Embed Size (px)
Citation preview
Copyright © 2009 Pearson Education, Inc.
PowerPoint® Lecture Presentation for
Concepts of GeneticsNinth Edition
Klug, Cummings, Spencer, Palladino
Chapter 5
Chromosome Mapping in Eukaryotes
Lectures by David Kass with contributions from
John C. Osterman.
Copyright © 2009 Pearson Education, Inc.
Copyright © 2009 Pearson Education, Inc.
• Genes assort independently if they are on
different chromosomes but show linkage if
they are on the same chromosome.
Section 5.1
Copyright © 2009 Pearson Education, Inc.
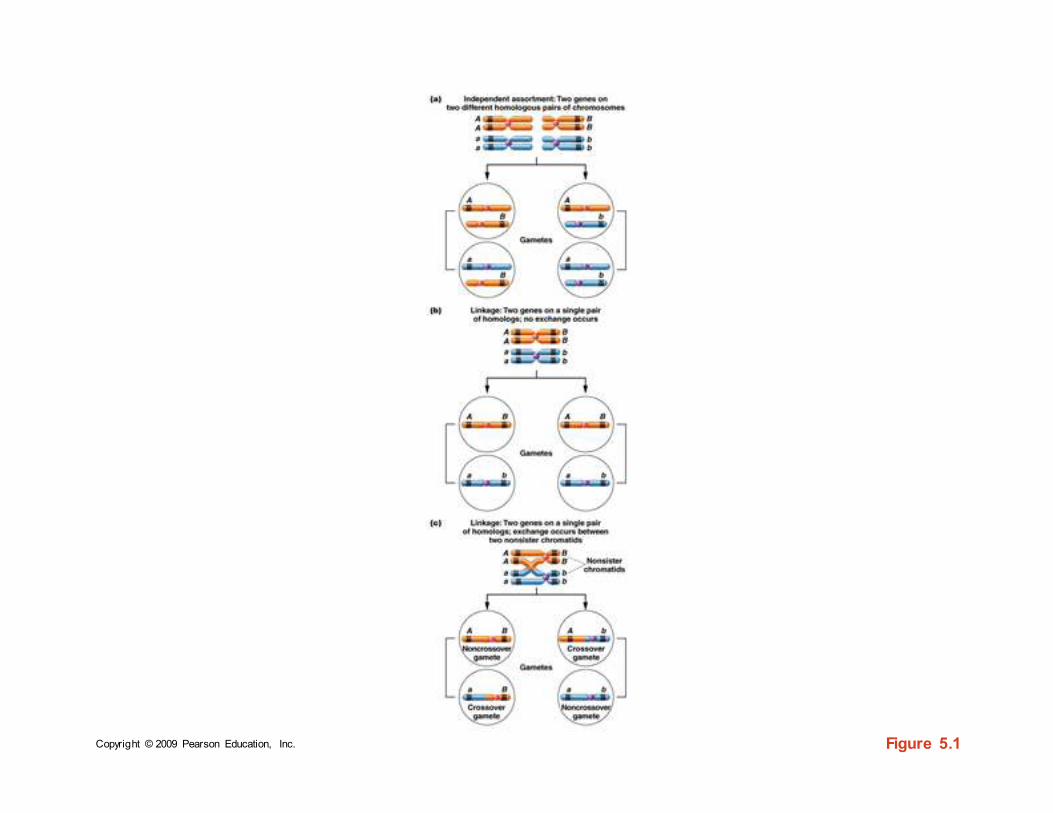
• In complete linkage, only parental
(noncrossover) gametes are produced.
• If crossing over between two linked
genes occurs between two nonsister
chromatids, both parental and
recombinant (crossover) gametes are
produced (Figure 5.1).
Section 5.1
Copyright © 2009 Pearson Education, Inc. Figure 5.1
Copyright © 2009 Pearson Education, Inc.
• The degree of crossing over between any
two loci on a single chromosome is
proportional to the distance between them,
known as the interlocus distance.
Section 5.1
Copyright © 2009 Pearson Education, Inc.
• If complete linkage exists between two
genes because of their close proximity and
organisms heterozygous at both loci are
mated, a unique F2 phenotypic ratio
designated the linkage ratio results.
Section 5.1
Copyright © 2009 Pearson Education, Inc.
• Genes on the same chromosome are part
of a linkage group.
• The number of linkage groups should
correspond to the haploid number of
chromosomes.
Section 5.1

Copyright © 2009 Pearson Education, Inc.
• The percentage of offspring resulting from
recombinant gametes depends on the
distance between the two genes on the
chromosome.
Section 5.2
Thomas H. Morgan. http://nobelprize.org/nobel_prizes/medicine/articles/lewis/
Alfred H. Sturtevant. http://eands.caltech.edu/articles/LXVII2/bomb.html
Copyright © 2009 Pearson Education, Inc.
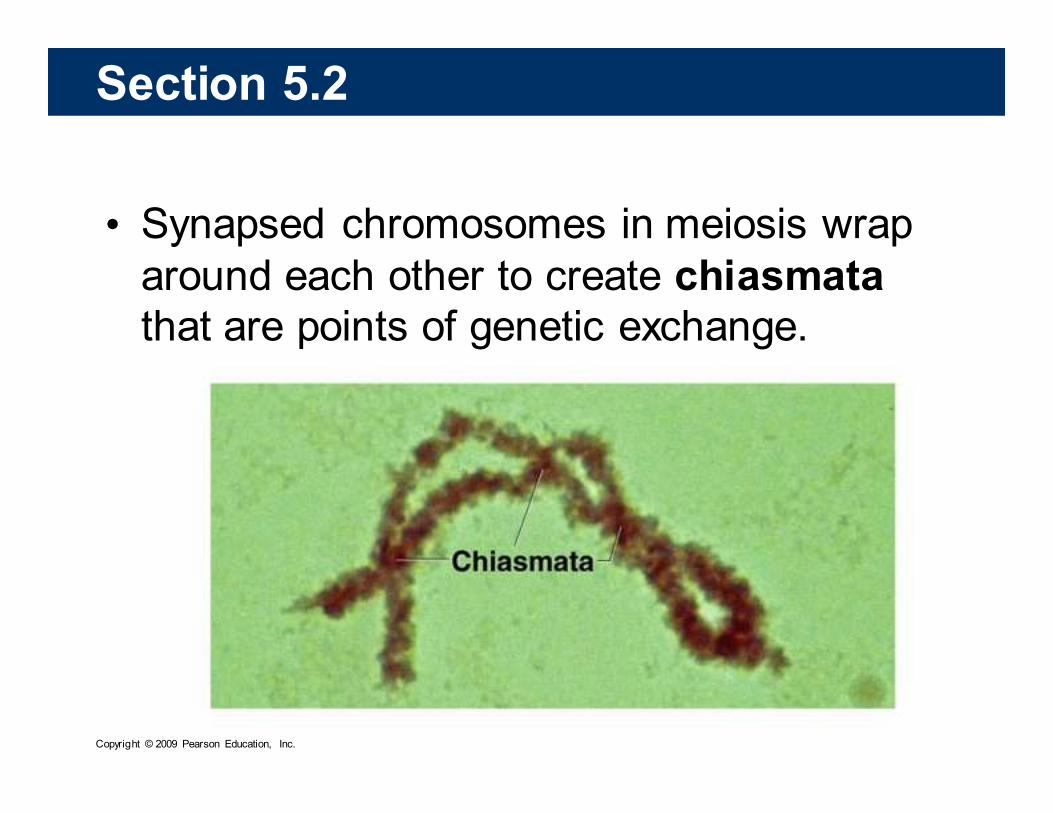
• Synapsed chromosomes in meiosis wrap
around each other to create chiasmata
that are points of genetic exchange.
Section 5.2
Copyright © 2009 Pearson Education, Inc.
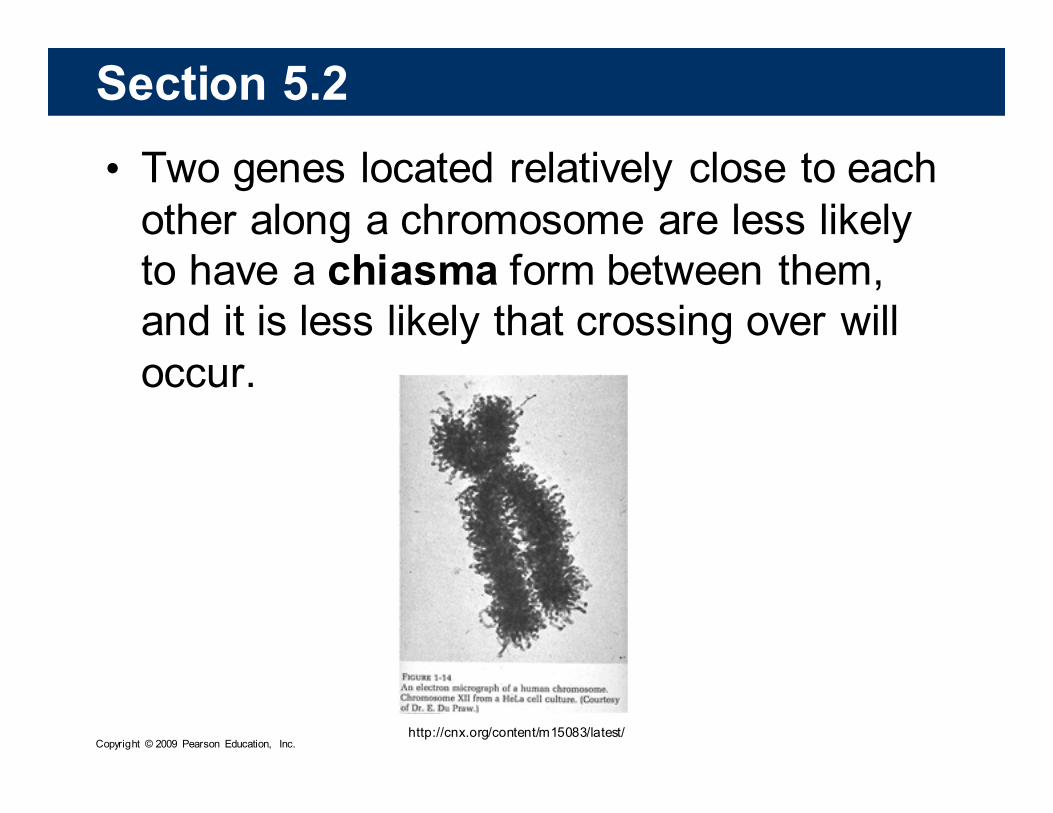
• Two genes located relatively close to each
other along a chromosome are less likely
to have a chiasma form between them,
and it is less likely that crossing over will
occur.
Section 5.2
http://cnx.org/content/m15083/latest/
Copyright © 2009 Pearson Education, Inc.
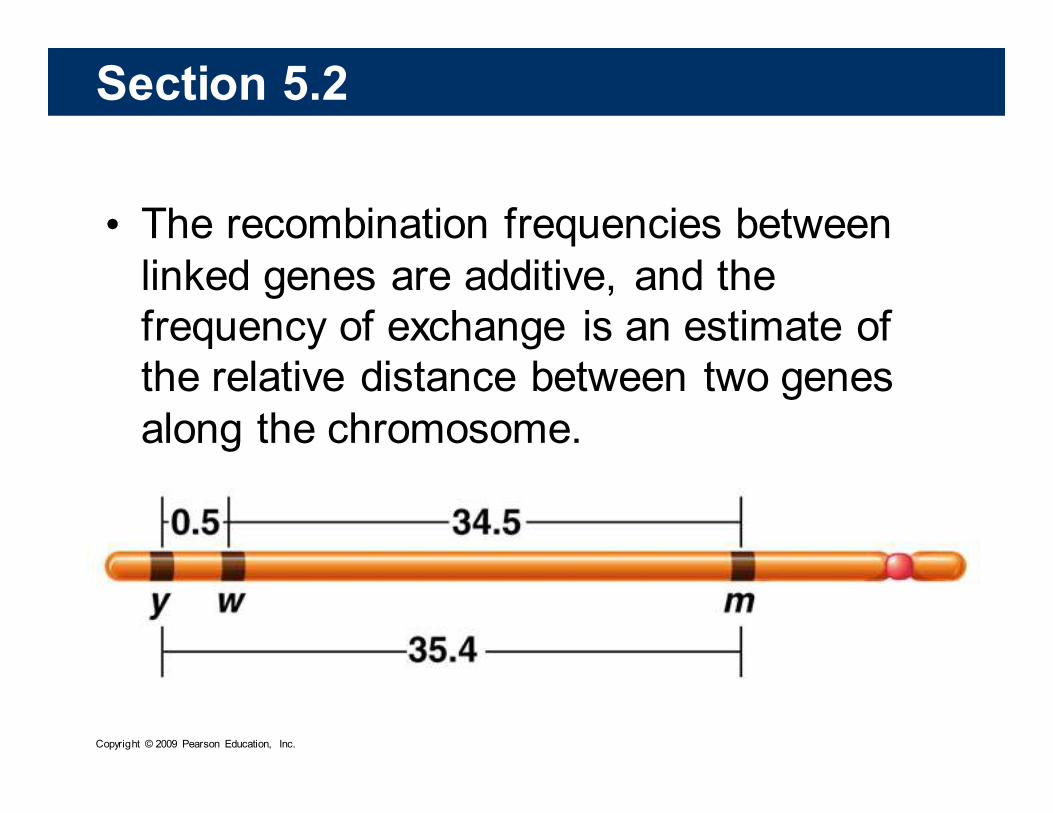
• The recombination frequencies between
linked genes are additive, and the
frequency of exchange is an estimate of
the relative distance between two genes
along the chromosome.
Section 5.2
Copyright © 2009 Pearson Education, Inc.
• One map unit (mu) is defined as 1 percent
recombination between two genes on a
chromosome.
• Map units are often called centimorgans
(cM) and are relative distances, not exact
ones.
Section 5.2
Copyright © 2009 Pearson Education, Inc.
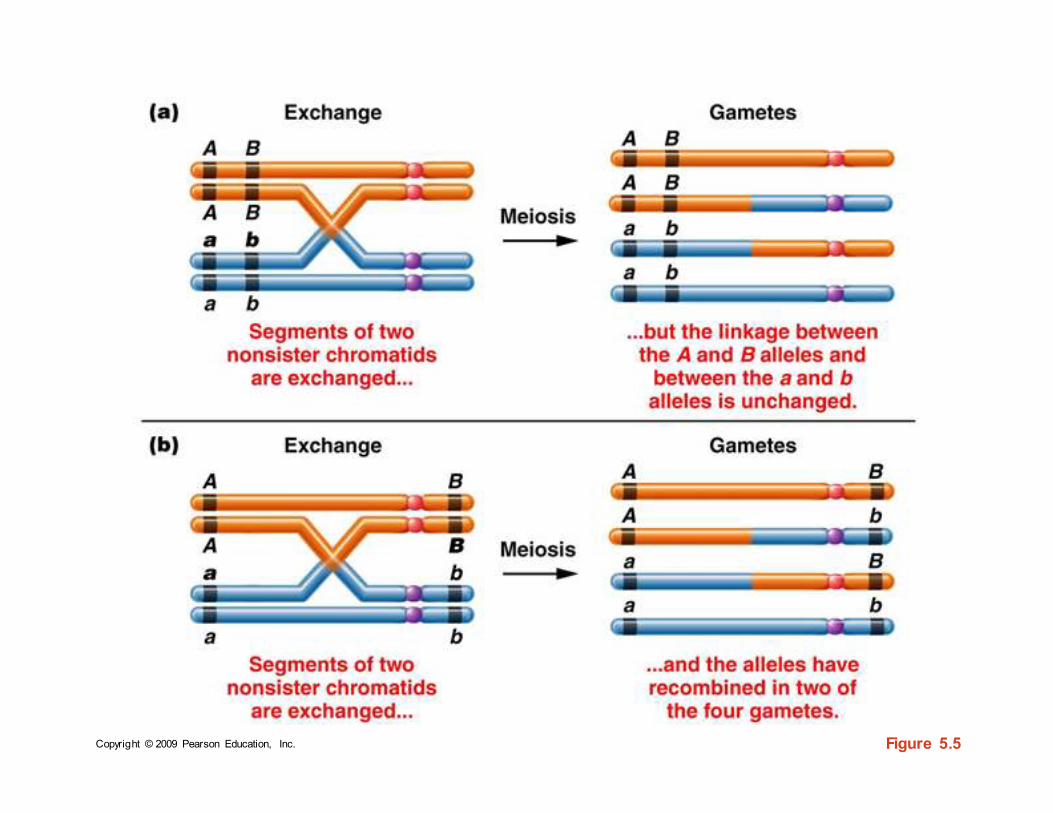
• A single crossover (SCO) alters linkage
between two genes only if the crossover
occurs between those two genes (Figure
5.5).
Section 5.2
Copyright © 2009 Pearson Education, Inc. Figure 5.5
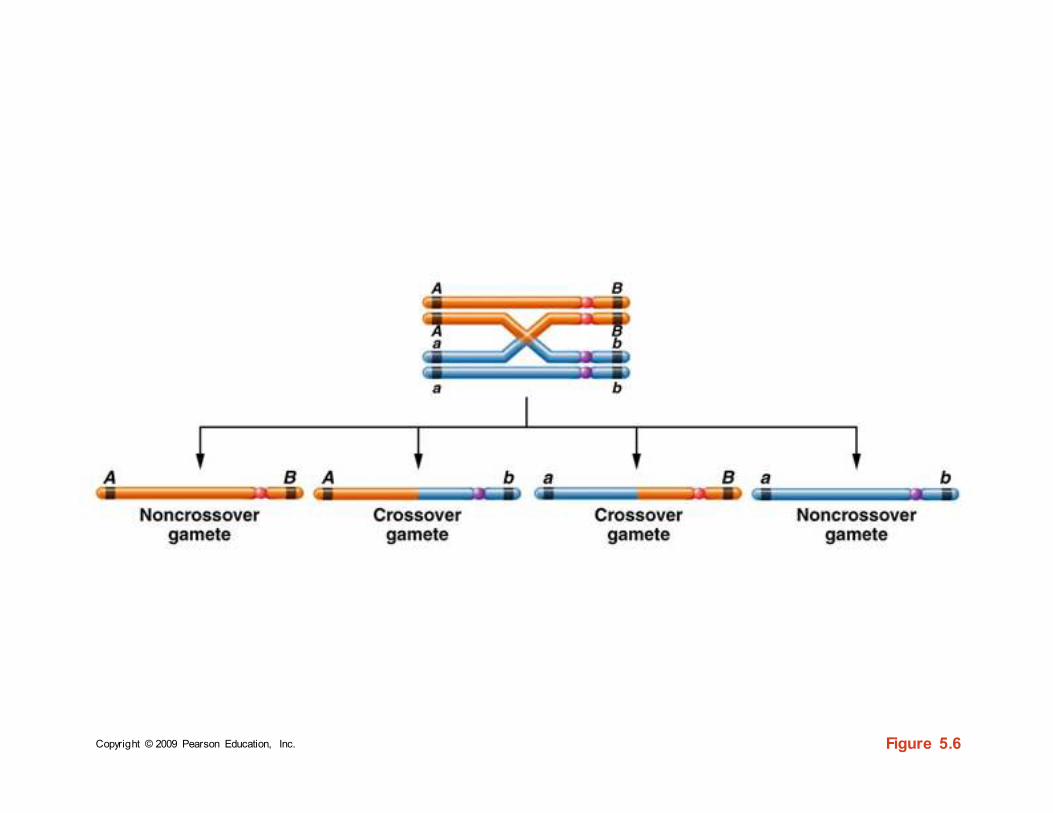
Copyright © 2009 Pearson Education, Inc. Figure 5.6
Copyright © 2009 Pearson Education, Inc.
• Single crossovers can be used to
determine the distance between two linked
genes, but double crossovers (DCOs)
can be used to determine the order of
three genes on the chromosome and the
distance between the linked genes.
Section 5.3
Copyright © 2009 Pearson Education, Inc.
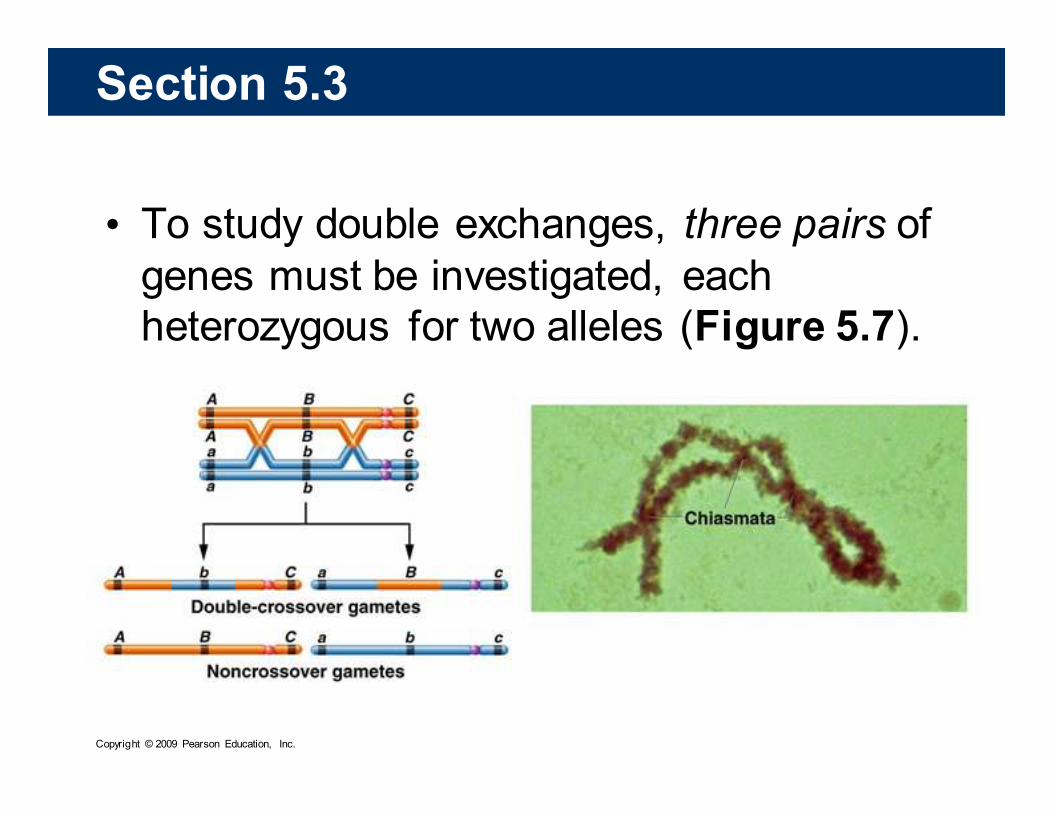
• To study double exchanges, three pairs of
genes must be investigated, each
heterozygous for two alleles (Figure 5.7).
Section 5.3
Copyright © 2009 Pearson Education, Inc.
• The expected frequency of double-
crossover gametes is much lower than
that of either single-crossover gamete
class.
Section 5.3
Copyright © 2009 Pearson Education, Inc.
• In Three-Point Mapping,
• Parent must be heterozygous for all 3 genes
under consideration.
• Cross constructed so genotypes can be
determined by offspring phenotypes.
• Many offspring produced to get a
representative sample of crossover events.
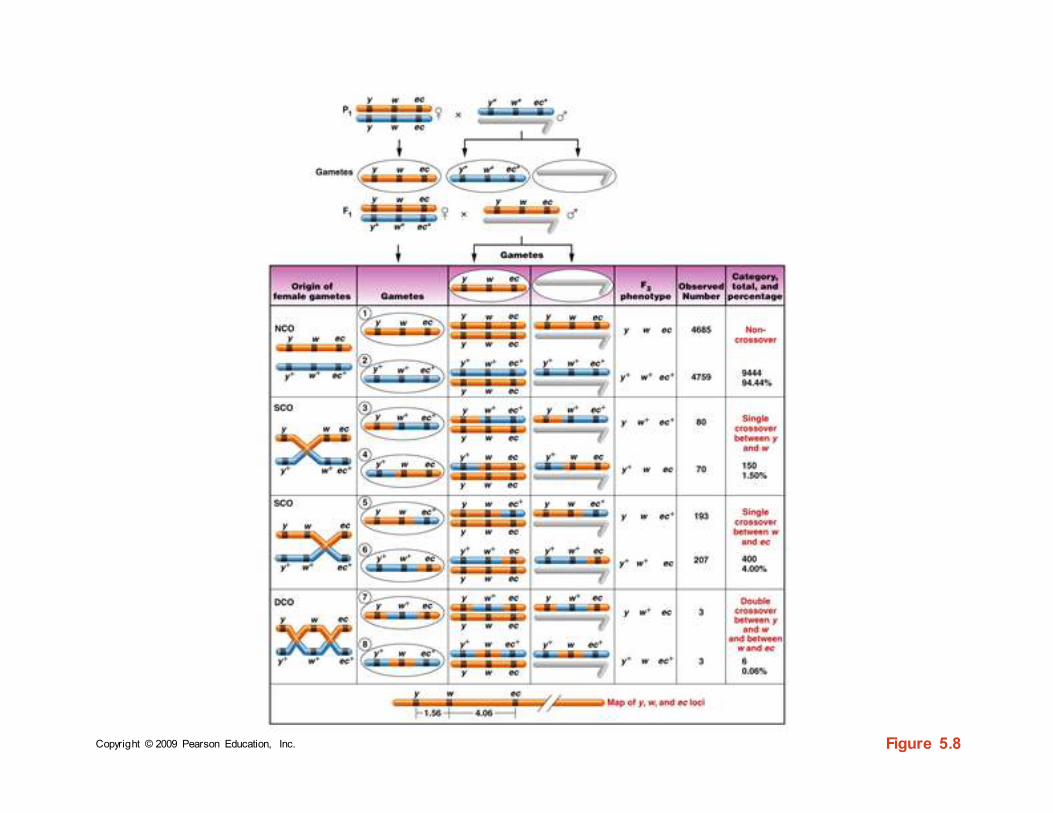
• A three-point mapping cross is shown in
Figure 5.8 (Drosophila).
Section 5.3
Copyright © 2009 Pearson Education, Inc. Figure 5.8
Copyright © 2009 Pearson Education, Inc.
• The noncrossover F2 phenotypes occur
in the greatest proportion of offspring.
• The double-crossover phenotypes
occur in the smallest proportion.
Section 5.3
Copyright © 2009 Pearson Education, Inc.
• Because the F2 phenotypes complement
each other (i.e., one is wild type and the
other is mutant for all three genes), they
are called reciprocal classes of
phenotypes.
Section 5.3
Copyright © 2009 Pearson Education, Inc.
• Distance between two genes in a three-
point cross is equal to the percentage of
all detectable exchanges occurring
between them and includes all single and
double crossovers.
Section 5.3
Copyright © 2009 Pearson Education, Inc.
Section 5.3
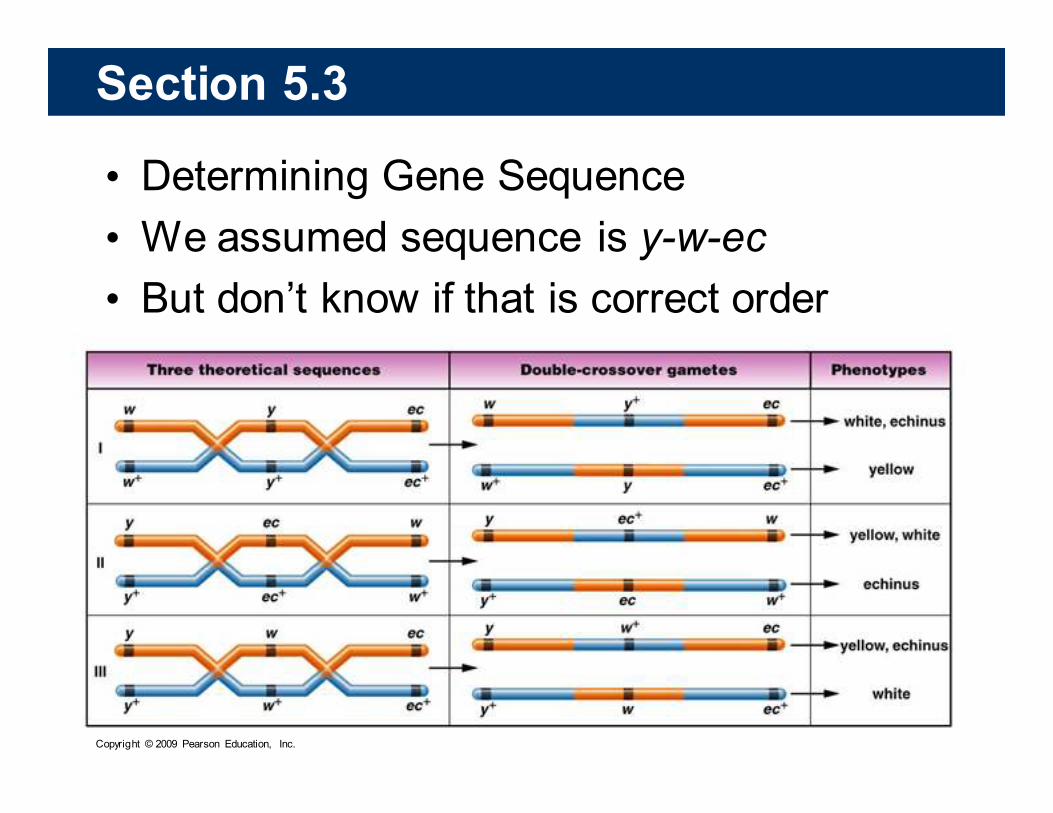
• Determining Gene Sequence
• We assumed sequence is y-w-ec
• But don’t know if that is correct order
Copyright © 2009 Pearson Education, Inc.
• 2 methods for determining gene order
from a three-point cross.
• Method I
• Method II
Section 5.3
Copyright © 2009 Pearson Education, Inc.
Section 5.3
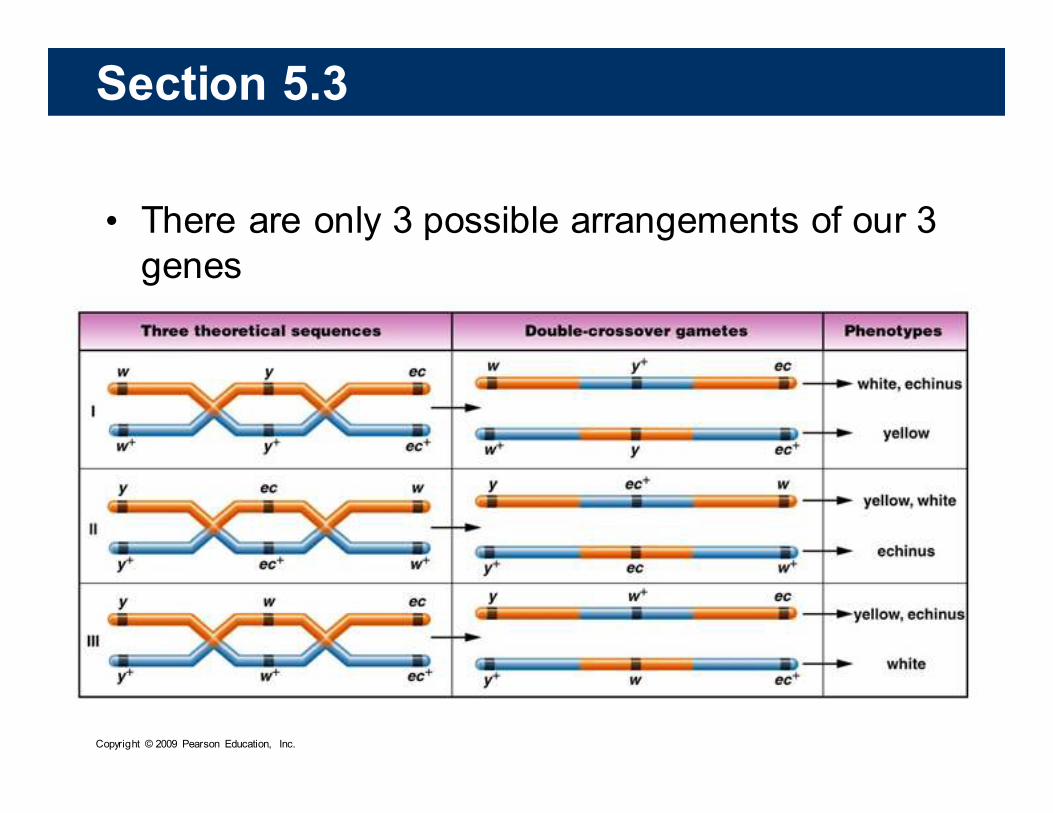
• There are only 3 possible arrangements of our 3
genes
Copyright © 2009 Pearson Education, Inc.
Section 5.3
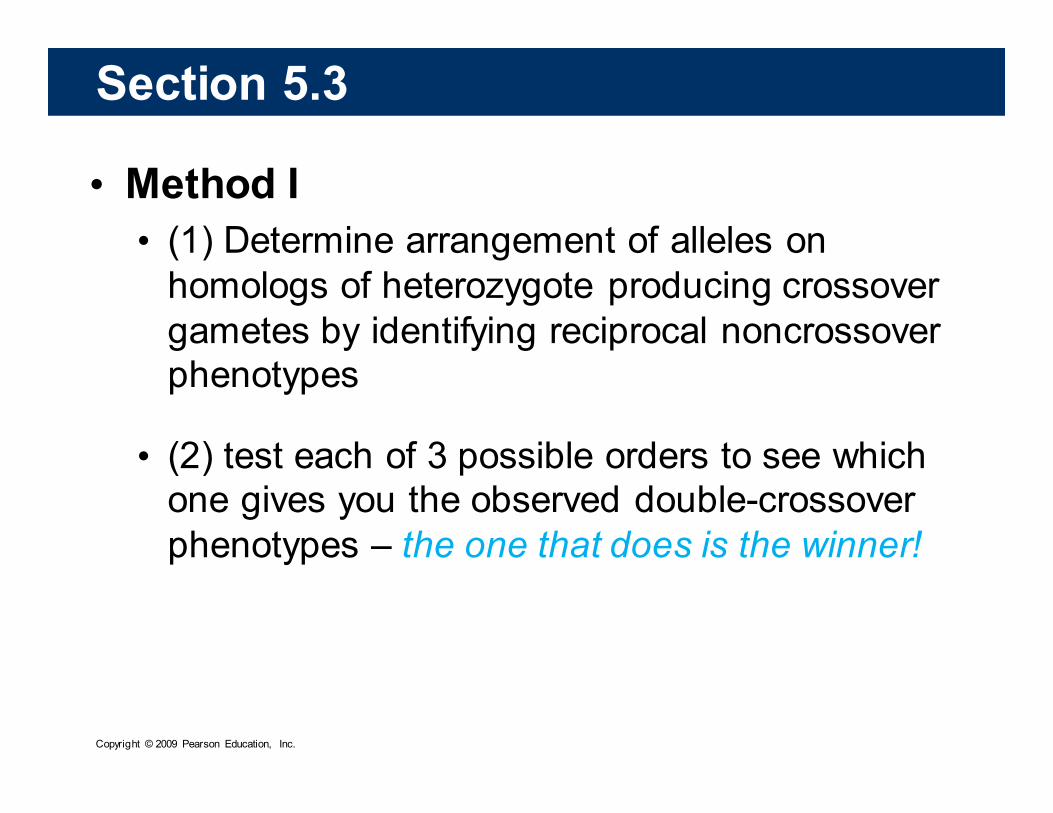
• Method I
• (1) Determine arrangement of alleles on
homologs of heterozygote producing crossover
gametes by identifying reciprocal noncrossover
phenotypes
• (2) test each of 3 possible orders to see which
one gives you the observed double-crossover
phenotypes – the one that does is the winner!
Copyright © 2009 Pearson Education, Inc.
Section 5.3
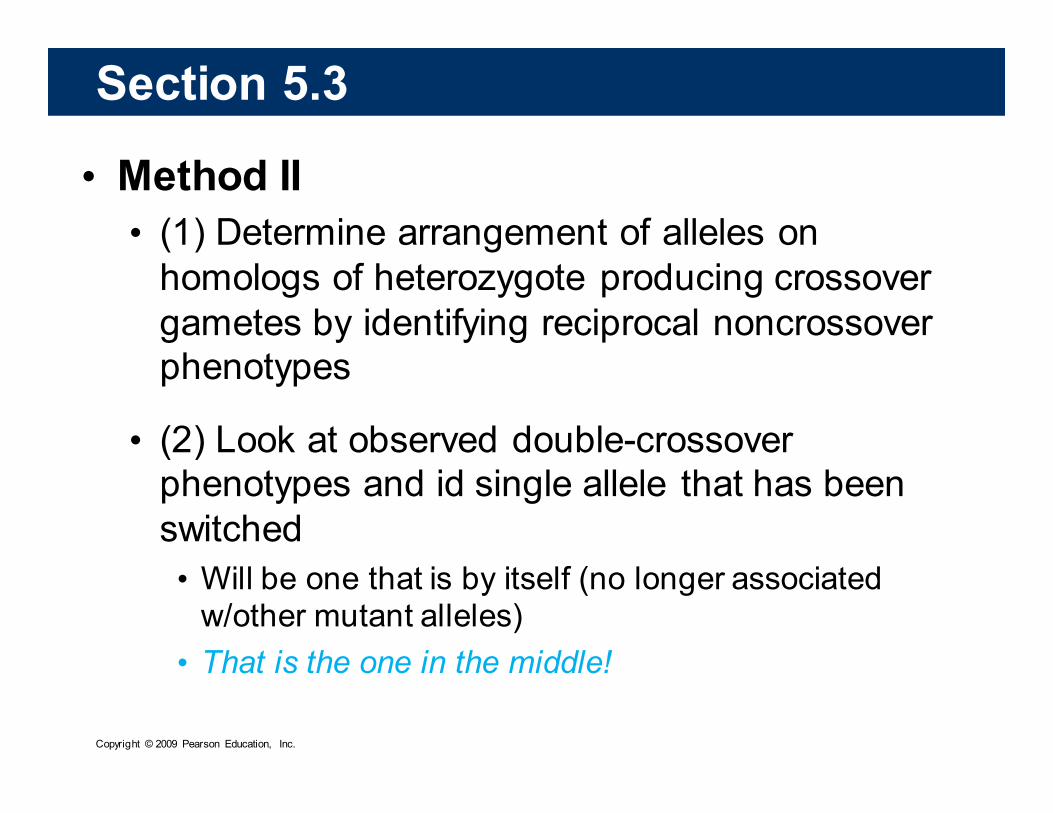
• Method II
• (1) Determine arrangement of alleles on
homologs of heterozygote producing crossover
gametes by identifying reciprocal noncrossover
phenotypes
• (2) Look at observed double-crossover
phenotypes and id single allele that has been
switched
• Will be one that is by itself (no longer associated w/other mutant alleles)
• That is the one in the middle!
Copyright © 2009 Pearson Education, Inc.
Section 5.3
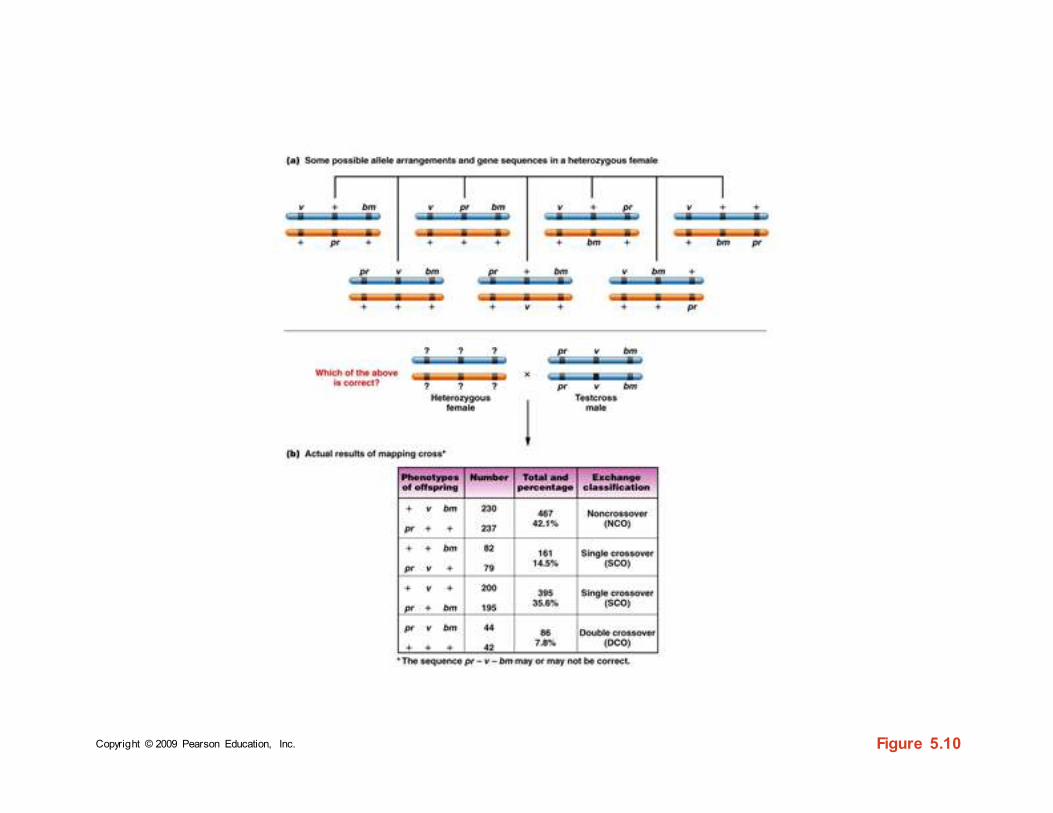
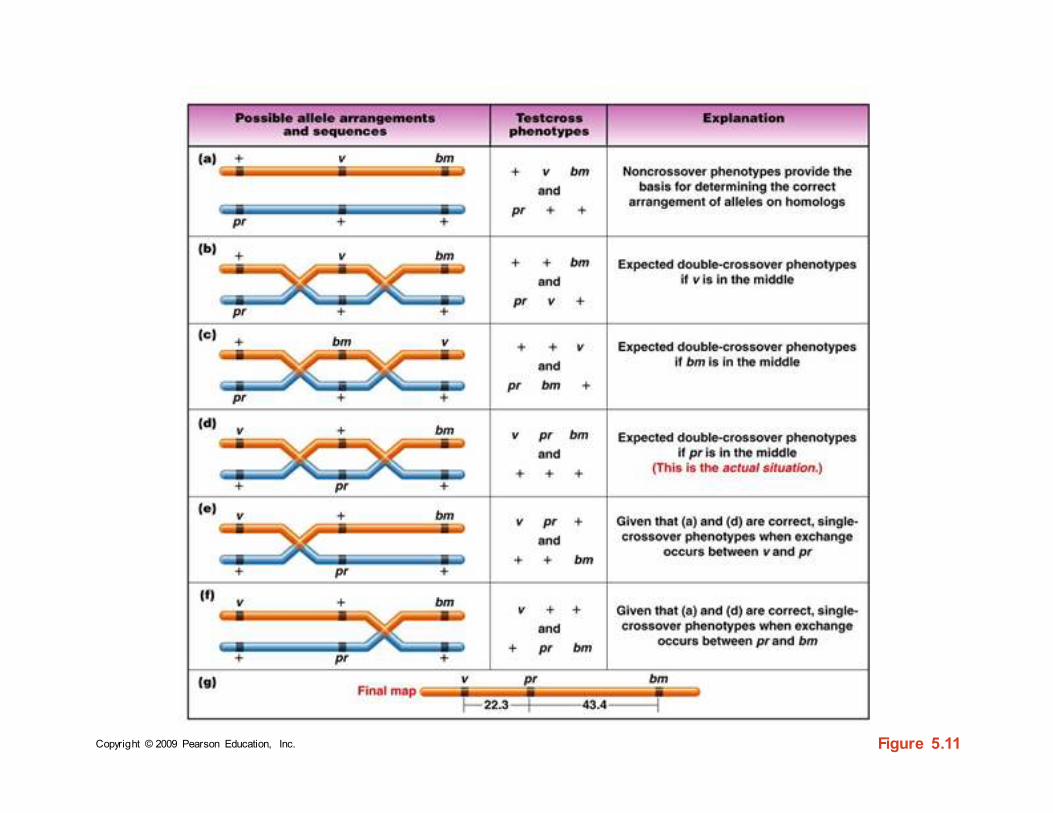
• Mapping Problem in Maize
• An example of a three-point cross and
mapping of the three genes involved is shown
in Figure 5.10 and Figure 5.11.
• 3 Linked Genes
• bm = brown midrib
• v = virescent seedling
• pr = purple aleurone
Copyright © 2009 Pearson Education, Inc. Figure 5.10
Copyright © 2009 Pearson Education, Inc. Figure 5.11
Copyright © 2009 Pearson Education, Inc.
• The expected frequency of multiple
exchanges between two genes can be
predicted from the distance between them.
• The coefficient of coincidence (C) is the
observed number of DCOs divided by the
expected number of DCOs.
Section 5.4
Copyright © 2009 Pearson Education, Inc.
• Interference reduces the expected
number of multiple crossovers when a
crossover event in one region of the
chromosome inhibits a second event
nearby.
• Interference is positive if fewer double-
crossover events than expected occur and
negative if more double-crossover events
than expected occur.
Section 5.4
Copyright © 2009 Pearson Education, Inc.
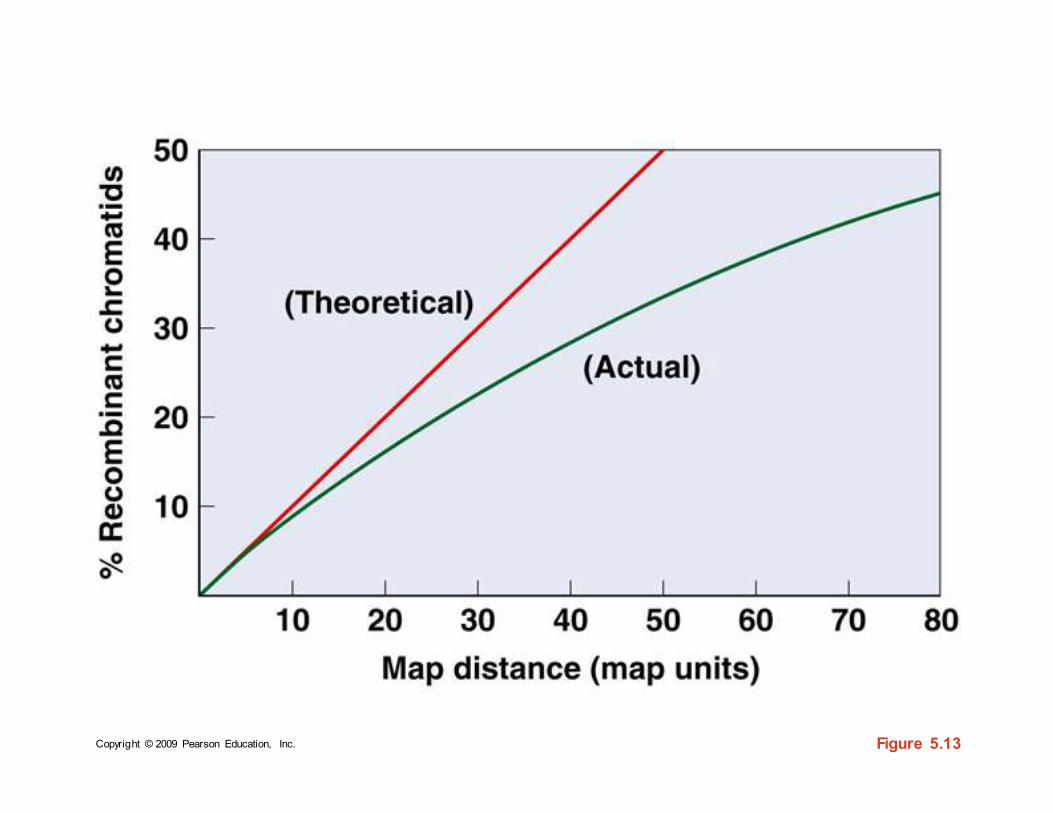
• When two genes are close together, the
accuracy of mapping is high.
• As the distance between them increases,
the accuracy of mapping decreases.
Section 5.5
Copyright © 2009 Pearson Education, Inc.
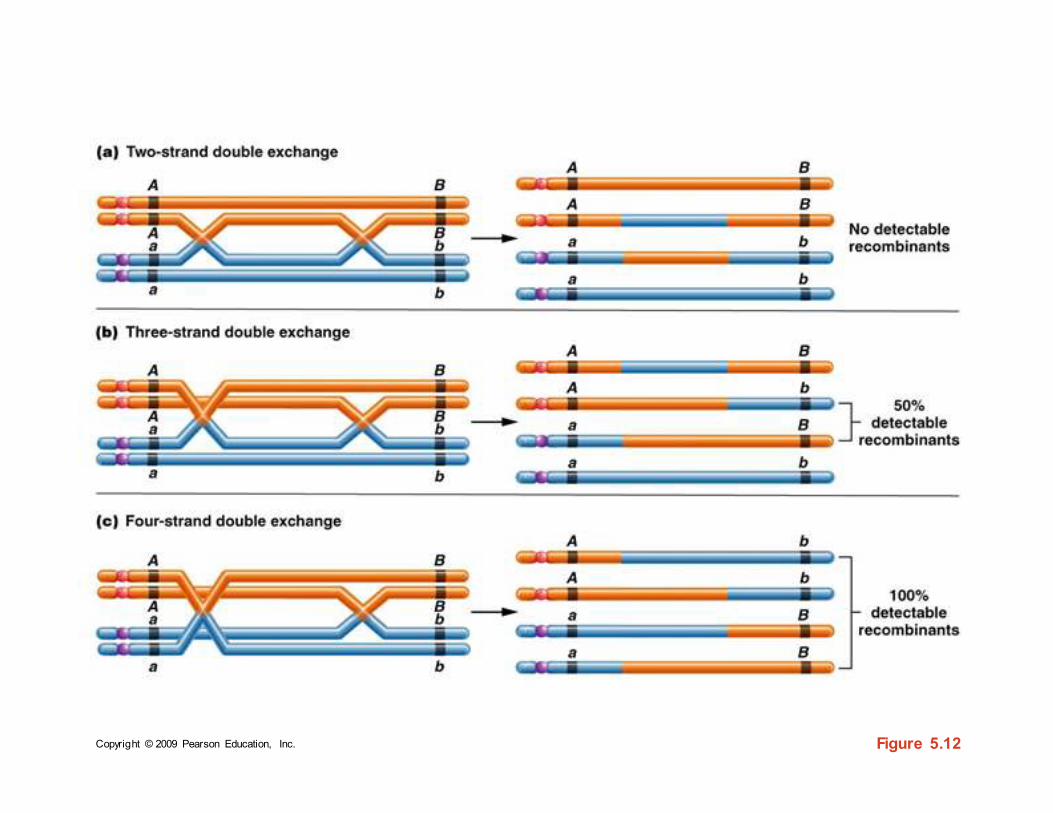
• Two exchanges between linked genes that
are far apart on a chromosome can
involve two, three, or all four strands.
• They can result in production of different
percentages of recombinant chromatids
(Figure 5.12).
Section 5.5
Copyright © 2009 Pearson Education, Inc. Figure 5.12
Copyright © 2009 Pearson Education, Inc. Figure 5.13
Copyright © 2009 Pearson Education, Inc.
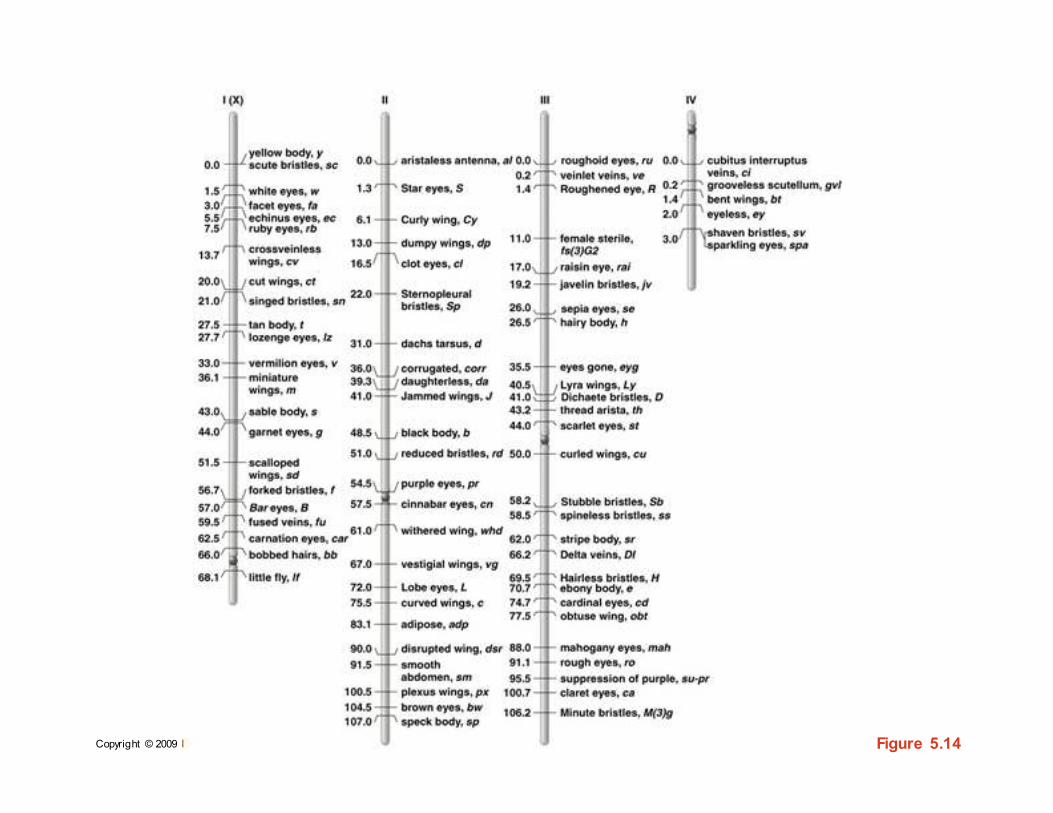
• The large numbers of mutants in
Drosophila, maize, and mice have allowed
extensive chromosome mapping in these
organisms (Figure 5.14).
Section 5.6- Drosophila Genes Have
Been Extensively Mapped
Copyright © 2009 Pearson Education, Inc. Figure 5.14
Copyright © 2009 Pearson Education, Inc.
• Lod score analysis relies on probability
calculations to demonstrate linkage
between two genes in organisms in which
linkage analysis relies primarily on
pedigrees.
Section 5.7
Copyright © 2009 Pearson Education, Inc.
• Somatic cell hybridization involves
fusion of two cells in culture to form a
single hybrid cell, called a heterokaryon.
Section 5.7
Copyright © 2009 Pearson Education, Inc.
• Synkaryon – nuclei eventually fuse in cell
• Upon continued culturing of the hybrid cell,
chromosomes from one of the two
parental species are gradually lost until
only a few chromosomes of one species
remain and most chromosomes are from
the other species
Section 5.7
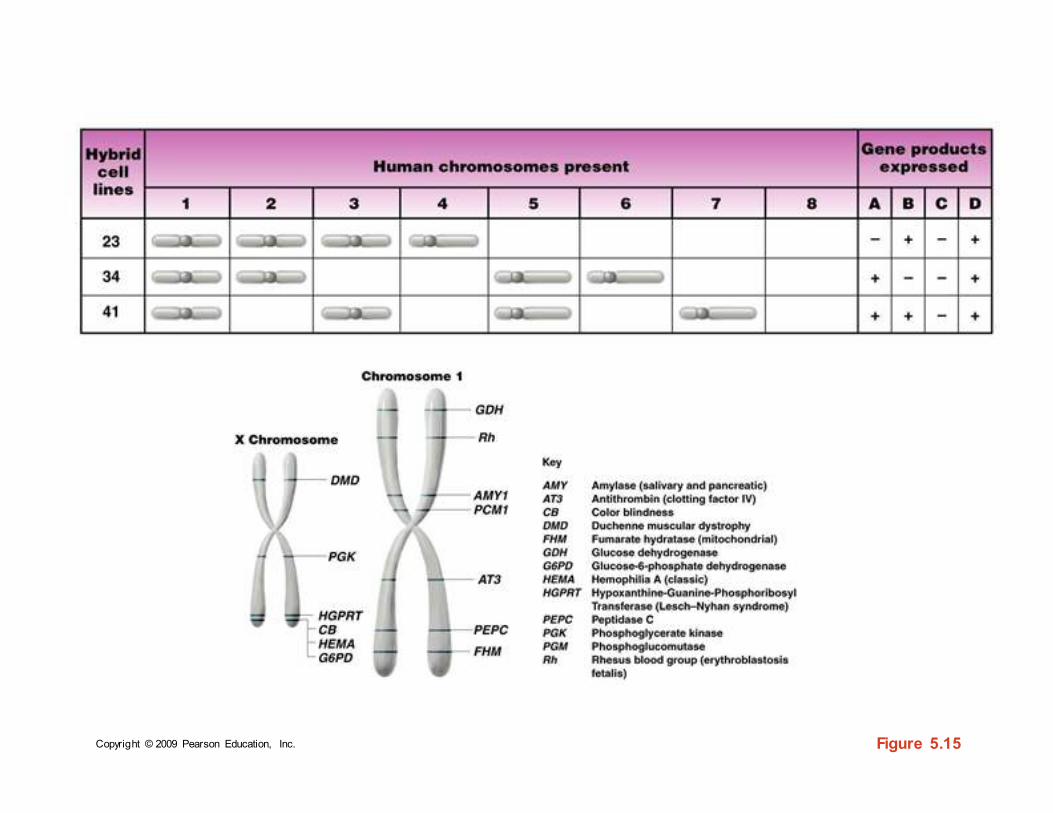
Copyright © 2009 Pearson Education, Inc. Figure 5.15
Copyright © 2009 Pearson Education, Inc.
• Chromosome Mapping is Now Possible
Using DNA Markers and Annotated
Computer Databases
• DNA markers represent landmarks along the
chromosome.
• RFLPs – Restriction Fragment Length
Polymorphisms
• Microsatellites
• SNPs – Single Nucleotide Polymorphisms
Section 5.8
Copyright © 2009 Pearson Education, Inc.
• Recombination Occurs between Mitotic
Chromosomes
• In Drosophila and certain fungi, homologs pair
up during mitosis, allowing crossing over to
take place.
• Sister chromatid exchanges (SCEs) occur
during mitosis but do not produce new allelic
combinations.
Section 5.10
Copyright © 2009 Pearson Education, Inc.
The End