Embed Size (px)
Citation preview

6/9/2014
1
Hydrology Options for Dynamic
Modeling at the Inlet Level
Matt Manges, PE, CFM – LAN
Saul Nuccitelli, PE, CFM – City of Austin (former LAN employee during this project)
Derek St. John, PE, CFM – LAN
5/29/2014
Agenda
• Introduction
• Typical Questions
• Example Project
• Hydrology Comparisons
• Recommendations
2
Introduction
• Dynamic modeling is growing in popularity
– Hydrology not well standardized
• Multiple ways of developing hydrologic
inputs
– Watershed or inlet-level
3

6/9/2014
2
Why Does the Dynamic Hydrology
Method Matter?
• Could influence analysis results
• Dynamic hydrographs aren’t often
addressed in design manuals
– No single “standard” method
• Potential for “thumbtack” hydrographs
• Inlet level drainage areas may be smaller
than the method’s original assumptions
4
Typical Questions for Inlet
Hydrographs?
• What loss/routing method should be used?
• What hyetograph should be used?
• How do dynamic flows compare to static flows?
– Should peaks match?
– Should dynamic peaks be lower or higher?
• Are there any simplifying assumptions?
• How do inlet level areas compare to watershed level modeling?
5
City of Austin – Euclid-Wilson Storm
Drain Improvements
6
• Historic flooding
issues
• 1960’s Era System
• Mixed land use
• 2.1 mi of storm sewer
• 63 Inlets
• 2 Major systems with
creek outfalls

6/9/2014
3
City of Austin – Euclid-Wilson Storm
Drain Improvements
7
• Historic flooding
issues
• 1960’s Era System
• Mixed land use
• 2.1 mi of storm sewer
• 63 Inlets
• 2 Major systems with
creek outfalls
Euclid-Wilson Background
8
• Studied & designed in
2010-11 with static
methodology
• Second system was
not constructed due
to AT&T conflict
• City wanted to
understand installed
LOS
– Dynamic, 2D model
Analysis Summary
• Static
– Rational Method
– 1% AEP storm event
– StormCAD
• Dynamic
– NRCS/SCS Type III Rainfall Distribution
– 1% AEP, 24-hour storm event
– NRCS/SCS Loss and Routing
– InfoWorks ICM
9
6/9/2014
4
Inlet Hydrograph Comparisons
10
0
1
2
3
4
5
6
7
0 200 400 600 800 1000 1200 1400
Flo
w (cfs
)
Time (min)
DA-A04a – Mix of residential & street, 0.64 Ac, C=0.72
Static Dynamic
Inlet Hydrograph Comparisons
11
0
2
4
6
8
10
12
14
0 200 400 600 800 1000 1200 1400
Flo
w (cfs
)
Time (min)
DA-A08c – Mix of residential & street, 1.42Ac, C=0.72
Static Dynamic
Inlet Hydrograph Comparisons
12
0
2
4
6
8
10
12
0 200 400 600 800 1000 1200 1400
Flo
w (cfs
)
Time (min)
DA-A20 – street, 0.88Ac, C=0.95
Static Dynamic
6/9/2014
5
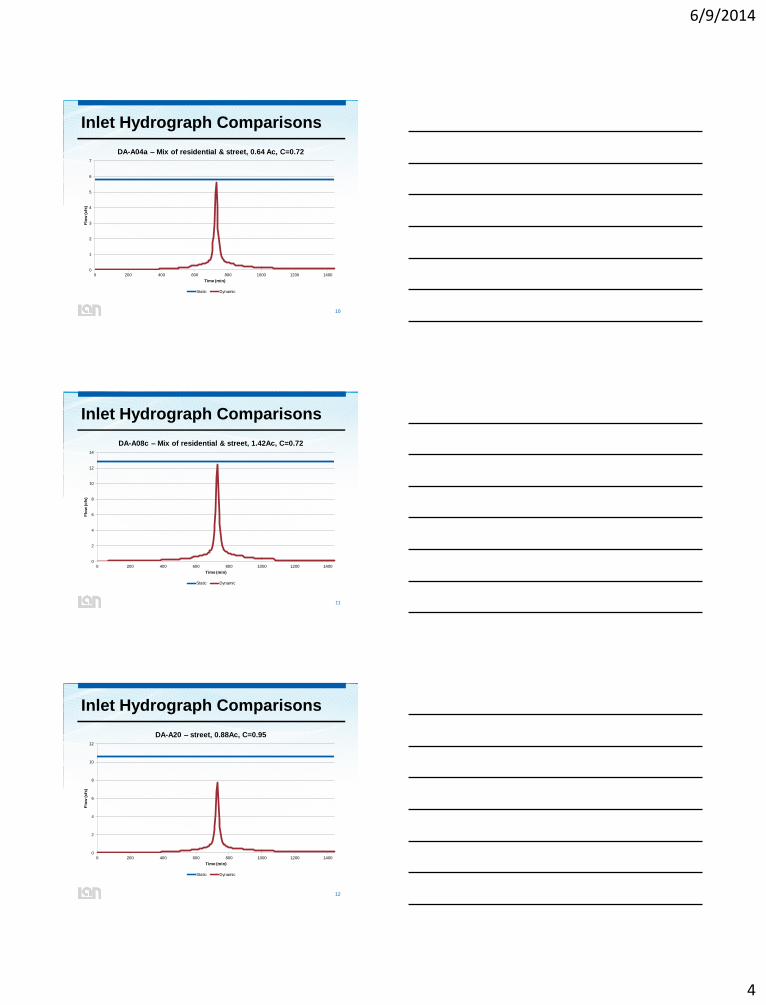
Inlet Hydrograph Comparisons
13
0
5
10
15
20
25
30
0 200 400 600 800 1000 1200 1400
Flo
w (cfs
)
Time (min)
DA-A17c– Highly Impervious, 2.23 Ac, C=0.95
Static Dynamic
Storm Drain Hydrograph
Comparisons
14
0
50
100
150
200
250
0 200 400 600 800 1000 1200 1400
Flo
w (cfs
)
Time (min)
SD-A1-12 – Mid point of system
Static Dynamic
Storm Drain Hydrograph
Comparisons
15
0
50
100
150
200
250
300
350
0 200 400 600 800 1000 1200 1400
Flo
w (cfs
)
Time (min)
SD-A1-01 – Northern Outfall
Static Dynamic

6/9/2014
6
Why the Differences?
• Rational
– Intensities based on IDF
– Constant intensity, average over a duration
• Dynamic
– Hyetograph shape based on SCS Type III
distribution
– Rainfall depth based on DDF
– NRCS/SCS method is more sophisticated
• Initial abstraction, losses, timing
16
Other Dynamic Options
• Modified/Universal/Unified Rational
Hydrograph
– Estimates of duration
• Small Watershed Method (Malcolm’s)
– No hyetograph, realistic volume
• Clark Unit Hydrograph with “R” Adjustment
– Widely utilized in Houston region
– Dynamic peak flow to match static flow
17
Inlet Hydrograph Comparisons
18
0
1
2
3
4
5
6
7
0 200 400 600 800 1000 1200 1400
Flo
w (cfs
)
Time (min)
DA-A04a – Mix of residential & street, 0.64 Ac, C=0.72
Static Dynamic Modified Rational Clark

6/9/2014
7
Inlet Hydrograph Comparisons
19
0
2
4
6
8
10
12
14
0 200 400 600 800 1000 1200 1400
Flo
w (cfs
)
Time (min)
DA-A08c – Mix of residential & street, 1.42Ac, C=0.72
Static Dynamic Modified Rational Clark
Inlet Hydrograph Comparisons
20
0
2
4
6
8
10
12
0 200 400 600 800 1000 1200 1400
Flo
w (cfs
)
Time (min)
DA-A20 – street, 0.88Ac, C=0.95
Static Dynamic Modified Rational Clark
Inlet Hydrograph Comparisons
21
0
5
10
15
20
25
30
35
0 200 400 600 800 1000 1200 1400
Flo
w (cfs
)
Time (min)
DA-A17c– Highly Impervious, 2.23 Ac, C=0.95
Static Dynamic Modified Rational Clark
6/9/2014
8
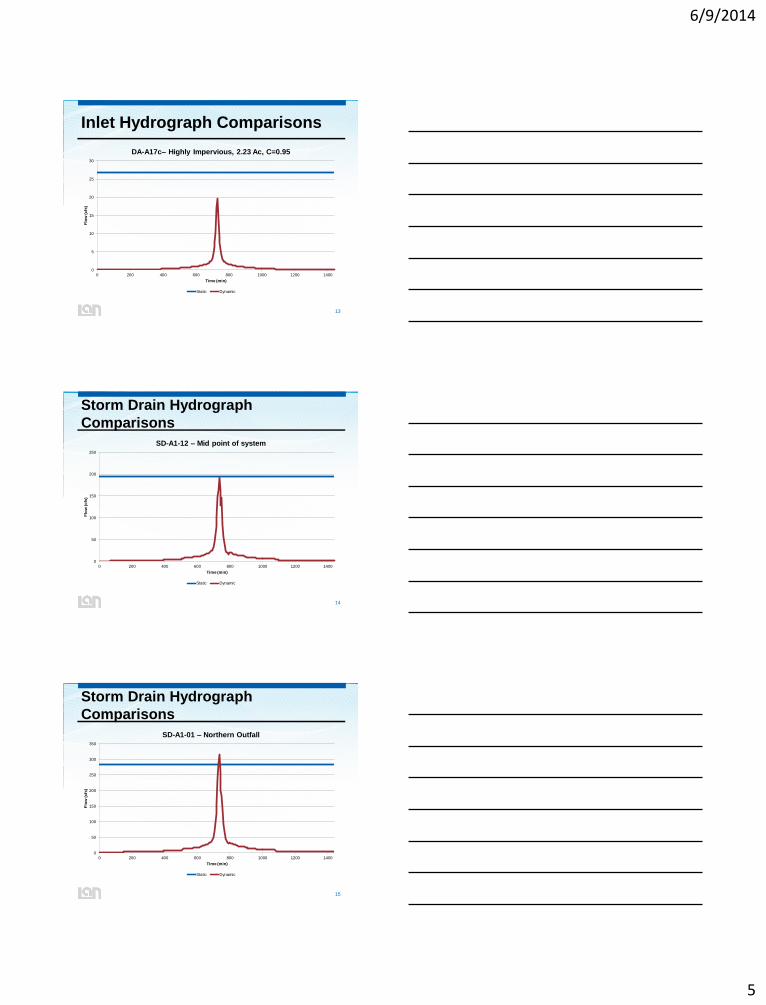
Storm Drain Hydrograph
Comparisons
22
0
50
100
150
200
250
0 200 400 600 800 1000 1200 1400
Flo
w (cfs
)
Time (min)
SD-A1-12 – Mid point of system
Static Dynamic Modified Rational Clark
Storm Drain Hydrograph
Comparisons
23
0
50
100
150
200
250
300
350
0 200 400 600 800 1000 1200 1400
Flo
w (cfs
)
Time (min)
SD-A1-01 – Northern Outfall
Static Dynamic Modified Ratonal Clark
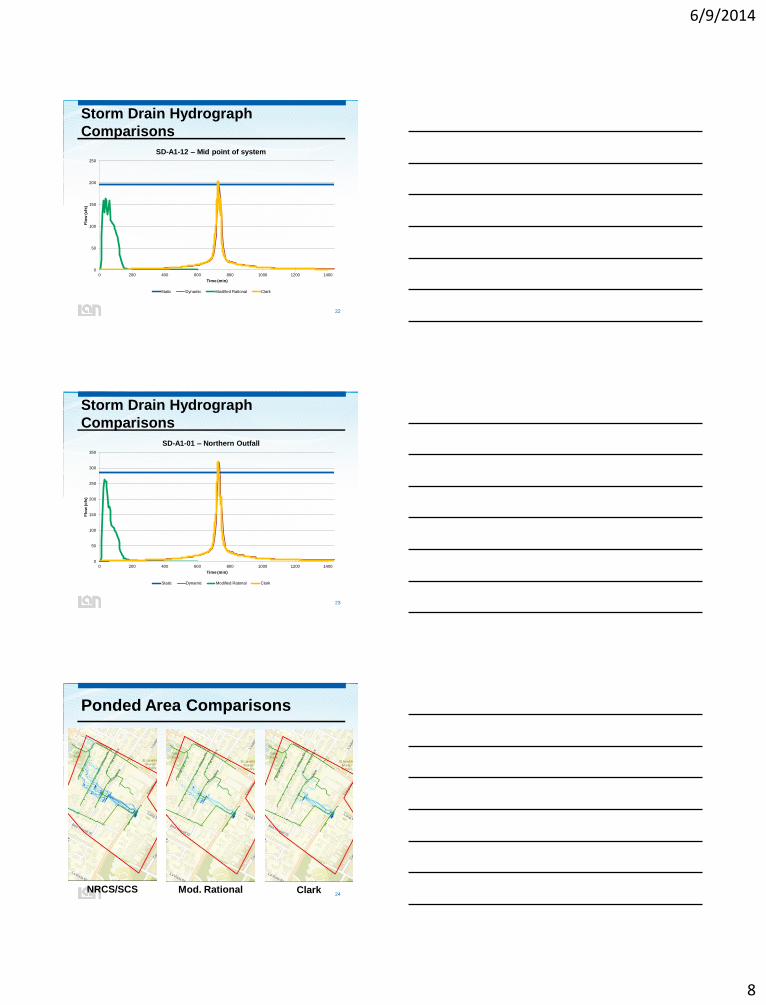
Ponded Area Comparisons
24NRCS/SCS Mod. Rational Clark

6/9/2014
9
Ponded Area Comparisons
25NRCS/SCS Mod. Rational Clark
Ponded Area Comparisons
26NRCS/SCS Mod. Rational Clark
Recommendations
• Conform with Design Manuals (when
possible)
• Standardize approaches with reviewing
agencies
– Discuss & decide ahead of time
• Understand your assumptions
27

6/9/2014
10
Other Considerations
• Reporting time step below minimum Tc
• Review the history of each method
• Look first to your criteria
• Open channel hydrology
• If peak flow matching is required
– Change non physical parameters
– Data is documented for the future
28
Questions?Matt Manges, PE, CFM
713-821-0366