Embed Size (px)
Citation preview

Power System Wide AreaMeasurement, Protection & Control
EIT ICT Labs Summer School for Smart Energy SystemsUniversité Paris Sud, August 28, 2013
Dr. Jacques Warichet([email protected])

Western America disturbance August 10, 1996
• WSCC system (Western Interconnection)
• Split into 4 islands• Loss of 30 GW load• 7,5 Million customers
without supply for a time between a few minutes and 9 hours
28/08/2013 Summer School for Smart Energy Systems 2013 - WAMS 2
7.5 million customers30 GW
Western America disturbance August 10, 1996
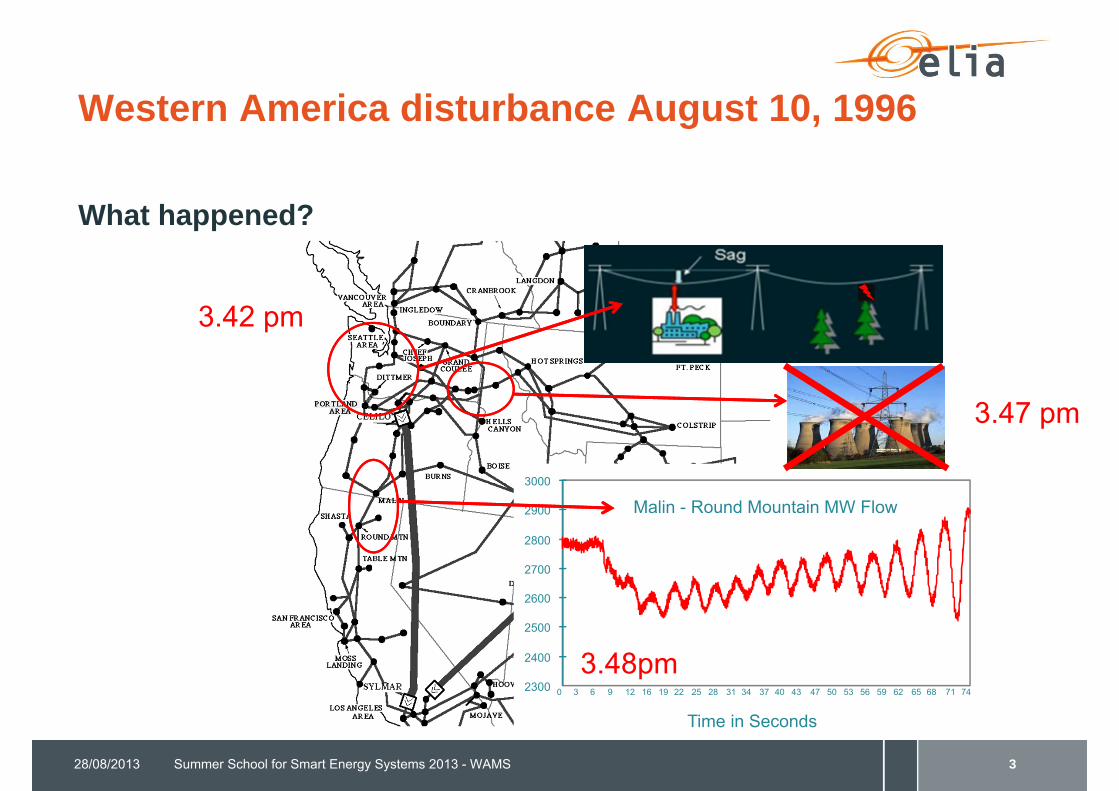
What happened?
28/08/2013 Summer School for Smart Energy Systems 2013 - WAMS 3
2300
2400
2500
2600
2700
2800
2900
3000
0 3 6 9 12 16 19 22 25 28 31 34 37 40 43 47 50 53 56 59 62 65 68 71 74
Time in Seconds
Malin - Round Mountain MW Flow
3.42 pm
3.47 pm
3.48pm
Western America disturbance August 10, 1996What happened?
• A warm summer afternoon: large amounts of air conditioning in service • high North to South flows from Oregon to California
• Initial system state • north of the PDCI (Pacific DC intertie): two forced outages of lines• a transformer was in maintenance: reduced voltage control
• Sequence of events• 3.42pm Allston Keeler 500 kV sagged close to a tree and flashed over• Parallel lines got loaded at 115% thermal rating & voltages were slightly depressed (to 504-510
kV)• 5 min later:
• Relay failure in 115 kV and an overloaded 230 kV line sagged to a tree• Sequential tripping of 13 units (McNary) due to exciter protection malfunction at high field
voltage power and voltage oscillations• 40 seconds of sustained oscillations at zero damping• Frequency dropped and export from BPA decreased AGC tried to restore the scheduled
exchanges • Lack of voltage control was not compensated by converters, and oscillations increased
• System splitting happened at 3.48 (6 minutes after begin) because of low voltage high current conditions (relay trip)
28/08/2013 Summer School for Smart Energy Systems 2013 - WAMS 4

Western America disturbance August 10, 1996
• Model issue• The event was beyond the N-k
security criterion for short-term planning= number of failures (protection relays, generator protection) was beyond expectations
• Nevertheless, the system model was not able to reproduce the event: Dynamic Security Analysis (DSA) was not able to warn about the cascading
28/08/2013 Summer School for Smart Energy Systems 2013 - WAMS 5
Source: D. Kosterev
North Western American interconnection disturbance (10 August 1996)
Model
Reality
Western America disturbance August 10, 1996
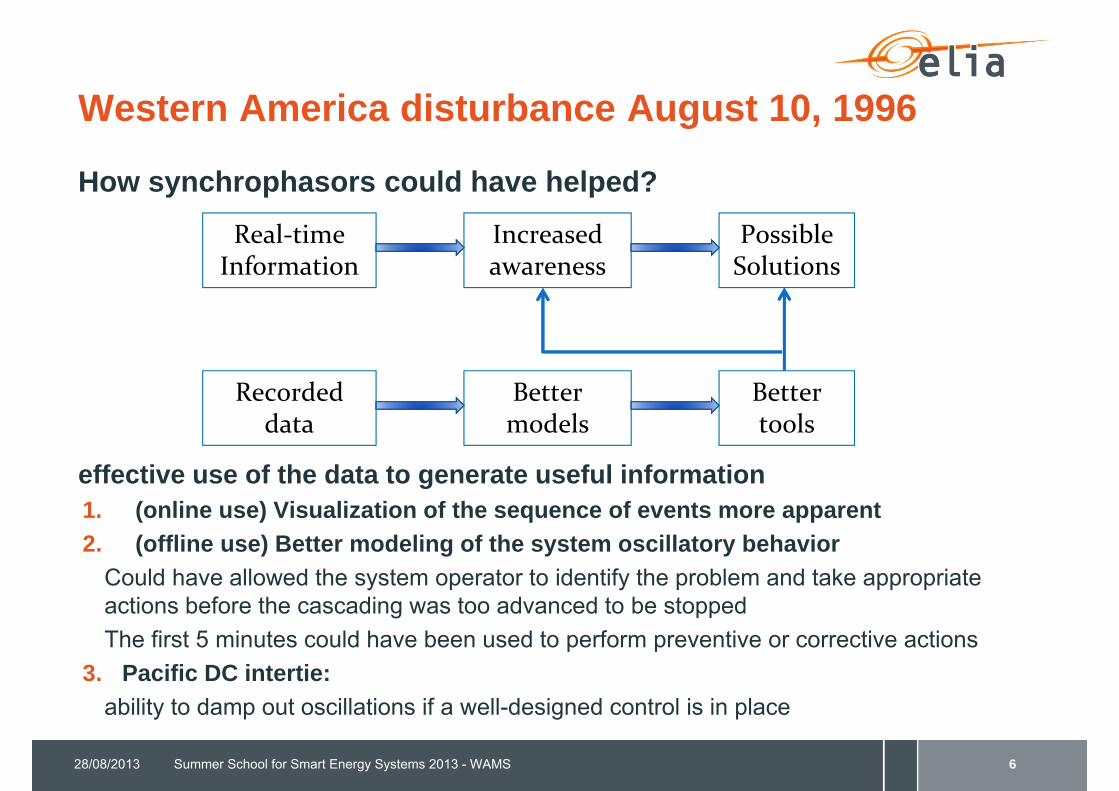
How synchrophasors could have helped?
effective use of the data to generate useful information1. (online use) Visualization of the sequence of events more apparent2. (offline use) Better modeling of the system oscillatory behavior
Could have allowed the system operator to identify the problem and take appropriate actions before the cascading was too advanced to be stoppedThe first 5 minutes could have been used to perform preventive or corrective actions
3. Pacific DC intertie: ability to damp out oscillations if a well-designed control is in place
28/08/2013 Summer School for Smart Energy Systems 2013 - WAMS 6
Real‐time Information
Increased awareness
Possible Solutions
Recorded data
Better models
Better tools

Contents
- About Elia and your trainer
- Measurement in power systems
- History of phasor measurement
- Principles of phasor measurement
- Standards for synchrophasors
- Power system applications of synchrophasors
- Conclusions
Summer School for Smart Energy Systems 2013 - WAMS28/08/2013 7

Summer School for Smart Energy Systems 2013 - WAMS
About Elia Group and your trainer
Power System Wide Area Measurement, Protection & Control
28/08/2013

The Transmission System: key component in the European Energy PolicyThe European power system
(ENTSO-e):
– 34 interconnected countries- 532 Million consumers
- 880 GW installed generation capacity 3.200TWh/year consumption
- 380 TWh/year cross-border exchanges
- 305.000 km lines and cables
One of the technologicalmarvels of the 20th century!
28/08/2013 Summer School for Smart Energy Systems 2013 - WAMS 9

Elia Group: High Voltage network ownership
Summer School for Smart Energy Systems 2013 - WAMS28/08/2013 10
Elia 50Hertz
Elia• 380-150kV network
• Most of the high voltage network (70-30kV)
50Hertz• 380-220kV network
- 34% of the German 380kV network
- 19% of the German 220kV network
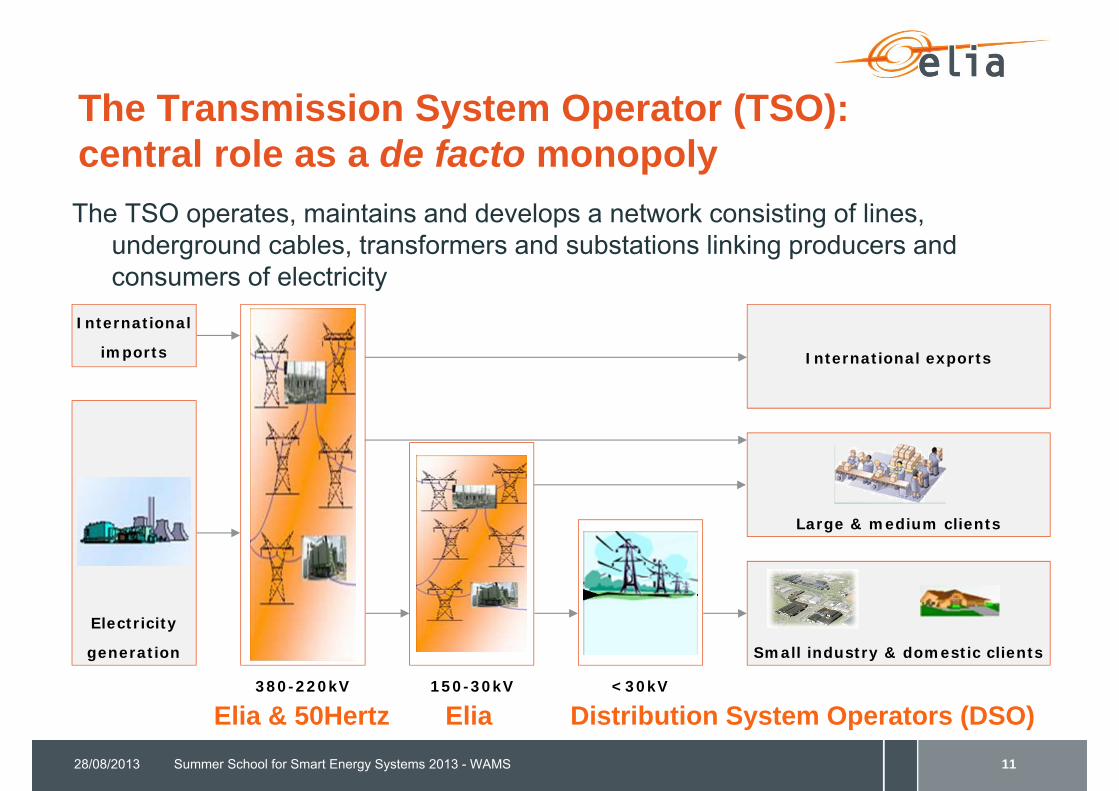
The Transmission System Operator (TSO): central role as a de facto monopolyThe TSO operates, maintains and develops a network consisting of lines,
underground cables, transformers and substations linking producers and consumers of electricity
28/08/2013 Summer School for Smart Energy Systems 2013 - WAMS 11
International exports
Electricity
generation
International
imports
Small industry & domestic clients
Large & medium clients
380-220kV 150-30kV <30kV
EliaElia & 50Hertz Distribution System Operators (DSO)

Elia Group activities
28/08/2013 Summer School for Smart Energy Systems 2013 - WAMS 12
System Operation• Capacity allocation• Network operation• Balancing generation and demand
Infrastructure Management
Related Activities
• Ownership• Maintenance• Development
• Market facilitator• Services & technical expertise• Telecom services• Power Exchange Hubs• EU Integration: CASC, Coreso• Activities for third parties (consulting)
More on www.eliagroup.eu

About your trainer: Jacques Warichet
2004 MSc Electromechanical Engineering, Université Libre de Bruxelles (ULB), Belgium
2004-2008 Research and teaching assistant, ULBResearch on PMUs Financed by Siemens AGPhD about synchrophasor measurements (completed February 2013)
Since 2008 Power Grid Security Expert, Elia, Belgium
Dynamic Security AssessmentGrid Connection requirements for generating units and HVDC links
EU FP7 Project Twenties (2010-2013): in charge of the WAMS setup to monitor inter-area oscillations
Summer School for Smart Energy Systems 2013 - WAMS28/08/2013 13

Summer School for Smart Energy Systems 2013 - WAMS
Measurements in power systems
Power System Wide Area Measurement, Protection & Control
28/08/2013
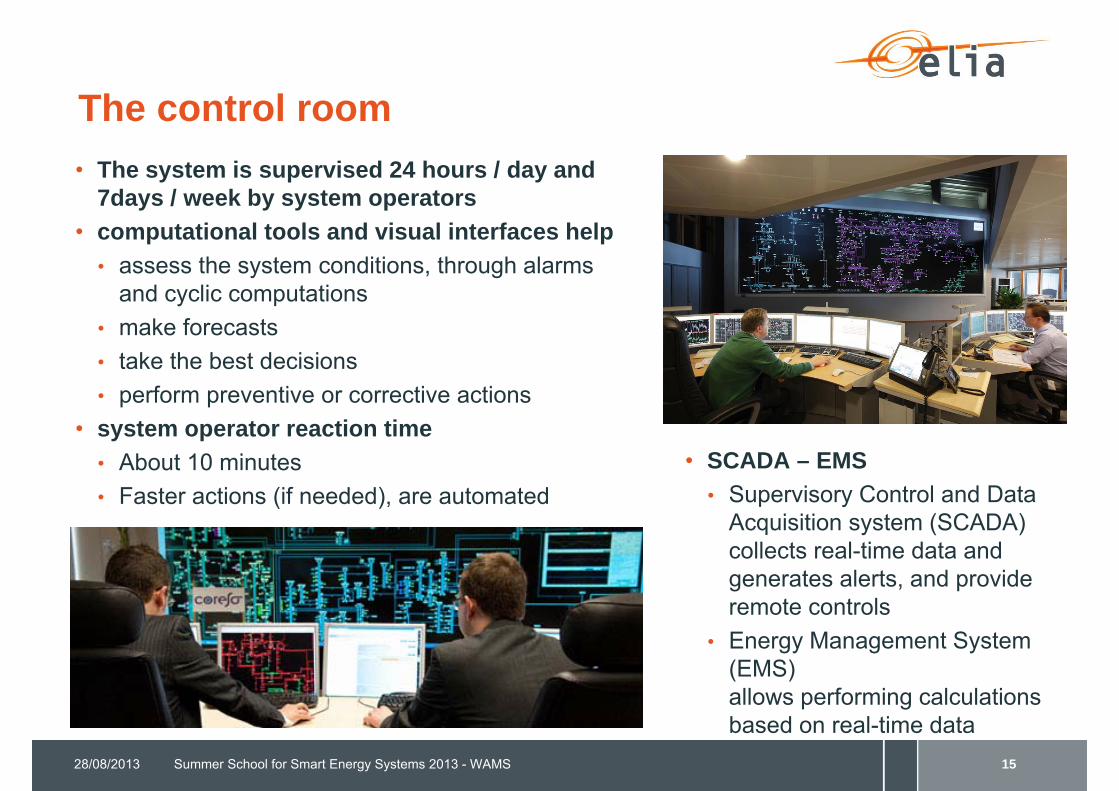
The control room• The system is supervised 24 hours / day and
7days / week by system operators• computational tools and visual interfaces help
• assess the system conditions, through alarms and cyclic computations
• make forecasts• take the best decisions • perform preventive or corrective actions
• system operator reaction time• About 10 minutes• Faster actions (if needed), are automated
• SCADA – EMS• Supervisory Control and Data
Acquisition system (SCADA) collects real-time data and generates alerts, and provide remote controls
• Energy Management System (EMS) allows performing calculations based on real-time data
28/08/2013 Summer School for Smart Energy Systems 2013 - WAMS 15
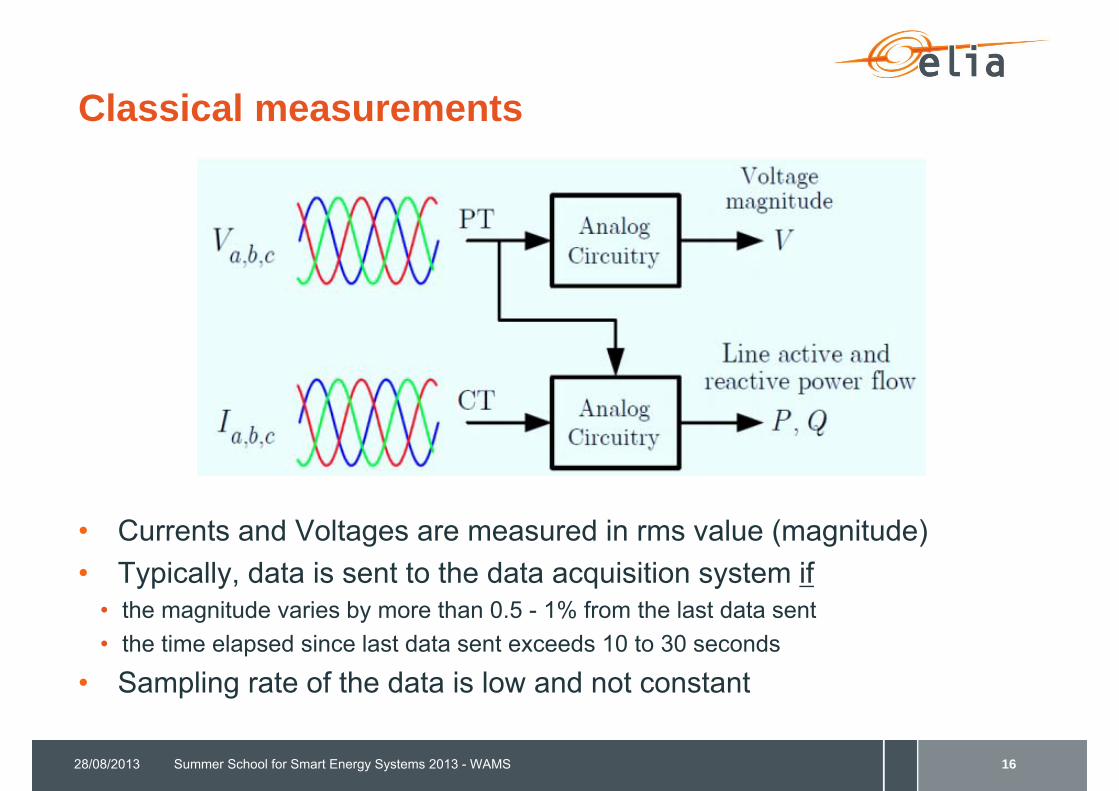
Classical measurements
• Currents and Voltages are measured in rms value (magnitude) • Typically, data is sent to the data acquisition system if
• the magnitude varies by more than 0.5 - 1% from the last data sent • the time elapsed since last data sent exceeds 10 to 30 seconds
• Sampling rate of the data is low and not constant
28/08/2013 Summer School for Smart Energy Systems 2013 - WAMS 16
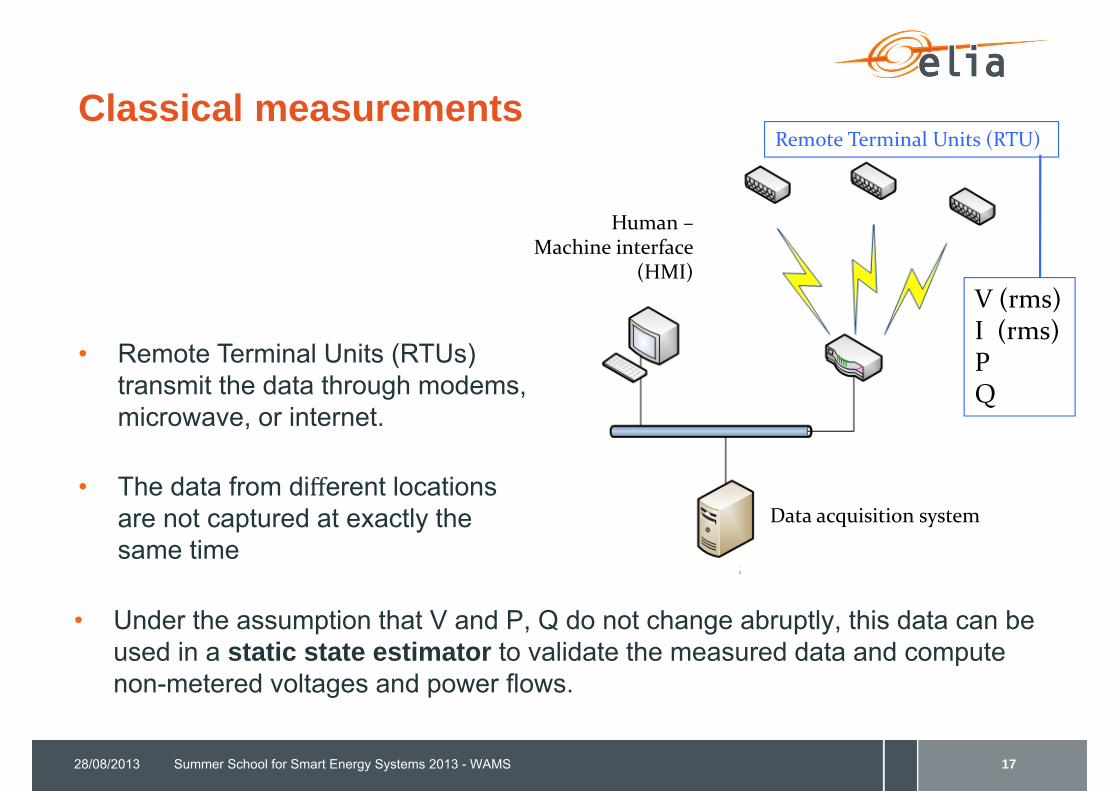
Classical measurements
• Under the assumption that V and P, Q do not change abruptly, this data can be used in a static state estimator to validate the measured data and compute non-metered voltages and power flows.
28/08/2013 Summer School for Smart Energy Systems 2013 - WAMS 17
Remote Terminal Units (RTU)
Data acquisition system
V (rms)I (rms)PQ
Human –Machine interface
(HMI)
• Remote Terminal Units (RTUs) transmit the data through modems, microwave, or internet.
• The data from different locations are not captured at exactly the same time
Why Phasor Measurement Units (PMUs) ?
• Phasor measurement data is synchronized with GPS signals• all voltage and current phasors measured across a wide geographical region will be
synchronized• High sampling rate (10-50 samples per second)
• Extended visibility through phasor data exchange: across different operating regions (beyond the eye of a single TSO)
• Dynamic responses and steady state responses also: better monitoring.• Exposes system dynamics, e.g. inter-area oscillations.• Aids in validating the system performance, model parameters, and controller
settings• Assists protective systems with new information• Aid in restoration (e.g. synchronization of islands)
• Can help existing EMS functions and provide new ones• Supplement/Assist static state estimators with additional data• Precise angle measurement allows the calculation of power transfer between
buses: improves static state estimator performance and accuracy
28/08/2013 Summer School for Smart Energy Systems 2013 - WAMS 18
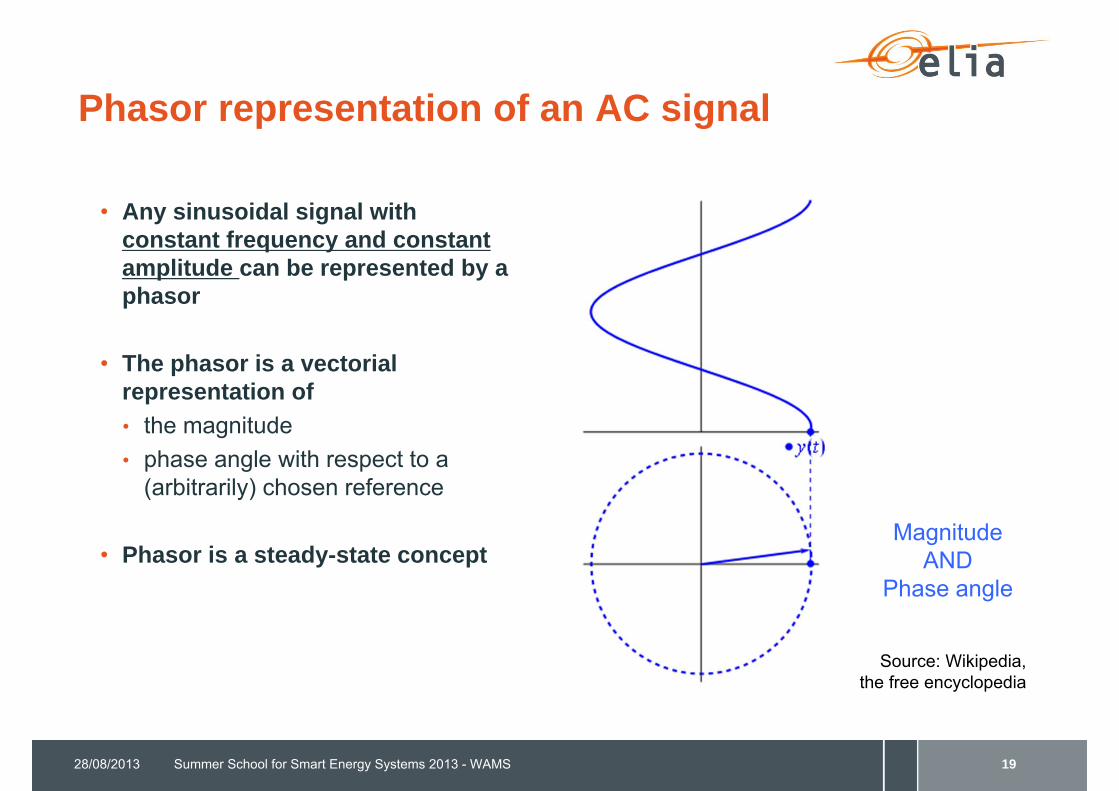
Phasor representation of an AC signal
• Any sinusoidal signal with constant frequency and constant amplitude can be represented by a phasor
• The phasor is a vectorialrepresentation of • the magnitude • phase angle with respect to a
(arbitrarily) chosen reference
• Phasor is a steady-state concept
28/08/2013 Summer School for Smart Energy Systems 2013 - WAMS 19
Source: Wikipedia, the free encyclopedia
Magnitude AND
Phase angle
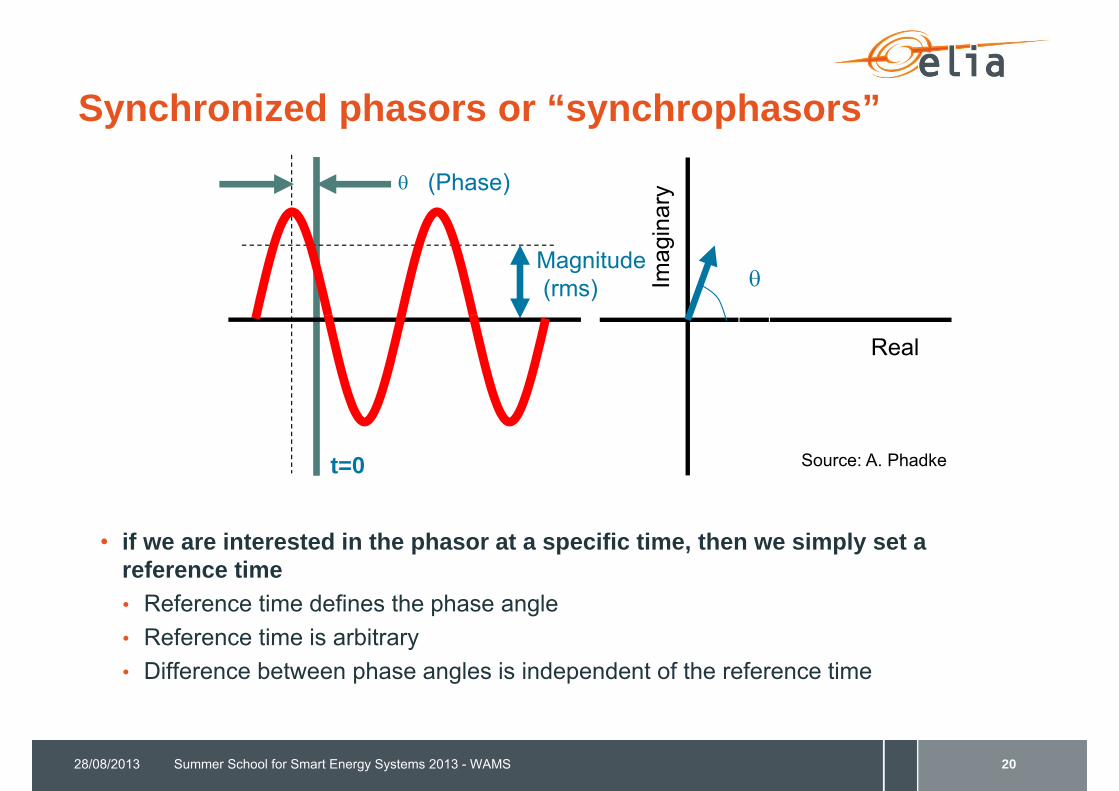
Synchronized phasors or “synchrophasors”
• if we are interested in the phasor at a specific time, then we simply set a reference time• Reference time defines the phase angle• Reference time is arbitrary• Difference between phase angles is independent of the reference time
28/08/2013 Summer School for Smart Energy Systems 2013 - WAMS 20
Real
Imag
inar
y
t=0 Source: A. Phadke
Magnitude(rms)
(Phase)
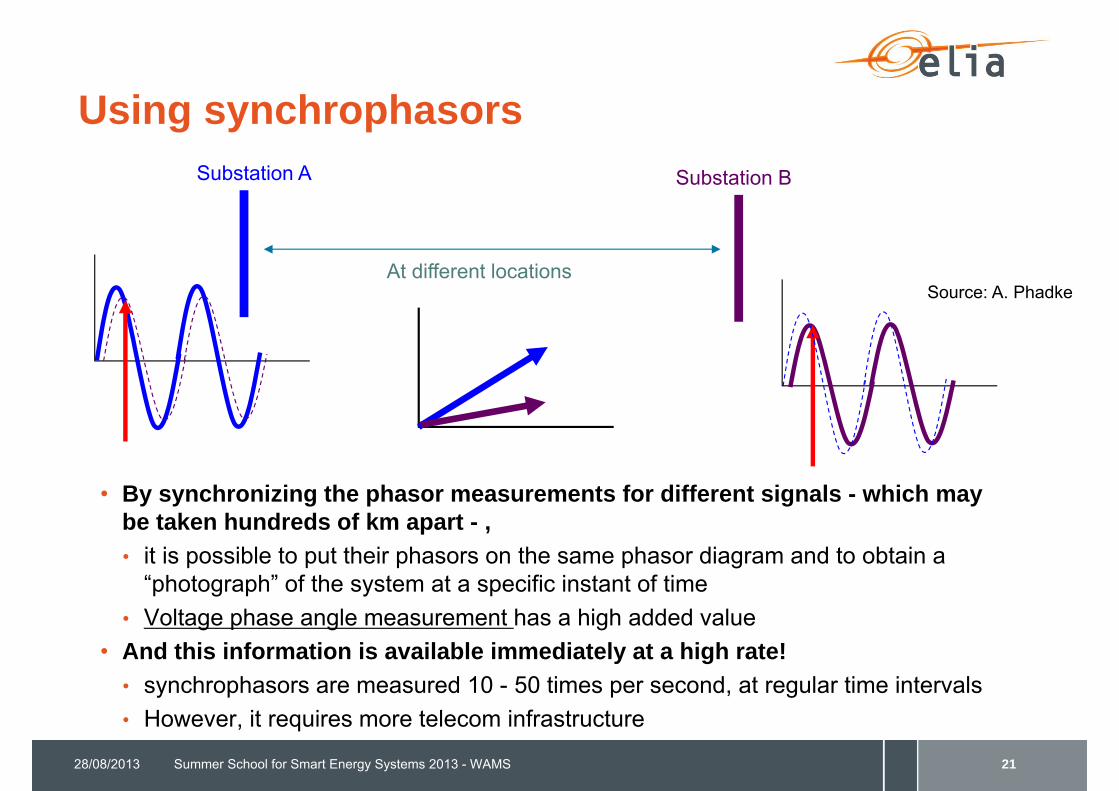
Using synchrophasors
• By synchronizing the phasor measurements for different signals - which may be taken hundreds of km apart - , • it is possible to put their phasors on the same phasor diagram and to obtain a
“photograph” of the system at a specific instant of time• Voltage phase angle measurement has a high added value
• And this information is available immediately at a high rate! • synchrophasors are measured 10 - 50 times per second, at regular time intervals• However, it requires more telecom infrastructure
28/08/2013 Summer School for Smart Energy Systems 2013 - WAMS 21
Substation A Substation B
At different locationsSource: A. Phadke
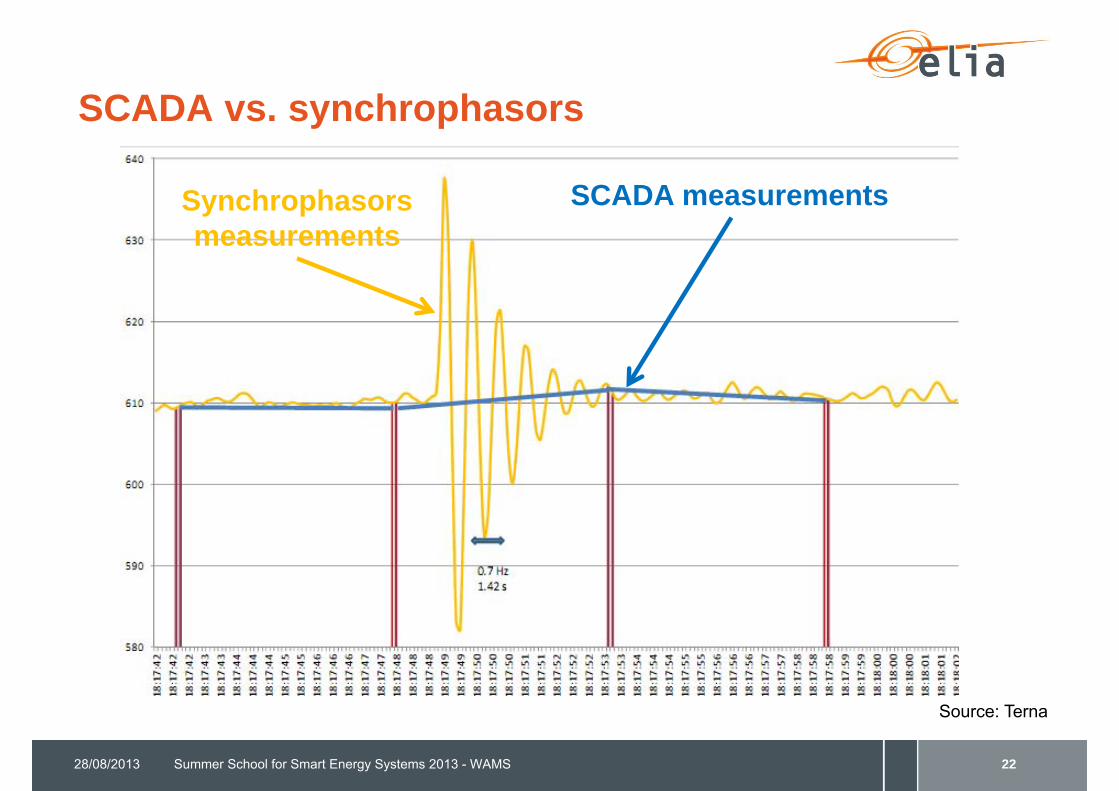
SCADA vs. synchrophasors
28/08/2013 Summer School for Smart Energy Systems 2013 - WAMS 22
Source: Terna
SCADA measurementsSynchrophasorsmeasurements

Wide Area Measurement Systems (WAMS)
28/08/2013 Summer School for Smart Energy Systems 2013 - WAMS 23
Samples
Samples - PhasorsProtection
Substation automation
EMSSCADAWide Area /Coordinated
Local /Uncoordinated
Dynamic Static
Wide Area Monitoring, Protection and Control
Control Center

Summer School for Smart Energy Systems 2013 - WAMS
History of phasor measurement
Power System Wide Area Measurement, Protection & Control
28/08/2013
History of WAMS & PMUs
• Wide area measurement systems• Wide area measurements in power systems have been used in EMS (Energy
Management System) functions for a long time• Ex: State Estimation, Economic Dispatch, tie line bias control and Automatic
Generation Control (AGC)• Modern wide area measurement systems can be traced back to 1965, after the
first North Eastern Blackout synchronization• But GPS fully deployed in the 1980s
• Phasor Measurement Units• Computer/Numerical Relaying developments in 1960-70s
• Computational speed limited the ability to supervise all type of faults• 1977: symmetrical components allowed reducing the number of equations
• Application of symmetrical components to power system applications• Development of first PMUs at Virginia Tech (USA) ~ 1982-1992 led by Arun Phadke• Leads to the first commercial PMU “Macrodyne” in 1992
Summer School for Smart Energy Systems 2013 - WAMS28/08/2013 25
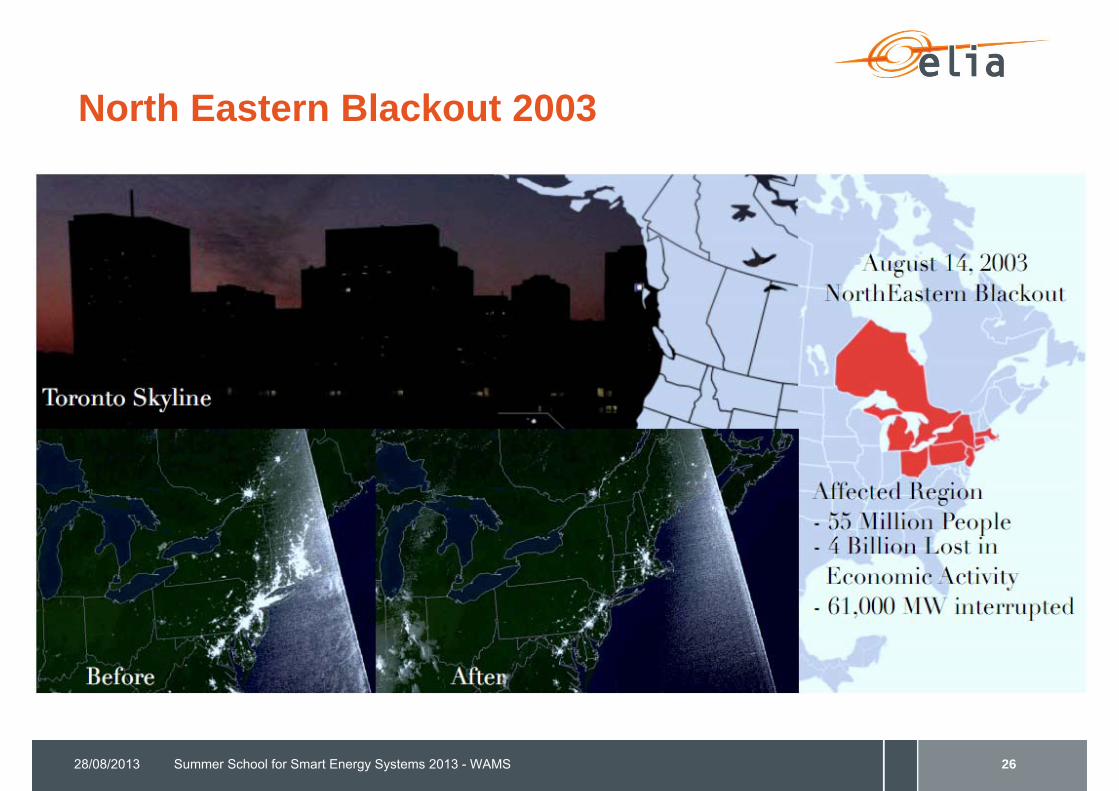
North Eastern Blackout 2003
28/08/2013 Summer School for Smart Energy Systems 2013 - WAMS 26
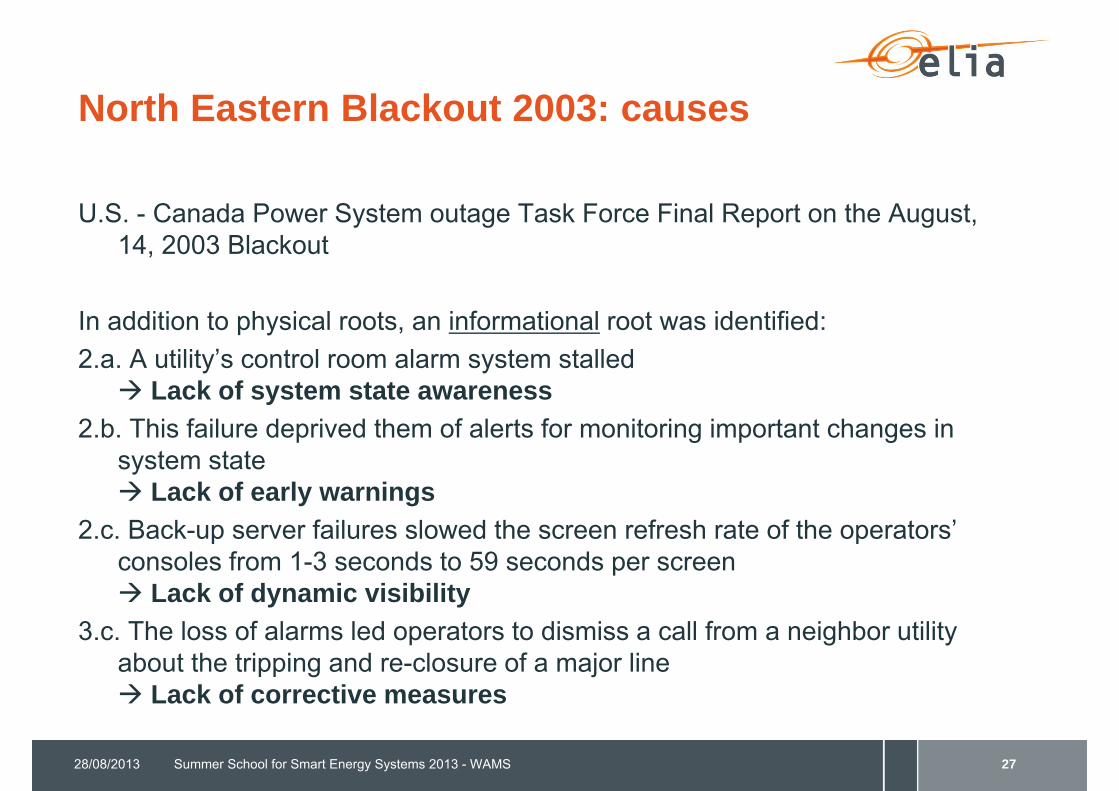
North Eastern Blackout 2003: causes
U.S. - Canada Power System outage Task Force Final Report on the August, 14, 2003 Blackout
In addition to physical roots, an informational root was identified:2.a. A utility’s control room alarm system stalled Lack of system state awareness
2.b. This failure deprived them of alerts for monitoring important changes in system state Lack of early warnings
2.c. Back-up server failures slowed the screen refresh rate of the operators’ consoles from 1-3 seconds to 59 seconds per screen Lack of dynamic visibility
3.c. The loss of alarms led operators to dismiss a call from a neighbor utility about the tripping and re-closure of a major line Lack of corrective measures
28/08/2013 Summer School for Smart Energy Systems 2013 - WAMS 27
Triggers towards synchrophasors technology
• While synchrophasors already existed prior 1996, the major disturbances in the USA (1996, 2003) and the Italian blackout of 2003, were the trigger towards practical implementation of synchrophasors
• Why wait so long?• Despite these events, the Security of Supply is very high (99,995%)• Power industry is known to be “conservative”: new tools, new processes need a
thorough validation and a good business case
• Recent developments put extra pressure on the power industry to use their assets better, closer to the limits of the system• Market liberalization and penetration of “intermittent” renewable energy sources
lead to more changing flows patterns• Developing the grid takes time and is more and more difficult due to environmental
constraints
28/08/2013 Summer School for Smart Energy Systems 2013 - WAMS 28

Milestones in wide area measurement systems
28/08/2013 Summer School for Smart Energy Systems 2013 - WAMS 29
1988
1st PMU PrototypeVirginia
Tech
1992
1st commercial PMU
Macrodyne
1995 20051893
Introduction of “Phasor” concept
1980s
GPStechnology
2011 2013
Latest version ofIEEE Std.
C37.118-2011
New PMU Standard
(IEEE C37.118-2005)
1st PMU Standard
(IEEE 1344)
1960s
2011-2012Massive
deployment programFinanced by the DoE
(USA)
1965North Eastern
Blackout
Birth of ModernWide Area
MeasurementSystems
Start of Numerical
RelaysDevelopment
1996WSCC
disturbance
2003North Eastern
&Italian
Blackouts
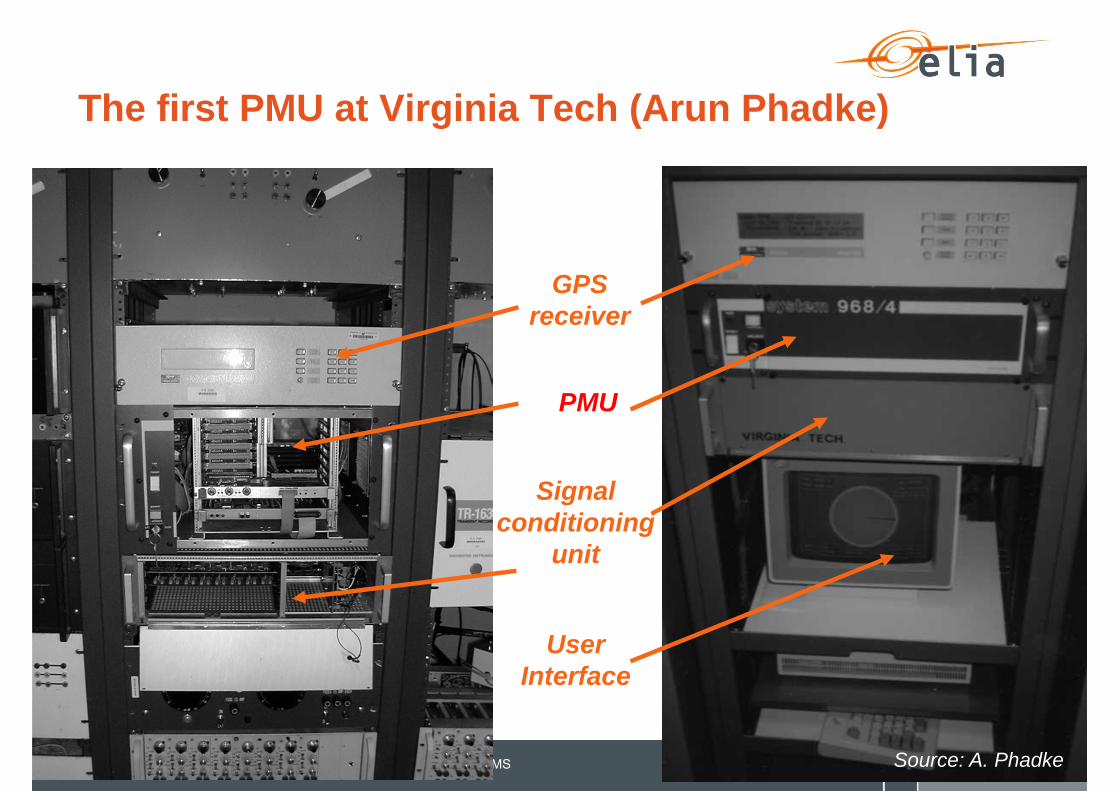
The first PMU at Virginia Tech (Arun Phadke)
28/08/2013 Summer School for Smart Energy Systems 2013 - WAMS 30
(b)
GPSreceiver
PMU
Signalconditioning
unit
UserInterface
Source: A. Phadke
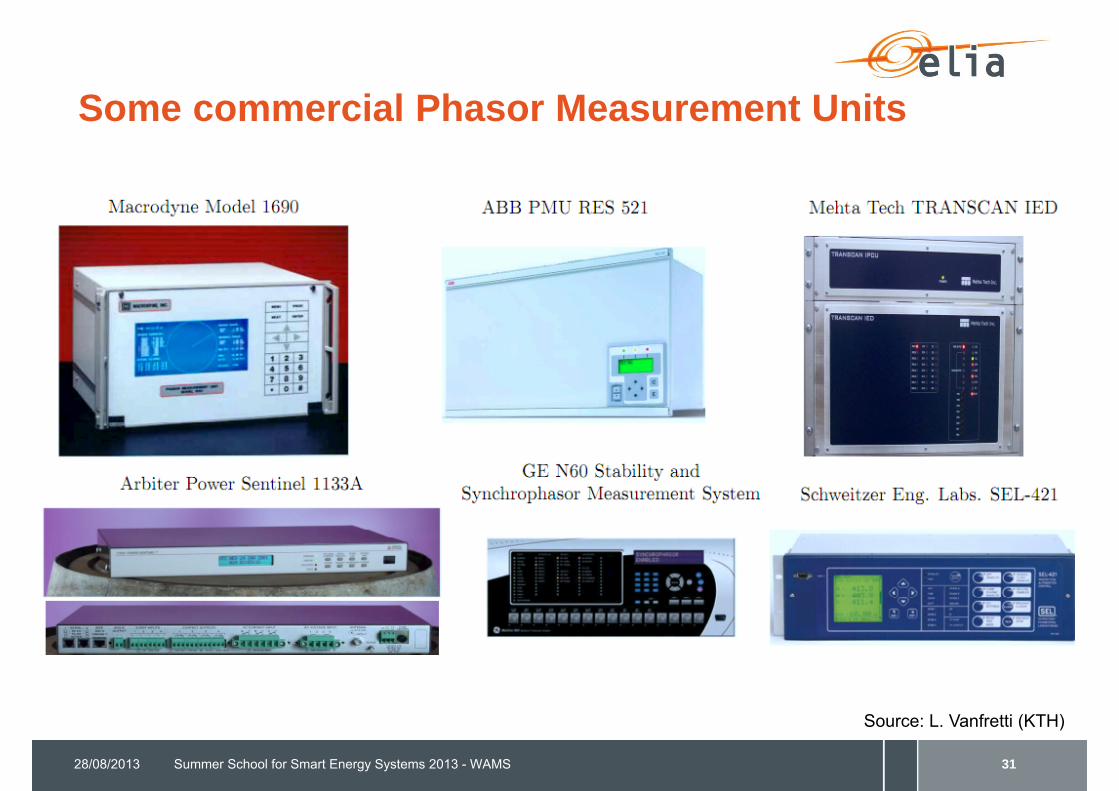
Some commercial Phasor Measurement Units
28/08/2013 Summer School for Smart Energy Systems 2013 - WAMS 31
Source: L. Vanfretti (KTH)
Summer School for Smart Energy Systems 2013 - WAMS
Principles of phasor measurement
Power System Wide Area Measurement, Protection & Control
28/08/2013
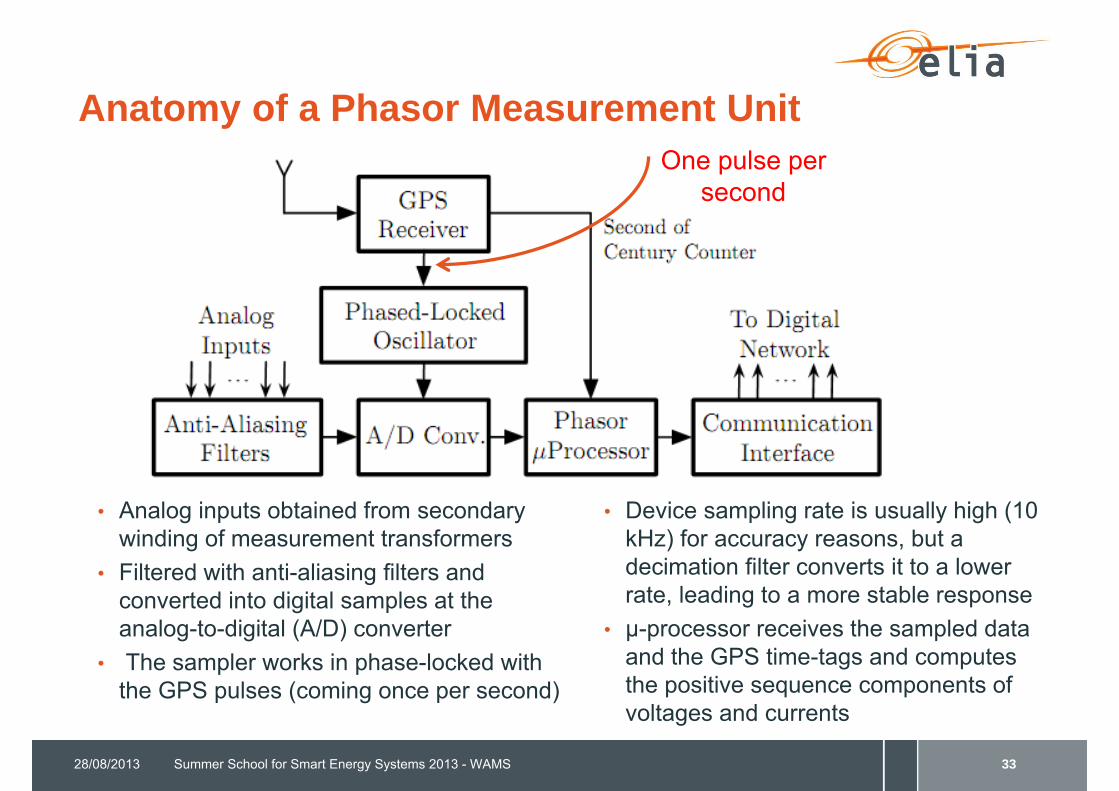
Anatomy of a Phasor Measurement Unit
• Analog inputs obtained from secondary winding of measurement transformers
• Filtered with anti-aliasing filters and converted into digital samples at the analog-to-digital (A/D) converter
• The sampler works in phase-locked with the GPS pulses (coming once per second)
• Device sampling rate is usually high (10 kHz) for accuracy reasons, but a decimation filter converts it to a lower rate, leading to a more stable response
• µ-processor receives the sampled data and the GPS time-tags and computes the positive sequence components of voltages and currents
28/08/2013 Summer School for Smart Energy Systems 2013 - WAMS 33
One pulse per second

Phasor definition
28/08/2013 Summer School for Smart Energy Systems 2013 - WAMS 34
Source: L. Vanfretti (KTH)

Phasor estimation from sampled data
• The voltage and current continuoussignals are sampled.
Here we use 12 points per cycle sampling rate: 12 x 50 Hz = 600 Hz
• Discrete Fourier Series (DFT) are used to compute the magnitude and phase of the signal.
28/08/2013 Summer School for Smart Energy Systems 2013 - WAMS 35
Samples of unit magnitude
sine and cosinefunctions
t
Input signal
Dat
asa
mpl
es
cosi
nes
sine
s
xN-1......x1x0
Source: A. Phadke

Non-recursive phasor estimation
28/08/2013 Summer School for Smart Energy Systems 2013 - WAMS 36
sin and cosfunctions,window 1
t
Input signal
New sample, window 2
sin and cosfunctions,window 2(shifted)
21
2 = 1 + k
1
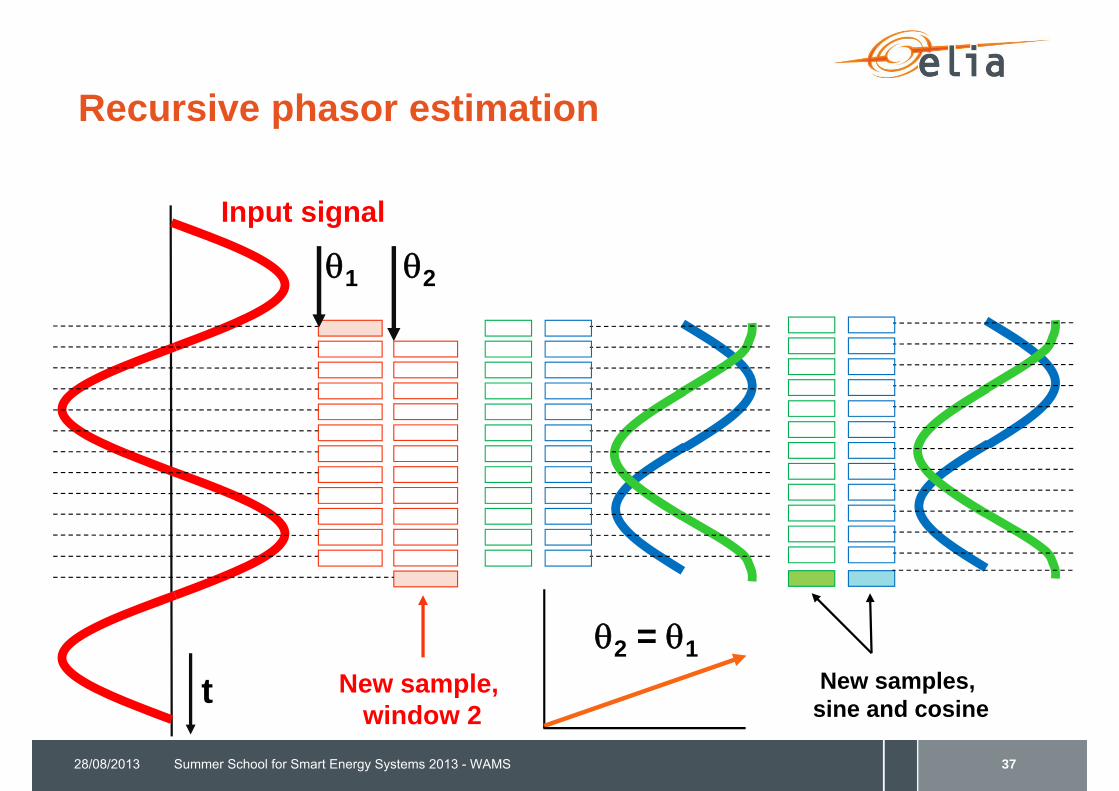
Recursive phasor estimation
28/08/2013 Summer School for Smart Energy Systems 2013 - WAMS 37
t
Input signal
21
New sample, window 2
2 = 1New samples,
sine and cosine
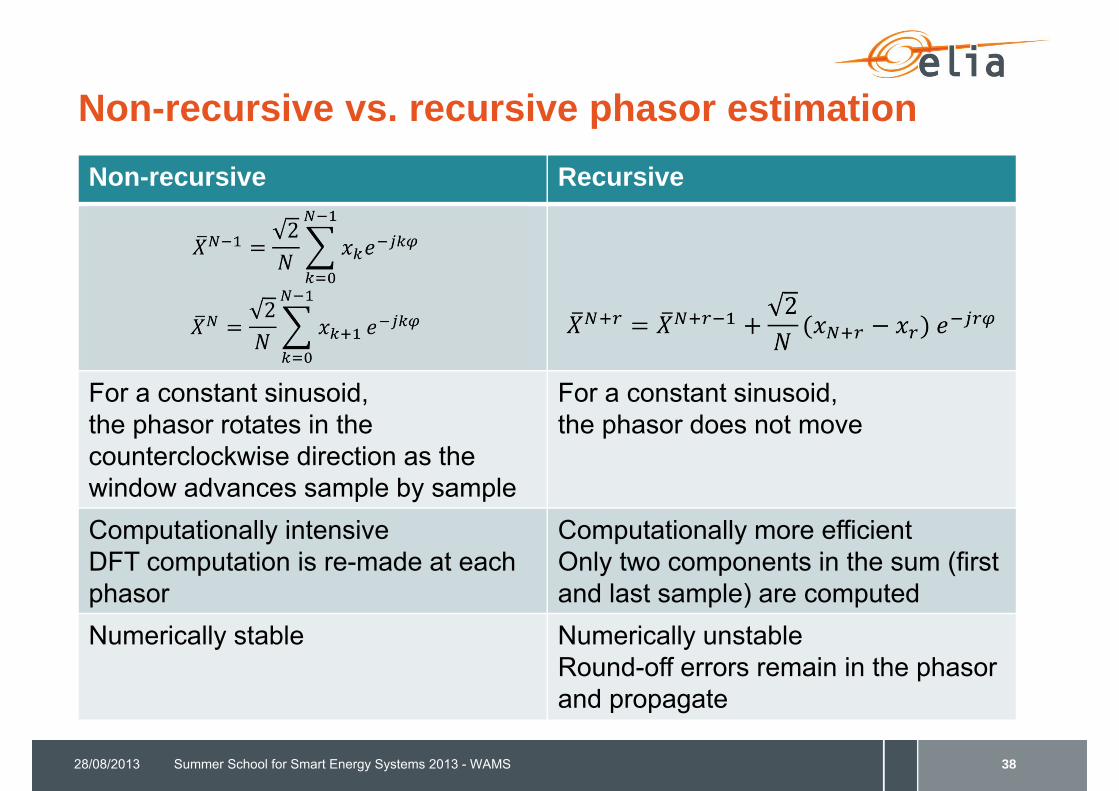
Non-recursive vs. recursive phasor estimationNon-recursive Recursive
For a constant sinusoid, the phasor rotates in the counterclockwise direction as the window advances sample by sample
For a constant sinusoid,the phasor does not move
Computationally intensive DFT computation is re-made at eachphasor
Computationally more efficientOnly two components in the sum (first and last sample) are computed
Numerically stable Numerically unstableRound-off errors remain in the phasor and propagate
28/08/2013 Summer School for Smart Energy Systems 2013 - WAMS 38

Noise in phasor estimation
28/08/2013 Summer School for Smart Energy Systems 2013 - WAMS 39
• Harmonics are eliminated correctly if Nyquist criterion is satisfied: fs > 2 fmax
• Using a complete cycle reduces the effect of random noise (mostly, measurement noise) on the resulting phasor.
• DFT over multiple cycles is also possible
True Phasor
Circle ofuncertainty
Size
of c
ircle
of
unce
rtai
nty
Measurement data window
Source: A. Phadke
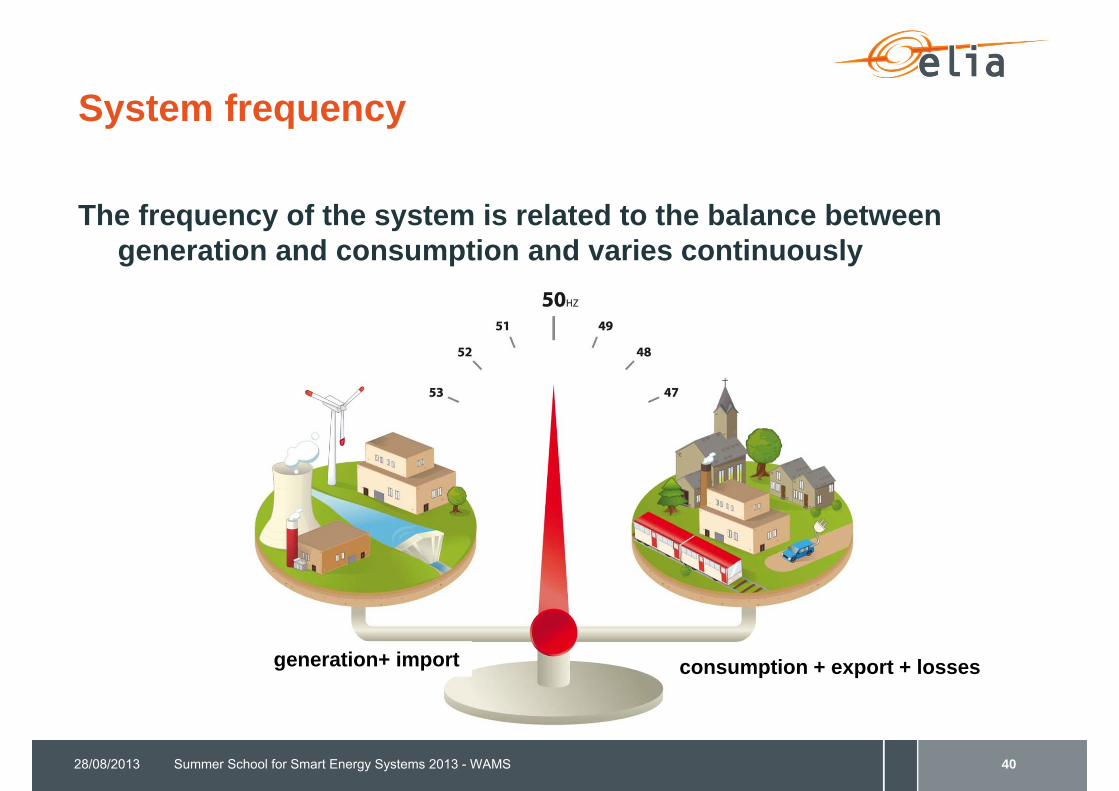
System frequency
The frequency of the system is related to the balance between generation and consumption and varies continuously
28/08/2013 Summer School for Smart Energy Systems 2013 - WAMS 40
generation+ import consumption + export + losses
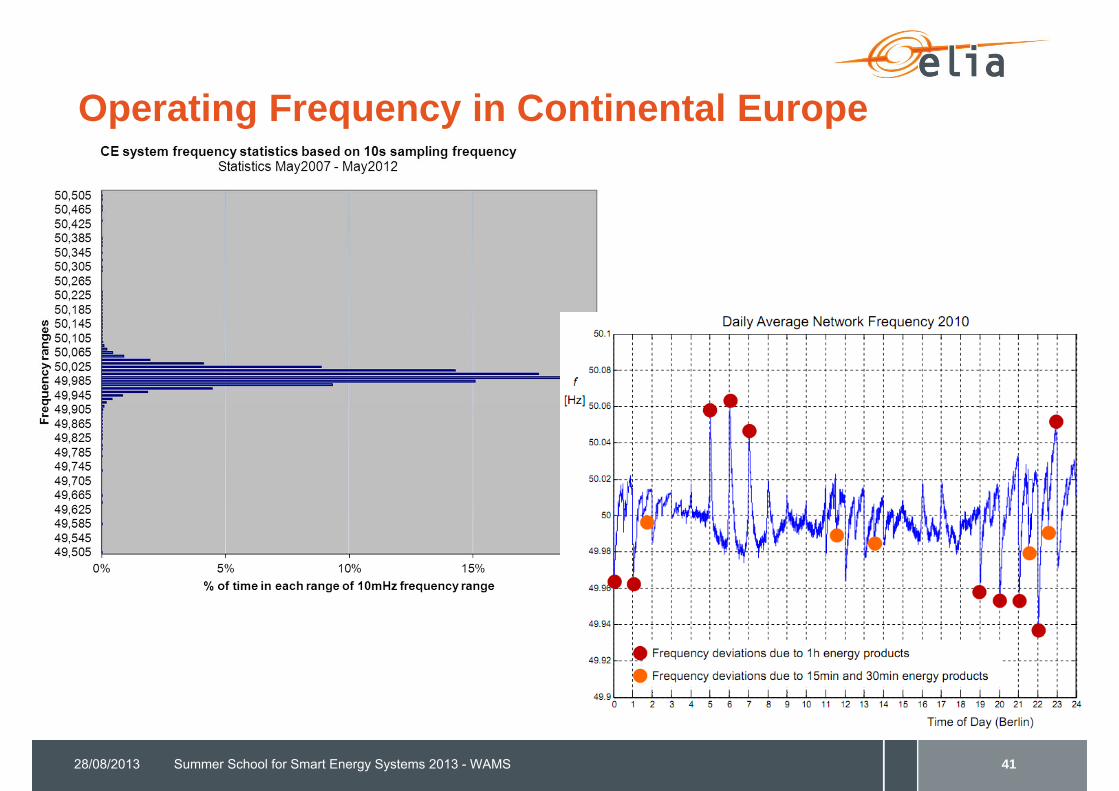
Operating Frequency in Continental Europe
28/08/2013 Summer School for Smart Energy Systems 2013 - WAMS 41
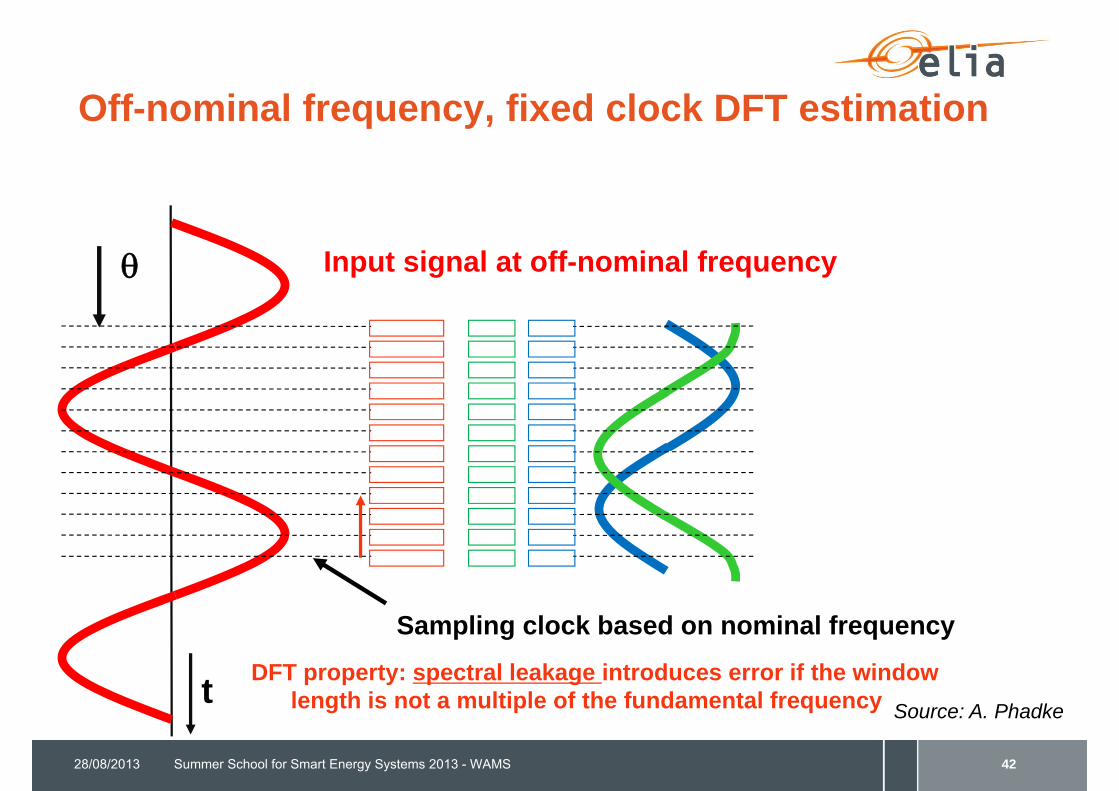
Off-nominal frequency, fixed clock DFT estimation
28/08/2013 Summer School for Smart Energy Systems 2013 - WAMS 42
t
Input signal at off-nominal frequency
Source: A. Phadke
Sampling clock based on nominal frequencyDFT property: spectral leakage introduces error if the window
length is not a multiple of the fundamental frequency
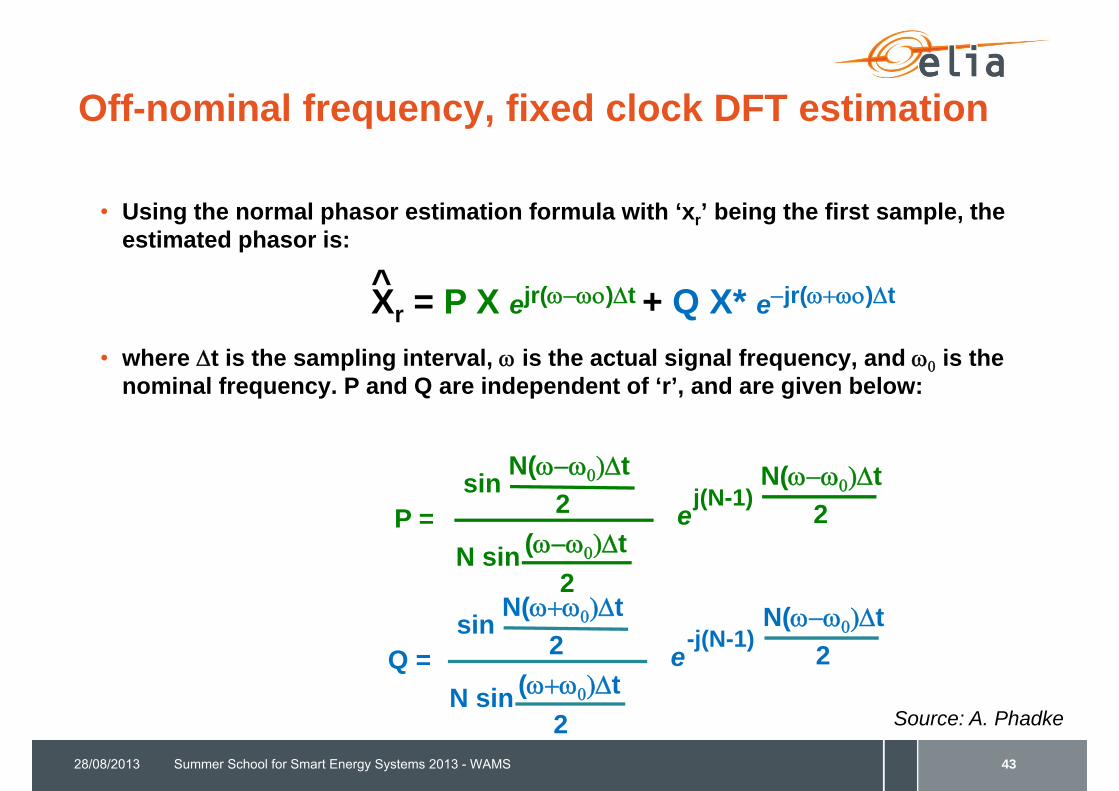
Off-nominal frequency, fixed clock DFT estimation
• Using the normal phasor estimation formula with ‘xr’ being the first sample, the estimated phasor is:
• where t is the sampling interval, is the actual signal frequency, and is the nominal frequency. P and Q are independent of ‘r’, and are given below:
28/08/2013 Summer School for Smart Energy Systems 2013 - WAMS 43
Xr = P X ejr()t + Q X* ejr()t
N(t2P =
sin
(tN sin2
N(t2e
j(N-1)
N(t2Q =
sin
(tN sin2
N(t2e
-j(N-1)
Source: A. Phadke
^
Off-nominal frequency, fixed clock DFT estimation
28/08/2013 Summer School for Smart Energy Systems 2013 - WAMS 44
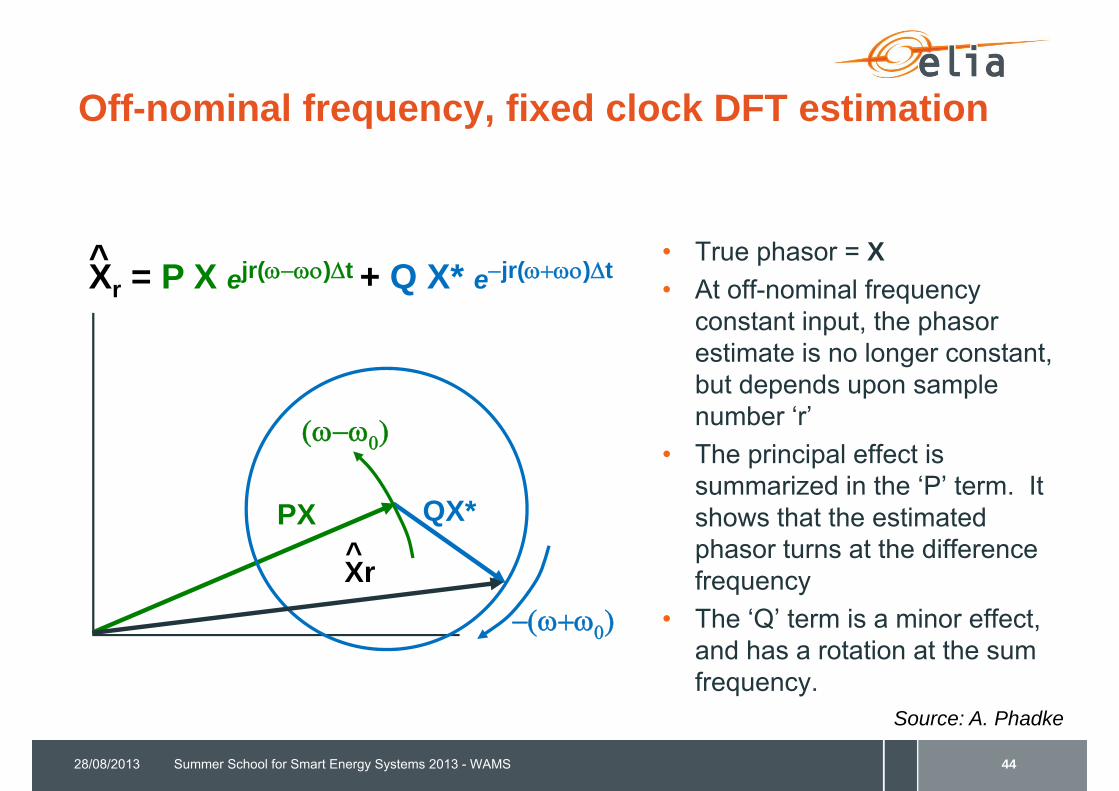
Xr = P X ejr()t + Q X* ejr()t^
Source: A. Phadke
PX
Xr^QX*
• True phasor = X• At off-nominal frequency
constant input, the phasor estimate is no longer constant, but depends upon sample number ‘r’
• The principal effect is summarized in the ‘P’ term. It shows that the estimated phasor turns at the difference frequency
• The ‘Q’ term is a minor effect, and has a rotation at the sum frequency.
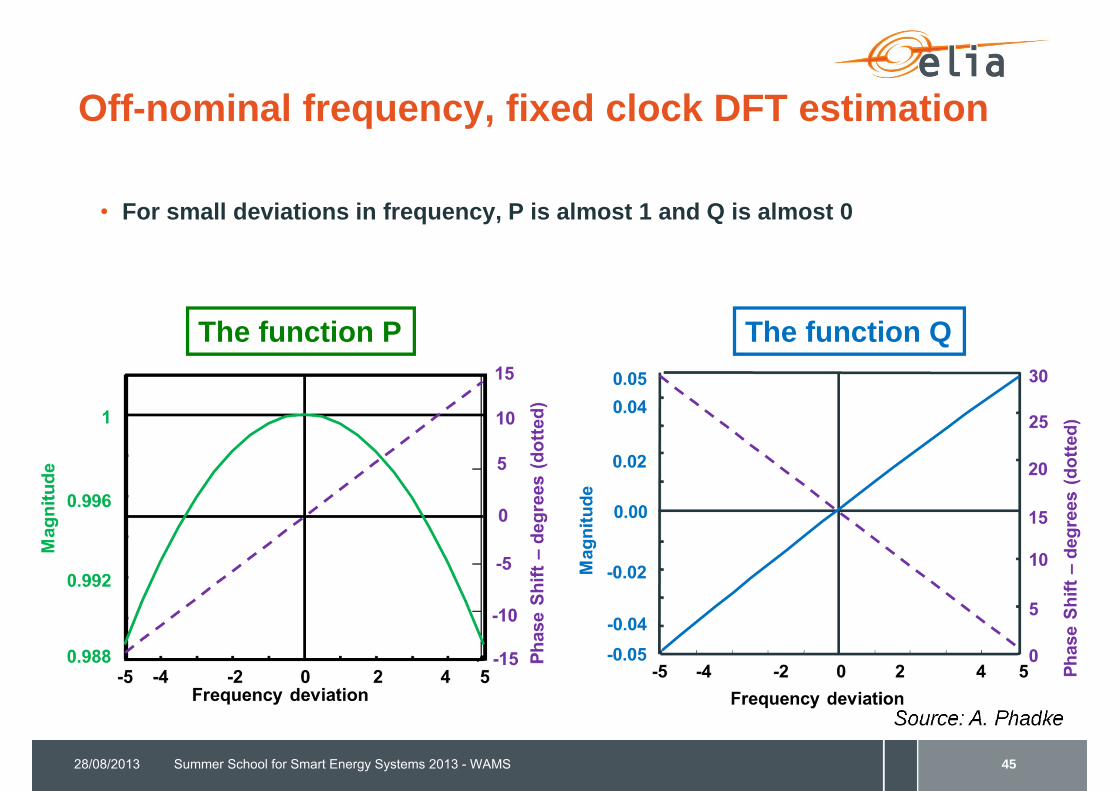
Off-nominal frequency, fixed clock DFT estimation
• For small deviations in frequency, P is almost 1 and Q is almost 0
28/08/2013 Summer School for Smart Energy Systems 2013 - WAMS 45
Source: A. Phadke
The function P The function Q
Off-nominal frequency, fixed clock DFT estimation
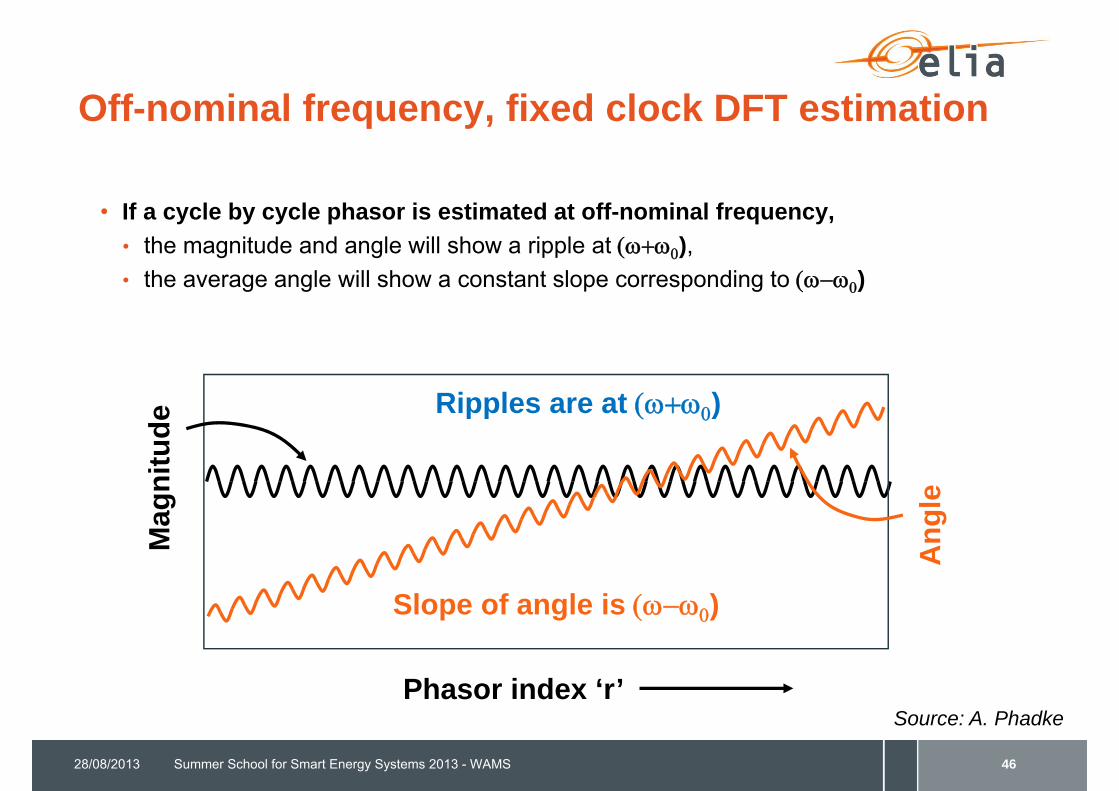
• If a cycle by cycle phasor is estimated at off-nominal frequency, • the magnitude and angle will show a ripple at ), • the average angle will show a constant slope corresponding to )
28/08/2013 Summer School for Smart Energy Systems 2013 - WAMS 46
Phasor index ‘r’
Mag
nitu
de
Ang
le
Ripples are at )
Slope of angle is )
Source: A. Phadke
Off-nominal frequency, fixed clock DFT estimation
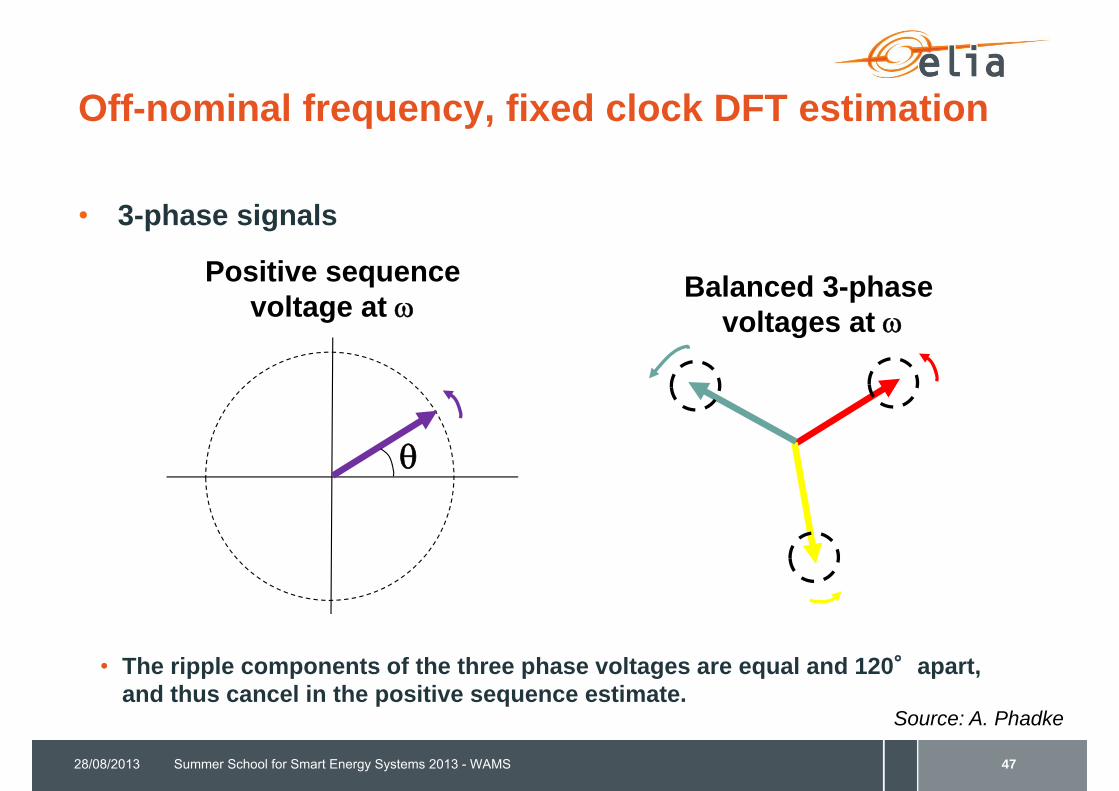
• 3-phase signals
• The ripple components of the three phase voltages are equal and 120°apart, and thus cancel in the positive sequence estimate.
28/08/2013 Summer School for Smart Energy Systems 2013 - WAMS 47
Balanced 3-phase voltages at
Positive sequencevoltage at
Source: A. Phadke

Off-nominal frequency, fixed clock DFT estimation
• Summary• For small frequency deviations, a single phase input with constant magnitude and
phase will lead to an estimate having minor error terms.• The principal effect is the rotation of the phasor estimate at difference frequency ), and a small ripple component at the sum frequency ).
• A pure positive sequence input at off-nominal frequency produces a pure positive sequence estimate without the ripple. The positive sequence estimate rotates at the difference frequency.
• Performance of the DFT estimator can be improved by adapting the length of the measurement window to the actual frequency of the signal
28/08/2013 Summer School for Smart Energy Systems 2013 - WAMS 48

Phasor estimation process with resampling
Performance of the DFT estimator can be improved by adapting the length of the measurement window to the actual frequency of the signal
28/08/2013 Summer School for Smart Energy Systems 2013 - WAMS 49
V or I analog input
Sampledsignal
Measurementwindow
Input filter
Resampling
Time tag
f estimation
Phasorestimation
Integer number of cycles
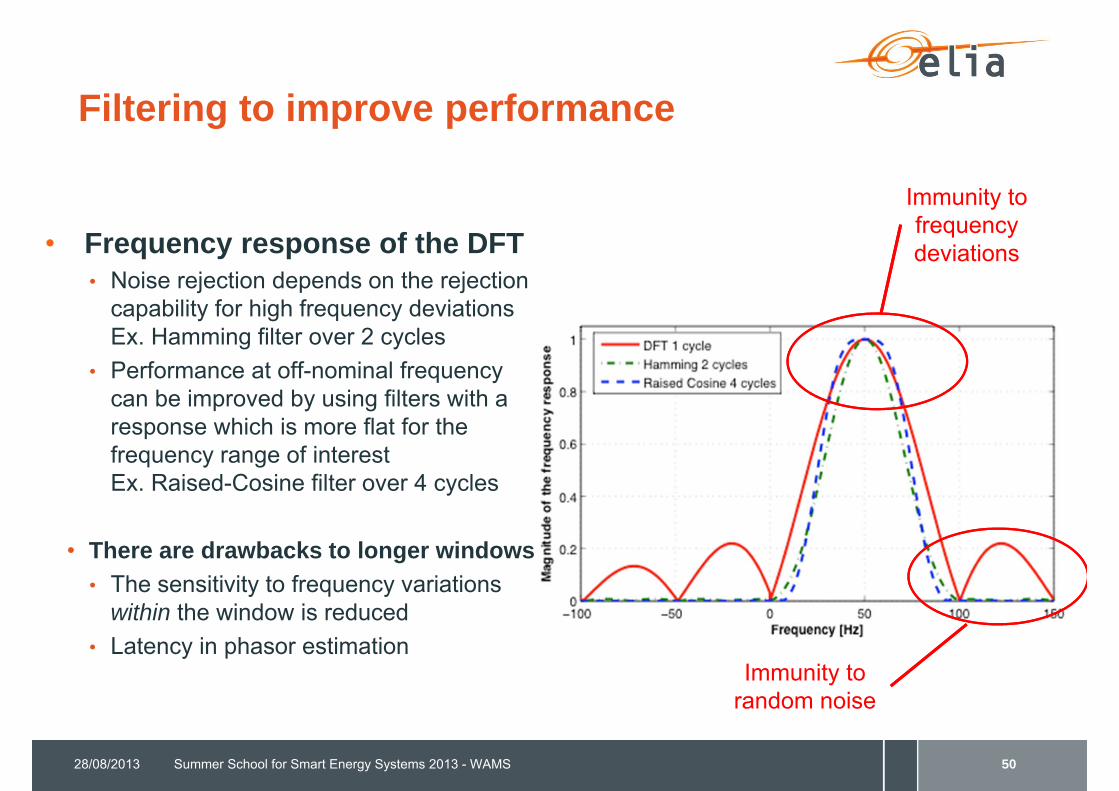
Filtering to improve performance
• Frequency response of the DFT• Noise rejection depends on the rejection
capability for high frequency deviationsEx. Hamming filter over 2 cycles
• Performance at off-nominal frequency can be improved by using filters with a response which is more flat for the frequency range of interestEx. Raised-Cosine filter over 4 cycles
• There are drawbacks to longer windows • The sensitivity to frequency variations
within the window is reduced• Latency in phasor estimation
28/08/2013 Summer School for Smart Energy Systems 2013 - WAMS 50
Immunity to frequency deviations
Immunity to random noise
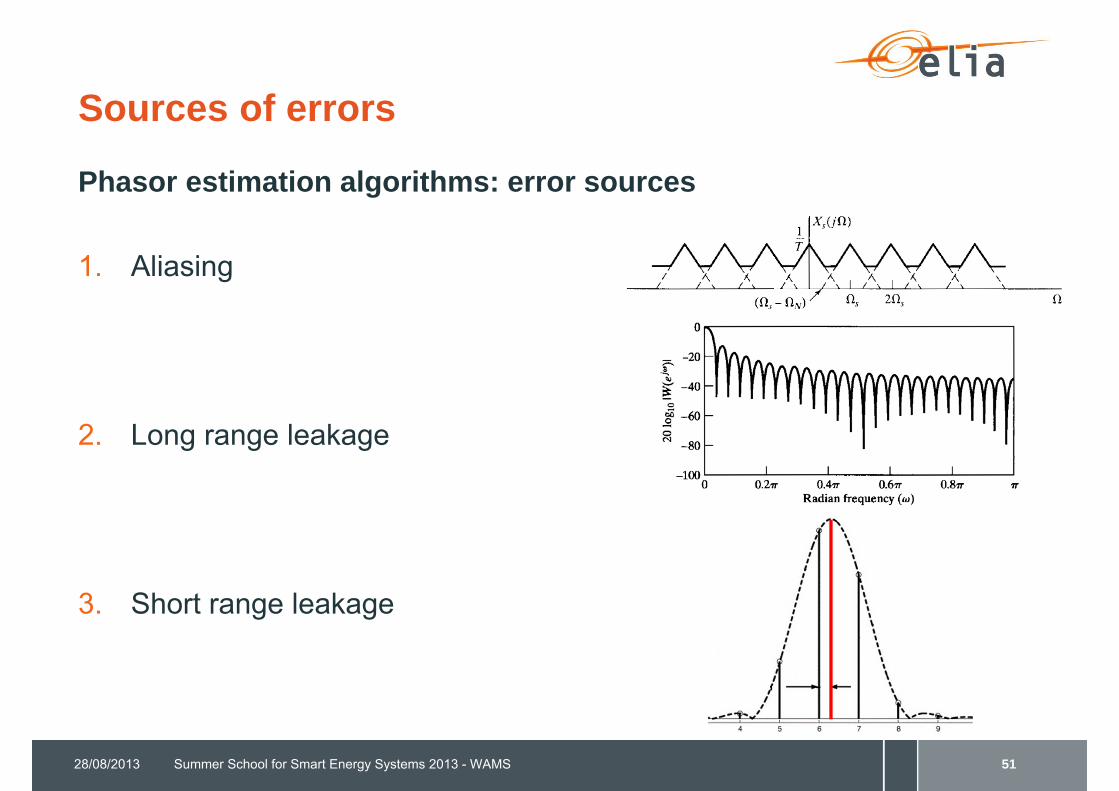
Sources of errors
Phasor estimation algorithms: error sources
1. Aliasing
2. Long range leakage
3. Short range leakage
28/08/2013 Summer School for Smart Energy Systems 2013 - WAMS 51
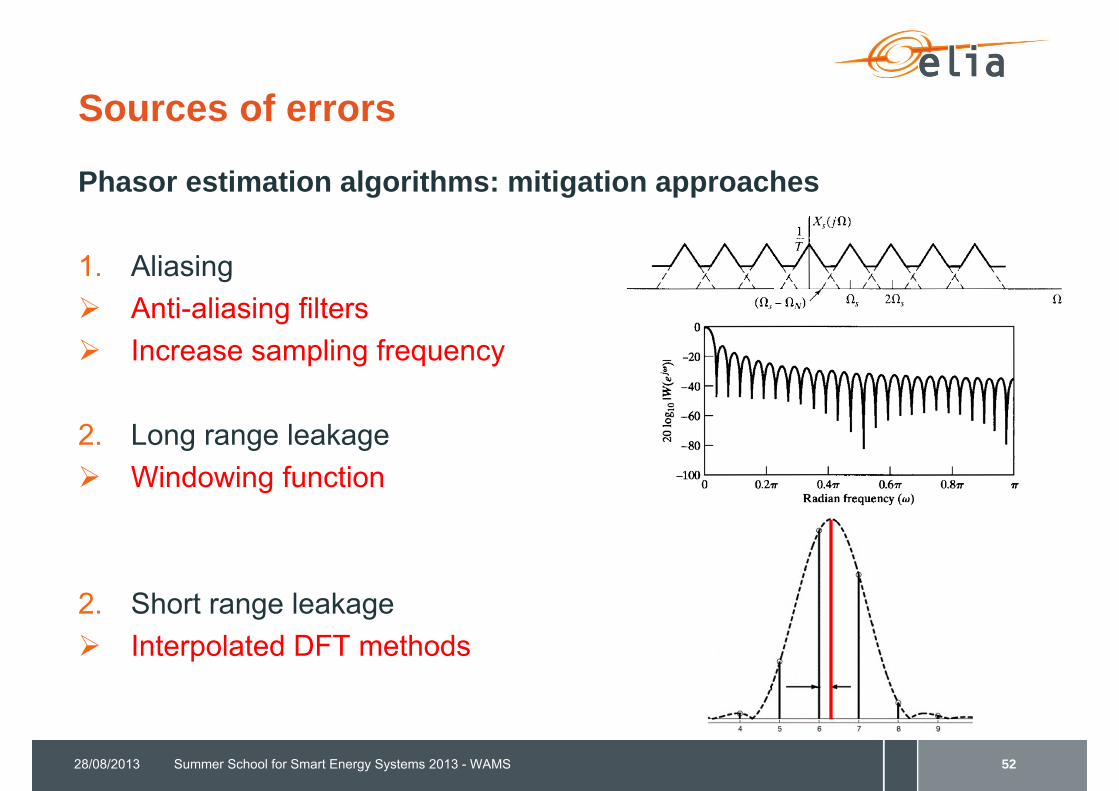
Sources of errors
Phasor estimation algorithms: mitigation approaches
1. Aliasing Anti-aliasing filters Increase sampling frequency
2. Long range leakage Windowing function
2. Short range leakage Interpolated DFT methods
28/08/2013 Summer School for Smart Energy Systems 2013 - WAMS 52

Latency of phasor estimation
• Latency • time delay between the phasor and the
time instant it represents
• Increasing the length of the window involves a higher latency in the phasor estimation
• There is a tradeoff between accuracy and latency
28/08/2013 Summer School for Smart Energy Systems 2013 - WAMS 53
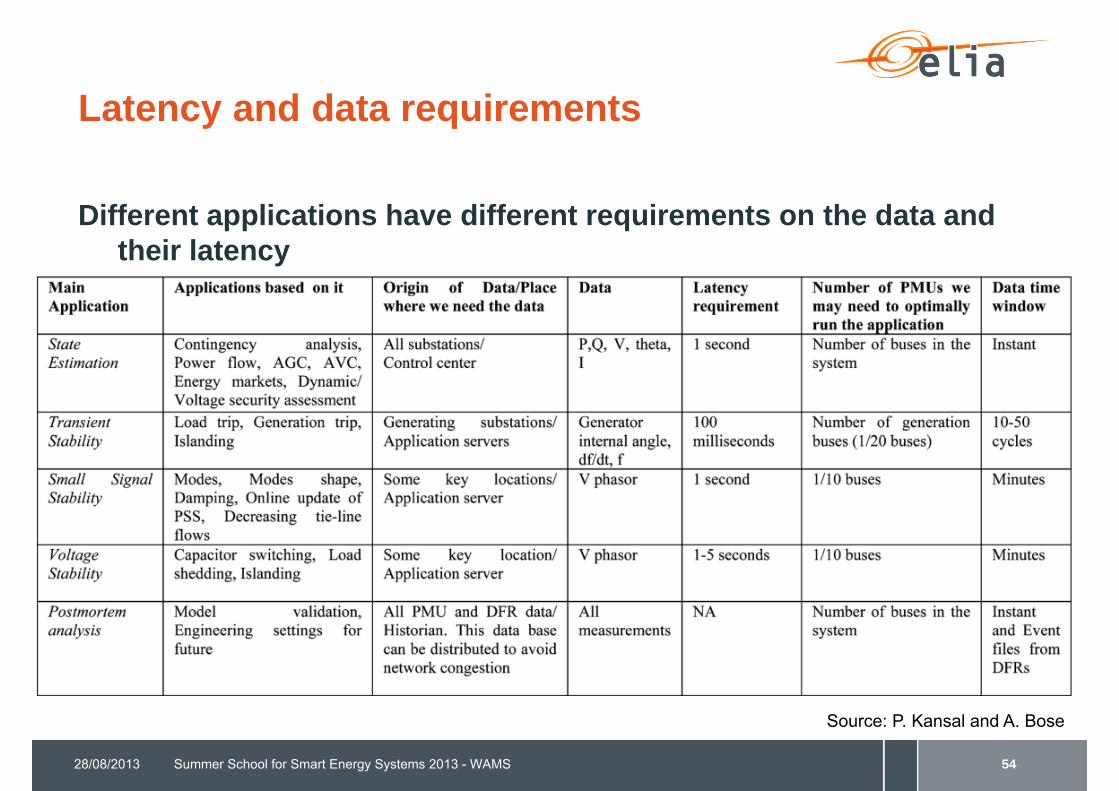
Latency and data requirements
Different applications have different requirements on the data and their latency
28/08/2013 Summer School for Smart Energy Systems 2013 - WAMS 54
Source: P. Kansal and A. Bose

Accuracy of phasor estimation
• Accuracy of the phasor estimation depends on the input signal• In steady-state, accuracy is very high (<< 0.1 degrees of error)• If the frequency varies (dynamic system conditions), then the error can be
substantial • During transients, especially with discontinuities, phasors meaning are questionable
• Each manufacturer implement its own algorithm for phasor estimation• Performance can be very different in different conditions
• Compared to other sources of errors in the measurement chain, the phasor estimation algorithm is of the same order of magnitude
28/08/2013 Summer School for Smart Energy Systems 2013 - WAMS 55
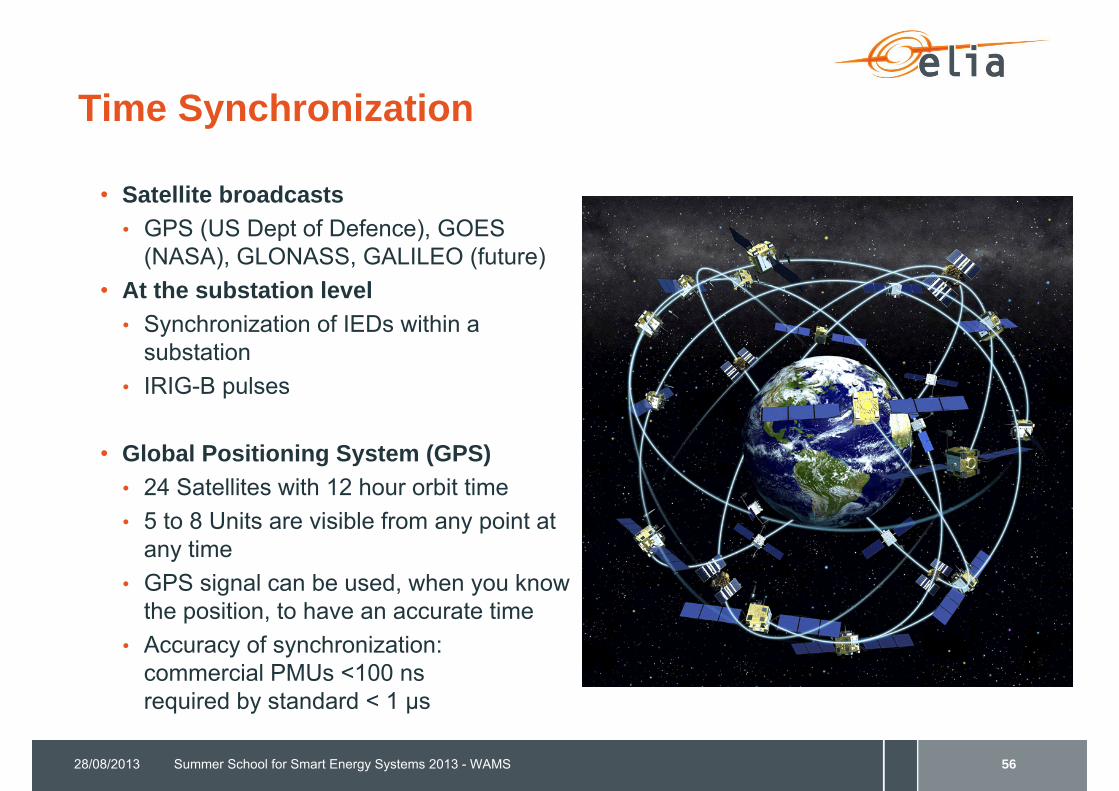
Time Synchronization
• Satellite broadcasts• GPS (US Dept of Defence), GOES
(NASA), GLONASS, GALILEO (future)• At the substation level
• Synchronization of IEDs within a substation
• IRIG-B pulses
• Global Positioning System (GPS)• 24 Satellites with 12 hour orbit time• 5 to 8 Units are visible from any point at
any time• GPS signal can be used, when you know
the position, to have an accurate time • Accuracy of synchronization:
commercial PMUs <100 nsrequired by standard < 1 μs
28/08/2013 Summer School for Smart Energy Systems 2013 - WAMS 56
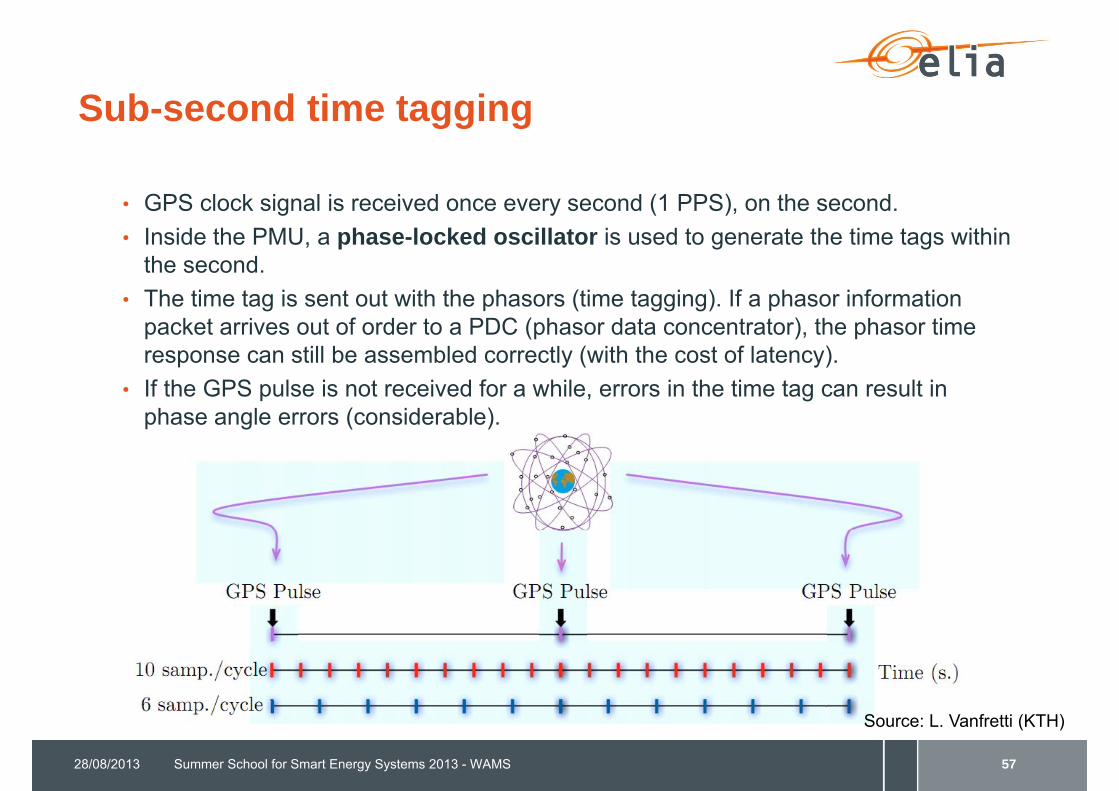
Sub-second time tagging
• GPS clock signal is received once every second (1 PPS), on the second.• Inside the PMU, a phase-locked oscillator is used to generate the time tags within
the second.• The time tag is sent out with the phasors (time tagging). If a phasor information
packet arrives out of order to a PDC (phasor data concentrator), the phasor time response can still be assembled correctly (with the cost of latency).
• If the GPS pulse is not received for a while, errors in the time tag can result in phase angle errors (considerable).
28/08/2013 Summer School for Smart Energy Systems 2013 - WAMS 57
Source: L. Vanfretti (KTH)
Wide Area Measurement System (WAMS)
28/08/2013 Summer School for Smart Energy Systems 2013 - WAMS 58
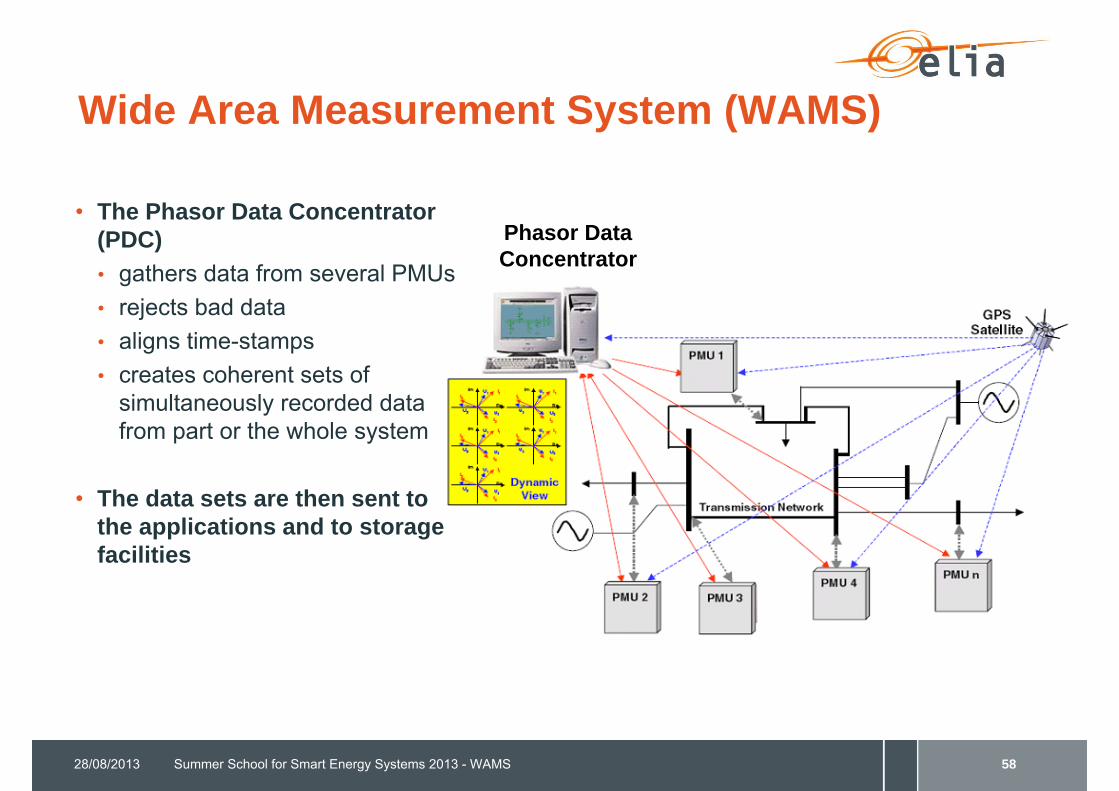
Phasor Data Concentrator
• The Phasor Data Concentrator (PDC)• gathers data from several PMUs• rejects bad data• aligns time-stamps• creates coherent sets of
simultaneously recorded data from part or the whole system
• The data sets are then sent to the applications and to storage facilities
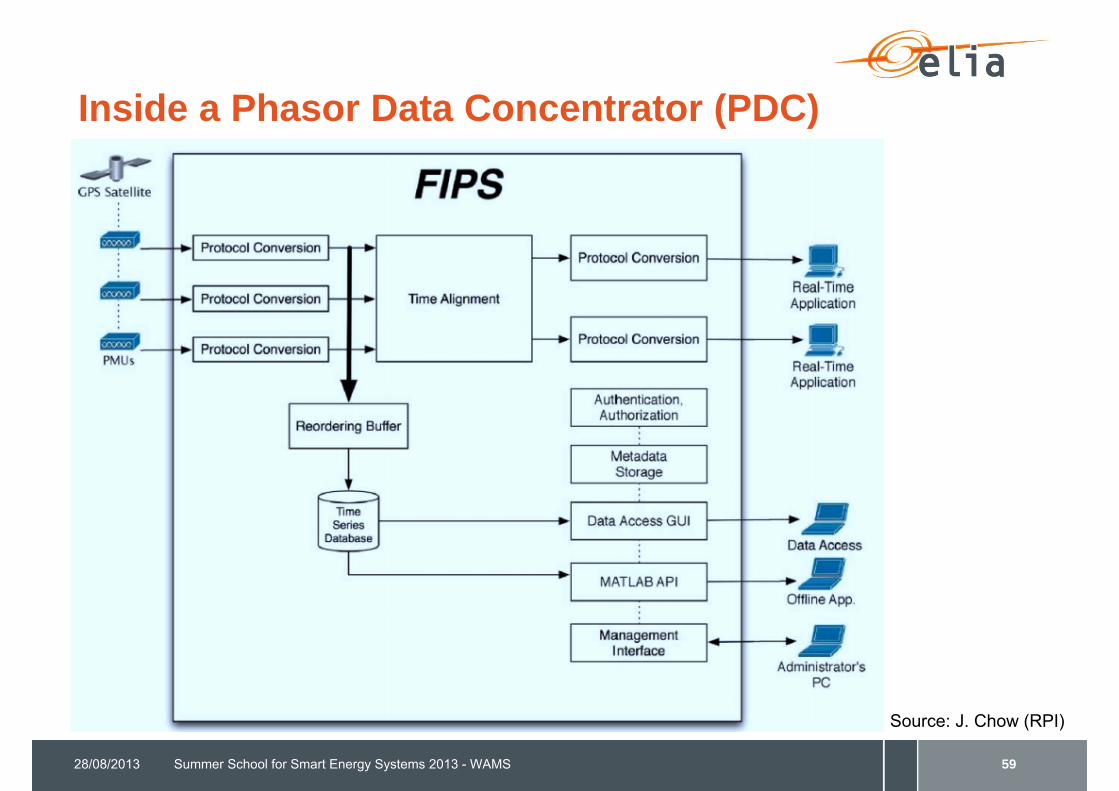
Inside a Phasor Data Concentrator (PDC)
28/08/2013 Summer School for Smart Energy Systems 2013 - WAMS 59
Source: J. Chow (RPI)
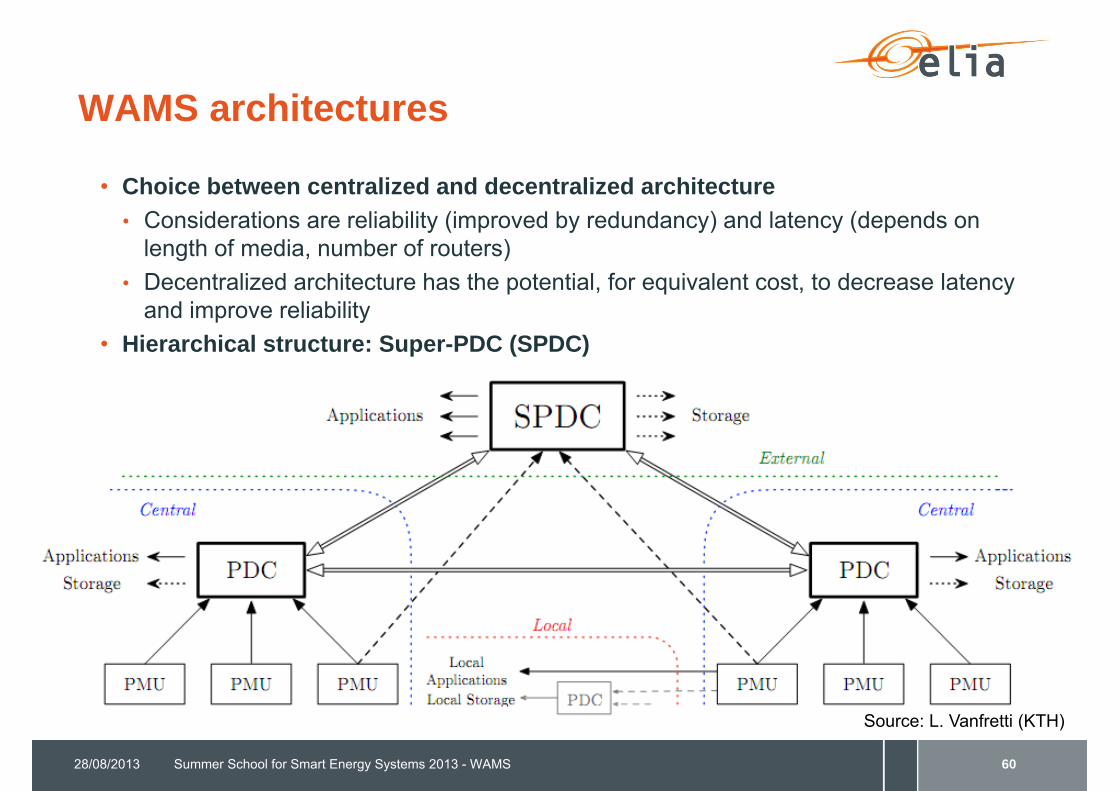
WAMS architectures
• Choice between centralized and decentralized architecture• Considerations are reliability (improved by redundancy) and latency (depends on
length of media, number of routers)• Decentralized architecture has the potential, for equivalent cost, to decrease latency
and improve reliability• Hierarchical structure: Super-PDC (SPDC)
28/08/2013 Summer School for Smart Energy Systems 2013 - WAMS 60
Source: L. Vanfretti (KTH)

Measurement chain: sources of inaccuracy, delay & unavailability
28/08/2013 Summer School for Smart Energy Systems 2013 - WAMS 61

Summer School for Smart Energy Systems 2013 - WAMS
Standards for synchrophasors
Power System Wide Area Measurement, Protection & Control
28/08/2013
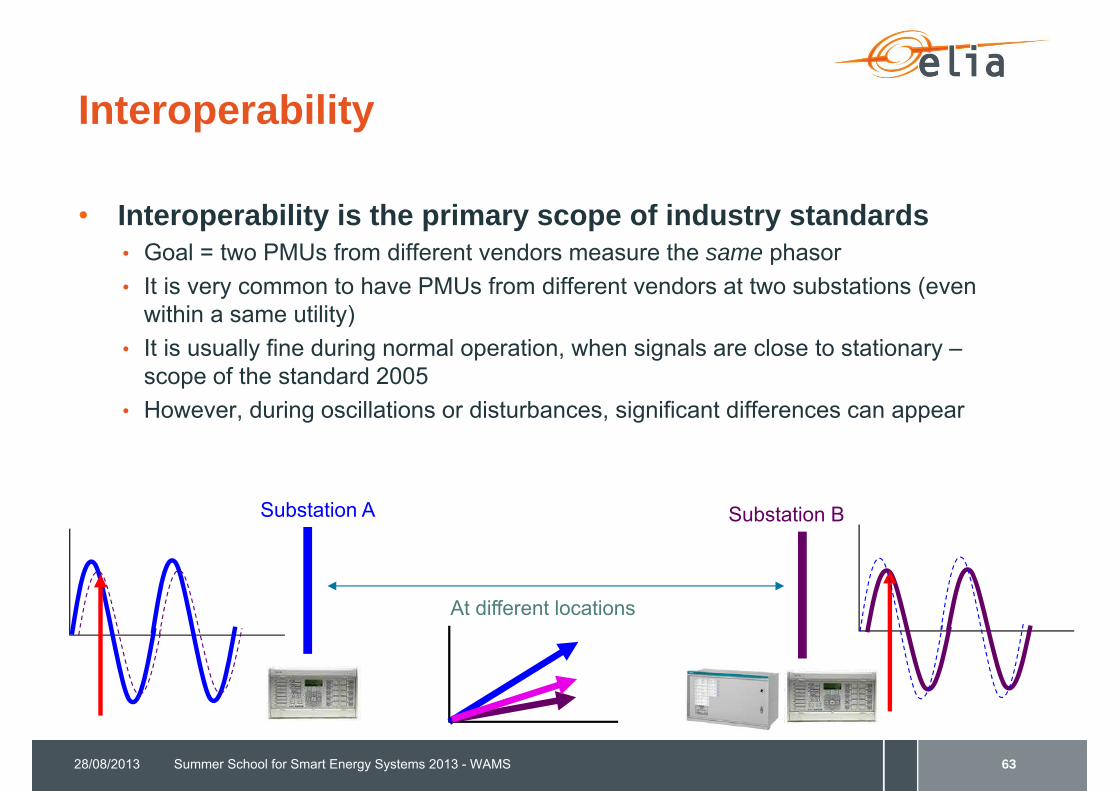
Interoperability
• Interoperability is the primary scope of industry standards • Goal = two PMUs from different vendors measure the same phasor• It is very common to have PMUs from different vendors at two substations (even
within a same utility)• It is usually fine during normal operation, when signals are close to stationary –
scope of the standard 2005• However, during oscillations or disturbances, significant differences can appear
28/08/2013 Summer School for Smart Energy Systems 2013 - WAMS 63
Substation A Substation B
At different locations
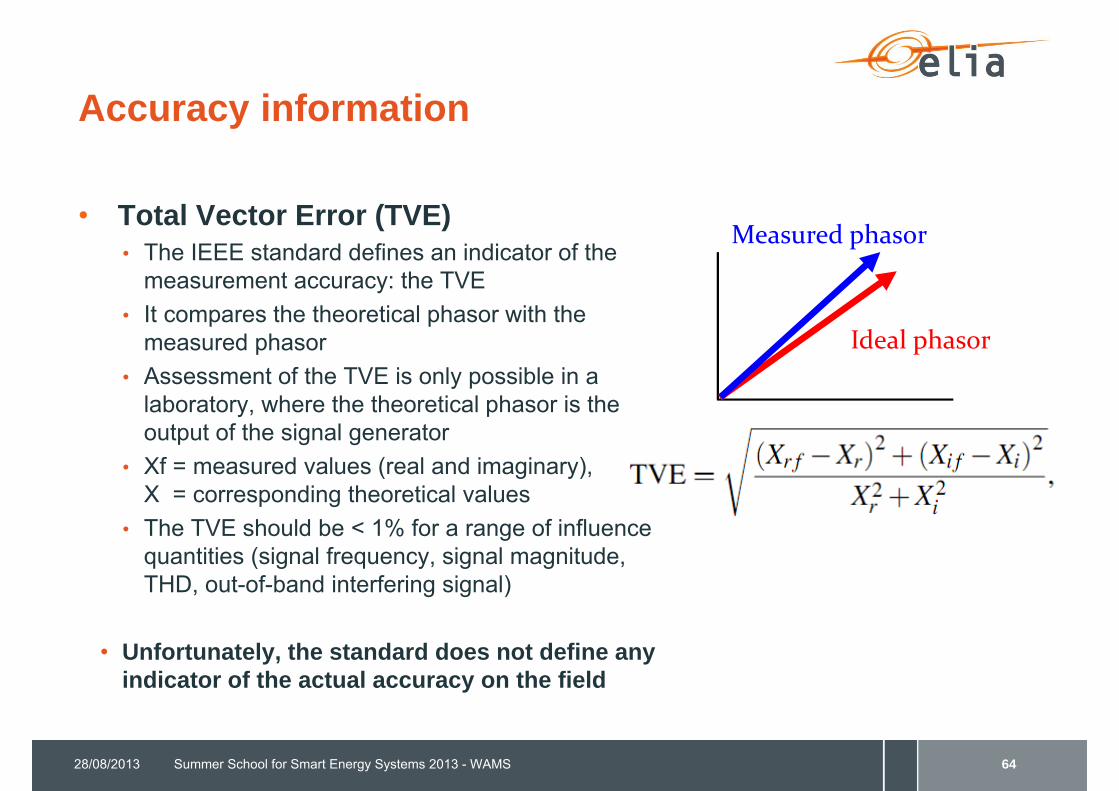
Accuracy information
• Total Vector Error (TVE)• The IEEE standard defines an indicator of the
measurement accuracy: the TVE• It compares the theoretical phasor with the
measured phasor• Assessment of the TVE is only possible in a
laboratory, where the theoretical phasor is the output of the signal generator
• Xf = measured values (real and imaginary),X = corresponding theoretical values
• The TVE should be < 1% for a range of influence quantities (signal frequency, signal magnitude, THD, out-of-band interfering signal)
• Unfortunately, the standard does not define any indicator of the actual accuracy on the field
28/08/2013 Summer School for Smart Energy Systems 2013 - WAMS 64
Ideal phasor
Measured phasor
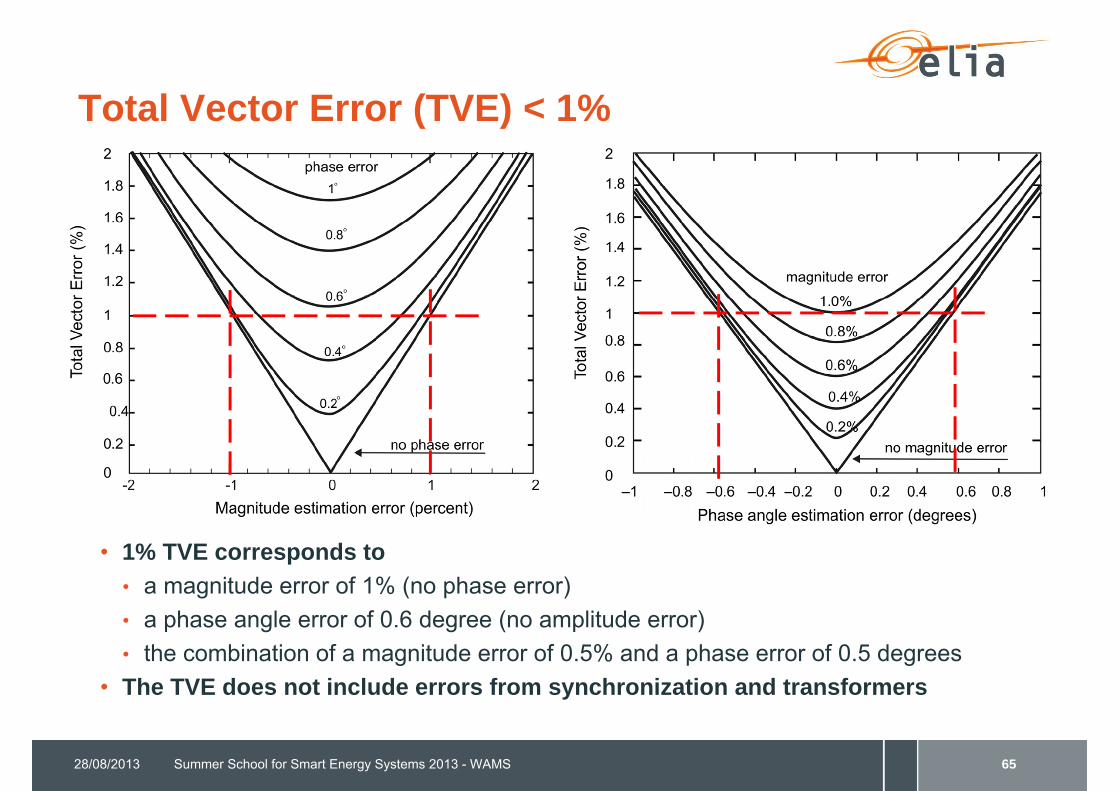
Total Vector Error (TVE) < 1%
• 1% TVE corresponds to • a magnitude error of 1% (no phase error)• a phase angle error of 0.6 degree (no amplitude error)• the combination of a magnitude error of 0.5% and a phase error of 0.5 degrees
• The TVE does not include errors from synchronization and transformers
28/08/2013 Summer School for Smart Energy Systems 2013 - WAMS 65
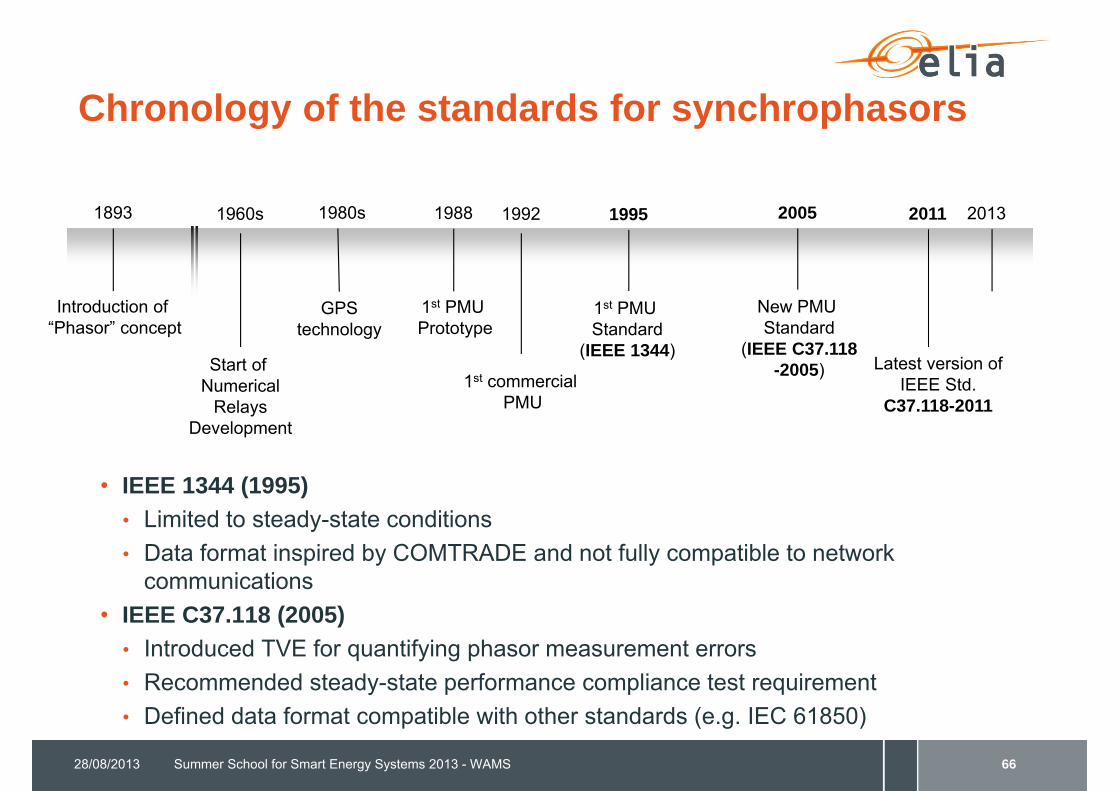
Chronology of the standards for synchrophasors
• IEEE 1344 (1995)• Limited to steady-state conditions• Data format inspired by COMTRADE and not fully compatible to network
communications• IEEE C37.118 (2005)
• Introduced TVE for quantifying phasor measurement errors• Recommended steady-state performance compliance test requirement• Defined data format compatible with other standards (e.g. IEC 61850)
28/08/2013 Summer School for Smart Energy Systems 2013 - WAMS 66
1988
1st PMU Prototype
1992
1st commercial PMU
1995 20051893
Introduction of “Phasor” concept
1980s
GPStechnology
2011 2013
Latest version ofIEEE Std.
C37.118-2011
New PMU Standard
(IEEE C37.118-2005)
1st PMU Standard
(IEEE 1344)
1960s
Start of Numerical
RelaysDevelopment
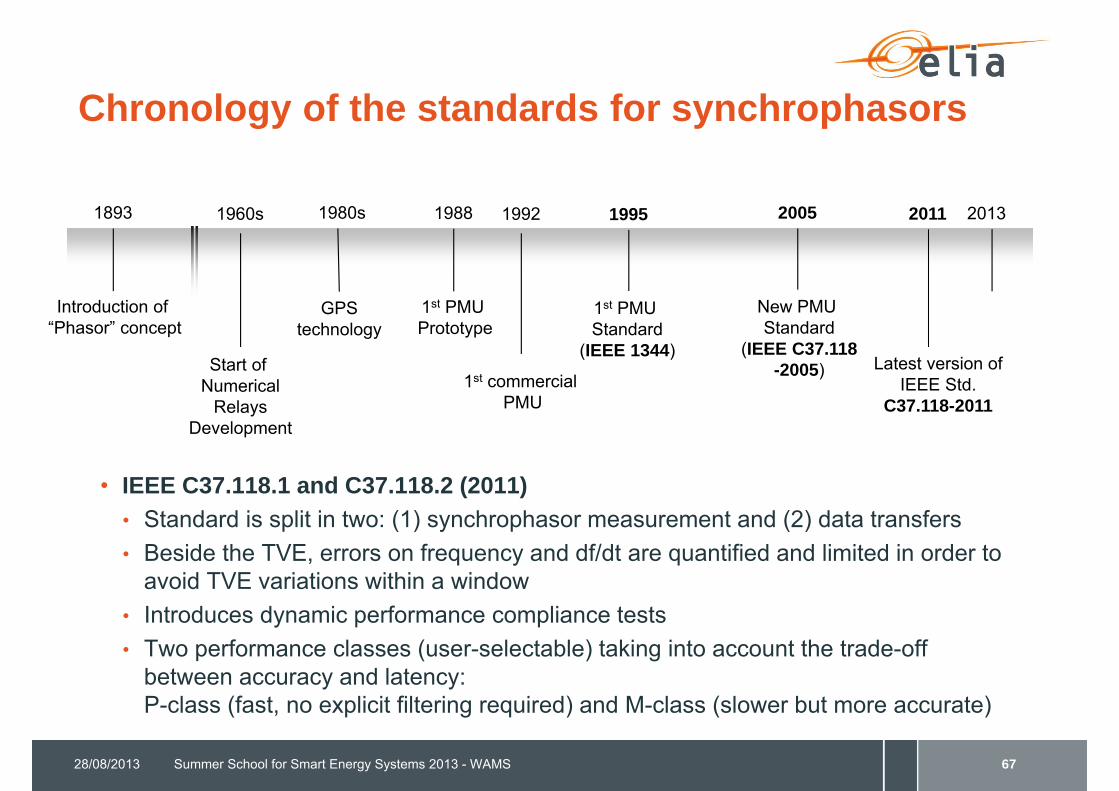
Chronology of the standards for synchrophasors
• IEEE C37.118.1 and C37.118.2 (2011)• Standard is split in two: (1) synchrophasor measurement and (2) data transfers• Beside the TVE, errors on frequency and df/dt are quantified and limited in order to
avoid TVE variations within a window• Introduces dynamic performance compliance tests• Two performance classes (user-selectable) taking into account the trade-off
between accuracy and latency: P-class (fast, no explicit filtering required) and M-class (slower but more accurate)
28/08/2013 Summer School for Smart Energy Systems 2013 - WAMS 67
1988
1st PMU Prototype
1992
1st commercial PMU
1995 20051893
Introduction of “Phasor” concept
1980s
GPStechnology
2011 2013
Latest version ofIEEE Std.
C37.118-2011
New PMU Standard
(IEEE C37.118-2005)
1st PMU Standard
(IEEE 1344)
1960s
Start of Numerical
RelaysDevelopment
Assessing the maturity of the synchrophasortechnology
Today, “a PMU is a basic equipment” (Damir Novosel, 2012)
- Costs mostly in engineering- Interoperability in dynamics ?
However, the full maturity is dependent on the
“capability of measuring electrical quantities accurately with measurement lags compatible with closed-loop control and special protection requirements”
(Innocent Kamwa, 2005)
28/08/2013 Summer School for Smart Energy Systems 2013 - WAMS 68

Summer School for Smart Energy Systems 2013 - WAMS
Power system applications of synchrophasors
Power System Wide Area Measurement, Protection & Control
28/08/2013
Applications
• Most widespread applications in Transmission – Improved state estimation (or state measurement) – Phase angle monitoring– inter-area oscillations monitoring (online modal analysis)– Online voltage stability assessment– Early warnings– Post-disturbance event analysis– Model validation– backup protection (as a substitute for zone 3 protection)– Load shedding control– Islanding control– Angular stability control– Interface with Control and Defense System (WAPS-WACS)
28/08/2013 Summer School for Smart Energy Systems 2013 - WAMS 70
28/08/2013 Summer School for Smart Energy Systems 2013 - WAMS 71
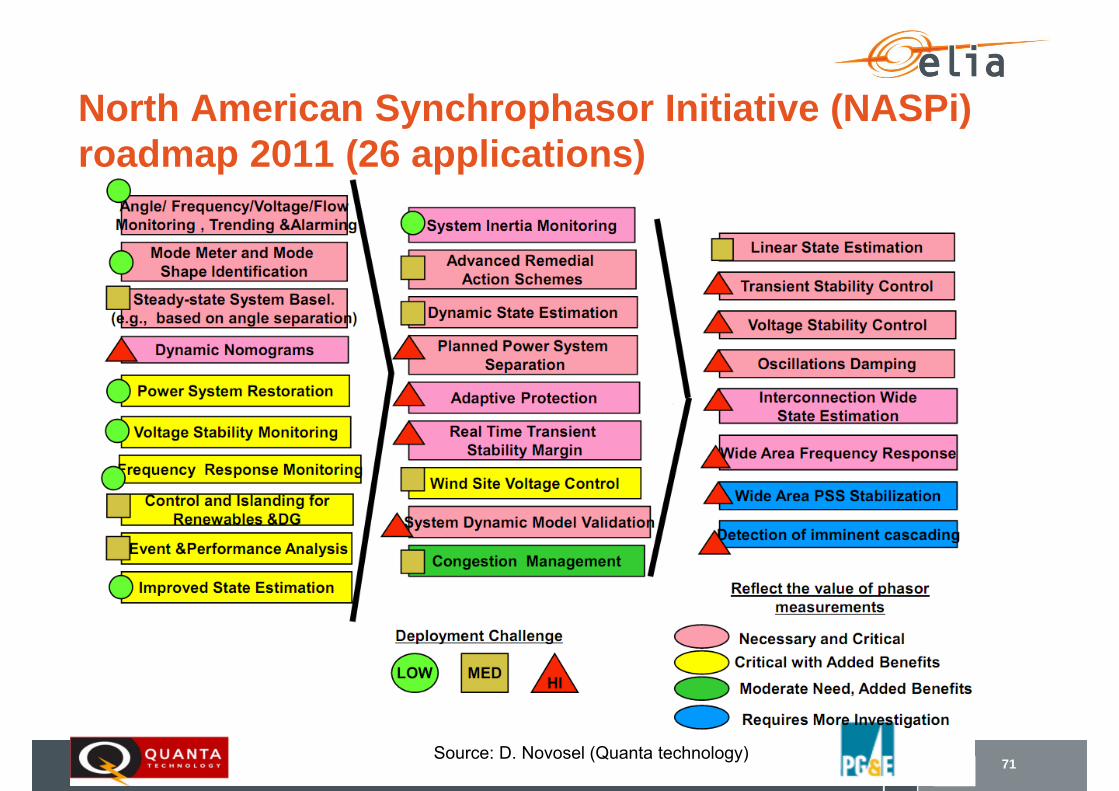
North American Synchrophasor Initiative (NASPi) roadmap 2011 (26 applications)
Source: D. Novosel (Quanta technology)
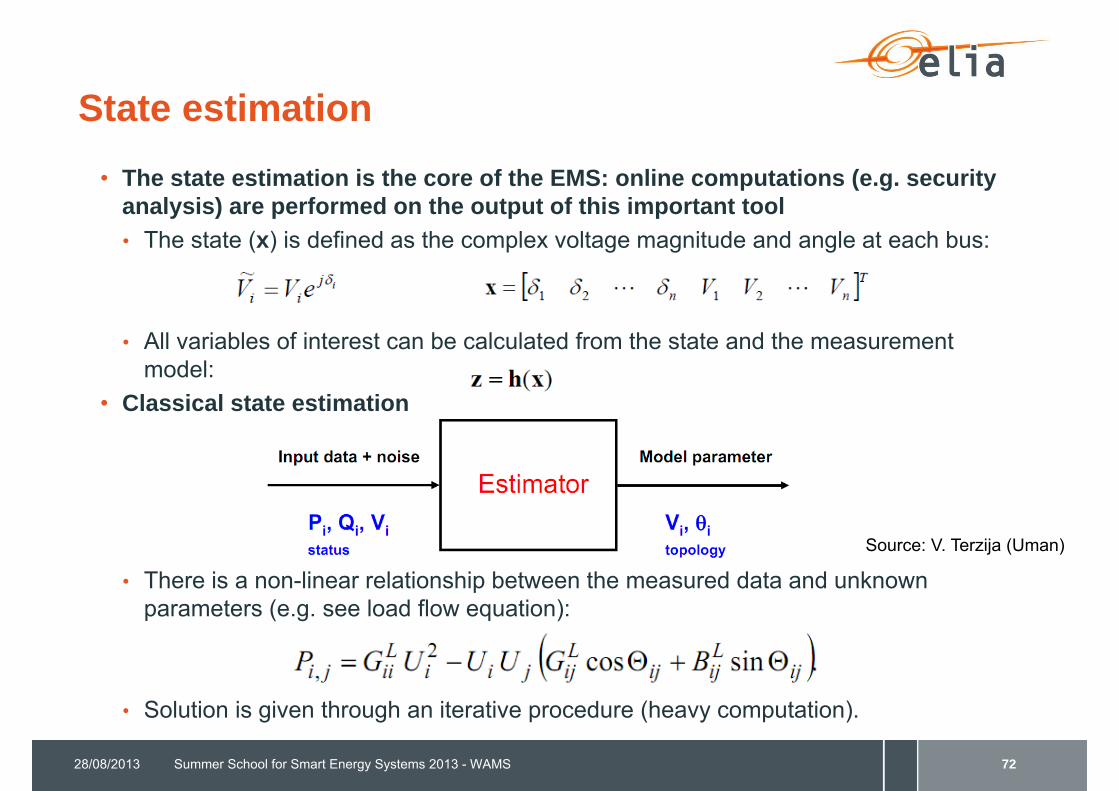
State estimation
Summer School for Smart Energy Systems 2013 - WAMS28/08/2013 72
• The state estimation is the core of the EMS: online computations (e.g. security analysis) are performed on the output of this important tool• The state (x) is defined as the complex voltage magnitude and angle at each bus:
• All variables of interest can be calculated from the state and the measurement model:
• Classical state estimation
• There is a non-linear relationship between the measured data and unknown parameters (e.g. see load flow equation):
• Solution is given through an iterative procedure (heavy computation).
Source: V. Terzija (Uman)
State measurement:state estimation using synchrophasors
• Unlike the classical state estimator, the (matrix) equations to solve are LINEAR, and hence no iterations are needed. • As soon as the measurements are obtained, the estimate is obtained by matrix
multiplication.• It is also possible to mix phasor measurements with traditional measurements
to obtain a Hybrid state estimator
28/08/2013 Summer School for Smart Energy Systems 2013 - WAMS 73
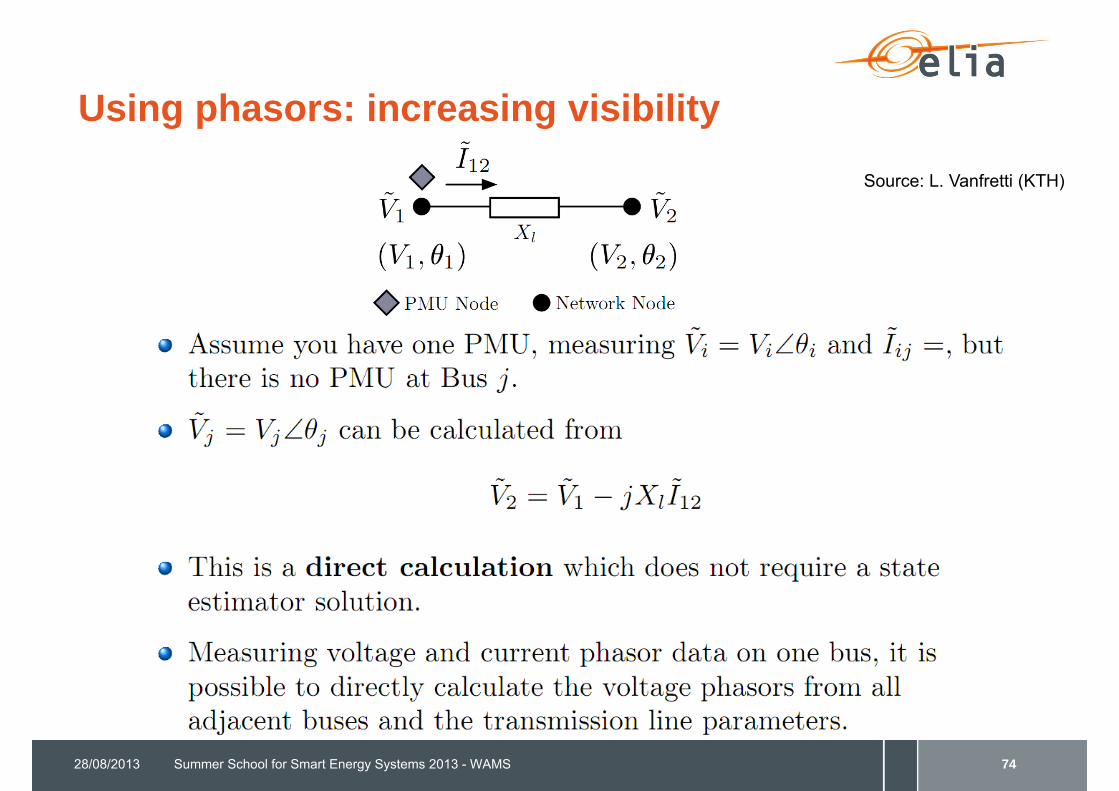
Using phasors: increasing visibility
28/08/2013 Summer School for Smart Energy Systems 2013 - WAMS 74
Source: L. Vanfretti (KTH)

Power-angle relationship
• The power-angle characteristics represents the active power across a transmission line or corridor as a function of the voltage phase angle differences
• It relies on the following assumptions• the two areas are represented by
ideal voltage sources, • the transmission line is purely
inductive (R=0, C=0)
28/08/2013 Summer School for Smart Energy Systems 2013 - WAMS 75
→
Source: SEL
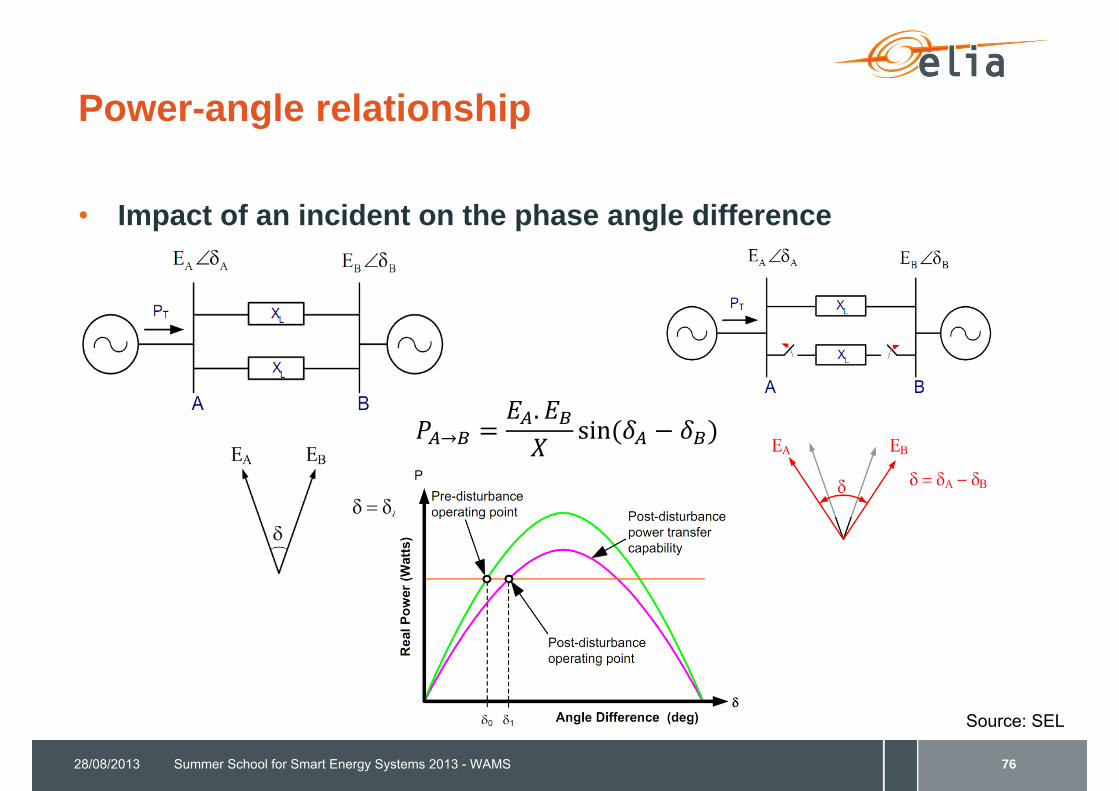
Power-angle relationship
• Impact of an incident on the phase angle difference
28/08/2013 Summer School for Smart Energy Systems 2013 - WAMS 76
Source: SEL
→.
sin
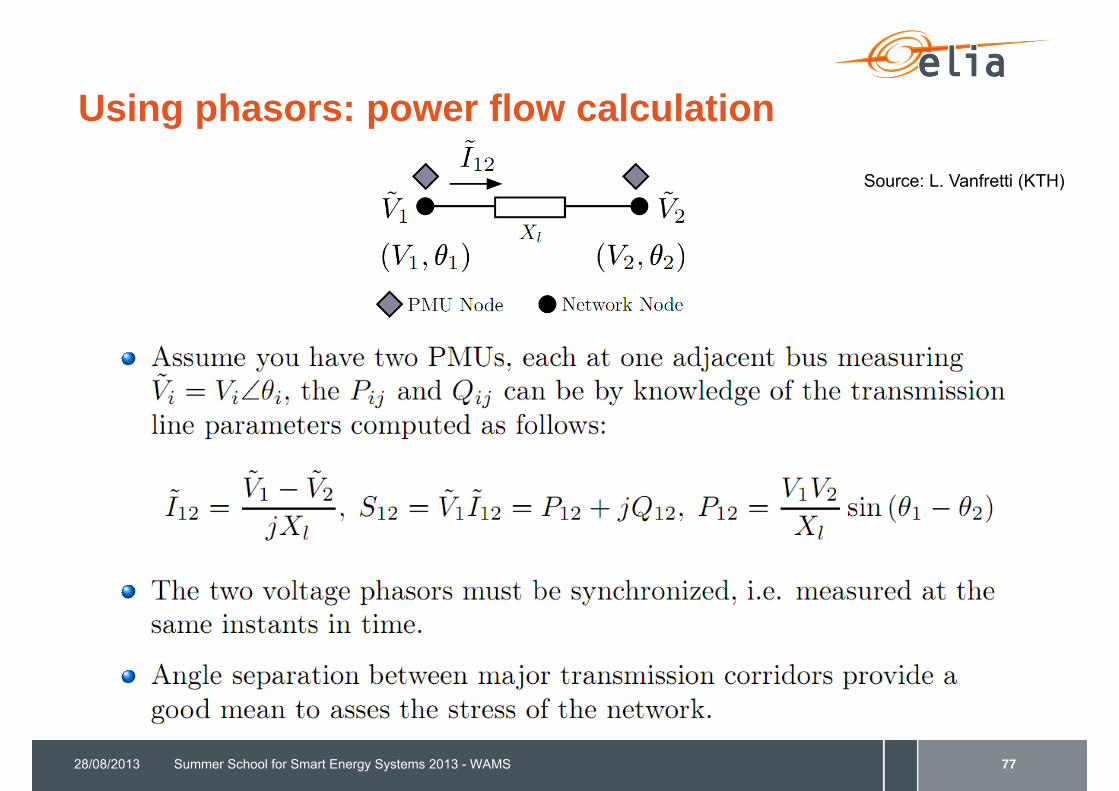
Using phasors: power flow calculation
28/08/2013 Summer School for Smart Energy Systems 2013 - WAMS 77
Source: L. Vanfretti (KTH)
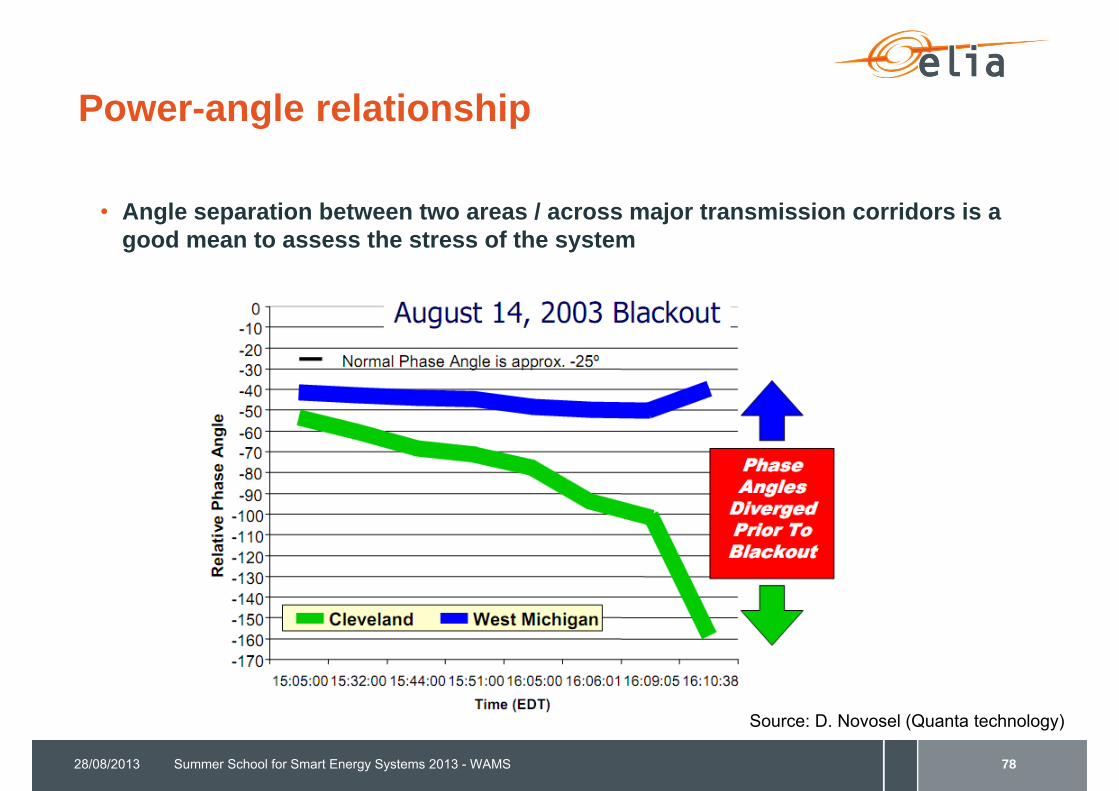
Power-angle relationship
• Angle separation between two areas / across major transmission corridors is a good mean to assess the stress of the system
28/08/2013 Summer School for Smart Energy Systems 2013 - WAMS 78
Source: D. Novosel (Quanta technology)
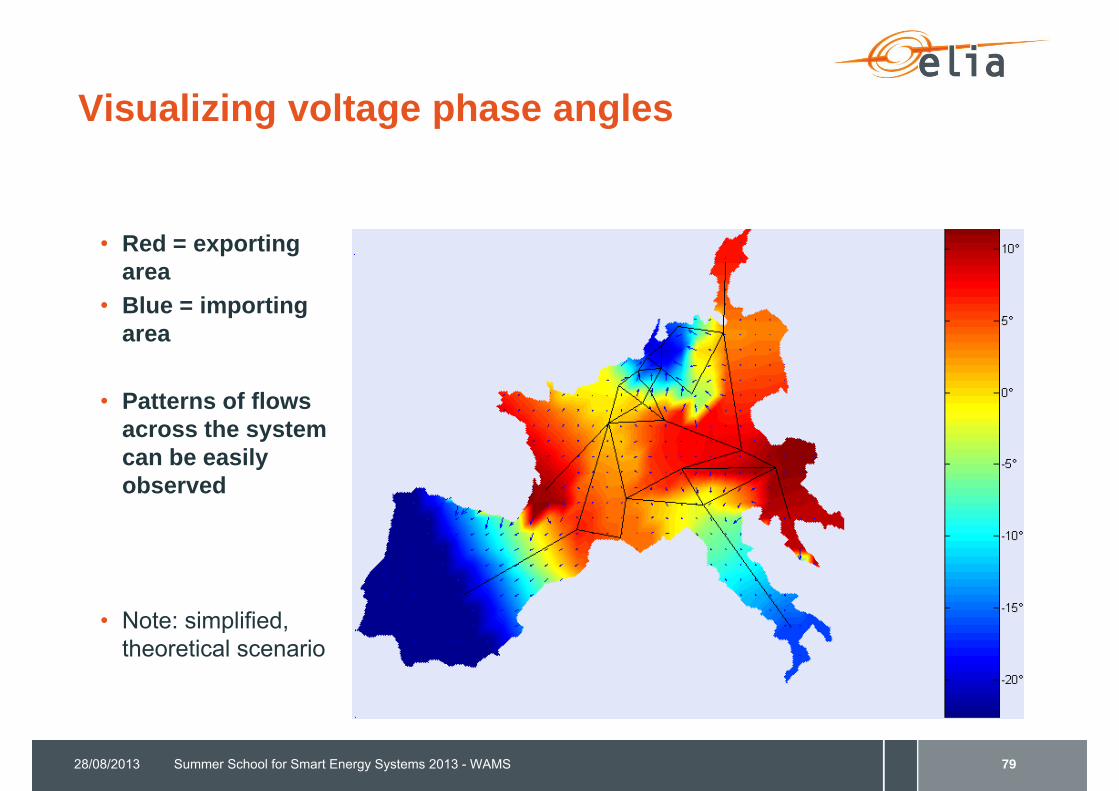
Visualizing voltage phase angles
• Red = exporting area
• Blue = importing area
• Patterns of flows across the system can be easily observed
• Note: simplified, theoretical scenario
28/08/2013 Summer School for Smart Energy Systems 2013 - WAMS 79
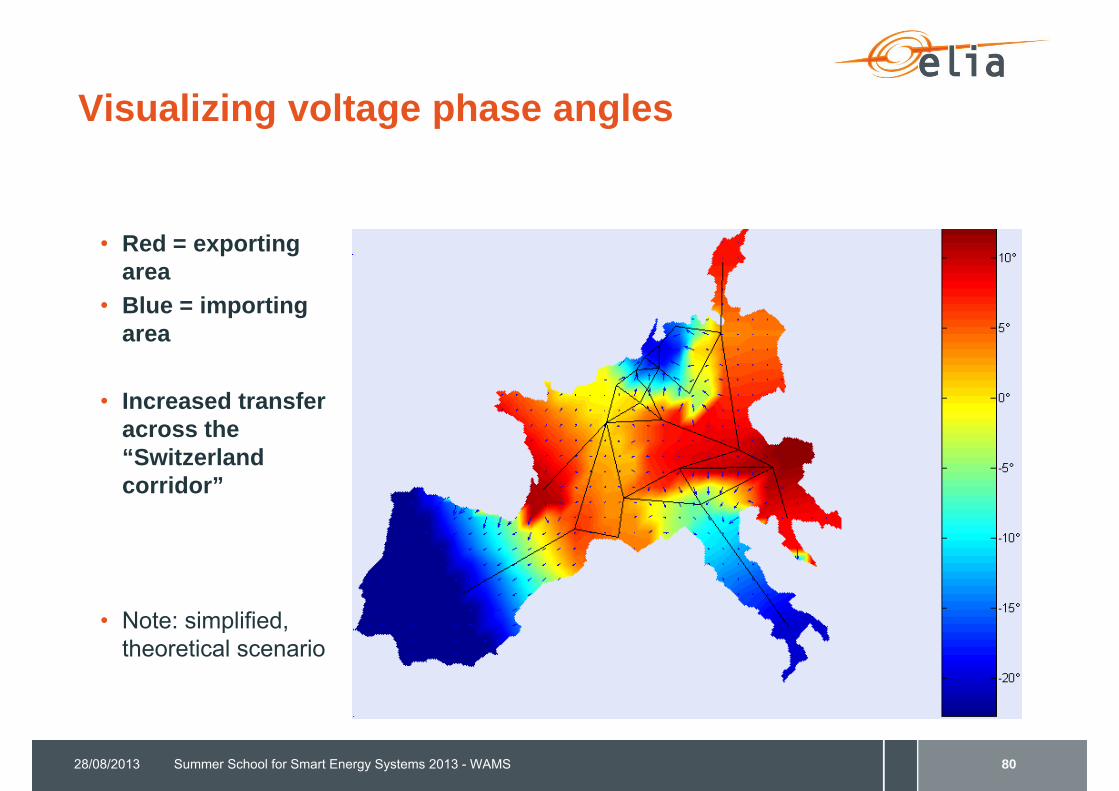
Visualizing voltage phase angles
28/08/2013 Summer School for Smart Energy Systems 2013 - WAMS 80
• Red = exporting area
• Blue = importing area
• Increased transfer across the “Switzerland corridor”
• Note: simplified, theoretical scenario
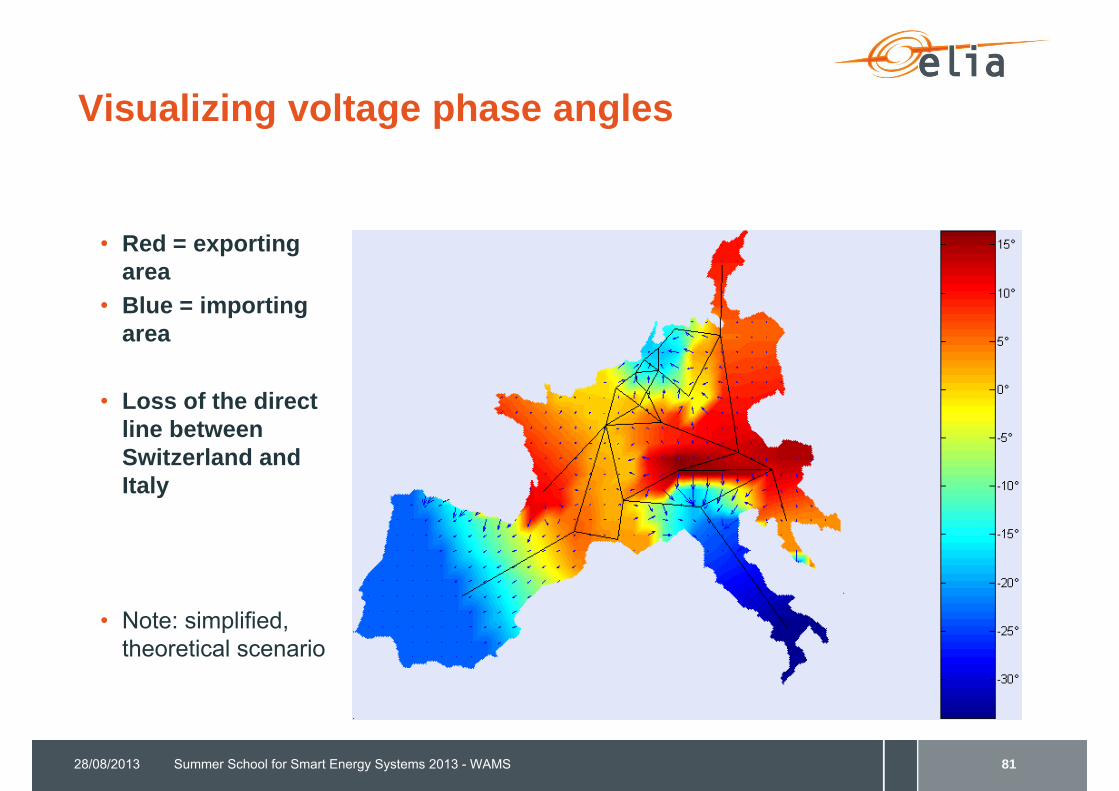
Visualizing voltage phase angles
28/08/2013 Summer School for Smart Energy Systems 2013 - WAMS 81
• Red = exporting area
• Blue = importing area
• Loss of the direct line between Switzerland and Italy
• Note: simplified, theoretical scenario

Online modal estimation (oscillations monitoring)• The high rate and synchronization allow to observe “small signals”, in
particular, inter-area oscillations in the range 0.1 – 2 Hz
28/08/2013 Summer School for Smart Energy Systems 2013 - WAMS 82
Source: Psymetrix

• State equation:
• Eigenvalue:
• Damping ratio:
Small-signal stability
• Conventional studies are performed during planning studies• These are based on a detailed model of the system
there are uncertainties: how good is the model? Are all scenarios investigate?• The oscillation modes are associated to the eigenvalues of the state matrix A
28/08/2013 Summer School for Smart Energy Systems 2013 - WAMS 83
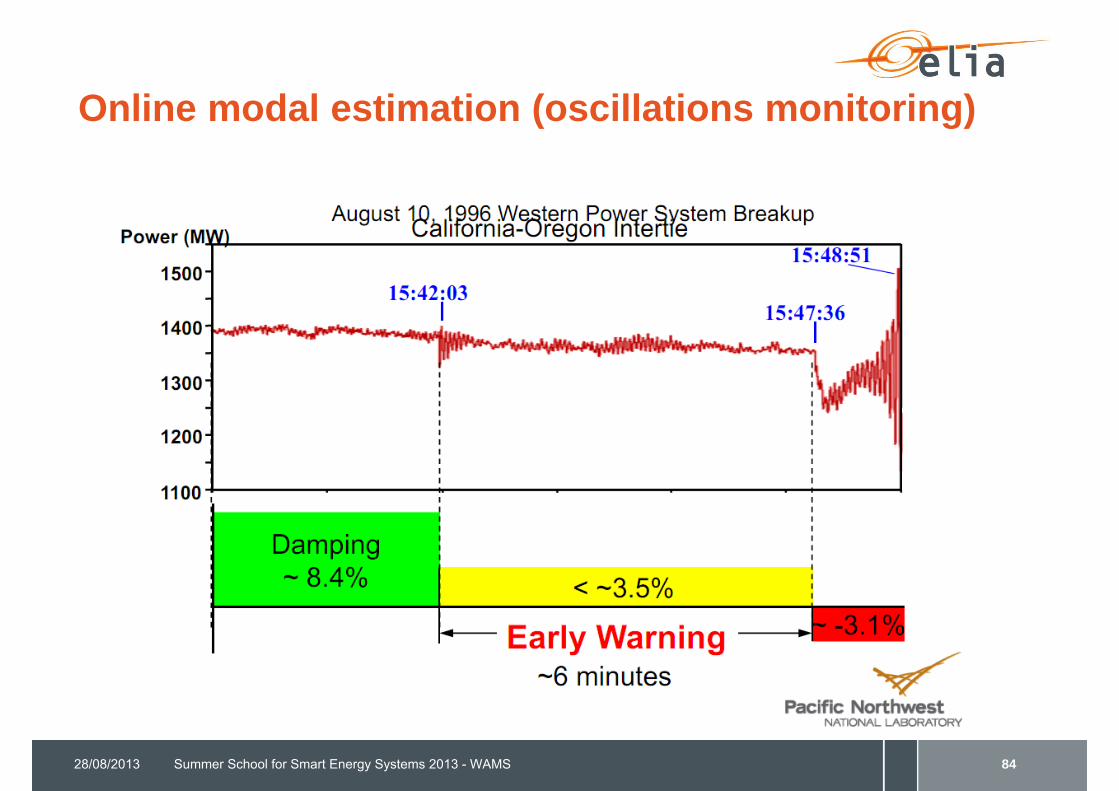
Online modal estimation (oscillations monitoring)
28/08/2013 Summer School for Smart Energy Systems 2013 - WAMS 84
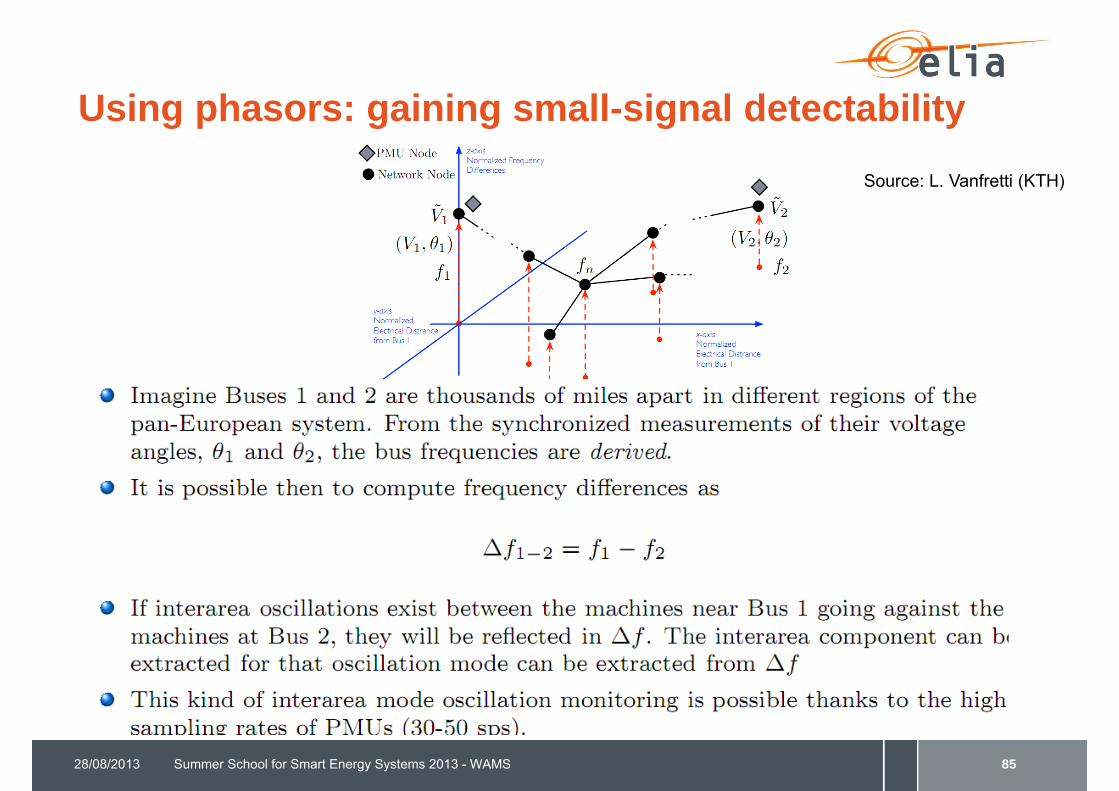
Using phasors: gaining small-signal detectability
28/08/2013 Summer School for Smart Energy Systems 2013 - WAMS 85
Source: L. Vanfretti (KTH)

86
The NETFLEX
Demonstration(2010-2013)
87
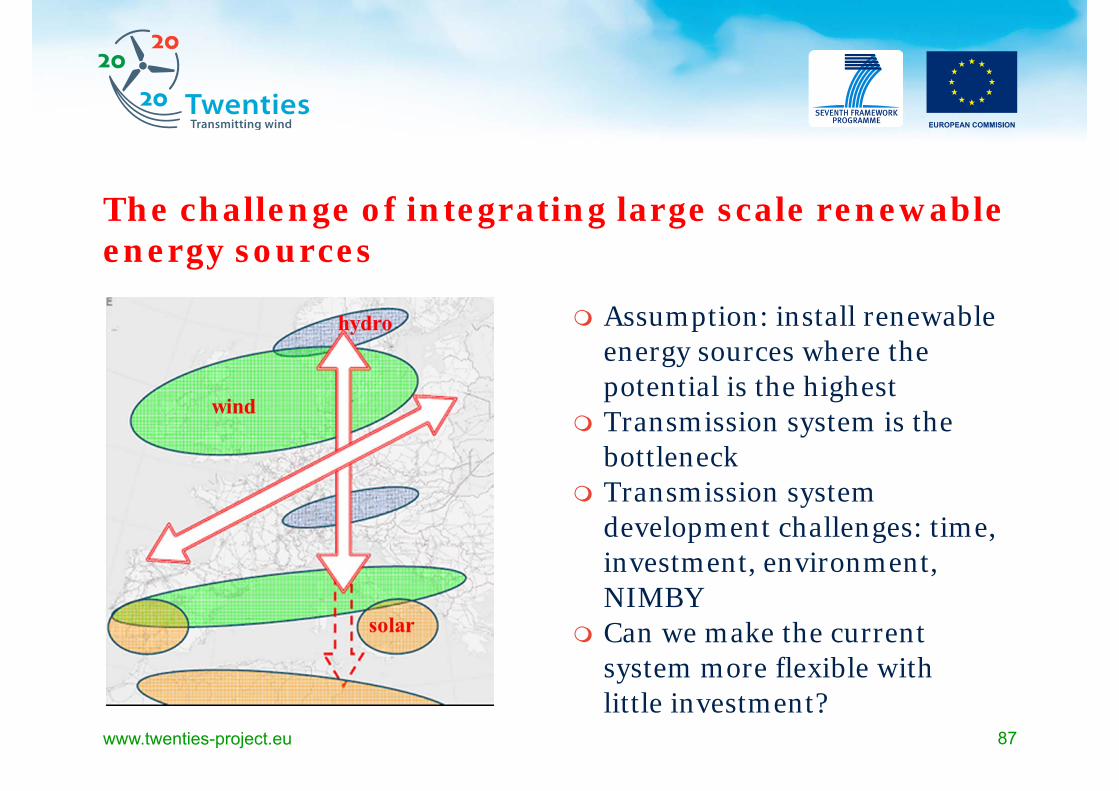
The challenge of integrating large scale renewable energy sources
Assumption: install renewable energy sources where the potential is the highest
Transmission system is the bottleneck
Transmission system development challenges: time, investment, environment, NIMBY
Can we make the current system more flexible with little investment?
www.twenties-project.eu
88
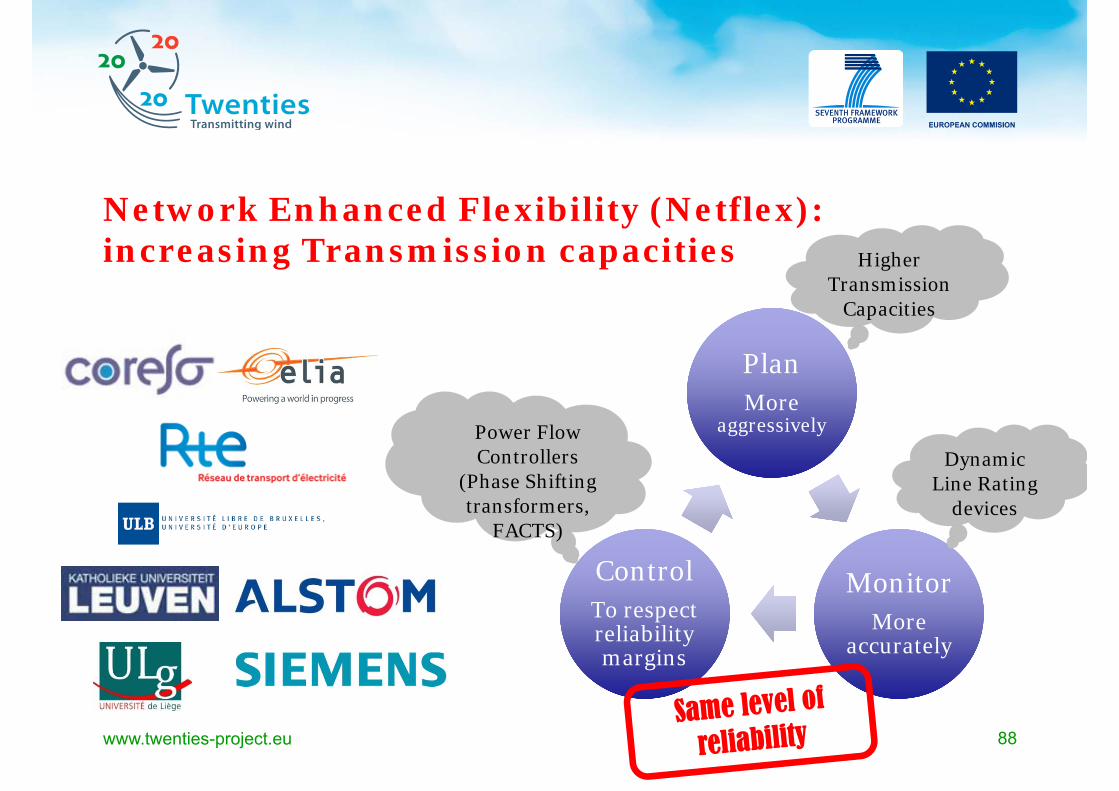
PlanMore
aggressively
PlanMore
aggressively
MonitorMore
accurately
MonitorMore
accurately
ControlTo respect reliability margins
ControlTo respect reliability margins
www.twenties-project.eu
Higher Transmission
Capacities
Dynamic Line Rating
devices
Power Flow Controllers
(Phase Shifting transformers,
FACTS)
Network Enhanced Flexibility (Netflex): increasing Transmission capacities
www.twenties-project.eu
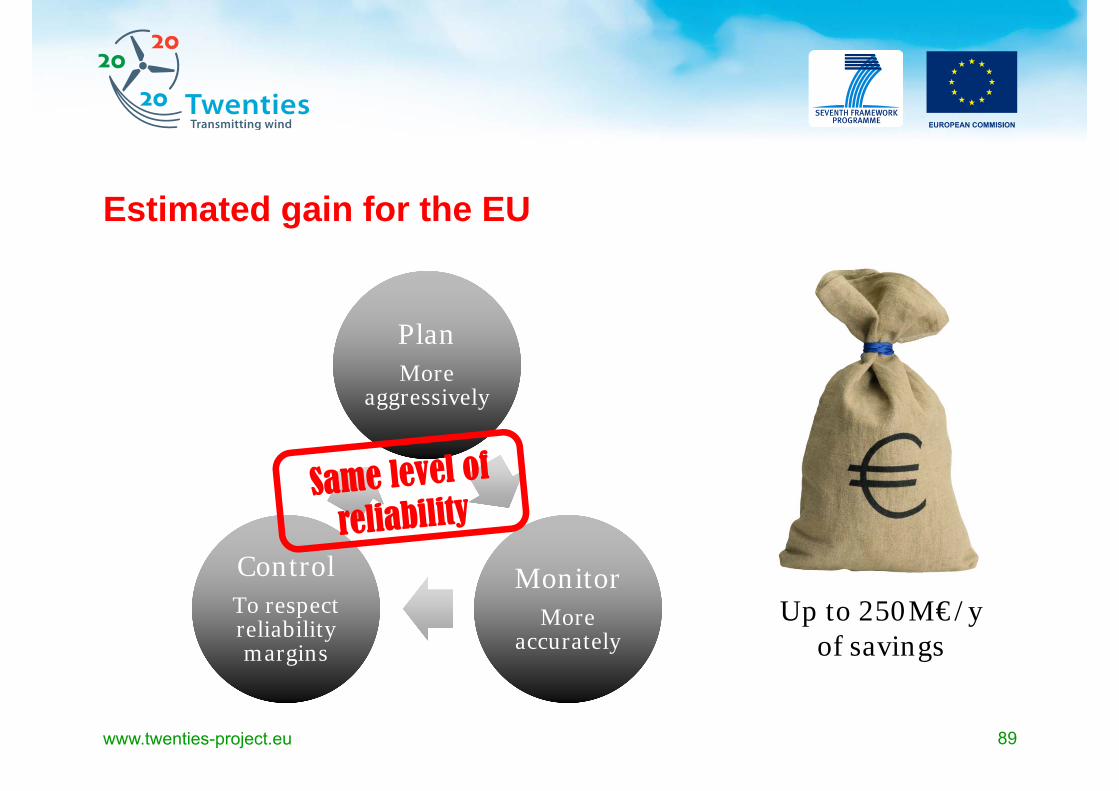
89www.twenties-project.eu
Estimated gain for the EU
PlanMore
aggressively
PlanMore
aggressively
MonitorMore
accurately
MonitorMore
accurately
ControlTo respect reliability margins
ControlTo respect reliability margins
Up to 250M€/yof savings
www.twenties-project.eu
90
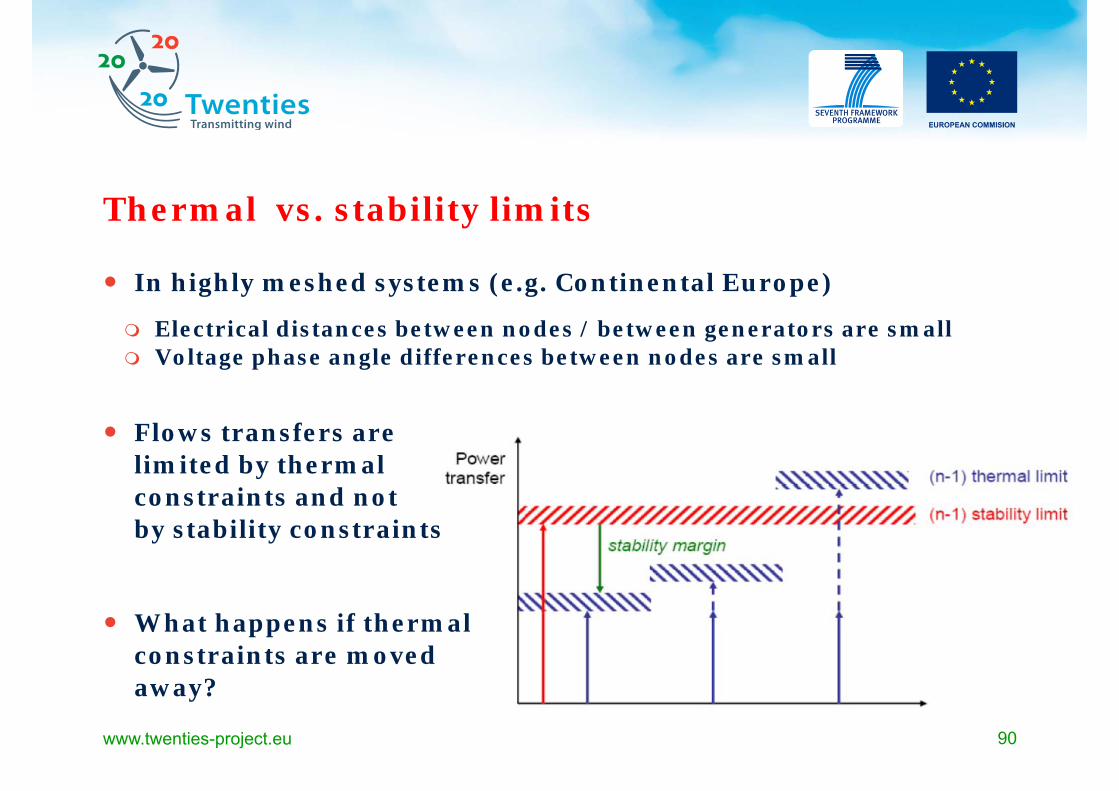
Thermal vs. stability limits
In highly meshed systems (e.g. Continental Europe)
Electrical distances between nodes / between generators are small Voltage phase angle differences between nodes are small
Flows transfers are limited by thermalconstraints and not by stability constraints
What happens if thermalconstraints are moved away?
www.twenties-project.eu
91
PlanMore
aggressively
PlanMore
aggressively
MonitorMore
accurately
MonitorMore
accurately
ControlTo respect reliability margins
ControlTo respect reliability margins
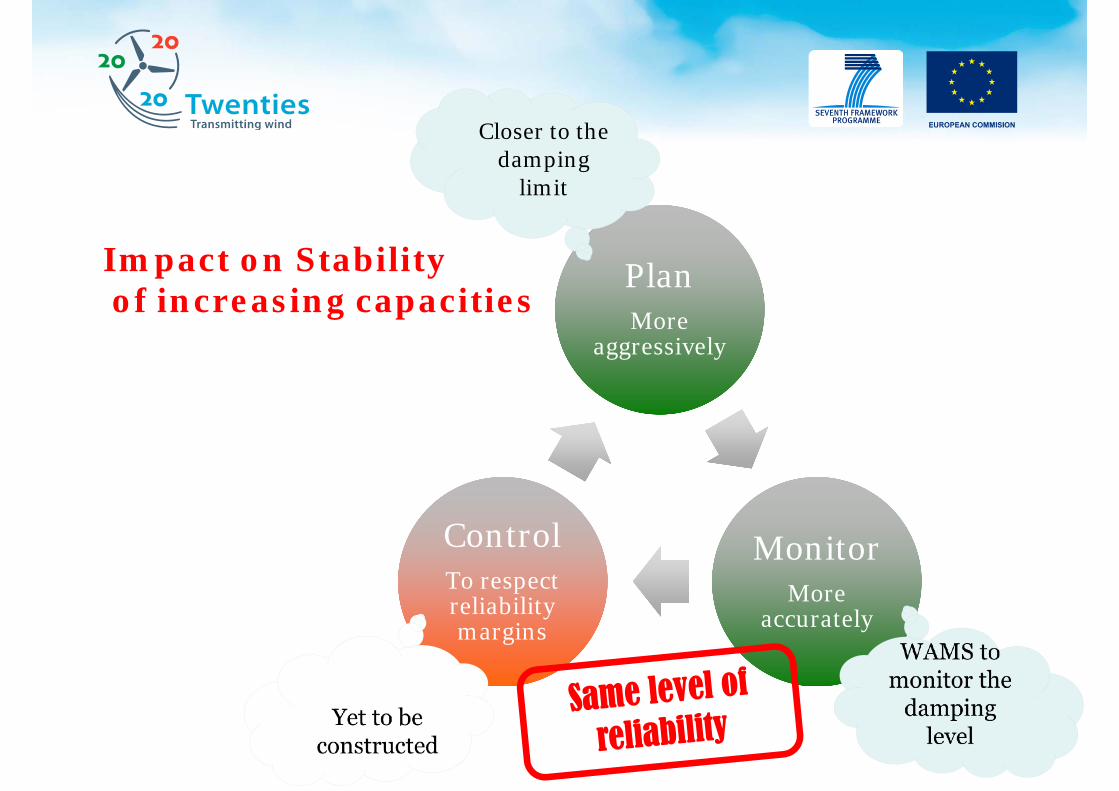
www.twenties-project.eu
Impact on Stabilityof increasing capacities
Closer to the damping
limit
92www.twenties-project.eu
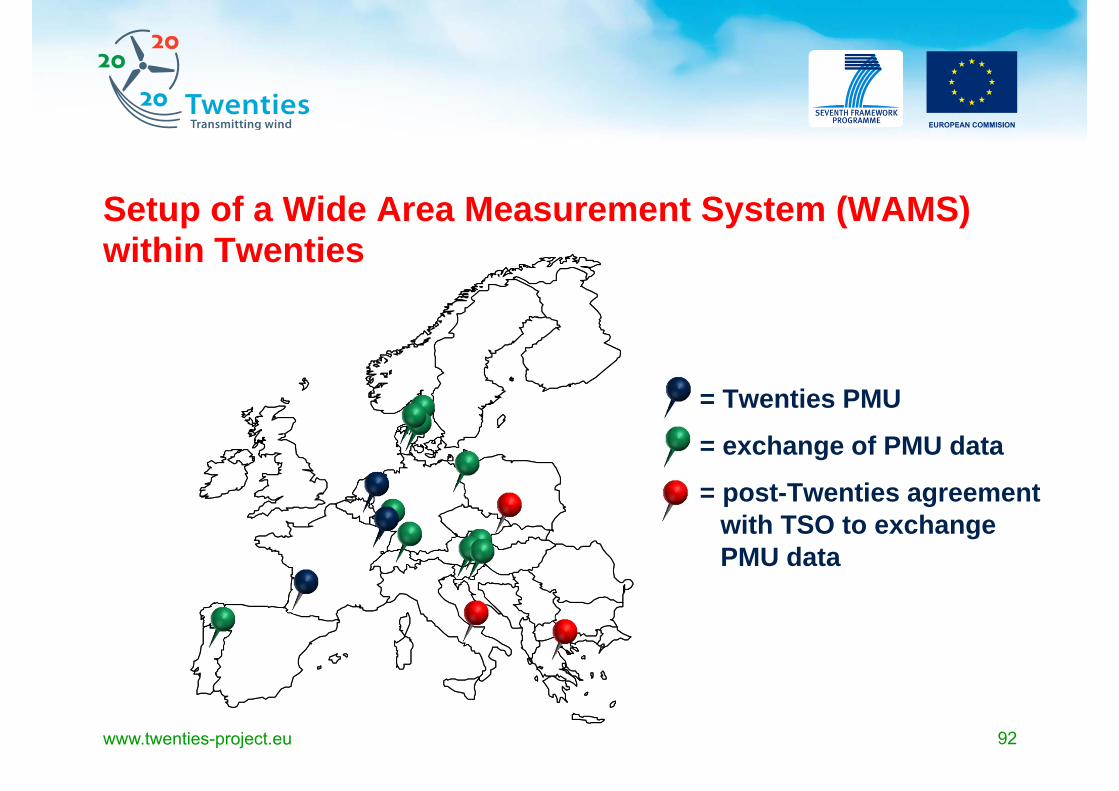
= Twenties PMU= exchange of PMU data= post-Twenties agreement
with TSO to exchange PMU data
Setup of a Wide Area Measurement System (WAMS)within Twenties
93
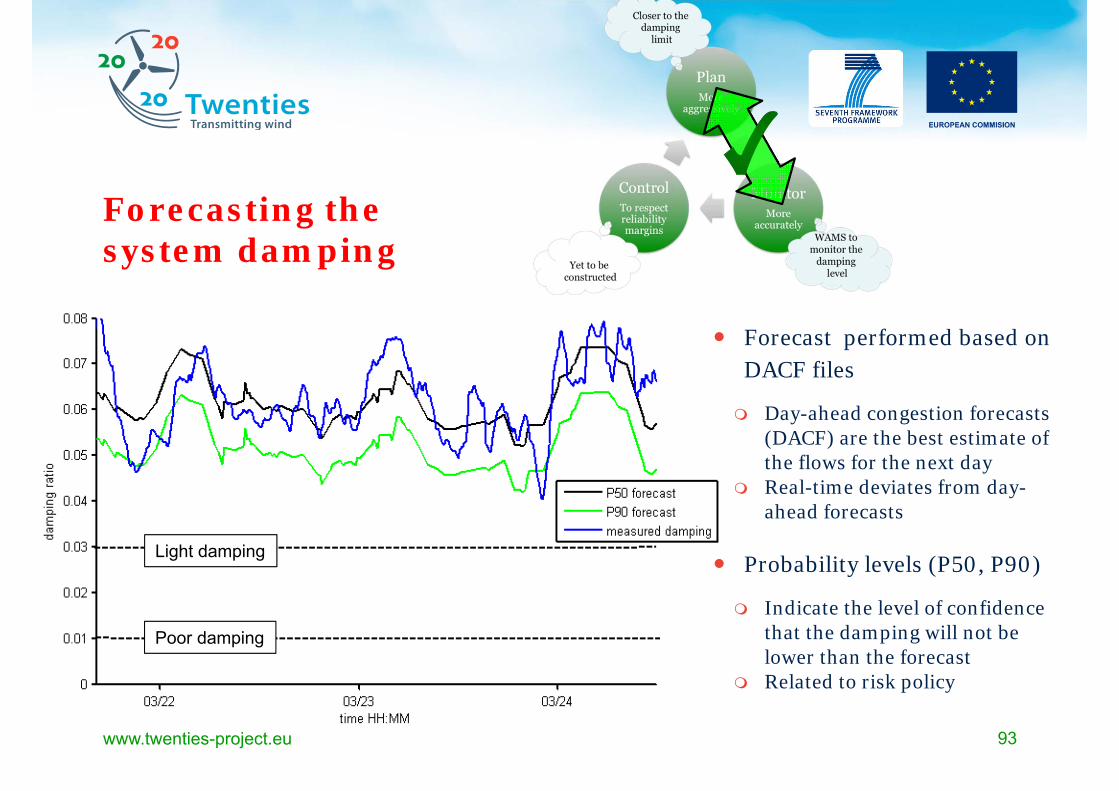
Forecasting the system damping
www.twenties-project.eu
Light damping
Poor damping
Forecast performed based on DACF files
Day-ahead congestion forecasts (DACF) are the best estimate of the flows for the next day
Real-time deviates from day-ahead forecasts
Probability levels (P50, P90)
Indicate the level of confidence that the damping will not be lower than the forecast
Related to risk policy
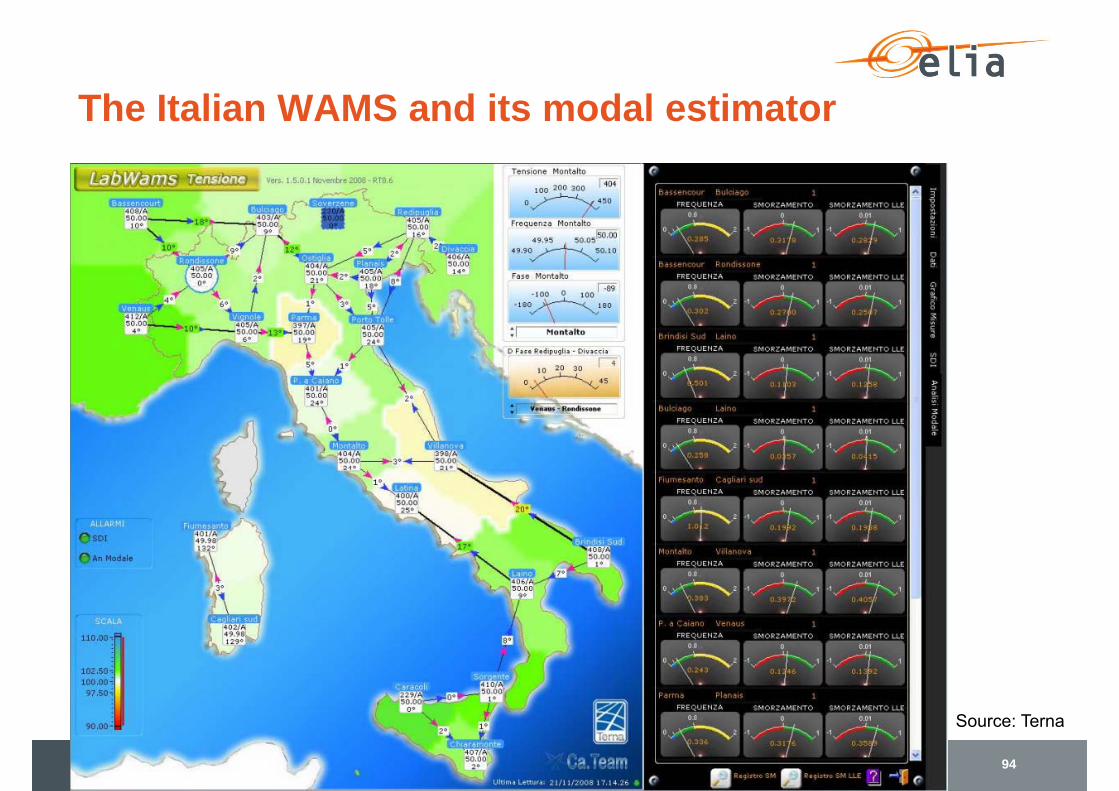
The Italian WAMS and its modal estimator
28/08/2013 Summer School for Smart Energy Systems 2013 - WAMS 94
Source: Terna
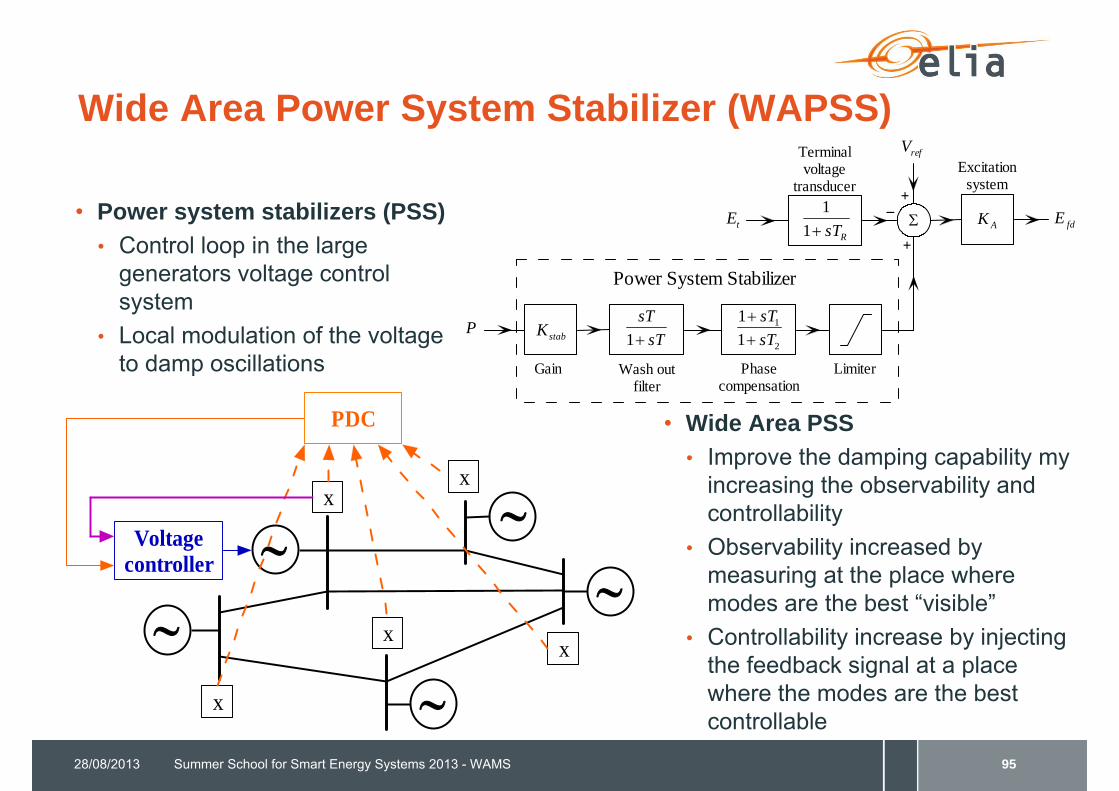
Wide Area Power System Stabilizer (WAPSS)
• Power system stabilizers (PSS)• Control loop in the large
generators voltage control system
• Local modulation of the voltage to damp oscillations
28/08/2013 Summer School for Smart Energy Systems 2013 - WAMS 95
sTsT1
RsT11
2
1
11
sTsT
stabK
AK
refV
fdEtE
P
Gain Wash outfilter
Phasecompensation
Limiter
Excitationsystem
Terminalvoltage
transducer
Power System Stabilizer
+
+
_
Voltagecontroller
xx
x
x
x
PDC • Wide Area PSS• Improve the damping capability my
increasing the observability and controllability
• Observability increased by measuring at the place where modes are the best “visible”
• Controllability increase by injecting the feedback signal at a place where the modes are the best controllable
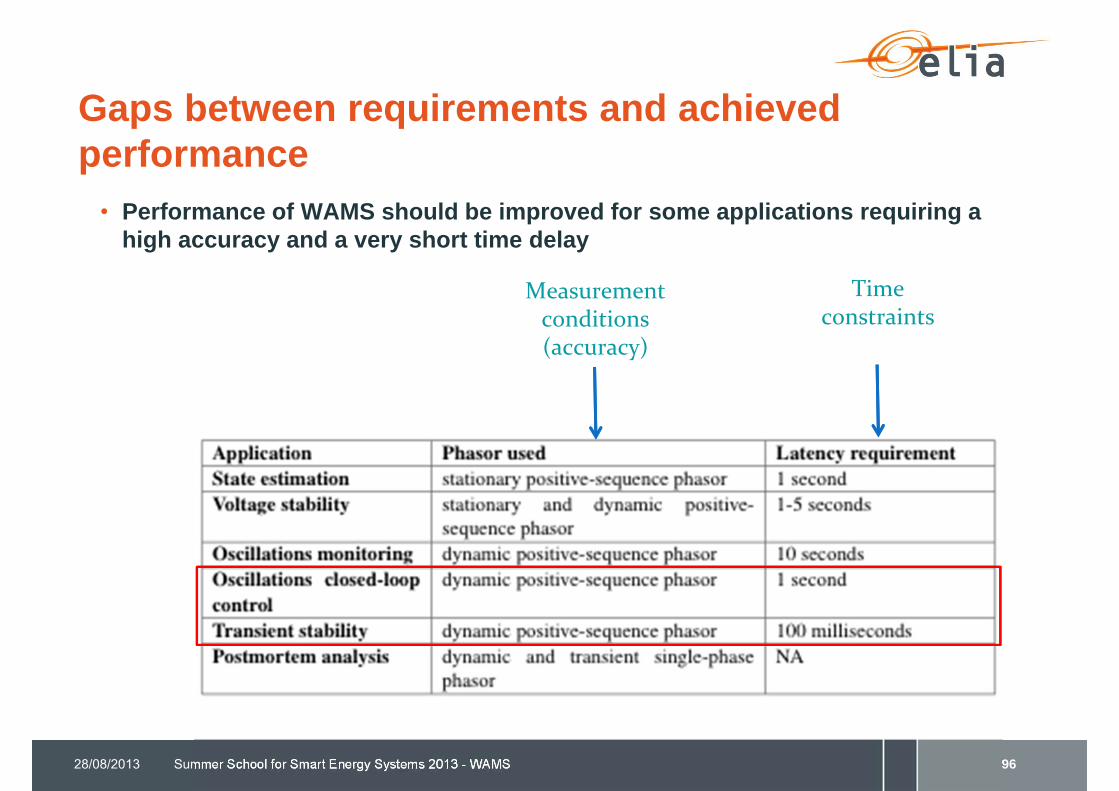
Gaps between requirements and achieved performance
• Performance of WAMS should be improved for some applications requiring a high accuracy and a very short time delay
28/08/2013 Summer School for Smart Energy Systems 2013 - WAMS 96
Measurement conditions(accuracy)
Time constraints
Summer School for Smart Energy Systems 2013 - WAMS
Conclusions, lessons learned and items for further research
Power System Wide Area Measurement, Protection & Control
28/08/2013
2 things to remember
• Thanks to synchronization, PMUs enable the measurement at a high rate of the voltage phase angle: • a great value for power system applications• Allows to simplify computations and speed up understanding of the system
dynamics
• The PMU technology is not fully mature: • interoperability during dynamics is not ensured, and • there is still a gap between what is available and what is required for some
applications (in terms, for example, of accuracy & latency)• there is a large margin for research and experimentations
Summer School for Smart Energy Systems 2013 - WAMS28/08/2013 98
Smarter Transmission & Distribution Grids
• Smart Operation and Control• The Holy Grail = Automatic feedback control for a self-healing system• Measure → Communicate → Analyze (System Assessment and Real Limits)→ Determine Preventive/Corrective Actions → Communicate → Control and Protect
• A cycle to be completed in some milliseconds for the most demanding applications
• beyond WAMS• phasor data have the potential to deliver a higher potential for smart grid
applications; • WAMS rely on the careful design and implementation of supporting communication
networks and computer systems
28/08/2013 Summer School for Smart Energy Systems 2013 - WAMS 99

Looking for a bit of reading ?
• An introductory book on PMUs:A. Phadke and J. Thorp,Synchronized Phasor Measurement and Their Applications,Springer, 2008(downloadable for free)
• More specialised documentation:IEEE XploreAsk me and I will be pleased to help you
Summer School for Smart Energy Systems 2013 - WAMS28/08/2013 100