Embed Size (px)
Citation preview
Journal of Power and Energy Engineering, 2015, 3, 43-55 Published Online May 2015 in SciRes. http://www.scirp.org/journal/jpee http://dx.doi.org/10.4236/jpee.2015.35004
How to cite this paper: Liu, Z.H., Xu, X.F., Abdelsalam, H.A. and Makram, E. (2015) Power System Harmonics Study for Un-balanced Microgrid System with PV Sources and Nonlinear Loads. Journal of Power and Energy Engineering, 3, 43-55. http://dx.doi.org/10.4236/jpee.2015.35004
Power System Harmonics Study for Unbalanced Microgrid System with PV Sources and Nonlinear Loads Zhanhe Liu1, Xufeng Xu1, Hany A. Abdelsalam1,2, Elham Makram1 1Electrical and Computer Engineering Department, Clemson University, Clemson, USA 2Electrical Engineering Department, Kafrelshikh University, Kafrelshikh, Egypt Email: [email protected], [email protected], [email protected], [email protected] Received 2 April 2015; accepted 6 May 2015; published 8 May 2015
Copyright © 2015 by authors and Scientific Research Publishing Inc. This work is licensed under the Creative Commons Attribution International License (CC BY). http://creativecommons.org/licenses/by/4.0/
Abstract Harmonics distortion is a crucial problem in microgrid. Harmonic sources can be categorized as two main factors: renewable energy integration and nonlinear loads. Both factors are investigated in this paper. For renewbale energy, photovoltaic (PV) power is one of the most effective solutions for energy crisis and it is showing great potential for serving customers in microgrid. A three- phase PV source model is establised and integrated at different locations in order to observe the impact of harmonics on a microgrid and power quality (PQ). A composite load is modeled using Crossed Frequency Admittance Matrix theory. A practicdal microgrid loacated at GA, USA is used as a study system. The microgrid, PV model and nonlinear load model are simulated in MATLAB/ Simulink environment. The results show the impact of installing PV sources at two types of loca-tions considering linear and composite nonlinear loads. In addition, three PQ indices are dis-cussed to show the numerical impacts with various perspectives.
Keywords Crossed Frequency Admittance Matrix, Nonlinear Load, Harmonics Distortion, PV, Power Quality Indices
1. Introduction Apart from conventional sources of power generation, photovoltaic (PV) is a promising zero-pollution renewa-ble energy resource. PV transforms solar energy into electrical power. Investments are more willing to focus on PV energy especially with the fast developments in PV cell technology. As expected, inverters and intermittent characteristic of PV bring negative impacts on micrigrid [1]-[5]. Harmonics distortion is one of the main reasons
Z. H. Liu et al.
44
which leads to these negative impacts. Previous research on PV integration provides a view on PV impacts dur-ing integration. In order to consider the intermittent characteristic of solar generation plant, it is necessary to look into weather condition variation during a certain time period [6]. Likewise related simulations have been developed in [7] to see total harmonics distortion (THD) at point of common coupling (PCC). In microgrid, while it is operating in grid connected mode, voltage profile is less distorted and relatively stable within a small range of fluctuation compared to currents. Hence most of negative impacts of PV injection suffer from current distortion. Simulations in [8] also verified that compared to voltages, current distortion was the main problem for PV source. Similar type of approach has been likewise developed in [9], which mostly focuses on voltage profiles and PV output using FFT analysis.
In addition to the PV sources of microgrid, house appliances or small scale of business buildings are the ma-jority of customers, which are considered as nonlinear loads. Therefore, nonlinear loads is another source of harmonics that should be investigated with PV injection. In [10], personal computer and compact fluorescent light (CFL) have been included while modeling the residential system. In [11], a frequency-domain harmonic model has been introduced only for compact fluorescent lamps (CFL). However, a composite model, which consists of multiple types of nonlinear load, can present a more accurate performance on simulating harmonics distortion. In [12], a mathematical approach has been introduced through crossed frequency admittance matrix. This method is able to represent interactions between voltages and currents of different harmonic orders. Two simplified load models (diode bridge rectifier load (DBR) and phase angle AC voltage controller (PAVC)) have been studied in [13].
Power quality (PQ) indices are used to quantify the quality of the system and comparing the negative impacts of different disturbances/modeling on power networks [14] [15]. PQ indices provide different approaches to compare and distinguish power disturbances, which have great significance for microgrid monitoring and opera-tion. Therefore, PQ indices can work as references, especially for microgrid with renewable energy.
This paper studies the impact of PV sources on a microgrid system considering composite linear/nonlinear loads. The crossed frequency admittance matrix method is used for nonlinear load modeling. In addition to the study of harmonic distortion, three PQ indices are applied and compared in order to give a clear view about the power distortion, waveform distortion and system unbalance. The paper is organized as follows: Section 2 de-scribes the PV source and its control scheme, Section 3 describes the composite nonlinear load model based on cross-frequency admittance matrix method, Section 4 introduces the harmonic distortion method and PQ indices, Section 5 presents a description for the microgird study system and the corresponding data, Section 6 presents the simulation results, and Section 7 concludes the study and future direction.
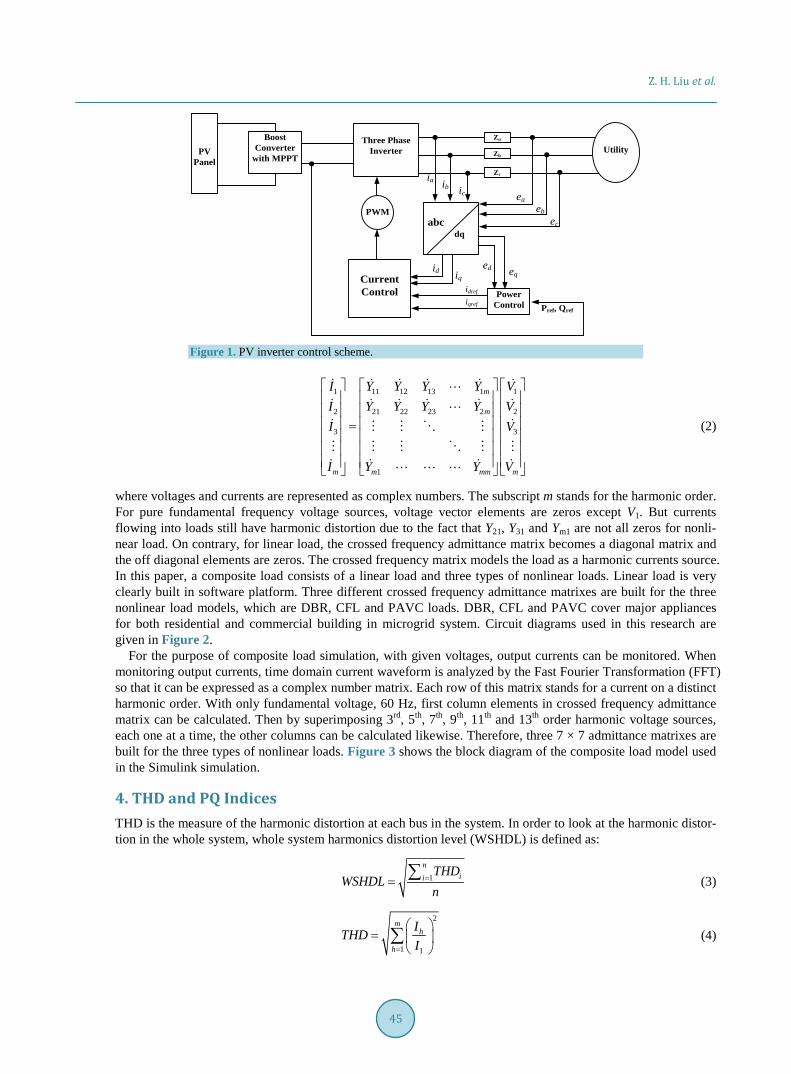
2. PV Source PV source consists of PV panel (a set of PV cells), DC-DC boost converter with MPPT, coupling capacitor, three phase inverter and its control and filter. In this paper, KC200GT is chosen as a model of PV cell [16]. The KC200GT data is determined by its own manufacture process. The data can be obtained from the manufacturer data sheet. There are two main methods for inverter control with PV integration: one is the active power control, and the other is the voltage frequency control. Since the harmonic current influences on grid-connected mode are being studied, active power control is the better option for lowering the reactive power output of PV sources. Figure 1 shows the configuration of three phase active power inverter control. The dq transformation block converts the three components (ia, ib, ic) of AC currents into two components (id, iq). Active and reactive power signals (Pref, Qref) are used to obtain the reference signal (idref, iqref) using the matrix solver in (1) [17].
( )( )
( )( )
( )( )
( )( )
dd
d d dd
q q qq
i t u t e tR Li tL
i t u t e tL Rt i tω
ω −
= − + − − (1)
where L and R represent inductance and resistance of the impedance Za, Zb and Zc between three phase inverter and voltage feedback in Figure 1. Since the purpose of this control scheme is to force the reactive power output close to zero, the reference on q-axis set to zero. The ud and uq are the output control signals of the current con-trol block.
3. Nonlinear Load Modeling The crossed frequency admittance matrix model [12] is based on the relationship between voltages and currents as
Z. H. Liu et al.
45
PV Panel
Boost Converter
with MPPT
Three Phase Inverter Utility
abc dq
Pref, Qref
PWM
Current Control Power
Control
id iq
ia ib ic
idref
iqref
ed eq
eaeb
ec
Za
Zb
Zc
Figure 1. PV inverter control scheme.
1 11 12 13 1 1
2 21 22 23 2 2
3 3
1
m
m
m m mm m
I Y Y Y Y VI Y Y Y Y VI V
I Y Y V
=
(2)
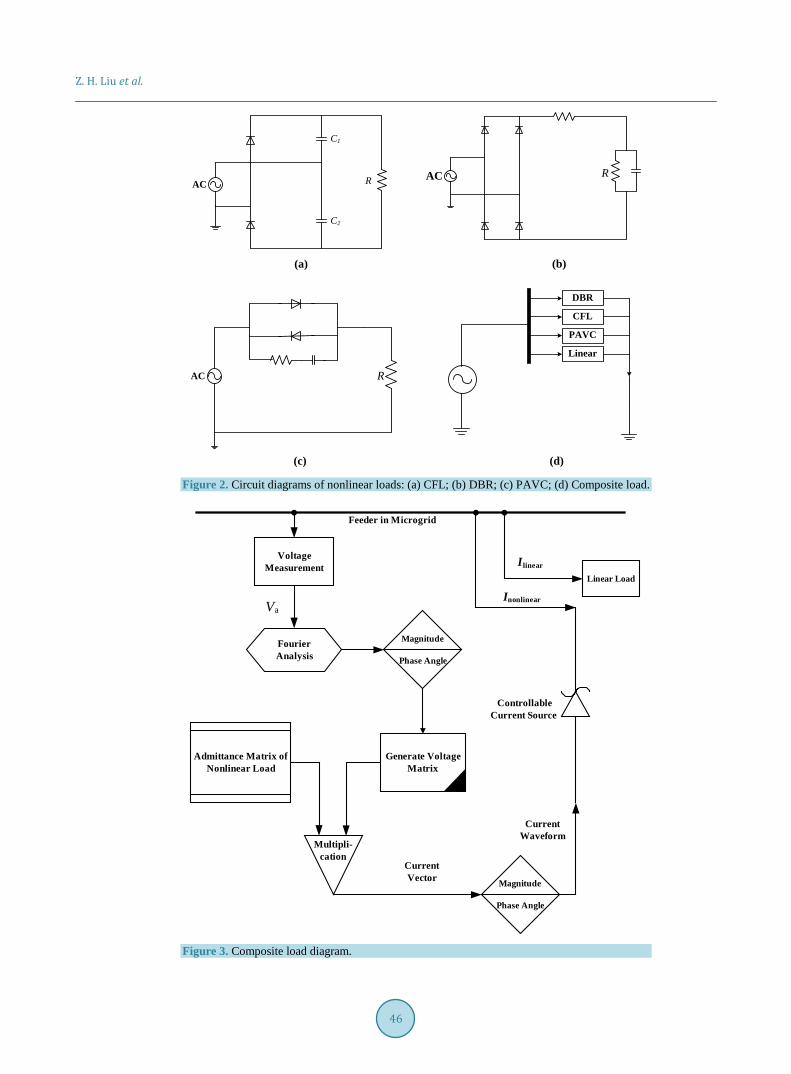
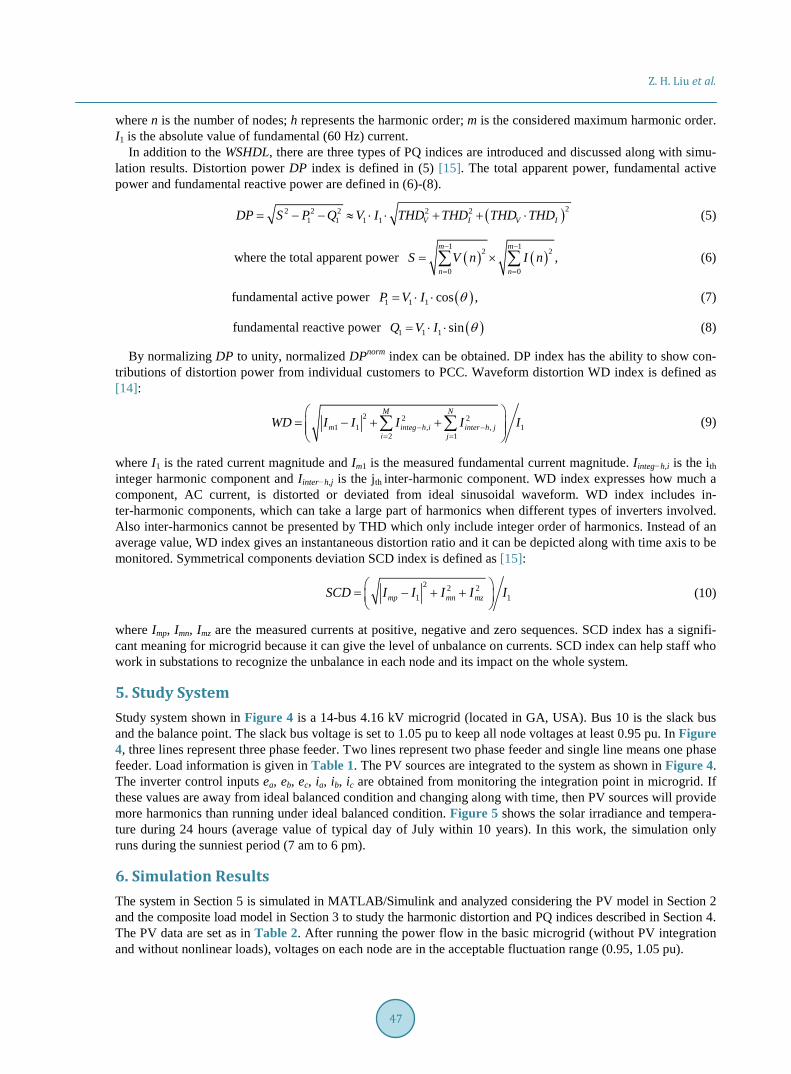
where voltages and currents are represented as complex numbers. The subscript m stands for the harmonic order. For pure fundamental frequency voltage sources, voltage vector elements are zeros except V1. But currents flowing into loads still have harmonic distortion due to the fact that Y21, Y31 and Ym1 are not all zeros for nonli-near load. On contrary, for linear load, the crossed frequency admittance matrix becomes a diagonal matrix and the off diagonal elements are zeros. The crossed frequency matrix models the load as a harmonic currents source. In this paper, a composite load consists of a linear load and three types of nonlinear loads. Linear load is very clearly built in software platform. Three different crossed frequency admittance matrixes are built for the three nonlinear load models, which are DBR, CFL and PAVC loads. DBR, CFL and PAVC cover major appliances for both residential and commercial building in microgrid system. Circuit diagrams used in this research are given in Figure 2.
For the purpose of composite load simulation, with given voltages, output currents can be monitored. When monitoring output currents, time domain current waveform is analyzed by the Fast Fourier Transformation (FFT) so that it can be expressed as a complex number matrix. Each row of this matrix stands for a current on a distinct harmonic order. With only fundamental voltage, 60 Hz, first column elements in crossed frequency admittance matrix can be calculated. Then by superimposing 3rd, 5th, 7th, 9th, 11th and 13th order harmonic voltage sources, each one at a time, the other columns can be calculated likewise. Therefore, three 7 × 7 admittance matrixes are built for the three types of nonlinear loads. Figure 3 shows the block diagram of the composite load model used in the Simulink simulation.
4. THD and PQ Indices THD is the measure of the harmonic distortion at each bus in the system. In order to look at the harmonic distor-tion in the whole system, whole system harmonics distortion level (WSHDL) is defined as:
1n
ii THDWSHDL
n== ∑ (3)
2
1 1
mh
h
ITHDI=
=
∑ (4)
Z. H. Liu et al.
46
AC R
C1
C2
AC R
AC R
DBR
CFL
PAVC
Linear
(a) (b)
(c) (d) Figure 2. Circuit diagrams of nonlinear loads: (a) CFL; (b) DBR; (c) PAVC; (d) Composite load.
Voltage Measurement
Fourier Analysis
Va
Magnitude
Phase Angle
Generate Voltage Matrix
Admittance Matrix of Nonlinear Load
Multipli-cation
Current Vector Magnitude
Phase Angle
Current Waveform
Feeder in Microgrid
Controllable Current Source
Linear Load
Inonlinear
Ilinear
Figure 3. Composite load diagram.
Z. H. Liu et al.
47
where n is the number of nodes; h represents the harmonic order; m is the considered maximum harmonic order. I1 is the absolute value of fundamental (60 Hz) current.
In addition to the WSHDL, there are three types of PQ indices are introduced and discussed along with simu-lation results. Distortion power DP index is defined in (5) [15]. The total apparent power, fundamental active power and fundamental reactive power are defined in (6)-(8).
( )22 2 2 2 21 1 1 1 V I V IDP S P Q V I THD THD THD THD= − − ≈ ⋅ ⋅ + + ⋅ (5)
where the total apparent power ( ) ( )1 12 2
0 0,
m m
n nS V n I n
− −
= =
= ×∑ ∑ (6)
fundamental active power ( )1 1 1 cos ,P V I θ= ⋅ ⋅ (7)
fundamental reactive power ( )1 1 1 sinQ V I θ= ⋅ ⋅ (8)
By normalizing DP to unity, normalized DPnorm index can be obtained. DP index has the ability to show con-tributions of distortion power from individual customers to PCC. Waveform distortion WD index is defined as [14]:
2 2 21 1 , , 1
2 1
M N
m integ h i inter h ji j
WD I I I I I− −= =
= − + +
∑ ∑ (9)
where I1 is the rated current magnitude and Im1 is the measured fundamental current magnitude. Iinteg−h,i is the ith integer harmonic component and Iinter−h,j is the jth inter-harmonic component. WD index expresses how much a component, AC current, is distorted or deviated from ideal sinusoidal waveform. WD index includes in-ter-harmonic components, which can take a large part of harmonics when different types of inverters involved. Also inter-harmonics cannot be presented by THD which only include integer order of harmonics. Instead of an average value, WD index gives an instantaneous distortion ratio and it can be depicted along with time axis to be monitored. Symmetrical components deviation SCD index is defined as [15]:
2 2 21 1mp mn mzSCD I I I I I = − + +
(10)
where Imp, Imn, Imz are the measured currents at positive, negative and zero sequences. SCD index has a signifi-cant meaning for microgrid because it can give the level of unbalance on currents. SCD index can help staff who work in substations to recognize the unbalance in each node and its impact on the whole system.
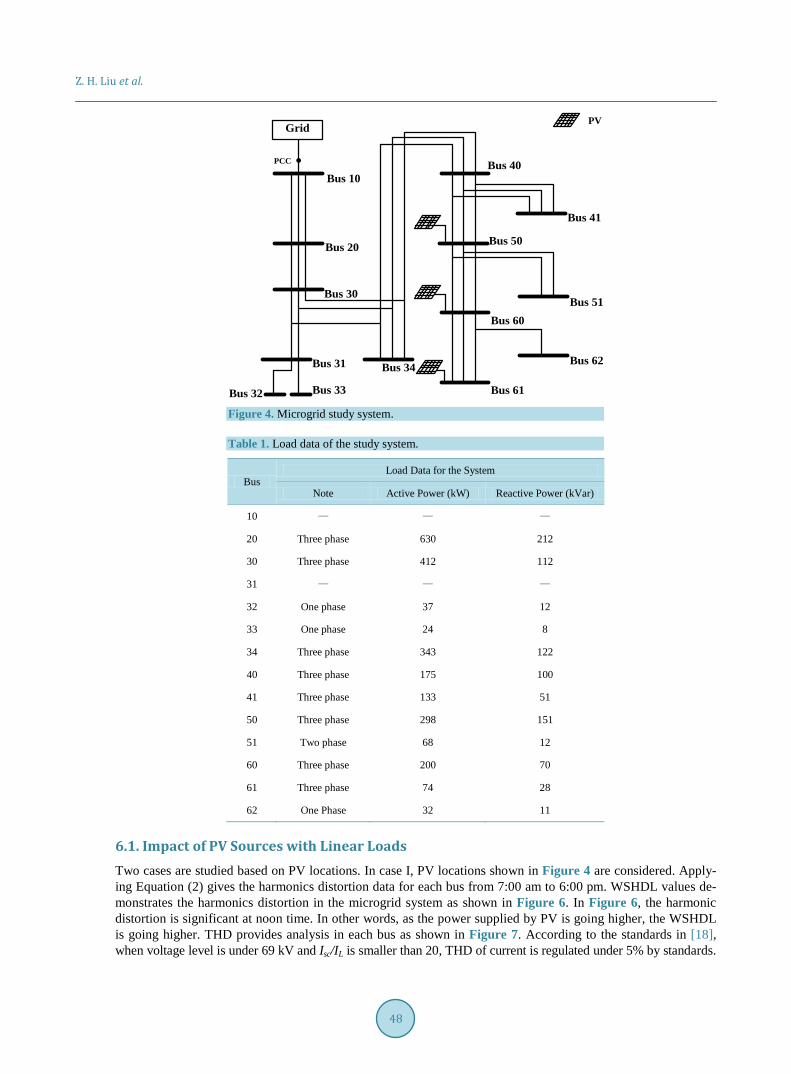
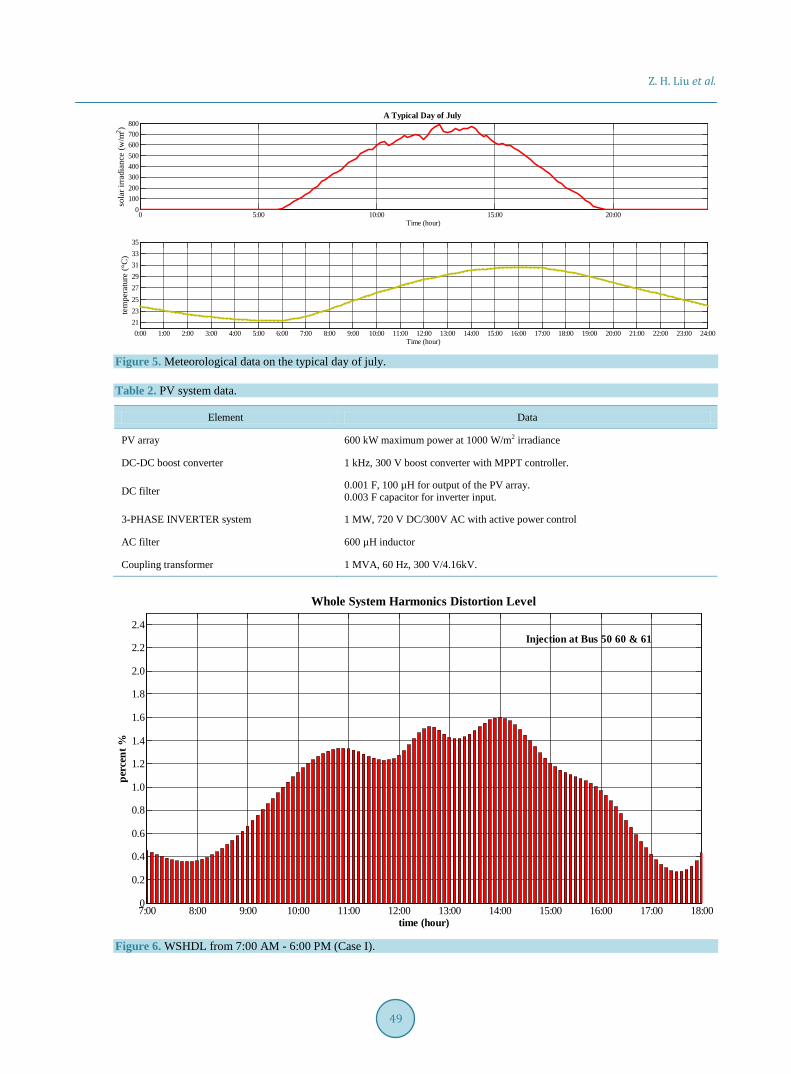
5. Study System Study system shown in Figure 4 is a 14-bus 4.16 kV microgrid (located in GA, USA). Bus 10 is the slack bus and the balance point. The slack bus voltage is set to 1.05 pu to keep all node voltages at least 0.95 pu. In Figure 4, three lines represent three phase feeder. Two lines represent two phase feeder and single line means one phase feeder. Load information is given in Table 1. The PV sources are integrated to the system as shown in Figure 4. The inverter control inputs ea, eb, ec, ia, ib, ic are obtained from monitoring the integration point in microgrid. If these values are away from ideal balanced condition and changing along with time, then PV sources will provide more harmonics than running under ideal balanced condition. Figure 5 shows the solar irradiance and tempera-ture during 24 hours (average value of typical day of July within 10 years). In this work, the simulation only runs during the sunniest period (7 am to 6 pm).
6. Simulation Results The system in Section 5 is simulated in MATLAB/Simulink and analyzed considering the PV model in Section 2 and the composite load model in Section 3 to study the harmonic distortion and PQ indices described in Section 4. The PV data are set as in Table 2. After running the power flow in the basic microgrid (without PV integration and without nonlinear loads), voltages on each node are in the acceptable fluctuation range (0.95, 1.05 pu).
Z. H. Liu et al.
48
Bus 10
Bus 20
Bus 30
Bus 31
Bus 32 Bus 33
Bus 34
Bus 40
Bus 50
Bus 60
Bus 61
Bus 41
Bus 62
Bus 51
GridPV
PCC
Figure 4. Microgrid study system.
Table 1. Load data of the study system.
Bus Load Data for the System
Note Active Power (kW) Reactive Power (kVar)
10 — — —
20 Three phase 630 212
30 Three phase 412 112
31 — — —
32 One phase 37 12
33 One phase 24 8
34 Three phase 343 122
40 Three phase 175 100
41 Three phase 133 51
50 Three phase 298 151
51 Two phase 68 12
60 Three phase 200 70
61 Three phase 74 28
62 One Phase 32 11
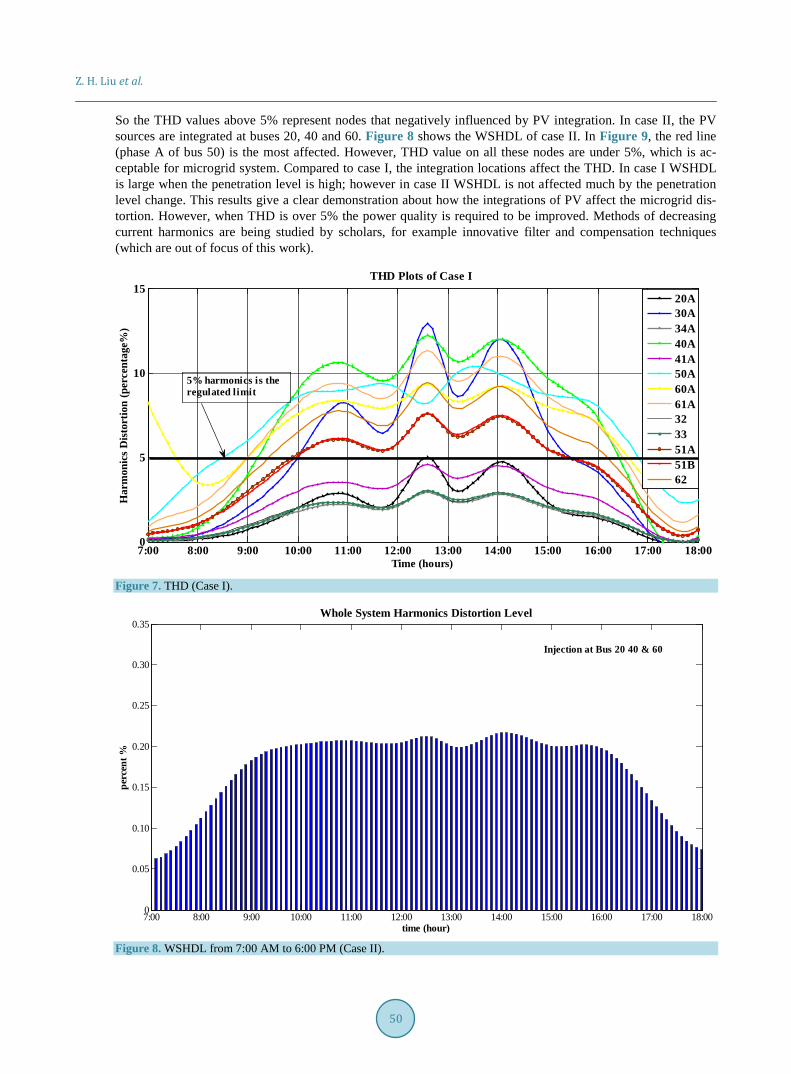
6.1. Impact of PV Sources with Linear Loads Two cases are studied based on PV locations. In case I, PV locations shown in Figure 4 are considered. Apply-ing Equation (2) gives the harmonics distortion data for each bus from 7:00 am to 6:00 pm. WSHDL values de-monstrates the harmonics distortion in the microgrid system as shown in Figure 6. In Figure 6, the harmonic distortion is significant at noon time. In other words, as the power supplied by PV is going higher, the WSHDL is going higher. THD provides analysis in each bus as shown in Figure 7. According to the standards in [18], when voltage level is under 69 kV and Isc/IL is smaller than 20, THD of current is regulated under 5% by standards.
Z. H. Liu et al.
49
0 5:00 10:00 15:00 20:000
100200300400500600700800
A Typical Day of July
Time (hour)
sola
r irra
dian
ce (w
/m2 )
0:00 1:00 2:00 3:00 4:00 5:00 6:00 7:00 8:00 9:00 10:00 11:00 12:00 13:00 14:00 15:00 16:00 17:00 18:00 19:00 20:00 21:00 22:00 23:00 24:002123252729313335
Time (hour)
tem
pera
ture
(°C
)
Figure 5. Meteorological data on the typical day of july. Table 2. PV system data.
Element Data
PV array 600 kW maximum power at 1000 W/m2 irradiance
DC-DC boost converter 1 kHz, 300 V boost converter with MPPT controller.
DC filter 0.001 F, 100 µH for output of the PV array. 0.003 F capacitor for inverter input.
3-PHASE INVERTER system 1 MW, 720 V DC/300V AC with active power control
AC filter 600 µH inductor
Coupling transformer 1 MVA, 60 Hz, 300 V/4.16kV.
7:00 8:00 9:00 10:00 11:00 12:00 13:00 14:00 15:00 16:00 17:00 18:000
0.2
0.4
0.6
0.8
1.0
1.2
1.4
1.6
1.8
2.0
2.2
2.4
Whole System Harmonics Distortion Level
time (hour)
perc
ent %
Injection at Bus 50 60 & 61
Figure 6. WSHDL from 7:00 AM - 6:00 PM (Case I).
Z. H. Liu et al.
50
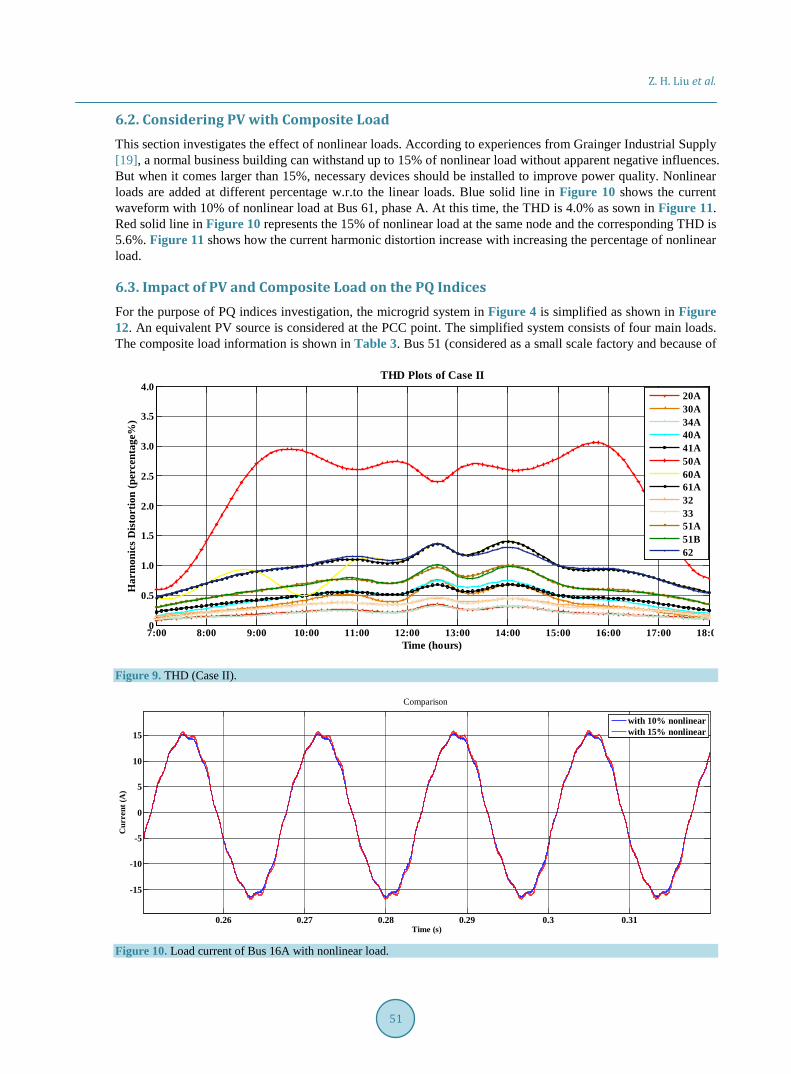
So the THD values above 5% represent nodes that negatively influenced by PV integration. In case II, the PV sources are integrated at buses 20, 40 and 60. Figure 8 shows the WSHDL of case II. In Figure 9, the red line (phase A of bus 50) is the most affected. However, THD value on all these nodes are under 5%, which is ac-ceptable for microgrid system. Compared to case I, the integration locations affect the THD. In case I WSHDL is large when the penetration level is high; however in case II WSHDL is not affected much by the penetration level change. This results give a clear demonstration about how the integrations of PV affect the microgrid dis-tortion. However, when THD is over 5% the power quality is required to be improved. Methods of decreasing current harmonics are being studied by scholars, for example innovative filter and compensation techniques (which are out of focus of this work).
7:00 8:00 9:00 10:00 11:00 12:00 13:00 14:00 15:00 16:00 17:00 18:000
5
10
15THD Plots of Case I
Har
mon
ics
Dis
tort
ion
(per
cent
age%
)
Time (hours)
20A30A34A40A41A50A60A61A323351A51B62
5% harmonics is theregulated limit
Figure 7. THD (Case I).
7:00 8:00 9:00 10:00 11:00 12:00 13:00 14:00 15:00 16:00 17:00 18:000
0.05
0.10
0.15
0.20
0.25
0.30
0.35Whole System Harmonics Distortion Level
time (hour)
perc
ent %
Injection at Bus 20 40 & 60
Figure 8. WSHDL from 7:00 AM to 6:00 PM (Case II).
Z. H. Liu et al.
51
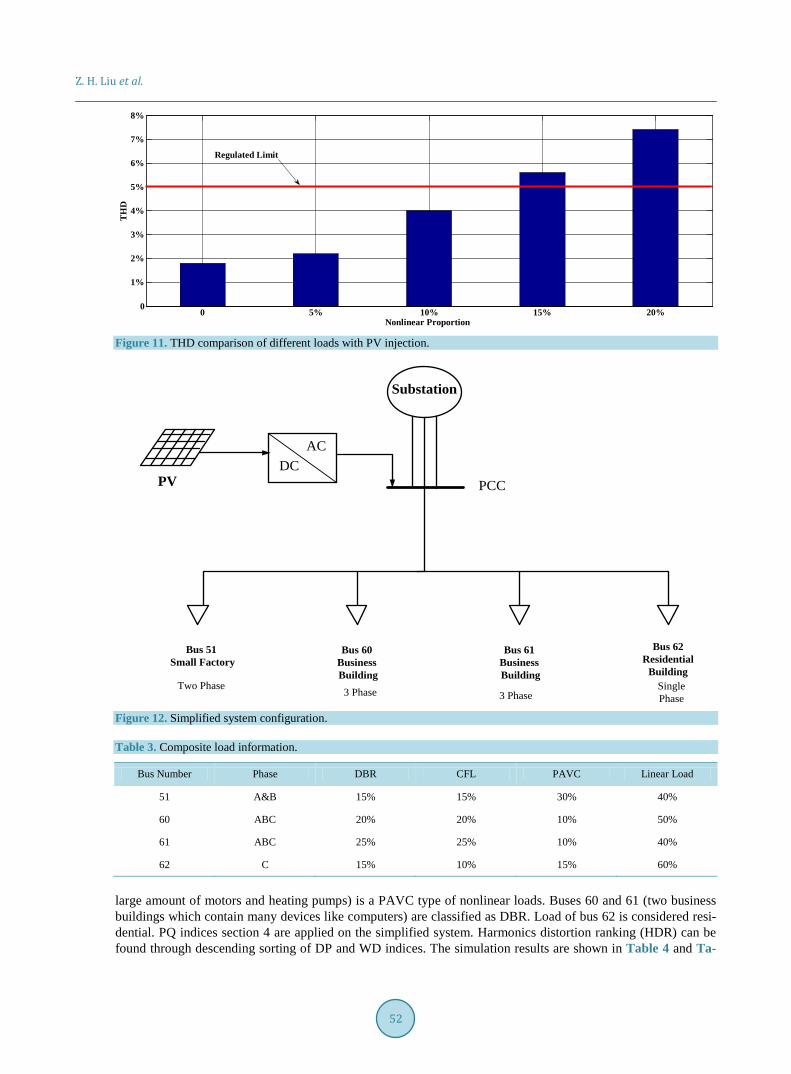
6.2. Considering PV with Composite Load This section investigates the effect of nonlinear loads. According to experiences from Grainger Industrial Supply [19], a normal business building can withstand up to 15% of nonlinear load without apparent negative influences. But when it comes larger than 15%, necessary devices should be installed to improve power quality. Nonlinear loads are added at different percentage w.r.to the linear loads. Blue solid line in Figure 10 shows the current waveform with 10% of nonlinear load at Bus 61, phase A. At this time, the THD is 4.0% as sown in Figure 11. Red solid line in Figure 10 represents the 15% of nonlinear load at the same node and the corresponding THD is 5.6%. Figure 11 shows how the current harmonic distortion increase with increasing the percentage of nonlinear load.
6.3. Impact of PV and Composite Load on the PQ Indices For the purpose of PQ indices investigation, the microgrid system in Figure 4 is simplified as shown in Figure 12. An equivalent PV source is considered at the PCC point. The simplified system consists of four main loads. The composite load information is shown in Table 3. Bus 51 (considered as a small scale factory and because of
7:00 8:00 9:00 10:00 11:00 12:00 13:00 14:00 15:00 16:00 17:00 18:00
0.5
1.0
1.5
2.0
2.5
3.0
3.5
4.0THD Plots of Case II
Har
mon
ics
Dis
tort
ion
(per
cent
age%
)
Time (hours)
20A30A34A40A41A50A60A61A323351A51B62
Figure 9. THD (Case II).
0.26 0.27 0.28 0.29 0.3 0.31
-15
-10
-5
0
5
10
15
Time (s)
Cur
rent
(A)
Comparison
with 10% nonlinearwith 15% nonlinear
Figure 10. Load current of Bus 16A with nonlinear load.
Z. H. Liu et al.
52
0 5% 10% 15% 20%0
1%
2%
3%
4%
5%
6%
7%
8%
Nonlinear Proportion
TH
D
Regulated Limit
Figure 11. THD comparison of different loads with PV injection.
Substation
PV
3 Phase3 PhaseTwo Phase Single Phase
Bus 62Residential
Building
Bus 60Business Building
Bus 61Business Building
Bus 51 Small Factory
ACDC
PCC
Figure 12. Simplified system configuration. Table 3. Composite load information.
Bus Number Phase DBR CFL PAVC Linear Load
51 A&B 15% 15% 30% 40%
60 ABC 20% 20% 10% 50%
61 ABC 25% 25% 10% 40%
62 C 15% 10% 15% 60%
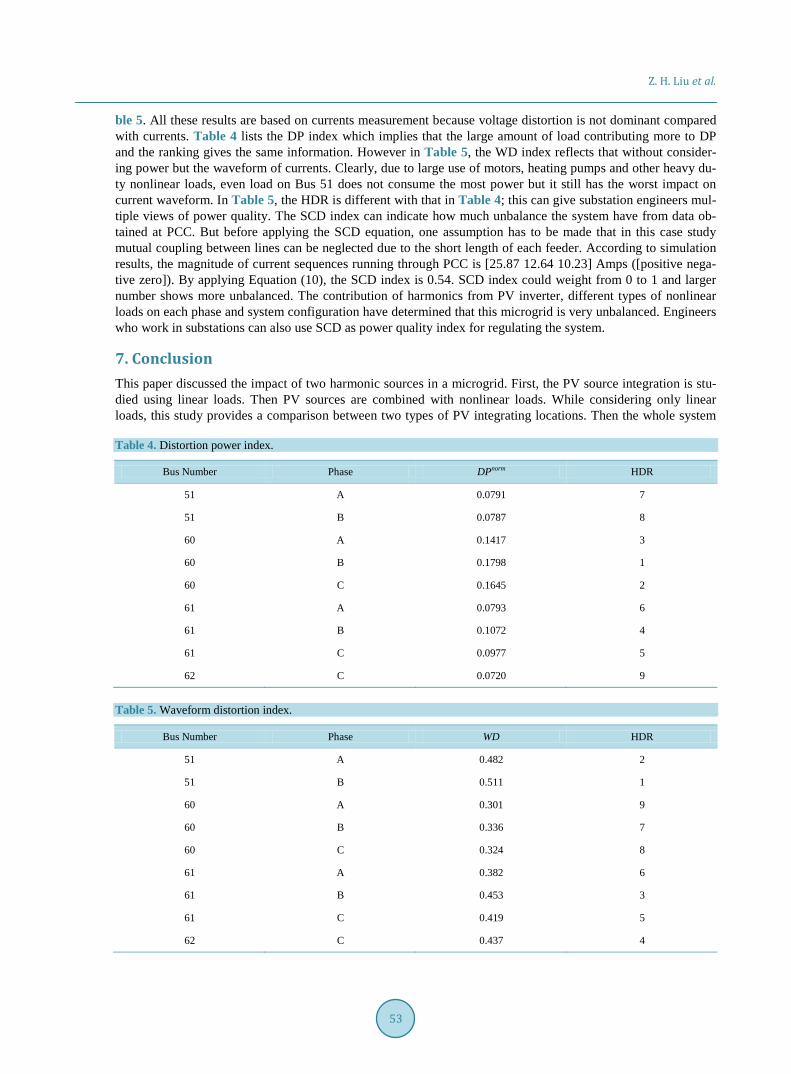
large amount of motors and heating pumps) is a PAVC type of nonlinear loads. Buses 60 and 61 (two business buildings which contain many devices like computers) are classified as DBR. Load of bus 62 is considered resi-dential. PQ indices section 4 are applied on the simplified system. Harmonics distortion ranking (HDR) can be found through descending sorting of DP and WD indices. The simulation results are shown in Table 4 and Ta-
Z. H. Liu et al.
53
ble 5. All these results are based on currents measurement because voltage distortion is not dominant compared with currents. Table 4 lists the DP index which implies that the large amount of load contributing more to DP and the ranking gives the same information. However in Table 5, the WD index reflects that without consider-ing power but the waveform of currents. Clearly, due to large use of motors, heating pumps and other heavy du-ty nonlinear loads, even load on Bus 51 does not consume the most power but it still has the worst impact on current waveform. In Table 5, the HDR is different with that in Table 4; this can give substation engineers mul-tiple views of power quality. The SCD index can indicate how much unbalance the system have from data ob-tained at PCC. But before applying the SCD equation, one assumption has to be made that in this case study mutual coupling between lines can be neglected due to the short length of each feeder. According to simulation results, the magnitude of current sequences running through PCC is [25.87 12.64 10.23] Amps ([positive nega-tive zero]). By applying Equation (10), the SCD index is 0.54. SCD index could weight from 0 to 1 and larger number shows more unbalanced. The contribution of harmonics from PV inverter, different types of nonlinear loads on each phase and system configuration have determined that this microgrid is very unbalanced. Engineers who work in substations can also use SCD as power quality index for regulating the system.
7. Conclusion This paper discussed the impact of two harmonic sources in a microgrid. First, the PV source integration is stu-died using linear loads. Then PV sources are combined with nonlinear loads. While considering only linear loads, this study provides a comparison between two types of PV integrating locations. Then the whole system Table 4. Distortion power index.
Bus Number Phase DPnorm HDR
51 A 0.0791 7
51 B 0.0787 8
60 A 0.1417 3
60 B 0.1798 1
60 C 0.1645 2
61 A 0.0793 6
61 B 0.1072 4
61 C 0.0977 5
62 C 0.0720 9
Table 5. Waveform distortion index.
Bus Number Phase WD HDR
51 A 0.482 2
51 B 0.511 1
60 A 0.301 9
60 B 0.336 7
60 C 0.324 8
61 A 0.382 6
61 B 0.453 3
61 C 0.419 5
62 C 0.437 4
Z. H. Liu et al.
54
harmonics distortion level as well as the THD are considered as the main measures to evaluate the PQ and im-pact of PV integrations. Instead of single PV source, this study investigates mutual influences with multiple PV sources. A composite load model helps to analyze the harmonic distortion compared to linear loads. An actual microgrid with historical-based weather conditions is used as a study system. Simulation results can indicate a discernible look at these negative impacts on the microgrid PQ. In order to make numerical comparison and ranking PQ indices are used to estimate the current distortion from several different perspectives. Three PQ in-dices are applied and compared to investigate the power distortion, waveform distortion and system unbalance. Further research may develop an algorithm to find the optimized integration plan for unbalanced microgrid sys-tem, with multiple PV sources and nonlinear loads.
References [1] Katiraei, F. and Aguero, J.R. (2011) Solar PV Integration Challenges. IEEE Power and Energy Magazine, 9, 62-71.
http://dx.doi.org/10.1109/MPE.2011.940579 [2] Papaioannou, I.T., Alexiadis, M.C., Demoulias, C.S., Labridis, D.P. and Dokopoulos, P.S. (2009) Modeling and Mea-
surement of Small Photovoltaic Systems and Penetration Scenarios. PowerTech of the IEEE Bucharest, Bucharest, 28 June-2 July 2009, 1-7. http://dx.doi.org/10.1109/PTC.2009.5281836
[3] Yazdani, A., Di Fazio, A.R., Ghoddami, H., Russo, M., Kazerani, M., Jatskevich, J., et al. (2011) Modeling Guidelines and a Benchmark for Power System Simulation Studies of Three-Phase Single-Stage Photovoltaic Systems. IEEE Transactions on Power Delivery, 26, 1247-1264. http://dx.doi.org/10.1109/TPWRD.2010.2084599
[4] Kulkarni, A. and John, V. (2013) Mitigation of Lower Order Harmonics in a Grid-Connected Single-Phase PV Inverter. IEEE Transactions on Power Electronics, 28, 5024-5037. http://dx.doi.org/10.1109/TPEL.2013.2238557
[5] Blaabjerg, F., Teodorescu, R., Liserre, M. and Timbus, A.V. (2006) Overview of Control and Grid Synchronization for Distributed Power Generation Systems. IEEE Transactions on Industrial Electronics, 53, 1398-1409. http://dx.doi.org/10.1109/TIE.2006.881997
[6] Shirek, G.J. and Lassiter, B.A. (2012) Solar Plant Modeling Impacts on Distribution Systems PV Case Study. Rural Electric Power Conference of the IEEE, Milwaukee, 15-17 April 2012, B5-1-B5-10. http://dx.doi.org/10.1109/REPCon.2012.6194569
[7] Kalbat, A. (2013) PSCAD Simulation of Grid-Tied Photovoltaic Systems and Total Harmonic Distortion Analysis. Electric Power and Energy Conversion Systems of 3rd International Conference on of the IEEE, Istanbul, 2-4 October 2013, 1-6. http://dx.doi.org/10.1109/EPECS.2013.6713002
[8] Schlabbach, J. and Kammer, L. (2006) Prediction of Harmonic Currents of PV-Inverters Using Measured Solar Radia-tion Data. Electrotechnical Conference of the IEEE Mediterranean, May 2006.
[9] Gallo, D., Langella, R., Testa, A., Hernandez, J.C., Papic, I., Blazic, B. and Meyer, J. (2013) Case Studies on Large PV Plants: Harmonic Distortion, Unbalance and Their Effects. Power and Energy Society General Meeting of the IEEE, Vancouver, 21-25 July 2013, 1-5. http://dx.doi.org/10.1109/PESMG.2013.6672271
[10] Munir, S. and Li, Y.W. (2013) Residential Distribution System Harmonic Compensation Using PV Interfacing Inverter. IEEE Transactions on Smart Grid, 4, 816-827. http://dx.doi.org/10.1109/TSG.2013.2238262
[11] Yong, J., Chen, L., Nassif, A.B. and Xu, W. (2010) A Frequency-Domain Harmonic Model for Compact Fluorescent Lamps. IEEE Transactions on Power Delivery, 25, 1182-1189. http://dx.doi.org/10.1109/TPWRD.2009.2032915
[12] Fauri, M. (1997) Harmonic Modelling of Non-Linear Load by Means of Crossed Frequency Admittance Matrix. IEEE Transactions on Power Systems, 12, 1632-1638. http://dx.doi.org/10.1109/59.627869
[13] El-Saadany. E.F., Salama, M.M.A. and Chikhani, A.Y. (2000) Passive Filter Design for Harmonic Reactive Power Compensation in Single-Phase Circuits Supplying Nonlinear Loads. IEE Proceedings-Generation on Transmission and Distribution, 147, 373-380. http://dx.doi.org/10.1049/ip-gtd:20000654
[14] Lin, T. and Domijan, A. (2005) On Power Quality Indices and Real Time Measurement. IEEE Transactions on Power Delivery, 20, 2552-2562. http://dx.doi.org/10.1109/TPWRD.2005.852333
[15] Jo, S.H., Son, S. and Park, J.W. (2013) On Improving Distortion Power Quality Index in Distributed Power Grids. IEEE Transactions on Smart Grid, 4, 586-595. http://dx.doi.org/10.1109/TSG.2012.2222943
[16] Villalva, M.G. and Gazoli, J.R. (2009) Modeling and Circuit-Based Simulation of Photovoltaic Arrays. Power Elec-tronics Conference of COBEP’09 Brazilian of the IEEE, 27 September-1 October 2009, 1244-1254. http://dx.doi.org/10.1109/COBEP.2009.5347680
[17] Cao, H., Zhang, H., Jiang, W. and Wei, S. (2012) Research on PQ Control Strategy for PV Inverter in the Unbalanced Grid. Power and Energy Engineering Conference of the Asia-Pacific IEEE, Shanghai, 27-29 March 2012, 1-3.
Z. H. Liu et al.
55
http://dx.doi.org/10.1109/APPEEC.2012.6307159 [18] Halpin, S.M. (2005) Comparison of IEEE and IEC Harmonic Standards. Power Engineering Society General Meeting
of the IEEE, 12-16 June 2005. http://dx.doi.org/10.1109/PES.2005.1489688 [19] http://www.grainger.com/content/safety-electrical-power-system-harmonics