Embed Size (px)
Citation preview
Anil Rajbhandary, NEA
Capacity Building Program for SARPEX Mock Exercise
07 February, 2017; New Delhi
Power Sector Overview
Nepal

Legislative and Regulatory Framework
Key Acts and Regulations that govern Nepal’s Power
Sector:
Nepal Electricity Authority Act, 1984
Electricity Act, 1992
Electricity Regulations, 1993
Electricity Tariff Fixation Commission Regulation,1993

Ministry of Energy
Institutional Arrangement
Water and Energy Commission
Electricity Tariff Fixation Commission
Nepal Electricity Authority
Role of Private Sector
Department of Electricity Development

Ministry of Energy
Line Ministry of the Power Sector
Responsible for framing legislation for submission to
Cabinet and Parliament
Regulatory oversight for issuing licenses for power
generation, transmission and distribution under the
Electricity Act 1992

Department for Electricity Development
Department under the Ministry of Energy as the
official one-stop window for interested private
investors to facilitate the development of private
sector power generation, transmission and
distribution projects.
Functions:Private Power Development Promotion and Facilitation
Inspectorate
Technical Support

Water and Energy Commission
Policy Advisory Body to the Government
Formulates Short and Long Term Water and Energy
Development Policies
Analyses and advises on bi-lateral and multi-lateral
energy development programs as well as hydropower
development treaties with neighboring countries

E Electricity Tariff Fixation Commission
Reviews and approves retail electricity tariff rates
and other fees for electrical service at the
consumer level.
Comprises a full time Chairman, and members
representing the line ministry, private sector,
regulated entities, industry and the consumers.

Nepal Electricity Authority
Established in August 1985 under NEA Act 1984
Wholly Government of Nepal undertaking
Responsible for generation, transmission and
distribution of electricity throughout Nepal

Roles of NEA
Project Execution
Power Purchaser
Operation & Maintenance of National Grid
Scheduling and Dispatching

Engineering Directorate, DMD L-12 T
Project Development Department,L- 11 T
Environment & Social Study Department,L- 11 T
Soil Rock and Concrete Laboratory, L- 11 T
NEA Training Centre,L- 11 Adm.
Transmision
Directorate,
Grid Operation Department,L-11 T
System OperationDepartment,
L-11 T
Grid Development Department, L-11 T
Administration Division,L-10 Adm
Finance Division,L-10 Acc
Monitoring & MIS Section, L-9, Electrical
Administration Division,L-10 Adm
Finance Division,L-10 Acc
Monitoring & MIS Section, L-9, Electrical
Administration Division,L-10 Adm
Monitoring & MIS Section, L-9, Electrical
Material Management Div,L-10 Electrical
NEA Board
Managing Director
MD'S Secretariat,
L- 11 T
Audit Committee
Internal Audit Department
L-11 Acc.NEA Subsidiary
Companies
Planning & Technical
Services Department,
L-11 T
Finance Division,
L-10 Acc.
Community & RE
Department
L-11 T
Loss Reduction Division L-10 Electrical
Distribution & Consumer Services
Directorate,DMD L-12 T
Kathmandu Regional
Office, L-11 T
Hetauda Regional Office,
L-11 T
Biratnagar Regional Office,
L-11 T
Janakpur Regional Office,
L-11 T
Butwal Regional Office,
L-11 T
Pokhara Regional Office,
L-11 T
Nepalgunj Regional Office,
L-11 T
Attaria Regional Office,
L-11 T
Generation
Directorate, DMD L-12 T
Large Generation Operation
& Maintenance Department,
L-11 T
Medium Generation Operation
& Maintenance Department,
L-11 T
Generation Development
Department,
L-11 T
Planning, Monitoring & IT
Directorate,
DMD L-12 T
Organizational Structure of Nepal Electricity Authority
Technical Support Department, L-11 T
Corporate Planning & Monitoring Department,L-11 T
System Planning Department, L-11 T
Power Trade Department,
L-11 T
Information TechnologyDepartment,
L-11 T
Economic AnalysisDepartment, L-11 Adm/Misc.
Electromechanical Design Division,L- 10 Electrical
Administration Section,L-9 Adm
Finance Section,L-9 Acc
Project Mgmt.
Directorate,DMD L-12 T
AccountsDepartment, L-11 Acc.
Corporate Finance Department,L-11 Acc.
Finance
Directorate,DMD L
Project Preparation Department,L-11 Adm.
Note :
T = Technical Services; A = Administration Services: Adm = Administration Group:Acc=Account Group
Administration
Directorate,DMD L-12 A
Human Resource Department,L-11 Adm.
Legal Department,L-11 Adm
General Service Department,L-11 Adm.
Recruitment Department,L-11 Adm

Role of Private Sector
Availability of concessional loans for the power
sector, particularly in generation projects, is lately on
the decline.
Electricity Act 1992, provides a legal framework for
the private sector participation in electricity
generation, transmission and distribution.
Today, IPPs share is nearly 45 percent of the total
installed generating capacity.
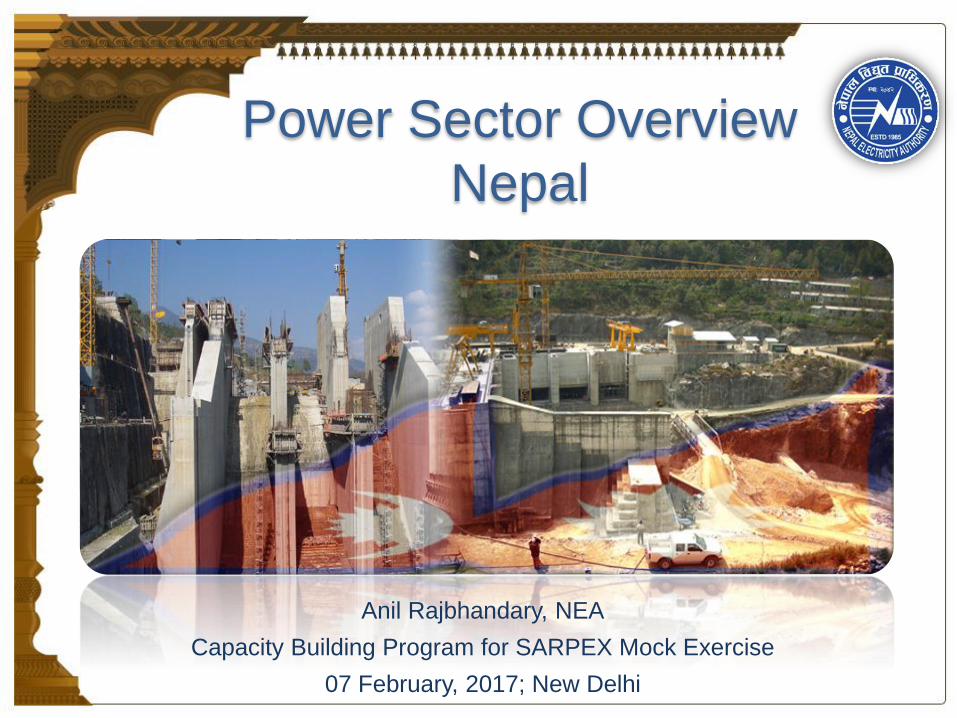
Installed Capacity: 960.6 MW
On Grid 956.1 MW Off Grid 4.5 MW
Hydro 902.7 MW Thermal 53.4 MW
ROR 810.7 MW Storage 92 MW
IPP 429.7 NEA 381
1700 Micro HP, 15 MW
Import from India 350 MW
Nepal Power System

NEA Power System Status
NEA Power System Status
On Grid Installed Capacity 956.1 MW
Transmission Line 132 kV 2,417 Circuit Km
Substation 132 kV : 29 1,765 MVA
Transmission line 66 kV 511 Circuit Km
Substation 66 kV : 12 458 MVA
Number of consumers 2.97 Million
Population Coverage 58 %


Total Energy Available and Peak Demand
Particulars FY 2011/12 2012/13 2013/14 2014/15 2015/16*
Sales (GWh) 3,044.7 3,156.0 3,496.3 3,743.7 3,746.0
Peak Demand (MW) 1,026.65 1,094.62 1,200.98 1,291.10 1,385.30
NEA Hydro Generation 2,357.43 2,273.11 2,288.23 2,365.64 2,168.49
NEA Thermal Generation 1.56 18.85 9.65 1.24 0.07
NEA Generation Total
(GWh)2,358.99 2,291.96 2,297.88 2,366.88 2,168.56
Power Purchase from India 746.07 790.14 1,318.75 1,369.89 1,758.41
Power Purchase from IPPs 1,073.57 1,175.98 1,070.46 1,268.93 1,173.14
Power Purchase Total
(GWh)1,819.64 1,966.12 2,389.21 2,638.82 2,931.55
Available Energy (GWh) 4,178.63 4,258.08 4,687.09 5,005.70 5,100.11

500
600
700
800
900
1000
1100
1200
1300
0 3 6 9 12 15 18 21 24
Nep
al S
up
ply
/Dem
and
(MW
)
Time Hr
System Load Curve of Peak Load Day(October 30, 2016) Sunday
Supply Demand

Breakdown of Supply Option in Meeting the System Peak
Supply OptionContribution
(MW)
NEA – Hydro 430.1
IPP - Hydro 241.0
Import 230.1
Total 901.2
Peak System Demand 1291.2
Deficit 390

NEA HYDRO
2,168.5 GWh 29.6%
NEA THERMAL
0.1 GWh 0.0%
IPP
1,173.1 GWh 16.0%
IMPORT
1,758.4 GWh 24.0%
ENERGY SHEDDED
2,228.8 GWh 30.4%
Percentage Energy Share of Different Supply Options
Fiscal Year - 2015/2016
(Total : 7,328.9 GWh)

Electricity DemandPeak Electricity Demand of Nepal is nearly 1300 MW
Prolonged Load Shedding throughout the year was
enforced to cope with Supply – Demand Imbalance since
last couple of years
This year supply situation is comparatively improved
Increased import
Commissioning of number of IPP Projects
Demand Side Management
Being a Developing Country and with more than a third of
the population still without access to electricity, electricity
demand is projected to grow on an average by 8.2 percent
annually based on target GDP growth rate of 6 percent

7,491.08
9,889.91
14,349.25
20,811.80
28,329.85
1559.7
2071.5
2978.3
4280.7
5785.3
0
1000
2000
3000
4000
5000
6000
0.00
5,000.00
10,000.00
15,000.00
20,000.00
25,000.00
30,000.00
20
16
/17
20
17
/18
20
18
/19
20
19
/20
20
20
/21
20
21
/22
20
22
/23
20
23
/24
20
24
/25
20
25
/26
20
26
/27
20
27
/28
20
28
/29
20
29
/30
20
30
/31
20
31
/32
20
32
/33
20
33
/34
Pe
ak L
oad
(MW
)
Ene
rgy
(GW
h)
Fiscal Year
Load Forecast
Energy (GWh) System Peak Load(MW)

Projects Under Construction
ProjectsInstalled Capacity
(MW)
Commissioning
Year
NEA
Chameliya 30 2017/18
Kulekhani III 14 2017/18
Trisuli 3 ‘A’ 60 2019/20
Rahughat 40 2020/21
Total 144

Projects Under Construction…
ProjectsInstalled Capacity
(MW)
Commissioning
Year
NEA Subsidiary
Upper Tamakosi 456 2018/19
Tanahu 140 2022/23
Upper Sanjen 14.8 2018/19
Sanjen 42.5 2019/20
Madhya Bhotekosi 102 2020/21
Rasuwagadhi 111 2020/21
Total 866.3
Total (NEA + Sub.) 1010.3
IPPs (83 Projects) 890.0 2017/18-2020/21
Grand Total 1900.3

Supply Demand Scenario
In the next two years, with the commissioning of
number of Hydro Projects
Power Deficit Likely to be eliminated during
the wet season
But likely to persist in the dry season
By 2019 -20
Likely to become surplus in energy terms
Need for Import to meet Peak Demand
during Dry Season
Seasonality of hydro power generation
Comparatively higher load

Power Exchange between Nepal & India
Started with the signing of Koshi River Treaty in 1954.
Nepal’s entitlement 10 MW
Power Exchange Agreement concluded in 1971 for a 5 MW
power exchange
at present it stands at 50 MW level.
Other River Treaties:
Gandak Treaty: 15 MW Gandak Power Station Built
Mahakali Treaty: 12 – 16 MW (70 GWh per annum)
being drawn from the Tanakpur Power Station
Import beyond the 50 MW level under commercial terms
Import of power by India from Nepal is lately on decline
Extension of Indian Grid to rural areas adjoining Nepal Border
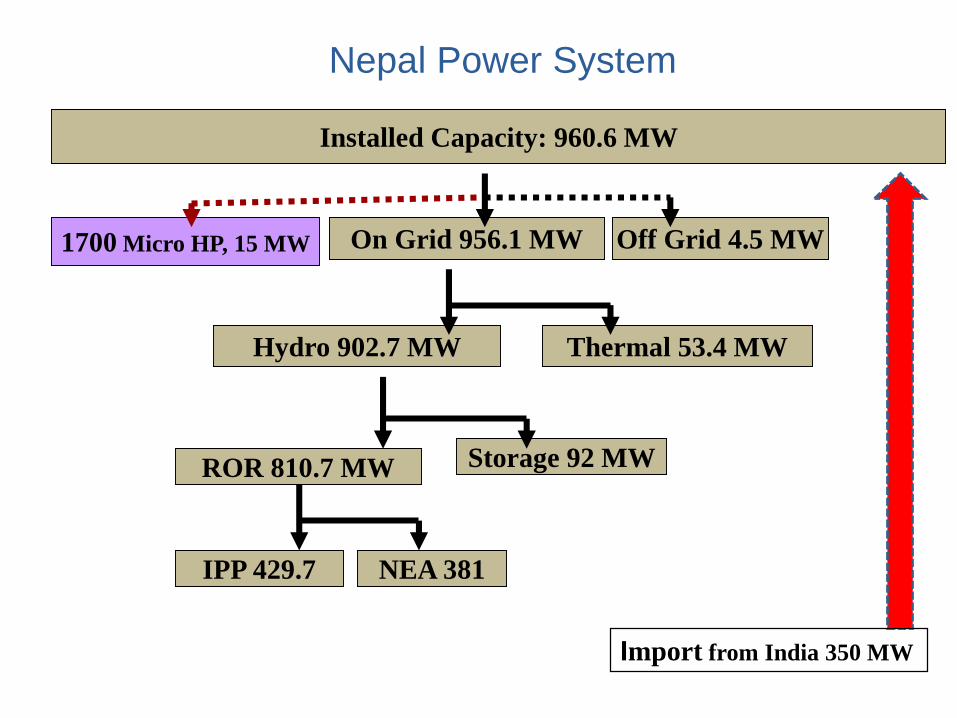
Existing Import Interconnections
InterconnectionsVoltage Level
(kV)
Import Capacity
(MW)
Kataiya - Kusaha 132 125
Kataiya - Rajbiraj 33 10
Sitamadi-Jaleshwor 33 12
Kataiya-Inaruwa 33 5
Raxaul-Birgunj 33 12
Ramnagar-Gandak 132 25
Jaynagar-Siraha 33 7
Nanpara-Nepalgunj 33 12
Tanakpur-Mahendranagar 132 40
Muzaffarpur-Dhalkebar 132 120
Total 368

New Interconnections
Kataiya - Kusaha 132 kV single circuit
15 km
50 MW
Raxaul - Parwanipur 132 kV single circuit
17 km
50 MW
Both transmission lines are being implemented under
Government of India Grant Assistance
Dhalkebar – Muzzaffarpur 400 kV double circuit cross-
border transmission line being implemented under PPP
Model

D – M 400 kV Cross Border Line
Implemented under commercial mode i.e. PPP
Model
The JV companies will develop, own, operate and
maintain the transmission line in their respective
territory.
PTC India signed Power Sales Agreement (PSA)
with NEA on 12 December, 2011 for the bulk sale
of 150 MW of power to NEA
With the commissioning of mega hydro projects in
Nepal, this high capacity interconnection will
facilitate in exporting surplus power from Nepal to
India
D – M Line Project Features
Voltage: 400 kV (initially charged at 220 kV)
and will be operated in synchronous mode with
the Indian grid
Line length: 40 Km in Nepal and 86 km in India
Transmission Capacity: ~ 1,000 MW
Pending commissioning of 220 kV Dhalkebar
substation the Transmission Line was operated
at 132 kV level for importing 80 MW power from
18 February, 2016
Presently 120 MW is being drawn


Wholesale Tariff
For bulk purchase by NEA from IPPs
NRs 4.80/kWh for 8 wet months (mid April – mid December)
NRs 8.40/kWh for 4 dry months (mid December – mid April)
increment at 3 % simple rate per year for 5 times for projects
upto 25 MW
increment at 3 % simple rate per year for 8 times for projects >
25 MW and upto 100 MW
Koshi Agreement : IRs 4.36/kWh
Mahakali Treaty : NRs 5.41/kWh payable to GoN
Power Exchange Agreement : IRs 5.63/kWh at 132 kV
IRs 6.08/kWh at 33 kV
IRs 6.54/kWh at 11 kV

Wholesale Tariff …
Power Purchase from North Bihar Power Distribution
Company Ltd : IRs 5.55/kWh
Power Purchase from Power Trading Corporation of
India Ltd : IRs 3.44/kWh RTC
Power Purchase from NTPC Vidyut Vyapar Nigam Ltd :
IRs 3.60/kWh RTC
Average Consumer Retail Price : NRs 8.60/kWh
in FY 2015/16