Embed Size (px)
DESCRIPTION
power quality
Citation preview

Energy Automation
Answers for infrastructure and cities.
Power Quality and Measurements Product Catalog Catalog SR 10 · Edition 2
1/2 Power Quality and Measurements Product Catalog · Siemens SR 10 · Edition 2
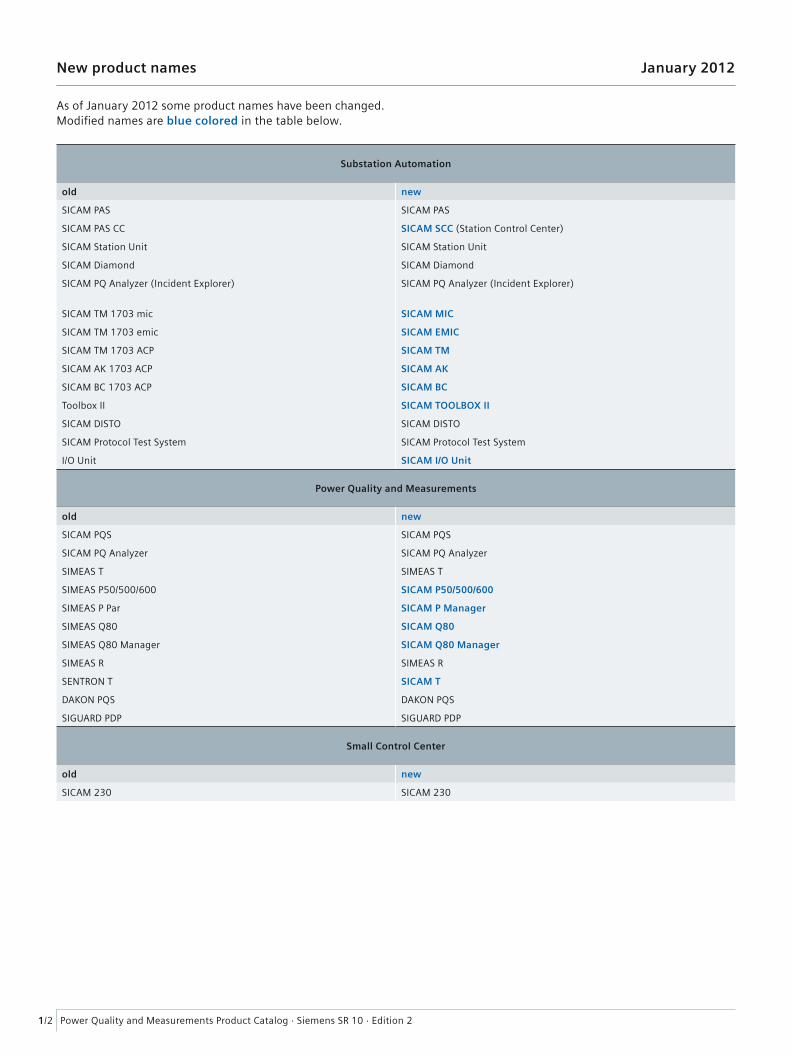
New product names January 2012
As of January 2012 some product names have been changed. Modifi ed names are blue colored in the table below.
Substation Automation
old new
SICAM PAS SICAM PAS
SICAM PAS CC SICAM SCC (Station Control Center)
SICAM Station Unit SICAM Station Unit
SICAM Diamond SICAM Diamond
SICAM PQ Analyzer (Incident Explorer) SICAM PQ Analyzer (Incident Explorer)
SICAM TM 1703 mic SICAM MIC
SICAM TM 1703 emic SICAM EMIC
SICAM TM 1703 ACP SICAM TM
SICAM AK 1703 ACP SICAM AK
SICAM BC 1703 ACP SICAM BC
Toolbox II SICAM TOOLBOX II
SICAM DISTO SICAM DISTO
SICAM Protocol Test System SICAM Protocol Test System
I/O Unit SICAM I/O Unit
Power Quality and Measurements
old new
SICAM PQS SICAM PQS
SICAM PQ Analyzer SICAM PQ Analyzer
SIMEAS T SIMEAS T
SIMEAS P50/500/600 SICAM P50/500/600
SIMEAS P Par SICAM P Manager
SIMEAS Q80 SICAM Q80
SIMEAS Q80 Manager SICAM Q80 Manager
SIMEAS R SIMEAS R
SENTRON T SICAM T
DAKON PQS DAKON PQS
SIGUARD PDP SIGUARD PDP
Small Control Center
old new
SICAM 230 SICAM 230

1/3Power Quality and Measurements Product Catalog · Siemens SR 10 · Edition 2
Contents
Power Quality and Measurements Product CatalogEnergy Automation
Catalog SR 10 · Edition 2
Invalid: Catalog SR 10 · V1.0
The products and systems described in this catalog are manufactured and sold according to a certifi ed management system (acc. to ISO 9001, ISO 14001 and BS OHSAS 18001).
1. Introduction Page
Power quality – Smart grids 1/4
Product overview: Devices, applications, products 1/6 1
Products
2. Power Monitoring Devices
SICAM P 2/1 to 2/16
2
3. Digital Measurement Transducer
SICAM T 3/1 to 3/16
3
4. Power Quality Recorder
SICAM Q80 4/1 to 4/30
4
5. Digital Fault Recorder and PQ Recorder
SIMEAS R-PQ 5/1 to 5/24
5
6. Digital Fault Recorder and Phasor Measurement Units
SIMEAS R-PMU 6/1 to 6/24
6
7. Fault Record and Power Quality Analysis System
SICAM PQS and SICAM PQ Analyzer 7/1 to 7/12
7
8. Phasor Data Processing
SIGUARD PDP 8/1 to 8/10
8
9. Data Concentrator
DAKON PQS 9/1 to 9/4
9

Introduction
1/4 Power Quality and Measurements Product Catalog · Siemens SR 10 · Edition 2
Power quality – Smart grids
Make power quality visible – Smart grids always with power quality
Electrical power is becoming more important as an energy resource. The global demand for electrical energy is increasing day per day in the same time electrical power supply systems are facing new challenges. The increasing infeed of renewable energy resources such as wind, solar, hydro, and increasing demand of energy effi ciency actions in order to meet environmental protection regulations, e.g. CO2 reduction, in combination with regional power supply systems of different utilities and the liberalization of the energy market, are only a few challenges for our modern power supply networks. To meet all these challenges, a lot of measures have to be taken into account:• Power system automation, as in smart grids • Load shedding and other load control techniques such as
demand response mechanisms to manage a power system. (i. e. directing power where it is needed in real-time)
• Increasing the reliability of the power grid by detecting faults early, allowing for isolation of operative system, and the prevention of power outages.
• Increasing the power quality by precise analysis and automated correction of sources of system degradation.
• Wide area measurement and control, in wide area grids, regional transmission networks, and local distribution grids.
Evergy country or even every region has its specifi c behavior of the power grid. Therefore the key to an excellent power
supply is, fi rst of all, to know the relevant local system circumstances in detail. In this way, the system health can be determined, adapted and improved in a continuous process. Using real-time information and reporting functions is essential to anticipate, detect, and respond to system and power quality problems, and service disruptions.Therefore, reliable data assessment is the fi rst priority in this scenario.The varieties of available parameters that lead to a wide grid analysis and power excellence is large and can be grouped into the following disciplines:
Grid monitoringThe need for monitoring and recording at the transmission level has been recognized for a long time. The experience with centralized disturbance recording systems has shown how valuable this information is in order to allow for a better understanding of the steady-state and dynamic behavior of the system. Nevertheless, as already explained, the complexity of electrical power systems has increased, and in the actual interconnected power system infl uences an wide area monitoring has become essential. Grid monitoring is therefore about the understanding what is going on in particular cases, considering the wide grid cir-cumstances, where fault location, protection behavior and system stability, through phasors measurement monitoring are analyzed. Fault recorders and phasor measurement units (PMU) are devices used for this discipline.
Power plantPower plant
Wind
Wind
Wind
PV
PV
Transmission network
Energystore
Energystore
Energystore
Energystore
Energystore
Industry
Industry
DistributionnetworkDistribution network
1-kV network
1-kV network
1-kV network
1-kV network CHPsystem
CHPsystem Car
CarOffice building,
CHP systemOffice building,
CHP system
Office building,PV,
energy store,CHP system
Office building,PV,
energy store,CHP system
Households,PV,
energy store,CHP system
Households,PV,
energy store,CHP system
Households,CHP system,
car
PQ11-0015.EN.ai
Households,CHP system,
car
Fig. 1/1 The modern power grid
1
2
3
4
5
6
7
8
9
Introduction
1/5Power Quality and Measurements Product Catalog · Siemens SR 10 · Edition 2
Power quality – Smart grids
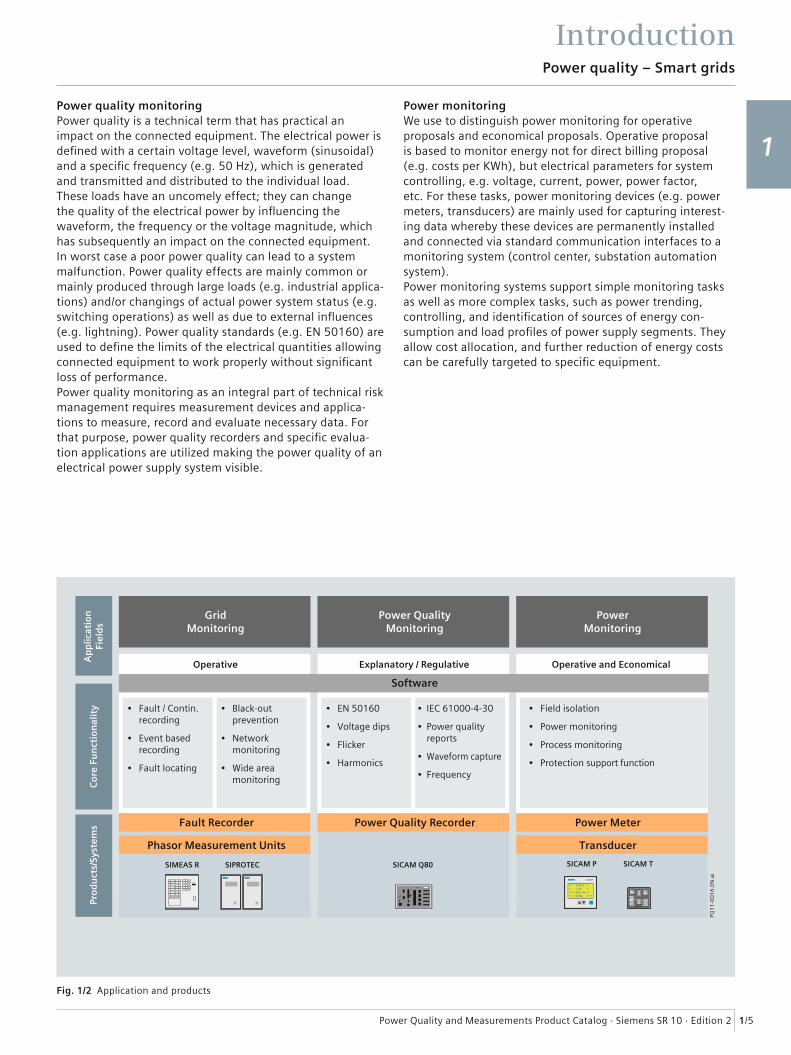
Power quality monitoringPower quality is a technical term that has practical an impact on the connected equipment. The electrical power is defi ned with a certain voltage level, waveform (sinusoidal) and a specifi c frequency (e.g. 50 Hz), which is generated and transmitted and distributed to the individual load. These loads have an uncomely effect; they can change the quality of the electrical power by infl uencing the waveform, the frequency or the voltage magnitude, which has subsequently an impact on the connected equipment. In worst case a poor power quality can lead to a system malfunction. Power quality effects are mainly common or mainly produced through large loads (e.g. industrial applica-tions) and/or changings of actual power system status (e.g. switching operations) as well as due to external infl uences (e.g. lightning). Power quality standards (e.g. EN 50160) are used to defi ne the limits of the electrical quantities allowing connected equipment to work properly without signifi cant loss of performance. Power quality monitoring as an integral part of technical risk management requires measurement devices and applica-tions to measure, record and evaluate necessary data. For that purpose, power quality recorders and specifi c evalua-tion applications are utilized making the power quality of an electrical power supply system visible.
Power monitoringWe use to distinguish power monitoring for operative proposals and economical proposals. Operative proposal is based to monitor energy not for direct billing proposal (e.g. costs per KWh), but electrical parameters for system controlling, e.g. voltage, current, power, power factor, etc. For these tasks, power monitoring devices (e.g. power meters, transducers) are mainly used for capturing interest-ing data whereby these devices are permanently installed and connected via standard communication interfaces to a monitoring system (control center, substation automation system).Power monitoring systems support simple monitoring tasks as well as more complex tasks, such as power trending, controlling, and identifi cation of sources of energy con-sumption and load profi les of power supply segments. They allow cost allocation, and further reduction of energy costs can be carefully targeted to specifi c equipment.
Co
re F
un
ctio
nal
ity
Ap
plic
atio
nFi
eld
sPr
od
uct
s/Sy
stem
s Fault Recorder Power Quality Recorder Power Meter
TransducerPhasor Measurement Units
GridMonitoring
Power QualityMonitoring
Software
PowerMonitoring
Operative
SIMEAS R SICAM Q80 SICAM P SICAM T
Operative and EconomicalExplanatory / Regulative
SIPROTEC
SICAM
Fig. 1/2 Application and products
1
2
3
4
5
6
7
8
9

Introduction
Power Quality and Measurements Product Catalog · Siemens SR 10 · Edition 21/6
Product overview – Power monitoring
The world’s increasing demand for electric power calls for highest effi ciency and absolute reliability in power networks. Today, currents, voltages and performance values in power distribution systems are routinely measured in order to determine the load. It is important to ensure that no overloading occurs. However, the need for measur-ing currents, voltages and performance values for the purpose of increasing system availability are nowhere near exhausted. There is tremendous potential here for installing power meters and transducers to support the necessary measurement tasks.Additionally, Smart Grid technology provides consistent answers to these challenges, but requires use of tech-nologies that can respond to the requirements mentioned. E.g. fast controlling reaction, local monitoring, high accuracy, and open communication for system integration capabilities are essential features in this context.Siemens power monitoring solutions are designed to match these applications. They are user-friendly, compatible with the latest communication standards, impart long-term reliability, and provide comprehensive power monitoring functionalities.
Power Meter – SICAM PSICAM P is a power meter for panel or standard DIN-rail mounting that is used for acquiring and/or displaying measured values in electrical power supply systems. More than 100 values can be measured, including phase voltages and currents, active power, reactive power, apparent power, symmetry factor, voltage and current harmonics, energy output, as well as external signals and states. SICAM P shows this data on the graphic display and transfers it to a central computer system for further processing via either PROFIBUS DP or MODBUS RTU/ASCII and IEC 60870-5-103.
In addition, measured values, including time information, can be stored in the memory. This information can be read out with the SICAM P Manager parameterization software, displayed, evaluated, and converted to csv data or COMTRADE format.
Electrical measurement transducer – SICAM TPower transducer applications are not new to electrical systems, but today more than ever they are required to deliver precise and fast measurement data. They need to be user-friendly, compatible with the latest communica-tion standards, impart long-term reliability, and provide comprehensive functionality at a reasonable price. This is exactly what the Siemens SICAM T has to offer. It makes 60 measured or calculated parameters available, and any of these fi gures can be assigned to each of the SICAM T’s four analog outputs with 120 ms response time for 50 Hz signals.Its comprehensive communication abilities make SICAM Tthe power transducer of fi rst choice for utilities as well as for industry customers. They include MODBUS TCP, MODBUS RTU, IEC 60870-5-103 and IEC 61850, which allow seamless system and SCADA integration through Ethernet or RS485.External time synchronization via Ethernet NTP or via fi eld bus using MODBUS RTU or IEC 60870-5-103 is also available.Thanks to its comprehensive on-board parameterization and visualization tool, the user friendly SICAM T can easily be parameterized and operated through the Web browser of any PC or notebook without the need for any extra software installation.
Fig. 1/3 SICAM P – Power meters
LSP_
28
23
_SIC
AM
_P5
0.t
if
SR1
0-0
01
.tif
Fig. 1/4 SICAM T electrical measurement transducer
1
2
3
4
5
6
7
8
9
Introduction
Power Quality and Measurements Product Catalog · Siemens SR 10 · Edition 2 1/7
Product overview – Power monitoring
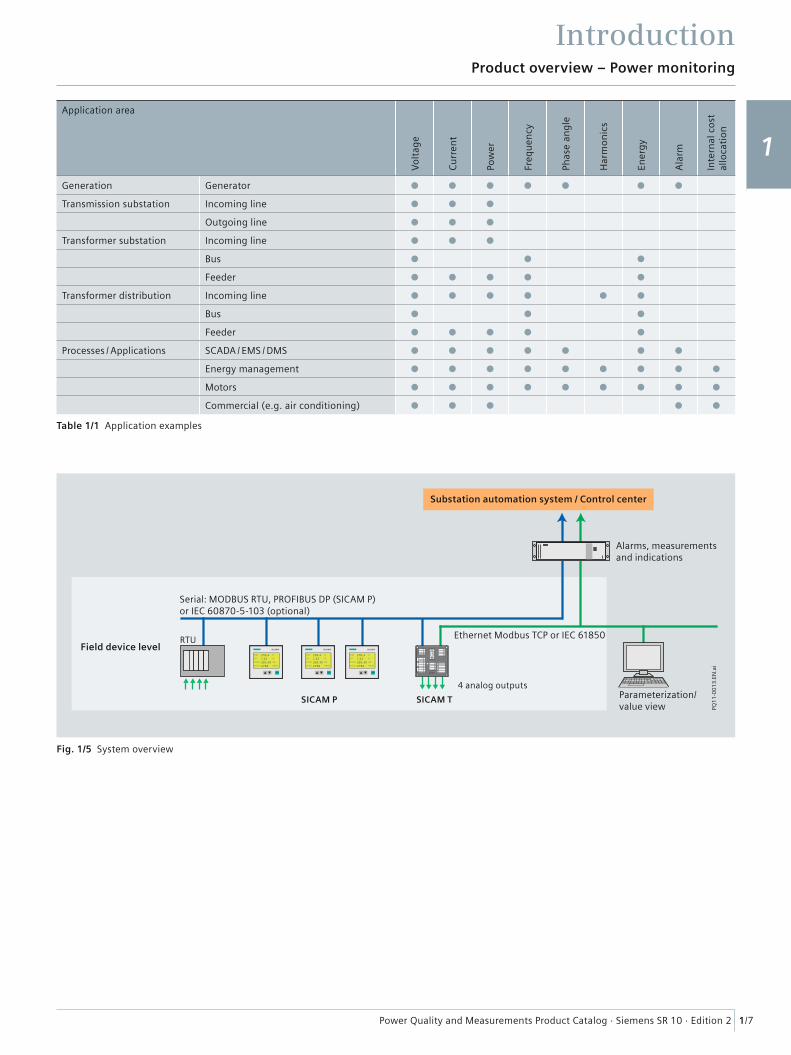
Table 1/1 Application examples
Application area
Vo
ltag
e
Cu
rren
t
Pow
er
Freq
uen
cy
Phas
e an
gle
Har
mo
nic
s
Ener
gy
Ala
rm
Inte
rnal
co
st
allo
cati
on
Generation Generator
Transmission substation Incoming line
Outgoing line
Transformer substation Incoming line
Bus
Feeder
Transformer distribution Incoming line
Bus
Feeder
Processes / Applications SCADA / EMS / DMS
Energy management
Motors
Commercial (e.g. air conditioning)
RTU
SICAM TSICAM P
SICAM P SICAM P SICAM P
SICAM T
Ethernet Modbus TCP or IEC 61850
4 analog outputsParameterization/value view
Alarms, measurementsand indications
Substation automation system / Control center
Serial: MODBUS RTU, PROFIBUS DP (SICAM P)or IEC 60870-5-103 (optional)
Field device level
PQ1
1-0
01
3.E
N.a
i
Fig. 1/5 System overview
1
2
3
4
5
6
7
8
9
Introduction
Power Quality and Measurements Product Catalog · Siemens SR 10 · Edition 21/8
Product overview – Power monitoring
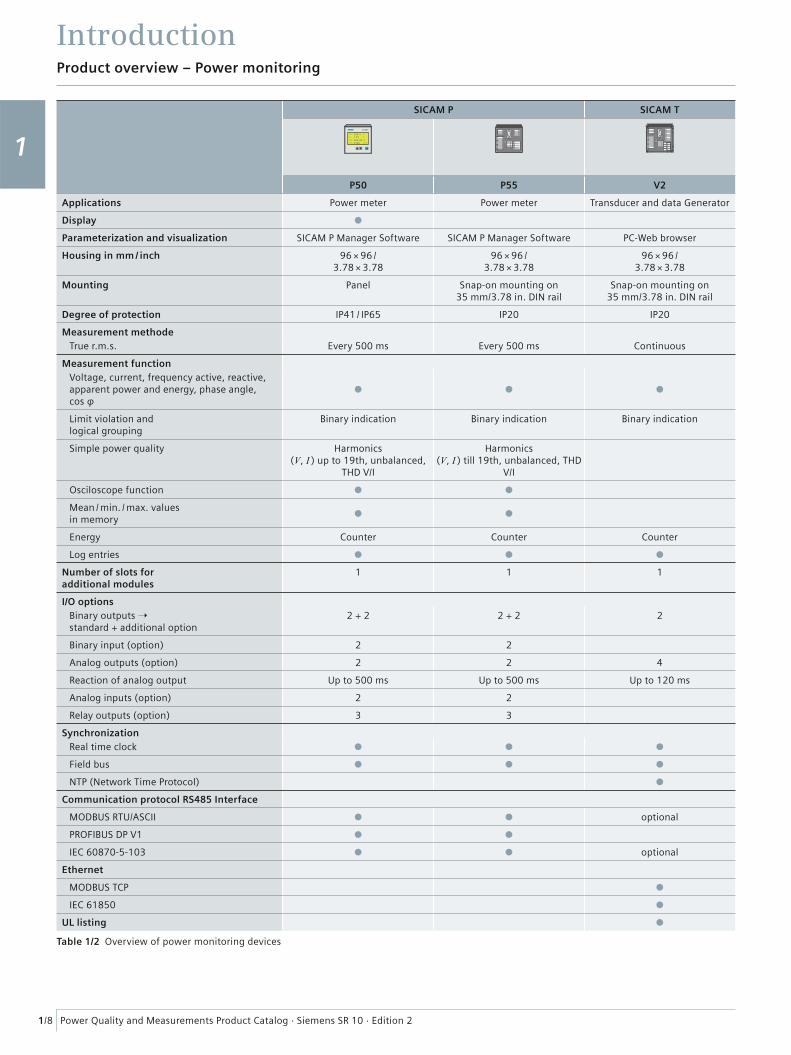
SICAM P SICAM T
SICAM P
P50 P55 V2
Applications Power meter Power meter Transducer and data Generator
Display
Parameterization and visualization SICAM P Manager Software SICAM P Manager Software PC-Web browser
Housing in mm / inch 96 × 96 / 3.78 × 3.78
96 × 96 / 3.78 × 3.78
96 × 96 / 3.78 × 3.78
Mounting Panel Snap-on mounting on 35 mm/3.78 in. DIN rail
Snap-on mounting on 35 mm/3.78 in. DIN rail
Degree of protection IP41 / IP65 IP20 IP20
Measurement methodeTrue r.m.s. Every 500 ms Every 500 ms Continuous
Measurement functionVoltage, current, frequency active, reactive, apparent power and energy, phase angle, cos φ
Limit violation and logical grouping
Binary indication Binary indication Binary indication
Simple power quality Harmonics (V, I ) up to 19th, unbalanced,
THD V/I
Harmonics (V, I ) till 19th, unbalanced, THD
V/I
Osciloscope function
Mean / min. / max. values in memory
Energy Counter Counter Counter
Log entries
Number of slots for additional modules
1 1 1
I/O optionsBinary outputs ➝ standard + additional option
2 + 2 2 + 2 2
Binary input (option) 2 2
Analog outputs (option) 2 2 4
Reaction of analog output Up to 500 ms Up to 500 ms Up to 120 ms
Analog inputs (option) 2 2
Relay outputs (option) 3 3
SynchronizationReal time clock
Field bus
NTP (Network Time Protocol)
Communication protocol RS485 Interface
MODBUS RTU/ASCII optional
PROFIBUS DP V1
IEC 60870-5-103 optional
Ethernet
MODBUS TCP
IEC 61850
UL listing
Table 1/2 Overview of power monitoring devices
1
2
3
4
5
6
7
8
9
Energy Automation
Answers for infrastructure and cities.
SICAM P Power Monitoring Devices

Power Quality and Measurements Product Catalog · Siemens SR 10 · Edition 22/2
Contents – SICAM P
Page
Function overview, description 2/3
Measured values and tolerances 2/6
SICAM P50 / P55 2/7
Description of I/O modules 2/8
Confi guration software 2/9
Application 2/11
Typical terminal assignments 2/12
Technical data 2/13
Dimension drawings 2/14
Selection and ordering data 2/15
1
2
3
4
5
6
7
8
9

Products – SICAM P
Power Quality and Measurements Product Catalog · Siemens SR 10 · Edition 2 2/3
Function overview, description
OverviewSICAM P is a power meter for panel mounting with graphicdisplay and background illumination, or for standard railmounting, used for acquiring and/or displaying measuredvalues in electrical power supply systems.More than 100 values can be measured, including r.m.s.values of voltages (phase-to-phase and/or phase-toground), currents, active, reactive and apparent powerand energy, power factor, phase angle, harmonics ofcurrents and voltages, total harmonic distortion per phaseplus frequency and symmetry factor, energy output, aswell as external signals and states.SICAM P is available with mounting dimensions of 96 mm × 96 mm/3.78 in. x 3.78 in. and can be ordered with or without display.The SICAM P comes standard with two binary outputs,which can be confi gured for energy counters, limit viola-tions or status signals. By ordering, SICAM P can be fi tted with 1 additional analog input or output module. The unit is also able to trigger on settable limits. Thisfunction can be programmed for sampled or r.m.s. values.SICAM P generates a list of minimum, average and maxi-mum values for currents, voltages, power, energy, etc.lndependent settings for currents, voltages, active andreactive power, power factor, etc. are also possible. In caseof a violation of these limits, the unit generates alarms. Upto 6 alarm groups can be defi ned using AND/OR for logicalcombinations. The alarms can be used to increase countervalues, to trigger the oscilloscope function, to generatebinary output pulses, etc.
Function overview• Measurement of voltage, current, active & reactive power,
frequency, active & reactive energy, power factor, symme-try factor, voltage and current harmonics up to the 21st, total harmonic distortion.
• Single-phase, three-phase balanced or unbalanced connection, four-wire connection
• Communications: PROFIBUS-DP, MODBUS RTU / ASCII or IEC 60870-5-103 communication protocol
• Simple parameterization via front key or RS485 communi-cation port using SICAM P Manager software
• Graphic display with background illumination with up to 20 programmable screens
• Real-time clock: Measured values and states will be recorded with time stamps.
• 1 MB memory management: The allocation of the non-volatile measurement memory is programmable.
• Recording and display of limit value violations and log entries.
• Battery: Recordings like limit value violations or energy counter values stay safely in the memory up to 3 months in case of a blackout.
ApplicationsPower monitoring systems with SICAM P, a permanently installed system, enables continuous logging of energy-related data and provides information on operational characteristics of electrical systems. SICAM P helps identify sources of energy consumption and time of peak consump-tion. This knowledge allows to allocate and reduce energy costs.The major application area is power monitoring and record-ing at MV and LV level. The major information types are measured values, alarms and status information.
Description of SICAM P
Measuring functionsMeasured input voltages and input currents are sampled for calculation of the corresponding r.m.s. values. All parameters derived from the measured values are calculated by a processor. They can be displayed on the screens and/or transmitted via the serial interface.Measurement of voltage, current, active & reactive power, frequency, active & reactive energy, power factor, symmetry factor, voltage and current harmonics up to the 21st, total harmonic distortion are available.With the SICAM P it is also possible to defi ne several limit value groups with different limit values for the measured parameters. These can be combined with logical elements, such as AND, OR. Violations are counted and indicated on the screen or made available at the binary outputs. Triggering of the oscilloscope is possible as well.
QualityDevelopment and production of the device is carried out in accordance with ISO 9001, ensuring highest quality stan-dard. That means high system reliability and product service life. Further characteristics are the constant high accuracy over years, CE designation, EMC strength, as well as the compliance with all relevant national and international standards.
Fig. 2/1 SICAM P – power meter
LSP_
28
23
_SIC
AM
_P5
0.t
if
1
2
3
4
5
6
7
8
9
Products – SICAM P
Power Quality and Measurements Product Catalog · Siemens SR 10 · Edition 22/4
Description
TechnologyPowerful on-board microprocessors ensure fast registration and updating of measured parameters.SICAM P can be connected to any power system confi gura-tion directly (up to 690 V systems) or via transformer – from single-phase to four-wire balanced or unbalanced three-phase systems. SICAM P can be connected to any power system confi guration up to 1 or 5 A or via current transformer.The power supply unit allows rated supply voltages from 24 to 250 V DC and 100 to 230 V AC.
CommunicationAs communication between fi eld devices is becoming standard, the development of the SICAM P communication interface is focused on the universality and fl exibility of the transmission protocol. It is connected via an RS485 port with standard 9-pin SUB-D connector.The SICAM P comes with the following standard communi-cation protocols:• PROFIBUS-DP V1 in compliance with EN 50170 Volume 2
and MODBUS RTU/ASCII • MODBUS RTU/ASCII and IEC 60870-5-103.
Limit valuesSeveral limit value groups with up to 6 selectable param-eters can be set in SICAM P. The values can be combined with logical elements such as AND/OR; limit value violations are counted, they are available at binary outputs or used for triggering the oscilloscope.
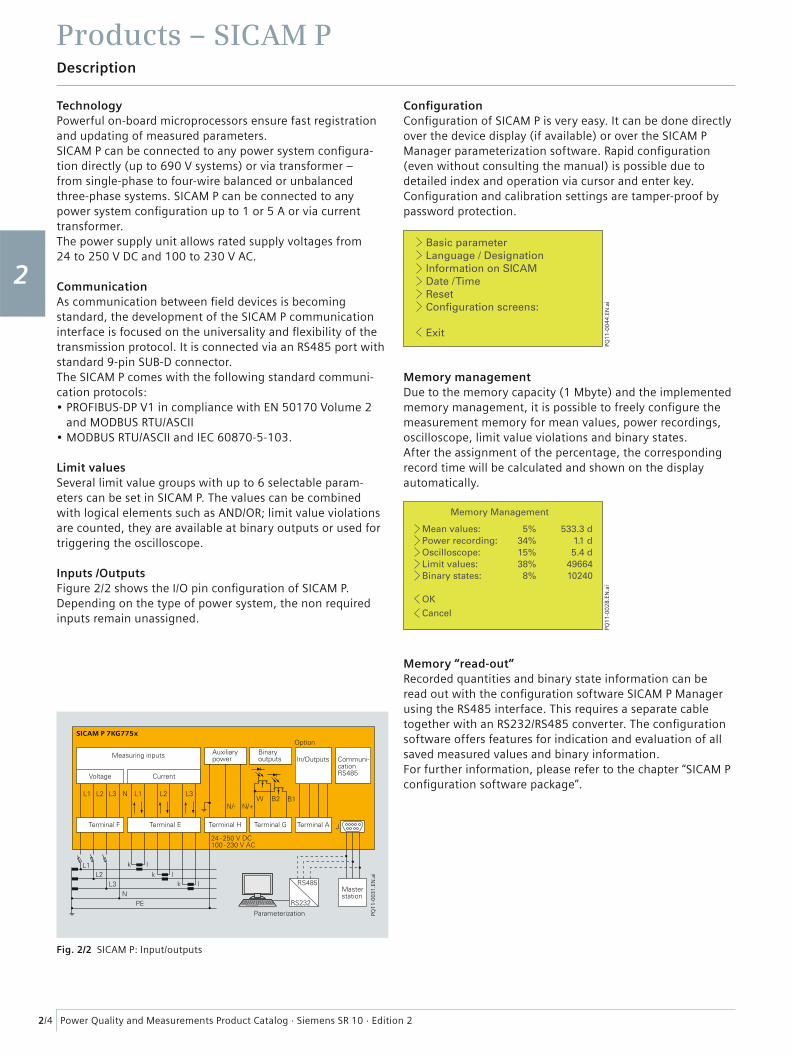
Inputs /OutputsFigure 2/2 shows the I/O pin confi guration of SICAM P. Depending on the type of power system, the non required inputs remain unassigned.
Confi gurationConfi guration of SICAM P is very easy. It can be done directly over the device display (if available) or over the SICAM P Manager parameterization software. Rapid confi guration (even without consulting the manual) is possible due to detailed index and operation via cursor and enter key. Confi guration and calibration settings are tamper-proof by password protection.
Memory managementDue to the memory capacity (1 Mbyte) and the implemented memory management, it is possible to freely confi gure the measurement memory for mean values, power recordings, oscilloscope, limit value violations and binary states.After the assignment of the percentage, the corresponding record time will be calculated and shown on the display automatically.
Memory “read-out”Recorded quantities and binary state information can be read out with the confi guration software SICAM P Manager using the RS485 interface. This requires a separate cable together with an RS232/RS485 converter. The confi guration software offers features for indication and evaluation of all saved measured values and binary information.For further information, please refer to the chapter “SICAM P confi guration software package”.
PQ1
1-0
03
1.E
N.a
i
SICAM P 7KG775x
PQ1
1-0
02
8.E
N.a
i
Fig. 2/2 SICAM P: Input/outputs
PQ1
1-0
04
4.E
N.a
i
1
2
3
4
5
6
7
8
9

Products – SICAM P
Power Quality and Measurements Product Catalog · Siemens SR 10 · Edition 2 2/5
Description
Display and screensAll parameters can be displayed on the SICAM P screens as required by the user. Up to 20 screens can be defi ned and selected with the front keys. Switching from one screen to another can be automatic or manual.Clear designations as well as menu-driven confi guration guarantee simple and easy operation of the SICAM P screens. Number, type, content and sequence of the screens are confi gurable, e.g.:• 2, 3, 4 or 6 measured values in one screen• One list screen for minimum, average and maximum values• Screens for harmonics• Screen serving as phasor (vector) diagram.Due to a wider graphical display, some display functionssuch as analog screen, oscilloscope, r.m.s. curve, harmonic are available. SICAM P is delivered with programmed default settings. A status line displayed in the measured value screens indicates status, interfacing and diagnostic messages of SICAM P. The display is automatically refreshed every 1 s.
List of screens examples
3-phase screen values
PQ1
1-0
03
7.E
N.a
i
V, I, cos φ
Digital values screen
PQ1
1-0
03
6.E
N.a
i
3 measured values – digital / analog
Digital / Analog screen
PQ1
1-0
03
5.E
N.a
i
4 measured values – digital
Digital values screen
PQ1
1-0
03
3.E
N.a
i
2 measured values – digital
1
2
3
4
5
6
7
8
9
Products – SICAM P
Power Quality and Measurements Product Catalog · Siemens SR 10 · Edition 22/6
Measured values and tolerances
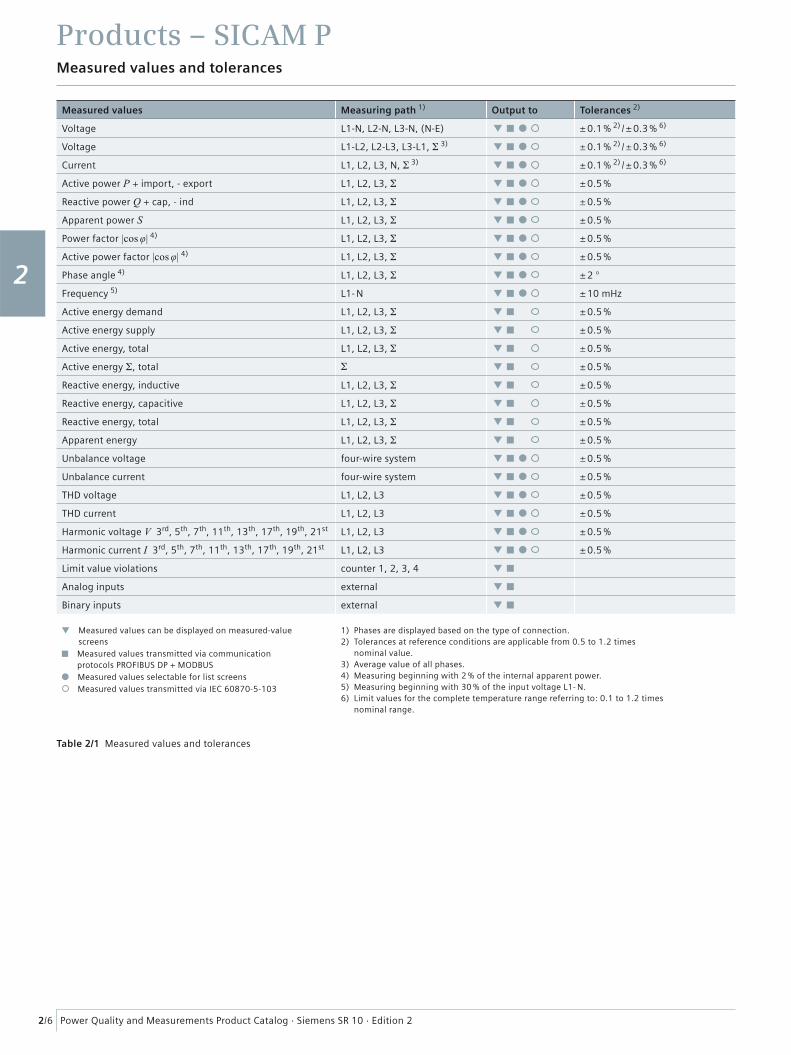
Measured values Measuring path 1) Output to Tolerances 2)
Voltage L1-N, L2-N, L3-N, (N-E) ± 0.1 % 2) / ± 0.3 % 6)
Voltage L1-L2, L2-L3, L3-L1, Σ 3) ± 0.1 % 2) / ± 0.3 % 6)
Current L1, L2, L3, N, Σ 3) ± 0.1 % 2) / ± 0.3 % 6)
Active power P + import, - export L1, L2, L3, Σ ± 0.5 %
Reactive power Q + cap, - ind L1, L2, L3, Σ ± 0.5 %
Apparent power S L1, L2, L3, Σ ± 0.5 %
Power factor |cos φ| 4) L1, L2, L3, Σ ± 0.5 %
Active power factor |cos φ| 4) L1, L2, L3, Σ ± 0.5 %
Phase angle 4) L1, L2, L3, Σ ± 2 °
Frequency 5) L1- N ± 10 mHz
Active energy demand L1, L2, L3, Σ ± 0.5 %
Active energy supply L1, L2, L3, Σ ± 0.5 %
Active energy, total L1, L2, L3, Σ ± 0.5 %
Active energy Σ, total Σ ± 0.5 %
Reactive energy, inductive L1, L2, L3, Σ ± 0.5 %
Reactive energy, capacitive L1, L2, L3, Σ ± 0.5 %
Reactive energy, total L1, L2, L3, Σ ± 0.5 %
Apparent energy L1, L2, L3, Σ ± 0.5 %
Unbalance voltage four-wire system ± 0.5 %
Unbalance current four-wire system ± 0.5 %
THD voltage L1, L2, L3 ± 0.5 %
THD current L1, L2, L3 ± 0.5 %
Harmonic voltage V 3rd, 5th, 7th, 11th, 13th, 17th, 19th, 21st L1, L2, L3 ± 0.5 %
Harmonic current I 3rd, 5th, 7th, 11th, 13th, 17th, 19th, 21st L1, L2, L3 ± 0.5 %
Limit value violations counter 1, 2, 3, 4
Analog inputs external
Binary inputs external
Measured values can be displayed on measured-value screens
Measured values transmitted via communication protocols PROFIBUS DP + MODBUS
Measured values selectable for list screens Measured values transmitted via IEC 60870-5-103
1) Phases are displayed based on the type of connection.2) Tolerances at reference conditions are applicable from 0.5 to 1.2 times
nominal value.3) Average value of all phases.4) Measuring beginning with 2 % of the internal apparent power.5) Measuring beginning with 30 % of the input voltage L1- N.6) Limit values for the complete temperature range referring to: 0.1 to 1.2 times
nominal range.
Table 2/1 Measured values and tolerances
1
2
3
4
5
6
7
8
9
Products – SICAM P
Power Quality and Measurements Product Catalog · Siemens SR 10 · Edition 2 2/7
SICAM P50 / P55
SICAM P50 / P55
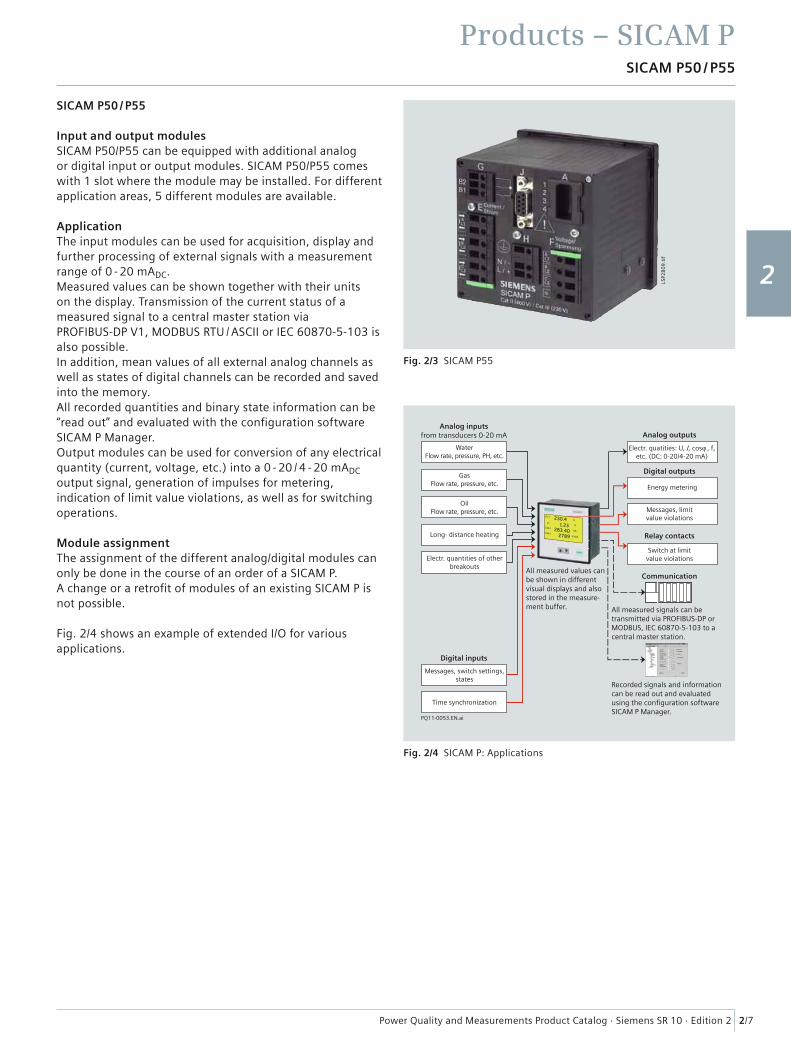
Input and output modulesSICAM P50/P55 can be equipped with additional analog or digital input or output modules. SICAM P50/P55 comes with 1 slot where the module may be installed. For different application areas, 5 different modules are available.
ApplicationThe input modules can be used for acquisition, display and further processing of external signals with a measurement range of 0 - 20 mADC.Measured values can be shown together with their units on the display. Transmission of the current status of a measured signal to a central master station via PROFIBUS-DP V1, MODBUS RTU / ASCII or IEC 60870-5-103 is also possible.In addition, mean values of all external analog channels as well as states of digital channels can be recorded and saved into the memory.All recorded quantities and binary state information can be “read out” and evaluated with the confi guration software SICAM P Manager.Output modules can be used for conversion of any electrical quantity (current, voltage, etc.) into a 0 - 20 / 4 - 20 mADC output signal, generation of impulses for metering, indication of limit value violations, as well as for switching operations.
Module assignmentThe assignment of the different analog/digital modules can only be done in the course of an order of a SICAM P.A change or a retrofi t of modules of an existing SICAM P is not possible.
Fig. 2/4 shows an example of extended I/O for various applications.
Analog inputsfrom transducers 0-20 mA Analog outputs
Digital outputs
Relay contacts
Communication
All measured signals can betransmitted via PROFIBUS-DP orMODBUS, IEC 60870-5-103 to acentral master station.
All measured values canbe shown in differentvisual displays and alsostored in the measure-ment buffer.
Recorded signals and informationcan be read out and evaluatedusing the configuration softwareSICAM P Manager.
Electr. quatities: U, , cos , f,etc. (DC: 0-20/4-20 mA)
Messages, limitvalue violations
Switch at limitvalue violations
Energy metering
WaterFlow rate, pressure, PH, etc.
GasFlow rate, pressure, etc.
OilFlow rate, pressure, etc.
Electr. quantities of otherbreakouts
Messages, switch settings,states
Time synchronization
PQ11-0053.EN.ai
Digital inputs
Long- distance heating
Fig. 2/4 SICAM P: Applications
LSP2
80
9.t
if
Fig. 2/3 SICAM P55
LSP2
80
9.t
if
1
2
3
4
5
6
7
8
9
Products – SICAM P
Power Quality and Measurements Product Catalog · Siemens SR 10 · Edition 22/8
Description of I/O modules
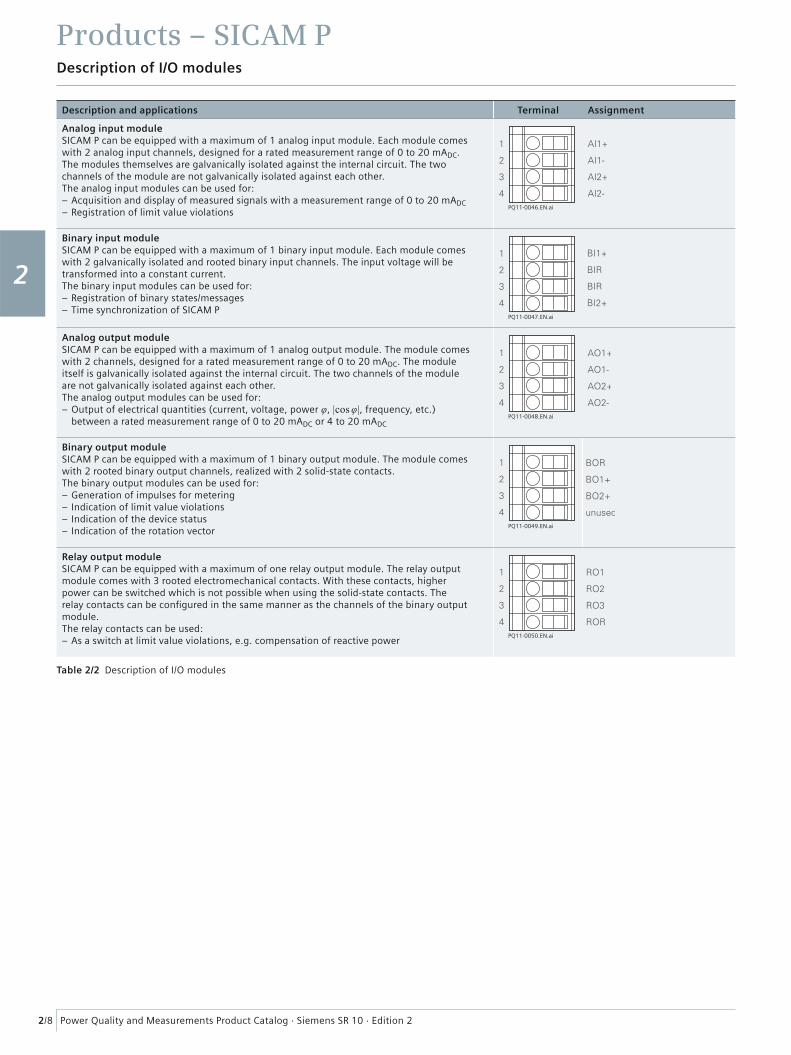
Description and applications Terminal Assignment
Analog input moduleSICAM P can be equipped with a maximum of 1 analog input module. Each module comes with 2 analog input channels, designed for a rated measurement range of 0 to 20 mADC. The modules themselves are galvanically isolated against the internal circuit. The two channels of the module are not galvanically isolated against each other.The analog input modules can be used for:– Acquisition and display of measured signals with a measurement range of 0 to 20 mADC– Registration of limit value violations
PQ11-0046.EN.ai
Binary input moduleSICAM P can be equipped with a maximum of 1 binary input module. Each module comes with 2 galvanically isolated and rooted binary input channels. The input voltage will be transformed into a constant current.The binary input modules can be used for:– Registration of binary states/messages– Time synchronization of SICAM P
PQ11-0047.EN.ai
Analog output moduleSICAM P can be equipped with a maximum of 1 analog output module. The module comes with 2 channels, designed for a rated measurement range of 0 to 20 mADC. The module itself is galvanically isolated against the internal circuit. The two channels of the module are not galvanically isolated against each other.The analog output modules can be used for:– Output of electrical quantities (current, voltage, power φ, |cos φ|, frequency, etc.)
between a rated measurement range of 0 to 20 mADC or 4 to 20 mADCPQ11-0048.EN.ai
Binary output moduleSICAM P can be equipped with a maximum of 1 binary output module. The module comes with 2 rooted binary output channels, realized with 2 solid-state contacts.The binary output modules can be used for:– Generation of impulses for metering– Indication of limit value violations– Indication of the device status– Indication of the rotation vector
PQ11-0049.EN.ai
Relay output moduleSICAM P can be equipped with a maximum of one relay output module. The relay output module comes with 3 rooted electromechanical contacts. With these contacts, higher power can be switched which is not possible when using the solid-state contacts. The relay contacts can be confi gured in the same manner as the channels of the binary output module.The relay contacts can be used:– As a switch at limit value violations, e.g. compensation of reactive power
PQ11-0050.EN.ai
Table 2/2 Description of I/O modules
1
2
3
4
5
6
7
8
9

Products – SICAM P
Power Quality and Measurements Product Catalog · Siemens SR 10 · Edition 2 2/9
Confi guration software
Confi guration software
ApplicationThe SICAM P confi guration software package enables a simple way to carry out the device settings. The package consists of the parameterizing software, a confi guration cable with RS232/RS485 converter, as well as a plug-in power supply for the converter. The SICAM P can be con-nected to any standard PC via the RS232/RS485 converter by means of a 9-pin SUB-D connector.The software runs with Windows 2000 and XP Professional edition.The confi guration software permits a faster confi gurationof the SICAM P devices. The user can set and store para-meters even without having a unit by his side. The parameters are transferred to the SICAM P by using the “Send to unit” command. Thus, a number of SICAM P units can be confi gured with minimum effort. The stored set of parameters is simply reloaded when a unit has to be replaced. Furthermore, fi rmware updates can be reloaded by means of the SICAM P confi guration software.The confi guration package supports all SICAM P units and is absolutely essential for the devices SICAM P55.
Confi guration of the measurement memoryDevices with measurement buffer offer the opportunity to record measured quantities and state information. Therefore, the confi guration software enables menu items for the determination of values and state information which should be recorded.
Memory read-out (Fig. 2/6)Separate functions integrated in the confi guration software, enable a read-out of the following information:• Mean values• Mean values of power• Oscilloscope recordings• State information of binary channels• Limit value violations• Log entries
PQ1
1-0
05
1.a
i
SICAM P
LSP2
50
1en
.tif
LSP2
50
2en
.tif
Fig. 2/5 Confi gurationLS
P25
03
en.t
if
Fig. 2/6 Confi guration of the measurement memory
1
2
3
4
5
6
7
8
9

Products – SICAM P
Power Quality and Measurements Product Catalog · Siemens SR 10 · Edition 22/10
Confi guration software
Display and evaluation (Fig. 2/7 / Fig. 2/8)All values and information read out via the software are shown automatically in tabular and graphical form together with the time stamp on the screen.The context menu offers some functions (masking of signals, copy, zoom, measuring functions) for easy analysis of measured values and state information.The following measured values can be shown in graphical form:• Mean values of voltage and current• Mean values of power• Oscilloscope recordings• State information of binary channels
The following information is shown in tabular form:• Limit value violations• Log entries
Export functionThe software also enables a function for the export of transmitted values and state information into an ASCII fi le. This ASCII fi le can be used in other applications, e.g. MS-Excel. Oscilloscope recordings can be exported into COMTRADE formatted fi les.
LSP2
91
8.t
if
Fig. 2/7 Oscilloscope view for evaluation
LSP2
49
2en
.tif
Fig. 2/8 Display and evaluation
1
2
3
4
5
6
7
8
9

Products – SICAM P
Power Quality and Measurements Product Catalog · Siemens SR 10 · Edition 2 2/11
Application
Application
Application example 1 (Fig. 2/9)SICAM P as a panel-mounted device for direct electrical power monitoring. With a very simple confi guration, the display of measured values is adaptable to the specifi c requirements of the user.
Application example 2 (Fig. 2/10)SICAM P as a panel-mounted or snap-on mounted device for use on a process bus.Network linking is possible with the integrated RS485 port with the standard PROFIBUS-DP and MODBUS RTU/ASCII communication protocol. Furthermore, it is also possible to integrate SICAM P50 into communication networks with IEC 60870-5-103 as standard protocol. That allows several SICAM P measured parameters to be indicated, evaluated and processed at a central master station.The major application area is the integration into PLC systems as a transducer.
Application example 3 (Fig. 2/11)SICAM P can be ordered for snap-on mounting on a 35 mm/1.38 in. DIN rail. For carrying out the setting of the device, the confi guration software is necessary.
Benefi tsA properly designed and installed monitoring system with SICAM P has numerous benefi ts, including:• Environment
A better knowledge of how energy is used within a facility allows to identify an array of prospects to improve effi ciency, minimize waste, and reduce energy consump-tion, thereby allowing the facility to be a better steward of its allotted natural resources.
• ReliabilityAssessment of data in the master station through PROFIBUS-DP, MODBUS RTU/ASCII or IEC 60870-5-103 protocols from the SICAM Ps can reveal existing or imminent issues that can affect the operation and product within a facility. Historical data from power monitoring systems can help locate and optimize the productivity.
• SafetyMonitoring systems can limit the exposure of personnel to potentially hazardous electrical environments by provid-ing remote status and operational parameters of equip-ment within hazardous areas. Some monitoring devices also offer a variety of additional parameters (temperature, pressure, fl ow rate, vibration, status indicators, etc.) through the use of I/O modules of the SICAM P.
• FinancialEach benefi t discussed above either directly or indirectly infl uences a business’ bottom line. In most cases, the mon-etary impact from even one or two benefi ts can quickly justify the purchase and installation of a power monitoring system with SICAM P.
Fig. 2/9 SICAM P with graphic display for panel mounting
LSP2
80
5.t
if
SICAM P SICAM P SICAM P SICAM P SICAM P
PQ11-0052.EN.ai Device withoutdisplay
Otherfield
devices
Fig. 2/10 SICAM P with PROFIBUS-DP, MODBUS and IEC 60870-5-103
LSP2
80
9.t
if
Fig. 2/11 SICAM P55
LSP2
80
9.t
if
1
2
3
4
5
6
7
8
9
Products – SICAM P
Power Quality and Measurements Product Catalog · Siemens SR 10 · Edition 22/12
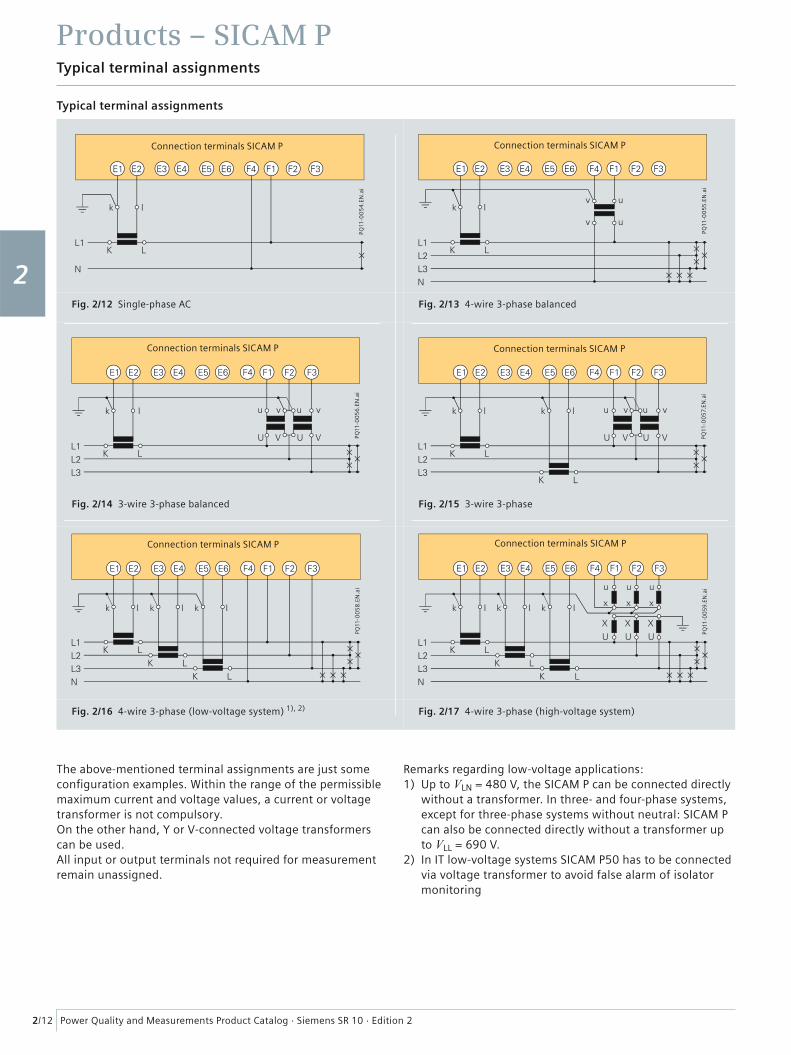
Typical terminal assignments
Typical terminal assignments
The above-mentioned terminal assignments are just some confi guration examples. Within the range of the permissiblemaximum current and voltage values, a current or voltage transformer is not compulsory.On the other hand, Y or V-connected voltage transformers can be used. All input or output terminals not required for measurement remain unassigned.
Remarks regarding low-voltage applications:1) Up to VLN = 480 V, the SICAM P can be connected directly
without a transformer. In three- and four-phase systems, except for three-phase systems without neutral: SICAM P can also be connected directly without a transformer up to VLL = 690 V.
2) In IT low-voltage systems SICAM P50 has to be connected via voltage transformer to avoid false alarm of isolator monitoring
Fig. 2/12 Single-phase AC
Fig. 2/14 3-wire 3-phase balanced
Fig. 2/16 4-wire 3-phase (low-voltage system) 1), 2)
Fig. 2/13 4-wire 3-phase balanced
Fig. 2/15 3-wire 3-phase
Fig. 2/17 4-wire 3-phase (high-voltage system)
PQ11
-00
54
.EN
.ai
Connection terminals SICAM P
PQ11
-00
56
.EN
.ai
Connection terminals SICAM PPQ
11-0
05
8.E
N.a
i
Connection terminals SICAM P
PQ11
-00
55
.EN
.ai
Connection terminals SICAM P
PQ11
-00
57.
EN.a
i
Connection terminals SICAM P
PQ11
-00
59.
EN.a
i
Connection terminals SICAM P
1
2
3
4
5
6
7
8
9
Products – SICAM P
Power Quality and Measurements Product Catalog · Siemens SR 10 · Edition 2 2/13
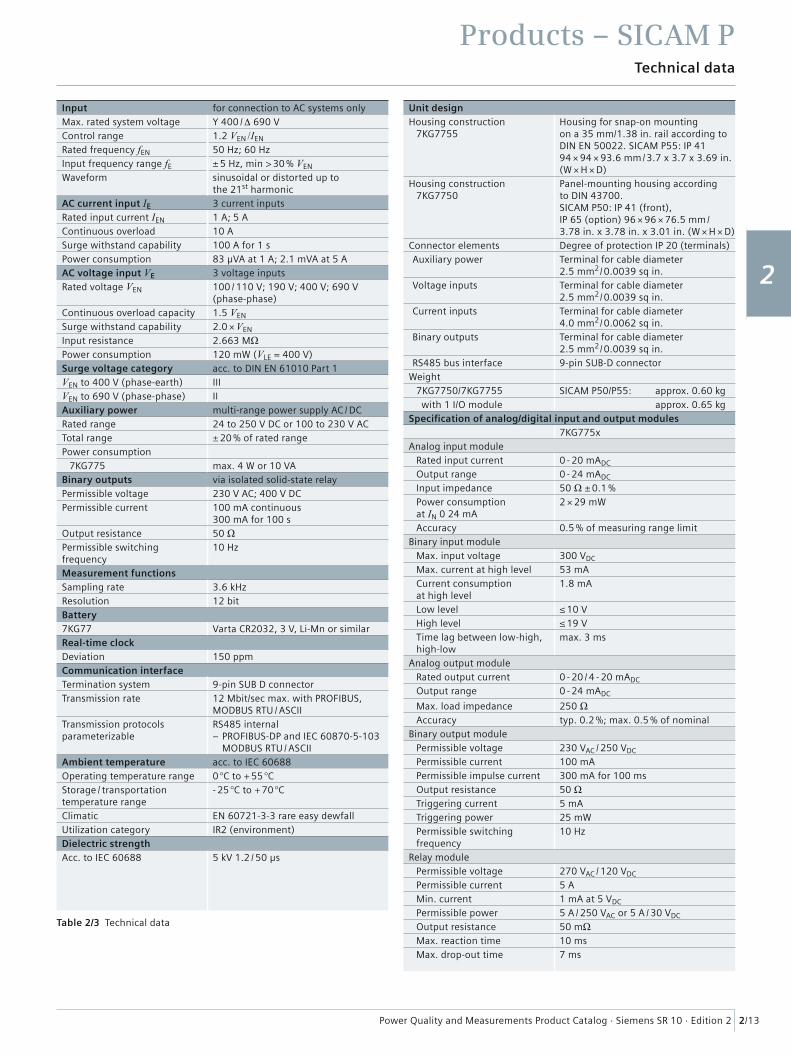
Technical data
Table 2/3 Technical data
Input for connection to AC systems onlyMax. rated system voltage Y 400 / Δ 690 VControl range 1.2 VEN /IEN
Rated frequency fEN 50 Hz; 60 HzInput frequency range fE ± 5 Hz, min > 30 % VEN
Waveform sinusoidal or distorted up to the 21st harmonic
AC current input IE 3 current inputsRated input current IEN 1 A; 5 AContinuous overload 10 ASurge withstand capability 100 A for 1 sPower consumption 83 μVA at 1 A; 2.1 mVA at 5 AAC voltage input VE 3 voltage inputsRated voltage VEN 100 / 110 V; 190 V; 400 V; 690 V
(phase-phase)Continuous overload capacity 1.5 VEN
Surge withstand capability 2.0 × VEN
Input resistance 2.663 MΩPower consumption 120 mW (VLE = 400 V)Surge voltage category acc. to DIN EN 61010 Part 1VEN to 400 V (phase-earth) IIIVEN to 690 V (phase-phase) IIAuxiliary power multi-range power supply AC / DCRated range 24 to 250 V DC or 100 to 230 V ACTotal range ± 20 % of rated rangePower consumption
7KG775 max. 4 W or 10 VABinary outputs via isolated solid-state relayPermissible voltage 230 V AC; 400 V DCPermissible current 100 mA continuous
300 mA for 100 sOutput resistance 50 ΩPermissible switching frequency
10 Hz
Measurement functionsSampling rate 3.6 kHzResolution 12 bitBattery7KG77 Varta CR2032, 3 V, Li-Mn or similarReal-time clockDeviation 150 ppmCommunication interfaceTermination system 9-pin SUB D connectorTransmission rate 12 Mbit/sec max. with PROFIBUS,
MODBUS RTU / ASCIITransmission protocolsparameterizable
RS485 internal– PROFIBUS-DP and IEC 60870-5-103
MODBUS RTU / ASCIIAmbient temperature acc. to IEC 60688Operating temperature range 0 °C to + 55 °CStorage / transportation temperature range
- 25 °C to + 70 °C
Climatic EN 60721-3-3 rare easy dewfallUtilization category IR2 (environment)Dielectric strengthAcc. to IEC 60688 5 kV 1.2 / 50 μs
Unit designHousing construction
7KG7755Housing for snap-on mounting on a 35 mm/1.38 in. rail according to DIN EN 50022. SICAM P55: IP 41 94 × 94 × 93.6 mm / 3.7 x 3.7 x 3.69 in. (W × H × D)
Housing construction7KG7750
Panel-mounting housing according to DIN 43700. SICAM P50: IP 41 (front), IP 65 (option) 96 × 96 × 76.5 mm/3.78 in. x 3.78 in. x 3.01 in. (W × H × D)
Connector elements Degree of protection IP 20 (terminals)Auxiliary power Terminal for cable diameter
2.5 mm2/ 0.0039 sq in.Voltage inputs Terminal for cable diameter
2.5 mm2/ 0.0039 sq in.Current inputs Terminal for cable diameter
4.0 mm2/ 0.0062 sq in.Binary outputs Terminal for cable diameter
2.5 mm2/ 0.0039 sq in.RS485 bus interface 9-pin SUB-D connector
Weight7KG7750/7KG7755 SICAM P50/P55: approx. 0.60 kg with 1 I/O module approx. 0.65 kg
Specifi cation of analog/digital input and output modules7KG775x
Analog input moduleRated input current 0 - 20 mADC
Output range 0 - 24 mADC
Input impedance 50 Ω ± 0.1 %Power consumption at IN 0 24 mA
2 × 29 mW
Accuracy 0.5 % of measuring range limitBinary input module
Max. input voltage 300 VDC
Max. current at high level 53 mACurrent consumption at high level
1.8 mA
Low level ≤ 10 VHigh level ≤ 19 VTime lag between low-high, high-low
max. 3 ms
Analog output moduleRated output current 0 - 20 / 4 - 20 mADC
Output range 0 - 24 mADC
Max. load impedance 250 ΩAccuracy typ. 0.2 %; max. 0.5 % of nominal
Binary output modulePermissible voltage 230 VAC / 250 VDC
Permissible current 100 mAPermissible impulse current 300 mA for 100 msOutput resistance 50 ΩTriggering current 5 mATriggering power 25 mWPermissible switching frequency
10 Hz
Relay modulePermissible voltage 270 VAC / 120 VDC
Permissible current 5 AMin. current 1 mA at 5 VDC
Permissible power 5 A / 250 VAC or 5 A / 30 VDC
Output resistance 50 mΩMax. reaction time 10 msMax. drop-out time 7 ms
1
2
3
4
5
6
7
8
9
Products – SICAM P
Power Quality and Measurements Product Catalog · Siemens SR 10 · Edition 22/14
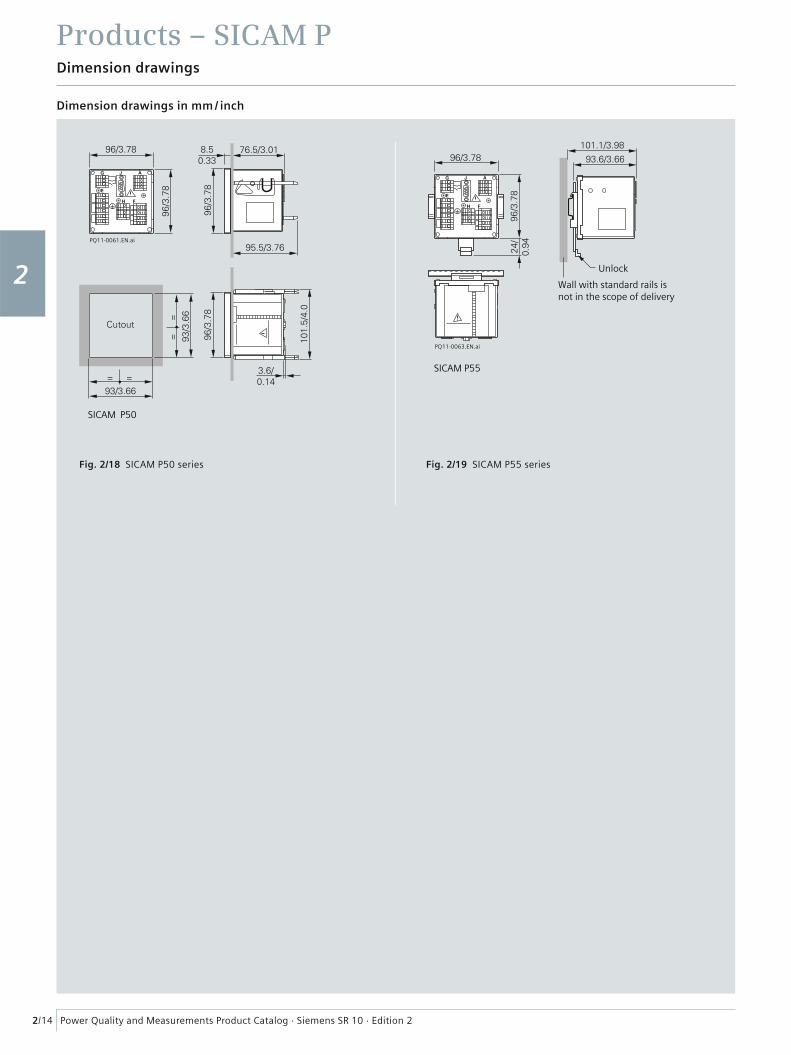
Dimension drawings
PQ11-0061.EN.ai
SICAM P50
PQ11-0063.EN.ai
SICAM P55
Wall with standard rails isnot in the scope of delivery
Unlock
Dimension drawings in mm / inch
Fig. 2/18 SICAM P50 series Fig. 2/19 SICAM P55 series
1
2
3
4
5
6
7
8
9
Products – SICAM P
Power Quality and Measurements Product Catalog · Siemens SR 10 · Edition 2 2/15
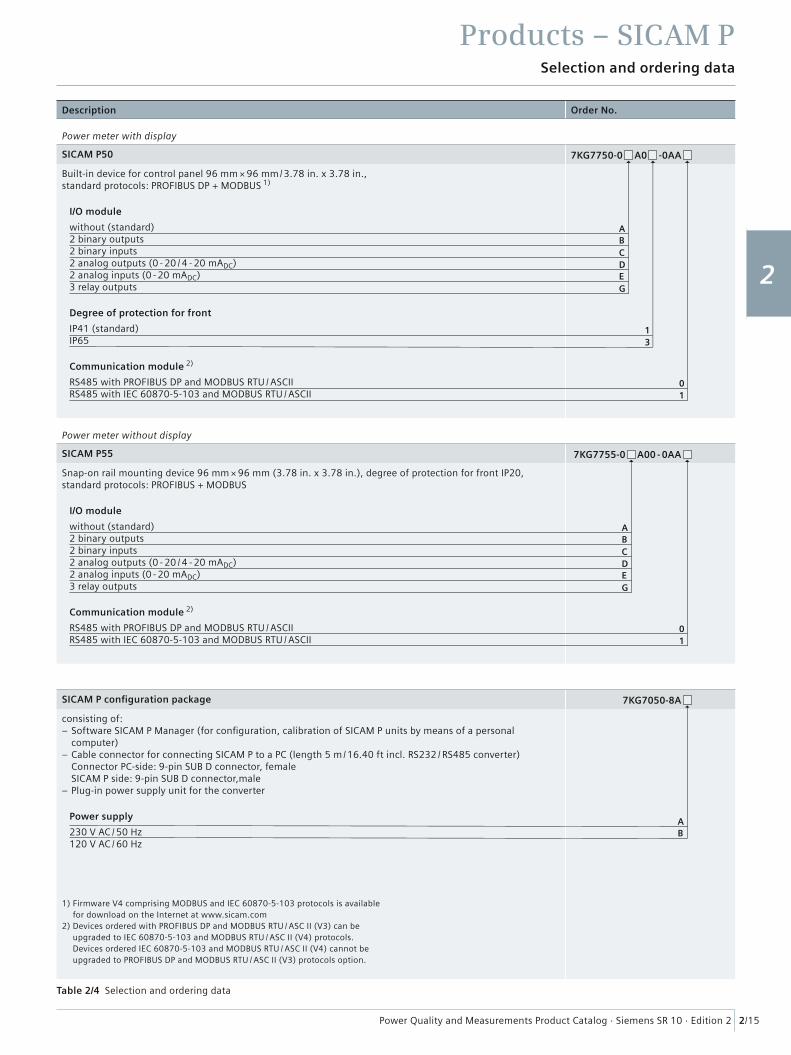
Selection and ordering data
Description Order No.
Power meter with display
SICAM P50 7KG7750-0 A0 -0AA
Built-in device for control panel 96 mm × 96 mm/3.78 in. x 3.78 in., standard protocols: PROFIBUS DP + MODBUS 1)
I/O module
without (standard)2 binary outputs2 binary inputs2 analog outputs (0 - 20 / 4 - 20 mADC)2 analog inputs (0 - 20 mADC)3 relay outputs
Degree of protection for front
IP41 (standard)IP65
Communication module 2)
RS485 with PROFIBUS DP and MODBUS RTU / ASCIIRS485 with IEC 60870-5-103 and MODBUS RTU / ASCII
Power meter without display
SICAM P55 7KG7755-0 A00 - 0AA
Snap-on rail mounting device 96 mm × 96 mm (3.78 in. x 3.78 in.), degree of protection for front IP20, standard protocols: PROFIBUS + MODBUS
I/O module
without (standard)2 binary outputs2 binary inputs2 analog outputs (0 - 20 / 4 - 20 mADC)2 analog inputs (0 - 20 mADC)3 relay outputs
Communication module 2)
RS485 with PROFIBUS DP and MODBUS RTU / ASCIIRS485 with IEC 60870-5-103 and MODBUS RTU / ASCII
SICAM P confi guration package 7KG7050-8A
consisting of:– Software SICAM P Manager (for confi guration, calibration of SICAM P units by means of a personal
computer)– Cable connector for connecting SICAM P to a PC (length 5 m / 16.40 ft incl. RS232 / RS485 converter)
Connector PC-side: 9-pin SUB D connector, femaleSICAM P side: 9-pin SUB D connector,male
– Plug-in power supply unit for the converter
Power supply
230 V AC / 50 Hz120 V AC / 60 Hz
Table 2/4 Selection and ordering data
1) Firmware V4 comprising MODBUS and IEC 60870-5-103 protocols is available for download on the Internet at www.sicam.com
2) Devices ordered with PROFIBUS DP and MODBUS RTU / ASC II (V3) can be upgraded to IEC 60870-5-103 and MODBUS RTU / ASC II (V4) protocols. Devices ordered IEC 60870-5-103 and MODBUS RTU / ASC II (V4) cannot be upgraded to PROFIBUS DP and MODBUS RTU / ASC II (V3) protocols option.
A
A
A
D
D
B
B
B
E
E
G
G
1
0
0
3
1
1
C
C
1
2
3
4
5
6
7
8
9
Products – SICAM P
Power Quality and Measurements Product Catalog · Siemens SR 10 · Edition 22/16
1
2
3
4
5
6
7
8
9

Energy Automation
Answers for infrastructure and cities.
SICAM T Digital Measurement Transducer

Power Quality and Measurements Product Catalog · Siemens SR 10 · Edition 23/2
Contents – SICAM T
Page
Device description 3/3
Applications 3/4
Specifi c functions and design 3/5
Measurands 3/6
Connection types 3/7
Graphical user interface 3/8
Technical data 3/10
Connection diagram, dimension drawings 3/13
Selection and ordering data 3/14
CE conformity and IEC 61850 certifi cate 3/15
1
2
3
4
5
6
7
8
9
Power Quality and Measurements Product Catalog · Siemens SR 10 · Edition 2
Products – SICAM T
3/3
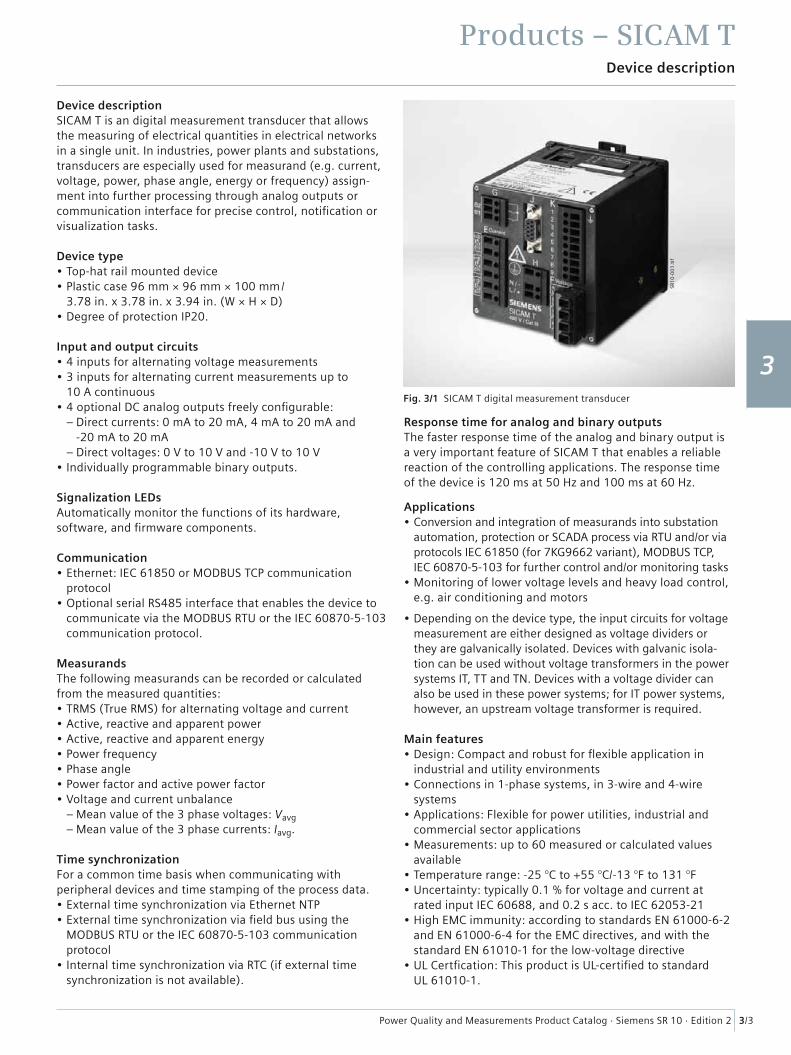
Device description
Device descriptionSICAM T is an digital measurement transducer that allows the measuring of electrical quantities in electrical networks in a single unit. In industries, power plants and substations, transducers are especially used for measurand (e.g. current, voltage, power, phase angle, energy or frequency) assign-ment into further processing through analog outputs or communication interface for precise control, notifi cation or visualization tasks.
Device type• Top-hat rail mounted device• Plastic case 96 mm × 96 mm × 100 mm /
3.78 in. x 3.78 in. x 3.94 in. (W × H × D)• Degree of protection IP20.
Input and output circuits• 4 inputs for alternating voltage measurements• 3 inputs for alternating current measurements up to
10 A continuous• 4 optional DC analog outputs freely confi gurable:
– Direct currents: 0 mA to 20 mA, 4 mA to 20 mA and -20 mA to 20 mA – Direct voltages: 0 V to 10 V and -10 V to 10 V
• Individually programmable binary outputs.
Signalization LEDsAutomatically monitor the functions of its hardware, software, and fi rmware components.
Communication• Ethernet: IEC 61850 or MODBUS TCP communication
protocol• Optional serial RS485 interface that enables the device to
communicate via the MODBUS RTU or the IEC 60870-5-103 communication protocol.
MeasurandsThe following measurands can be recorded or calculated from the measured quantities:• TRMS (True RMS) for alternating voltage and current• Active, reactive and apparent power• Active, reactive and apparent energy• Power frequency• Phase angle• Power factor and active power factor• Voltage and current unbalance
– Mean value of the 3 phase voltages: Vavg – Mean value of the 3 phase currents: Iavg.
Time synchronizationFor a common time basis when communicating with peripheral devices and time stamping of the process data. • External time synchronization via Ethernet NTP• External time synchronization via fi eld bus using the
MODBUS RTU or the IEC 60870-5-103 communication protocol
• Internal time synchronization via RTC (if external time synchronization is not available).
Response time for analog and binary outputsThe faster response time of the analog and binary output is a very important feature of SICAM T that enables a reliable reaction of the controlling applications. The response time of the device is 120 ms at 50 Hz and 100 ms at 60 Hz.
Applications• Conversion and integration of measurands into substation
automation, protection or SCADA process via RTU and/or via protocols IEC 61850 (for 7KG9662 variant), MODBUS TCP, IEC 60870-5-103 for further control and/or monitoring tasks
• Monitoring of lower voltage levels and heavy load control, e.g. air conditioning and motors
• Depending on the device type, the input circuits for voltage measurement are either designed as voltage dividers or they are galvanically isolated. Devices with galvanic isola-tion can be used without voltage transformers in the power systems IT, TT and TN. Devices with a voltage divider can also be used in these power systems; for IT power systems, however, an upstream voltage transformer is required.
Main features• Design: Compact and robust for fl exible application in
industrial and utility environments• Connections in 1-phase systems, in 3-wire and 4-wire
systems• Applications: Flexible for power utilities, industrial and
commercial sector applications• Measurements: up to 60 measured or calculated values
available• Temperature range: -25 °C to +55 °C/-13 °F to 131 °F• Uncertainty: typically 0.1 % for voltage and current at
rated input IEC 60688, and 0.2 s acc. to IEC 62053-21• High EMC immunity: according to standards EN 61000-6-2
and EN 61000-6-4 for the EMC directives, and with the standard EN 61010-1 for the low-voltage directive
• UL Certfi cation: This product is UL-certifi ed to standard UL 61010-1.
SR1
0-0
01
.tif
Fig. 3/1 SICAM T digital measurement transducer
1
2
3
4
5
6
7
8
9
Power Quality and Measurements Product Catalog · Siemens SR 10 · Edition 2
Products – SICAM T
3/4
Device description Applications
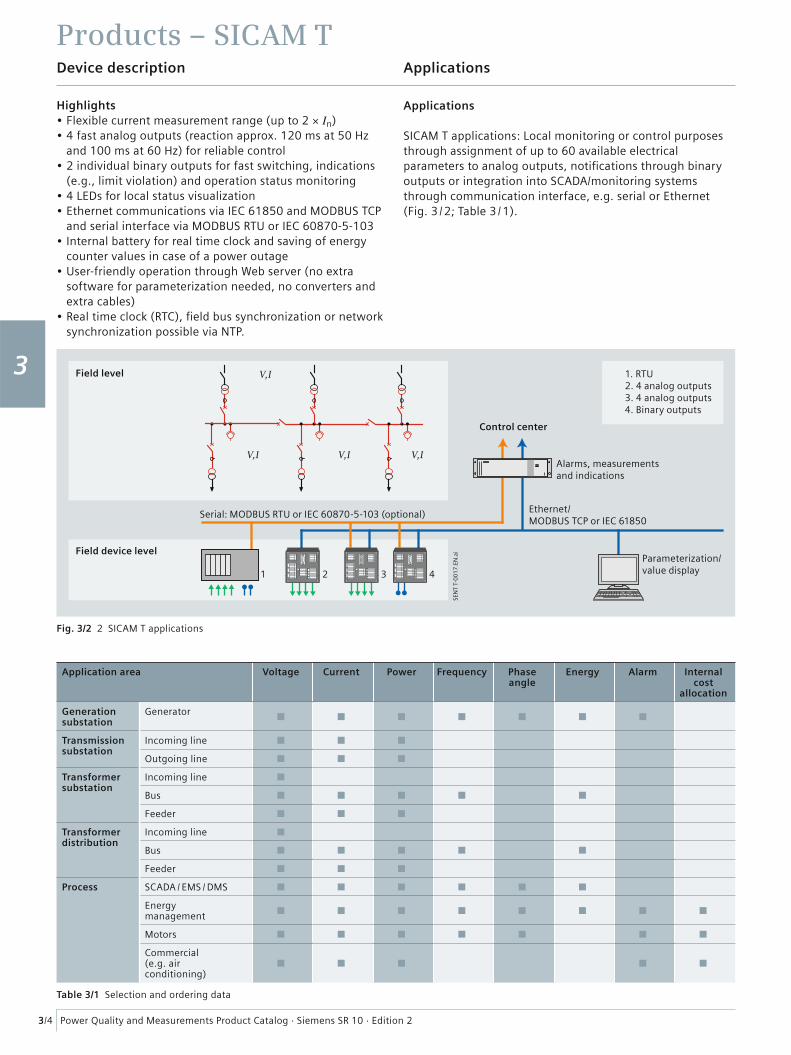
Applications
SICAM T applications: Local monitoring or control purposes through assignment of up to 60 available electrical parameters to analog outputs, notifi cations through binary outputs or integration into SCADA/monitoring systems through communication interface, e.g. serial or Ethernet (Fig. 3 /2; Table 3 /1).
Highlights• Flexible current measurement range (up to 2 × In)• 4 fast analog outputs (reaction approx. 120 ms at 50 Hz
and 100 ms at 60 Hz) for reliable control• 2 individual binary outputs for fast switching, indications
(e.g., limit violation) and operation status monitoring • 4 LEDs for local status visualization• Ethernet communications via IEC 61850 and MODBUS TCP
and serial interface via MODBUS RTU or IEC 60870-5-103• Internal battery for real time clock and saving of energy
counter values in case of a power outage• User-friendly operation through Web server (no extra
software for parameterization needed, no converters and extra cables)
• Real time clock (RTC), fi eld bus synchronization or network synchronization possible via NTP.
Ethernet/MODBUS TCP or IEC 61850
1 2 3 4
Parameterization/value display
Alarms, measurementsand indications
Control center
1. RTU2. 4 analog outputs3. 4 analog outputs4. Binary outputs
Serial: MODBUS RTU or IEC 60870-5-103 (optional)
V,I
V,I V,I V,I
Field device level
Field level
SEN
T T-
00
17
.EN
.ai
Application area Voltage Current Power Frequency Phase angle
Energy Alarm Internal cost
allocation
Generation substation
Generator■ ■ ■ ■ ■ ■ ■
Transmission substation
Incoming line ■ ■ ■
Outgoing line ■ ■ ■
Transformer substation
Incoming line ■
Bus ■ ■ ■ ■ ■
Feeder ■ ■ ■
Transformer distribution
Incoming line ■
Bus ■ ■ ■ ■ ■
Feeder ■ ■ ■
Process SCADA / EMS / DMS ■ ■ ■ ■ ■ ■
Energy management ■ ■ ■ ■ ■ ■ ■ ■
Motors ■ ■ ■ ■ ■ ■ ■
Commercial (e.g. air conditioning)
■ ■ ■ ■ ■
Fig. 3/2 2 SICAM T applications
Table 3/1 Selection and ordering data
1
2
3
4
5
6
7
8
9
Power Quality and Measurements Product Catalog · Siemens SR 10 · Edition 2
Products – SICAM T
3/5
Specifi c functions and design
Specifi c functions and design
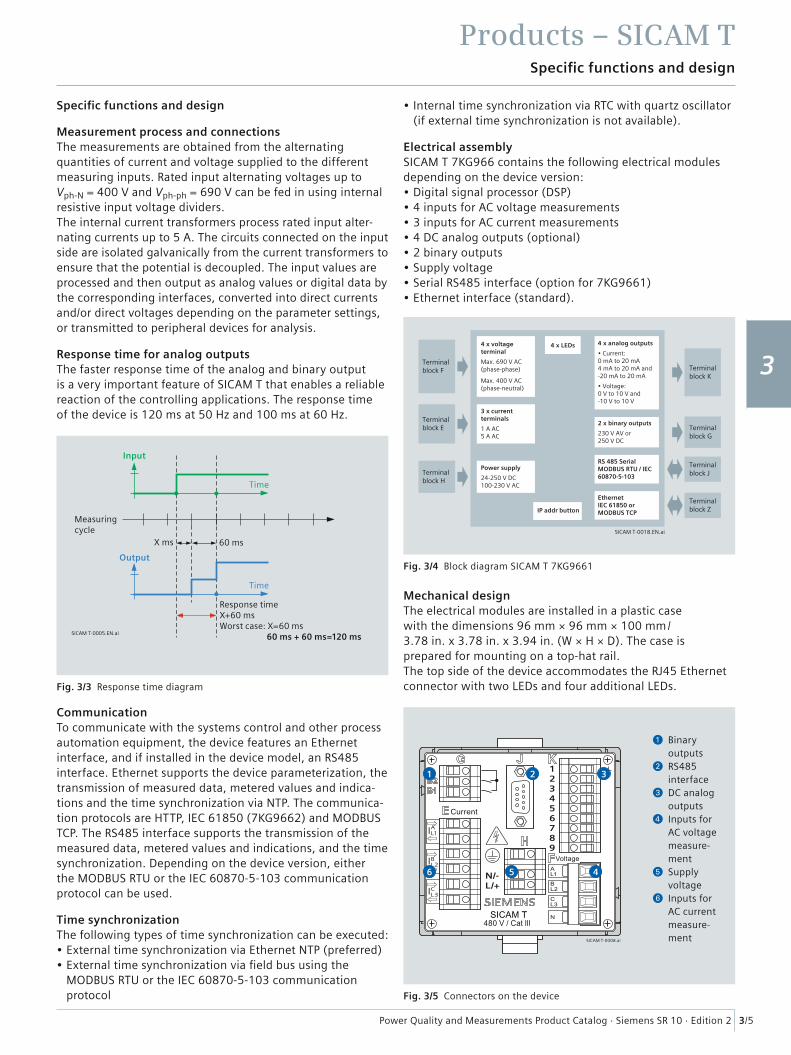
Measurement process and connectionsThe measurements are obtained from the alternating quantities of current and voltage supplied to the different measuring inputs. Rated input alternating voltages up to Vph-N = 400 V and Vph-ph = 690 V can be fed in using internal resistive input voltage dividers. The internal current transformers process rated input alter-nating currents up to 5 A. The circuits connected on the input side are isolated galvanically from the current transformers to ensure that the potential is decoupled. The input values are processed and then output as analog values or digital data by the corresponding interfaces, converted into direct currents and/or direct voltages depending on the parameter settings, or transmitted to peripheral devices for analysis.
Response time for analog outputsThe faster response time of the analog and binary output is a very important feature of SICAM T that enables a reliable reaction of the controlling applications. The response time of the device is 120 ms at 50 Hz and 100 ms at 60 Hz.
CommunicationTo communicate with the systems control and other process automation equipment, the device features an Ethernet interface, and if installed in the device model, an RS485 interface. Ethernet supports the device parameterization, the transmission of measured data, metered values and indica-tions and the time synchronization via NTP. The communica-tion protocols are HTTP, IEC 61850 (7KG9662) and MODBUS TCP. The RS485 interface supports the transmission of the measured data, metered values and indications, and the time synchronization. Depending on the device version, either the MODBUS RTU or the IEC 60870-5-103 communication protocol can be used.
Time synchronizationThe following types of time synchronization can be executed:• External time synchronization via Ethernet NTP (preferred)• External time synchronization via fi eld bus using the
MODBUS RTU or the IEC 60870-5-103 communication protocol
• Internal time synchronization via RTC with quartz oscillator (if external time synchronization is not available).
Electrical assemblySICAM T 7KG966 contains the following electrical modules depending on the device version:• Digital signal processor (DSP)• 4 inputs for AC voltage measurements• 3 inputs for AC current measurements• 4 DC analog outputs (optional)• 2 binary outputs• Supply voltage• Serial RS485 interface (option for 7KG9661)• Ethernet interface (standard).
Mechanical designThe electrical modules are installed in a plastic case with the dimensions 96 mm × 96 mm × 100 mm/3.78 in. x 3.78 in. x 3.94 in. (W × H × D). The case is prepared for mounting on a top-hat rail.The top side of the device accommodates the RJ45 Ethernet connector with two LEDs and four additional LEDs.
X ms 60 ms
Input
Measuringcycle
Time
SICAM T-0005.EN.ai
Output
Time
Response timeX+60 msWorst case: X=60 ms 60 ms + 60 ms=120 ms
4 x voltageterminal
Max. 690 V AC(phase-phase)
Max. 400 V AC(phase-neutral)
4 x LEDs
Terminalblock F Terminal
block K
Terminalblock G
Terminalblock J
Terminalblock Z
Terminalblock E
Terminalblock H
4 x analog outputs
0 mA to 20 mA4 mA to 20 mA and-20 mA to 20 mA
0 V to 10 V and-10 V to 10 V
2 x binary outputs
230 V AV or250 V DC
RS 485 SerialMODBUS RTU / IEC60870-5-103
Ethernet IEC 61850 or MODBUS TCP
3 x currentterminals
1 A AC5 A AC
Power supply
24-250 V DC100-230 V AC
IP addr button
SICAM T-0018.EN.ai
123456789
AL1
BL2
CL3
N/-L/+
SICAM T-0008.ai
3
456
1 2
Binary outputs
RS485 interface
DC analog outputs
Inputs for AC voltage measure-ment
Supply voltage
Inputs for AC current measure-ment
Fig. 3/3 Response time diagram
Fig. 3/5 Connectors on the device
Fig. 3/4 Block diagram SICAM T 7KG9661
1
2
3
4
5
6
7
8
9
Power Quality and Measurements Product Catalog · Siemens SR 10 · Edition 2
Products – SICAM T
3/6
Measurands
Measurand Circuit 1-phase system
3-wire network (delta) 4-wire network (star)
balanced (1I)
unbal-anced
(3I)
unbal-anced
(2I)
balanced (1I)
unbal-anced
(3I)
AC voltage Va a-N ■ ■ ■
Vb b-N ■
Vc c-N ■
Vab, Vbc, Vca a-b, b-c, c-a ■ ■ ■ ■
VN a, b, c ■
Vavg a, b, c ∑Vph/3 ∑Vph/3 ∑Vph/3 a-N ∑Vph/3
Vunbal a-b, b-c, c-a ■ ■ ■ ■
AC current Ia a ■ ■ ■ ■ ■ ■
Ib, Ic b, c ■ ■ ■
IN a, b, c ■ ■
Iavg a, b, c ■ ■ ∑Iph/3
Iunbal a, b, c ■ ■ ■
Active power factor
cos φ (a) a ■ ■
cos φ (b), cos φ (c) b, c ■
cos φ a, b, c ■ ■ ■ ■ ■
Power factor PFa a ■ ■
PFb, PFc b, c ■
PF a, b, c ■ ■ ■ ■ ■
Phase angle φa a ■ ■
φb, φc b, c ■
φ a, b, c ■ ■ ■ ■ ■
Frequency f a, b, c ■ ■ ■ ■ ■ ■
Active power Pa a ■ ■
Pb, Pc b, c ■
P a, b, c ■ ■ ■ ■ ■
Reactive power Qa a ■ ■
Qb, Qc b, c ■
Q a, b, c ■ ■ ■ ■ ■
Apparent power Sa a ■ ■
Sb, Sc b, c ■
S a, b, c ■ ■ ■ ■ ■
Active energy – supply
WPa supply a ■ ■
WPb supply, WPc supply b, c ■
WPsupply a, b, c ■ ■ ■ ■ ■
Active energy – demand
WPa demand a ■ ■
WPb demand, WPc demand b, c ■
WPdemand a, b, c ■ ■ ■ ■ ■
Reactive energy – inductive
WQa inductive a ■ ■
WQb inductive, WQc inductive b, c ■
WQinductive a, b, c ■ ■ ■ ■ ■
Reactive energy – capacitive
WQa capacitive a ■ ■
WQb capacitive, WQc capacitive b, c ■
WQcapacitive a, b, c ■ ■ ■ ■ ■
Apparent energy WSa a ■ ■
WSb, WSc b, c ■
WS a, b, c ■ ■ ■ ■ ■
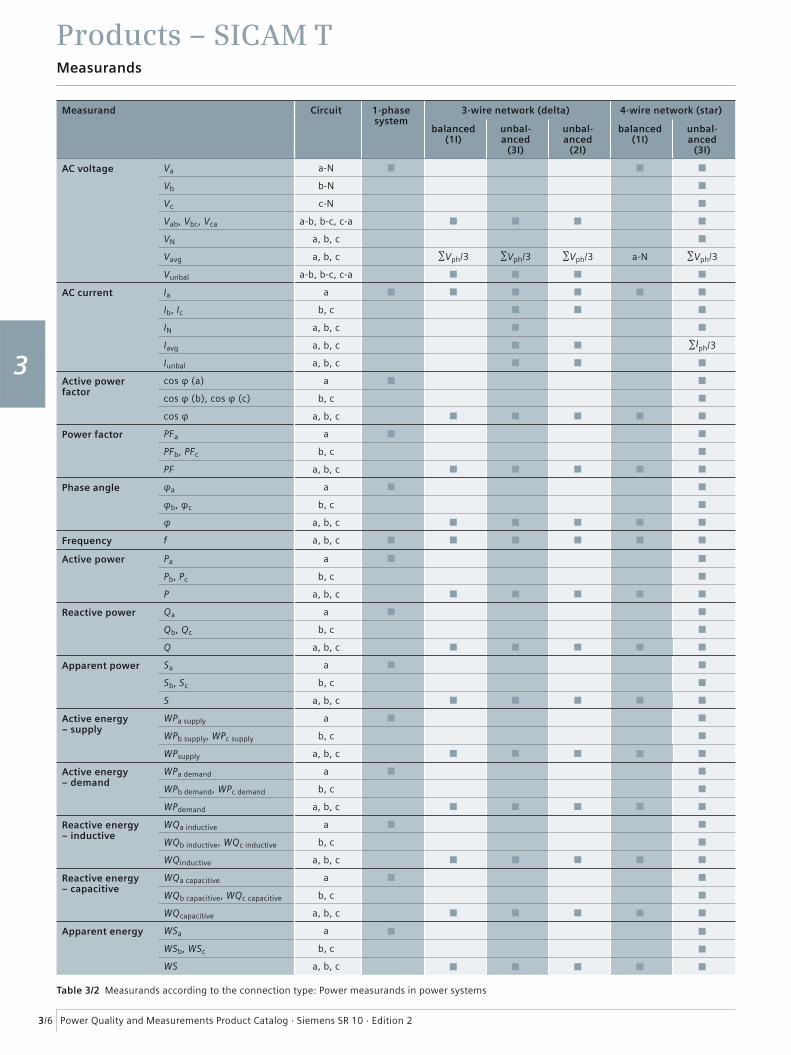
Table 3/2 Measurands according to the connection type: Power measurands in power systems
1
2
3
4
5
6
7
8
9
Power Quality and Measurements Product Catalog · Siemens SR 10 · Edition 2
Products – SICAM T
3/7
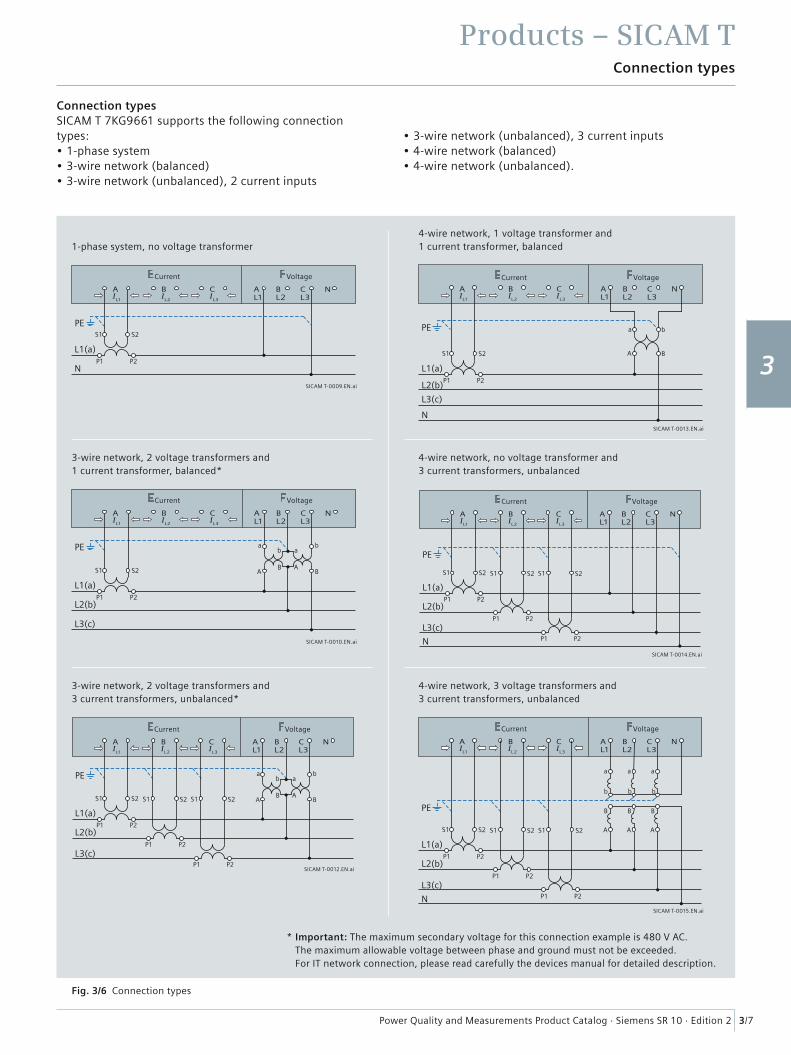
Connection types
Connection typesSICAM T 7KG9661 supports the following connection types: • 1-phase system• 3-wire network (balanced)• 3-wire network (unbalanced), 2 current inputs
• 3-wire network (unbalanced), 3 current inputs• 4-wire network (balanced)• 4-wire network (unbalanced).
PE
AI
L1
AL1
BL2
CL3
NBI
L2
CI
L3
P1 P2
S1 S2
L1(a)
N
Current Voltage
SICAM T-0009.EN.ai
1-phase system, no voltage transformer
ab
AB A
B
abPE
AI
L1
AL1
BL2
CL3
NBI
L2
CI
L3
P1 P2
P1 P2
S1 S2 S1 S2
L1(a)
L3(c)
S1 S2
L2(b)
P1 P2
Current Voltage
SICAM T-0012.EN.ai
3-wire network, 2 voltage transformers and 3 current transformers, unbalanced*
P1 P2
P1 P2
S1 S2 S1 S2
L1(a)
PE
L3(c)
S1 S2
N
AI
L1
AL1
BL2
CL3
NBI
L2
CI
L3
L2(b)
P1 P2
SICAM T-0014.EN.ai
Current Voltage
4-wire network, no voltage transformer and 3 current transformers, unbalanced
P1 P2
P1 P2
S1 S2 S1 S2
a
b b b
L1(a)
PE
L3(c)
S1 S2
N
AI
L1
AL1
BL2
CL3
NBI
L2
CI
L3
a a
A A A
B B B
L2(b)
P1 P2
Current Voltage
SICAM T-0015.EN.ai
4-wire network, 3 voltage transformers and 3 current transformers, unbalanced
ab
AB A
B
abPE
AI
L1
AL1
BL2
CL3
NBI
L2
CI
L3
P1 P2
S1 S2
L1(a)
L2(b)
L3(c)
Current Voltage
SICAM T-0010.EN.ai
3-wire network, 2 voltage transformers and 1 current transformer, balanced*
a b
A B
PE
AI
L1
AL1
BL2
CL3
NBI
L2
CI
L3
N
P1 P2
S1 S2
L1(a)
L3(c)
L2(b)
Current
SICAM T-0013.EN.ai
Voltage
4-wire network, 1 voltage transformer and 1 current transformer, balanced
Fig. 3/6 Connection types
* Important: The maximum secondary voltage for this connection example is 480 V AC. The maximum allowable voltage between phase and ground must not be exceeded. For IT network connection, please read carefully the devices manual for detailed description.
1
2
3
4
5
6
7
8
9
Power Quality and Measurements Product Catalog · Siemens SR 10 · Edition 2
Products – SICAM T
3/8
Graphical user interface
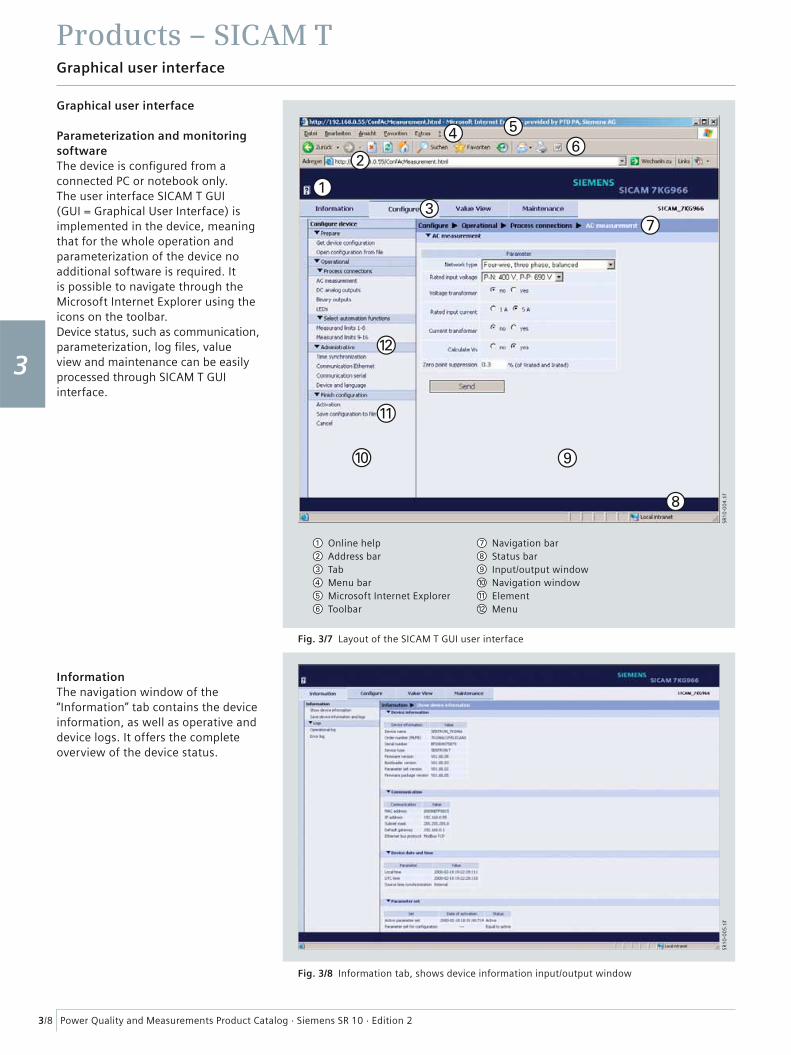
Graphical user interface
Parameterization and monitoring softwareThe device is confi gured from a connected PC or notebook only. The user interface SICAM T GUI (GUI = Graphical User Interface) is implemented in the device, meaning that for the whole operation and parameterization of the device no additional software is required. It is possible to navigate through the Microsoft Internet Explorer using the icons on the toolbar.Device status, such as communication,parameterization, log fi les, value view and maintenance can be easily processed through SICAM T GUI interface.
InformationThe navigation window of the “Information” tab contains the device information, as well as operative and device logs. It offers the complete overview of the device status.
Online help Address bar Tab Menu bar Microsoft Internet Explorer Toolbar
Navigation bar Status bar Input/output window Navigation window Element Menu
Fig. 3/7 Layout of the SICAM T GUI user interface
Fig. 3/8 Information tab, shows device information input/output window
SR1
0-0
04
.tif
SR1
0-0
05
.tif
1
2
3
4
5
6
7
8
9

Power Quality and Measurements Product Catalog · Siemens SR 10 · Edition 2
Products – SICAM T
3/9
Graphical user interface
Confi gurationThe confi guration mode allows to set the device parameters. It is possible to tailor the process connections to the installation environment, specify the limits of the measuring ranges, parameterize the communication, and make various operational settings.
Analog outputsThe following types of characteristics are used for the transmission of measured values to the DC analog outputs: Linear, Zoom, Live-Zero, Knee-point, Knee-point Zoom, Bipolar Linear, Bipolar Knee-point Zoom, Square Transfer Characteristic (U^2).
Value ViewThe measured values are displayed in the “Value View” tab.• AC operational values• AC power and energy• DC analog outputs• Binary outputs• Measurand limitsDepending on which operational parameters are selected, the input/output window displays the measured values of the measurands with the corresponding unit or indications in a tabular list that is updated every 5 s.
MaintenanceThe “Maintenance” tab allows to update the fi rmware, perform calibration, make various presettings, view and delete logs, and analyze protocol-specifi c communication data.
SR1
0-0
06
.tif
SR1
0-0
07
.tif
SR1
0-0
08
.tif
Fig. 3/9 DC analog outputs input/output window
Fig. 3/10 Value View tab
Fig. 3/11 Maintenance tab
1
2
3
4
5
6
7
8
9
Power Quality and Measurements Product Catalog · Siemens SR 10 · Edition 2
Products – SICAM T
3/10
Technical data
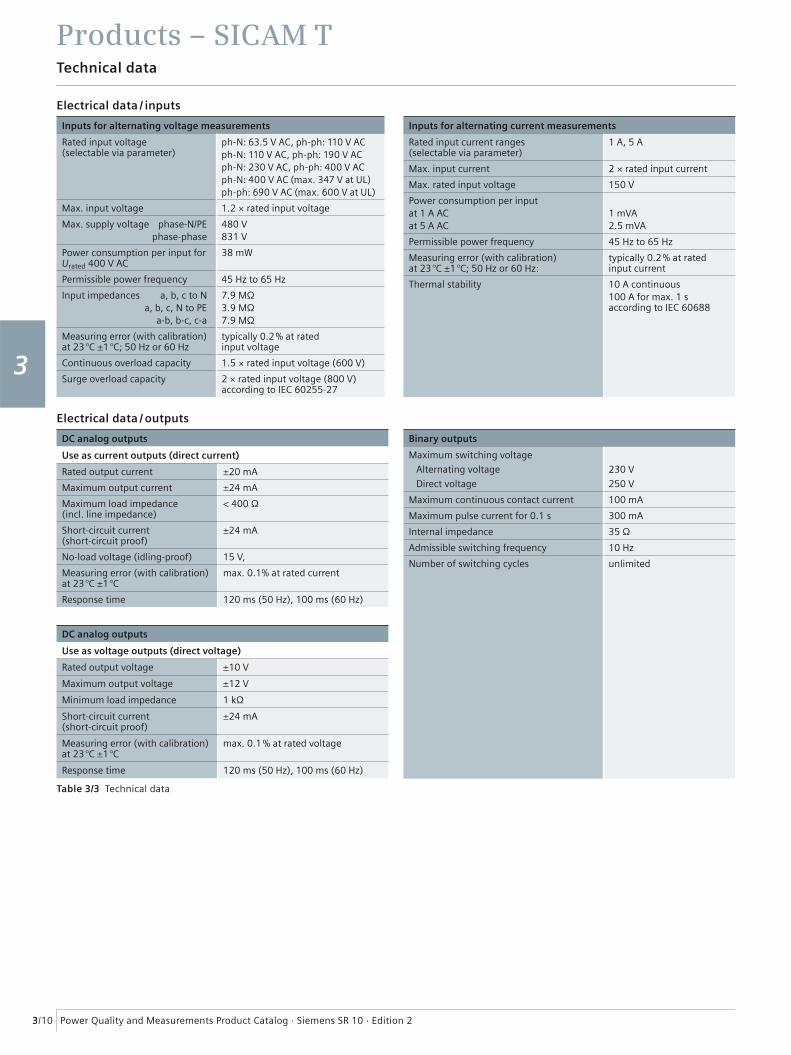
Electrical data / inputs
Inputs for alternating voltage measurements
Rated input voltage (selectable via parameter)
ph-N: 63.5 V AC, ph-ph: 110 V ACph-N: 110 V AC, ph-ph: 190 V ACph-N: 230 V AC, ph-ph: 400 V ACph-N: 400 V AC (max. 347 V at UL)ph-ph: 690 V AC (max. 600 V at UL)
Max. input voltage 1.2 × rated input voltage
Max. supply voltage phase-N/PE phase-phase
480 V831 V
Power consumption per input for Urated 400 V AC
38 mW
Permissible power frequency 45 Hz to 65 Hz
Input impedances a, b, c to N a, b, c, N to PE a-b, b-c, c-a
7.9 MΩ3.9 MΩ7.9 MΩ
Measuring error (with calibration) at 23 °C ±1 °C; 50 Hz or 60 Hz
typically 0.2 % at rated input voltage
Continuous overload capacity 1.5 × rated input voltage (600 V)
Surge overload capacity 2 × rated input voltage (800 V) according to IEC 60255-27
Inputs for alternating current measurements
Rated input current ranges (selectable via parameter)
1 A, 5 A
Max. input current 2 × rated input current
Max. rated input voltage 150 V
Power consumption per inputat 1 A ACat 5 A AC
1 mVA2.5 mVA
Permissible power frequency 45 Hz to 65 Hz
Measuring error (with calibration) at 23 °C ±1 °C; 50 Hz or 60 Hz:
typically 0.2 % at rated input current
Thermal stability 10 A continuous100 A for max. 1 s according to IEC 60688
Electrical data / outputs
DC analog outputs
Use as current outputs (direct current)
Rated output current ±20 mA
Maximum output current ±24 mA
Maximum load impedance (incl. line impedance)
< 400 Ω
Short-circuit current (short-circuit proof)
±24 mA
No-load voltage (idling-proof) 15 V,
Measuring error (with calibration) at 23 °C ±1 °C
max. 0.1% at rated current
Response time 120 ms (50 Hz), 100 ms (60 Hz)
DC analog outputs
Use as voltage outputs (direct voltage)
Rated output voltage ±10 V
Maximum output voltage ±12 V
Minimum load impedance 1 kΩ
Short-circuit current (short-circuit proof)
±24 mA
Measuring error (with calibration) at 23 °C ±1 °C
max. 0.1 % at rated voltage
Response time 120 ms (50 Hz), 100 ms (60 Hz)
Binary outputs
Maximum switching voltage
Alternating voltage
Direct voltage
230 V
250 V
Maximum continuous contact current 100 mA
Maximum pulse current for 0.1 s 300 mA
Internal impedance 35 Ω
Admissible switching frequency 10 Hz
Number of switching cycles unlimited
Table 3/3 Technical data
1
2
3
4
5
6
7
8
9
Power Quality and Measurements Product Catalog · Siemens SR 10 · Edition 2
Products – SICAM T
3/11
Technical data
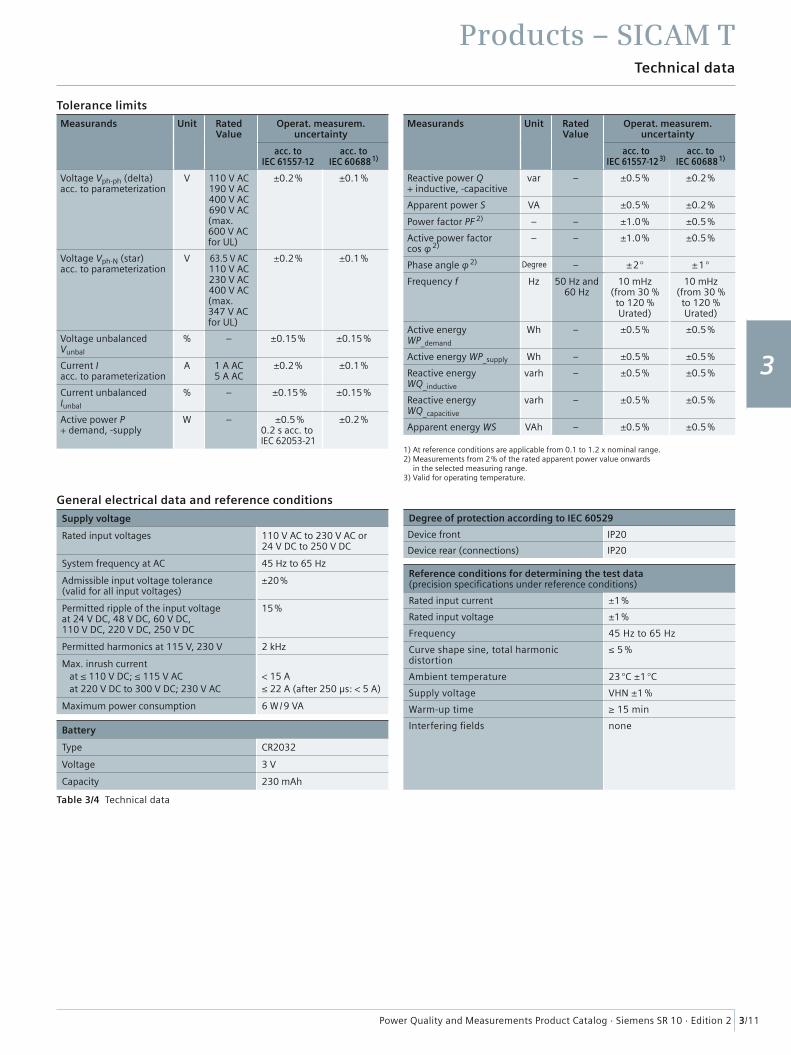
Tolerance limits
Measurands Unit Rated Value
Operat. measurem. uncertainty
acc. toIEC 61557-12
acc. toIEC 60688 1)
Voltage Vph-ph (delta) acc. to parameterization
V 110 V AC190 V AC400 V AC690 V AC(max. 600 V AC for UL)
±0.2 % ±0.1 %
Voltage Vph-N (star) acc. to parameterization
V 63.5 V AC110 V AC230 V AC400 V AC(max. 347 V AC for UL)
±0.2 % ±0.1 %
Voltage unbalanced Vunbal
% – ±0.15 % ±0.15 %
Current I acc. to parameterization
A 1 A AC5 A AC
±0.2 % ±0.1 %
Current unbalanced Iunbal
% – ±0.15 % ±0.15 %
Active power P + demand, -supply
W – ±0.5 %0.2 s acc. to IEC 62053-21
±0.2 %
Measurands Unit Rated Value
Operat. measurem. uncertainty
acc. toIEC 61557-12 3)
acc. toIEC 60688 1)
Reactive power Q + inductive, -capacitive
var – ±0.5 % ±0.2 %
Apparent power S VA ±0.5 % ±0.2 %
Power factor PF 2) – – ±1.0 % ±0.5 %
Active power factor cos φ 2)
– – ±1.0 % ±0.5 %
Phase angle φ 2) Degree – ±2 ° ±1 °
Frequency f Hz 50 Hz and 60 Hz
10 mHz(from 30 % to 120 % Urated)
10 mHz(from 30 % to 120 % Urated)
Active energy WP_demand
Wh – ±0.5 % ±0.5 %
Active energy WP_supply Wh – ±0.5 % ±0.5 %
Reactive energy WQ_inductive
varh – ±0.5 % ±0.5 %
Reactive energy WQ_capacitive
varh – ±0.5 % ±0.5 %
Apparent energy WS VAh – ±0.5 % ±0.5 %
1) At reference conditions are applicable from 0.1 to 1.2 x nominal range.2) Measurements from 2 % of the rated apparent power value onwards
in the selected measuring range.3) Valid for operating temperature.
General electrical data and reference conditions
Supply voltage
Rated input voltages 110 V AC to 230 V AC or 24 V DC to 250 V DC
System frequency at AC 45 Hz to 65 Hz
Admissible input voltage tolerance (valid for all input voltages)
±20 %
Permitted ripple of the input voltage at 24 V DC, 48 V DC, 60 V DC, 110 V DC, 220 V DC, 250 V DC
15 %
Permitted harmonics at 115 V, 230 V 2 kHz
Max. inrush current at ≤ 110 V DC; ≤ 115 V ACat 220 V DC to 300 V DC; 230 V AC
< 15 A≤ 22 A (after 250 μs: < 5 A)
Maximum power consumption 6 W / 9 VA
Battery
Type CR2032
Voltage 3 V
Capacity 230 mAh
Degree of protection according to IEC 60529
Device front IP20
Device rear (connections) IP20
Reference conditions for determining the test data (precision specifi cations under reference conditions)
Rated input current ±1 %
Rated input voltage ±1 %
Frequency 45 Hz to 65 Hz
Curve shape sine, total harmonic distortion
≤ 5 %
Ambient temperature 23 °C ±1 °C
Supply voltage VHN ±1 %
Warm-up time ≥ 15 min
Interfering fi elds none
Table 3/4 Technical data
1
2
3
4
5
6
7
8
9
Power Quality and Measurements Product Catalog · Siemens SR 10 · Edition 2
Products – SICAM T
3/12
Products – SICAM TTechnical data
Table 3/5 Technical data
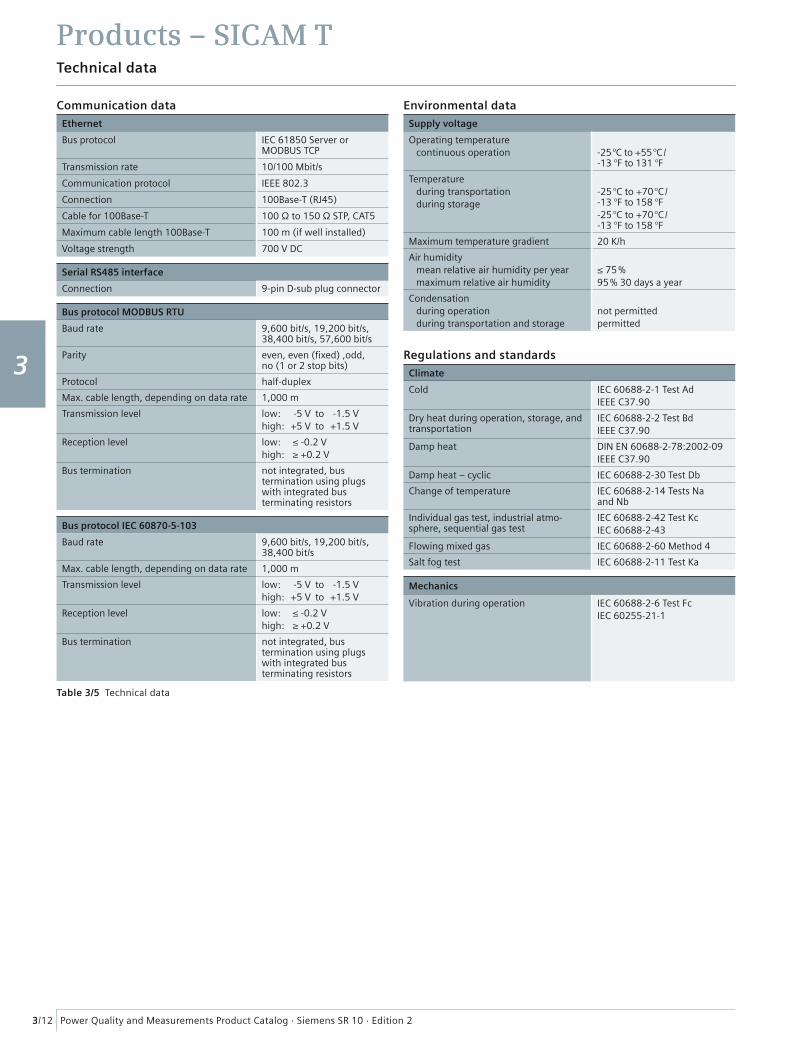
Communication data
Ethernet
Bus protocol IEC 61850 Server or MODBUS TCP
Transmission rate 10/100 Mbit/s
Communication protocol IEEE 802.3
Connection 100Base-T (RJ45)
Cable for 100Base-T 100 Ω to 150 Ω STP, CAT5
Maximum cable length 100Base-T 100 m (if well installed)
Voltage strength 700 V DC
Serial RS485 interface
Connection 9-pin D-sub plug connector
Bus protocol MODBUS RTU
Baud rate 9,600 bit/s, 19,200 bit/s, 38,400 bit/s, 57,600 bit/s
Parity even, even (fi xed) ,odd, no (1 or 2 stop bits)
Protocol half-duplex
Max. cable length, depending on data rate 1,000 m
Transmission level low: -5 V to -1.5 Vhigh: +5 V to +1.5 V
Reception level low: ≤ -0.2 Vhigh: ≥ +0.2 V
Bus termination not integrated, bus termination using plugs with integrated bus terminating resistors
Bus protocol IEC 60870-5-103
Baud rate 9,600 bit/s, 19,200 bit/s, 38,400 bit/s
Max. cable length, depending on data rate 1,000 m
Transmission level low: -5 V to -1.5 Vhigh: +5 V to +1.5 V
Reception level low: ≤ -0.2 Vhigh: ≥ +0.2 V
Bus termination not integrated, bus termination using plugs with integrated bus terminating resistors
Environmental data
Supply voltage
Operating temperaturecontinuous operation -25 °C to +55 °C /
-13 °F to 131 °F
Temperatureduring transportationduring storage
-25 °C to +70 °C /-13 °F to 158 °F-25 °C to +70 °C /-13 °F to 158 °F
Maximum temperature gradient 20 K/h
Air humiditymean relative air humidity per yearmaximum relative air humidity
≤ 75 %95 % 30 days a year
Condensationduring operationduring transportation and storage
not permittedpermitted
Regulations and standards
Climate
Cold IEC 60688-2-1 Test AdIEEE C37.90
Dry heat during operation, storage, and transportation
IEC 60688-2-2 Test BdIEEE C37.90
Damp heat DIN EN 60688-2-78:2002-09IEEE C37.90
Damp heat – cyclic IEC 60688-2-30 Test Db
Change of temperature IEC 60688-2-14 Tests Na and Nb
Individual gas test, industrial atmo-sphere, sequential gas test
IEC 60688-2-42 Test KcIEC 60688-2-43
Flowing mixed gas IEC 60688-2-60 Method 4
Salt fog test IEC 60688-2-11 Test Ka
Mechanics
Vibration during operation IEC 60688-2-6 Test FcIEC 60255-21-1
1
2
3
4
5
6
7
8
9
1
2
3
4
5
6
7
8
9

Power Quality and Measurements Product Catalog · Siemens SR 10 · Edition 2
Products – SICAM T
3/13
Products – SICAM TConnection diagram, dimension drawings
IL1A
A01 2
1
3
AL1
L/+
L/–
BL2
CL3
N
IL2B
IL3
A02 45
A03 67
A04
B0B1B2
89
C
RS485
CurrentE
F
H
K
G
J
Z
Voltage
Power supply
Ethernetinterface
Serialinterface
9-pole
SEN
T T-
00
19
.EN
.ai
123456789
AL1
BL2
CL3
N/-L/+
96 / 3.78
96
SICAM T
SENT T-0020.EN.ai
103.8 / 4.09
Snap-in clip
Guiding of thesnap-in clip
Top-hat rail
Release device Pulling directionDimensions in mm / in.
113.3 / 4.46
Connection diagram / dimension drawings
Fig. 3/12 Connection diagram
Fig. 3/13 Dimension drawings
1
2
3
4
5
6
7
8
9
1
2
3
4
5
6
7
8
9
Power Quality and Measurements Product Catalog · Siemens SR 10 · Edition 2
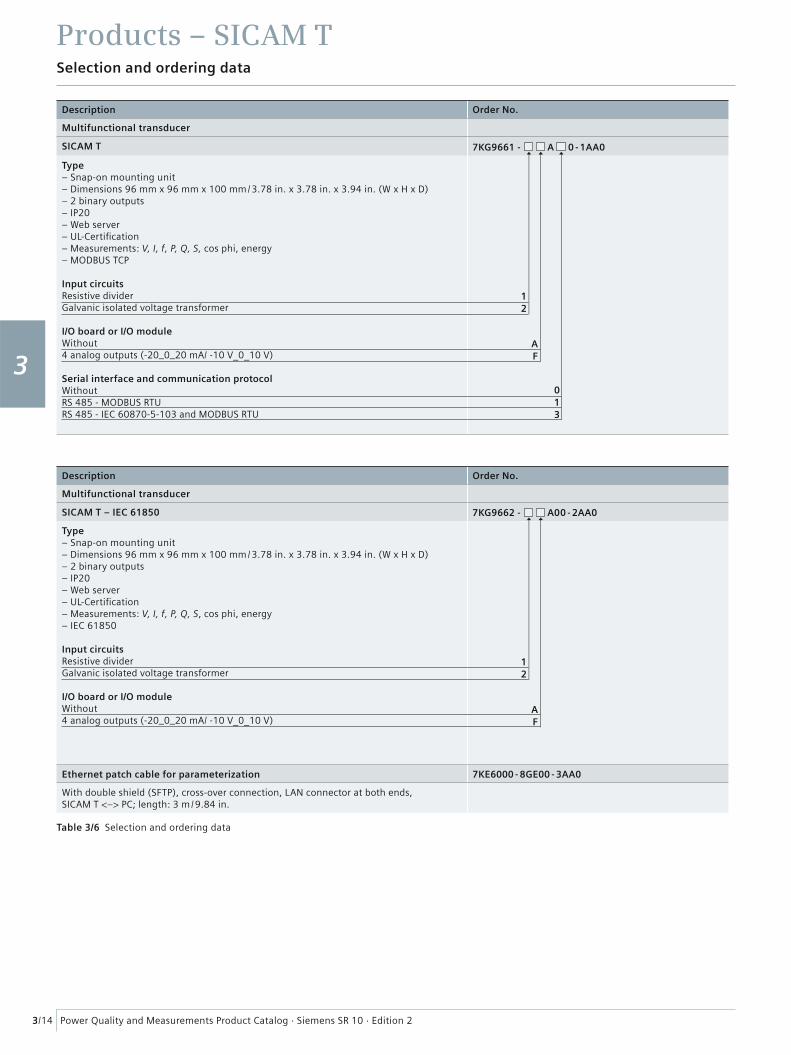
Products – SICAM T
3/14
Selection and ordering data
Description Order No.
Multifunctional transducer
SICAM T 7KG9661 - A 0 - 1AA0
Type– Snap-on mounting unit– Dimensions 96 mm x 96 mm x 100 mm / 3.78 in. x 3.78 in. x 3.94 in. (W x H x D)– 2 binary outputs– IP20– Web server– UL-Certifi cation– Measurements: V, I, f, P, Q, S, cos phi, energy– MODBUS TCP
Input circuitsResistive dividerGalvanic isolated voltage transformer
I/O board or I/O moduleWithout4 analog outputs (-20_0_20 mA/ -10 V_0_10 V)
Serial interface and communication protocolWithoutRS 485 - MODBUS RTURS 485 - IEC 60870-5-103 and MODBUS RTU
Description Order No.
Multifunctional transducer
SICAM T – IEC 61850 7KG9662 - A00 - 2AA0
Type– Snap-on mounting unit– Dimensions 96 mm x 96 mm x 100 mm / 3.78 in. x 3.78 in. x 3.94 in. (W x H x D)– 2 binary outputs– IP20– Web server– UL-Certifi cation– Measurements: V, I, f, P, Q, S, cos phi, energy– IEC 61850
Input circuitsResistive dividerGalvanic isolated voltage transformer
I/O board or I/O moduleWithout4 analog outputs (-20_0_20 mA/ -10 V_0_10 V)
Ethernet patch cable for parameterization 7KE6000 - 8GE00 - 3AA0
With double shield (SFTP), cross-over connection, LAN connector at both ends, SICAM T <–> PC; length: 3 m / 9.84 in.
Table 3/6 Selection and ordering data
F
F
13
2
2
A
A
0
1
1
1
2
3
4
5
6
7
8
9
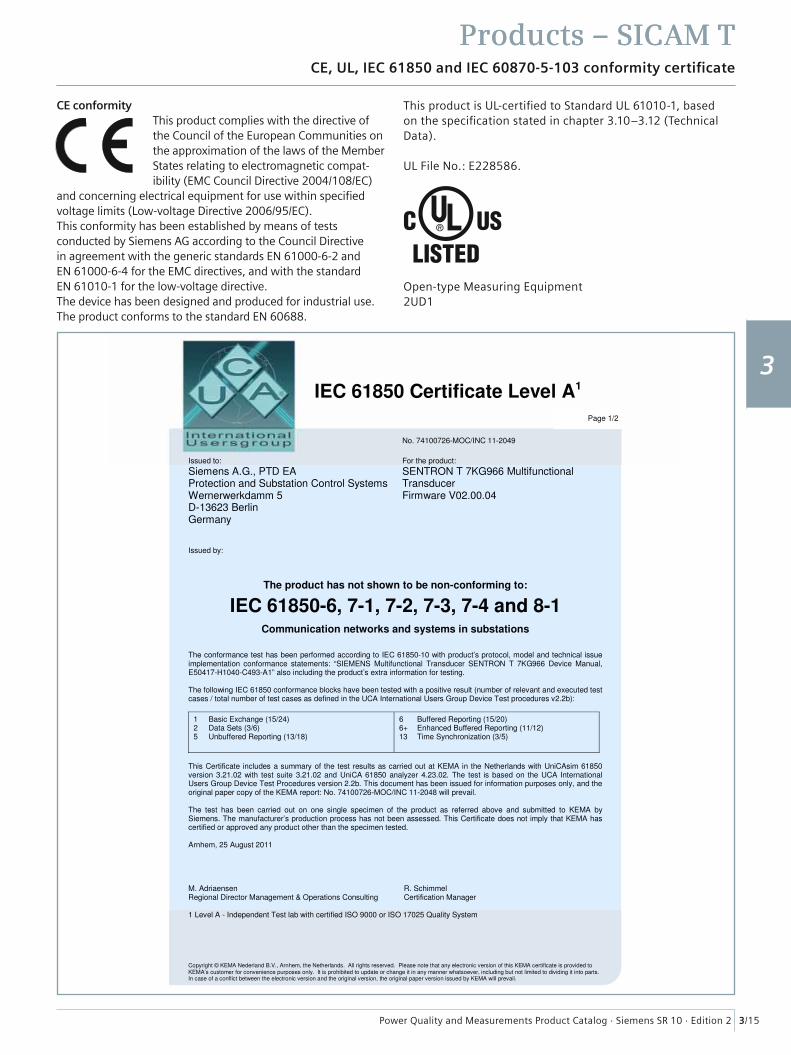
Power Quality and Measurements Product Catalog · Siemens SR 10 · Edition 2
Products – SICAM T
3/15
Products – SICAM TCE, UL, IEC 61850 and IEC 60870-5-103 conformity certifi cate
This product is UL-certifi ed to Standard UL 61010-1, based on the specifi cation stated in chapter 3.10–3.12 (Technical Data).
UL File No.: E228586.
Open-type Measuring Equipment 2UD1
CE conformityThis product complies with the directive of the Council of the European Communities on the approximation of the laws of the Member States relating to electromagnetic compat-ibility (EMC Council Directive 2004/108/EC)
and concerning electrical equipment for use within specifi ed voltage limits (Low-voltage Directive 2006/95/EC).This conformity has been established by means of tests conducted by Siemens AG according to the Council Directive in agreement with the generic standards EN 61000-6-2 and EN 61000-6-4 for the EMC directives, and with the standard EN 61010-1 for the low-voltage directive. The device has been designed and produced for industrial use. The product conforms to the standard EN 60688.
IEC 61850 Certificate Level A1
No. 74100726-MOC/INC 11-2049
Issued to: For the product:
Siemens A.G., PTD EA Protection and Substation Control Systems Wernerwerkdamm 5 D-13623 Berlin Germany
SENTRON T 7KG966 Multifunctional Transducer Firmware V02.00.04
Issued by:
The product has not shown to be non-conforming to:
IEC 61850-6, 7-1, 7-2, 7-3, 7-4 and 8-1 Communication networks and systems in substations
The conformance test has been performed according to IEC 61850-10 with product’s protocol, model and technical issue implementation conformance statements: “SIEMENS Multifunctional Transducer SENTRON T 7KG966 Device Manual, E50417-H1040-C493-A1” also including the product’s extra information for testing. The following IEC 61850 conformance blocks have been tested with a positive result (number of relevant and executed test cases / total number of test cases as defined in the UCA International Users Group Device Test procedures v2.2b):
1 Basic Exchange (15/24) 2 Data Sets (3/6) 5 Unbuffered Reporting (13/18)
6 Buffered Reporting (15/20) 6+ Enhanced Buffered Reporting (11/12) 13 Time Synchronization (3/5)
This Certificate includes a summary of the test results as carried out at KEMA in the Netherlands with UniCAsim 61850 version 3.21.02 with test suite 3.21.02 and UniCA 61850 analyzer 4.23.02. The test is based on the UCA International Users Group Device Test Procedures version 2.2b. This document has been issued for information purposes only, and the original paper copy of the KEMA report: No. 74100726-MOC/INC 11-2048 will prevail. The test has been carried out on one single specimen of the product as referred above and submitted to KEMA by Siemens. The manufacturer’s production process has not been assessed. This Certificate does not imply that KEMA has certified or approved any product other than the specimen tested. Arnhem, 25 August 2011 M. Adriaensen R. Schimmel Regional Director Management & Operations Consulting Certification Manager 1 Level A - Independent Test lab with certified ISO 9000 or ISO 17025 Quality System
Page 1/2
Copyright © KEMA Nederland B.V., Arnhem, the Netherlands. All rights reserved. Please note that any electronic version of this KEMA certificate is provided to KEMA’s customer for convenience purposes only. It is prohibited to update or change it in any manner whatsoever, including but not limited to dividing it into parts. In case of a conflict between the electronic version and the original version, the original paper version issued by KEMA will prevail.
1
2
3
4
5
6
7
8
9
1
2
3
4
5
6
7
8
9
Power Quality and Measurements Product Catalog · Siemens SR 10 · Edition 2
Products – SICAM T
3/16
Products – SICAM T
1
2
3
4
5
6
7
8
9
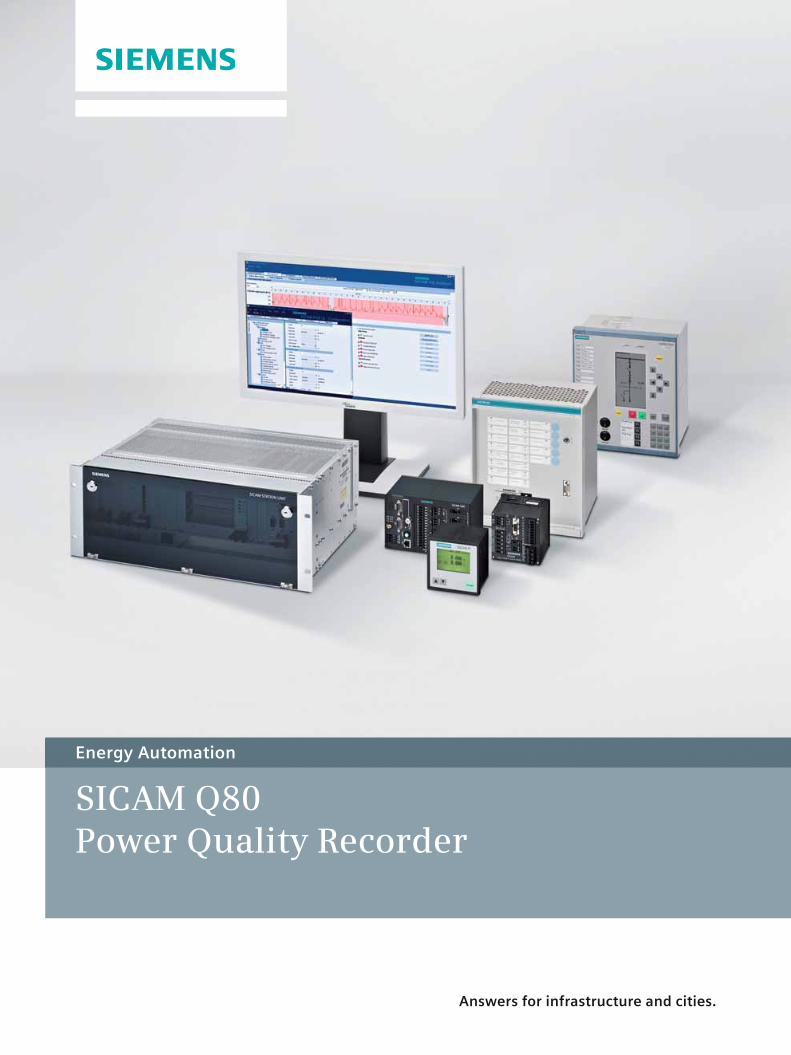
Energy Automation
Answers for infrastructure and cities.
SICAM Q80 Power Quality Recorder
Power Quality and Measurements Product Catalog · Siemens SR 10 · Edition 2 4/2
Contents – SICAM Q80
1
2
3
4
5
6
7
8
9
Page
Description, function overview 4/3
Power quality 4/5
Standards 4/10
Measurement points 4/11
Device functions 4/12
System communication and c onfi guration 4/16
SICAM Q80 Manager 4/17
Connection 4/23
Technical data 4/24
Connection diagrams, dimension drawings 4/28
Selection and ordering data 4/29
CE conformity and disclaimer of liability 4/30

Power Quality and Measurements Product Catalog · Siemens SR 10 · Edition 2
Products – SICAM Q80
4/3
Description, function overview
1
2
3
4
5
6
7
8
9
DescriptionPower quality is a complex issue. The voltage quality is affected by all parties connected in the power system: Power utilities of transmission and distribution, power producers and consumers. Inadequate power quality has an adverse effect on the dependability of loads in the power supply system, and can have serious consequences.SICAM Q80 is a compact and powerful recorder designed for utilities and industries to continuously monitor the power quality for regulatory purposes (e.g. evaluation against the standards) as well as event-based recordings for explanatory purposes (e.g. wave shape recording), from the generation plant to the last customer in the electrical supply chain.With SICAM Q80, the quality of the power supply system can be continuously monitored. This can be based on the quality criteria defi ned in the European electricity supply system quality standard EN 50160 or other assessment criteria. Moreover, data that are above or below the defi ned threshold values are stored and can thus be used for a meaningful overall analysis.It provides information that allows to see the whole electri-cal healthy of the power system!
Field of application of SICAM Q80• Regulatory power quality application: Measurement,
comparison, and profi ling of power quality parameters at the individual electrical system interfaces: E.g. generation, transmission, subtransmission and distribution systems.
• Explanatory power quality application: Disturbance record-ing (e.g. waveform capture) support to understand the causes and consequences of power quality problems.
Benefi ts• Customer satisfaction: Companies with a suitable power
quality monitoring system are proven to be more reliable suppliers and users of energy.
• Asset protection: Early identifi cation of disturbances and active response to them. Comprehensive information for enhancing the visibility and control of assets at the edge of the grid.
• In case of negotiations or disputes, power quality monitor-ing provides evidences to align interests and to support agreements between parts.
• Quality of supply is in the interests of power utilities, regulators, consumers, and the environment.
Function overviewMeasurement of continuous phenomena and disturbances according to the necessary accuracy requirements, as stipulated in IEC 61000-4-15, IEC 61000-4-7 and IEC 61000-4-30 (Class A).
Recording and evaluation• Voltage frequency: Frequency deviation• Slow voltage variation: Detection and monitoring of
supply interruption• Rapid voltage variations: Voltage dips, voltage swells,
rapid voltage changes and voltage fl uctuations (fl icker)• Power line signaling superimposed on the supply voltage• Voltage waveshape: Harmonics (up to the 50th harmonic)
and up to 10 interharmonics• Flexible value limit and event defi nition• Fault recording triggered by waveform and binary values• Comparison and reporting of power quality profi le accord-
ing to EN 50160 or local standards.
SR10
.2.1
-20
30
.ep
s
Fig. 4/1 SICAM Q80 Power Quality Recorder

Power Quality and Measurements Product Catalog · Siemens SR 10 · Edition 2
Products – SICAM Q80
4/4
Description, function overview
1
2
3
4
5
6
7
8
9
Features• Suitable for monitoring single-phase, 3- and 4-wire power
systems (up to 1000 Vrms)• 4 voltage, 4 current, or 8 voltage measuring channels• Standard: 4 binary inputs, 4 binary outputs• Sampling rate 10 kHz for network analysis• Measurement accuracy 0.1 % of the range• High local storage capability: Removable compact fl ash
(standard delivery 2 GB)• Enhanced data compression process (power quality data)• Automatic data transfer
• Automatic comparison and reporting of the power quality profi le according to EN 50160 or local standards
• Automatic notifi cation in case of a fault or violations by e-mail, SMS, and fax
• Export functions• Ethernet and modem communication interfaces for
parameterization, remote monitoring, and polling• GPS / DCF-77 / IRIG-B and NTP for synchronization• Network trigger system• Simple operation, compact and robust design.
Current disturbances
Voltage disturbances
Fig. 4/2 Power quality monitoring provides value to everyone – to the local utility, to the consumer, to the local economy and to the environment
SR10
.2.1
-20
31.e
n.t
if
Power Quality and Measurements Product Catalog · Siemens SR 10 · Edition 2
Products – SICAM Q80
4/5
Power quality
1
2
3
4
5
6
7
8
9
Supply qualityQuality is generally recognized as an important aspect of any electricity supply service. Customers care about high quality just as much as low prices. Price and quality are complementary. Together, they defi ne the value that customers derive from the electrical supply service.The quality of the electricity supply provided to fi nal customers results from a range of quality factors, for which different sectors of the electricity industry are responsible. Quality of service in the electrical supply has a number of different dimensions, which can be grouped under three general headings: Commercial relationships between a sup-plier and a user, continuity of supply, and voltage quality.To avoid the high cost of equipment failures, all customers must make sure that they obtain an electricity supply of satisfactory quality, and that their electrical equipment is capable of functioning as required even when small distur-bances occur. In practice, the voltage can never be perfect.Electrical supply is one of the most essential basic services supporting an industrial society. Electricity consumers require this basic service:• To be available all the time (i.e. a high level of reliability) • To enable all consumers’ electrical equipment to work
safely and satisfactorily (i.e. a high level of power quality).
Voltage qualityVoltage quality, also termed power quality (PQ), covers a variety of characteristics in a power system. Chief among these is the quality of the voltage waveform. There are several technical standards defi ning voltage quality criteria, but ultimately quality is determined by the ability of custom-ers’ equipment to perform properly. The relevant technical phenomena are: Variations in frequency, fl uctuations in voltage magnitude, short-duration voltage variations (dips, swells, and short interruptions), long-duration voltage varia-tions (overvoltages or undervoltages), transients (temporar-ily transient overvoltages), waveform distortion, etc. In many countries, voltage quality is regulated to some extent, often using industry-wide accepted standards or practices to provide indicative levels of performance.
Everybody is now aware of the effects of poor power quality, but few really have it under control. The levels of power quality disturbances need to be monitored weekly, sometimes even daily, in order to trigger appropriate remedial measures before severe consequences occur.The power utility therefore has an interest in monitoring the power quality, showing that it is acting correctly and improving its know-how about the system. This ensures customer satisfaction by providing electricity with quality and reliability.The availability and quality of power is of even greater concern to distribution companies. The liberalization of the electricity market has put them in the uncomfortable position of being affected by other players’ actions. This situation has been stabilizing and power quality is becoming a top priority issue in the restructuring process. With increas-ing customer awareness of energy effi ciency, it is clear that the quality of supply will be receiving much attention.Most power quality problems directly concern the end user, or are experienced at this level. End users have to measure the power quality and invest in local mitigation facilities. However, consumers often turn to the utility company, instead, and exert pressure to obtain the required supply quality. The EN 50160 power quality standard describes the main characteristics of the voltage at the customer’s supply terminals in public low, medium, and, in the near future, high-voltage systems, under normal operating conditions.
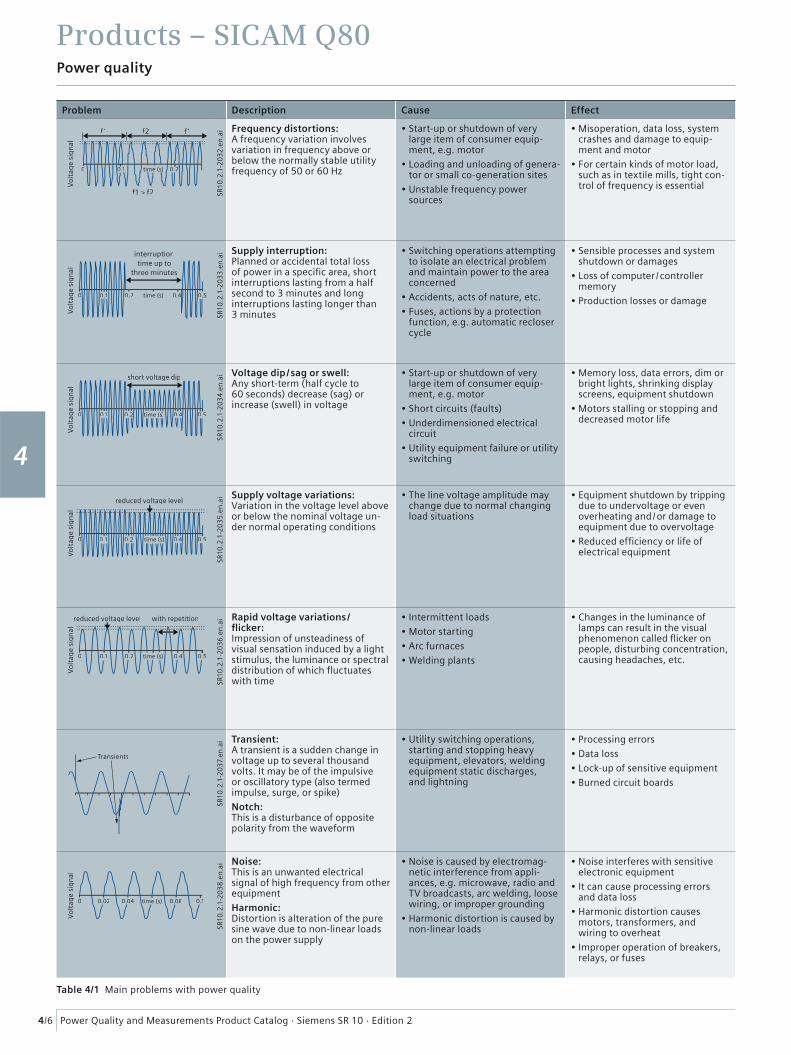
Power Quality and Measurements Product Catalog · Siemens SR 10 · Edition 2
Products – SICAM Q80
4/6
Power quality
1
2
3
4
5
6
7
8
9
Problem Description Cause Effect
0 time (s)0.1 0.2
Vo
ltag
e si
gn
al
f1
f1 > f2
f1f2
SR10
.2.1
-20
32
.en
.ai Frequency distortions:
A frequency variation involves variation in frequency above or below the normally stable utility frequency of 50 or 60 Hz
• Start-up or shutdown of very large item of consumer equip-ment, e.g. motor
• Loading and unloading of genera-tor or small co-generation sites
• Unstable frequency power sources
• Misoperation, data loss, system crashes and damage to equip-ment and motor
• For certain kinds of motor load, such as in textile mills, tight con-trol of frequency is essential
time (s)0 0.1 0.2 0.4 0.5
interruptiontime up to
three minutes
Vo
ltag
e si
gn
al
SR10
.2.1
-20
33
.en
.ai Supply interruption:
Planned or accidental total loss of power in a specifi c area, short interruptions lasting from a half second to 3 minutes and long interruptions lasting longer than 3 minutes
• Switching operations attempting to isolate an electrical problem and maintain power to the area concerned
• Accidents, acts of nature, etc.
• Fuses, actions by a protection function, e.g. automatic recloser cycle
• Sensible processes and system shutdown or damages
• Loss of computer / controller memory
• Production losses or damage
time (s)0 0.1 0.2 0.4 0.5
short voltage dip
Vo
ltag
e si
gn
al
SR10
.2.1
-20
34
.en
.ai Voltage dip / sag or swell:
Any short-term (half cycle to 60 seconds) decrease (sag) or increase (swell) in voltage
• Start-up or shutdown of very large item of consumer equip-ment, e.g. motor
• Short circuits (faults)
• Underdimensioned electrical circuit
• Utility equipment failure or utility switching
• Memory loss, data errors, dim or bright lights, shrinking display screens, equipment shutdown
• Motors stalling or stopping and decreased motor life
time (s)0 0.1 0.2 0.4 0.5
reduced voltage level
Vo
ltag
e si
gn
al
SR10
.2.1
-20
35
.en
.ai Supply voltage variations:
Variation in the voltage level above or below the nominal voltage un-der normal operating conditions
• The line voltage amplitude may change due to normal changing load situations
• Equipment shutdown by tripping due to undervoltage or even overheating and / or damage to equipment due to overvoltage
• Reduced effi ciency or life of electrical equipment
time (s)0 0.1 0.2 0.4 0.5
with repetitionreduced voltage level
Vo
ltag
e si
gn
al
SR10
.2.1
-20
36
.en
.ai Rapid voltage variations /
fl icker: Impression of unsteadiness of visual sensation induced by a light stimulus, the luminance or spectral distribution of which fl uctuates with time
• Intermittent loads
• Motor starting
• Arc furnaces
• Welding plants
• Changes in the luminance of lamps can result in the visual phenomenon called fl icker on people, disturbing concentration, causing headaches, etc.
Transients
SR10
.2.1
-20
37.
en.a
i Transient: A transient is a sudden change in voltage up to several thousand volts. It may be of the impulsive or oscillatory type (also termed impulse, surge, or spike)
Notch: This is a disturbance of opposite polarity from the waveform
• Utility switching operations, starting and stopping heavy equipment, elevators, welding equipment static discharges, and lightning
• Processing errors
• Data loss
• Lock-up of sensitive equipment
• Burned circuit boards
time (s)0 0.02 0.04 0.08 0.1
Vo
ltag
e si
gn
al
SR10
.2.1
-20
38
.en
.ai Noise:
This is an unwanted electrical signal of high frequency from other equipment
Harmonic: Distortion is alteration of the pure sine wave due to non-linear loads on the power supply
• Noise is caused by electromag-netic interference from appli-ances, e.g. microwave, radio and TV broadcasts, arc welding, loose wiring, or improper grounding
• Harmonic distortion is caused by non-linear loads
• Noise interferes with sensitive electronic equipment
• It can cause processing errors and data loss
• Harmonic distortion causes motors, transformers, and wiring to overheat
• Improper operation of breakers, relays, or fuses
Table 4/1 Main problems with power quality
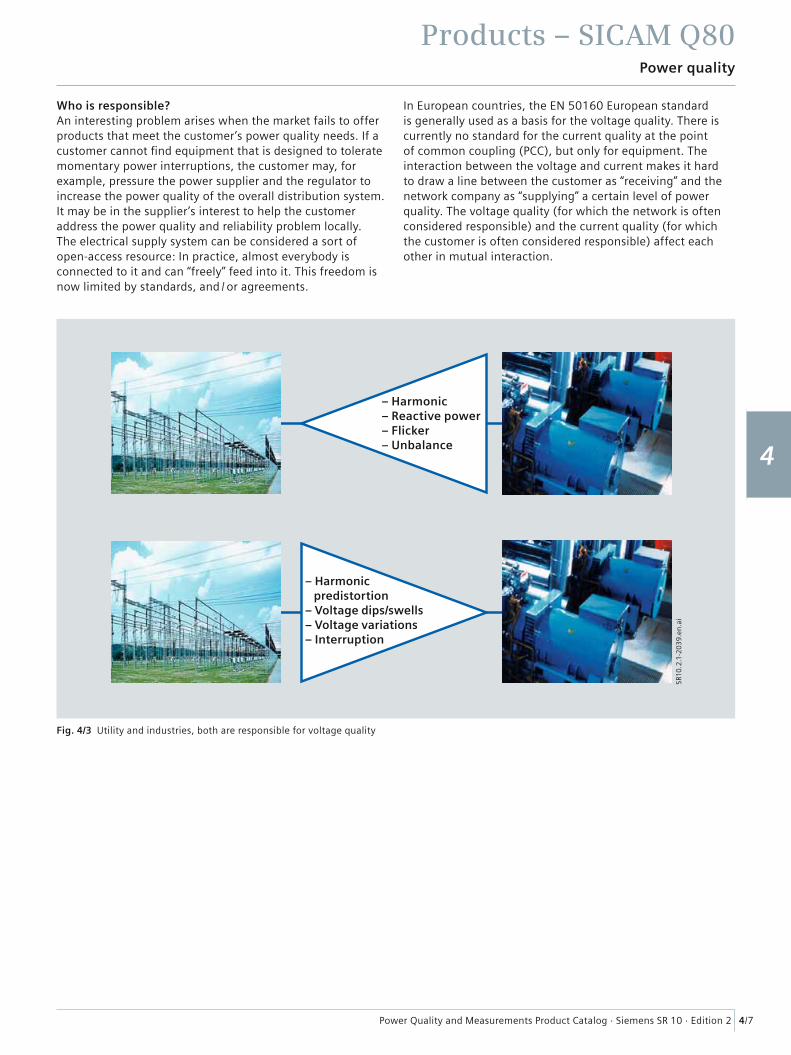
Power Quality and Measurements Product Catalog · Siemens SR 10 · Edition 2
Products – SICAM Q80
4/7
Power quality
1
2
3
4
5
6
7
8
9
Who is responsible?An interesting problem arises when the market fails to offer products that meet the customer’s power quality needs. If a customer cannot fi nd equipment that is designed to tolerate momentary power interruptions, the customer may, for example, pressure the power supplier and the regulator to increase the power quality of the overall distribution system. It may be in the supplier’s interest to help the customer address the power quality and reliability problem locally.The electrical supply system can be considered a sort of open-access resource: In practice, almost everybody is connected to it and can “freely” feed into it. This freedom is now limited by standards, and / or agreements.
In European countries, the EN 50160 European standard is generally used as a basis for the voltage quality. There is currently no standard for the current quality at the point of common coupling (PCC), but only for equipment. The interaction between the voltage and current makes it hard to draw a line between the customer as “receiving” and the network company as “supplying” a certain level of power quality. The voltage quality (for which the network is often considered responsible) and the current quality (for which the customer is often considered responsible) affect each other in mutual interaction.
Fig. 4/3 Utility and industries, both are responsible for voltage quality
SR10
.2.1
-20
39.
en.a
i
– Harmonic– Reactive power– Flicker– Unbalance
– Harmonic predistortion– Voltage dips/swells– Voltage variations– Interruption
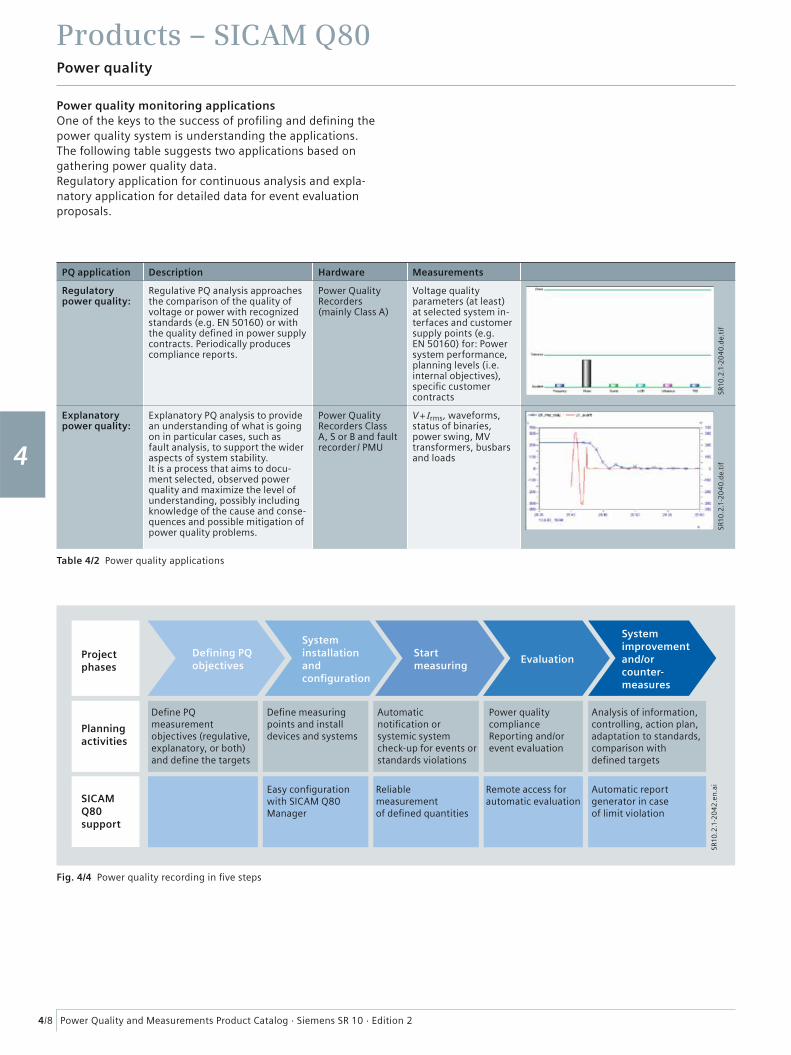
Power Quality and Measurements Product Catalog · Siemens SR 10 · Edition 2
Products – SICAM Q80
4/8
Power quality
1
2
3
4
5
6
7
8
9
Power quality monitoring applicationsOne of the keys to the success of profi ling and defi ning the power quality system is understanding the applications. The following table suggests two applications based on gathering power quality data. Regulatory application for continuous analysis and expla-natory application for detailed data for event evaluation pro posals.
PQ application Description Hardware Measurements
Regulatory power quality:
Regulative PQ analysis approaches the comparison of the quality of voltage or power with recognized standards (e.g. EN 50160) or with the quality defi ned in power supply contracts. Periodically produces compliance reports.
Power Quality Recorders (mainly Class A)
Voltage quality parameters (at least) at selected system in-terfaces and customer supply points (e.g. EN 50160) for: Power system performance,planning levels (i.e. internal objectives),specifi c customer contracts
Explanatory power quality:
Explanatory PQ analysis to provide an understanding of what is going on in particular cases, such as fault analysis, to support the wider aspects of system stability.It is a process that aims to docu-ment selected, observed power quality and maximize the level of understanding, possibly including knowledge of the cause and conse-quences and possible mitigation of power quality problems.
Power Quality Recorders Class A, S or B and fault recorder / PMU
V + Irms, waveforms, status of binaries, power swing, MV transformers, busbars and loads
Define PQ measurement objectives (regulative, explanatory, or both)and define the targets
Defining PQobjectives
Startmeasuring
Evaluation
Systeminstallationandconfiguration
Systemimprovementand/orcounter-measures
Planningactivities
SICAMQ80support
Projectphases
Define measuring points and installdevices and systems
Easy configurationwith SICAM Q80Manager
Reliable measurement of defined quantities
Remote access forautomatic evaluation
Automatic reportgenerator in caseof limit violation
Automaticnotification orsystemic systemcheck-up for events orstandards violations
Power quality complianceReporting and/orevent evaluation
Analysis of information,controlling, action plan,adaptation to standards,comparison with defined targets
SR10
.2.1
-20
42.e
n.a
i
Fig. 4/4 Power quality recording in fi ve steps
Table 4/2 Power quality applications
SR10
.2.1
-20
40
.de.
tif
SR10
.2.1
-20
40
.de.
tif
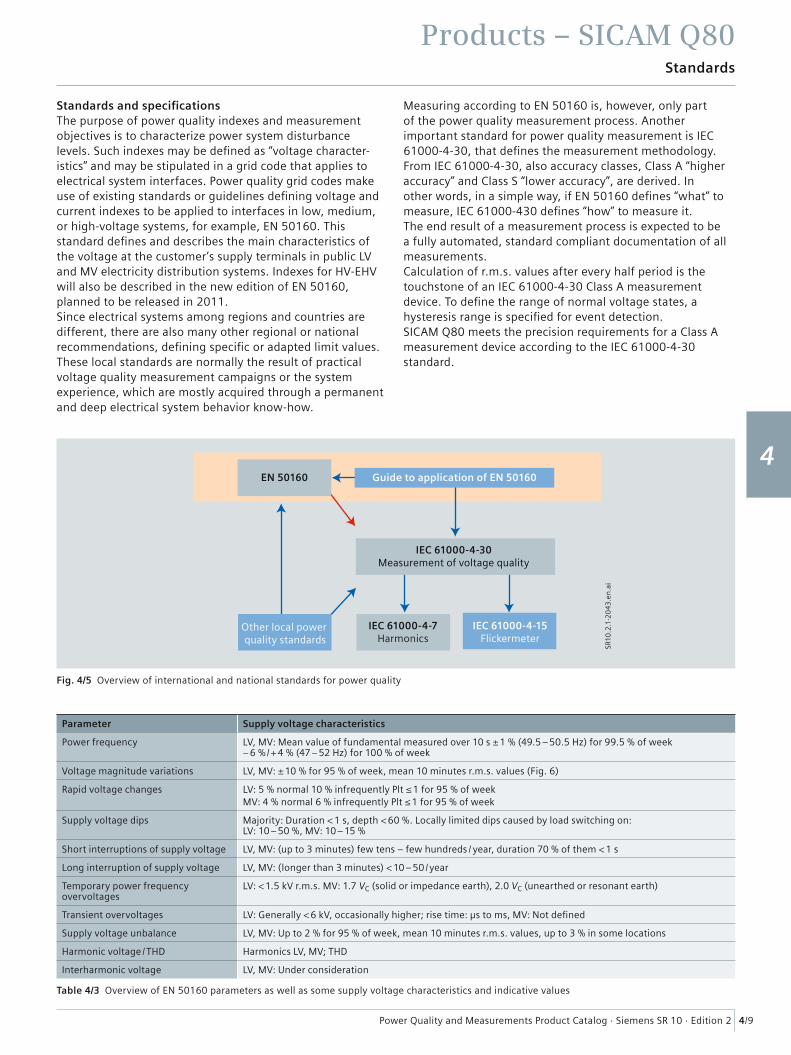
Power Quality and Measurements Product Catalog · Siemens SR 10 · Edition 2
Products – SICAM Q80
4/9
Standards
1
2
3
4
5
6
7
8
9
Standards and specifi cationsThe purpose of power quality indexes and measurement objectives is to characterize power system disturbance levels. Such indexes may be defi ned as “voltage character-istics” and may be stipulated in a grid code that applies to electrical system interfaces. Power quality grid codes make use of existing standards or guidelines defi ning voltage and current indexes to be applied to interfaces in low, medium, or high-voltage systems, for example, EN 50160. This standard defi nes and describes the main characteristics of the voltage at the customer’s supply terminals in public LV and MV electricity distribution systems. Indexes for HV-EHV will also be described in the new edition of EN 50160, planned to be released in 2011.Since electrical systems among regions and countries are different, there are also many other regional or national recommendations, defi ning specifi c or adapted limit values. These local standards are normally the result of practical voltage quality measurement campaigns or the system experience, which are mostly acquired through a permanent and deep electrical system behavior know-how.
Measuring according to EN 50160 is, however, only part of the power quality measurement process. Another important standard for power quality measurement is IEC 61000-4-30, that defi nes the measurement methodology. From IEC 61000-4-30, also accuracy classes, Class A “higher accuracy” and Class S “lower accuracy”, are derived. In other words, in a simple way, if EN 50160 defi nes “what” to measure, IEC 61000-430 defi nes “how” to measure it.The end result of a measurement process is expected to be a fully automated, standard compliant documentation of all measurements.Calculation of r.m.s. values after every half period is the touchstone of an IEC 61000-4-30 Class A measurement device. To defi ne the range of normal voltage states, a hysteresis range is specifi ed for event detection.SICAM Q80 meets the precision requirements for a Class A measurement device according to the IEC 61000-4-30 standard.
Parameter Supply voltage characteristics
Power frequency LV, MV: Mean value of fundamental measured over 10 s ± 1 % (49.5 – 50.5 Hz) for 99.5 % of week – 6 % / + 4 % (47 – 52 Hz) for 100 % of week
Voltage magnitude variations LV, MV: ± 10 % for 95 % of week, mean 10 minutes r.m.s. values (Fig. 6)
Rapid voltage changes LV: 5 % normal 10 % infrequently Plt ≤ 1 for 95 % of weekMV: 4 % normal 6 % infrequently Plt ≤ 1 for 95 % of week
Supply voltage dips Majority: Duration < 1 s, depth < 60 %. Locally limited dips caused by load switching on: LV: 10 – 50 %, MV: 10 – 15 %
Short interruptions of supply voltage LV, MV: (up to 3 minutes) few tens – few hundreds / year, duration 70 % of them < 1 s
Long interruption of supply voltage LV, MV: (longer than 3 minutes) < 10 – 50 / year
Temporary power frequency overvoltages
LV: < 1.5 kV r.m.s. MV: 1.7 VC (solid or impedance earth), 2.0 VC (unearthed or resonant earth)
Transient overvoltages LV: Generally < 6 kV, occasionally higher; rise time: μs to ms, MV: Not defi ned
Supply voltage unbalance LV, MV: Up to 2 % for 95 % of week, mean 10 minutes r.m.s. values, up to 3 % in some locations
Harmonic voltage / THD Harmonics LV, MV; THD
Interharmonic voltage LV, MV: Under consideration
Table 4/3 Overview of EN 50160 parameters as well as some supply voltage characteristics and indicative values
Fig. 4/5 Overview of international and national standards for power quality
SR10
.2.1
-20
43.e
n.a
i
Guide to application of EN 50160EN 50160
IEC 61000-4-30Measurement of voltage quality
IEC 61000-4-15Flickermeter
IEC 61000-4-7Harmonics
Other local power quality standards

Power Quality and Measurements Product Catalog · Siemens SR 10 · Edition 2
Products – SICAM Q80
4/10
Standards
1
2
3
4
5
6
7
8
9
StandardsIEC 61000-4-30, Ed. 2, 2008-10Power Quality Measurement Methods: This standard defi nes the methods for measurement and interpretation of results for power quality parameters in AC supply systems.
IEC 61000-4-15:1997 + A1:2003Flickermeter, Functional and Design Specifi cations: This section of IEC 61000 provides a functional and design specifi cation for fl icker measuring apparatus intended to indicate the correct fl icker perception level for all practical voltage fl uctuation waveforms.
IEC 61000-4-7, Ed. 2, 2002-08General Guide on Harmonics and Interharmonics: This is a general guide on harmonics and interharmonics measure-ments and instrumentation, for power supply systems and equipment connected thereto.
Odd harmonics Even harmonics
Not multiples of 3 Multiples of 3
Order h Relativevoltage (%)
Order h Relativevoltage (%)
Order h Relativevoltage (%)
5 6 3 5 2 2
7 5 9 1.5 4 1
11 3.5 15 0.5 6 … 24 0.5
13 3 21 0.5
17 2
19 1.5
23 1.5
25 1.5
Table 4/4 Values of individual harmonic voltages at the supply terminals for orders up to 25, given in percent of VN
Voltage dip, ∆t > 10 ms
Short supplyinterruption
Range of the supply voltage variationsduring 95 % of the supplying time
1.1 VA
1 VN (r.m.s.)
9 VN (r.m.s.)VN (r.m.s.)
VA
V (r.m.s.)
V
0.9 VA
< 3 min∆t
Fig. 4/6 Illustration of a voltage dip and a short supply interruption, classifi ed according to EN 50160;
VN – nominal voltage of the supply system (r.m.s.), VA – amplitude of the supply voltage, V(r.m.s.) – the actual r.m.s. value of the supply voltage
SR10
.2.1
-20
44
.en
.ai
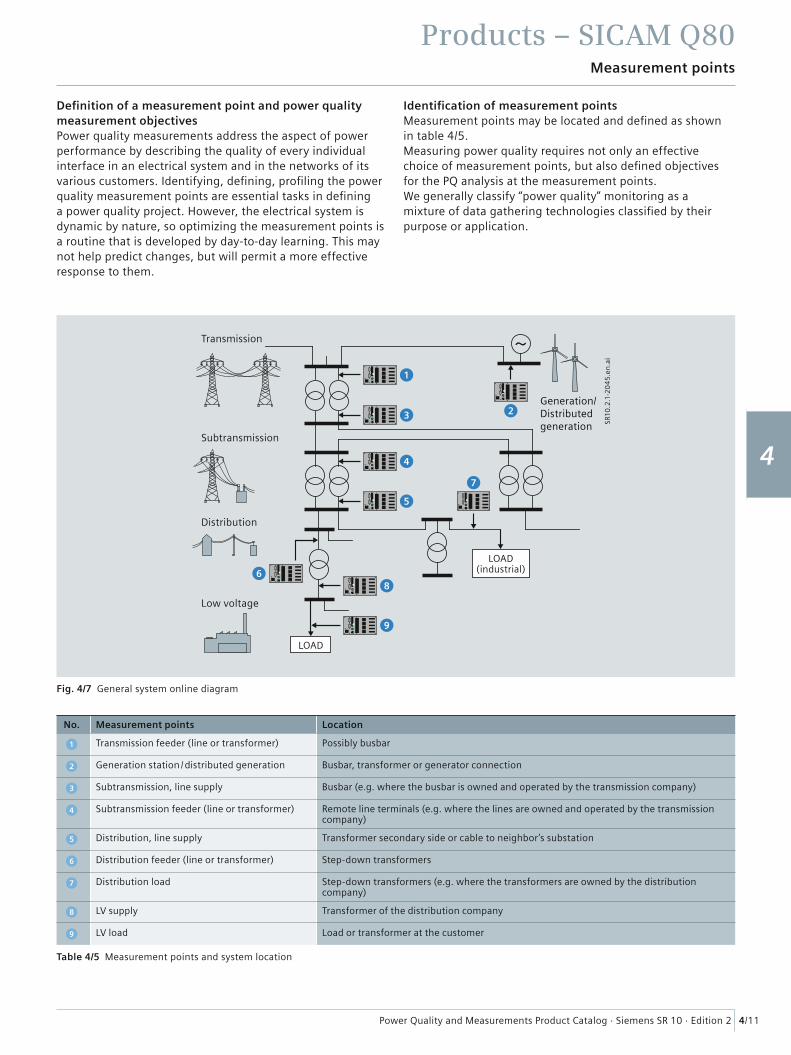
Power Quality and Measurements Product Catalog · Siemens SR 10 · Edition 2
Products – SICAM Q80
4/11
Measurement points
1
2
3
4
5
6
7
8
9
Defi nition of a measurement point and power quality measurement objectivesPower quality measurements address the aspect of power performance by describing the quality of every individual interface in an electrical system and in the networks of its various customers. Identifying, defi ning, profi ling the power quality measurement points are essential tasks in defi ning a power quality project. However, the electrical system is dynamic by nature, so optimizing the measurement points is a routine that is developed by day-to-day learning. This may not help predict changes, but will permit a more effective response to them.
Identifi cation of measurement pointsMeasurement points may be located and defi ned as shown in table 4/5.Measuring power quality requires not only an effective choice of measurement points, but also defi ned objectives for the PQ analysis at the measurement points.We generally classify “power quality” monitoring as a mixture of data gathering technologies classifi ed by their purpose or application.
No. Measurement points Location
1 Transmission feeder (line or transformer) Possibly busbar
2 Generation station / distributed generation Busbar, transformer or generator connection
3 Subtransmission, line supply Busbar (e.g. where the busbar is owned and operated by the transmission company)
4 Subtransmission feeder (line or transformer) Remote line terminals (e.g. where the lines are owned and operated by the transmission company)
5 Distribution, line supply Transformer secondary side or cable to neighbor’s substation
6 Distribution feeder (line or transformer) Step-down transformers
7 Distribution load Step-down transformers (e.g. where the transformers are owned by the distribution company)
8 LV supply Transformer of the distribution company
9 LV load Load or transformer at the customer
Table 4/5 Measurement points and system location
1
3
4
5
68
7
2
9
Transmission
Subtransmission
Distribution
Low voltage
LOAD
LOAD(industrial)
Generation/Distributed generation
Fig. 4/7 General system online diagram
SR10
.2.1
-20
45
.en
.ai
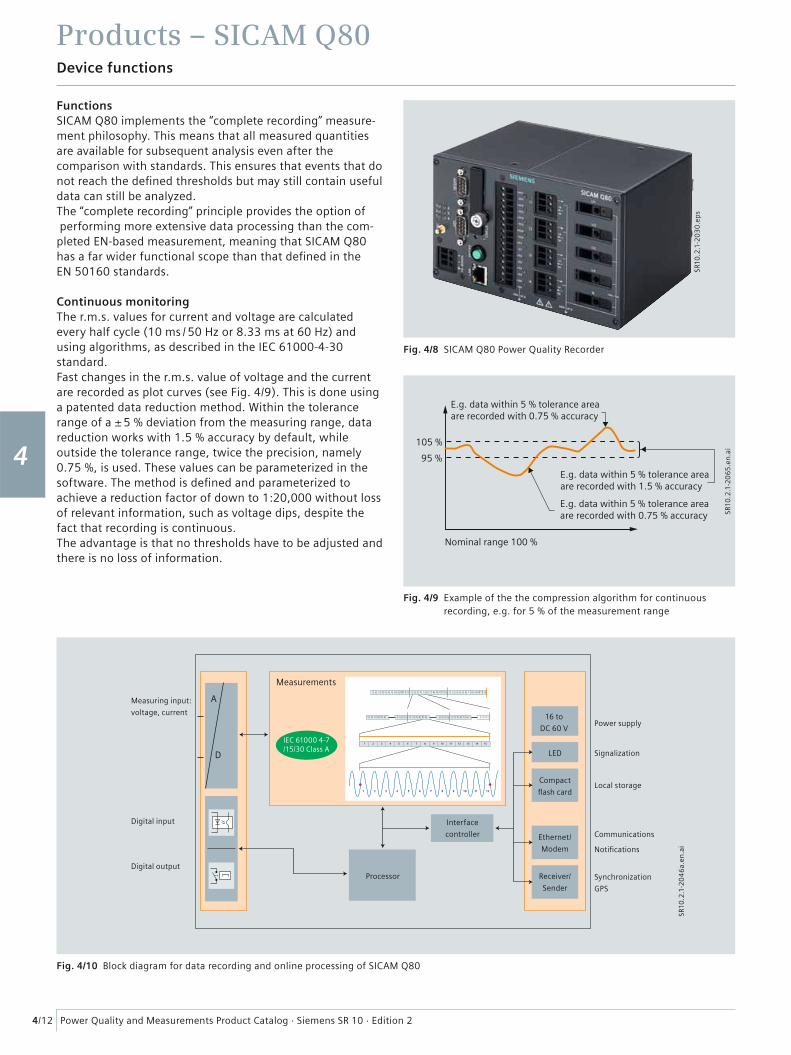
Power Quality and Measurements Product Catalog · Siemens SR 10 · Edition 2
Products – SICAM Q80
4/12
Device functions
1
2
3
4
5
6
7
8
9
FunctionsSICAM Q80 implements the “complete recording” measure-ment philosophy. This means that all measured quantities are available for subsequent analysis even after the comparison with standards. This ensures that events that do not reach the defi ned thresholds but may still contain useful data can still be analyzed.The “complete recording” principle provides the option of performing more extensive data processing than the com-pleted EN-based measurement, meaning that SICAM Q80 has a far wider functional scope than that defi ned in the EN 50160 standards.
Continuous monitoringThe r.m.s. values for current and voltage are calculated every half cycle (10 ms / 50 Hz or 8.33 ms at 60 Hz) and using algorithms, as described in the IEC 61000-4-30 standard.Fast changes in the r.m.s. value of voltage and the current are recorded as plot curves (see Fig. 4/9). This is done using a patented data reduction method. Within the tolerance range of a ± 5 % deviation from the measuring range, data reduction works with 1.5 % accuracy by default, while outside the tolerance range, twice the precision, namely 0.75 %, is used. These values can be parameterized in the software. The method is defi ned and parameterized to achieve a reduction factor of down to 1:20,000 without loss of relevant information, such as voltage dips, despite the fact that recording is continuous.The advantage is that no thresholds have to be adjusted and there is no loss of information.
Fig. 4/8 SICAM Q80 Power Quality Recorder
SR10
.2.1
-20
30
.ep
s
Fig. 4/9 Example of the the compression algorithm for continuous recording, e.g. for 5 % of the measurement range
SR10
.2.1
-20
65
.en
.ai
E.g. data within 5 % tolerance areaare recorded with 0.75 % accuracy
E.g. data within 5 % tolerance areaare recorded with 0.75 % accuracy
E.g. data within 5 % tolerance areaare recorded with 1.5 % accuracy
105 %
95 %
Nominal range 100 %
Fig. 4/10 Block diagram for data recording and online processing of SICAM Q80
SR10
.2.1
-20
46
a.en
.ai
121110987654321121110987654321121110987654321
65432
1 2 3 4 5 6 7 8 9 10 11 12 13 14 15
108 109 200 6543211 108 109 200108 109 200 654321
1 2 3 4 5 6 7 8 9 10 11 12
Measuring input:
voltage, currentPower supply
16 to
DC 60 V
LED
Compact
flash card
Ethernet/
Modem
Receiver/
Sender
Measurements
IEC 61000 4-7/15/30 Class A Signalization
Local storage
Communications
Notifications
Synchronization
GPS
A
D
Digital input
Digital outputProcessor
Interface
controller

Power Quality and Measurements Product Catalog · Siemens SR 10 · Edition 2
Products – SICAM Q80
4/13
Device functions
1
2
3
4
5
6
7
8
9
Recording of eventsThe plots of the r.m.s. value curves are the basis for capturing events. A deviation of the r.m.s. in one direction results in a new data point in the reduced curves; an event is characterized and bounded by two transitions: One from the normal to the faulty voltage level and one from the faulty level back to the normal level. The normal-to-fault and back-to-normal transitions are defi ned as a standard ± difference from a defi nable hysteresis voltage.The duration of the event is mea-sured between the two transitions. The depth of the result is determined from the minimum or maximum of the amplitude in the region affected by the fault. This assumes that the amplitude remains almost constant during the fault. According to the currently valid standard, every devia-tion > 10 % of the nominal voltage counts as an event. Depending on the duration and amplitude, further distinctions are made into dips and short / long interruptions.
Harmonics and interharmonicsThe frequencies in the voltage, current, and therefore also in the power, are calculated by means of Fast Fourier Transform (FFT). The FFT is calculated seamlessly with a square window over each group of 10 periods. This corresponds to the specifi cations for measuring harmonics and interharmonics in power supply networks defi ned in EN 61000-4-7.
FlickerLow-frequency amplitude fl uctua-tions in the network, in turn, cause the luminous density in lamps to fl uctuate. This is perceptible as fl ickering. Above a certain threshold of perceptibility, this is considered a nuisance. Such fl uctuations can be measured using a fl ickermeter.The fl icker is calculated with a sampling rate of 100 Hz according to the description of a fl ickermeter in the EN 61000-4-15 standard.
Fig. 4/11 Harmonics overview
SR10
.2.1
-20
48
.en
.tif
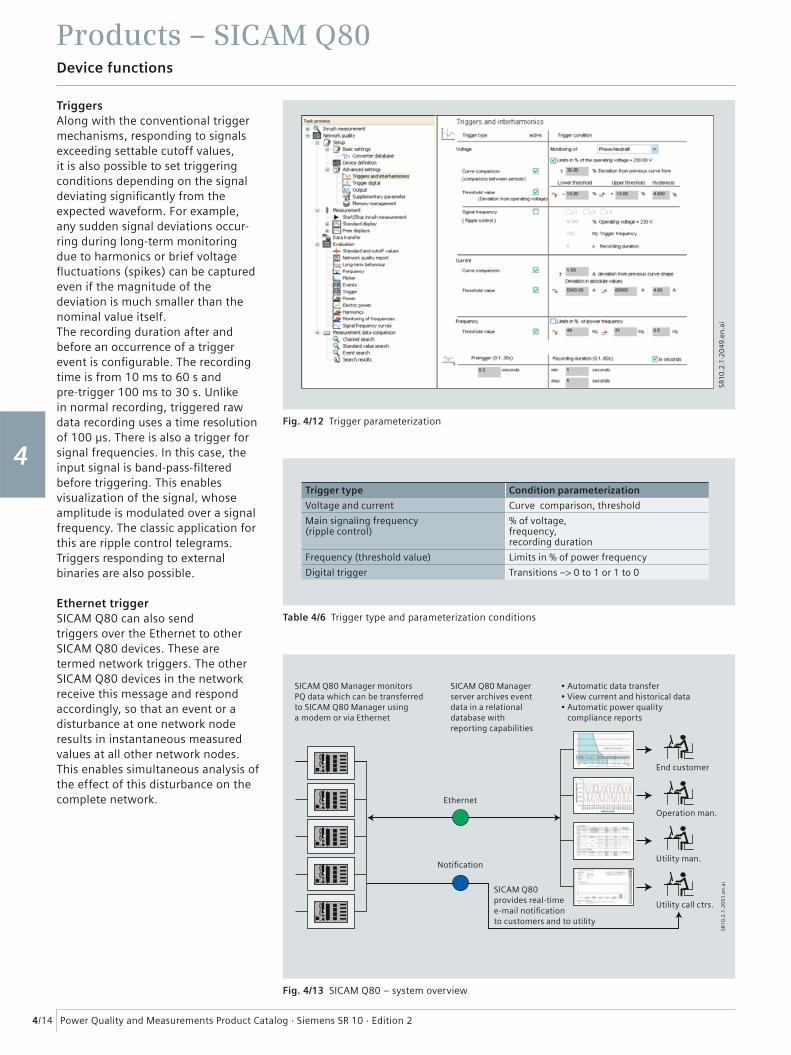
Power Quality and Measurements Product Catalog · Siemens SR 10 · Edition 2
Products – SICAM Q80
4/14
Device functions
1
2
3
4
5
6
7
8
9
TriggersAlong with the conventional trigger mechanisms, responding to signals exceeding settable cutoff values, it is also possible to set triggering conditions depending on the signal deviating signifi cantly from the expected waveform. For example, any sudden signal deviations occur-ring during long-term monitoring due to harmonics or brief voltage fl uctuations (spikes) can be captured even if the magnitude of the deviation is much smaller than the nominal value itself.The recording duration after and before an occurrence of a trigger event is confi gurable. The recording time is from 10 ms to 60 s and pre-trigger 100 ms to 30 s. Unlike in normal recording, triggered raw data recording uses a time resolution of 100 μs. There is also a trigger for signal frequencies. In this case, the input signal is band-pass-fi ltered before triggering. This enables visualization of the signal, whose amplitude is modulated over a signal frequency. The classic application for this are ripple control telegrams.Triggers responding to external binaries are also possible.
Ethernet triggerSICAM Q80 can also send triggers over the Ethernet to other SICAM Q80 devices. These are termed network triggers. The other SICAM Q80 devices in the network receive this message and respond accordingly, so that an event or a disturbance at one network node results in instantaneous measured values at all other network nodes. This enables simultaneous analysis of the effect of this disturbance on the complete network.
Fig. 4/12 Trigger parameterization
Trigger type Condition parameterization
Voltage and current Curve comparison, threshold
Main signaling frequency(ripple control)
% of voltage, frequency, recording duration
Frequency (threshold value) Limits in % of power frequency
Digital trigger Transitions –> 0 to 1 or 1 to 0
Table 4/6 Trigger type and parameterization conditions
Fig. 4/13 SICAM Q80 – system overview
SICAM Q80 Manager monitorsPQ data which can be transferredto SICAM Q80 Manager usinga modem or via Ethernet
SICAM Q80 Managerserver archives eventdata in a relationaldatabase withreporting capabilities
Ethernet
End customer
Operation man.
Utility man.
Utility call ctrs.
Notification
SICAM Q80provides real-timee-mail notificationto customers and to utility
• Automatic data transfer• View current and historical data• Automatic power quality compliance reports
SR1
0.2
.1-2
05
1.e
n.a
iSR
10.2
.1-2
04
9.en
.ai
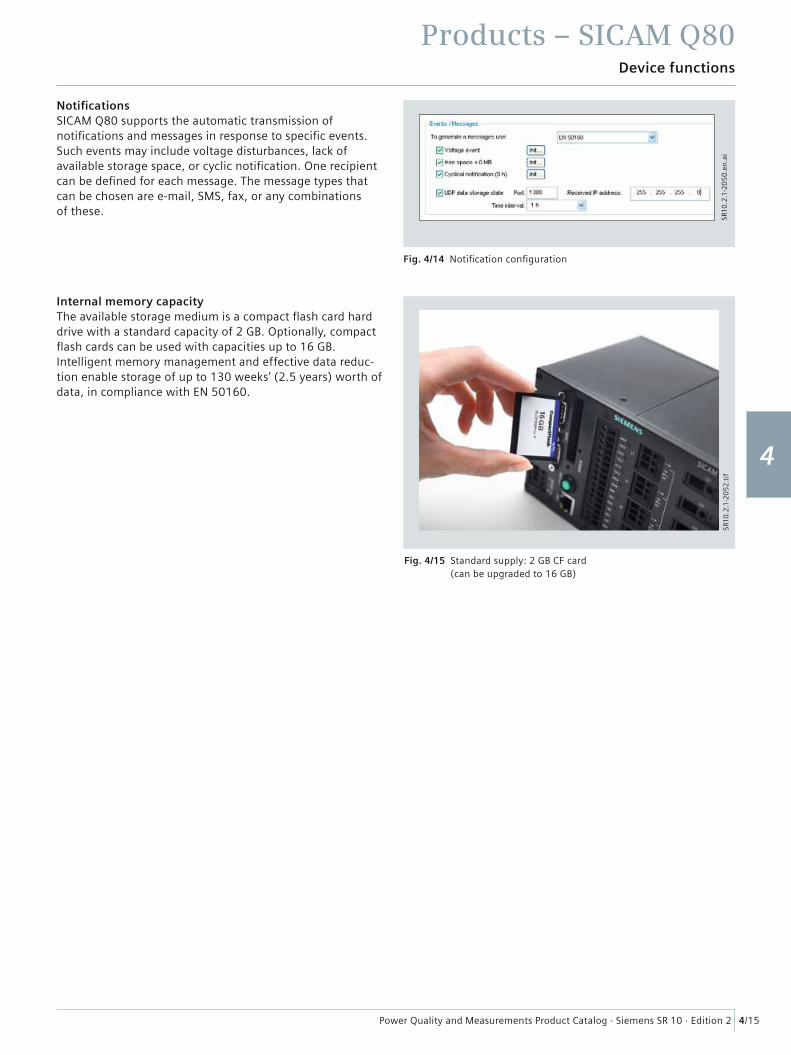
Power Quality and Measurements Product Catalog · Siemens SR 10 · Edition 2
Products – SICAM Q80
4/15
Device functions
1
2
3
4
5
6
7
8
9
Notifi cationsSICAM Q80 supports the automatic transmission of notifi cations and messages in response to specifi c events. Such events may include voltage disturbances, lack of available storage space, or cyclic notifi cation. One recipient can be defi ned for each message. The message types that can be chosen are e-mail, SMS, fax, or any combinations of these.
Fig. 4/14 Notifi cation confi guration
SR10
.2.1
-20
50
.en
.ai
Internal memory capacityThe available storage medium is a compact fl ash card hard drive with a standard capacity of 2 GB. Optionally, compact fl ash cards can be used with capacities up to 16 GB. Intelligent memory management and effective data reduc-tion enable storage of up to 130 weeks’ (2.5 years) worth of data, in compliance with EN 50160.
Fig. 4/15 Standard supply: 2 GB CF card (can be upgraded to 16 GB)
SR10
.2.1
-20
52
.tif
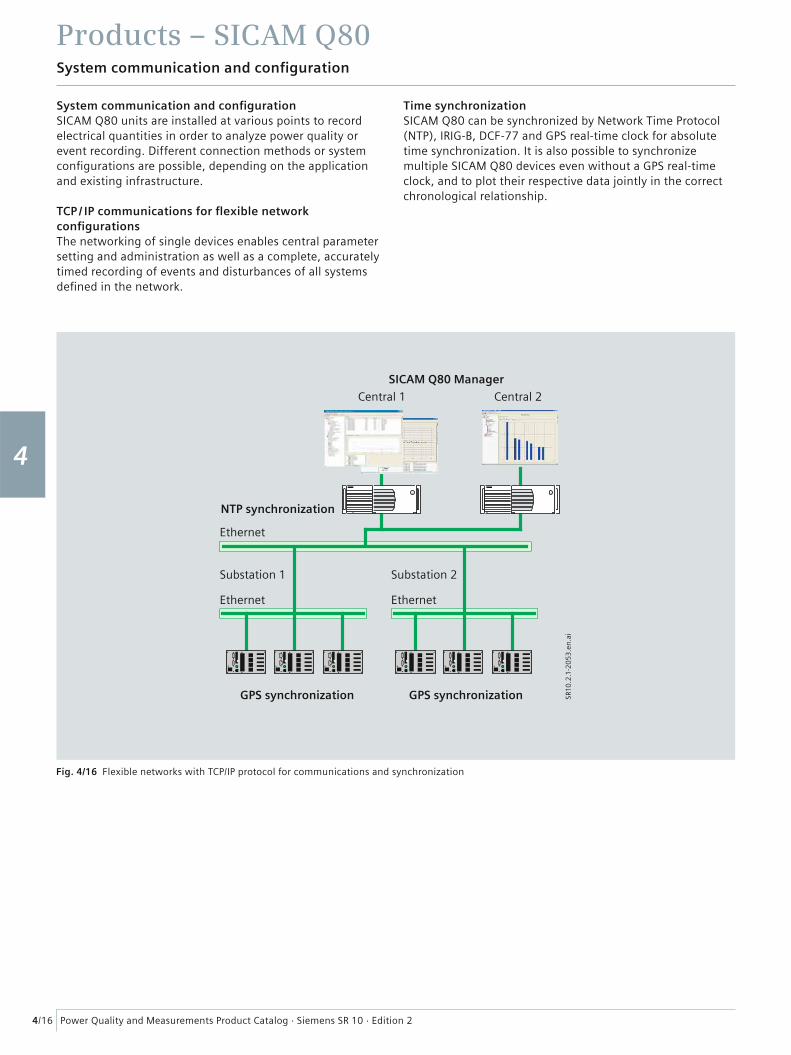
Power Quality and Measurements Product Catalog · Siemens SR 10 · Edition 2
Products – SICAM Q80
4/16
System communication and confi guration
1
2
3
4
5
6
7
8
9
Central 1
Substation 1 Substation 2
GPS synchronization
NTP synchronization
GPS synchronization
Central 2
SICAM Q80 Manager
Ethernet
Ethernet Ethernet
Fig. 4/16 Flexible networks with TCP/IP protocol for communications and synchronization
SR10
.2.1
-20
53
.en
.ai
System communication and c onfi gurationSICAM Q80 units are installed at various points to record electrical quantities in order to analyze power quality or event recording. Different connection methods or system confi gurations are possible, depending on the application and existing infrastructure.
TCP / IP communications for fl exible network c onfi gurationsThe networking of single devices enables central parameter setting and administration as well as a complete, accurately timed recording of events and disturbances of all systems defi ned in the network.
Time synchronizationSICAM Q80 can be synchronized by Network Time Protocol (NTP), IRIG-B, DCF-77 and GPS real-time clock for absolute time synchronization. It is also possible to synchronize multiple SICAM Q80 devices even without a GPS real-time clock, and to plot their respective data jointly in the correct chronological relationship.

Power Quality and Measurements Product Catalog · Siemens SR 10 · Edition 2
Products – SICAM Q80
4/17
Software
1
2
3
4
5
6
7
8
9
SICAM Q80 ManagerThe SICAM Q80 Manager is a complete software tool for parameterization, system overview, evaluations and automatic analyses; it allows the analysis of more than 500 data sets from the SICAM Q80 Power Quality Recorder. It covers the whole chain of power quality analysis from measurement to the provision of important information, enabling remedial measures to be taken to improve power quality.The SICAM Q80 Manager PC software enables user-friendly operation. Setting and other operations are performed in an intuitive manner. Despite the large number of func-tions available, the user interface is clearly organized, in a tree structure similar to the familiar Microsoft Explorer® tree structure. SICAM Q80Manager runs under Microsoft Windows 2000, XP, or Vista.For operation and analysis by the user, the SICAM Q80 Manager software enables central parameter setting of all devices without any special PC knowledge.The SICAM Q80 Manager software is designed to guarantee easy handling of the applications. Conducting measurement according to industry standards requires no special instru-mentation or computer skills. Its function and appearance resembles the familiar Windows-Explorer.The standard software module includes all functions necessary for operation, display, analysis and documentation.
MeasurementImprovement
Datatransmission
Definition ofmeasures
AnalysisReportingand archiving
1
2
34
5
6
Fig. 4/17 Power quality cycle
SR10
.2.1
-20
54
.en
.ai
Fig. 4/18 Measurement overviewSR
10.2
.1-2
05
5.e
n.t
if
Measurement system overviewA topology structure can be created in SICAM Q80 Manager, so that the user can have a clear measurement system structure, with regions, station, voltage level, measurement location and device name information. For each device, the measurement status is reported, so that the last measure-ment time information is available.
Defi ning your own grid code with user-friendly advanced settingsThe process of setting up measurements, data analysis and documentation is streamlined. In SICAM Q80, the EN 50160 measurements are predefi ned and require only very few additional settings, so SICAM Q80 is easy to use even for operators without any special know-how or training.However, the user can freely defi ne and save special measurements, value limits, analyses and documentation to be reused later if needed.
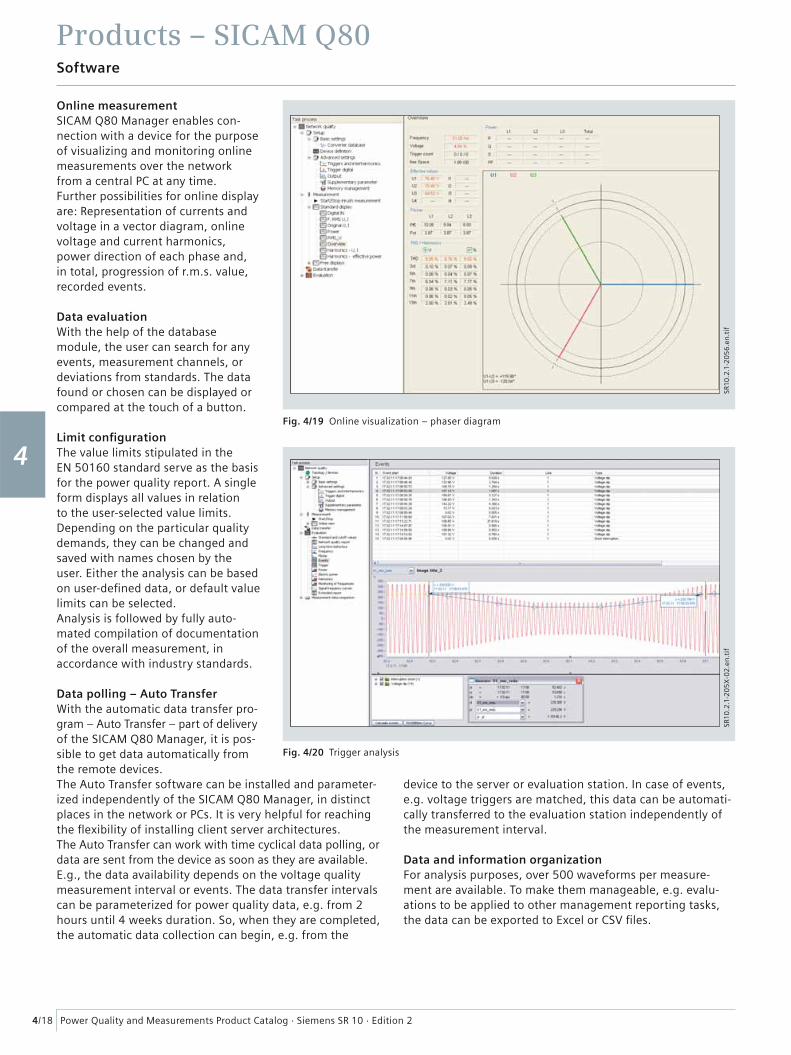
Power Quality and Measurements Product Catalog · Siemens SR 10 · Edition 2
Products – SICAM Q80
4/18
Software
1
2
3
4
5
6
7
8
9
Fig. 4/19 Online visualization – phaser diagram
SR10
.2.1
-20
56
.en
.tif
Online measurementSICAM Q80 Manager enables con-nection with a device for the purpose of visualizing and monitoring online measurements over the network from a central PC at any time.Further possibilities for online display are: Representation of currents and voltage in a vector diagram, online voltage and current harmonics, power direction of each phase and, in total, progression of r.m.s. value, recorded events.
Data evaluationWith the help of the database module, the user can search for any events, measurement channels, or deviations from standards. The data found or chosen can be displayed or compared at the touch of a button.
Limit confi gurationThe value limits stipulated in the EN 50160 standard serve as the basis for the power quality report. A single form displays all values in relation to the user-selected value limits. Depending on the particular quality demands, they can be changed and saved with names chosen by the user. Either the analysis can be based on user-defi ned data, or default value limits can be selected.Analysis is followed by fully auto-mated compilation of documentation of the overall measurement, in accordance with industry standards.
Data polling – Auto TransferWith the automatic data transfer pro-gram – Auto Transfer – part of delivery of the SICAM Q80 Manager, it is pos-sible to get data automatically from the remote devices. The Auto Transfer software can be installed and parameter-ized independently of the SICAM Q80 Manager, in distinct places in the network or PCs. It is very helpful for reaching the fl exibility of installing client server architectures. The Auto Transfer can work with time cyclical data polling, or data are sent from the device as soon as they are available.E.g., the data availability depends on the voltage quality measurement interval or events. The data transfer intervals can be parameterized for power quality data, e.g. from 2 hours until 4 weeks duration. So, when they are completed, the automatic data collection can begin, e.g. from the
device to the server or evaluation station. In case of events, e.g. voltage triggers are matched, this data can be automati-cally transferred to the evaluation station independently of the measurement interval.
Data and information organizationFor analysis purposes, over 500 waveforms per measure-ment are available. To make them manageable, e.g. evalu-ations to be applied to other management reporting tasks, the data can be exported to Excel or CSV fi les.
Fig. 4/20 Trigger analysis
SR10
.2.1
-20
5X
-02
.en
.tif?

Power Quality and Measurements Product Catalog · Siemens SR 10 · Edition 2
Products – SICAM Q80
4/19
Software
1
2
3
4
5
6
7
8
9
Report generatorThe report generator is used to create graphical reports to document the measurement and analysis results. Unlike the print function of the curve window, which prints out the current curve plot, the report can be made up of a layout comprising curve plots, text, tables and other graphical objects.The report generator has a multi-document user interface on which multiple reports can be edited at one time. The usual editing operations, such as multiple selection, copy, paste, move, orientation, etc. are all provided.The properties of the objects, such as colors, fonts, etc. can be changed in various ways, even in groups. An undo function, seamless zoom-ing, a freely defi nable grid with a snap-function, and context sensitive online help round off the support tools available to the user for rapid compilation of complex reports.The report generator can be used to give every report and log its own layout:• Automation of documentation• The quick way to get measurement
results as a hard copy• Creation of document templates• Insertion of measurement plots of
any length• Insertion of measurement value
tables• Insertion of elements via the
MS Windows Clipboard• Text, pixel graphics, vector
graphics, OLE objects• Texts in any font, color or format• Structural elements• Lines, frames, fi elds, arrows• Grid functions for millimeter-precise
layouts (e.g. 1 V corresponds to 10 mm / 0.39 in.).
Fig. 4/21 Network quality reportSR
10.2
.1-2
05
8 .e
n.t
if
Fig. 4/22 Automatic data transfer program
SR10
.2.1
-20
5X
-03
.en
.tif
Automatic power quality reporting – Auto ReportJointly with Windows Scheduler Program, the Auto Report performs automatically scheduled power quality reports. The users just need to defi ne the task and its interval, and where the reports have to be available.
Through the measurement overview option in the SICAM Q80Manager, the user can access the reports, e.g. in PDF fi les, over the reports status windows, which already contain the brief status information, pass or fail.
Power Quality and Measurements Product Catalog · Siemens SR 10 · Edition 2
Products – SICAM Q80
4/20
Software
1
2
3
4
5
6
7
8
9
Measurements overviewAll values relevant to power quality are monitored, recorded and evaluated according to international and national standards for power quality (e.g. the European standard EN 50160).
Time resolutionMany network quality attributes (e.g. voltage dips) require very detailed display while for others (e.g. slow changes), averages over 10 minutes are adequate. There may be fi ve different resolution levels in total, depending on the calculation technique used.
Measurement standards IEC 61000-4-30; IEC 61000-4-15; IEC 61000-4-7
Standards for voltage quality analysis Voltage quality in accordance with EN 50160 or according to individually defi ned criteria
Voltage, current Curve plots of r.m.s. values after every half period (reduced half-period r.m.s. values)
Flicker Short-term (Pst), long-term (Plt) and momentary values (Pf5)
Frequency 40 to 70 Hz
Harmonics Voltage, current up to 50th harmonic, THD
Interharmonics Up to 10 frequencies (5 to 3,000 Hz, resolution 5 Hz)
Symmetry Zero / positive / negative phase-sequence system / asymmetry
Power calculation as per DIN 40110-1 and CE2 1-, 2-, 3-phase, total (active, apparent, reactive power)
Phase angle < 1° up to 2.5 kHz
Trigger functionality For voltage and current: R.m.s. trigger, curve form trigger, signal frequency trigger
Transients Recording of instantaneous release of trigger values at 10 kHz
Table 4/7 Measurement specifi cation
Resolution Signifi cance Examples
10 min Values over the selected averaging interval (default 10 min) Mean values, fl icker
10 to 12 cycles Values over the selected averaging interval f (default = 10 s) Frequency
Half cycle Sample of the demodulated impulse sequence (fi lter result of the amplitude modulated signal frequency)
Main voltage signaling
10 ms r.m.s. value every half cycle r.m.s. values
100 μs lnput samples and derived quantities without data reduction Recording of instantaneous value (curve shape)
Table 4/8 Time resolution of data
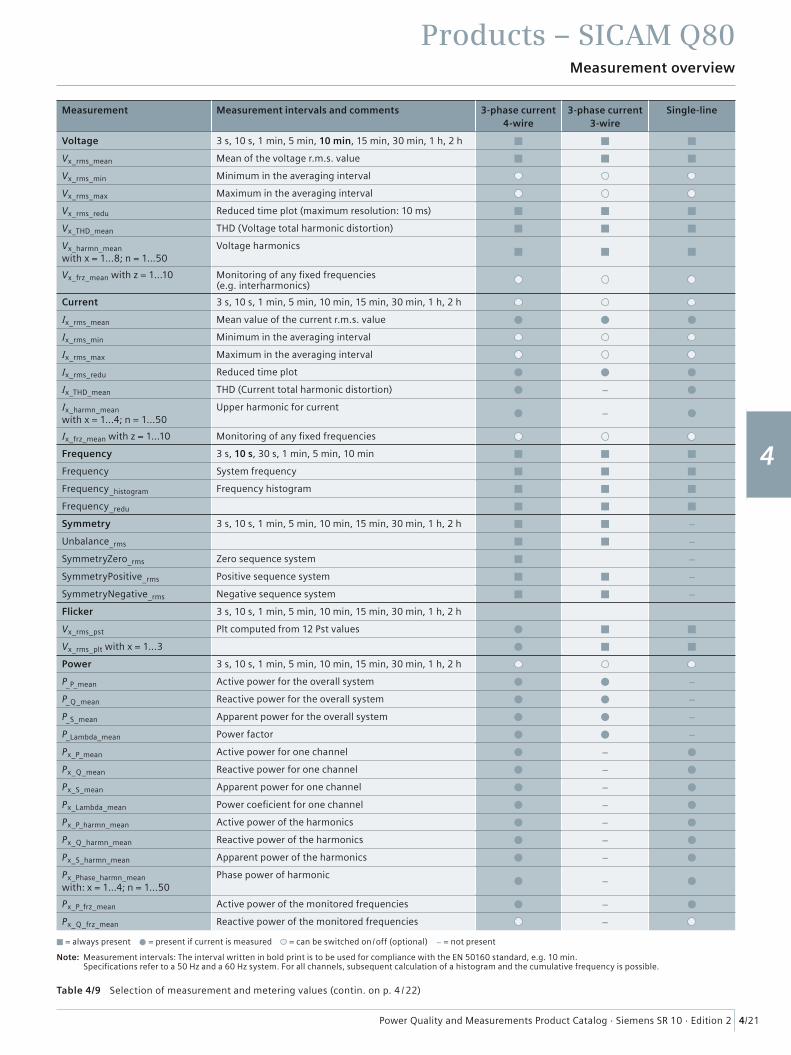
Power Quality and Measurements Product Catalog · Siemens SR 10 · Edition 2
Products – SICAM Q80
4/21
Measurement overview
1
2
3
4
5
6
7
8
9
Measurement Measurement intervals and comments 3-phase current 4-wire
3-phase current3-wire
Single-line
Voltage 3 s, 10 s, 1 min, 5 min, 10 min, 15 min, 30 min, 1 h, 2 h ■ ■ ■
Vx_rms_mean Mean of the voltage r.m.s. value ■ ■ ■
Vx_rms_min Minimum in the averaging interval
Vx_rms_max Maximum in the averaging interval
Vx_rms_redu Reduced time plot (maximum resolution: 10 ms) ■ ■ ■
Vx_THD_mean THD (Voltage total harmonic distortion) ■ ■ ■
Vx_harmn_mean with x = 1…8; n = 1…50
Voltage harmonics■ ■ ■
Vx_frz_mean with z = 1…10 Monitoring of any fi xed frequencies (e.g. interharmonics)
Current 3 s, 10 s, 1 min, 5 min, 10 min, 15 min, 30 min, 1 h, 2 h
Ix_rms_mean Mean value of the current r.m.s. value ● ● ●
Ix_rms_min Minimum in the averaging interval
Ix_rms_max Maximum in the averaging interval
Ix_rms_redu Reduced time plot ● ● ●
Ix_THD_mean THD (Current total harmonic distortion) ● – ●
Ix_harmn_mean with x = 1…4; n = 1…50
Upper harmonic for current● – ●
Ix_frz_mean with z = 1…10 Monitoring of any fi xed frequencies
Frequency 3 s, 10 s, 30 s, 1 min, 5 min, 10 min ■ ■ ■
Frequency System frequency ■ ■ ■
Frequency_histogram Frequency histogram ■ ■ ■
Frequency_redu ■ ■ ■
Symmetry 3 s, 10 s, 1 min, 5 min, 10 min, 15 min, 30 min, 1 h, 2 h ■ ■ –
Unbalance_rms ■ ■ –
SymmetryZero_rms Zero sequence system ■ –
SymmetryPositive_rms Positive sequence system ■ ■ –
SymmetryNegative_rms Negative sequence system ■ ■ –
Flicker 3 s, 10 s, 1 min, 5 min, 10 min, 15 min, 30 min, 1 h, 2 h
Vx_rms_pst Plt computed from 12 Pst values ● ■ ■
Vx_rms_plt with x = 1…3 ● ■ ■
Power 3 s, 10 s, 1 min, 5 min, 10 min, 15 min, 30 min, 1 h, 2 h
P_P_mean Active power for the overall system ● ● –
P_Q_mean Reactive power for the overall system ● ● –
P_S_mean Apparent power for the overall system ● ● –
P_Lambda_mean Power factor ● ● –
Px_P_mean Active power for one channel ● – ●
Px_Q_mean Reactive power for one channel ● – ●
Px_S_mean Apparent power for one channel ● – ●
Px_Lambda_mean Power coefi cient for one channel ● – ●
Px_P_harmn_mean Active power of the harmonics ● – ●
Px_Q_harmn_mean Reactive power of the harmonics ● – ●
Px_S_harmn_mean Apparent power of the harmonics ● – ●
Px_Phase_harmn_mean with: x = 1…4; n = 1…50
Phase power of harmonic● – ●
Px_P_frz_mean Active power of the monitored frequencies ● – ●
Px_Q_frz_mean Reactive power of the monitored frequencies –
■ = always present ● = present if current is measured = can be switched on / off (optional) – = not present
Note: Measurement intervals: The interval written in bold print is to be used for compliance with the EN 50160 standard, e.g. 10 min. Specifi cations refer to a 50 Hz and a 60 Hz system. For all channels, subsequent calculation of a histogram and the cumulative frequency is possible.
Table 4/9 Selection of measurement and metering values (contin. on p. 4 / 22)
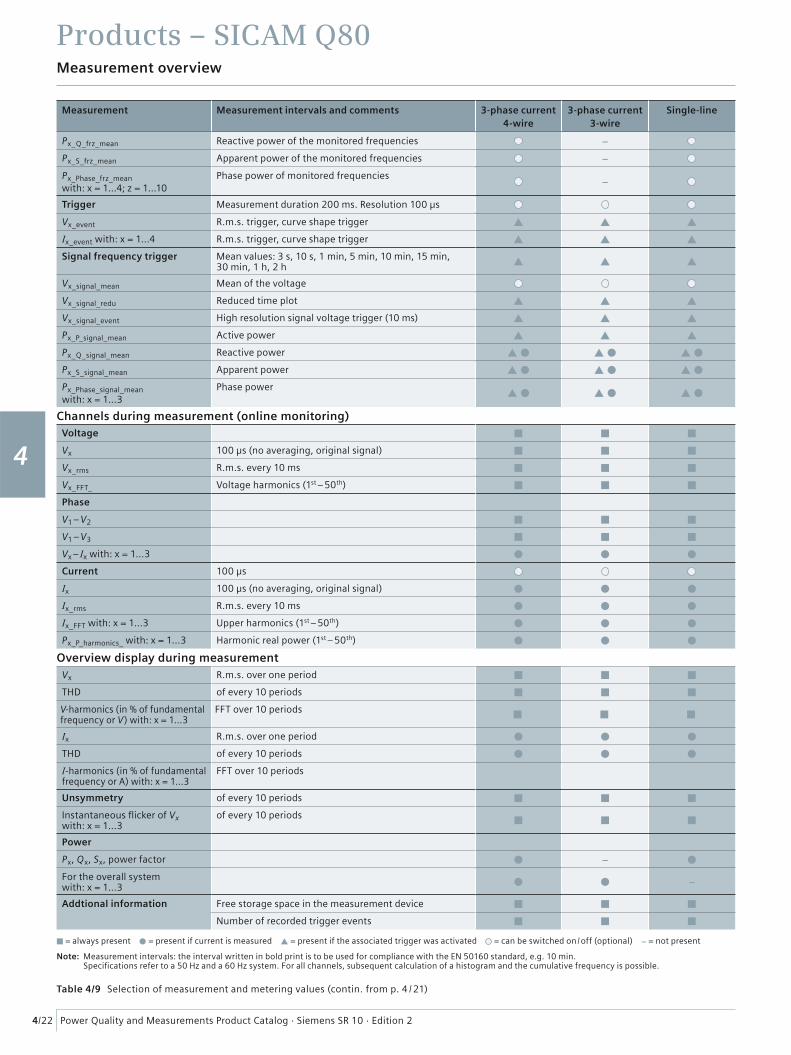
Power Quality and Measurements Product Catalog · Siemens SR 10 · Edition 2
Products – SICAM Q80
4/22
Measurement overview
1
2
3
4
5
6
7
8
9
Measurement Measurement intervals and comments 3-phase current 4-wire
3-phase current3-wire
Single-line
Px_Q_frz_mean Reactive power of the monitored frequencies –
Px_S_frz_mean Apparent power of the monitored frequencies –
Px_Phase_frz_mean with: x = 1…4; z = 1…10
Phase power of monitored frequencies–
Trigger Measurement duration 200 ms. Resolution 100 µs
Vx_event R.m.s. trigger, curve shape trigger ▲ ▲ ▲
Ix_event with: x = 1…4 R.m.s. trigger, curve shape trigger ▲ ▲ ▲
Signal frequency trigger Mean values: 3 s, 10 s, 1 min, 5 min, 10 min, 15 min, 30 min, 1 h, 2 h ▲ ▲ ▲
Vx_signal_mean Mean of the voltage
Vx_signal_redu Reduced time plot ▲ ▲ ▲
Vx_signal_event High resolution signal voltage trigger (10 ms) ▲ ▲ ▲
Px_P_signal_mean Active power ▲ ▲ ▲
Px_Q_signal_mean Reactive power ▲ ● ▲ ● ▲ ●
Px_S_signal_mean Apparent power ▲ ● ▲ ● ▲ ●
Px_Phase_signal_mean with: x = 1…3
Phase power▲ ● ▲ ● ▲ ●
Channels during measurement (online monitoring)Voltage ■ ■ ■
Vx 100 µs (no averaging, original signal) ■ ■ ■
Vx_rms R.m.s. every 10 ms ■ ■ ■
Vx_FFT_ Voltage harmonics (1st – 50th) ■ ■ ■
Phase
V1 – V2 ■ ■ ■
V1 – V3 ■ ■ ■
Vx – Ix with: x = 1…3 ● ● ●
Current 100 µs
Ix 100 µs (no averaging, original signal) ● ● ●
Ix_rms R.m.s. every 10 ms ● ● ●
Ix_FFT with: x = 1…3 Upper harmonics (1st – 50th) ● ● ●
Px_P_harmonics_ with: x = 1…3 Harmonic real power (1st – 50th) ● ● ●
Overview display during measurementVx R.m.s. over one period ■ ■ ■
THD of every 10 periods ■ ■ ■
V-harmonics (in % of fundamental frequency or V) with: x = 1…3
FFT over 10 periods■ ■ ■
Ix R.m.s. over one period ● ● ●
THD of every 10 periods ● ● ●
I-harmonics (in % of fundamental frequency or A) with: x = 1…3
FFT over 10 periods
Unsymmetry of every 10 periods ■ ■ ■
Instantaneous fl icker of Vx with: x = 1…3
of every 10 periods■ ■ ■
Power
Px, Qx, Sx, power factor ● – ●
For the overall system with: x = 1…3 ● ● –
Addtional information Free storage space in the measurement device ■ ■ ■
Number of recorded trigger events ■ ■ ■
■ = always present ● = present if current is measured ▲ = present if the associated trigger was activated = can be switched on / off (optional) – = not present
Note: Measurement intervals: the interval written in bold print is to be used for compliance with the EN 50160 standard, e.g. 10 min. Specifi cations refer to a 50 Hz and a 60 Hz system. For all channels, subsequent calculation of a histogram and the cumulative frequency is possible.
Table 4/9 Selection of measurement and metering values (contin. from p. 4 / 21)
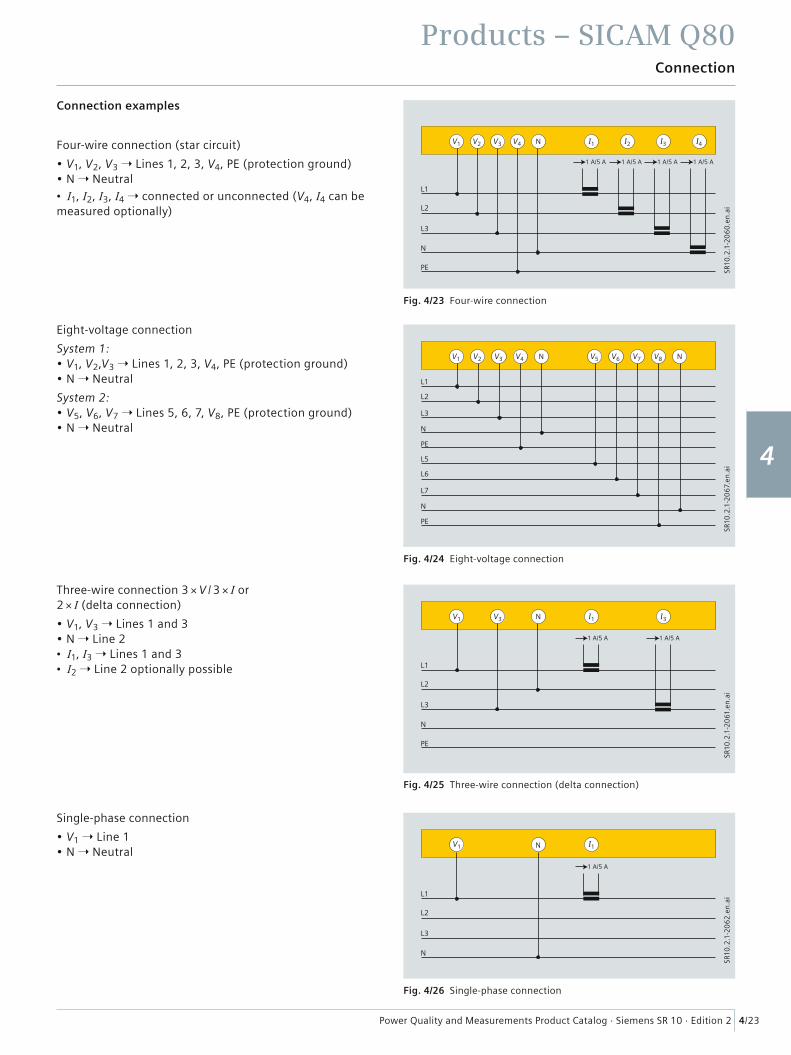
Power Quality and Measurements Product Catalog · Siemens SR 10 · Edition 2
Products – SICAM Q80
4/23
Connection
1
2
3
4
5
6
7
8
9
Connection examples
Four-wire connection (star circuit)
• V1, V2, V3 ➝ Lines 1, 2, 3, V4, PE (protection ground)• N ➝ Neutral
• I1, I2, I3, I4 ➝ connected or unconnected (V4, I4 can be measured optionally)
Eight-voltage connection
System 1:• V1, V2,V3 ➝ Lines 1, 2, 3, V4, PE (protection ground)• N ➝ Neutral
System 2:• V5, V6, V7 ➝ Lines 5, 6, 7, V8, PE (protection ground)• N ➝ Neutral
Three-wire connection 3 × V / 3 × I or 2 × I (delta connection)
• V1, V3 ➝ Lines 1 and 3• N ➝ Line 2• I1, I3 ➝ Lines 1 and 3• I2 ➝ Line 2 optionally possible
Single-phase connection
• V1 ➝ Line 1• N ➝ Neutral
L1
V1 V2 V3 V4 N
1 A/5 A
I1
L2
L3
N
PE
1 A/5 A
I2
1 A/5 A
I3
1 A/5 A
I4
SR10
.2.1
-20
60
.en
.ai
Fig. 4/23 Four-wire connection
L1
V1 V2 V3 V4 N V5 V6 V7 V8 N
L2
L3
N
PE
L5
L6
L7
N
PE
SR10
.2.1
-20
67.
en.a
i
Fig. 4/24 Eight-voltage connection
L1
V1 V3 N
1 A/5 A
I1
L2
L3
N
PE
1 A/5 A
I3
SR10
.2.1
-20
61.e
n.a
i
Fig. 4/25 Three-wire connection (delta connection)
L1
1 A/5 A
L2
L3
N
V1 N I1
SR10
.2.1
-20
62
.en
.ai
Fig. 4/26 Single-phase connection

Power Quality and Measurements Product Catalog · Siemens SR 10 · Edition 2
Products – SICAM Q80
4/24
Technical data
1
2
3
4
5
6
7
8
9
Parameter Typical value Min. / max. Test conditions / remarks
Ambient conditions The normal ambient conditions according to EN 61010-1 apply
Signal inputs 4 × current [I ]4 × voltage [V ]and8 × voltage [V ]
Digital input / output 4 binary inputs4 relay outputs
Power consumption < 10 W< 12 W
Permanent operationAfter power-on (to recharge the UPS)
Power supply DC 10 to 60 V orAC 100 V to 240 V /DC 110 V to 320 V
UPS capacitor Back-up time: ≤ 1 second Factory settings
EMC Interference immunity /Transient emissions
Class A According to IEC / EN 61326-1
Degree of protection IP 20 According to EN 60529
Weight Approx. 1.9 kg
Dimensions 166 mm × 105 mm × 126 mm6.53 in. × 4.13 in. × 4.96 in.
(W × H × D) without mounting rail
Ambient temperature range – 10 °C to 55 °C / 50 °F to 131 °F Without condensation
Storage temperature – 40 °C to 90 °C / – 40 °F to 194 °F Within temperatures ≤ 15 °C or > 55 °C / ≤ 59 °F or > 131 °F only for short time
Communication interfaces Ethernet, Modem
TCP / IPDSUB
Memory capacity CF card Min. 2 GB,Max. 16 GB
Standard accessory: 2 GB CF cardup to 16 GB possible
Internal clock and external synchronization
± 1 s / dayGPSDCF 77 or via other SICAM Q80
Battery backedGPS inputSync input
General data
Table 4/10 Technical data
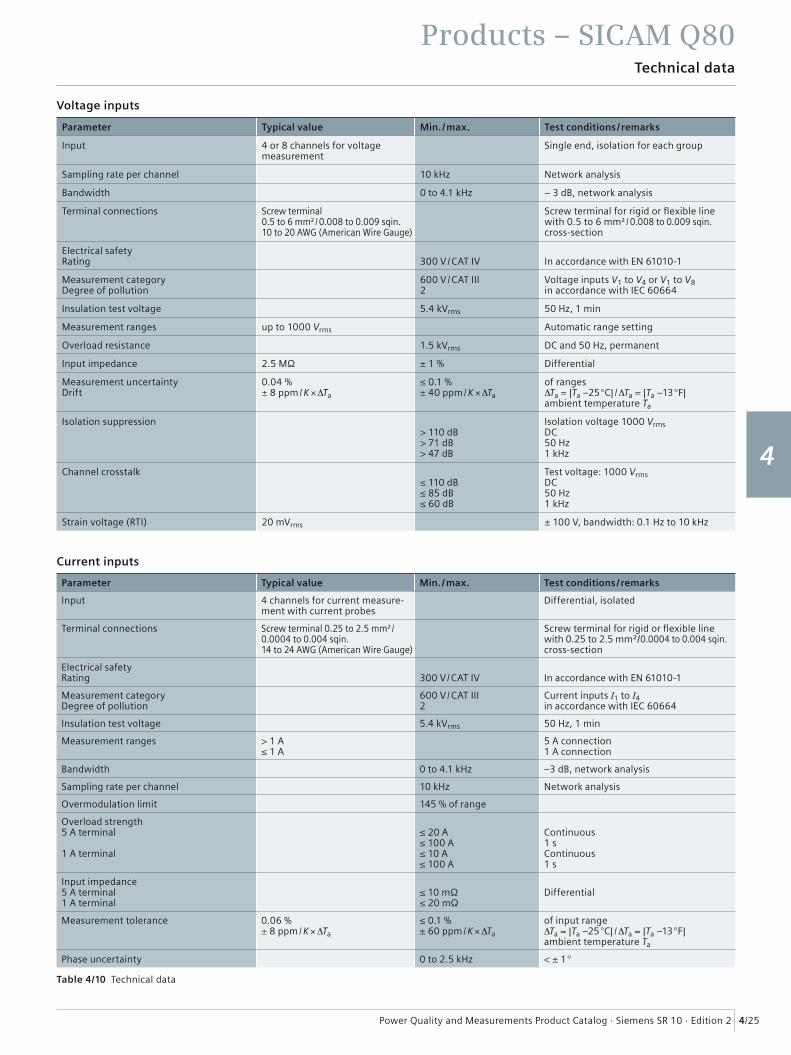
Power Quality and Measurements Product Catalog · Siemens SR 10 · Edition 2
Products – SICAM Q80
4/25
Technical data
1
2
3
4
5
6
7
8
9
Parameter Typical value Min. / max. Test conditions / remarks
Input 4 or 8 channels for voltage measurement
Single end, isolation for each group
Sampling rate per channel 10 kHz Network analysis
Bandwidth 0 to 4.1 kHz – 3 dB, network analysis
Terminal connections Screw terminal 0.5 to 6 mm² / 0.008 to 0.009 sqin.10 to 20 AWG (American Wire Gauge)
Screw terminal for rigid or fl exible line with 0.5 to 6 mm² / 0.008 to 0.009 sqin. cross-section
Electrical safety Rating 300 V / CAT IV In accordance with EN 61010-1
Measurement categoryDegree of pollution
600 V / CAT III2
Voltage inputs V1 to V4 or V1 to V8in accordance with IEC 60664
Insulation test voltage 5.4 kVrms 50 Hz, 1 min
Measurement ranges up to 1000 Vrms Automatic range setting
Overload resistance 1.5 kVrms DC and 50 Hz, permanent
Input impedance 2.5 MΩ ± 1 % Differential
Measurement uncertaintyDrift
0.04 %± 8 ppm / K × ΔTa
≤ 0.1 %± 40 ppm / K × ΔTa
of rangesΔTa = |Ta –25 °C| / ΔTa = |Ta –13 °F|ambient temperature Ta
Isolation suppression> 110 dB> 71 dB> 47 dB
Isolation voltage 1000 VrmsDC50 Hz1 kHz
Channel crosstalk≤ 110 dB≤ 85 dB≤ 60 dB
Test voltage: 1000 VrmsDC50 Hz1 kHz
Strain voltage (RTI) 20 mVrms ± 100 V, bandwidth: 0.1 Hz to 10 kHz
Parameter Typical value Min. / max. Test conditions / remarks
Input 4 channels for current measure-ment with current probes
Differential, isolated
Terminal connections Screw terminal 0.25 to 2.5 mm² /0.0004 to 0.004 sqin.14 to 24 AWG (American Wire Gauge)
Screw terminal for rigid or fl exible line with 0.25 to 2.5 mm²/0.0004 to 0.004 sqin. cross-section
Electrical safetyRating 300 V / CAT IV In accordance with EN 61010-1
Measurement categoryDegree of pollution
600 V / CAT III2
Current inputs I1 to I4in accordance with IEC 60664
Insulation test voltage 5.4 kVrms 50 Hz, 1 min
Measurement ranges > 1 A≤ 1 A
5 A connection1 A connection
Bandwidth 0 to 4.1 kHz –3 dB, network analysis
Sampling rate per channel 10 kHz Network analysis
Overmodulation limit 145 % of range
Overload strength5 A terminal
1 A terminal
≤ 20 A≤ 100 A≤ 10 A≤ 100 A
Continuous1 sContinuous1 s
Input impedance5 A terminal1 A terminal
≤ 10 mΩ≤ 20 mΩ
Differential
Measurement tolerance 0.06 %± 8 ppm / K × ΔTa
≤ 0.1 %± 60 ppm / K × ΔTa
of input rangeΔTa = |Ta –25 °C| / ΔTa = |Ta –13 °F|ambient temperature Ta
Phase uncertainty 0 to 2.5 kHz < ± 1 °
Voltage inputs
Current inputs
Table 4/10 Technical data
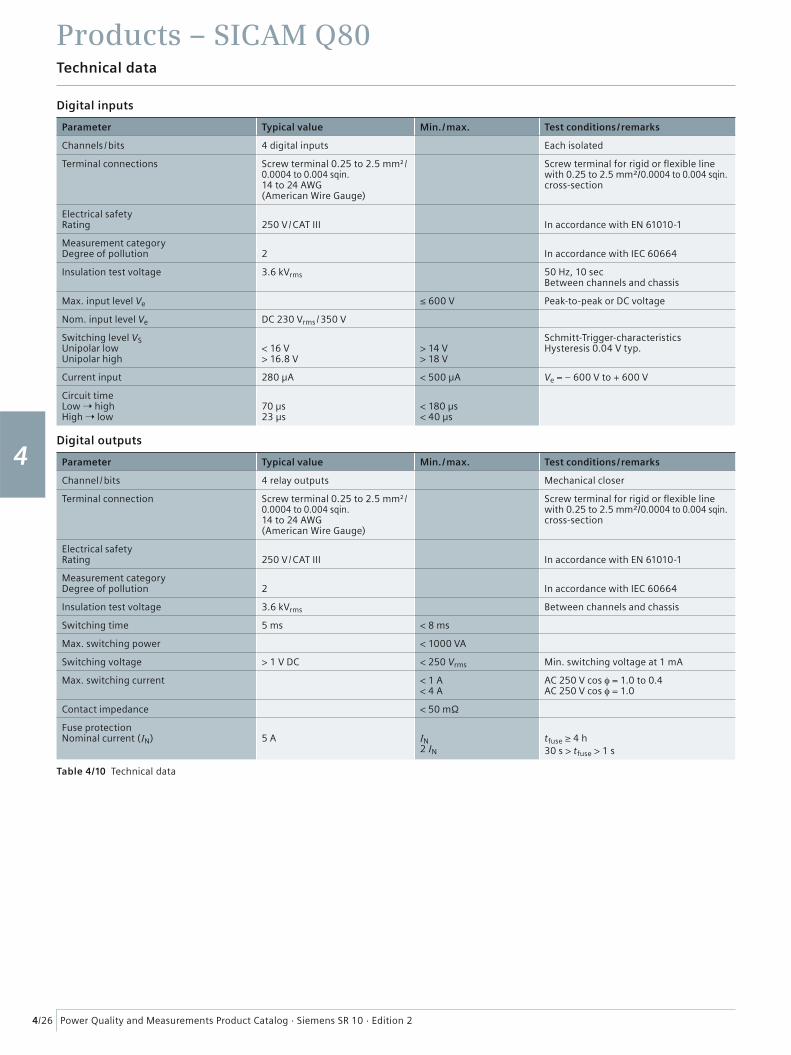
Power Quality and Measurements Product Catalog · Siemens SR 10 · Edition 2
Products – SICAM Q80
4/26
Technical data
1
2
3
4
5
6
7
8
9
Digital inputs
Digital outputs
Parameter Typical value Min. / max. Test conditions / remarks
Channels / bits 4 digital inputs Each isolated
Terminal connections Screw terminal 0.25 to 2.5 mm² /0.0004 to 0.004 sqin.14 to 24 AWG (American Wire Gauge)
Screw terminal for rigid or fl exible line with 0.25 to 2.5 mm²/0.0004 to 0.004 sqin. cross-section
Electrical safetyRating 250 V / CAT III In accordance with EN 61010-1
Measurement categoryDegree of pollution 2 In accordance with IEC 60664
Insulation test voltage 3.6 kVrms 50 Hz, 10 secBetween channels and chassis
Max. input level Ve ≤ 600 V Peak-to-peak or DC voltage
Nom. input level Ve DC 230 Vrms / 350 V
Switching level VSUnipolar lowUnipolar high
< 16 V> 16.8 V
> 14 V> 18 V
Schmitt-Trigger-characteristicsHysteresis 0.04 V typ.
Current input 280 µA < 500 µA Ve = – 600 V to + 600 V
Circuit time Low ➝ highHigh ➝ low
70 µs23 µs
< 180 µs< 40 µs
Parameter Typical value Min. / max. Test conditions / remarks
Channel / bits 4 relay outputs Mechanical closer
Terminal connection Screw terminal 0.25 to 2.5 mm² /0.0004 to 0.004 sqin. 14 to 24 AWG (American Wire Gauge)
Screw terminal for rigid or fl exible line with 0.25 to 2.5 mm²/0.0004 to 0.004 sqin. cross-section
Electrical safetyRating 250 V / CAT III In accordance with EN 61010-1
Measurement categoryDegree of pollution 2 In accordance with IEC 60664
Insulation test voltage 3.6 kVrms Between channels and chassis
Switching time 5 ms < 8 ms
Max. switching power < 1000 VA
Switching voltage > 1 V DC < 250 Vrms Min. switching voltage at 1 mA
Max. switching current < 1 A< 4 A
AC 250 V cos φ = 1.0 to 0.4AC 250 V cos φ = 1.0
Contact impedance < 50 mΩ
Fuse protectionNominal current (IN) 5 A IN
2 IN
tfuse ≥ 4 h30 s > tfuse > 1 s
Table 4/10 Technical data
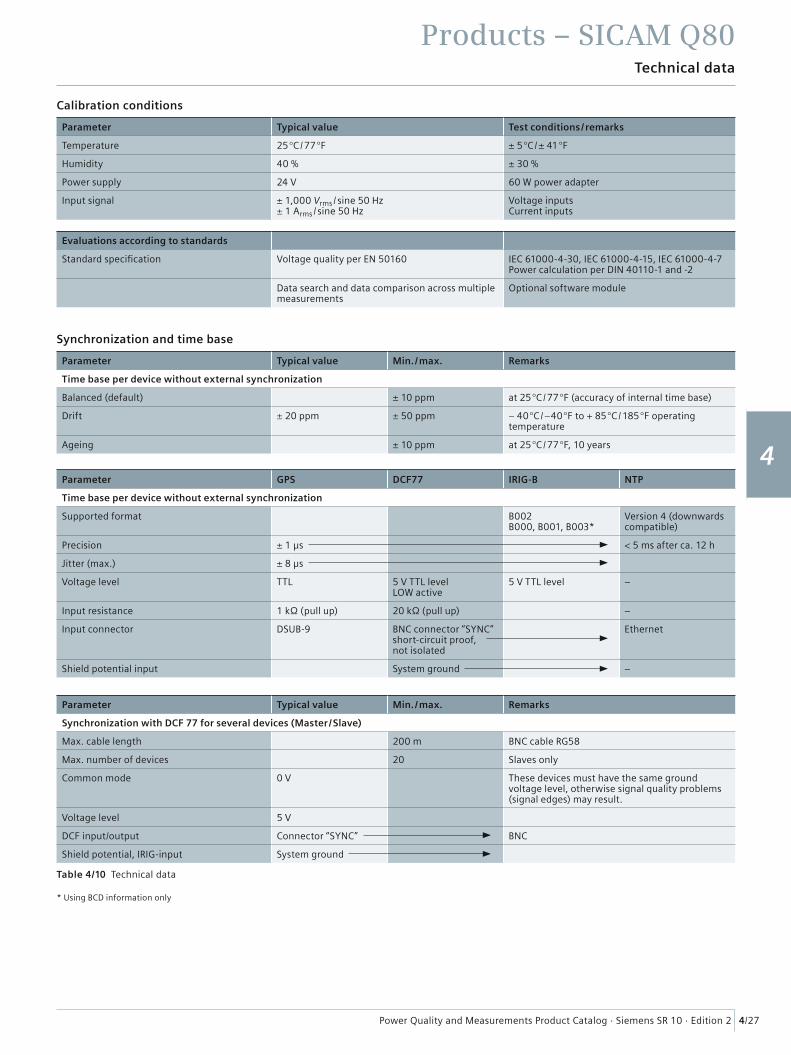
Power Quality and Measurements Product Catalog · Siemens SR 10 · Edition 2
Products – SICAM Q80
4/27
Technical data
1
2
3
4
5
6
7
8
9
Parameter Typical value Test conditions / remarks
Temperature 25 °C / 77 °F ± 5 °C / ± 41 °F
Humidity 40 % ± 30 %
Power supply 24 V 60 W power adapter
Input signal ± 1,000 Vrms / sine 50 Hz± 1 Arms / sine 50 Hz
Voltage inputsCurrent inputs
Evaluations according to standards
Standard specifi cation Voltage quality per EN 50160 IEC 61000-4-30, IEC 61000-4-15, IEC 61000-4-7 Power calculation per DIN 40110-1 and -2
Data search and data comparison across multiple measurements
Optional software module
Parameter Typical value Min. / max. Remarks
Time base per device without external synchronization
Balanced (default) ± 10 ppm at 25 °C / 77 °F (accuracy of internal time base)
Drift ± 20 ppm ± 50 ppm – 40 °C / –40 °F to + 85 °C / 185 °F operating t emperature
Ageing ± 10 ppm at 25 °C / 77 °F, 10 years
Parameter GPS DCF77 IRIG-B NTP
Time base per device without external synchronization
Supported format B002B000, B001, B003*
Version 4 (downwards compatible)
Precision ± 1 µs < 5 ms after ca. 12 h
Jitter (max.) ± 8 µs
Voltage level TTL 5 V TTL levelLOW active
5 V TTL level –
Input resistance 1 kΩ (pull up) 20 kΩ (pull up) –
Input connector DSUB-9 BNC connector “SYNC”short-circuit proof, not isolated
Ethernet
Shield potential input System ground –
Parameter Typical value Min. / max. Remarks
Synchronization with DCF 77 for several devices (Master / Slave)
Max. cable length 200 m BNC cable RG58
Max. number of devices 20 Slaves only
Common mode 0 V These devices must have the same ground voltage level, otherwise signal quality problems (signal edges) may result.
Voltage level 5 V
DCF input/output Connector “SYNC” BNC
Shield potential, IRIG-input System ground
Calibration conditions
Synchronization and time base
* Using BCD information only
Table 4/10 Technical data
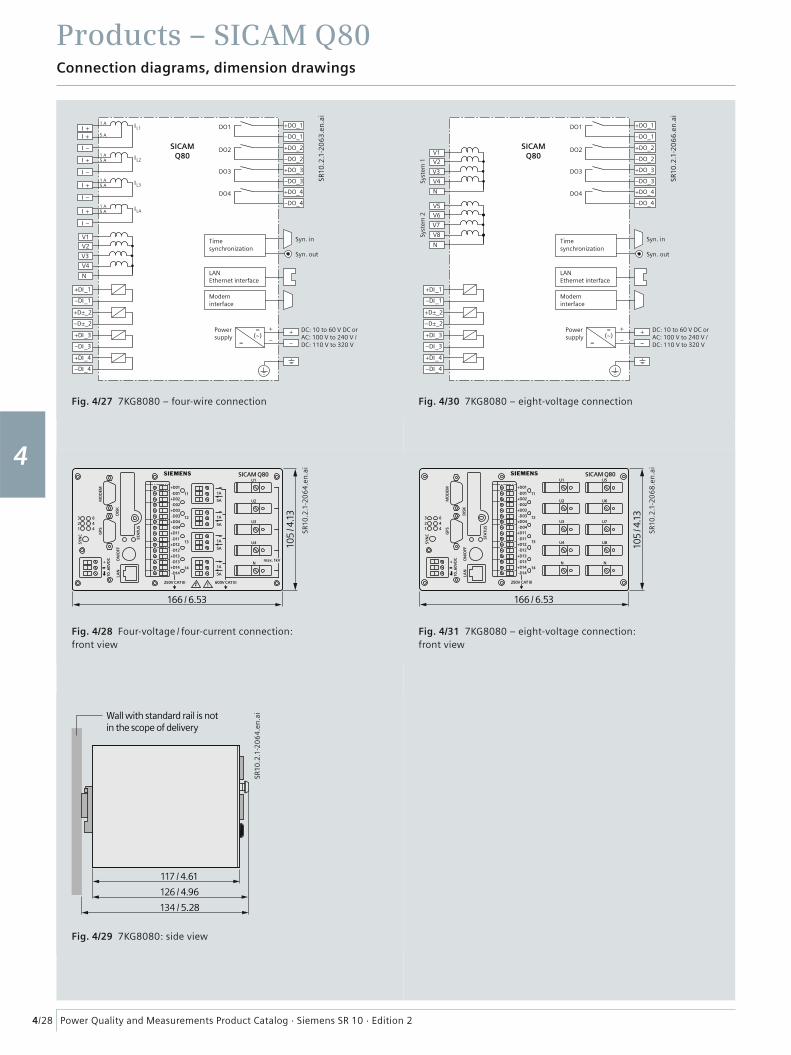
Power Quality and Measurements Product Catalog · Siemens SR 10 · Edition 2
Products – SICAM Q80
4/28
Connection diagrams, dimension drawings
1
2
3
4
5
6
7
8
9
DO1
DO2
DO3
DO4
=(~)
=
+
–+ DC: 10 to 60 V DC or
AC: 100 V to 240 V /DC: 110 V to 320 V
Syn. in
Syn. out
–
Powersupply
Timesynchronization
LANEthernet interface
Modeminterface
SICAMQ80I + I L2
I –
1 A5 A
I + I L1
I –
1 A
5 A
I + I L4
I –
+DI_1
–DI_1
+DI_3
–DI_3
+DI_4
–DI_4
+D±_2
–D±_2
+DO_1
–DO_1
+DO_2
–DO_2
+DO_3
–DO_3
+DO_4
–DO_41 A5 A
I + I L3
I –
1 A5 A
V1
V2
V4
N
V3
I +
SR10
.2.1
-20
63
.en
.ai
Fig. 4/27 7KG8080 – four-wire connection
1
1A
U1
U2
SICAM Q80
U3
U4
Nmax. 1kV
+D01
-D01+D02-D02
+D03-D03
+D04-D04
+D11-D11
+D12-D12
+D13-D13
+D14-D14
11
12
13
14
5A
23
4
MO
DEM
GPS
SYN
C
DIS
KO
N/O
FFLA
N
10..6
0VD
C
STA
TUS
+
46 1A
5A
1A
5A
1A
5A
600V CAT III250V CAT III
166 / 6.53
105
/ 4.1
3
Fig. 4/28 Four-voltage / four-current connection: front view
117 / 4.61
126 / 4.96
134 / 5.28
Wall with standard rail is notin the scope of delivery
Fig. 4/29 7KG8080: side view
DO1
DO2
DO3
DO4
=(~)
=
+
–+ DC: 10 to 60 V DC or
AC: 100 V to 240 V /DC: 110 V to 320 V
Syn. in
Syn. out
Syst
em 1
Syst
em 2
–
Powersupply
SR1
0.2
.1-2
06
6.e
n.a
i
Timesynchronization
LANEthernet interface
Modeminterface
SICAMQ80
+DI_1
–DI_1
+DI_3
–DI_3
+DI_4
–DI_4
+D±_2
–D±_2
+DO_1
–DO_1
+DO_2
–DO_2
+DO_3
–DO_3
+DO_4
–DO_4
V1
V2
V4
N
V3
V5
V6
V8
N
V7
SR10
.2.1
-20
66
.en
.ai
Fig. 4/30 7KG8080 – eight-voltage connection
1
U5
U6
SICAM Q80
U7
U8
N
+D01
-D01+D02-D02
+D03-D03
+D04-D04
+D11-D11
+D12-D12
+D13-D13
+D14-D14
11
12
13
14
23
4
MO
DEM
GPS
SYN
C
DIS
KO
N/O
FFLA
N
10..6
0VD
C
STA
TUS
+
46
U1
U2
U3
U4
N
250V CAT III
166 / 6.53
105
/ 4.1
3Fig. 4/31 7KG8080 – eight-voltage connection: front view
SR10
.2.1
-20
64
.en
.ai
SR10
.2.1
-20
64
.en
.ai
SR10
.2.1
-20
68
.en
.ai

Power Quality and Measurements Product Catalog · Siemens SR 10 · Edition 2
Products – SICAM Q80
4/29
Selection and ordering data
1
2
3
4
5
6
7
8
9
Description Order No.
SICAM Q80 Power Quality Recorder 7KG8080 - A 0 0 - 0 AA 0
– IEC 61000-4-30 / Class A– 2 GB compact fl ash– 4 binary inputs and 4 binary outputs– Synchronization: DCF77/ GPS / IRIG-B / NTP Sync. – Ethernet interface – SICAM Q80 Manager– Operating instructions: English and German
We suggest the following GPS accessories:– Garmin (18 LVC-5Hz), or– Hopf Receiver 6875-FW7.0: 7XV5664-0CA00
(see SIPROTEC price list)
Inputs:4 currents / 4 voltages8 voltages
Power supply:DC 24/60 VVaux AC: 100 V to 240 V / Vaux DC: 110 V to 320 V
SICAM Q80 – Manager Software for 7KG8081 - 1AA00 - 0AA0
– Device parameterization– System topology– Online measurement– Power quality reports (e.g. according to EN 50160) – Automatic power quality reporting (Windows schedule)– Excel / ASC II export – Software language: English / German – Operating instructions and system manual: English / German as PDF
Extra printed system manual
GermanEnglish
E50417 - H1000 - C420 - A1E50417 - H1076 - C420 - A1
Ethernet patch cable 7KE6000 - 8GE00 - 3AA0
With double shield (SFTP),cross-over connection,with LAN connector on both ends,SICAM Q80 <CE> PC
0
A
1
B
Table 4/11 Selection and ordering data
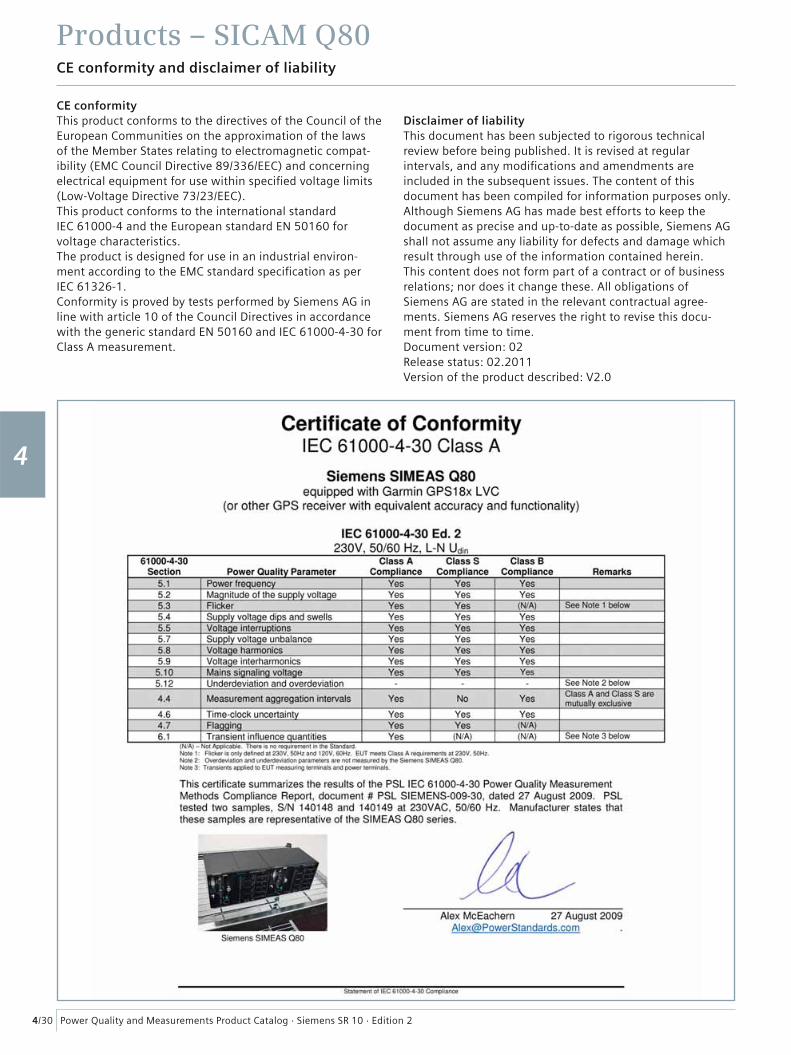
Power Quality and Measurements Product Catalog · Siemens SR 10 · Edition 2
Products – SICAM Q80
4/30
CE conformity and disclaimer of liability
1
2
3
4
5
6
7
8
9
CE conformityThis product conforms to the directives of the Council of the European Communities on the approximation of the laws of the Member States relating to electromagnetic compat-ibility (EMC Council Directive 89/336/EEC) and concerning electrical equipment for use within specifi ed voltage limits (Low-Voltage Directive 73/23/EEC).This product conforms to the international standard IEC 61000-4 and the European standard EN 50160 for voltage characteristics.The product is designed for use in an industrial environ-ment according to the EMC standard specifi cation as per IEC 61326-1.Conformity is proved by tests performed by Siemens AG in line with article 10 of the Council Directives in accordance with the generic standard EN 50160 and IEC 61000-4-30 for Class A measurement.
Disclaimer of liabilityThis document has been subjected to rigorous technical review before being published. It is revised at regular intervals, and any modifi cations and amendments are included in the subsequent issues. The content of this document has been compiled for information purposes only. Although Siemens AG has made best efforts to keep the document as precise and up-to-date as possible, Siemens AG shall not assume any liability for defects and damage which result through use of the information contained herein.This content does not form part of a contract or of business relations; nor does it change these. All obligations of Siemens AG are stated in the relevant contractual agree-ments. Siemens AG reserves the right to revise this docu-ment from time to time.Document version: 02Release status: 02.2011Version of the product described: V2.0

Energy Automation
Answers for infrastructure and cities.
SIMEAS R-PQ Digital Fault and Power Quality Recorder
Power Quality and Measurements Product Catalog · Siemens SR 10 · Edition 2 5/2
1
2
3
4
5
6
7
8
9
Contents – SIMEAS R-PQ
Page
Description, function overview 5/3
System overview 5/4
Functions 5/7
Hardware 5/8
Technical data 5/11
Dimension drawings 5/14
Selection and ordering data 5/16
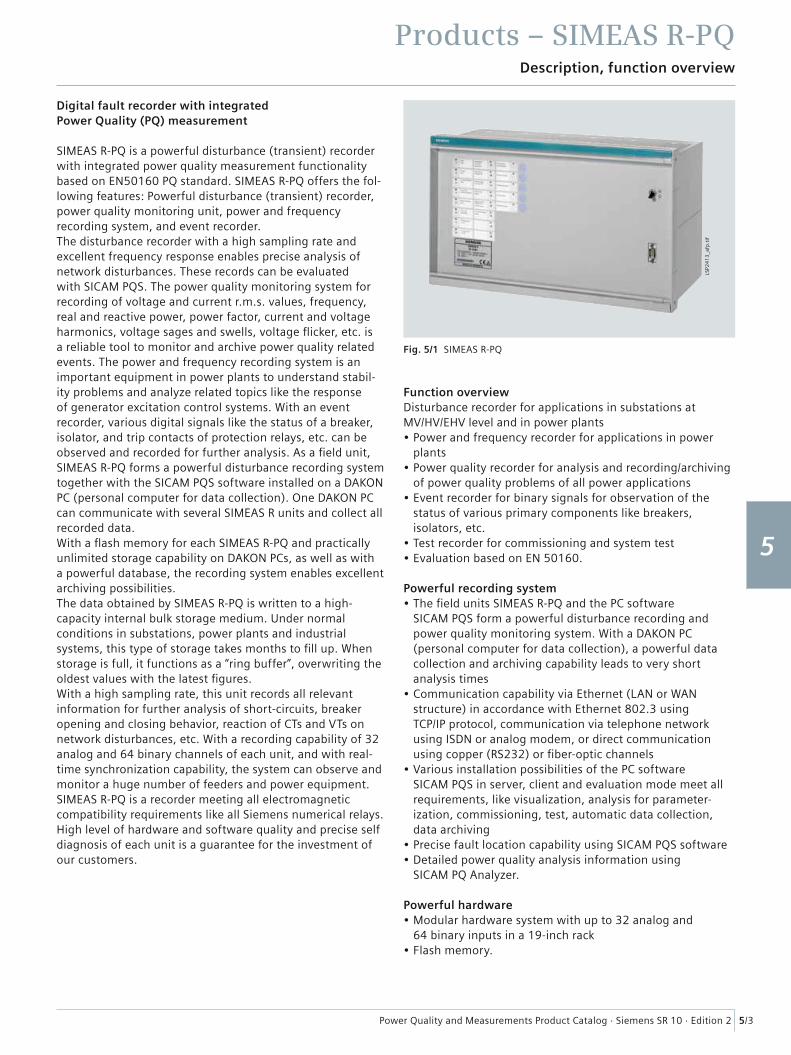
Power Quality and Measurements Product Catalog · Siemens SR 10 · Edition 2
Products – SIMEAS R-PQ
5/3
1
2
3
4
5
6
7
8
9
Description, function overview
Digital fault recorder with integrated Power Quality (PQ) measurement
SIMEAS R-PQ is a powerful disturbance (transient) recorder with integrated power quality measurement functionality based on EN50160 PQ standard. SIMEAS R-PQ offers the fol-lowing features: Powerful disturbance (transient) recorder, power quality monitoring unit, power and frequency recording system, and event recorder.The disturbance recorder with a high sampling rate and excellent frequency response enables precise analysis of network disturbances. These records can be evaluated with SICAM PQS. The power quality monitoring system for recording of voltage and current r.m.s. values, frequency, real and reactive power, power factor, current and voltage harmonics, voltage sages and swells, voltage fl icker, etc. is a reliable tool to monitor and archive power quality related events. The power and frequency recording system is an important equipment in power plants to understand stabil-ity problems and analyze related topics like the response of generator excitation control systems. With an event recorder, various digital signals like the status of a breaker, isolator, and trip contacts of protection relays, etc. can be observed and recorded for further analysis. As a fi eld unit, SIMEAS R-PQ forms a powerful disturbance recording system together with the SICAM PQS software installed on a DAKON PC (personal computer for data collection). One DAKON PC can communicate with several SIMEAS R units and collect all recorded data.With a fl ash memory for each SIMEAS R-PQ and practically unlimited storage capability on DAKON PCs, as well as with a powerful database, the recording system enables excellent archiving possibilities.The data obtained by SIMEAS R-PQ is written to a high-capacity internal bulk storage medium. Under normal conditions in substations, power plants and industrial systems, this type of storage takes months to fi ll up. When storage is full, it functions as a “ring buffer”, overwriting the oldest values with the latest fi gures.With a high sampling rate, this unit records all relevant information for further analysis of short-circuits, breaker opening and closing behavior, reaction of CTs and VTs on network disturbances, etc. With a recording capability of 32 analog and 64 binary channels of each unit, and with real-time synchronization capability, the system can observe and monitor a huge number of feeders and power equipment.SIMEAS R-PQ is a recorder meeting all electromagnetic compatibility requirements like all Siemens numerical relays. High level of hardware and software quality and precise self diagnosis of each unit is a guarantee for the investment of our customers.
Function overviewDisturbance recorder for applications in substations at MV/HV/EHV level and in power plants• Power and frequency recorder for applications in power
plants• Power quality recorder for analysis and recording/archiving
of power quality problems of all power applications• Event recorder for binary signals for observation of the
status of various primary components like breakers, isolators, etc.
• Test recorder for commissioning and system test• Evaluation based on EN 50160.
Powerful recording system• The fi eld units SIMEAS R-PQ and the PC software
SICAM PQS form a powerful disturbance recording and power quality monitoring system. With a DAKON PC (personal computer for data collection), a powerful data collection and archiving capability leads to very short analysis times
• Communication capability via Ethernet (LAN or WAN structure) in accordance with Ethernet 802.3 using TCP/IP protocol, communication via telephone network using ISDN or analog modem, or direct communication using copper (RS232) or fi ber-optic channels
• Various installation possibilities of the PC software SICAM PQS in server, client and evaluation mode meet all requirements, like visualization, analysis for parameter-ization, commissioning, test, automatic data collection, data archiving
• Precise fault location capability using SICAM PQS software• Detailed power quality analysis information using
SICAM PQ Analyzer.
Powerful hardware• Modular hardware system with up to 32 analog and
64 binary inputs in a 19-inch rack• Flash memory.
Fig. 5/1 SIMEAS R-PQ
LSP2
41
3_a
fp.t
if

Power Quality and Measurements Product Catalog · Siemens SR 10 · Edition 2
Products – SIMEAS R-PQ
5/4
1
2
3
4
5
6
7
8
9
System overview
System overviewThe DAKON is an industrial PC to which two or more SIMEAS R-PQ and numerical relays with the IEC 60870-5-103 and IEC 61850 protocols can be connected. A DAKON can automatically fetch both data from SIMEAS R-PQ or SIMEAS R-PMU and the fault recordings from protection equipment, and write these to its own storage. Communication between SIMEAS R-PQ, a DAKON and evaluation PCs is possible in various ways, for example via a wide area network (WAN) or local area network, with the TCP/IP protocol and electric or optical cables, as well as with converters and switches.As an alternative, communication via analog or ISDN modems is also possible.
Time synchronizationTo enable a comparison of recordings from fault recorders and protection equipment at different locations, precise time synchronization of all SIMEAS R-PQ and DAKON devices is necessary. This is ensured by the use of additional components, such as GPS receiver and sync transceiver.More details at the document “Application Note Time Synchronization” www.siemens.com/powerquality
Analysis and evaluation softwareAll data recorded with SIMEAS R-PQ can be analyzed with the SICAM PQS software package.SICAM PQS is also used for parameterizing the SIMEAS R-PQ, and archiving the fault recordings and mean values.The SICAM PQS software also offers the ability to work out the location of a fault in a line. Depending on data availability, the program can use fault recordings made at either end of a line to determine the fault location. The measured values recorded with the “mean value and power quality recorder” function can be analyzed with the SICAM PQ Analyzer, which is an optional software package of SICAM PQS.For example, information can be obtained about the system voltage quality on a specifi c feeder.
Design and data acquisition unitsThe SIMEAS R-PQ recorder is available in two different housings. The smaller type (ZE8/16) can be equipped with one data acquisition unit (DAU). The larger type (ZE32/64) provides space for up to 4 DAUs. A selection of different DAUs enables fl exible arrangement of inputs for current, voltage and DC voltage:• VDAU (8 voltage channels)• CDAU (8 current channels)• VCDAU (4 voltage and 4 current channels)• DDAU (8 voltage or 8 current channels).
All data acquisition units described also feature 16 binary channels. If a larger number of binary signals is to be recorded, the recorder can optionally be equipped with a BDAU with 32 binary channels.
Fig. 5/2 SIMEAS R-PQ, compact housing
SR2
00
0a-
afp
.tif
SR2
00
5a-
afp
.tif
SR2
00
6a-
afp
.tif
Fig. 5/4 DAUs
Fig. 5/3 SIMEAS R-PQ, front view. A DAU can be seen in the middle slot
Power Quality and Measurements Product Catalog · Siemens SR 10 · Edition 2
Products – SIMEAS R-PQ
5/5
1
2
3
4
5
6
7
8
9
System overview
Dynamic fault recorder for analog and binary channelsThe “fault recorder” function includes recording of analog and digital signals. These signals are continuously recorded and simultaneously compared with the parameterized trigger criteria. On triggering, all channels are recorded concurrently as well as with a pre-fault, variable fault progression, and post-fault, depending on the parameter settings for recording.
Recording alternating current and voltageThree different data acquisition units are available for recording currents and voltages:• VCDAU with 4 voltage and 4 current inputs• CDAU with 8 current inputs• VDAU with 8 voltage inputs.The SIMEAS R-PQ sampling rate is 256 × system frequency. For a system frequency of 50 Hz, the sampling rate is therefore 12.8 kHz (for 60 Hz, 15.36 kHz per channel).
Recording of the process variablesDC signals are measured via the DDAU data acquisition unit, which has 8 signal inputs. The DDAU can be ordered for an input range of -1 V to +1V, -10 V to +10 V or -20 mA to +20 mA. These inputs can be assigned to one process signal each, e.g. display of temperature in K, speed of rotation in rpm, voltage in kV, current in kA.
Recording of binary signalsThe recording of binary channels is fully synchronized with recording of analog channels. The sampling rate is 2 kHz.A group of 16 binary inputs can record up to 250 state changes per second.
Flexible triggeringWith its numerous settable trigger conditions, SIMEAS R-PQ can be precisely adapted to the specifi c requirements of an application:
– Triggering on the r.m.s. value of an analog channel(min. / max. triggering)
For triggering, the recorder calculates a measured value corresponding to the r.m.s. value of a current or voltage (I, V ) continuously at intervals of half a system cycle. The values sampled over half a system cycle are used to calculate this measured value.Triggering occurs (i.e. recording is started) when the measured value either exceeds a positive maximum limit or falls below a positive minimum limit.One practical example of this is triggering on a maximum value of the r.m.s. current and on a minimum value of an r.m.s. voltage.
– Triggering on a change in the r.m.s. value of an analogchannel (dM/dt triggering)
Each time the measured value described above (V, I ) is calculated, the difference is formed between two measured values one system cycle apart. This difference is compared with the set rate-of-change (dM/dt) limit, e.g. 10 kV / 20 ms. This permits triggering on a positive or negative change to the r.m.s. value of a voltage or current input.
– Triggering on the r.m.s. value of the positive or negativesequence system (min. / max. triggering)
The recorder can be parameterized to treat the analog inputs of a data acquisition unit as single, independent channels, or assign them to a three-phase system. In the latter case, positive and negative sequence components can be calculated both for current and voltage channels and used for triggering. Calculation of the measured quantities and of the triggering is performed as described under “Triggering on the r.m.s. value of an analog chan-nel, min. / max. triggering”.
Examples of logic gating:• Voltage min. trigger threshold, recording reached,
and current max.• Binary contact channel 1 high recording and current
max. trigger reached• Binary contact 1.
– Triggering on the limit of a DC channel (min. / max.triggering)
Triggering is performed when the sampled value of the DC signal exceeds the max. limit or falls below the min. limit.
– Triggering on the gradient of a DC channel (gradient triggering)
For the gradient trigger, the difference is calculated between two sampled values of a DC signal in a settable time interval.Triggering can be performed on a positive or negative gradient.
– Triggering on binary channels Triggering to state (high or low), or on the positive or neg-ative signal edge, or on a binary input change is possible.
– Logic gating of trigger conditionsAnalog and binary trigger conditions can be ANDed. The logic gating of triggers serves, for example, to distinguish a fault from an intentional line disconnection.The logic operation is applied to a settable time window from 0 to 1 s. If the triggering conditions are detected as “true” during this time window, recording starts. A total of 8 patterns with 8 start selectors each can be parameter-ized as trigger criteria.
– Triggering via the front panel (manual trigger)This function is especially useful for commissioning work. It permits testing of the polarity of current and voltage channels and testing of phase angle offsets.
– Network triggerThis triggering applies to devices communicating via an Ethernet network.Triggering is performed either from the PC for all con-nected SIMEAS R-PQ recorders, or sent from a SIMEAS R-PQ to further devices.
– External triggerA recording start can be triggered externally via a separate binary input. Recording is limited to 10 s and is performed for as long as a voltage is applied to this input.
Power Quality and Measurements Product Catalog · Siemens SR 10 · Edition 2
Products – SIMEAS R-PQ
5/6
1
2
3
4
5
6
7
8
9
System overview
Flexible triggering (cont.)
The duration of the recording and the pre- and post-faults can be parameterized.Smart sequence control monitors the trigger conditions during recording.If retriggering is permitted and the maximum fault record-ing length is reached, a dynamic fault recording length is reached. For external triggering, time synchronization of all SIMEAS R-PQ devices in the system is required to ensure the fault records have the same time reference.
Power and frequency recorderThe frequency and power recorder calculates and stores the active and reactive power and the power factor plus the frequency (P, Q, PF (cos φ) and f ). This function is used, for example, to record the load conditions before, during and after a fault in a power plant.Power swings in the power system and the frequency curve over a long time can be recorded.One special application is recording of the properties of primary control in a power plant. For example, if a power plant unit is shut down at another location in a grid, the frequency of the power system will drop.This causes a considerable change in the power output of the power plant in which recording is taking place. Because all channels are recorded simultaneously, the user can establish a power balance, e.g. at the infeed points in substations.
Recording principleThe variables active power, reactive power, power factor and frequency (P, Q, PF (cos φ) and f ) are continuously calculated at intervals of one system cycle, and stored in a buffer. If the parameter “averaging time” is set to “1”, the calculation interval of the frequency and power recorder is one system cycle. The values in the fault recording therefore correspond to the values in the buffer. Other settings of the “averaging time” parameter can reduce the recorder’s calculation interval. For example, if the “averaging time” parameter is set to “4”, a mean value is formed over the 4 values of the variables (P, Q, PF (cos φ), f ) last calculated and written to the buffer after 4 system cycles have elapsed. This means that the calculation interval of the fault record-ing is 4 system cycles. The “averaging time” parameter can be set in the range 1 to 250.The number of calculated values before the trigger point (pre-fault) can be selected in the range of 0 to 500.The system frequency is measured via a voltage channel if the unit is equipped with an appropriate module (VDAU, VCDAU); if not, the frequency is measured via a current channel of a CDAU by automatic determination of the current signal with the highest amplitude and the lowest harmonic distortion.
Power quality recorder and mean value recorderThe mean value recorder and power quality recorder functions store the signals continuously. The averaging time for the groups listed below can be freely parameterized in the range of 10 s to one hour.The following electrical quantities are measured, stored and displayed in the evaluation program:• Voltage and current• Active and reactive power• Frequency, positive and negative sequence system• Weighted and unweighted THD• Current and voltage harmonic• Process variables• Voltage dips• Flicker.
With this function it is possible to monitor a substation or part of a substation (e.g. feeder) continuously and to evalu-ate its power quality. The measurement is used for monitor-ing the r.m.s. current progression as well as the active and reactive power. This enables the energy requirement of a feeder to be averaged over a long period. Moreover, an analysis of the r.m.s. voltage, the current harmonic progression, the THD, the progression of voltage dips and fl icker effects (Pst and PIt value) provides information about the quality of the power supply on a feeder. Existing fault sources can thus be located and countermeasures taken.
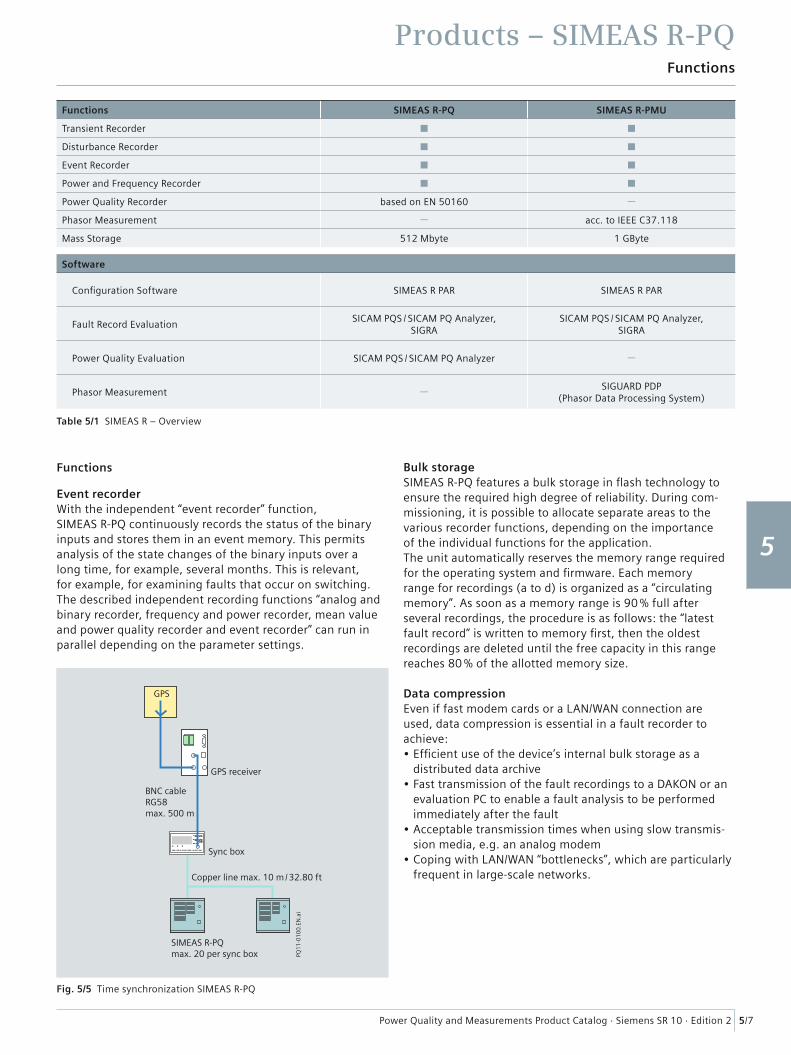
Power Quality and Measurements Product Catalog · Siemens SR 10 · Edition 2
Products – SIMEAS R-PQ
5/7
1
2
3
4
5
6
7
8
9
Functions
Functions
Event recorderWith the independent “event recorder” function, SIMEAS R-PQ continuously records the status of the binary inputs and stores them in an event memory. This permits analysis of the state changes of the binary inputs over a long time, for example, several months. This is relevant,for example, for examining faults that occur on switching.The described independent recording functions “analog and binary recorder, frequency and power recorder, mean value and power quality recorder and event recorder” can run in parallel depending on the parameter settings.
Bulk storageSIMEAS R-PQ features a bulk storage in fl ash technology to ensure the required high degree of reliability. During com-missioning, it is possible to allocate separate areas to the various recorder functions, depending on the importance of the individual functions for the application.The unit automatically reserves the memory range required for the operating system and fi rmware. Each memory range for recordings (a to d) is organized as a “circulating memory”. As soon as a memory range is 90 % full after several recordings, the procedure is as follows: the “latest fault record” is written to memory fi rst, then the oldest recordings are deleted until the free capacity in this range reaches 80 % of the allotted memory size.
Data compressionEven if fast modem cards or a LAN/WAN connection are used, data compression is essential in a fault recorder to achieve:• Effi cient use of the device’s internal bulk storage as a
distributed data archive• Fast transmission of the fault recordings to a DAKON or an
evaluation PC to enable a fault analysis to be performed immediately after the fault
• Acceptable transmission times when using slow transmis-sion media, e.g. an analog modem
• Coping with LAN/WAN “bottlenecks”, which are particularly frequent in large-scale networks.
Functions SIMEAS R-PQ SIMEAS R-PMU
Transient Recorder
Disturbance Recorder
Event Recorder
Power and Frequency Recorder
Power Quality Recorder based on EN 50160
Phasor Measurement acc. to IEEE C37.118
Mass Storage 512 Mbyte 1 GByte
Software
Confi guration Software SIMEAS R PAR SIMEAS R PAR
Fault Record EvaluationSICAM PQS / SICAM PQ Analyzer,
SIGRASICAM PQS / SICAM PQ Analyzer,
SIGRA
Power Quality Evaluation SICAM PQS / SICAM PQ Analyzer
Phasor MeasurementSIGUARD PDP
(Phasor Data Processing System)
Table 5/1 SIMEAS R – Overview
Sync box
PQ1
1-0
10
0.E
N.a
i
SIMEAS R-PQmax. 20 per sync box
Copper line max. 10 m/32.80 ft
GPS receiver
BNC cableRG58max. 500 m
GPS
Fig. 5/5 Time synchronization SIMEAS R-PQ
Power Quality and Measurements Product Catalog · Siemens SR 10 · Edition 2
Products – SIMEAS R-PQ
5/8
1
2
3
4
5
6
7
8
9
Functions, hardware
Time synchronization for SIMEAS R-PQTime synchronization is achieved via a special input of the processor module to which a synchronization box (7KE6000-8HA*) is connected externally.Depending on implementation, the synchronization box can pick up the time signal from various receiver types, for example, via a GPS, DCF77 or IRIG-B.Synchronization with a GPS signal is the usual method. This requires special receivers that generally output a modulated telegram (DCF77, IRIG-B). This time telegram is passed on to the synchronization box.When confi guring a fault recorder system, it is important to ensure that the right synchronization box is ordered for the receiver type. It decodes the receiver signal and sends a time telegram to the SIMEAS R-PQ with an internal protocol.Independently of this synchronization, it is also possible to synchronize with a minute pulse via a binary input. This feature can be used to reset the second hand of the SIMEAS R-PQ’s internal clock to zero on each pulse.If external synchronization fails, all the data acquisition units (DAUs) of a recorder are synchronized by the internal clock. The time is adjusted automatically on recovery of the synchronization telegram.
If two or more recorders are used at a single mounting location, the signal from the synchronization box is wired to the control input of the various recorders in parallel.
If the synchronization signal has to be distributed via optical cables due to a substantial distance between the various SIMEAS R-PQ recorders, the following additional compo-nents are required:• Sync FO distributor: converts the 24 V signal of the
synchronization box to 8 FO outputs (7KE6000-8AH/8AJ).• Sync transceiver: converts the FO signal to 24 V
(7KE6000-8AK/8AL).
Communication interfaces and componentsSIMEAS R-PQ features the following communication interfaces:• COMS interface
This RS232 interface on the front panel is for direct communication with an evaluation PC. This interface can be used to parameterize and test the recorder during commissioning. It has fi xed communication parameters.
• COM1 interface
This serial interface (RS232) is located on the rear of the recorder. This interface enables the recorder to communi-cate via an external analog or ISDN modem. The recorder can then be connected to a telephone network, but a direct modem-to-modem connection is also possible.
The communication parameters of this interface can be set.• Ethernet interface
This integrated interface is used to connect the recorder to a LAN (local area network) IEEE 802.3 (10 Mbps Ethernet) with the TCP/IP protocol. (Please note that recorders delivered up to about February 2003 have a PCMCIA slot for an Ethernet card at the rear).
• Ethernet structure
The network used to connect to an evaluation PC or a DAKON has star topology.One or more connection nodes (switches) can be used. To improve the reliability of communication channels, optical cables can be used for the network.
The following components can be used to set up an optical network:• Transceiver (7KE6000-8AF/8AG)
Converter from 10BASE-T ports with copper cable to 10BASE-FL with optical cable. The unit has an FO and a 10BASE-T network port. Housing: DIN rail mounting.
• Multiport repeater, or switchThis switch enables connection to two or more Ethernet cable segments. The unit has one FO and six 10BASE-T network ports. Housing: DIN rail mounting.
Hardware
HousingTwo types of housing are available for SIMEAS R-PQ:• 1/2 19-inch rack with 3 slots and• 19-inch rack with 6 slotsThe fi rst slot is fi lled by the CPU module, the last slot of each rack by the PSU. The remaining slots can be fi lled with various data acquisition units (DAUs). The modules are slotted into the rack vertically, and the terminals are located at the rear of the rack.
Central processorThe central processor coordinates the data acquisition units, communication via the interfaces, and manages the database for the various fault records and mean values. It also monitors the entire hardware.
Power supplyThe power supply is drawn from two different units (PSUs), depending on the supply voltage:• 24 V – 60 V DC• 110 V – 250 V DC and 115 – 230 V ACIn the event of a sudden power failure, the recorder contin-ues to function, drawing its power from a storage capacitor (for details such as duration, see “Technical Data”).This allows time for a controlled reset if the power supply fails during operation. The PSU can optionally be equipped with a battery. The battery ensures operation for up to 10 minutes. The battery is loaded automatically and its charge state is monitored by an independent circuit. With a weekly automatic load test, the memory effect of the battery is reduced. Use of the battery is especially recommended if the recorder is powered from an AC source without PSU back-up.
Data Acquisition Units (DAUs)The following data acquisition units are available for the unit:• VCDAU: 4 current / 4 voltage channels and 16 binary
channels• VDAU: 8 voltage channels and 16 binary channels• CDAU: 8 current channels and 16 binary channels• DDAU: 8 channels for process variables and 16 binary
channels• BDAU: 32 binary channels.
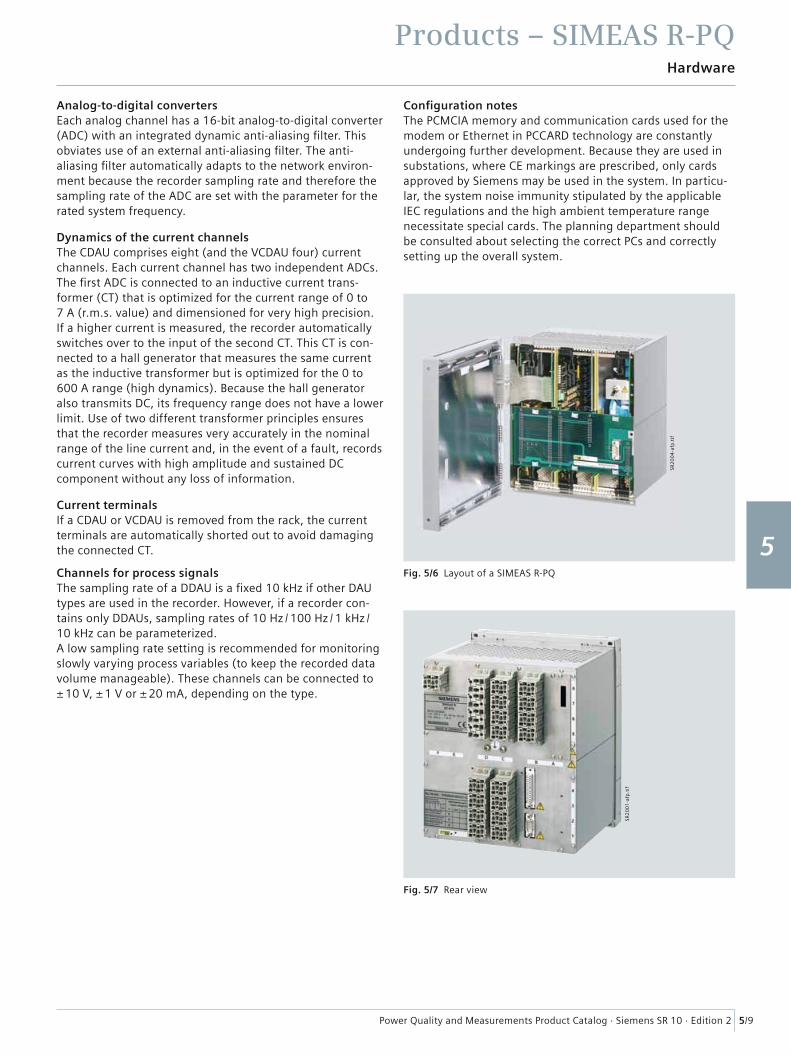
Power Quality and Measurements Product Catalog · Siemens SR 10 · Edition 2
Products – SIMEAS R-PQ
5/9
1
2
3
4
5
6
7
8
9
Hardware
Analog-to-digital convertersEach analog channel has a 16-bit analog-to-digital converter (ADC) with an integrated dynamic anti-aliasing fi lter. This obviates use of an external anti-aliasing fi lter. The anti-aliasing fi lter automatically adapts to the network environ-ment because the recorder sampling rate and therefore the sampling rate of the ADC are set with the parameter for the rated system frequency.
Dynamics of the current channelsThe CDAU comprises eight (and the VCDAU four) current channels. Each current channel has two independent ADCs.The fi rst ADC is connected to an inductive current trans-former (CT) that is optimized for the current range of 0 to 7 A (r.m.s. value) and dimensioned for very high precision.If a higher current is measured, the recorder automatically switches over to the input of the second CT. This CT is con-nected to a hall generator that measures the same current as the inductive transformer but is optimized for the 0 to 600 A range (high dynamics). Because the hall generator also transmits DC, its frequency range does not have a lower limit. Use of two different transformer principles ensures that the recorder measures very accurately in the nominal range of the line current and, in the event of a fault, records current curves with high amplitude and sustained DC component without any loss of information.
Current terminalsIf a CDAU or VCDAU is removed from the rack, the current terminals are automatically shorted out to avoid damaging the connected CT.
Channels for process signalsThe sampling rate of a DDAU is a fi xed 10 kHz if other DAU types are used in the recorder. However, if a recorder con-tains only DDAUs, sampling rates of 10 Hz / 100 Hz / 1 kHz / 10 kHz can be parameterized.A low sampling rate setting is recommended for monitoring slowly varying process variables (to keep the recorded data volume manageable). These channels can be connected to ± 10 V, ± 1 V or ± 20 mA, depending on the type.
Confi guration notesThe PCMCIA memory and communication cards used for the modem or Ethernet in PCCARD technology are constantly undergoing further development. Because they are used in substations, where CE markings are prescribed, only cards approved by Siemens may be used in the system. In particu-lar, the system noise immunity stipulated by the applicable IEC regulations and the high ambient temperature range necessitate special cards. The planning department should be consulted about selecting the correct PCs and correctly setting up the overall system.
Fig. 5/6 Layout of a SIMEAS R-PQ
Fig. 5/7 Rear view
SR2
00
4-a
fp.t
if
SR2
00
1-a
fp.t
if

Power Quality and Measurements Product Catalog · Siemens SR 10 · Edition 2
Products – SIMEAS R-PQ
5/10
1
2
3
4
5
6
7
8
9
Hardware
ModesSIMEAS R-PQ has three operating modes:• Normal mode
In normal mode all functions are active.• Blocked mode
In blocked mode, the recording functions “dynamic recorder for analog and binary channels” and “power and frequency recorder” are inactive, i.e. no fault records are recorded. If this mode is selected, only the functions “mean value and power quality recorder” and “event recorder” are active. The mode is used, for example, to test equipment connection during commissioning.
• Test modeIn test mode, all functions are active, but recorded events are entered with “test” as their cause. The “event recorded” alarm relay does not pick up. “Test mode” is used to check the functionality of the SIMEAS R-PQ. The different modes can be selected on the keyboard. Remote control via Value Viewer of SICAM PQS is possible at any time.
LEDs on the front panel of the recorderThe front panel of the recorder contains 8 red and 8 green parameterizable LEDs assigned as follows:
8 green LEDs• Recorder in operation• Operating voltage OK• Battery capacity OK• Event recorded• Data transmission to the PC• Circulating memory active• Two further LEDs freely programmable.
8 red LEDs• Fault DAU(s)• Fault printer• Fault time synchronization• Fault fi ne synchronization• Fault data memory• PC not accessible• Temperature ≤ 5 °C / 41 °F• Temperature ≥ 55 °C / 131 °F.
and 5 LEDs permanently assigned to the control buttons listed below:
Control buttonsThe recorder has the following control buttons that are located on the front panel:• Acknowledge group alarm• Normal mode• Blocked mode• Test mode• Manual trigger.
Control inputsThere are four contact inputs at the rear of the recorder:• Acknowledge group alarm• System reset• External start• Time synchronization.
Alarm outputsThe recorder has four alarm outputs. The fi rst is perma-nently connected to the processor watchdog. The other three can be freely programmed and are pre-assigned as follows:• Watchdog• Ready to run• Event being recorded• Group alarm.
Group alarm• Fault DAU(s)• Fault printer• Fault synchronization• Fault data memory.
Fig. 5/8 LEDs and control buttons
LSP2
82
4.t
if
Power Quality and Measurements Product Catalog · Siemens SR 10 · Edition 2
Products – SIMEAS R-PQ
5/11
1
2
3
4
5
6
7
8
9
Technical data
Mechanical design
ZE 8 /16 1/2 19” version
Dimensions (W × H × D) 223 mm × 266 mm × 300 mm/8.78 in. x 10.47 in. x 11.81 in.
Number of slots 3
Slot 1: CPUPCCard-Slot
Slot 0 type I and IISlot 1 type I to III
Slot 2: DAU See “Analog and binary inputs and outputs”
Slot 3: Power supply unit
ZE 32 /64 19” version
Dimensions (W × H × D) 445 mm × 266 mm × 300 mm/17.52 inch x 10.47 in. x 11.81 in.
Number of slots 6
Slot 1: CPU Approx 1.5 mA / input
Slot 2 - 5: DAU See “Analog and binary inputs and outputs”
Slot 6: Power supply unit
Auxiliary voltage
Low-voltage version
DC voltage
Rated auxiliary DC voltage Vaux 24 / 28 / 60 V DC
Permissible voltage ranges 19.2 to 72 V DC
High-voltage version
DC voltage
Rated auxiliary DC voltage Vaux 110 / 125 / 220 / 250 V DC
Permissible voltage ranges 88 to 300 V DC
AC voltage 50 / 60 Hz
Rated auxiliary AC voltage Vaux 115 / 230 V AC
Permissible voltage ranges 92 to 276 V AC
Voltage stability without back-up battery
Bridging time Measured times, central unitZE8/16 ZE32/64
for Vaux = 24 V DC ≥ 400 ms ≥ 150 ms
for Vaux = 60 V DC ≥ 450 ms ≥ 170 ms
for Vaux = 110 V DC ≥ 500 ms ≥ 180 ms
for Vaux = 250 V DC ≥ 700 ms ≥ 200 ms
for Vaux = 115 V AC ≥ 500 ms ≥ 200 ms
for Vaux = 230 V AC ≥ 800 ms ≥ 348 ms
Optionally with back-up battery
Power failure bridging time up to 10 min with all functions operating
Power consumption
1/2 19” version 8 analog / 16 binary channels
24 to 60 V DC 20 W110 to 250 V DC 18 W115 to 230 V AC 30 VA
19” version 32 analog / 64 binary channels
24 to 60 V DC 45 W110 to 250 V DC 40 W115 to 230 V AC 70 VA
Analog and binary inputs and outputs
Slot 2(1/2 19” version)
To be equipped according to table “Equipping version”
Slot 2 to 5(19” version)
To be equipped according to table “Equipping version”
Equipping versions
VCDAU 8 analog (4 current / 4 voltage) and 16 binary channels
CDAU 8 analog (8 current) and 16 binary channels
VDAU 8 analog (8 voltage) and 16 binary channels
BDAU 32 binary channels
DDAU 8 analog (8 current ± 20 mA, or 8 voltage ± 1 V or ± 10 V) and 16 binary channels
SIMEAS R-PQ
VCDAU, CDAU and VDAU
If a recorder contains only DDAUs, it is possible to parameterize the sampling rates 10 Hz / 100 Hz / 1 kHz / 10 kHz. If the recorder also contains other DAUs, the sampling rate of the DC signals is always 10 kHz.
Sampling Rated Frequencyfrequency frequency range
4.3 kHz 16.7 Hz 12 to 20 Hz12.8 kHz 50 Hz 40 to 60 Hz15.36 kHz 60 Hz 50 to 70 Hz64 times oversampling
Voltage input (VDAU or VCDAU)
Measuring range 1 1.5 to 200 Vrms
Impedance > 100 kΩ
Resolution 15 mV
Overvoltage Max. 300 Vrms for 5 s
Accuracy (at 23 °C ± 1 °C /73.4 °F ± 33.8 °F and rated frequency)
Class 0.3, ± 0.25 % of measured value ± 30 mV
Frequency response 3 to 5500 Hz (5 %)
Number of analog-digital converters per channel
1
Measuring range 2 3 to 400 Vrms
Impedance > 200 kΩ
Resolution 30 mV
Overvoltage Max. 600 Vrms for 5 s
Accuracy (at 23 °C ± 1 °C /73.4 °F ± 33.8 °F and rated frequency)
Class 0.3, ± 0.25 % of measured value ± 30 mV
Frequency response 3 to 5500 Hz (5 %)
Number of analog-digital converters per channel
Voltage channel 1
Current channel 2
Table 5/2 Technical data
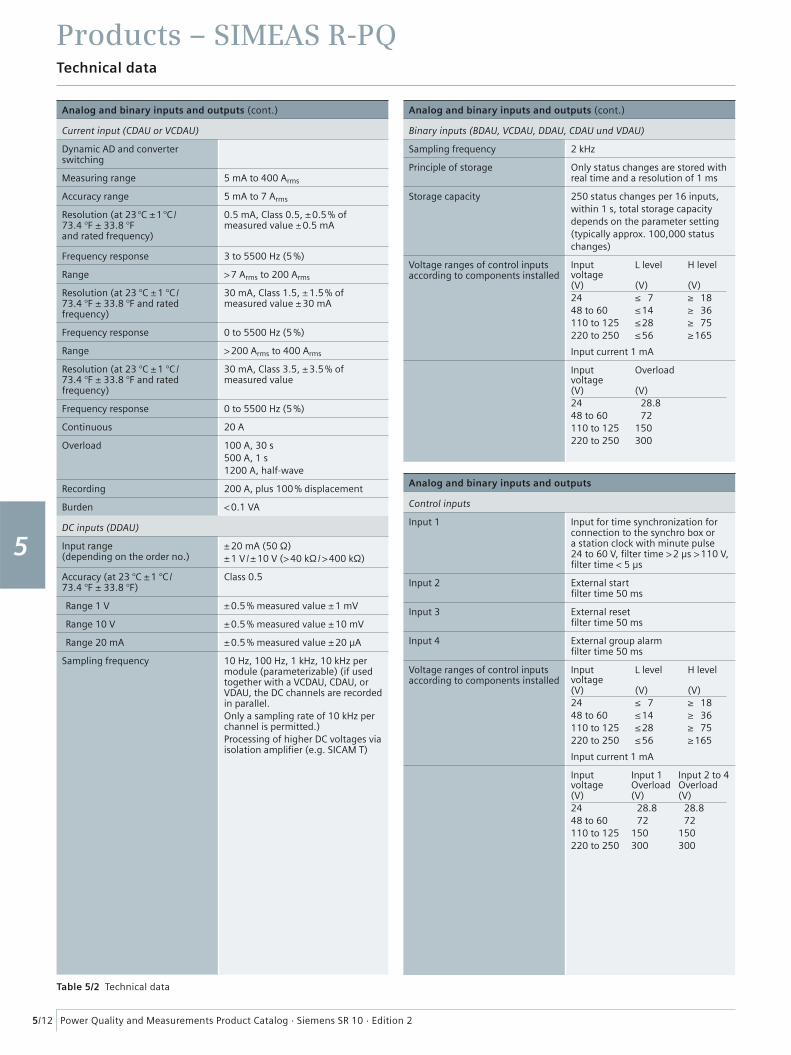
Power Quality and Measurements Product Catalog · Siemens SR 10 · Edition 2
Products – SIMEAS R-PQ
5/12
1
2
3
4
5
6
7
8
9
Technical data
Analog and binary inputs and outputs (cont.)
Current input (CDAU or VCDAU)
Dynamic AD and converter switching
Measuring range 5 mA to 400 Arms
Accuracy range 5 mA to 7 Arms
Resolution (at 23 °C ± 1 °C /73.4 °F ± 33.8 °F and rated frequency)
0.5 mA, Class 0.5, ± 0.5 % of measured value ± 0.5 mA
Frequency response 3 to 5500 Hz (5 %)
Range > 7 Arms to 200 Arms
Resolution (at 23 °C ± 1 °C /73.4 °F ± 33.8 °F and rated frequency)
30 mA, Class 1.5, ± 1.5 % of measured value ± 30 mA
Frequency response 0 to 5500 Hz (5 %)
Range > 200 Arms to 400 Arms
Resolution (at 23 °C ± 1 °C /73.4 °F ± 33.8 °F and rated frequency)
30 mA, Class 3.5, ± 3.5 % of measured value
Frequency response 0 to 5500 Hz (5 %)
Continuous 20 A
Overload 100 A, 30 s500 A, 1 s1200 A, half-wave
Recording 200 A, plus 100 % displacement
Burden < 0.1 VA
DC inputs (DDAU)
Input range (depending on the order no.)
± 20 mA (50 Ω)± 1 V / ± 10 V (> 40 kΩ / > 400 kΩ)
Accuracy (at 23 °C ± 1 °C /73.4 °F ± 33.8 °F)
Class 0.5
Range 1 V ± 0.5 % measured value ± 1 mV
Range 10 V ± 0.5 % measured value ± 10 mV
Range 20 mA ± 0.5 % measured value ± 20 µA
Sampling frequency 10 Hz, 100 Hz, 1 kHz, 10 kHz per module (parameterizable) (if used together with a VCDAU, CDAU, or VDAU, the DC channels are recorded in parallel.Only a sampling rate of 10 kHz per channel is permitted.)Processing of higher DC voltages via isolation amplifi er (e.g. SICAM T)
Analog and binary inputs and outputs (cont.)
Binary inputs (BDAU, VCDAU, DDAU, CDAU und VDAU)
Sampling frequency 2 kHz
Principle of storage Only status changes are stored with real time and a resolution of 1 ms
Storage capacity 250 status changes per 16 inputs,within 1 s, total storage capacitydepends on the parameter setting(typically approx. 100,000 statuschanges)
Voltage ranges of control inputs according to components installed
Input L level H levelvoltage(V) (V) (V)24 ≤ 7 ≥ 1848 to 60 ≤ 14 ≥ 36110 to 125 ≤ 28 ≥ 75220 to 250 ≤ 56 ≥ 165
Input current 1 mA
Input Overloadvoltage(V) (V)24 28.848 to 60 72110 to 125 150220 to 250 300
Analog and binary inputs and outputs
Control inputs
Input 1 Input for time synchronization for connection to the synchro box or a station clock with minute pulse 24 to 60 V, fi lter time > 2 μs > 110 V, fi lter time < 5 μs
Input 2 External start fi lter time 50 ms
Input 3 External resetfi lter time 50 ms
Input 4 External group alarmfi lter time 50 ms
Voltage ranges of control inputs according to components installed
Input L level H levelvoltage(V) (V) (V)24 ≤ 7 ≥ 1848 to 60 ≤ 14 ≥ 36110 to 125 ≤ 28 ≥ 75220 to 250 ≤ 56 ≥ 165
Input current 1 mA
Input Input 1 Input 2 to 4voltage Overload Overload(V) (V) (V)24 28.8 28.848 to 60 72 72110 to 125 150 150220 to 250 300 300
Table 5/2 Technical data
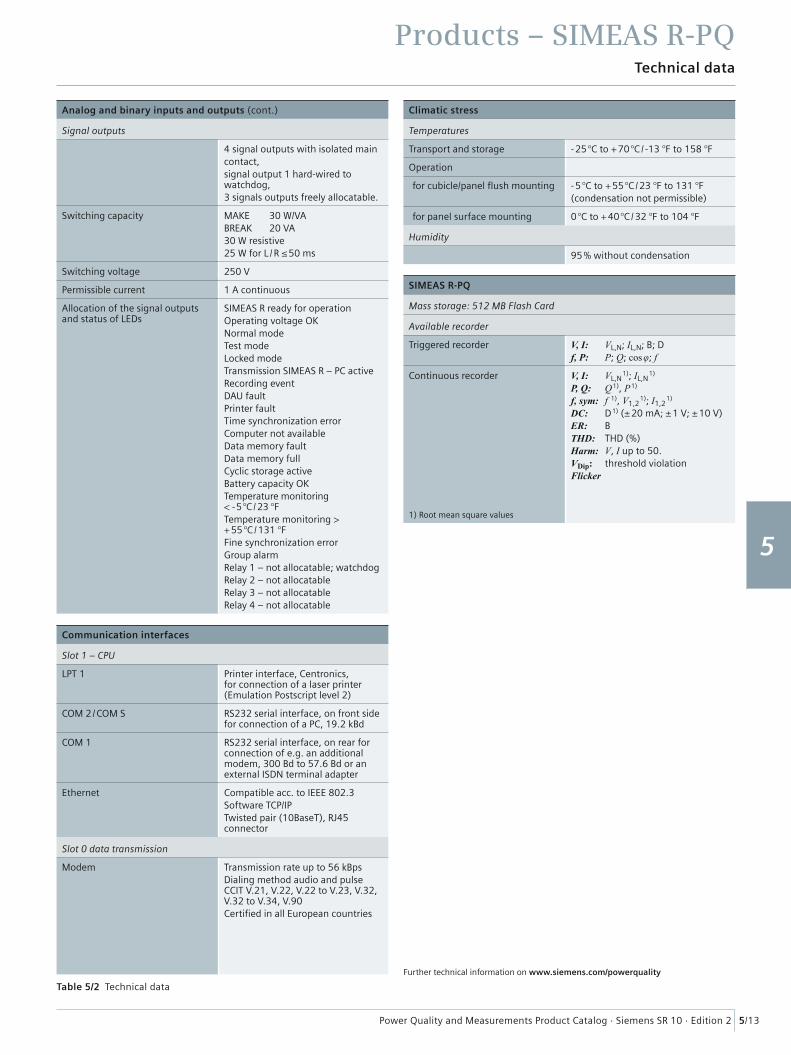
Power Quality and Measurements Product Catalog · Siemens SR 10 · Edition 2
Products – SIMEAS R-PQ
5/13
1
2
3
4
5
6
7
8
9
Technical data
Analog and binary inputs and outputs (cont.)
Signal outputs
4 signal outputs with isolated maincontact,signal output 1 hard-wired to watchdog,3 signals outputs freely allocatable.
Switching capacity MAKE 30 W/VABREAK 20 VA30 W resistive25 W for L / R ≤ 50 ms
Switching voltage 250 V
Permissible current 1 A continuous
Allocation of the signal outputs and status of LEDs
SIMEAS R ready for operationOperating voltage OKNormal modeTest modeLocked modeTransmission SIMEAS R – PC activeRecording eventDAU faultPrinter faultTime synchronization errorComputer not availableData memory faultData memory fullCyclic storage activeBattery capacity OKTemperature monitoring < - 5 °C / 23 °FTemperature monitoring > + 55 °C /131 °FFine synchronization errorGroup alarmRelay 1 – not allocatable; watchdogRelay 2 – not allocatableRelay 3 – not allocatableRelay 4 – not allocatable
Communication interfaces
Slot 1 – CPU
LPT 1 Printer interface, Centronics, for connection of a laser printer (Emulation Postscript level 2)
COM 2 / COM S RS232 serial interface, on front side for connection of a PC, 19.2 kBd
COM 1 RS232 serial interface, on rear for connection of e.g. an additional modem, 300 Bd to 57.6 Bd or an external ISDN terminal adapter
Ethernet Compatible acc. to IEEE 802.3Software TCP/IPTwisted pair (10BaseT), RJ45 connector
Slot 0 data transmission
Modem Transmission rate up to 56 kBpsDialing method audio and pulse CCIT V.21, V.22, V.22 to V.23, V.32, V.32 to V.34, V.90Certifi ed in all European countries
Climatic stress
Temperatures
Transport and storage - 25 °C to + 70 °C / -13 °F to 158 °F
Operation
for cubicle/panel fl ush mounting - 5 °C to + 55 °C /23 °F to 131 °F(condensation not permissible)
for panel surface mounting 0 °C to + 40 °C /32 °F to 104 °F
Humidity
95 % without condensation
SIMEAS R-PQ
Mass storage: 512 MB Flash Card
Available recorder
Triggered recorder V, I: VL,N; IL,N; B; Df, P: P; Q; cos φ; f
Continuous recorder V, I: VL,N 1); IL,N
1)
P, Q: Q 1), P 1)
f, sym: f 1), V1,2 1); I1,2
1)
DC: D 1) (± 20 mA; ± 1 V; ± 10 V)ER: BTHD: THD (%)Harm: V, I up to 50.VDip: threshold violation Flicker
1) Root mean square values
Further technical information on www.siemens.com/powerquality
Table 5/2 Technical data
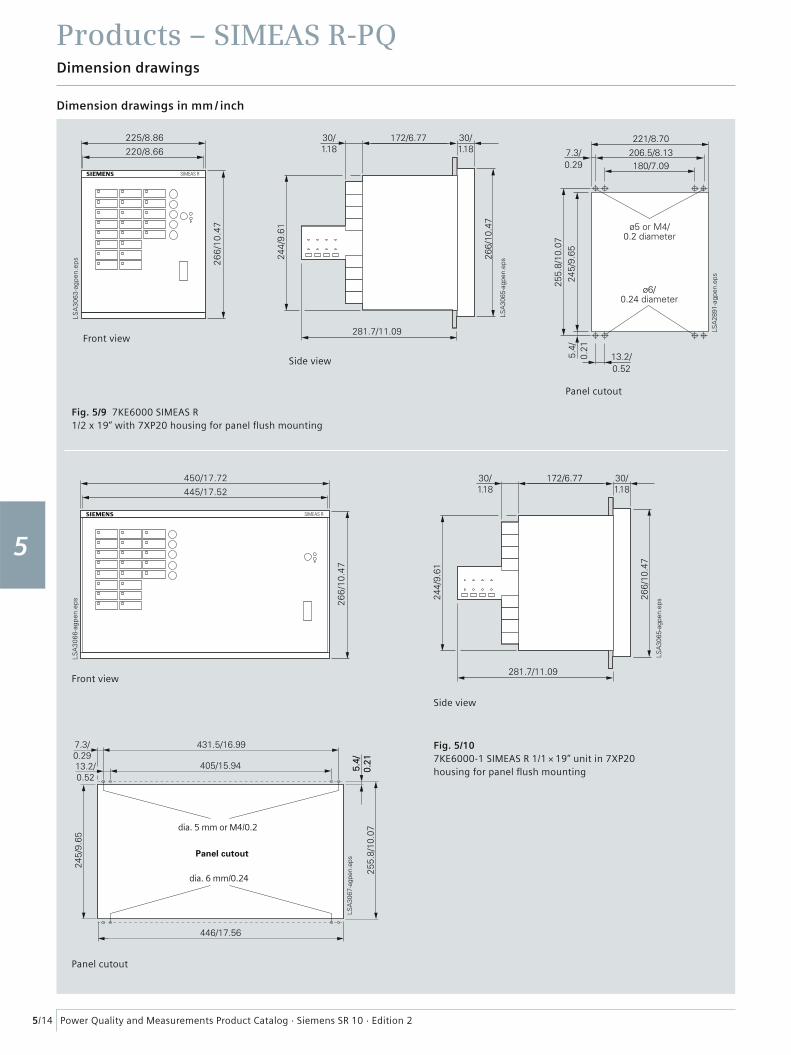
Power Quality and Measurements Product Catalog · Siemens SR 10 · Edition 2
Products – SIMEAS R-PQ
5/14
1
2
3
4
5
6
7
8
9
Dimension drawings
dia. 6 mm/0.24
dia. 5 mm or M4/0.2
Fig. 5/9 7KE6000 SIMEAS R 1/2 x 19” with 7XP20 housing for panel fl ush mounting
Front view
Front view
Panel cutout
Side view
Panel cutout
Side view
Fig. 5/10 7KE6000-1 SIMEAS R 1/1 × 19” unit in 7XP20 housing for panel fl ush mounting
Dimension drawings in mm / inch
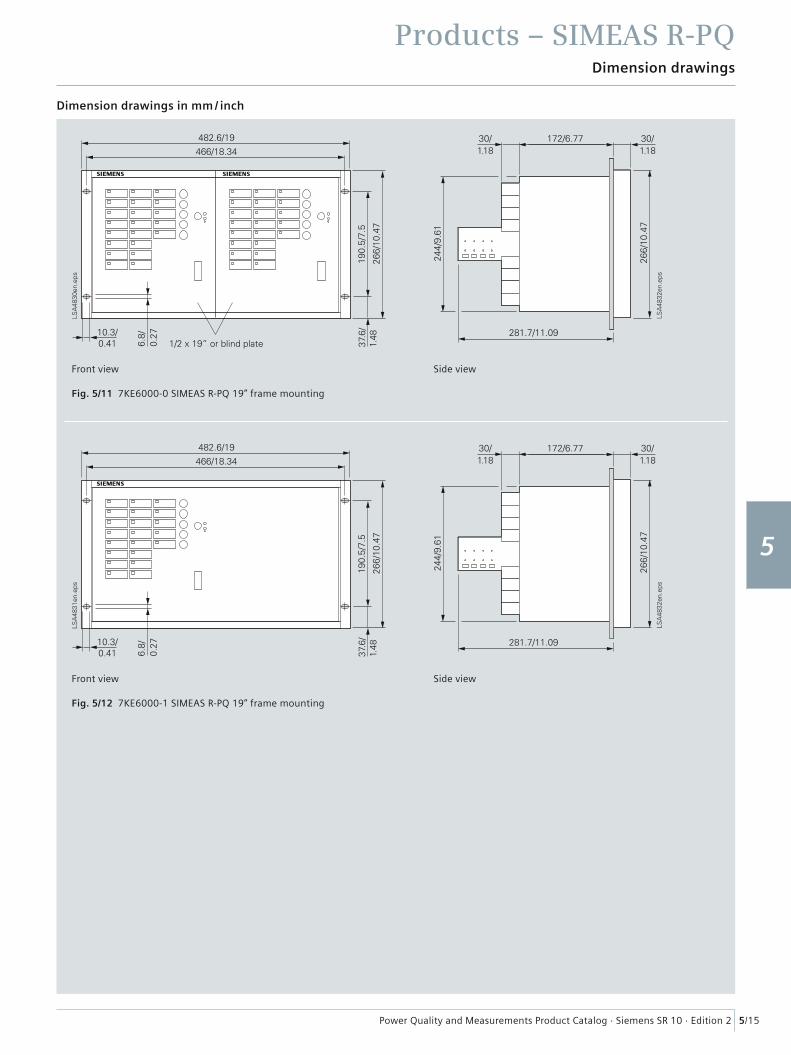
Power Quality and Measurements Product Catalog · Siemens SR 10 · Edition 2
Products – SIMEAS R-PQ
5/15
1
2
3
4
5
6
7
8
9
Dimension drawings
Front view
Fig. 5/11 7KE6000-0 SIMEAS R-PQ 19” frame mounting
Front view
Fig. 5/12 7KE6000-1 SIMEAS R-PQ 19” frame mounting
Side view
Side view
Dimension drawings in mm / inch

Power Quality and Measurements Product Catalog · Siemens SR 10 · Edition 2
Products – SIMEAS R-PQ
5/16
1
2
3
4
5
6
7
8
9
Selection and ordering data
Description Order No.
Central unit V3 ZE8 /16 with integrated Ethernet port 1) 7KE6000-0 4 -
With one data acquisition unit, remote data transmission to DAKON or evaluation PC, case ½ × 19”, usage of COM1 or COM2 or Ethernet /StandardNote: Cables must be ordered separately
Housing
For panel fl ush mounting (perforated housing)For surface mountingFor 19” assembly (perforated housing)
Measurement at
16.7 Hz network50 Hz network60 Hz network
Terminals 2)
StandardUS design
Signal voltages of the CPU and the binary inputs 3)
24 V DC, all binary inputs + CPU binary input 148 V to 60 V DC, all binary inputs + CPU binary input 1110 V to 125 V DC, all binary inputs + CPU binary input 1220 V to 250 V DC, all binary inputs + CPU binary input 148 V to 60 V DC, all binary inputs – CPU binary input 1: 24 V DC110 V to 125 V DC, all binary inputs – CPU binary input 1: 24 V DC220 V to 250 V DC, all binary inputs – CPU binary input 1: 24 V DC
Data acquisition unit DAU
VDAU (8 V /16 binary inputs)CDAU (8 I /16 binary inputs)VCDAU (4 V / 4 I /16 binary inputs)BDAU (32 binary inputs)DDAU 20 mADDAU 1 VDDAU 10 V
Auxiliary power
24 V to 60 V DC without battery24 V to 60 V DC with battery50/60 Hz, 115/230 V AC or 110 V to 250 V DC without battery50/60 Hz, 115/230 V AC or 110 V to 250 V DC with battery
Manual
GermanEnglishFrenchSpanishItalianPortuguese
1) Digital disturbance recorder (DFR) with one slot for a data acquisition unit (DAU), ½-19” rack. The basic unit has two RS232 ports(COMS and COM1), one Ethernet and one printer port. Only two communication ports can be supported in parallel.
2) Housing for surface mounting is not available with US terminals3) This ordering position defi nes the input voltage level of the binary inputs of the central processor unit (CPU) board and the binary inputs of the DAU unit.
Please note that the binary input No. 1 of the CPU unit is reserved for external time synchronization.For the device 7KE6000-0** or 7KE6100-0** the voltage level of this input must be 24 V DC, if you connect this inputto the synchronization unit 7KE6000-8HA** or together with a GPS receiver7XV5664-0AA00 via FO to the Sync-transceiver 7KE6000-8AK/L.
Example: SIMEAS R will be installed in a substation with 110 V DC voltage battery system and GPS time synchronization (= Hopf receiver + synch-box).In this case, this MLFB position (No. 13) must be “6”.
Attention: The 24 V DC input has the range of 24 V to 60 V DC.
Table 5/3 Selection and ordering data
D
1
A
4
D
7
H
C
12
E
2
B
5
F
D
F
3
C
6
G
E
G
K
HJ
4
21
5
3
7
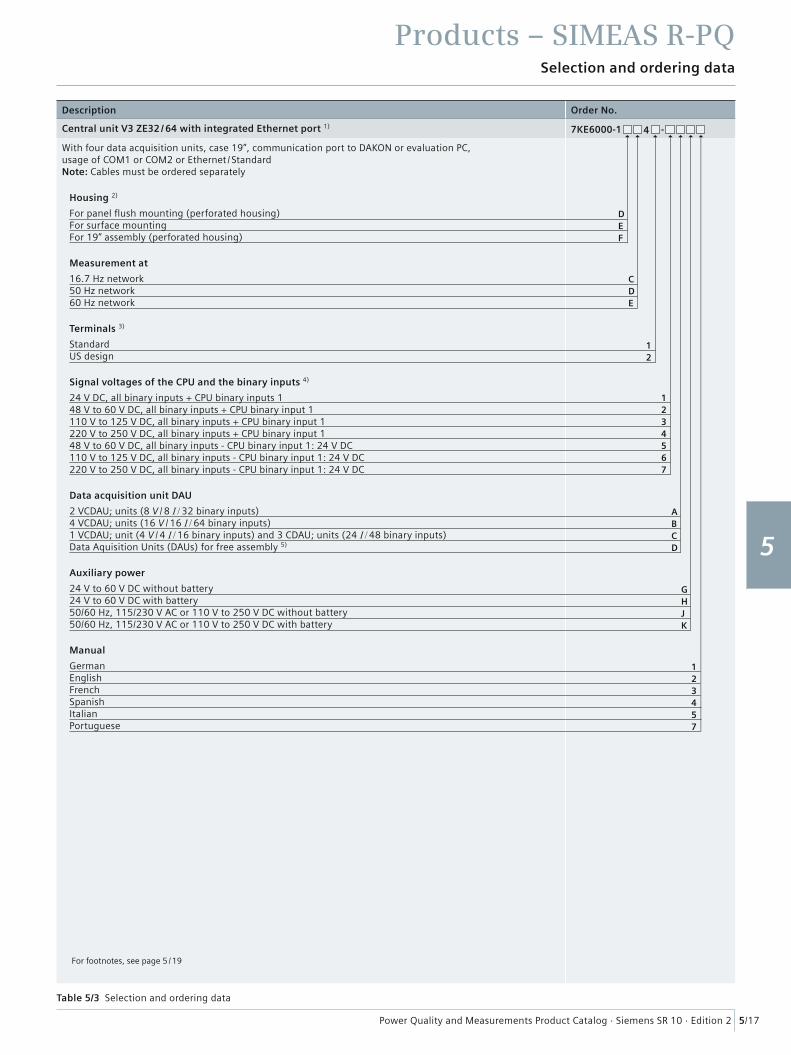
Power Quality and Measurements Product Catalog · Siemens SR 10 · Edition 2
Products – SIMEAS R-PQ
5/17
1
2
3
4
5
6
7
8
9
Selection and ordering data
Description Order No.
Central unit V3 ZE32 / 64 with integrated Ethernet port 1) 7KE6000-1 4 -
With four data acquisition units, case 19”, communication port to DAKON or evaluation PC,usage of COM1 or COM2 or Ethernet /StandardNote: Cables must be ordered separately
Housing 2)
For panel fl ush mounting (perforated housing)For surface mountingFor 19” assembly (perforated housing)
Measurement at
16.7 Hz network50 Hz network60 Hz network
Terminals 3)
StandardUS design
Signal voltages of the CPU and the binary inputs 4)
24 V DC, all binary inputs + CPU binary inputs 148 V to 60 V DC, all binary inputs + CPU binary input 1110 V to 125 V DC, all binary inputs + CPU binary input 1220 V to 250 V DC, all binary inputs + CPU binary input 148 V to 60 V DC, all binary inputs - CPU binary input 1: 24 V DC110 V to 125 V DC, all binary inputs - CPU binary input 1: 24 V DC220 V to 250 V DC, all binary inputs - CPU binary input 1: 24 V DC
Data acquisition unit DAU
2 VCDAU; units (8 V / 8 I / 32 binary inputs)4 VCDAU; units (16 V / 16 I / 64 binary inputs)1 VCDAU; unit (4 V / 4 I / 16 binary inputs) and 3 CDAU; units (24 I / 48 binary inputs)Data Aquisition Units (DAUs) for free assembly 5)
Auxiliary power
24 V to 60 V DC without battery24 V to 60 V DC with battery50/60 Hz, 115/230 V AC or 110 V to 250 V DC without battery50/60 Hz, 115/230 V AC or 110 V to 250 V DC with battery
Manual
GermanEnglishFrenchSpanishItalianPortuguese
Table 5/3 Selection and ordering data
For footnotes, see page 5 /19
D
1
4
C
7
C
12
E
2
A
5
D
D
F
3
B
6
E
G
K
HJ
4
21
5
3
7
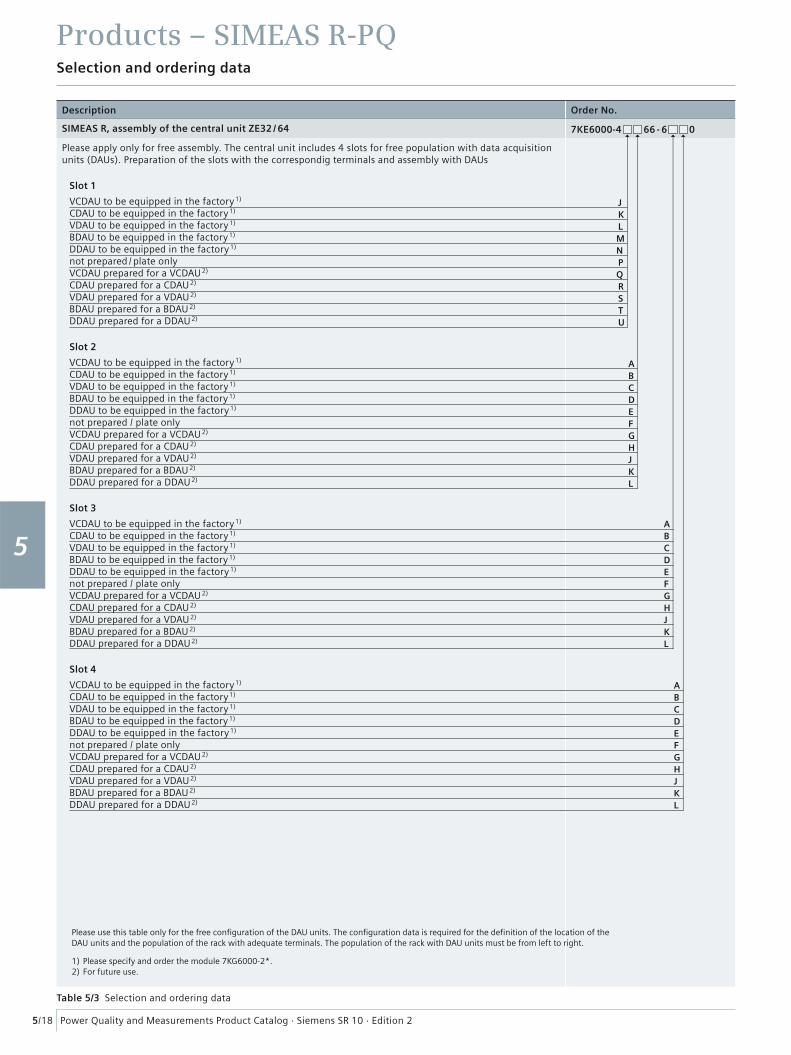
Power Quality and Measurements Product Catalog · Siemens SR 10 · Edition 2
Products – SIMEAS R-PQ
5/18
1
2
3
4
5
6
7
8
9
Selection and ordering data
Description Order No.
SIMEAS R, assembly of the central unit ZE32 / 64 7KE6000-4 66 - 6 0
Please apply only for free assembly. The central unit includes 4 slots for free population with data acquisition units (DAUs). Preparation of the slots with the correspondig terminals and assembly with DAUs
Slot 1
VCDAU to be equipped in the factory 1)
CDAU to be equipped in the factory 1)
VDAU to be equipped in the factory 1)
BDAU to be equipped in the factory 1)
DDAU to be equipped in the factory 1)
not prepared / plate onlyVCDAU prepared for a VCDAU 2)
CDAU prepared for a CDAU 2)
VDAU prepared for a VDAU 2)
BDAU prepared for a BDAU 2)
DDAU prepared for a DDAU 2)
Slot 2
VCDAU to be equipped in the factory 1)
CDAU to be equipped in the factory 1)
VDAU to be equipped in the factory 1)
BDAU to be equipped in the factory 1)
DDAU to be equipped in the factory 1)
not prepared / plate onlyVCDAU prepared for a VCDAU 2)
CDAU prepared for a CDAU 2)
VDAU prepared for a VDAU 2)
BDAU prepared for a BDAU 2)
DDAU prepared for a DDAU 2)
Slot 3
VCDAU to be equipped in the factory 1)
CDAU to be equipped in the factory 1)
VDAU to be equipped in the factory 1)
BDAU to be equipped in the factory 1)
DDAU to be equipped in the factory 1)
not prepared / plate onlyVCDAU prepared for a VCDAU 2)
CDAU prepared for a CDAU 2)
VDAU prepared for a VDAU 2)
BDAU prepared for a BDAU 2)
DDAU prepared for a DDAU 2)
Slot 4
VCDAU to be equipped in the factory 1)
CDAU to be equipped in the factory 1)
VDAU to be equipped in the factory 1)
BDAU to be equipped in the factory 1)
DDAU to be equipped in the factory 1)
not prepared / plate onlyVCDAU prepared for a VCDAU 2)
CDAU prepared for a CDAU 2)
VDAU prepared for a VDAU 2)
BDAU prepared for a BDAU 2)
DDAU prepared for a DDAU 2)
Please use this table only for the free confi guration of the DAU units. The confi guration data is required for the defi nition of the location of the DAU units and the population of the rack with adequate terminals. The population of the rack with DAU units must be from left to right.
1) Please specify and order the module 7KG6000-2*.2) For future use.
Table 5/3 Selection and ordering data
J
P
M
S
Q
K
N
T
L
R
U
A
A
A
F
F
F
D
D
D
J
J
J
G
G
G
B
B
B
E
E
E
K
K
K
C
C
C
H
H
H
L
L
L
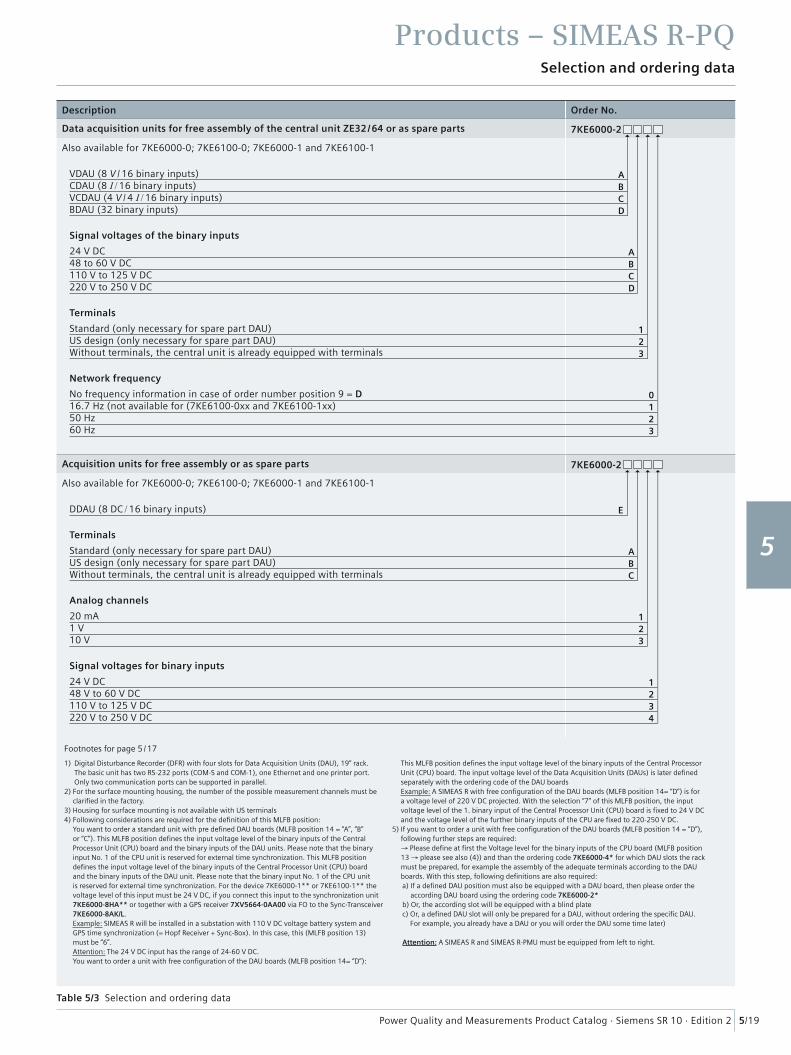
Power Quality and Measurements Product Catalog · Siemens SR 10 · Edition 2
Products – SIMEAS R-PQ
5/19
1
2
3
4
5
6
7
8
9
Selection and ordering data
Description Order No.
Data acquisition units for free assembly of the central unit ZE32 /64 or as spare parts 7KE6000-2
Also available for 7KE6000-0; 7KE6100-0; 7KE6000-1 and 7KE6100-1
VDAU (8 V / 16 binary inputs)CDAU (8 I / 16 binary inputs)VCDAU (4 V / 4 I / 16 binary inputs)BDAU (32 binary inputs)
Signal voltages of the binary inputs
24 V DC48 to 60 V DC110 V to 125 V DC220 V to 250 V DC
Terminals
Standard (only necessary for spare part DAU)US design (only necessary for spare part DAU)Without terminals, the central unit is already equipped with terminals
Network frequency
No frequency information in case of order number position 9 = D16.7 Hz (not available for (7KE6100-0xx and 7KE6100-1xx)50 Hz60 Hz
Acquisition units for free assembly or as spare parts 7KE6000-2
Also available for 7KE6000-0; 7KE6100-0; 7KE6000-1 and 7KE6100-1
DDAU (8 DC / 16 binary inputs)
Terminals
Standard (only necessary for spare part DAU)US design (only necessary for spare part DAU)Without terminals, the central unit is already equipped with terminals
Analog channels
20 mA1 V10 V
Signal voltages for binary inputs
24 V DC48 V to 60 V DC110 V to 125 V DC220 V to 250 V DC
Table 5/3 Selection and ordering data
1) Digital Disturbance Recorder (DFR) with four slots for Data Acquisition Units (DAU), 19” rack.The basic unit has two RS-232 ports (COM-S and COM-1), one Ethernet and one printer port.Only two communication ports can be supported in parallel.
2) For the surface mounting housing, the number of the possible measurement channels must beclarifi ed in the factory.
3) Housing for surface mounting is not available with US terminals4) Following considerations are required for the defi nition of this MLFB position:
You want to order a standard unit with pre defi ned DAU boards (MLFB position 14 = “A”, “B” or “C”). This MLFB position defi nes the input voltage level of the binary inputs of the Central Processor Unit (CPU) board and the binary inputs of the DAU units. Please note that the binary input No. 1 of the CPU unit is reserved for external time synchronization. This MLFB position defi nes the input voltage level of the binary inputs of the Central Processor Unit (CPU) board and the binary inputs of the DAU unit. Please note that the binary input No. 1 of the CPU unit is reserved for external time synchronization. For the device 7KE6000-1** or 7KE6100-1** the voltage level of this input must be 24 V DC, if you connect this input to the synchronization unit 7KE6000-8HA** or together with a GPS receiver 7XV5664-0AA00 via FO to the Sync-Transceiver 7KE6000-8AK/L.Example: SIMEAS R will be installed in a substation with 110 V DC voltage battery system and GPS time synchronization (= Hopf Receiver + Sync-Box). In this case, this (MLFB position 13) must be “6”.Attention: The 24 V DC input has the range of 24-60 V DC.You want to order a unit with free confi guration of the DAU boards (MLFB position 14= “D”):
This MLFB position defi nes the input voltage level of the binary inputs of the Central Processor Unit (CPU) board. The input voltage level of the Data Acquisition Units (DAUs) is later defi ned separately with the ordering code of the DAU boardsExample: A SIMEAS R with free confi guration of the DAU boards (MLFB position 14= “D”) is for a voltage level of 220 V DC projected. With the selection “7” of this MLFB position, the input voltage level of the 1. binary input of the Central Processor Unit (CPU) board is fi xed to 24 V DC and the voltage level of the further binary inputs of the CPU are fi xed to 220-250 V DC.
5) If you want to order a unit with free confi guration of the DAU boards (MLFB position 14 = “D”),following further steps are required:→ Please defi ne at fi rst the Voltage level for the binary inputs of the CPU board (MLFB position 13 → please see also (4)) and than the ordering code 7KE6000-4* for which DAU slots the rack must be prepared, for example the assembly of the adequate terminals according to the DAU boards. With this step, following defi nitions are also required:
a) If a defi ned DAU position must also be equipped with a DAU board, then please order the according DAU board using the ordering code 7KE6000-2*
b) Or, the according slot will be equipped with a blind plate c) Or, a defi ned DAU slot will only be prepared for a DAU, without ordering the specifi c DAU.
For example, you already have a DAU or you will order the DAU some time later)
Attention: A SIMEAS R and SIMEAS R-PMU must be equipped from left to right.
Footnotes for page 5 /17
A
A
1
0
D
D
B
B
2
1
C
C
3
23
E
A
1
1
B
2
2
C
3
34
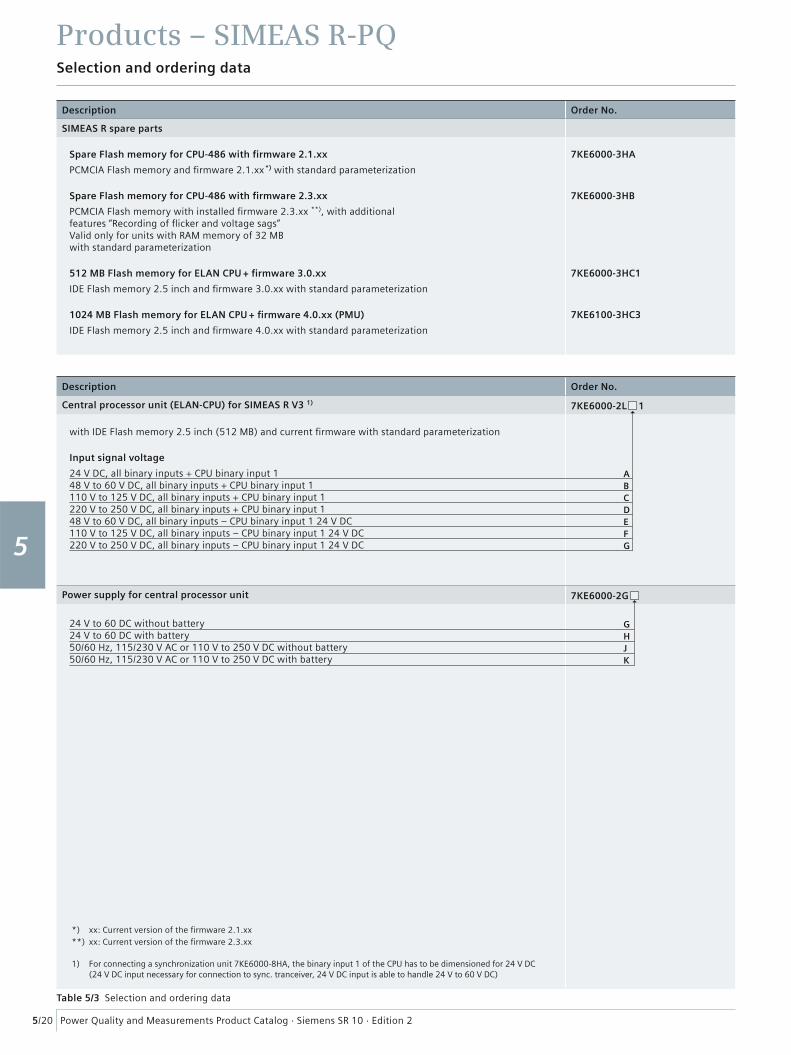
Power Quality and Measurements Product Catalog · Siemens SR 10 · Edition 2
Products – SIMEAS R-PQ
5/20
1
2
3
4
5
6
7
8
9
Selection and ordering data
Description Order No.
SIMEAS R spare parts
Spare Flash memory for CPU-486 with fi rmware 2.1.xx 7KE6000-3HA
PCMCIA Flash memory and fi rmware 2.1.xx *) with standard parameterization
Spare Flash memory for CPU-486 with fi rmware 2.3.xx 7KE6000-3HB
PCMCIA Flash memory with installed fi rmware 2.3.xx **), with additional features “Recording of fl icker and voltage sags” Valid only for units with RAM memory of 32 MBwith standard parameterization
512 MB Flash memory for ELAN CPU + fi rmware 3.0.xx 7KE6000-3HC1
IDE Flash memory 2.5 inch and fi rmware 3.0.xx with standard parameterization
1024 MB Flash memory for ELAN CPU + fi rmware 4.0.xx (PMU) 7KE6100-3HC3
IDE Flash memory 2.5 inch and fi rmware 4.0.xx with standard parameterization
Description Order No.
Central processor unit (ELAN-CPU) for SIMEAS R V3 1) 7KE6000-2L 1
with IDE Flash memory 2.5 inch (512 MB) and current fi rmware with standard parameterization
Input signal voltage
24 V DC, all binary inputs + CPU binary input 148 V to 60 V DC, all binary inputs + CPU binary input 1110 V to 125 V DC, all binary inputs + CPU binary input 1220 V to 250 V DC, all binary inputs + CPU binary input 148 V to 60 V DC, all binary inputs – CPU binary input 1 24 V DC110 V to 125 V DC, all binary inputs – CPU binary input 1 24 V DC220 V to 250 V DC, all binary inputs – CPU binary input 1 24 V DC
Power supply for central processor unit 7KE6000-2G
24 V to 60 DC without battery24 V to 60 DC with battery50/60 Hz, 115/230 V AC or 110 V to 250 V DC without battery50/60 Hz, 115/230 V AC or 110 V to 250 V DC with battery
*) xx: Current version of the fi rmware 2.1.xx**) xx: Current version of the fi rmware 2.3.xx
1) For connecting a synchronization unit 7KE6000-8HA, the binary input 1 of the CPU has to be dimensioned for 24 V DC(24 V DC input necessary for connection to sync. tranceiver, 24 V DC input is able to handle 24 V to 60 V DC)
Table 5/3 Selection and ordering data
A
G
B
H
C
J
D
K
EFG
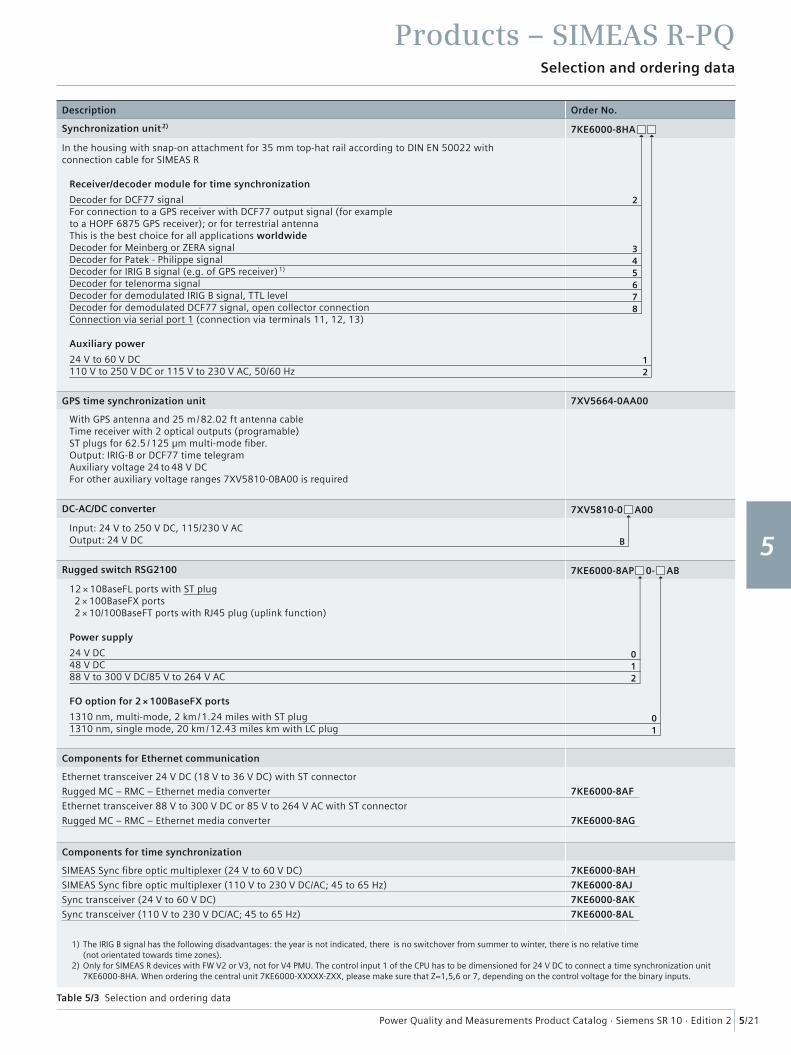
Power Quality and Measurements Product Catalog · Siemens SR 10 · Edition 2
Products – SIMEAS R-PQ
5/21
1
2
3
4
5
6
7
8
9
Selection and ordering data
Description Order No.
Synchronization unit 2) 7KE6000-8HA
In the housing with snap-on attachment for 35 mm top-hat rail according to DIN EN 50022 with connection cable for SIMEAS R
Receiver/decoder module for time synchronization
Decoder for DCF77 signal For connection to a GPS receiver with DCF77 output signal (for example to a HOPF 6875 GPS receiver); or for terrestrial antennaThis is the best choice for all applications worldwideDecoder for Meinberg or ZERA signalDecoder for Patek - Philippe signalDecoder for IRIG B signal (e.g. of GPS receiver) 1)
Decoder for telenorma signalDecoder for demodulated IRIG B signal, TTL levelDecoder for demodulated DCF77 signal, open collector connectionConnection via serial port 1 (connection via terminals 11, 12, 13)
Auxiliary power
24 V to 60 V DC110 V to 250 V DC or 115 V to 230 V AC, 50/60 Hz
GPS time synchronization unit 7XV5664-0AA00
With GPS antenna and 25 m/82.02 ft antenna cable Time receiver with 2 optical outputs (programable)ST plugs for 62.5 / 125 μm multi-mode fi ber.Output: IRIG-B or DCF77 time telegramAuxiliary voltage 24 to 48 V DCFor other auxiliary voltage ranges 7XV5810-0BA00 is required
DC-AC/DC converter 7XV5810-0 A00
Input: 24 V to 250 V DC, 115/230 V ACOutput: 24 V DC
Rugged switch RSG2100 7KE6000-8AP 0- AB
12 × 10BaseFL ports with ST plug 2 × 100BaseFX ports 2 × 10/100BaseFT ports with RJ45 plug (uplink function)
Power supply
24 V DC48 V DC88 V to 300 V DC/85 V to 264 V AC
FO option for 2 × 100BaseFX ports
1310 nm, multi-mode, 2 km/1.24 miles with ST plug1310 nm, single mode, 20 km/12.43 miles km with LC plug
Components for Ethernet communication
Ethernet transceiver 24 V DC (18 V to 36 V DC) with ST connector
Rugged MC – RMC – Ethernet media converter
Ethernet transceiver 88 V to 300 V DC or 85 V to 264 V AC with ST connector
Rugged MC – RMC – Ethernet media converter
7KE6000-8AF
7KE6000-8AG
Components for time synchronization
SIMEAS Sync fi bre optic multiplexer (24 V to 60 V DC)
SIMEAS Sync fi bre optic multiplexer (110 V to 230 V DC/AC; 45 to 65 Hz)
Sync transceiver (24 V to 60 V DC)
Sync transceiver (110 V to 230 V DC/AC; 45 to 65 Hz)
7KE6000-8AH
7KE6000-8AJ
7KE6000-8AK
7KE6000-8AL
1) The IRIG B signal has the following disadvantages: the year is not indicated, there is no switchover from summer to winter, there is no relative time (not orientated towards time zones).
2) Only for SIMEAS R devices with FW V2 or V3, not for V4 PMU. The control input 1 of the CPU has to be dimensioned for 24 V DC to connect a time synchronization unit 7KE6000-8HA. When ordering the central unit 7KE6000-XXXXX-ZXX, please make sure that Z=1,5,6 or 7, depending on the control voltage for the binary inputs.
Table 5/3 Selection and ordering data
2
1
B
012
3
2
45678
01
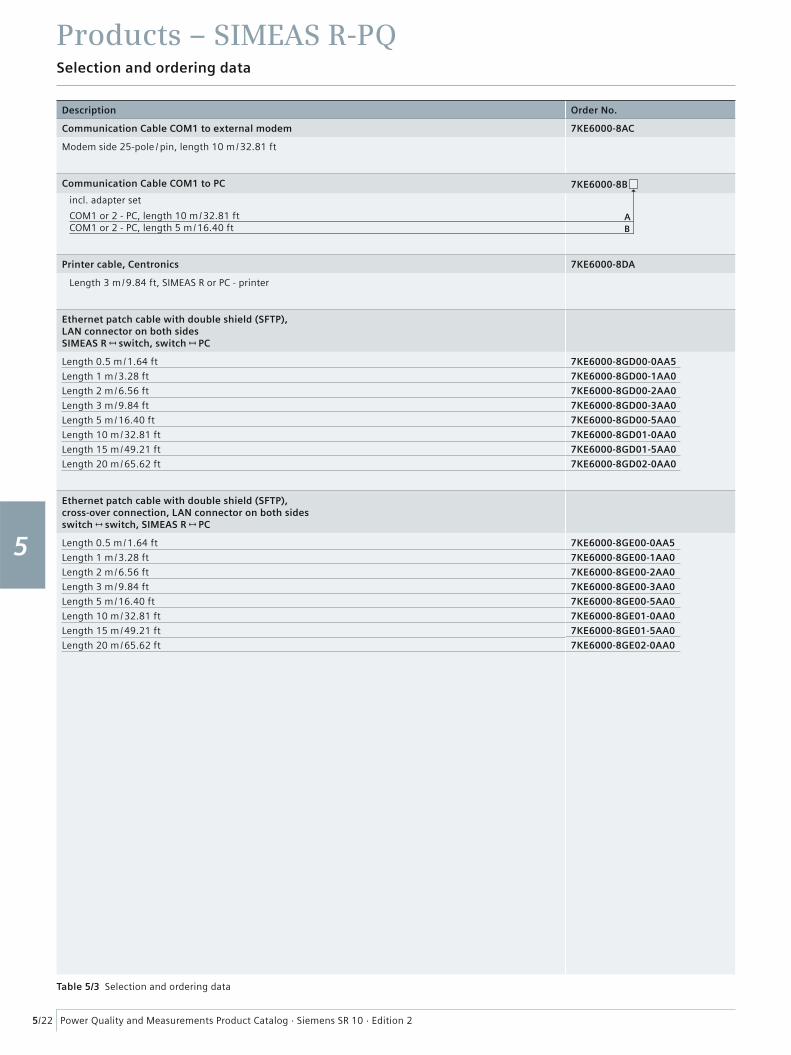
Power Quality and Measurements Product Catalog · Siemens SR 10 · Edition 2
Products – SIMEAS R-PQ
5/22
1
2
3
4
5
6
7
8
9
Selection and ordering data
Description Order No.
Communication Cable COM1 to external modem 7KE6000-8AC
Modem side 25-pole / pin, length 10 m/32.81 ft
Communication Cable COM1 to PC 7KE6000-8B
incl. adapter set
COM1 or 2 - PC, length 10 m/32.81 ftCOM1 or 2 - PC, length 5 m/16.40 ft
Printer cable, Centronics 7KE6000-8DA
Length 3 m/9.84 ft, SIMEAS R or PC - printer
Ethernet patch cable with double shield (SFTP), LAN connector on both sidesSIMEAS R switch, switch PC
Length 0.5 m/1.64 ft
Length 1 m/3.28 ft
Length 2 m/6.56 ft
Length 3 m/9.84 ft
Length 5 m/16.40 ft
Length 10 m/32.81 ft
Length 15 m/49.21 ft
Length 20 m/65.62 ft
7KE6000-8GD00-0AA5
7KE6000-8GD00-1AA0
7KE6000-8GD00-2AA0
7KE6000-8GD00-3AA0
7KE6000-8GD00-5AA0
7KE6000-8GD01-0AA0
7KE6000-8GD01-5AA0
7KE6000-8GD02-0AA0
Ethernet patch cable with double shield (SFTP),cross-over connection, LAN connector on both sidesswitch switch, SIMEAS R PC
Length 0.5 m/1.64 ft
Length 1 m/3.28 ft
Length 2 m/6.56 ft
Length 3 m/9.84 ft
Length 5 m/16.40 ft
Length 10 m/32.81 ft
Length 15 m/49.21 ft
Length 20 m/65.62 ft
7KE6000-8GE00-0AA5
7KE6000-8GE00-1AA0
7KE6000-8GE00-2AA0
7KE6000-8GE00-3AA0
7KE6000-8GE00-5AA0
7KE6000-8GE01-0AA0
7KE6000-8GE01-5AA0
7KE6000-8GE02-0AA0
Table 5/3 Selection and ordering data
AB

Power Quality and Measurements Product Catalog · Siemens SR 10 · Edition 2
Products – SIMEAS R-PQ
5/23
1
2
3
4
5
6
7
8
9
Selection and ordering data
Description Order No.
Connection cable for current inputs 8-core fl exible cable, 2.5 mm2/0.004 sq in., for 4 current channels
7KE6000-8GA00-0
Please note: Minimum length 2 m/6.56 ft
Without pre-assembled cablesWith end sleeve ferruleWith end sleeve ferrule on both sidesWithout core identifi cationWith core identifi cationCable length in m (X = 2 ... 8, 9 = special length)
Connection cable for voltage inputs 8-core fl exible cable, 0.75 mm2/0.001 sq in., for 4 voltage channels
7KE6000-8GB00-0
Please note: Minimum length 2 m/6.56 ft
Without pre-assembled cablesWith end sleeve ferrule on one sideWith end sleeve ferrule on both sidesWithout core identifi cationWith core identifi cationCable length in m (X = 2 ... 8, 9 = special length)
Connection cable for binary inputs32-core fl exible cable, 0.25 mm2/0.0004 sq in.
7KE6000-8GC00-0
Please note: Minimum length 2 m/6.56 ft
Without pre-assembled cablesWith end sleeve ferrule on one sideWith end sleeve ferrule on both sidesWithout core identifi cationWith core identifi cationCable length in m (X = 2 ... 8, 9 = special length)
Manual for fi rmware version SIMEAS R-PQ
English
German
French
Spanish
Italian
Portuguese
E50417-B1076-C209-A2
E50417-B1000-C209-A4
E50417-B1077-C209-A1
E50417-B1078-C209-A1
E50417-B1072-C209-A1
E50417-B1079-C209-A1
USB alarm box 7KE6020-1AA00
Monitoring unit for DAKON XP with USB connection, own watchdog and 7 alarm contacts
Table 5/3 Selection and ordering data
ABC
AB
X
A
A
B
B
C
C
A
A
B
B
X
X
Power Quality and Measurements Product Catalog · Siemens SR 10 · Edition 2
Products – SIMEAS R-PQ
5/24
1
2
3
4
5
6
7
8
9
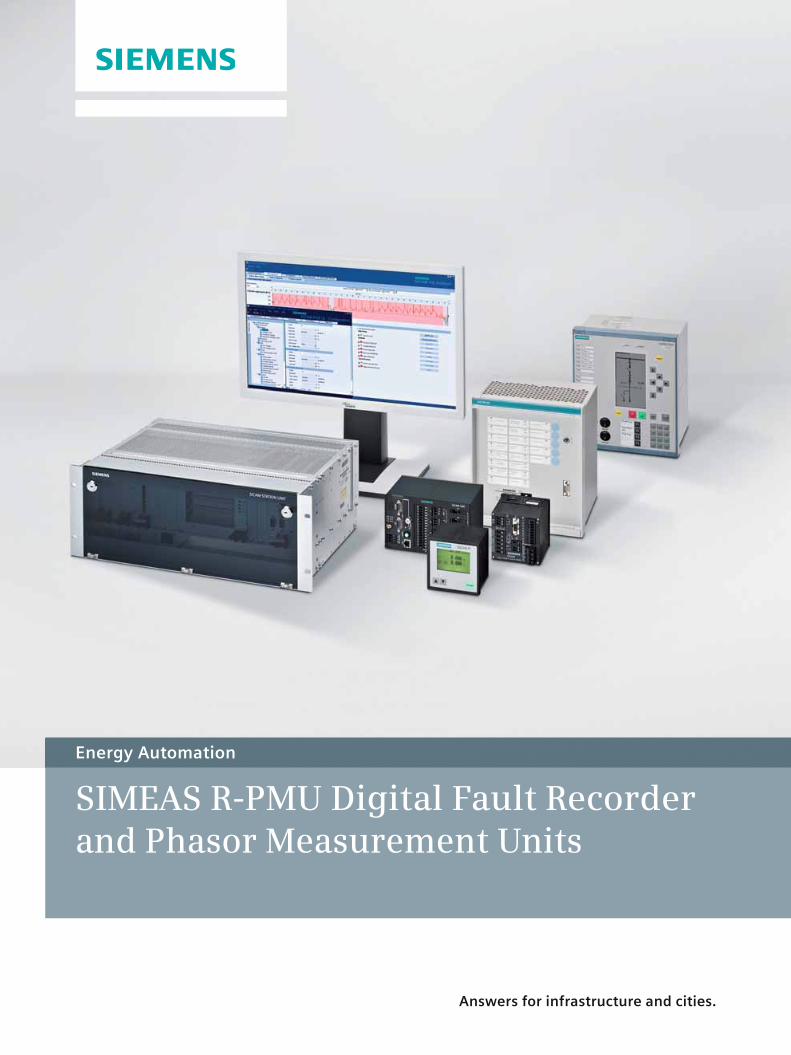
Energy Automation
Answers for infrastructure and cities.
SIMEAS R-PMU Digital Fault Recorder and Phasor Measurement Units
Power Quality and Measurements Product Catalog · Siemens SR 10 · Edition 2 6/2
Contents – SIMEAS R-PMU
1
2
3
4
5
6
7
8
9
Page
Description, function and system overview 6/3
Functions 6/4
Hardware 6/8
Technical data 6/11
Dimension drawings 6/14
Selection and ordering data 6/16
Certifi cate 6/24
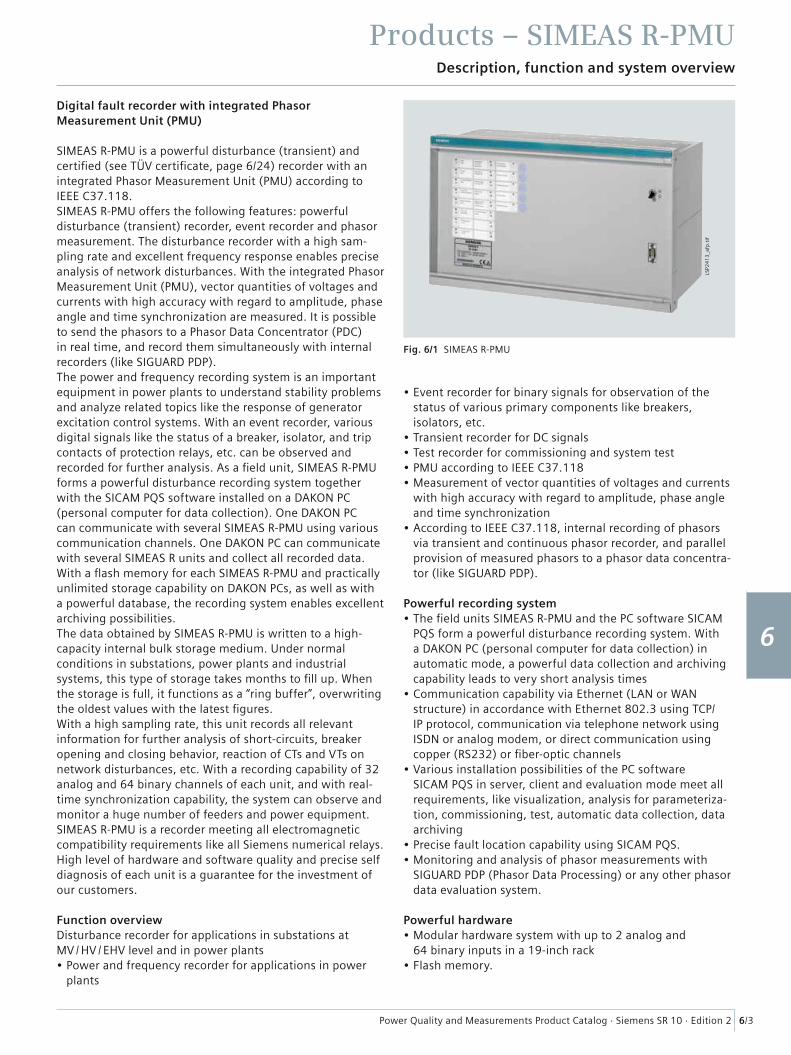
Power Quality and Measurements Product Catalog · Siemens SR 10 · Edition 2
Products – SIMEAS R-PMU
6/3
Description, function and system overview
1
2
3
4
5
6
7
8
9
Digital fault recorder with integrated Phasor Measurement Unit (PMU)
SIMEAS R-PMU is a powerful disturbance (transient) and certifi ed (see TÜV certifi cate, page 6/24) recorder with an integrated Phasor Measurement Unit (PMU) according to IEEE C37.118.SIMEAS R-PMU offers the following features: powerful disturbance (transient) recorder, event recorder and phasor measurement. The disturbance recorder with a high sam-pling rate and excellent frequency response enables precise analysis of network disturbances. With the integrated Phasor Measurement Unit (PMU), vector quantities of voltages and currents with high accuracy with regard to amplitude, phase angle and time synchronization are measured. It is possible to send the phasors to a Phasor Data Concentrator (PDC) in real time, and record them simultaneously with internal recorders (like SIGUARD PDP).The power and frequency recording system is an important equipment in power plants to understand stability problems and analyze related topics like the response of generator excitation control systems. With an event recorder, various digital signals like the status of a breaker, isolator, and trip contacts of protection relays, etc. can be observed and recorded for further analysis. As a fi eld unit, SIMEAS R-PMU forms a powerful disturbance recording system together with the SICAM PQS software installed on a DAKON PC (personal computer for data collection). One DAKON PC can communicate with several SIMEAS R-PMU using various communication channels. One DAKON PC can communicate with several SIMEAS R units and collect all recorded data.With a fl ash memory for each SIMEAS R-PMU and practically unlimited storage capability on DAKON PCs, as well as with a powerful database, the recording system enables excellent archiving possibilities. The data obtained by SIMEAS R-PMU is written to a high-capacity internal bulk storage medium. Under normal conditions in substations, power plants and industrial systems, this type of storage takes months to fi ll up. When the storage is full, it functions as a “ring buffer”, overwriting the oldest values with the latest fi gures.With a high sampling rate, this unit records all relevant information for further analysis of short-circuits, breaker opening and closing behavior, reaction of CTs and VTs on network disturbances, etc. With a recording capability of 32 analog and 64 binary channels of each unit, and with real-time synchronization capability, the system can observe and monitor a huge number of feeders and power equipment.SIMEAS R-PMU is a recorder meeting all electromagnetic compatibility requirements like all Siemens numerical relays. High level of hardware and software quality and precise self diagnosis of each unit is a guarantee for the investment of our customers.
Function overviewDisturbance recorder for applications in substations at MV / HV / EHV level and in power plants• Power and frequency recorder for applications in power
plants
• Event recorder for binary signals for observation of the status of various primary components like breakers, isolators, etc.
• Transient recorder for DC signals• Test recorder for commissioning and system test• PMU according to IEEE C37.118• Measurement of vector quantities of voltages and currents
with high accuracy with regard to amplitude, phase angle and time synchronization
• According to IEEE C37.118, internal recording of phasors via transient and continuous phasor recorder, and parallel provision of measured phasors to a phasor data concentra-tor (like SIGUARD PDP).
Powerful recording system• The fi eld units SIMEAS R-PMU and the PC software SICAM
PQS form a powerful disturbance recording system. With a DAKON PC (personal computer for data collection) in automatic mode, a powerful data collection and archiving capability leads to very short analysis times
• Communication capability via Ethernet (LAN or WAN structure) in accordance with Ethernet 802.3 using TCP/IP protocol, communication via telephone network using ISDN or analog modem, or direct communication using copper (RS232) or fi ber-optic channels
• Various installation possibilities of the PC software SICAM PQS in server, client and evaluation mode meet all requirements, like visualization, analysis for parameteriza-tion, commissioning, test, automatic data collection, data archiving
• Precise fault location capability using SICAM PQS.• Monitoring and analysis of phasor measurements with
SIGUARD PDP (Phasor Data Processing) or any other phasor data evaluation system.
Powerful hardware• Modular hardware system with up to 2 analog and
64 binary inputs in a 19-inch rack• Flash memory.
Fig. 6/1 SIMEAS R-PMU
LSP2
41
3_a
fp.t
if
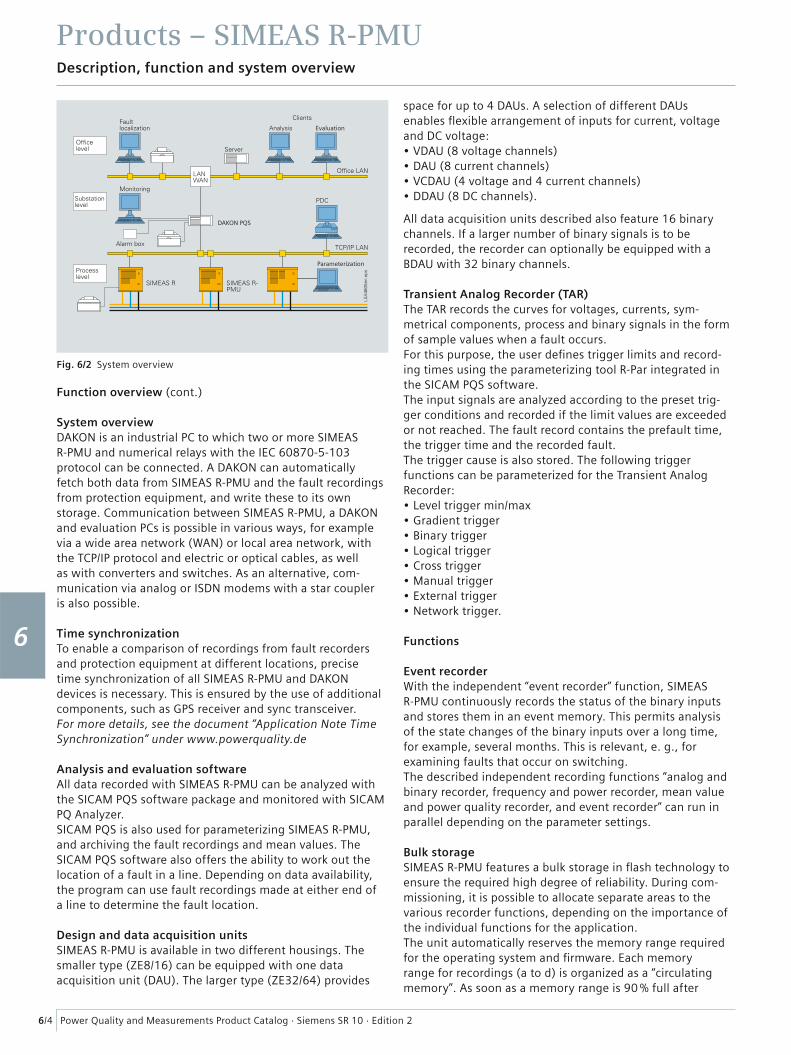
Power Quality and Measurements Product Catalog · Siemens SR 10 · Edition 2
Products – SIMEAS R-PMU
6/4
Description, function and system overview
1
2
3
4
5
6
7
8
9
Function overview (cont.)
System overviewDAKON is an industrial PC to which two or more SIMEAS R-PMU and numerical relays with the IEC 60870-5-103 protocol can be connected. A DAKON can automaticallyfetch both data from SIMEAS R-PMU and the fault recordings from protection equipment, and write these to its own storage. Communication between SIMEAS R-PMU, a DAKON and evaluation PCs is possible in various ways, for example via a wide area network (WAN) or local area network, with the TCP/IP protocol and electric or optical cables, as well as with converters and switches. As an alternative, com-munication via analog or ISDN modems with a star coupler is also possible.
Time synchronizationTo enable a comparison of recordings from fault recorders and protection equipment at different locations, precise time synchronization of all SIMEAS R-PMU and DAKON devices is necessary. This is ensured by the use of additional components, such as GPS receiver and sync transceiver.For more details, see the document “Application Note Time Synchronization” under www.powerquality.de
Analysis and evaluation softwareAll data recorded with SIMEAS R-PMU can be analyzed with the SICAM PQS software package and monitored with SICAM PQ Analyzer.SICAM PQS is also used for parameterizing SIMEAS R-PMU, and archiving the fault recordings and mean values. The SICAM PQS software also offers the ability to work out the location of a fault in a line. Depending on data availability, the program can use fault recordings made at either end of a line to determine the fault location.
Design and data acquisition unitsSIMEAS R-PMU is available in two different housings. The smaller type (ZE8/16) can be equipped with one data acquisition unit (DAU). The larger type (ZE32/64) provides
space for up to 4 DAUs. A selection of different DAUs enables fl exible arrangement of inputs for current, voltage and DC voltage:• VDAU (8 voltage channels)• DAU (8 current channels)• VCDAU (4 voltage and 4 current channels)• DDAU (8 DC channels).
All data acquisition units described also feature 16 binary channels. If a larger number of binary signals is to be recorded, the recorder can optionally be equipped with a BDAU with 32 binary channels.
Transient Analog Recorder (TAR)The TAR records the curves for voltages, currents, sym-metrical components, process and binary signals in the form of sample values when a fault occurs.For this purpose, the user defi nes trigger limits and record-ing times using the parameterizing tool R-Par integrated in the SICAM PQS software.The input signals are analyzed according to the preset trig-ger conditions and recorded if the limit values are exceeded or not reached. The fault record contains the prefault time, the trigger time and the recorded fault.The trigger cause is also stored. The following trigger functions can be parameterized for the Transient Analog Recorder:• Level trigger min/max• Gradient trigger• Binary trigger• Logical trigger• Cross trigger• Manual trigger• External trigger• Network trigger.
Functions
Event recorderWith the independent “event recorder” function, SIMEAS R-PMU continuously records the status of the binary inputs and stores them in an event memory. This permits analysis of the state changes of the binary inputs over a long time, for example, several months. This is relevant, e. g., for examining faults that occur on switching.The described independent recording functions “analog and binary recorder, frequency and power recorder, mean value and power quality recorder, and event recorder” can run in parallel depending on the parameter settings.
Bulk storageSIMEAS R-PMU features a bulk storage in fl ash technology to ensure the required high degree of reliability. During com-missioning, it is possible to allocate separate areas to the various recorder functions, depending on the importance of the individual functions for the application.The unit automatically reserves the memory range required for the operating system and fi rmware. Each memory range for recordings (a to d) is organized as a “circulating memory”. As soon as a memory range is 90 % full after
Evaluation
Parameterization
DAKON PQS
Fig. 6/2 System overview

Power Quality and Measurements Product Catalog · Siemens SR 10 · Edition 2
Products – SIMEAS R-PMU
6/5
Functions
1
2
3
4
5
6
7
8
9
Bulk storage (cont.)several recordings, the procedure is as follows: the “latest fault record” is written to memory fi rst, then the oldest recordings are deleted until the free capacity in this range reaches 80 % of the allotted memory size.
Data compressionEven if fast modem cards or a LAN/WAN connection are used, data compression is essential in a fault recorder to achieve:• Effi cient use of the device’s internal bulk storage as a
distributed data archive• Fast transmission of the fault recordings to a DAKON or an
evaluation PC to enable a fault analysis to be performed immediately after the fault
• Acceptable transmission times when using slow transmis-sion media, e.g. an analog modem
• Coping with LAN/WAN “bottlenecks”, which are particularly frequent in large-scale networks.
Time synchronization (Fig. 6/3)The SIMEAS R-PMU Phasor Measurement Unit (PMU) requires a standard-compliant precise time signal for phasor measurement. A GPS receiver provides the required preci-sion. As an alternative, SIMEAS R-PMU can be synchronized via minute impulse. This mode does not provide the accuracy of the GPS synchronization. Particularly the PMU cannot be used in this mode. For very complex networks, a passive star coupler has to be used. This device allows to use 5 fi bre-optic cables instead of 1.Note: SIMEAS R-PMU uses the original DCF77 protocol for synchronization. A synchronization box 7KE6000-8HAxx is not required, and cannot be used for SIMEAS R-PMU. If GPS time synchronisation via DCF77 protocol is used, the synchronization input (binary input 1) of the SIMEAS R-PMU CPU board has to be designed for 24 V DC (7KE6100-xx xxx 1xxx, 7KE6100-xx xxx 5xxx, 7KE6100-xx xxx 6xxx, or 7KE6100-xx xxx 7xxx).Note: If the PMU functionality is not used, SIMEAS R-PMU can be also synchronized like SIMEAS R-PQ, see page 6/4.
Communication interfaces and componentsSIMEAS R-PMU features the following communication interfaces:• COMS interface
This RS232 interface on the front panel is for direct communication with an evaluation PC. This interface can be used to parameterize and test the recorder during commissioning. It has fi xed communication parameters.
• COM1 interfaceThis serial interface (RS232) is located on the rear of the recorder. This interface enables the recorder to communi-cate via an external analog or ISDN modem. The recorder can then be connected to a telephone network, but a direct modem-to-modem connection is also possible. The communication parameters of this interface can be set.
• Ethernet interfaceThis integrated interface is used to connect the recorder to a LAN (local area network) IEEE 802.3 (10 Mbps Ethernet)
with the TCP/IP protocol. (Please note that recorders delivered up to about February 2003 have a PCMCIA slot for an Ethernet card at the rear).
• Ethernet structureThe network used to connect to an evaluation PC or a DAKON has star topology.One or more connection nodes (switches) can be used. To improve the reliability of communication channels, optical cables can be used for the network.The following components can be used to set up an optical network:
– Transceiver (7KE6000-8AF/8AG)Converter from 10BASE-T ports with copper cable to 10BASE-FL with optical cable. The unit has an FO and a 10BASE-T network port. Housing: DIN rail mounting.
– Multiport repeater, or switchThis switch enables connection to two or more Ethernet cable segments. The unit has one FO and six 10BASE-T network ports. Housing: DIN rail mounting.
Dynamic fault recorder for analog and binary channelsThe “fault recorder” function includes recording of analog and digital signals. These signals are continuously recorded and simultaneously compared with the parameterized trigger criteria. On triggering, all channels are recorded concurrently as well as with a pre-fault, variable fault progression, and post-fault, depending on the parameter settings for recording.
Sync box
PQ1
1-0
09
9.E
N.a
i
SIMEAS R-PMUonly fault recorder
SIMEAS R-PMUPMU & fault recorder
GPS receiverHopf 6875
FO at the output FL2max. 1.5 km/0.932 miles
FurtherSIMEAS R-PMU orprotection devices
FO at the outputFL2 max. 1.5 km/0.932 miles
Star coupler
Sync transceiver
Copper linemax. 10 m/3.61 ft
Copper line max. 10 m/3.61 ft
Sync transceiver
GPS receiverHopf 6875
GPS
GPS
Fig. 6/3 Time synchronization SIMEAS R-PMU

Power Quality and Measurements Product Catalog · Siemens SR 10 · Edition 2
Products – SIMEAS R-PMU
6/6
Functions
1
2
3
4
5
6
7
8
9
Recording alternating current and voltageThree different data acquisition units are available for recording currents and voltages:• VCDAU with 4 voltage and 4 current inputs• CDAU with 8 current inputs• VDAU with 8 voltage inputs.The sampling rate of SIMEAS R-PMU is constant at 192 samples. For a system frequency of 50 Hz (frequency range 25 to 60 Hz), the sampling rate is constant at 9,600 Hz, and for 60 Hz (frequency range 30 to 70 Hz), the sampling rate is constant at 11,520 Hz (see table 6/1, page 6/11).
Recording of the process variablesDC signals are measured via the DDAU data acquisition unit, which has 8 signal inputs. The DDAU can be ordered for an input range of -1 V to +1V, -10 V to +10 V, or -20 mA to +20 mA. These inputs can be assigned to one process signal each, e.g. display of temperature in K, speed of rotation in rpm, voltage in kV, current in kA.
Recording of binary signalsThe recording of binary channels is fully synchronized with recording of analog channels. The sampling rate is 2 kHz.A group of 16 binary inputs can record up to 250 state changes per second.
Flexible triggeringWith its numerous settable trigger conditions, SIMEAS R-PMU can be precisely adapted to the specifi c requirements of an application:
– Triggering on the r.m.s. value of an analog channel(min. / max. triggering)
For triggering, the recorder calculates a measured value corresponding to the r.m.s. value of a current or voltage (I, V ) continuously at intervals of half a system cycle. The values sampled over half a system cycle are used to calculate this measured value.Triggering occurs (i.e. recording is started) when the measured value either exceeds a positive maximum limit or falls below a positive minimum limit.One practical example of this is triggering on a maximum value of the r.m.s. current and on a minimum value of an r.m.s. voltage.
– Triggering on a change in the r.m.s. value of an analogchannel (dM/dt triggering)
Each time the measured value described above (V, I ) is calculated, the difference is formed between two measured values one system cycle apart. This difference is compared with the set rate-of-change (dM / dt) limit, e.g. 10 kV / 20 ms. This permits triggering on a positive or negative change to the r.m.s. value of a voltage or current input.
– Triggering on the r.m.s. value of the positive or negative sequence system (min. / max. triggering)
The recorder can be parameterized to treat the analog inputs of a data acquisition unit as single, independent channels, or assign them to a three-phase system. In the latter case, positive and negative sequence components can be calculated both for current and voltage channels, and used for triggering. Calculation of the measured
Fig. 6/4 SIMEAS R-PMU, compact housing
SR2
00
0a-
afp
.tif
Fig. 6/5 SIMEAS R-PMU, front view. A DAU can be seen in the middle slot
SR2
00
5a-
afp
.tif
Fig. 6/6 DAUs
SR2
00
6a-
afp
.tif

Power Quality and Measurements Product Catalog · Siemens SR 10 · Edition 2
Products – SIMEAS R-PMU
6/7
Functions
1
2
3
4
5
6
7
8
9
quantities and of the triggering is performed as described under “Triggering on the r.m.s. value of an analog chan-nel, min. / max. triggering”.
Examples of logic gating: – Voltage min. trigger threshold, recording reached, and current max. – Binary contact channel 1 high recording and current max. trigger reached – Binary contact 1, – Triggering on the limit of a DC channel (min. / max. triggering)
Triggering is performed when the sampled value of the DC signal exceeds the max. limit or falls below the min. limit.
– Triggering on the gradient of a DC channel(gradient triggering)
For the gradient trigger, the difference is calculated between two sampled values of a DC signal in a settable time interval. Triggering can be performed on a positive or negative gradient.
– Triggering on binary channelsTriggering to state (high or low), or on the positive or negative signal edge, or on a binary input change is possible.
– Logic gating of trigger conditionsAnalog and binary trigger conditions can be ANDed. The logic gating of triggers serves, for example, to distinguish a fault from an intentional line disconnection. The logic operation is applied to a settable time window from 0 to 1 s. If the triggering conditions are detected as “true” during this time window, recording starts. A total of 8 patterns with 8 start selectors each can be parameterized as trigger criteria.
– Triggering via the front panel (manual trigger)This function is especially useful for commissioning work. It permits testing the polarity of current and voltage channels, and testing phase angle offsets.
– Triggering via PCThis triggering is identical with the manual triggering, but activated from the PC via the SICAM PQS software.
– Network triggerThis triggering applies to devices communicating via an Ethernet network.Triggering is performed either from the PC for all con-nected SIMEAS R-PMU recorders, or sent from a SIMEAS R-PMU to further devices.
– External triggerA recording start can be triggered externally via a separate binary input. Recording is limited to 10 s and is performed for as long as a voltage is applied to this input.The duration of the recording and the pre- and post-faults can be parameterized.Smart sequence control monitors the trigger conditions during recording.If retriggering is permitted and the maximum fault record-ing length is reached, a dynamic fault recording length is reached. For external triggering, time synchronization of all SIMEAS R-PMU devices in the system is required to ensure the fault records have the same time reference.
– Cross triggerFor SIMEAS R-PMU, the cross trigger has been activated for the Transient Analog Recorder (TAR). Recording by the Transient Analog Recorder will be started as soon as the Transient Phasor Recorder (TPR) has been triggered. In this case, the pre-fault time corresponds to the recording time that has been parameterized for the TAR. An extension (retriggering) of the TAR fault record can only be initiated by the TAR, and not by another cross trigger of the TPR.
Fig. 6/7 Phasor measurement application
Measuringquantities
IEEEC37.118
Inter Comor
IEEE C37.118
TPR/CPR
Online Evaluation
Control Center
SIGUARD
PDC
Real-time respond Offline Evaluation
Special ProtectionSchemes (SPS)
SICAM PQS
PQ11-0098.EN.ai
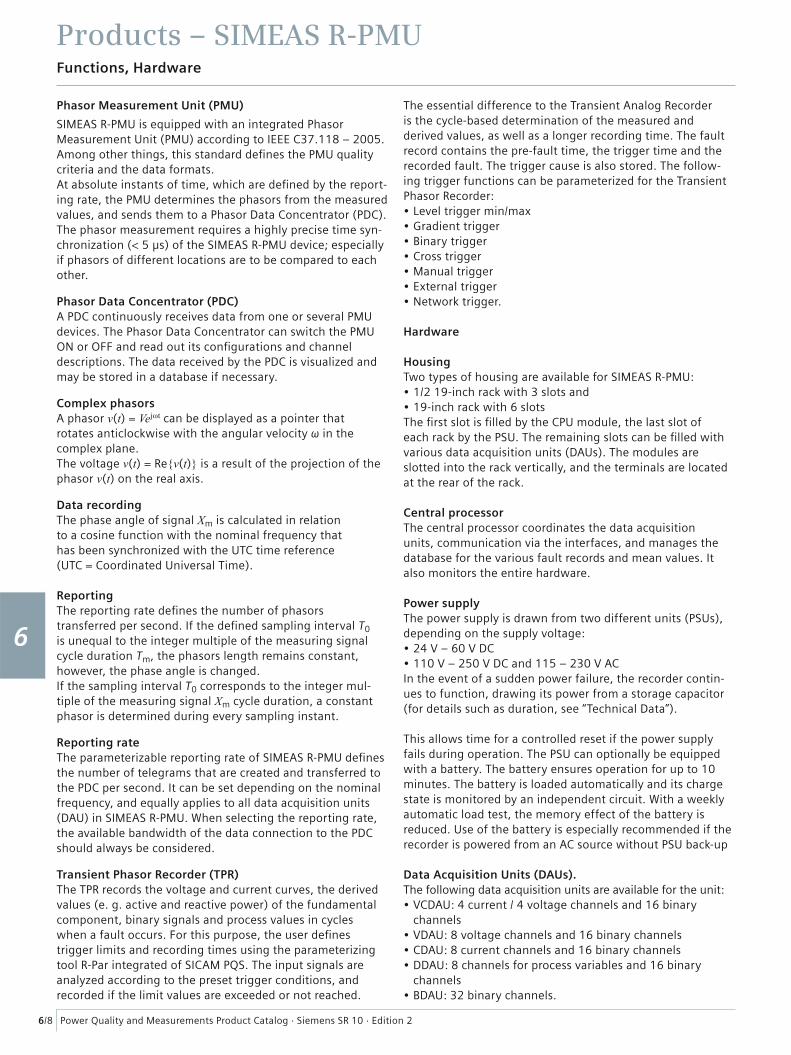
Power Quality and Measurements Product Catalog · Siemens SR 10 · Edition 2
Products – SIMEAS R-PMU
6/8
Functions, Hardware
1
2
3
4
5
6
7
8
9
Phasor Measurement Unit (PMU)
SIMEAS R-PMU is equipped with an integrated Phasor Measurement Unit (PMU) according to IEEE C37.118 – 2005.Among other things, this standard defi nes the PMU quality criteria and the data formats.At absolute instants of time, which are defi ned by the report-ing rate, the PMU determines the phasors from the measured values, and sends them to a Phasor Data Concentrator (PDC).The phasor measurement requires a highly precise time syn-chronization (< 5 μs) of the SIMEAS R-PMU device; especially if phasors of different locations are to be compared to each other.
Phasor Data Concentrator (PDC)A PDC continuously receives data from one or several PMU devices. The Phasor Data Concentrator can switch the PMU ON or OFF and read out its confi gurations and channel descriptions. The data received by the PDC is visualized and may be stored in a database if necessary.
Complex phasorsA phasor v(t) = Vejωt can be displayed as a pointer that rotates anticlockwise with the angular velocity ω in the complex plane.The voltage v(t) = Re{v(t)} is a result of the projection of the phasor v(t) on the real axis.
Data recordingThe phase angle of signal Xm is calculated in relation to a cosine function with the nominal frequency that has been synchronized with the UTC time reference (UTC = Coordinated Universal Time).
ReportingThe reporting rate defi nes the number of phasors transferred per second. If the defi ned sampling interval T0 is unequal to the integer multiple of the measuring signal cycle duration Tm, the phasors length remains constant, however, the phase angle is changed.If the sampling interval T0 corresponds to the integer mul-tiple of the measuring signal Xm cycle duration, a constant phasor is determined during every sampling instant.
Reporting rateThe parameterizable reporting rate of SIMEAS R-PMU defi nes the number of telegrams that are created and transferred to the PDC per second. It can be set depending on the nominal frequency, and equally applies to all data acquisition units (DAU) in SIMEAS R-PMU. When selecting the reporting rate, the available bandwidth of the data connection to the PDC should always be considered.
Transient Phasor Recorder (TPR)The TPR records the voltage and current curves, the derived values (e. g. active and reactive power) of the fundamental component, binary signals and process values in cycles when a fault occurs. For this purpose, the user defi nes trigger limits and recording times using the parameterizing tool R-Par integrated of SICAM PQS. The input signals are analyzed according to the preset trigger conditions, and recorded if the limit values are exceeded or not reached.
The essential difference to the Transient Analog Recorder is the cycle-based determination of the measured and derived values, as well as a longer recording time. The fault record contains the pre-fault time, the trigger time and the recorded fault. The trigger cause is also stored. The follow-ing trigger functions can be parameterized for the Transient Phasor Recorder:• Level trigger min/max• Gradient trigger• Binary trigger• Cross trigger• Manual trigger• External trigger• Network trigger.
Hardware
HousingTwo types of housing are available for SIMEAS R-PMU:• 1/2 19-inch rack with 3 slots and• 19-inch rack with 6 slotsThe fi rst slot is fi lled by the CPU module, the last slot of each rack by the PSU. The remaining slots can be fi lled with various data acquisition units (DAUs). The modules are slotted into the rack vertically, and the terminals are located at the rear of the rack.
Central processorThe central processor coordinates the data acquisition units, communication via the interfaces, and manages the database for the various fault records and mean values. It also monitors the entire hardware.
Power supplyThe power supply is drawn from two different units (PSUs), depending on the supply voltage:• 24 V – 60 V DC• 110 V – 250 V DC and 115 – 230 V ACIn the event of a sudden power failure, the recorder contin-ues to function, drawing its power from a storage capacitor (for details such as duration, see “Technical Data”).
This allows time for a controlled reset if the power supply fails during operation. The PSU can optionally be equipped with a battery. The battery ensures operation for up to 10 minutes. The battery is loaded automatically and its charge state is monitored by an independent circuit. With a weekly automatic load test, the memory effect of the battery is reduced. Use of the battery is especially recommended if the recorder is powered from an AC source without PSU back-up
Data Acquisition Units (DAUs).The following data acquisition units are available for the unit:• VCDAU: 4 current / 4 voltage channels and 16 binary
channels• VDAU: 8 voltage channels and 16 binary channels• CDAU: 8 current channels and 16 binary channels• DDAU: 8 channels for process variables and 16 binary
channels• BDAU: 32 binary channels.
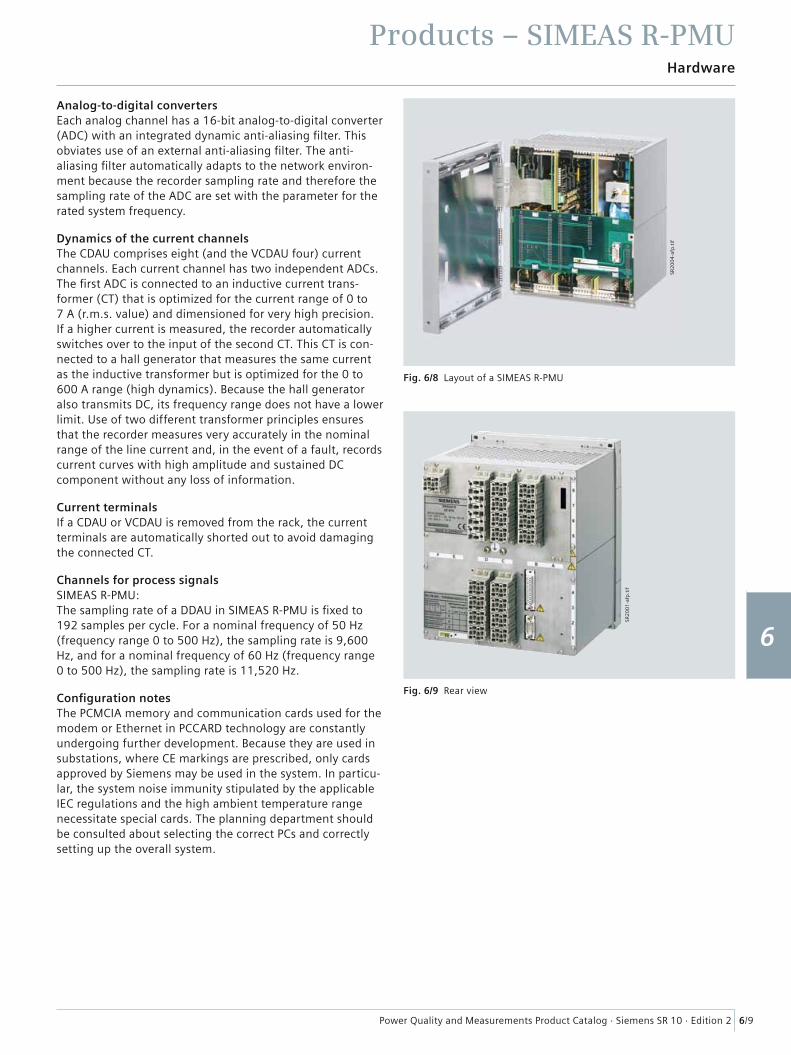
Power Quality and Measurements Product Catalog · Siemens SR 10 · Edition 2
Products – SIMEAS R-PMU
6/9
Hardware
1
2
3
4
5
6
7
8
9
Analog-to-digital convertersEach analog channel has a 16-bit analog-to-digital converter (ADC) with an integrated dynamic anti-aliasing fi lter. This obviates use of an external anti-aliasing fi lter. The anti-aliasing fi lter automatically adapts to the network environ-ment because the recorder sampling rate and therefore the sampling rate of the ADC are set with the parameter for the rated system frequency.
Dynamics of the current channelsThe CDAU comprises eight (and the VCDAU four) current channels. Each current channel has two independent ADCs. The fi rst ADC is connected to an inductive current trans-former (CT) that is optimized for the current range of 0 to 7 A (r.m.s. value) and dimensioned for very high precision. If a higher current is measured, the recorder automatically switches over to the input of the second CT. This CT is con-nected to a hall generator that measures the same current as the inductive transformer but is optimized for the 0 to 600 A range (high dynamics). Because the hall generator also transmits DC, its frequency range does not have a lower limit. Use of two different transformer principles ensures that the recorder measures very accurately in the nominal range of the line current and, in the event of a fault, records current curves with high amplitude and sustained DC component without any loss of information.
Current terminalsIf a CDAU or VCDAU is removed from the rack, the current terminals are automatically shorted out to avoid damaging the connected CT.
Channels for process signalsSIMEAS R-PMU:The sampling rate of a DDAU in SIMEAS R-PMU is fi xed to 192 samples per cycle. For a nominal frequency of 50 Hz (frequency range 0 to 500 Hz), the sampling rate is 9,600 Hz, and for a nominal frequency of 60 Hz (frequency range 0 to 500 Hz), the sampling rate is 11,520 Hz.
Confi guration notesThe PCMCIA memory and communication cards used for the modem or Ethernet in PCCARD technology are constantly undergoing further development. Because they are used in substations, where CE markings are prescribed, only cards approved by Siemens may be used in the system. In particu-lar, the system noise immunity stipulated by the applicable IEC regulations and the high ambient temperature range necessitate special cards. The planning department should be consulted about selecting the correct PCs and correctly setting up the overall system.
Fig. 6/8 Layout of a SIMEAS R-PMU
Fig. 6/9 Rear view
SR2
00
4-a
fp.t
if
SR2
00
1-a
fp.t
if

Power Quality and Measurements Product Catalog · Siemens SR 10 · Edition 2
Products – SIMEAS R-PMU
6/10
Hardware
1
2
3
4
5
6
7
8
9
ModesSIMEAS R-PMU has three operating modes:• Normal mode
In normal mode all functions are active.• Blocked mode
In blocked mode, the recording functions “dynamic recorder for analog and binary channels” and “power and frequency recorder” are inactive, i.e. no fault records are recorded. If this mode is selected, only the functions “mean value and power quality recorder” and “event recorder” are active. The mode is used, for example, to test equipment connection during commissioning.
• Test modeIn test mode, all functions are active, but recorded events are entered with “test” as their cause. The “event recorded” alarm relay does not pick up. “Test mode” is used to check the functionality of SIMEAS R-PMU. The different modes can be selected on the keyboard. Remote control via SICAM PQS is possible at any time.
LEDs on the front panel of the recorder The front panel of the recorder contains 8 red and 8 green parameterizable LEDs assigned as follows:• Recorder in operation• Operating voltage OK• Battery capacity OK• Event being recorded• Recorder synchronized• Circulating memory active• PMU active• DAU error• Printer fault• Data memory fault• Synchronization fault• PC not accessible• Temperature fault• Spare (freely parameterizable),and 5 LEDs permanently assigned to the control buttons listed below.
Control buttonsThe recorder has the following control buttons that are located on the front panel:• Acknowledge group alarm• Normal mode• Blocked mode• Test mode• Manual trigger.
Control inputsThere are four contact inputs at the rear of the recorder:• Acknowledge group alarm• System reset• External start• Time synchronization.
Alarm outputsThe recorder has four alarm outputs. The fi rst is perma-nently connected to the processor watchdog. The other three can be freely parameterized and are pre-assignedas follows:• Watchdog (permanent, not parameterizable)• E.g. ready to run (parameterizable)• E.g. event being recorded (parameterizable)• E.g. group alarm (parameterizable).
Group alarmHere is an example of how the group alarm can be param-eterized. Up to 5 signals can be parameterized for the group alarm:• DAU fault• Printer fault• Synchronization fault• CPU fault• Data fault.
Fig. 6/10 LEDs and control buttons
LSP2
82
4.t
if
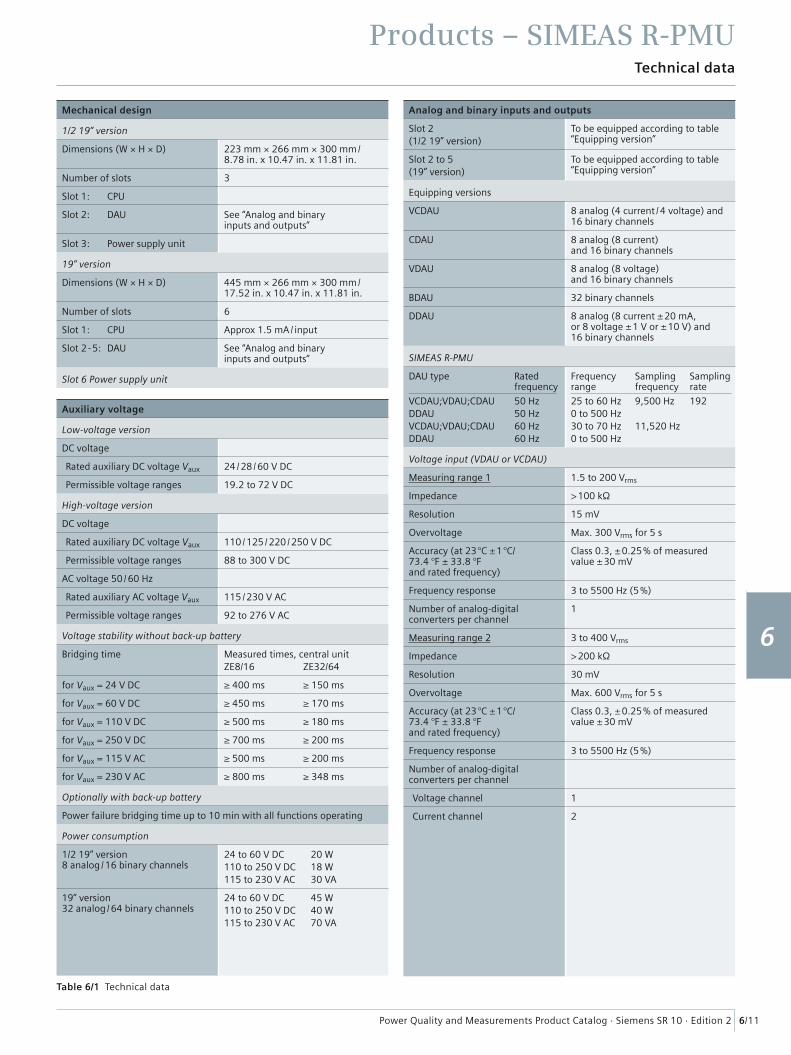
Power Quality and Measurements Product Catalog · Siemens SR 10 · Edition 2
Products – SIMEAS R-PMU
6/11
Technical data
1
2
3
4
5
6
7
8
9
Mechanical design
1/2 19” version
Dimensions (W × H × D) 223 mm × 266 mm × 300 mm/8.78 in. x 10.47 in. x 11.81 in.
Number of slots 3
Slot 1: CPU
Slot 2: DAU See “Analog and binary inputs and outputs”
Slot 3: Power supply unit
19” version
Dimensions (W × H × D) 445 mm × 266 mm × 300 mm/17.52 in. x 10.47 in. x 11.81 in.
Number of slots 6
Slot 1: CPU Approx 1.5 mA / input
Slot 2 - 5: DAU See “Analog and binary inputs and outputs”
Slot 6 Power supply unit
Auxiliary voltage
Low-voltage version
DC voltage
Rated auxiliary DC voltage Vaux 24 / 28 / 60 V DC
Permissible voltage ranges 19.2 to 72 V DC
High-voltage version
DC voltage
Rated auxiliary DC voltage Vaux 110 / 125 / 220 / 250 V DC
Permissible voltage ranges 88 to 300 V DC
AC voltage 50 / 60 Hz
Rated auxiliary AC voltage Vaux 115 / 230 V AC
Permissible voltage ranges 92 to 276 V AC
Voltage stability without back-up battery
Bridging time Measured times, central unitZE8/16 ZE32/64
for Vaux = 24 V DC ≥ 400 ms ≥ 150 ms
for Vaux = 60 V DC ≥ 450 ms ≥ 170 ms
for Vaux = 110 V DC ≥ 500 ms ≥ 180 ms
for Vaux = 250 V DC ≥ 700 ms ≥ 200 ms
for Vaux = 115 V AC ≥ 500 ms ≥ 200 ms
for Vaux = 230 V AC ≥ 800 ms ≥ 348 ms
Optionally with back-up battery
Power failure bridging time up to 10 min with all functions operating
Power consumption
1/2 19” version 8 analog / 16 binary channels
24 to 60 V DC 20 W110 to 250 V DC 18 W115 to 230 V AC 30 VA
19” version 32 analog / 64 binary channels
24 to 60 V DC 45 W110 to 250 V DC 40 W115 to 230 V AC 70 VA
Analog and binary inputs and outputs
Slot 2(1/2 19” version)
To be equipped according to table “Equipping version”
Slot 2 to 5(19” version)
To be equipped according to table “Equipping version”
Equipping versions
VCDAU 8 analog (4 current / 4 voltage) and 16 binary channels
CDAU 8 analog (8 current) and 16 binary channels
VDAU 8 analog (8 voltage) and 16 binary channels
BDAU 32 binary channels
DDAU 8 analog (8 current ± 20 mA, or 8 voltage ± 1 V or ± 10 V) and 16 binary channels
SIMEAS R-PMU
DAU type Rated frequency
VCDAU;VDAU;CDAU 50 HzDDAU 50 HzVCDAU;VDAU;CDAU 60 HzDDAU 60 Hz
Frequency Sampling Samplingrange frequency rate
25 to 60 Hz 9,500 Hz 1920 to 500 Hz30 to 70 Hz 11,520 Hz0 to 500 Hz
Voltage input (VDAU or VCDAU)
Measuring range 1 1.5 to 200 Vrms
Impedance > 100 kΩ
Resolution 15 mV
Overvoltage Max. 300 Vrms for 5 s
Accuracy (at 23 °C ± 1 °C/73.4 °F ± 33.8 °Fand rated frequency)
Class 0.3, ± 0.25 % of measured value ± 30 mV
Frequency response 3 to 5500 Hz (5 %)
Number of analog-digital converters per channel
1
Measuring range 2 3 to 400 Vrms
Impedance > 200 kΩ
Resolution 30 mV
Overvoltage Max. 600 Vrms for 5 s
Accuracy (at 23 °C ± 1 °C/73.4 °F ± 33.8 °F and rated frequency)
Class 0.3, ± 0.25 % of measured value ± 30 mV
Frequency response 3 to 5500 Hz (5 %)
Number of analog-digital converters per channel
Voltage channel 1
Current channel 2
Table 6/1 Technical data
Power Quality and Measurements Product Catalog · Siemens SR 10 · Edition 2
Products – SIMEAS R-PMU
6/12
Technical data
1
2
3
4
5
6
7
8
9
Analog and binary inputs and outputs (cont.)
Current input (CDAU or VCDAU)
Dynamic AD and converter switching
Measuring range 5 mA to 400 Arms
Accuracy range 5 mA to 7 Arms
Resolution (at 23 °C ± 1 °C/73.4 °F ± 33.8 °F and rated frequency)
0.5 mA, Class 0.5, ± 0.5 % of measured ± 0.5 mA
Frequency response 3 to 5500 Hz (5 %)
Range > 7 Arms to 200 Arms
Resolution (at 23 °C ± 1 °C/73.4 °F ± 33.8 °F and rated frequency)
30 mA, Class 1.5, ± 1.5 % of measured value ± 30 mA
Frequency response 0 to 5500 Hz (5 %)
Range > 200 Arms to 400 Arms
Resolution (at 23 °C ± 1 °C/73.4 °F ± 33.8 °F and rated frequency)
30 mA, Class 3.5, ± 3.5 % of measured value
Frequency response 0 to 5500 Hz (5 %)
Continuous 20 A
Overload 100 A, 30 s500 A, 1 s1200 A, half-wave
Recording 200 A, plus 100 % displacement
Burden < 0.1 VA
DC inputs (DDAU)
Input range (depending on the order no.)
± 20 mA (50 Ω)± 1 V / ± 10 V (> 40 kΩ / > 400 kΩ)
Accuracy (at 23 °C ± 1 °C/ 73.4 °F ± 33.8 °F)
Class 0.5
Range 1 V ± 0.5 % measured value ± 1 mV
Range 10 V ± 0.5 % measured value ± 10 mV
Range 20 mA ± 0.5 % measured value ± 20 µA
Sampling frequency 10 Hz, 100 Hz, 1 kHz, 10 kHz per module (parameterizable) (if used together with a VCDAU, CDAU, or VDAU, the DC channels are recorded in parallel.Only a sampling rate of 10 kHz per channel is permitted.)Processing of higher DC voltages via isolation amplifi er (e.g. SICAM T)
Analog and binary inputs and outputs (cont.)
Binary inputs (BDAU, VCDAU, DDAU, CDAU und VDAU)
Sampling frequency 2 kHz
Principle of storage Only status changes are stored with real time and a resolution of 1 ms
Storage capacity 250 status changes per 16 inputs,within 1 s, total storage capacitydepends on the parameter setting(typically approx. 100,000 statuschanges)
Voltage ranges of control inputs according to components installed
Input L level H levelvoltage(V) (V) (V)24 ≤ 7 ≥ 1848 to 60 ≤ 14 ≥ 36110 to 125 ≤ 28 ≥ 75220 to 250 ≤ 56 ≥ 165
Input current 1 mA
Input Overloadvoltage(V) (V)24 28.848 to 60 72110 to 125 150220 to 250 300
Analog and binary inputs and outputs
Control inputs
Input 1 Input for time synchronization for connection to the synchro box or a station clock with minute pulse 24 to 60 V, fi lter time > 2 μs > 110 V, fi lter time < 5 μs
Input 2 External start fi lter time 50 ms
Input 3 External resetfi lter time 50 ms
Input 4 External group alarmfi lter time 50 ms
Voltage ranges of control inputs according to components installed
Input L level H levelvoltage(V) (V) (V)24 ≤ 7 ≥ 1848 to 60 ≤ 14 ≥ 36110 to 125 ≤ 28 ≥ 75220 to 250 ≤ 56 ≥ 165
Input current 1 mA
Input Input 1 Input 2 to 4voltage Overload Overload(V) (V) (V)24 28.8 28.848 to 60 72 72110 to 125 150 150220 to 250 300 300
Table 6/1 Technical data

Power Quality and Measurements Product Catalog · Siemens SR 10 · Edition 2
Products – SIMEAS R-PMU
6/13
Technical data
1
2
3
4
5
6
7
8
9
Analog and binary inputs and outputs (cont.)
Signal outputs
4 signal outputs with isolated maincontact,signal output 1 hard-wired to watchdog,3 signals outputs freely allocatable.
Switching capacity MAKE 30 W/VABREAK 20 VA30 W resistive25 W for L / R ≤ 50 ms
Switching voltage 250 V
Permissible current 1 A continuous
Allocation of the signal outputs and status of LEDs
SIMEAS R ready for operationOperating voltage OKNormal modeTest modeLocked modeTransmission SIMEAS R – PC activeRecording eventDAU faultPrinter faultTime synchronization errorComputer not availableData memory faultData memory fullCyclic storage activeBattery capacity OKTemperature monitoring < - 5 °C / -13 °FTemperature monitoring > + 55 °C /+131 °FFine synchronization errorGroup alarmRelay 1 – not allocatable; watchdogRelay 2 – not allocatableRelay 3 – not allocatableRelay 4 – not allocatable
Communication interfaces
Slot 1 – CPU
LPT 1 Printer interface, Centronics, for connection of a laser printer (Emulation Postscript level 2)
COM 2 / COM S RS232 serial interface, on front side for connection of a PC, 19.2 kBd
COM 1 RS232 serial interface, on rear for connection of e.g. an additional modem, 300 Bd to 57.6 Bd or an external ISDN terminal adapter
Ethernet Compatible acc. to IEEE 802.3Software TCP/IPTwisted pair (10BaseT), RJ45 connector
Slot 0 data transmission
Modem Transmission rate up to 56 kBpsDialing method audio and pulse CCIT V.21, V.22, V.22 to V.23, V.32, V.32 to V.34, V.90Certifi ed in all European countries
Climatic stress
Temperatures
Transport and storage - 25 °C to + 70 °C / -13 °F to +158 °F
Operation
for cubicle/panel fl ush mounting - 5 °C to + 55 °C /+23 °F to +131 °F(condensation not permissible)
for panel surface mounting 0 °C to + 40 °C /+32 °F to +104 °F
Humidity
95 % without condensation
SIMEAS R-PMU
Mass storage: 1 GB Flash Card
Available recorder
PMU according to IEEE C37.118 and parallel
Triggered recorder Transient Analog Rec (TAR): VL,N; IL,N; V1,2,0; I1,2,0; B; D
Transient Phasor Rec.(TPR): VL,N; IL,N; V1,2,0; I1,2,0; B; D; f; P; Q
Continuous recorder Cont. RMS Rec (CRR): VL,N
1); IL,N 1); V1,2,0
1); I1,2,0 1)
Cont. Q (Power) Rec. (CQR): Q 1), P 1)
Cont. Frequency Rec. (CFR): f 1)
Cont. DC Rec. (CDR): D 1) (± 20 mA; ± 1 V; ± 10 V)
Event Rec. (ER): B
Cont. Phasor Rec. (CPR): VL,N; IL,N; f
1) Root mean square values
Table 6/1 Technical data
Further technical information on www.siemens.com/powerquality
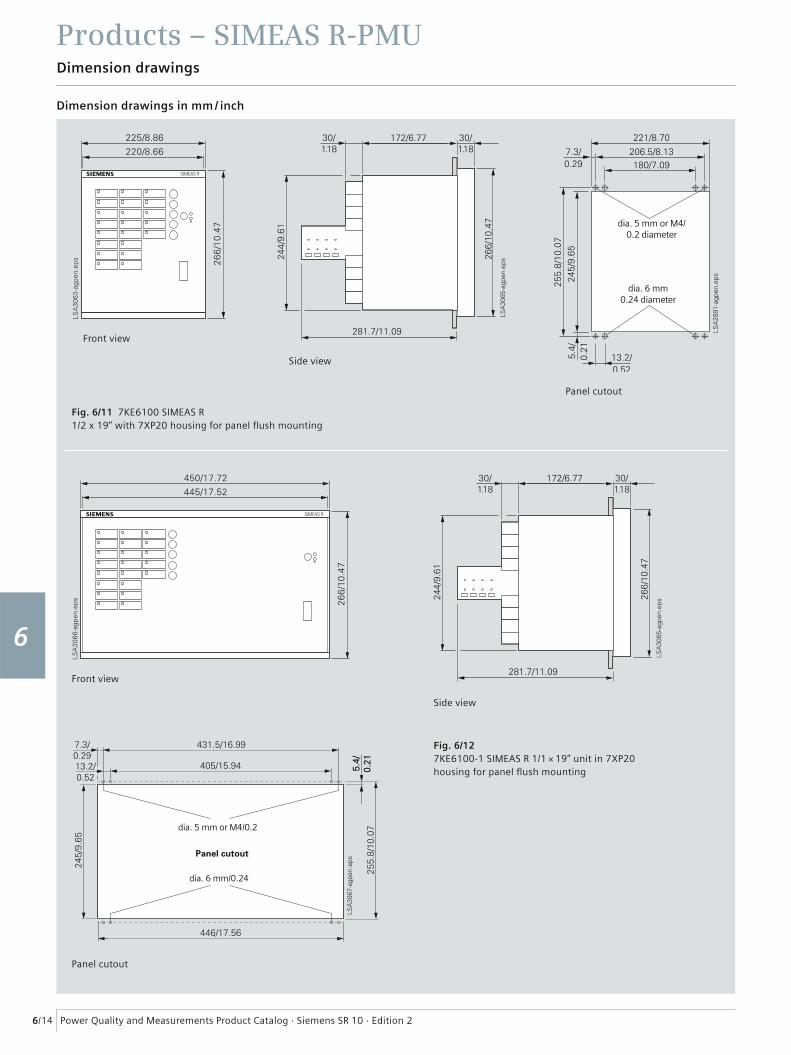
Power Quality and Measurements Product Catalog · Siemens SR 10 · Edition 2
Products – SIMEAS R-PMU
6/14
Dimension drawings
1
2
3
4
5
6
7
8
9dia. 6 mm/0.24
dia. 5 mm or M4/0.2
dia. 5 mm or M4/0.2 diameter
dia. 6 mm0.24 diameter
Fig. 6/11 7KE6100 SIMEAS R 1/2 x 19” with 7XP20 housing for panel fl ush mounting
Front view
Front view
Panel cutout
Side view
Panel cutout
Side view
Fig. 6/12 7KE6100-1 SIMEAS R 1/1 × 19” unit in 7XP20 housing for panel fl ush mounting
Dimension drawings in mm / inch
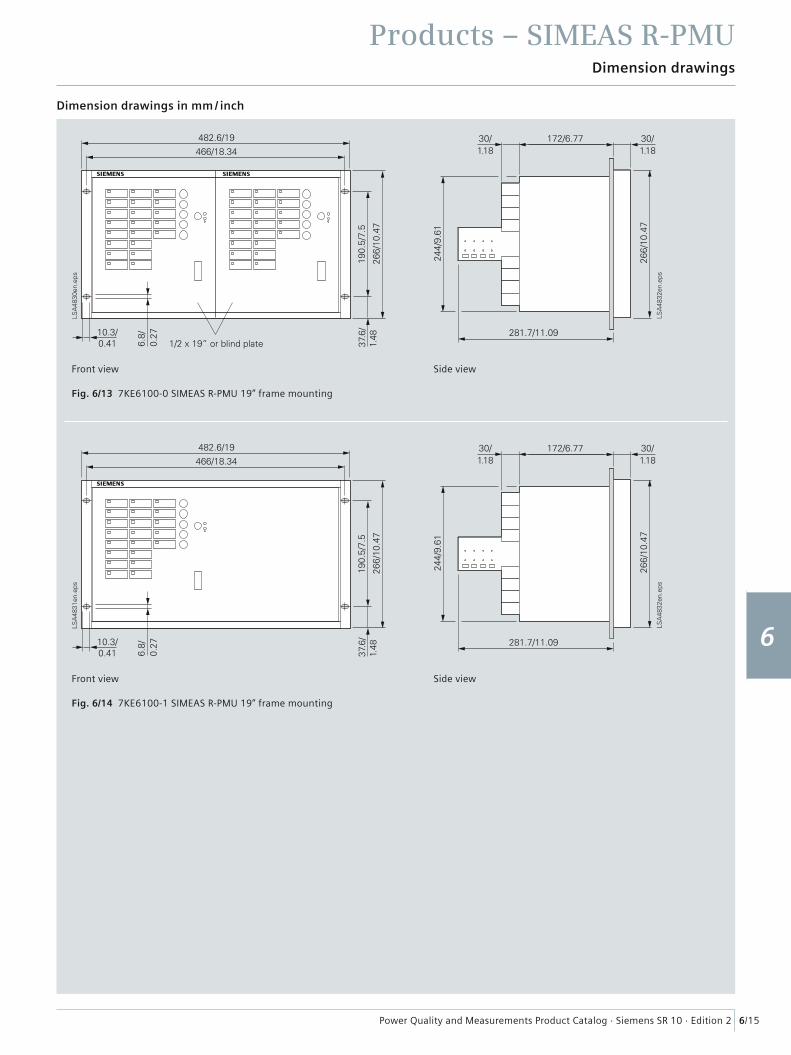
Power Quality and Measurements Product Catalog · Siemens SR 10 · Edition 2
Products – SIMEAS R-PMU
6/15
Dimension drawings
1
2
3
4
5
6
7
8
9
Front view
Fig. 6/13 7KE6100-0 SIMEAS R-PMU 19” frame mounting
Front view
Fig. 6/14 7KE6100-1 SIMEAS R-PMU 19” frame mounting
Side view
Side view
Dimension drawings in mm / inch
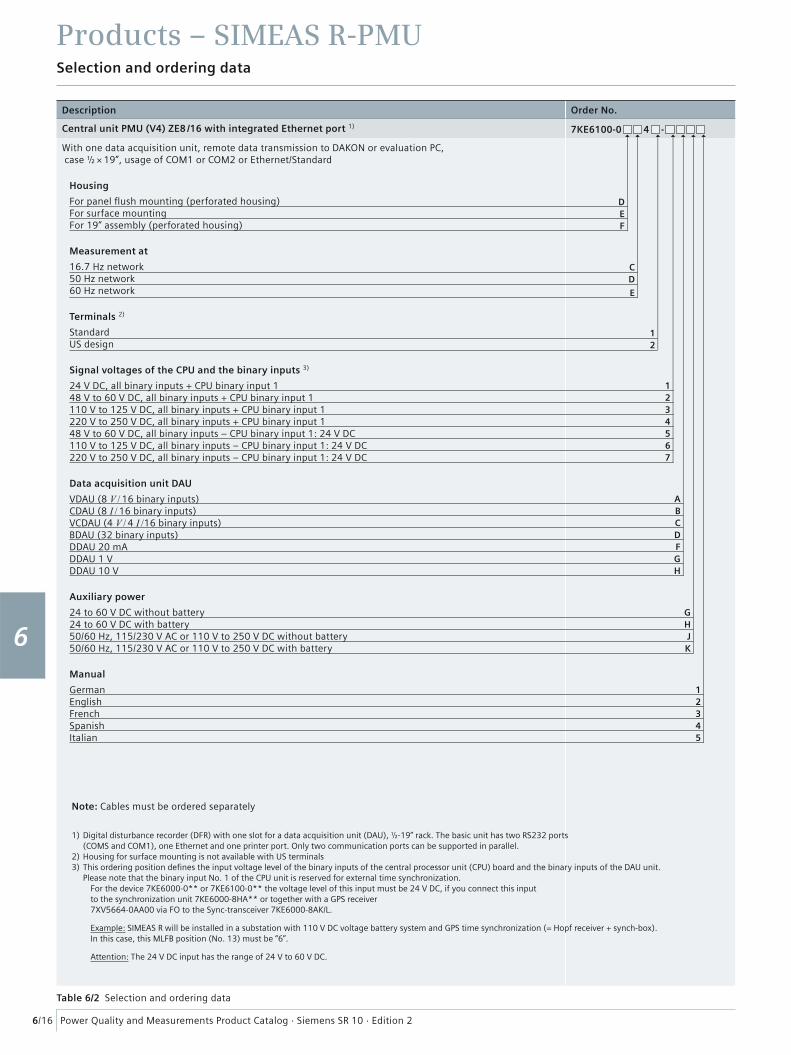
Power Quality and Measurements Product Catalog · Siemens SR 10 · Edition 2
Products – SIMEAS R-PMU
6/16
Selection and ordering data
1
2
3
4
5
6
7
8
9
Description Order No.
Central unit PMU (V4) ZE8 /16 with integrated Ethernet port 1) 7KE6100-0 4 -
With one data acquisition unit, remote data transmission to DAKON or evaluation PC, case ½ × 19”, usage of COM1 or COM2 or Ethernet/Standard
Housing
For panel fl ush mounting (perforated housing)For surface mountingFor 19” assembly (perforated housing)
Measurement at
16.7 Hz network50 Hz network60 Hz network
Terminals 2)
StandardUS design
Signal voltages of the CPU and the binary inputs 3)
24 V DC, all binary inputs + CPU binary input 148 V to 60 V DC, all binary inputs + CPU binary input 1110 V to 125 V DC, all binary inputs + CPU binary input 1220 V to 250 V DC, all binary inputs + CPU binary input 148 V to 60 V DC, all binary inputs – CPU binary input 1: 24 V DC110 V to 125 V DC, all binary inputs – CPU binary input 1: 24 V DC220 V to 250 V DC, all binary inputs – CPU binary input 1: 24 V DC
Data acquisition unit DAU
VDAU (8 V / 16 binary inputs)CDAU (8 I / 16 binary inputs)VCDAU (4 V / 4 I /16 binary inputs)BDAU (32 binary inputs)DDAU 20 mADDAU 1 VDDAU 10 V
Auxiliary power
24 to 60 V DC without battery24 to 60 V DC with battery50/60 Hz, 115/230 V AC or 110 V to 250 V DC without battery50/60 Hz, 115/230 V AC or 110 V to 250 V DC with battery
Manual
GermanEnglishFrenchSpanishItalian
1) Digital disturbance recorder (DFR) with one slot for a data acquisition unit (DAU), ½-19” rack. The basic unit has two RS232 ports(COMS and COM1), one Ethernet and one printer port. Only two communication ports can be supported in parallel.
2) Housing for surface mounting is not available with US terminals3) This ordering position defi nes the input voltage level of the binary inputs of the central processor unit (CPU) board and the binary inputs of the DAU unit.
Please note that the binary input No. 1 of the CPU unit is reserved for external time synchronization.For the device 7KE6000-0** or 7KE6100-0** the voltage level of this input must be 24 V DC, if you connect this inputto the synchronization unit 7KE6000-8HA** or together with a GPS receiver7XV5664-0AA00 via FO to the Sync-transceiver 7KE6000-8AK/L.
Example: SIMEAS R will be installed in a substation with 110 V DC voltage battery system and GPS time synchronization (= Hopf receiver + synch-box).In this case, this MLFB position (No. 13) must be “6”.
Attention: The 24 V DC input has the range of 24 V to 60 V DC.
Note: Cables must be ordered separately
Table 6/2 Selection and ordering data
D
1
A
4
D
7
H
12
E
2
B
5
F
C
F
3
C
6
G
D
E
G
K
HJ
4
21
5
3
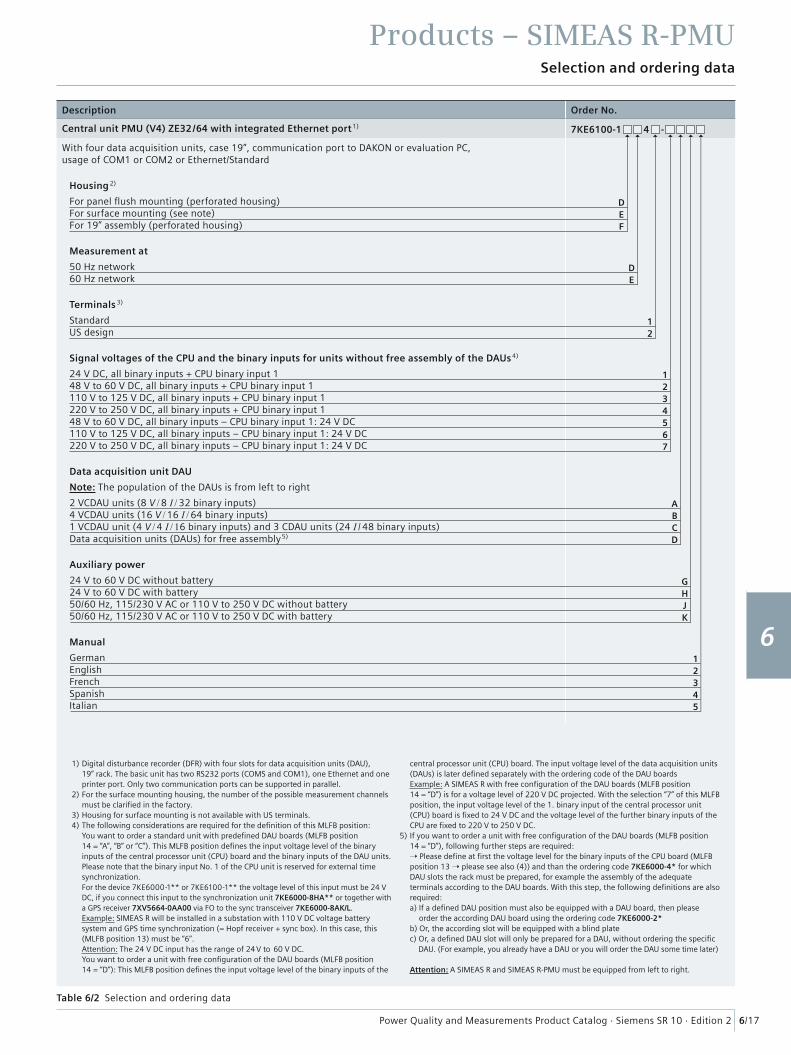
Power Quality and Measurements Product Catalog · Siemens SR 10 · Edition 2
Products – SIMEAS R-PMU
6/17
Selection and ordering data
1
2
3
4
5
6
7
8
9
Description Order No.
Central unit PMU (V4) ZE32 / 64 with integrated Ethernet port 1) 7KE6100-1 4 -
With four data acquisition units, case 19”, communication port to DAKON or evaluation PC,usage of COM1 or COM2 or Ethernet/Standard
Housing 2)
For panel fl ush mounting (perforated housing)For surface mounting (see note)For 19” assembly (perforated housing)
Measurement at
50 Hz network60 Hz network
Terminals 3)
StandardUS design
Signal voltages of the CPU and the binary inputs for units without free assembly of the DAUs 4)
24 V DC, all binary inputs + CPU binary input 148 V to 60 V DC, all binary inputs + CPU binary input 1110 V to 125 V DC, all binary inputs + CPU binary input 1220 V to 250 V DC, all binary inputs + CPU binary input 148 V to 60 V DC, all binary inputs – CPU binary input 1: 24 V DC110 V to 125 V DC, all binary inputs – CPU binary input 1: 24 V DC220 V to 250 V DC, all binary inputs – CPU binary input 1: 24 V DC
Data acquisition unit DAU
Note: The population of the DAUs is from left to right
2 VCDAU units (8 V / 8 I / 32 binary inputs)4 VCDAU units (16 V / 16 I / 64 binary inputs)1 VCDAU unit (4 V / 4 I / 16 binary inputs) and 3 CDAU units (24 I / 48 binary inputs)Data acquisition units (DAUs) for free assembly 5)
Auxiliary power
24 V to 60 V DC without battery24 V to 60 V DC with battery50/60 Hz, 115/230 V AC or 110 V to 250 V DC without battery50/60 Hz, 115/230 V AC or 110 V to 250 V DC with battery
Manual
GermanEnglishFrenchSpanishItalian
1) Digital disturbance recorder (DFR) with four slots for data acquisition units (DAU), 19” rack. The basic unit has two RS232 ports (COMS and COM1), one Ethernet and one printer port. Only two communication ports can be supported in parallel.
2) For the surface mounting housing, the number of the possible measurement channels must be clarifi ed in the factory.
3) Housing for surface mounting is not available with US terminals.4) The following considerations are required for the defi nition of this MLFB position:
You want to order a standard unit with predefi ned DAU boards (MLFB position 14 = “A”, “B” or “C”). This MLFB position defi nes the input voltage level of the binary inputs of the central processor unit (CPU) board and the binary inputs of the DAU units. Please note that the binary input No. 1 of the CPU unit is reserved for external time synchronization.For the device 7KE6000-1** or 7KE6100-1** the voltage level of this input must be 24 V DC, if you connect this input to the synchronization unit 7KE6000-8HA** or together with a GPS receiver 7XV5664-0AA00 via FO to the sync transceiver 7KE6000-8AK/L.Example: SIMEAS R will be installed in a substation with 110 V DC voltage battery system and GPS time synchronization (= Hopf receiver + sync box). In this case, this (MLFB position 13) must be “6”.Attention: The 24 V DC input has the range of 24 V to 60 V DC.You want to order a unit with free confi guration of the DAU boards (MLFB position 14 = “D”): This MLFB position defi nes the input voltage level of the binary inputs of the
central processor unit (CPU) board. The input voltage level of the data acquisition units (DAUs) is later defi ned separately with the ordering code of the DAU boardsExample: A SIMEAS R with free confi guration of the DAU boards (MLFB position 14 = “D”) is for a voltage level of 220 V DC projected. With the selection “7” of this MLFB position, the input voltage level of the 1. binary input of the central processor unit (CPU) board is fi xed to 24 V DC and the voltage level of the further binary inputs of the CPU are fi xed to 220 V to 250 V DC.
5) If you want to order a unit with free confi guration of the DAU boards (MLFB position 14 = “D”), following further steps are required:➝ Please defi ne at fi rst the voltage level for the binary inputs of the CPU board (MLFB position 13 ➝ please see also (4)) and than the ordering code 7KE6000-4* for which DAU slots the rack must be prepared, for example the assembly of the adequate terminals according to the DAU boards. With this step, the following defi nitions are also required:a) If a defi ned DAU position must also be equipped with a DAU board, then please
order the according DAU board using the ordering code 7KE6000-2*b) Or, the according slot will be equipped with a blind platec) Or, a defi ned DAU slot will only be prepared for a DAU, without ordering the specifi c
DAU. (For example, you already have a DAU or you will order the DAU some time later)
Attention: A SIMEAS R and SIMEAS R-PMU must be equipped from left to right.
D
1
A
4
7
D
12
E
2
B
5
D
F
3
C
6
E
G
K
HJ
4
21
5
3
Table 6/2 Selection and ordering data
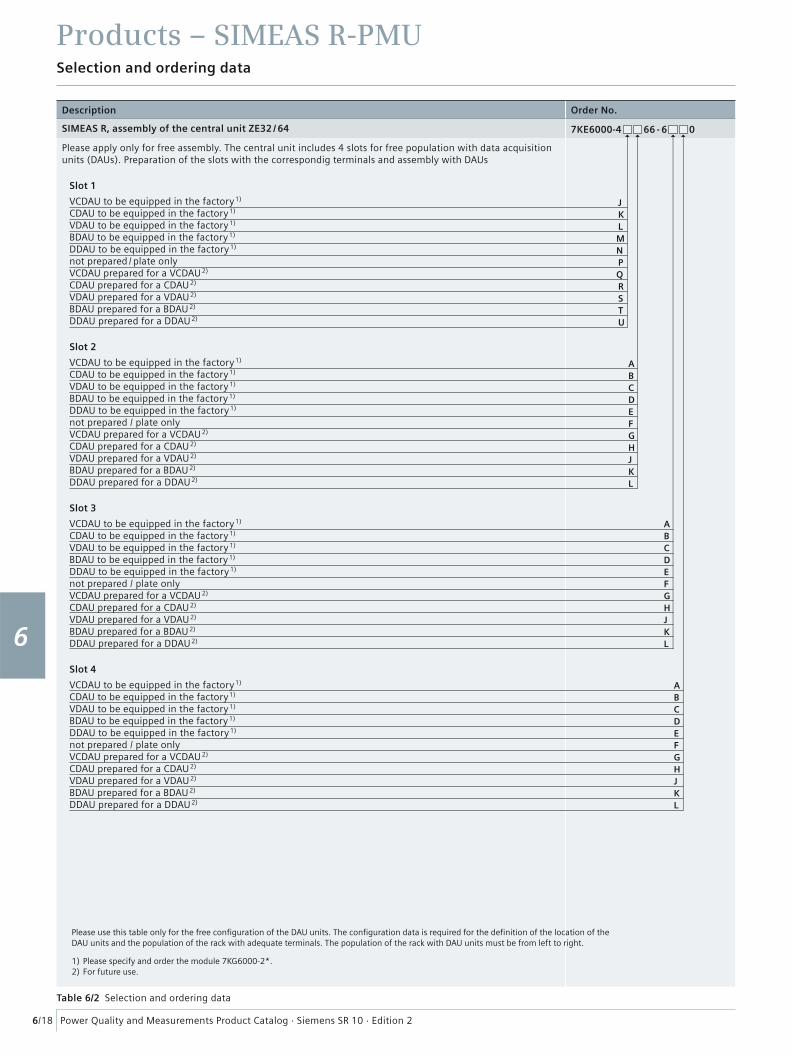
Power Quality and Measurements Product Catalog · Siemens SR 10 · Edition 2
Products – SIMEAS R-PMU
6/18
Selection and ordering data
1
2
3
4
5
6
7
8
9
Description Order No.
SIMEAS R, assembly of the central unit ZE32 / 64 7KE6000-4 66 - 6 0
Please apply only for free assembly. The central unit includes 4 slots for free population with data acquisition units (DAUs). Preparation of the slots with the correspondig terminals and assembly with DAUs
Slot 1
VCDAU to be equipped in the factory 1)
CDAU to be equipped in the factory 1)
VDAU to be equipped in the factory 1)
BDAU to be equipped in the factory 1)
DDAU to be equipped in the factory 1)
not prepared / plate onlyVCDAU prepared for a VCDAU 2)
CDAU prepared for a CDAU 2)
VDAU prepared for a VDAU 2)
BDAU prepared for a BDAU 2)
DDAU prepared for a DDAU 2)
Slot 2
VCDAU to be equipped in the factory 1)
CDAU to be equipped in the factory 1)
VDAU to be equipped in the factory 1)
BDAU to be equipped in the factory 1)
DDAU to be equipped in the factory 1)
not prepared / plate onlyVCDAU prepared for a VCDAU 2)
CDAU prepared for a CDAU 2)
VDAU prepared for a VDAU 2)
BDAU prepared for a BDAU 2)
DDAU prepared for a DDAU 2)
Slot 3
VCDAU to be equipped in the factory 1)
CDAU to be equipped in the factory 1)
VDAU to be equipped in the factory 1)
BDAU to be equipped in the factory 1)
DDAU to be equipped in the factory 1)
not prepared / plate onlyVCDAU prepared for a VCDAU 2)
CDAU prepared for a CDAU 2)
VDAU prepared for a VDAU 2)
BDAU prepared for a BDAU 2)
DDAU prepared for a DDAU 2)
Slot 4
VCDAU to be equipped in the factory 1)
CDAU to be equipped in the factory 1)
VDAU to be equipped in the factory 1)
BDAU to be equipped in the factory 1)
DDAU to be equipped in the factory 1)
not prepared / plate onlyVCDAU prepared for a VCDAU 2)
CDAU prepared for a CDAU 2)
VDAU prepared for a VDAU 2)
BDAU prepared for a BDAU 2)
DDAU prepared for a DDAU 2)
Please use this table only for the free confi guration of the DAU units. The confi guration data is required for the defi nition of the location of the DAU units and the population of the rack with adequate terminals. The population of the rack with DAU units must be from left to right.
1) Please specify and order the module 7KG6000-2*.2) For future use.
Table 6/2 Selection and ordering data
J
P
M
S
Q
K
N
T
L
R
U
A
A
A
F
F
F
D
D
D
J
J
J
G
G
G
B
B
B
E
E
E
K
K
K
C
C
C
H
H
H
L
L
L
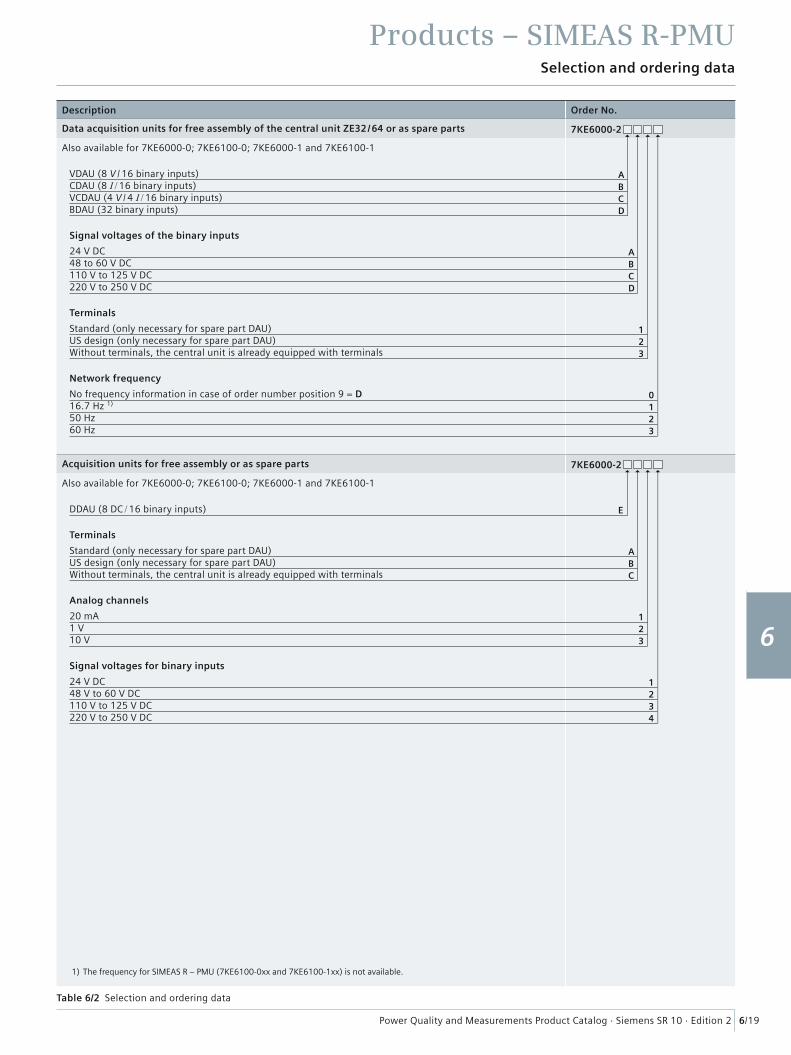
Power Quality and Measurements Product Catalog · Siemens SR 10 · Edition 2
Products – SIMEAS R-PMU
6/19
Selection and ordering data
1
2
3
4
5
6
7
8
9
Description Order No.
Data acquisition units for free assembly of the central unit ZE32 /64 or as spare parts 7KE6000-2
Also available for 7KE6000-0; 7KE6100-0; 7KE6000-1 and 7KE6100-1
VDAU (8 V / 16 binary inputs)CDAU (8 I / 16 binary inputs)VCDAU (4 V / 4 I / 16 binary inputs)BDAU (32 binary inputs)
Signal voltages of the binary inputs
24 V DC48 to 60 V DC110 V to 125 V DC220 V to 250 V DC
Terminals
Standard (only necessary for spare part DAU)US design (only necessary for spare part DAU)Without terminals, the central unit is already equipped with terminals
Network frequency
No frequency information in case of order number position 9 = D16.7 Hz 1)
50 Hz60 Hz
Acquisition units for free assembly or as spare parts 7KE6000-2
Also available for 7KE6000-0; 7KE6100-0; 7KE6000-1 and 7KE6100-1
DDAU (8 DC / 16 binary inputs)
Terminals
Standard (only necessary for spare part DAU)US design (only necessary for spare part DAU)Without terminals, the central unit is already equipped with terminals
Analog channels
20 mA1 V10 V
Signal voltages for binary inputs
24 V DC48 V to 60 V DC110 V to 125 V DC220 V to 250 V DC
1) The frequency for SIMEAS R – PMU (7KE6100-0xx and 7KE6100-1xx) is not available.
Table 6/2 Selection and ordering data
A
A
1
0
D
D
B
B
2
1
C
C
3
23
E
A
1
1
B
2
2
C
3
34

Power Quality and Measurements Product Catalog · Siemens SR 10 · Edition 2
Products – SIMEAS R-PMU
6/20
Selection and ordering data
1
2
3
4
5
6
7
8
9
Description Order No.
SIMEAS R spare parts
Spare Flash memory für CPU-486 with fi rmware 2.1.xx *) 7KE6000-3HA
PCMCIA Flash memory and fi rmware 2.1.xx *) with standard parameterization
Spare Flash memory for CPU-486 with fi rmware 2.3.xx **) 7KE6000-3HB
PCMCIA Flash memory with installed fi rmware 2.3.xx **), with additional features “Recording of fl icker and voltage sags” Valid only for units with RAM memory of 32 MBwith standard parameterization
512 MB Flash memory for ELAN CPU + fi rmware 3.0.xx 7KE6000-3HC1
IDE Flash memory 2.5 inch and fi rmware 3.0.xx with standard parameterization
1024 MB Flash memory for ELAN CPU + fi rmware 4.0.xx (PMU) 7KE6100-3HC3
IDE Flash memory 2.5 inch and fi rmware 4.0.xx with standard parameterization
Description Order No.
Central processor unit (ELAN-CPU) for SIMEAS R-PMU V4 7KE6100-2L 1
with IDE Flash memory 2.5 inch (1 GB) and current fi rmware with standard parameterization
Input signal voltage
24 V DC, all binary inputs + CPU binary input 148 V to 60 V DC, all binary inputs + CPU binary input 1110 V to 125 V DC, all binary inputs + CPU binary input 1220 V to 250 V DC, all binary inputs + CPU binary input 148 V to 60 V DC, all binary inputs - CPU binary input 1 24 V DC110 V to 125 V DC, all binary inputs - CPU binary input 1 24 V DC220 V to 250 V DC, all binary inputs - CPU binary input 1 24 V DC
Power supply for central processor unit 7KE6000-2G
24 V to 60 DC without battery24 V to 60 DC with battery50/60 Hz, 115/230 V AC or 110 V to 250 V DC without battery50/60 Hz, 115/230 V AC or 110 V to 250 V DC with battery
*) xx: Current version of the fi rmware 21.xx**) xx: Current version of the fi rmware 23.xx
1) For connecting a synchronization unit 7KE6000-8HA, the binary input 1 of the CPU has to be dimensioned for 24 V DC(24 V DC input necessary for connection to sync. tranceiver, 24 V DC input is able to handle 24 V to 60 V DC)
Table 6/2 Selection and ordering data
A
G
B
H
C
J
D
K
EFG

Power Quality and Measurements Product Catalog · Siemens SR 10 · Edition 2
Products – SIMEAS R-PMU
6/21
Selection and ordering data
1
2
3
4
5
6
7
8
9
Description Order No.
Synchronization unit 2) 7KE6000-8HA
In the housing with snap-on attachment for 35 mm/1.38 in. top-hat rail according to DIN EN 50022 with connection cable for SIMEAS R
Receiver /decoder module for time synchronization
Decoder for DCF77 signal For connection to a GPS receiver with DCF77 output signal (for example to a HOPF 6875 GPS receiver); or for terrestrial antennaThis is the best choice for all applications worldwideDecoder for Meinberg or ZERA signalDecoder for Patek - Philippe signalDecoder for IRIG B signal (e.g. of GPS receiver) 1)
Decoder for telenorma signalDecoder for demodulated IRIG B signal, TTL levelDecoder for demodulated DCF77 signal, open collector connectionConnection via serial port 1 (connection via terminals 11, 12, 13)
Auxiliary power
24 V to 60 V DC110 V to 250 V DC or 115 V to 230 V AC, 50/60 Hz
GPS time synchronization unit 7XV5664-0AA00
With GPS antenna and 25 m/82.02 ft antenna cable Time receiver with 2 optical outputs (programable)ST plugs for 62.5 / 125 μm multi-mode fi ber.Output: IRIG-B or DCF77 time telegramAuxiliary voltage 24 to 48 V DCFor other auxiliary voltage ranges 7XV5810-0BA00 is required
DC-AC/DC converter 7XV5810-0 A00
Input: 24 V to 250 V DC, 115/230 V ACOutput: 24 V DC
Rugged switch RSG2100 7KE6000-8AP 0- AB
12 × 10BaseFL ports with ST plug 2 × 100BaseFX ports 2 × 10/100BaseFT ports with RJ45 plug (uplink function)
Power supply
24 V DC48 V DC88 V to 300 V DC/85 V to 264 V AC
FO option for 2 × 100BaseFX ports
1310 nm, multi-mode, 2 km/1.24 miles with ST plug1310 nm, single mode, 20 km/12.43 miles km with LC plug
Components for Ethernet communication
Ethernet transceiver 24 V DC (18 V to 36 V DC) with ST connector
Rugged MC – RMC – Ethernet media converter
Ethernet transceiver 88 V to 300 V DC or 85 V to 264 V AC with ST connector
Rugged MC – RMC – Ethernet media converter
7KE6000-8AF
7KE6000-8AG
Components for time synchronization
SIMEAS Sync fi bre optic multiplexer (24 V to 60 V DC)
SIMEAS Sync fi bre optic multiplexer (110 V to 230 V DC/AC; 45 to 65 Hz)
Sync transceiver (24 V to 60 V DC)
Sync transceiver (110 V to 230 V DC/AC; 45 to 65 Hz)
7KE6000-8AH
7KE6000-8AJ
7KE6000-8AK
7KE6000-8AL
1) The IRIG B signal has the following disadvantages: the year is not indicated, there is no switchover from summer to winter, there is no relative time (not orientated towards time zones).
2) Only for SIMEAS R devices with FW V2 or V3, not for V4 PMU. The control input 1 of the CPU has to be dimensioned for 24 V DC to connect a time synchronization unit 7KE6000-8HA. When ordering the central unit 7KE6000-XXXXX-ZXX, please make sure that Z=1,5,6 or 7, depending on the control voltage for the binary inputs.
Table 6/2 Selection and ordering data
2
1
B
012
3
2
45678
01
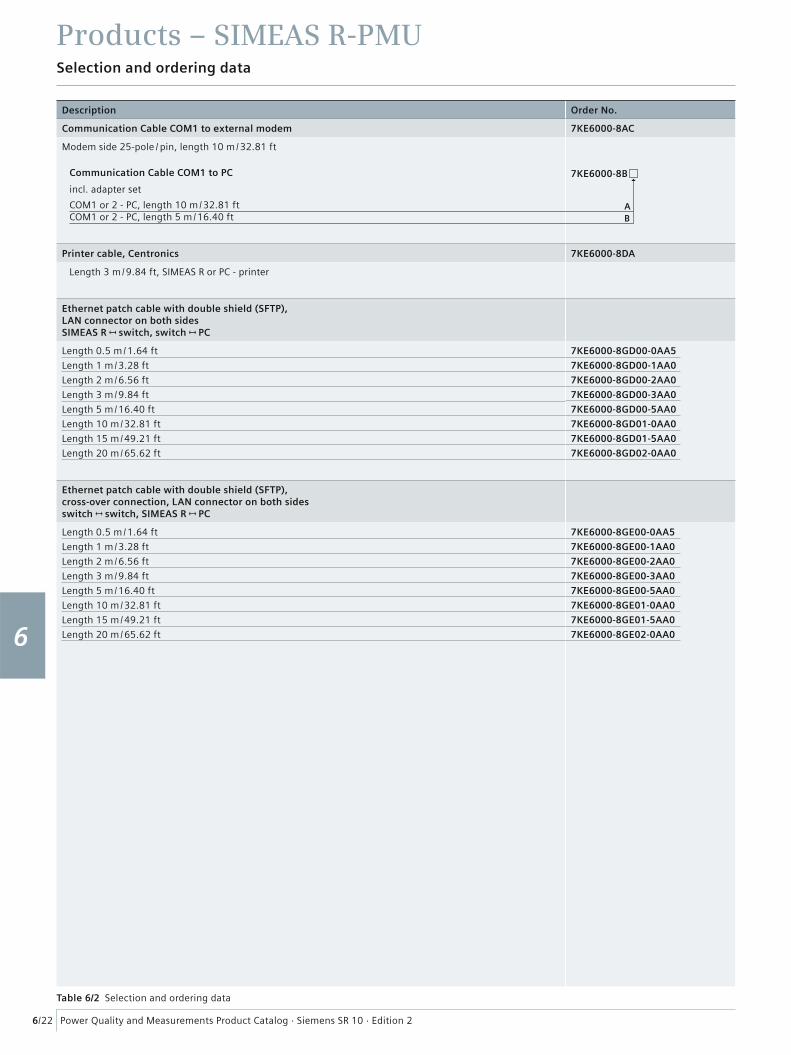
Power Quality and Measurements Product Catalog · Siemens SR 10 · Edition 2
Products – SIMEAS R-PMU
6/22
Selection and ordering data
1
2
3
4
5
6
7
8
9
Description Order No.
Communication Cable COM1 to external modem 7KE6000-8AC
Modem side 25-pole / pin, length 10 m/32.81 ft
Communication Cable COM1 to PC 7KE6000-8B
incl. adapter set
COM1 or 2 - PC, length 10 m/32.81 ftCOM1 or 2 - PC, length 5 m/16.40 ft
Printer cable, Centronics 7KE6000-8DA
Length 3 m/9.84 ft, SIMEAS R or PC - printer
Ethernet patch cable with double shield (SFTP), LAN connector on both sidesSIMEAS R switch, switch PC
Length 0.5 m/1.64 ft
Length 1 m/3.28 ft
Length 2 m/6.56 ft
Length 3 m/9.84 ft
Length 5 m/16.40 ft
Length 10 m/32.81 ft
Length 15 m/49.21 ft
Length 20 m/65.62 ft
7KE6000-8GD00-0AA5
7KE6000-8GD00-1AA0
7KE6000-8GD00-2AA0
7KE6000-8GD00-3AA0
7KE6000-8GD00-5AA0
7KE6000-8GD01-0AA0
7KE6000-8GD01-5AA0
7KE6000-8GD02-0AA0
Ethernet patch cable with double shield (SFTP),cross-over connection, LAN connector on both sidesswitch switch, SIMEAS R PC
Length 0.5 m/1.64 ft
Length 1 m/3.28 ft
Length 2 m/6.56 ft
Length 3 m/9.84 ft
Length 5 m/16.40 ft
Length 10 m/32.81 ft
Length 15 m/49.21 ft
Length 20 m/65.62 ft
7KE6000-8GE00-0AA5
7KE6000-8GE00-1AA0
7KE6000-8GE00-2AA0
7KE6000-8GE00-3AA0
7KE6000-8GE00-5AA0
7KE6000-8GE01-0AA0
7KE6000-8GE01-5AA0
7KE6000-8GE02-0AA0
Table 6/2 Selection and ordering data
AB

Power Quality and Measurements Product Catalog · Siemens SR 10 · Edition 2
Products – SIMEAS R-PMU
6/23
Selection and ordering data
1
2
3
4
5
6
7
8
9
Description Order No.
Connection cable for current inputs 8-core fl exible cable, 2.5 mm2/0.004 sq in., for 4 current channels
7KE6000-8GA00-0
Please note: Minimum length 2 m/6.56 ft
Without pre-assembled cablesWith end sleeve ferruleWith end sleeve ferrule on both sidesWithout core identifi cationWith core identifi cationCable length in m (X = 2 ... 8, 9 = special length)
Connection cable for voltage inputs 8-core fl exible cable, 0.75 mm2/0.001 sq in., for 4 voltage channels
7KE6000-8GB00-0
Please note: Minimum length 2 m/6.56 ft
Without pre-assembled cablesWith end sleeve ferrule on one sideWith end sleeve ferrule on both sidesWithout core identifi cationWith core identifi cationCable length in m (X = 2 ... 8, 9 = special length)
Connection cable for binary inputs32-core fl exible cable, 0.25 mm2/0.0004 sq in.
7KE6000-8GC00-0
Please note: Minimum length 2 m/6.56 ft
Without pre-assembled cablesWith end sleeve ferrule on one sideWith end sleeve ferrule on both sidesWithout core identifi cationWith core identifi cationCable length in m (X = 2 ... 8, 9 = special length)
Manual for fi rmware version SIMEAS R-PMU
English
German
French
Spanish
Italian
E50417-B1076-C360-A1
E50417-B1000-C360-A1
E50417-B1077-C360-A2
E50417-B1078-C360-A2
E50417-B1072-C360-A2
USB alarm box 7KE6020-1AA00
Monitoring unit for DAKON XP with USB connection, own watchdog and 7 alarm contacts
Table 6/2 Selection and ordering data
ABC
AB
X
A
A
B
B
C
C
A
A
B
B
X
X

Power Quality and Measurements Product Catalog · Siemens SR 10 · Edition 2
Products – SIMEAS R-PMU
6/24
Certifi cate
1
2
3
4
5
6
7
8
9
Energy Automation
Answers for infrastructure and cities.
SICAM PQS Fault Record and Power Quality Analysis System
Power Quality and Measurements Product Catalog · Siemens SR 10 · Edition 2 7/2
1
2
3
4
5
6
7
8
9
Contents – SICAM PQS
Page
Description and function overview 7/3
Applications 7/3
SICAM PQ Analyzer collector 7/8
Architecture and Confi guration 7/9
Selection and ordering data 7/10
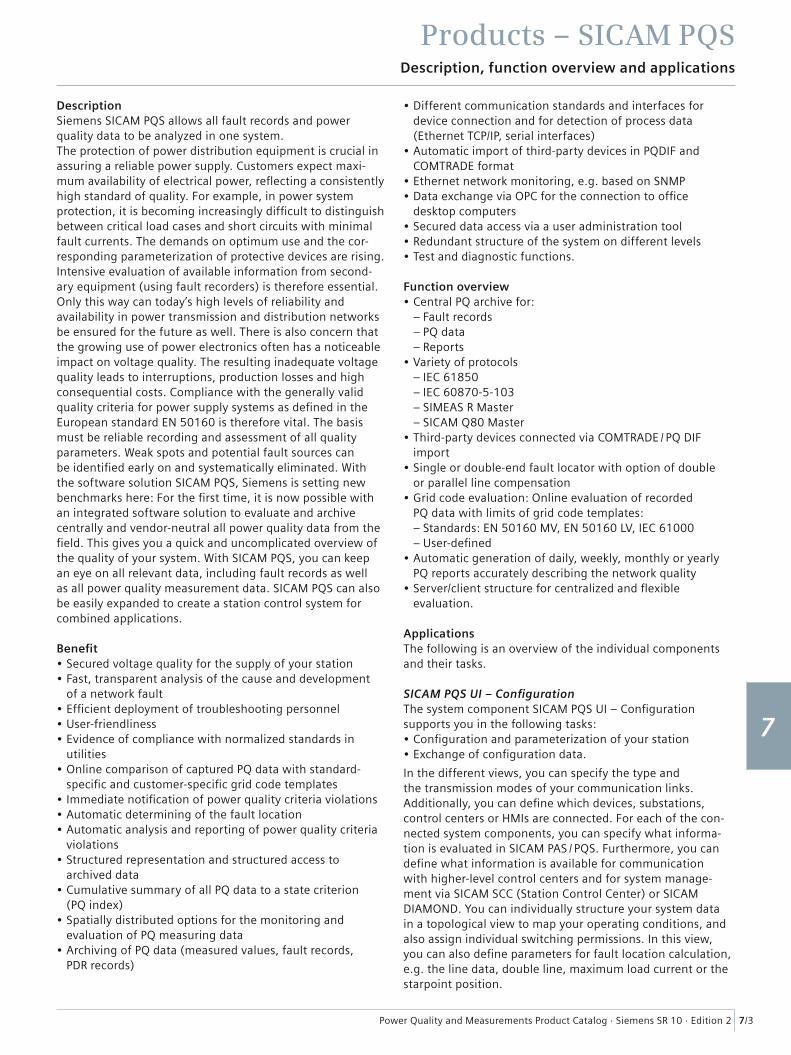
Power Quality and Measurements Product Catalog · Siemens SR 10 · Edition 2
Products – SICAM PQS
7/3
1
2
3
4
5
6
7
8
9
Description, function overview and applications
Description Siemens SICAM PQS allows all fault records and power quality data to be analyzed in one system.The protection of power distribution equipment is crucial in assuring a reliable power supply. Customers expect maxi-mum availability of electrical power, refl ecting a consistently high standard of quality. For example, in power system protection, it is becoming increasingly diffi cult to distinguish between critical load cases and short circuits with minimal fault currents. The demands on optimum use and the cor-responding parameterization of protective devices are rising. Intensive evaluation of available information from second-ary equipment (using fault recorders) is therefore essential. Only this way can today’s high levels of reliability and availability in power transmission and distribution networks be ensured for the future as well. There is also concern that the growing use of power electronics often has a noticeable impact on voltage quality. The resulting inadequate voltage quality leads to interruptions, production losses and high consequential costs. Compliance with the generally valid quality criteria for power supply systems as defi ned in the European standard EN 50160 is therefore vital. The basis must be reliable recording and assessment of all quality parameters. Weak spots and potential fault sources can be identifi ed early on and systematically eliminated. With the software solution SICAM PQS, Siemens is setting new benchmarks here: For the fi rst time, it is now possible with an integrated software solution to evaluate and archive centrally and vendor-neutral all power quality data from the fi eld. This gives you a quick and uncomplicated overview of the quality of your system. With SICAM PQS, you can keep an eye on all relevant data, including fault records as well as all power quality measurement data. SICAM PQS can also be easily expanded to create a station control system for combined applications.
Benefi t• Secured voltage quality for the supply of your station • Fast, transparent analysis of the cause and development
of a network fault • Effi cient deployment of troubleshooting personnel • User-friendliness • Evidence of compliance with normalized standards in
utilities • Online comparison of captured PQ data with standard-
specifi c and customer-specifi c grid code templates • Immediate notifi cation of power quality criteria violations • Automatic determining of the fault location • Automatic analysis and reporting of power quality criteria
violations • Structured representation and structured access to
archived data • Cumulative summary of all PQ data to a state criterion
(PQ index) • Spatially distributed options for the monitoring and
evaluation of PQ measuring data • Archiving of PQ data (measured values, fault records,
PDR records)
• Different communication standards and interfaces for device connection and for detection of process data (Ethernet TCP/IP, serial interfaces)
• Automatic import of third-party devices in PQDIF and COMTRADE format
• Ethernet network monitoring, e.g. based on SNMP • Data exchange via OPC for the connection to offi ce
desktop computers • Secured data access via a user administration tool• Redundant structure of the system on different levels • Test and diagnostic functions.
Function overview• Central PQ archive for:
– Fault records – PQ data – Reports
• Variety of protocols – IEC 61850 – IEC 60870-5-103 – SIMEAS R Master – SICAM Q80 Master
• Third-party devices connected via COMTRADE / PQ DIF import
• Single or double-end fault locator with option of double or parallel line compensation
• Grid code evaluation: Online evaluation of recorded PQ data with limits of grid code templates:
– Standards: EN 50160 MV, EN 50160 LV, IEC 61000 – User-defi ned
• Automatic generation of daily, weekly, monthly or yearly PQ reports accurately describing the network quality
• Server/client structure for centralized and fl exible evaluation.
ApplicationsThe following is an overview of the individual components and their tasks.
SICAM PQS UI – Confi gurationThe system component SICAM PQS UI – Confi guration supports you in the following tasks:• Confi guration and parameterization of your station • Exchange of confi guration data.
In the different views, you can specify the type and the transmission modes of your communication links. Additionally, you can defi ne which devices, substations, control centers or HMIs are connected. For each of the con-nected system components, you can specify what informa-tion is evaluated in SICAM PAS / PQS. Furthermore, you can defi ne what information is available for communication with higher-level control centers and for system manage-ment via SICAM SCC (Station Control Center) or SICAM DIAMOND. You can individually structure your system data in a topological view to map your operating conditions, and also assign individual switching permissions. In this view, you can also defi ne parameters for fault location calculation, e.g. the line data, double line, maximum load current or the starpoint position.
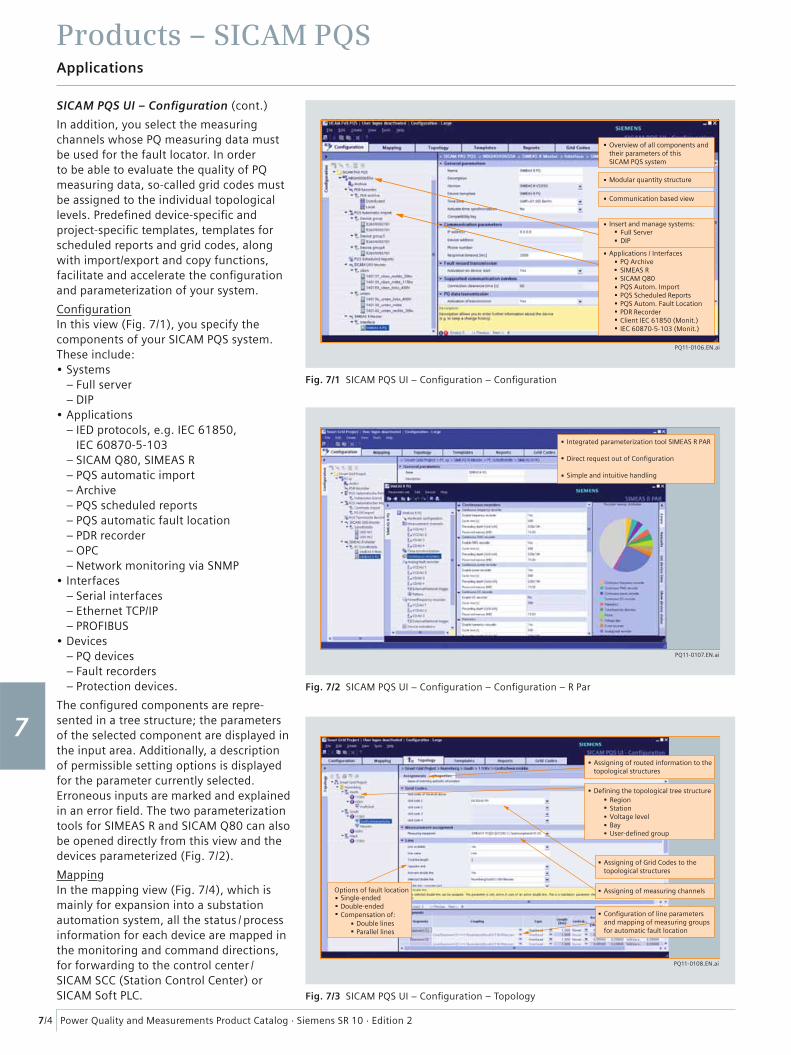
Power Quality and Measurements Product Catalog · Siemens SR 10 · Edition 2
Products – SICAM PQS
7/4
1
2
3
4
5
6
7
8
9
Applications
SICAM PQS UI – Confi guration (cont.)
In addition, you select the measuring channels whose PQ measuring data must be used for the fault locator. In order to be able to evaluate the quality of PQ measuring data, so-called grid codes must be assigned to the individual topological levels. Predefi ned device-specifi c and project-specifi c templates, templates for scheduled reports and grid codes, along with import/export and copy functions, facilitate and accelerate the confi guration and parameterization of your system.
Confi gurationIn this view (Fig. 7/1), you specify the components of your SICAM PQS system. These include:• Systems
– Full server – DIP
• Applications – IED protocols, e.g. IEC 61850, IEC 60870-5-103 – SICAM Q80, SIMEAS R – PQS automatic import – Archive – PQS scheduled reports – PQS automatic fault location – PDR recorder – OPC – Network monitoring via SNMP
• Interfaces – Serial interfaces – Ethernet TCP/IP – PROFIBUS
• Devices – PQ devices – Fault recorders – Protection devices.
The confi gured components are repre-sented in a tree structure; the parameters of the selected component are displayed in the input area. Additionally, a description of permissible setting options is displayed for the parameter currently selected. Erroneous inputs are marked and explained in an error fi eld. The two parameterization tools for SIMEAS R and SICAM Q80 can also be opened directly from this view and the devices parameterized (Fig. 7/2).
MappingIn the mapping view (Fig. 7/4), which is mainly for expansion into a substation automation system, all the status / process information for each device are mapped in the monitoring and command directions, for forwarding to the control center / SICAM SCC (Station Control Center) or SICAM Soft PLC.
Overview of all components andtheir parameters of this SICAM PQS system
Modular quantity structure
Communication based view
Insert and manage systems: Full Server DIP
Applications / Interfaces PQ Archive SIMEAS R SICAM Q80 PQS Autom. Import PQS Scheduled Reports PQS Autom. Fault Location PDR Recorder Client IEC 61850 (Monit.) IEC 60870-5-103 (Monit.)
PQ11-0106.EN.ai
Fig. 7/1 SICAM PQS UI − Confi guration – Confi guration
Integrated parameterization tool SIMEAS R PAR
Direct request out of Configuration
Simple and intuitive handling
PQ11-0107.EN.ai
Fig. 7/2 SICAM PQS UI − Confi guration – Confi guration – R Par
Assigning of routed information to thetopological structures
Assigning of Grid Codes to thetopological structures
Assigning of measuring channels
Configuration of line parametersand mapping of measuring groupsfor automatic fault location
Options of fault locationSingle-ended Double-endedCompensation of:
Double linesParallel lines
Defining the topological tree structureRegionStationVoltage levelBayUser-defined group
PQ11-0108.EN.ai
Fig. 7/3 SICAM PQS UI − Confi guration – Topology
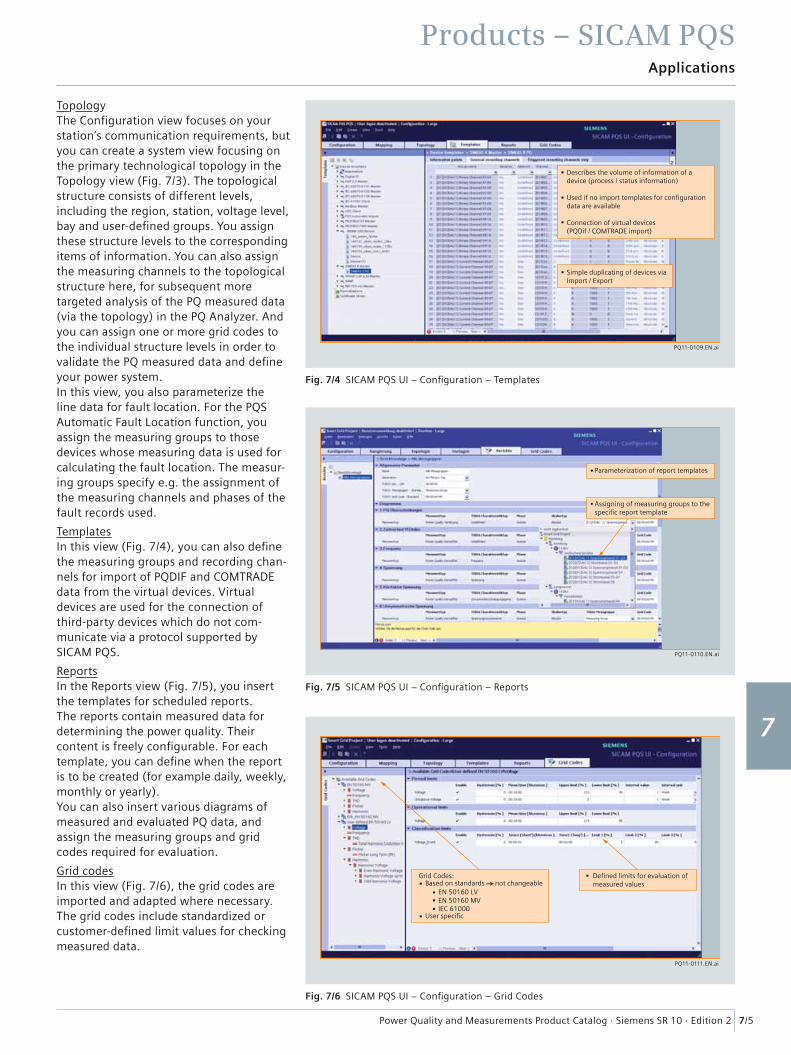
Power Quality and Measurements Product Catalog · Siemens SR 10 · Edition 2
Products – SICAM PQS
7/5
1
2
3
4
5
6
7
8
9
Applications
TopologyThe Confi guration view focuses on your station’s communication requirements, but you can create a system view focusing on the primary technological topology in the Topology view (Fig. 7/3). The topological structure consists of different levels, including the region, station, voltage level, bay and user-defi ned groups. You assign these structure levels to the corresponding items of information. You can also assign the measuring channels to the topological structure here, for subsequent more targeted analysis of the PQ measured data (via the topology) in the PQ Analyzer. And you can assign one or more grid codes to the individual structure levels in order to validate the PQ measured data and defi ne your power system.In this view, you also parameterize the line data for fault location. For the PQS Automatic Fault Location function, you assign the measuring groups to those devices whose measuring data is used for calculating the fault location. The measur-ing groups specify e.g. the assignment of the measuring channels and phases of the fault records used.
TemplatesIn this view (Fig. 7/4), you can also defi ne the measuring groups and recording chan-nels for import of PQDIF and COMTRADE data from the virtual devices. Virtual devices are used for the connection of third-party devices which do not com-municate via a protocol supported by SICAM PQS.
ReportsIn the Reports view (Fig. 7/5), you insert the templates for scheduled reports. The reports contain measured data for determining the power quality. Their content is freely confi gurable. For each template, you can defi ne when the report is to be created (for example daily, weekly, monthly or yearly).You can also insert various diagrams of measured and evaluated PQ data, and assign the measuring groups and grid codes required for evaluation.
Grid codesIn this view (Fig. 7/6), the grid codes are imported and adapted where necessary. The grid codes include standardized or customer-defi ned limit values for checking measured data.
Describes the volume of information of adevice (process / status information)
Used if no import templates for configurationdata are available
Connection of virtual devices(PQDif / COMTRADE import)
Simple duplicating of devices viaImport / Export
PQ11-0109.EN.ai
Fig. 7/4 SICAM PQS UI − Confi guration – Templates
Assigning of measuring groups to thespecific report template
Parameterization of report templates
PQ11-0110.EN.ai
Fig. 7/5 SICAM PQS UI − Confi guration – Reports
Defined limits for evaluation ofmeasured values
Grid Codes:Based on standards not changeable
User specific
EN 50160 LVEN 50160 MVIEC 61000
PQ11-0111.EN.ai
Fig. 7/6 SICAM PQS UI − Confi guration – Grid Codes
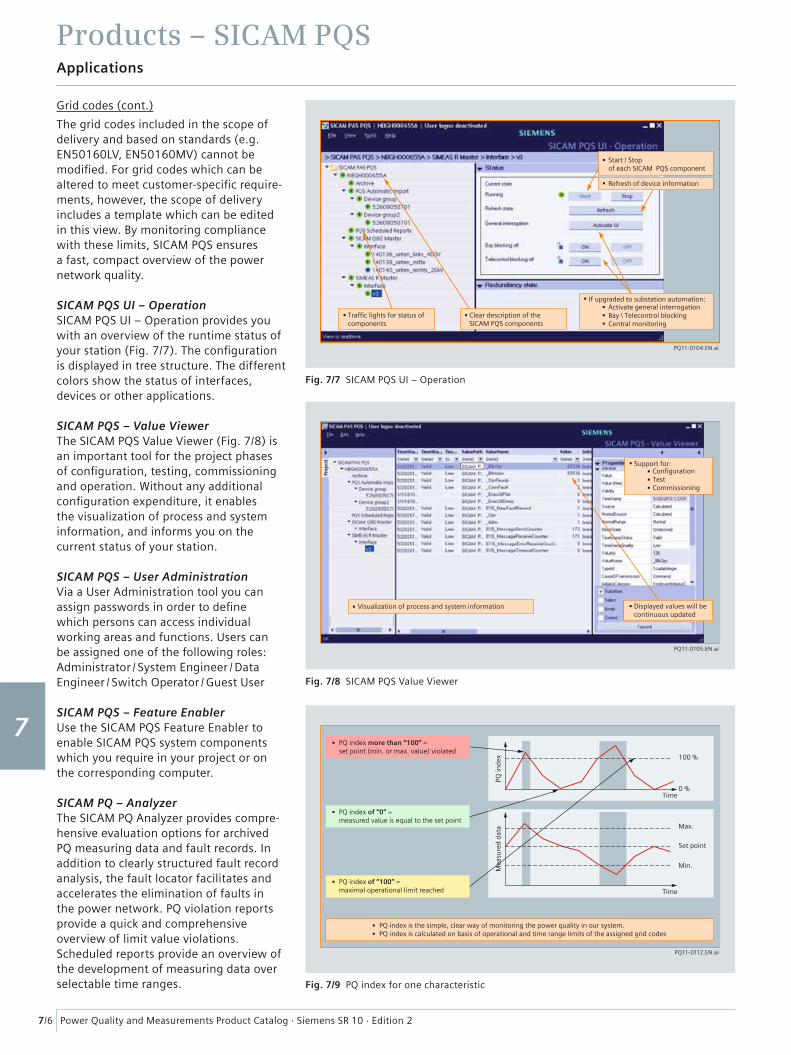
Power Quality and Measurements Product Catalog · Siemens SR 10 · Edition 2
Products – SICAM PQS
7/6
1
2
3
4
5
6
7
8
9
Applications
Grid codes (cont.)
The grid codes included in the scope of delivery and based on standards (e.g. EN50160LV, EN50160MV) cannot be modifi ed. For grid codes which can be altered to meet customer-specifi c require-ments, however, the scope of delivery includes a template which can be edited in this view. By monitoring compliance with these limits, SICAM PQS ensures a fast, compact overview of the power network quality.
SICAM PQS UI – OperationSICAM PQS UI – Operation provides you with an overview of the runtime status of your station (Fig. 7/7). The confi guration is displayed in tree structure. The different colors show the status of interfaces, devices or other applications.
SICAM PQS – Value ViewerThe SICAM PQS Value Viewer (Fig. 7/8) is an important tool for the project phases of confi guration, testing, commissioning and operation. Without any additional confi guration expenditure, it enables the visualization of process and system information, and informs you on the current status of your station.
SICAM PQS – User AdministrationVia a User Administration tool you can assign passwords in order to defi ne which persons can access individual working areas and functions. Users can be assigned one of the following roles: Administrator / System Engineer / Data Engineer / Switch Operator / Guest User
SICAM PQS – Feature EnablerUse the SICAM PQS Feature Enabler to enable SICAM PQS system components which you require in your project or on the corresponding computer.
SICAM PQ – AnalyzerThe SICAM PQ Analyzer provides compre-hensive evaluation options for archived PQ measuring data and fault records. In addition to clearly structured fault record analysis, the fault locator facilitates and accelerates the elimination of faults in the power network. PQ violation reports provide a quick and comprehensive overview of limit value violations. Scheduled reports provide an overview of the development of measuring data over selectable time ranges.
Traffic lights for status ofcomponents
Clear description of theSICAM PQS components
Start / Stopof each SICAM PQS component
If upgraded to substation automation: Activate general interrogation Bay \ Telecontrol blocking Central monitoring
Refresh of device information
PQ11-0104.EN.ai
Fig. 7/7 SICAM PQS UI − Operation
Visualization of process and system information
Support for:ConfigurationTestCommissioning
Displayed values will becontinuous updated
PQ11-0105.EN.ai
Fig. 7/8 SICAM PQS Value Viewer
100 %
0 %
Max.
Min.
Time
PQ in
dex
Time
Mea
sure
d da
ta
Set point
PQ index more than “100“ =set point (min. or max. value) violated
PQ index of “0“ =measured value is equal to the set point
PQ index of “100“ =maximal operational limit reached
PQ index is the simple, clear way of monitoring the power quality in our system. PQ index is calculated on basis of operational and time range limits of the assigned grid codes
PQ11-0112.EN.ai
Fig. 7/9 PQ index for one characteristic
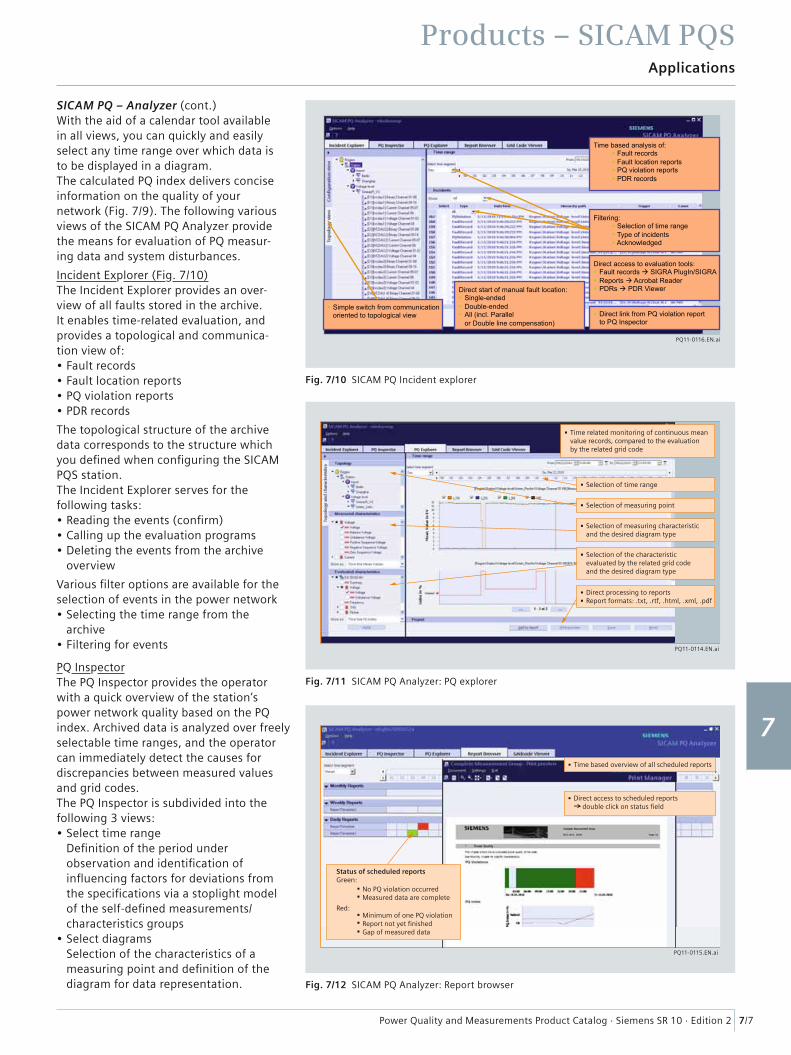
Power Quality and Measurements Product Catalog · Siemens SR 10 · Edition 2
Products – SICAM PQS
7/7
1
2
3
4
5
6
7
8
9
Applications
SICAM PQ – Analyzer (cont.)With the aid of a calendar tool available in all views, you can quickly and easily select any time range over which data is to be displayed in a diagram.The calculated PQ index delivers concise information on the quality of your network (Fig. 7/9). The following various views of the SICAM PQ Analyzer provide the means for evaluation of PQ measur-ing data and system disturbances.
Incident Explorer (Fig. 7/10)The Incident Explorer provides an over-view of all faults stored in the archive. It enables time-related evaluation, and provides a topological and communica-tion view of:• Fault records • Fault location reports • PQ violation reports • PDR records
The topological structure of the archive data corresponds to the structure which you defi ned when confi guring the SICAM PQS station. The Incident Explorer serves for the following tasks:• Reading the events (confi rm)• Calling up the evaluation programs • Deleting the events from the archive
overview
Various fi lter options are available for the selection of events in the power network• Selecting the time range from the
archive • Filtering for events
PQ InspectorThe PQ Inspector provides the operator with a quick overview of the station’s power network quality based on the PQ index. Archived data is analyzed over freely selectable time ranges, and the operator can immediately detect the causes for discrepancies between measured values and grid codes. The PQ Inspector is subdivided into the following 3 views:• Select time range
Defi nition of the period under observation and identifi cation of infl uencing factors for deviations from the specifi cations via a stoplight model of the self-defi ned measurements/characteristics groups
• Select diagramsSelection of the characteristics of a measuring point and defi nition of the diagram for data representation.
PQ11-0116.EN.ai
Time based analysis of: Fault records Fault location reports PQ violation reports PDR records
Simple switch from communication oriented to topological view
Filtering: Selection of time range Type of incidents Acknowledged
Direct access to evaluation tools: Fault records SIGRA PlugIn/SIGRA Reports Acrobat Reader PDRs PDR Viewer
Direct link from PQ violation report to PQ Inspector
Direct start of manual fault location: Single-ended Double-ended All (incl. Parallel or Double line compensation)
PQ11-0116.EN.ai
Fig. 7/10 SICAM PQ Incident explorer
Time related monitoring of continuous meanvalue records, compared to the evaluationby the related grid code
Selection of time range
Selection of measuring point
Selection of measuring characteristicand the desired diagram type
Direct processing to reportsReport formats: .txt, .rtf, .html, .xml, .pdf
Selection of the characteristicevaluated by the related grid codeand the desired diagram type
PQ11-0114.EN.ai
Fig. 7/11 SICAM PQ Analyzer: PQ explorer
Time based overview of all scheduled reports
Direct access to scheduled reports double click on status field
Status of scheduled reportsGreen:
No PQ violation occurredMeasured data are complete
Red:Minimum of one PQ violationReport not yet finishedGap of measured data
PQ11-0115.EN.ai
Fig. 7/12 SICAM PQ Analyzer: Report browser
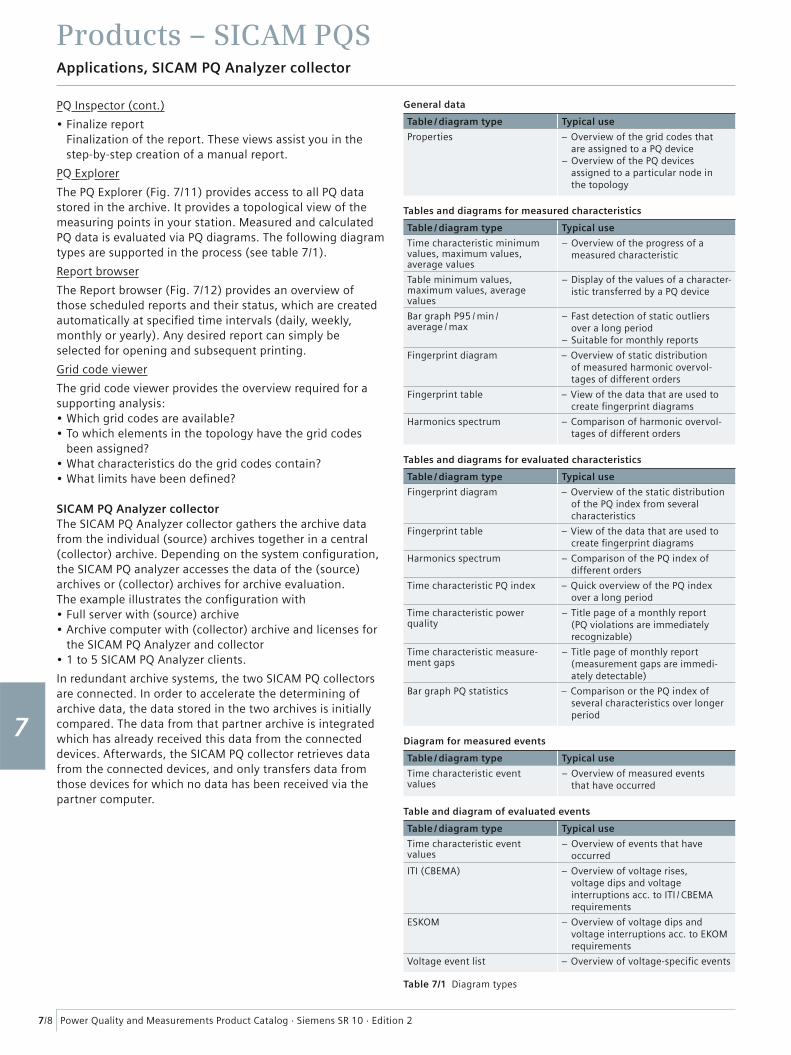
Power Quality and Measurements Product Catalog · Siemens SR 10 · Edition 2
Products – SICAM PQS
7/8
1
2
3
4
5
6
7
8
9
Applications, SICAM PQ Analyzer collector
PQ Inspector (cont.)
• Finalize reportFinalization of the report. These views assist you in the step-by-step creation of a manual report.
PQ Explorer
The PQ Explorer (Fig. 7/11) provides access to all PQ data stored in the archive. It provides a topological view of the measuring points in your station. Measured and calculated PQ data is evaluated via PQ diagrams. The following diagram types are supported in the process (see table 7/1).
Report browser
The Report browser (Fig. 7/12) provides an overview of those scheduled reports and their status, which are created automatically at specifi ed time intervals (daily, weekly, monthly or yearly). Any desired report can simply be selected for opening and subsequent printing.
Grid code viewer
The grid code viewer provides the overview required for a supporting analysis:• Which grid codes are available?• To which elements in the topology have the grid codes
been assigned?• What characteristics do the grid codes contain?• What limits have been defi ned?
SICAM PQ Analyzer collectorThe SICAM PQ Analyzer collector gathers the archive data from the individual (source) archives together in a central (collector) archive. Depending on the system confi guration, the SICAM PQ analyzer accesses the data of the (source) archives or (collector) archives for archive evaluation. The example illustrates the confi guration with• Full server with (source) archive• Archive computer with (collector) archive and licenses for
the SICAM PQ Analyzer and collector• 1 to 5 SICAM PQ Analyzer clients.
In redundant archive systems, the two SICAM PQ collectors are connected. In order to accelerate the determining of archive data, the data stored in the two archives is initially compared. The data from that partner archive is integrated which has already received this data from the connected devices. Afterwards, the SICAM PQ collector retrieves data from the connected devices, and only transfers data from those devices for which no data has been received via the partner computer.
General data
Table / diagram type Typical use
Properties – Overview of the grid codes that are assigned to a PQ device
– Overview of the PQ devices assigned to a particular node in the topology
Tables and diagrams for measured characteristics
Table / diagram type Typical use
Time characteristic minimum values, maximum values, average values
– Overview of the progress of a measured characteristic
Table minimum values, maximum values, average values
– Display of the values of a character-istic transferred by a PQ device
Bar graph P95 / min / average / max
– Fast detection of static outliers over a long period
– Suitable for monthly reports
Fingerprint diagram – Overview of static distribution of measured harmonic overvol-tages of different orders
Fingerprint table – View of the data that are used to create fi ngerprint diagrams
Harmonics spectrum – Comparison of harmonic overvol-tages of different orders
Tables and diagrams for evaluated characteristics
Table / diagram type Typical use
Fingerprint diagram – Overview of the static distribution of the PQ index from several characteristics
Fingerprint table – View of the data that are used to create fi ngerprint diagrams
Harmonics spectrum – Comparison of the PQ index of different orders
Time characteristic PQ index – Quick overview of the PQ index over a long period
Time characteristic power quality
– Title page of a monthly report (PQ violations are immediately recognizable)
Time characteristic measure-ment gaps
– Title page of monthly report (measurement gaps are immedi-ately detectable)
Bar graph PQ statistics – Comparison or the PQ index of several characteristics over longer period
Diagram for measured events
Table / diagram type Typical use
Time characteristic event values
– Overview of measured events that have occurred
Table and diagram of evaluated events
Table / diagram type Typical use
Time characteristic event values
– Overview of events that have occurred
ITI (CBEMA) – Overview of voltage rises, voltage dips and voltage interruptions acc. to ITI / CBEMA requirements
ESKOM – Overview of voltage dips and voltage interruptions acc. to EKOM requirements
Voltage event list – Overview of voltage-specifi c events
Table 7/1 Diagram types

Power Quality and Measurements Product Catalog · Siemens SR 10 · Edition 2
Products – SICAM PQS
7/9
1
2
3
4
5
6
7
8
9
SICAM PQ Analyzer collector, architecture and confi guration
ArchitectureThanks to its modular system structure, SICAM PQS is suit-able for multiple use in power supply utilities or industrial facilities.SICAM PQS can be set up in many variants:• Full server with (source) archive and SICAM PQ Analyzer• System with
– Full servers with (source) archive – SICAM PQ Analyzer clients
• System with – Full servers – Archive computers with (collector) archive – SICAM PQ Analyzer clients.
The number of components which can be used in a system depends on the individual license.
(Source) archiveThe full server collects PQ measuring data and fault records from connected devices, and stores them in its local (source) archive. This archive data can be directly evaluated by one or more SICAM PQ Analyzers.
(Collector) archiveIn distributed systems with one or more full servers, the data of the (source) archives is collected by the SICAM PQ Analyzer collector and stored in a central (collector) archive on an archive computer.This archive data is evaluated by one or more SICAM PQ Analyzer(s).
Confi guration
Operating systemsThe following operating systems are supported:• Windows XP Professional SP3 (32-Bit)• Windows Server 2003 R2 Standard SP2 (32-Bit)• Windows 7 Professional SP1 (32-Bit or 64-Bit)
– only in Windows-classic design• Windows Server 2008 Standard SP2 (32-Bit) without
Hyper-V – only in Windows-classic design• Windows Server 2008 R2 Standard SP1 (64-Bit)
– only in Windows-classic design• Windows Embedded Standard
(SICAM Station Unit V2.20, 32-Bit).
Hardware requirementsComputer with• Processor
– At least Intel Pentium Celeron 1.86 GHz – Recommended for SICAM PQS Intel Core Duo 2 GHz – Engineering for large installations Intel Core 2 Duo 3 GHz
• RAM size – At least 2 GB – Recommended for SICAM PQS 4 GB – Engineering of large installations 4 GB
• Hard disk capacity – At least 2 GB not including archive size
• Graphics card: – At least SVGA (16 MB), 1024 × 768 – Recommended SXGA (32 MB), 1280 × 1024
• Monitor matching graphics card• DVD drive• Keyboard• Mouse• USB port for dongle• Network interface.
Note:Computers with multi-core processors are supported. Computers with multi-processor main boards are only supported in single-processor operation.
SICAM PQ Analyzeranalyzer clients
Archive computer with(collector) archive
Full server with(source) archive
PQ devices, fault recorders, and protection relays PQ1
1-0
10
2.E
N.a
i
Fig. 7/13 Architecture

Power Quality and Measurements Product Catalog · Siemens SR 10 · Edition 2
Products – SICAM PQS
7/10
1
2
3
4
5
6
7
8
9
Selection and ordering data
Table 7/2 Selection and ordering data
Description Order No. Precondition
SICAM PQS V7.0 BundlesBase package plus one application. Base packages & Bundles will be delivered with USB dongles (MLFB position 8=”1”)
Supporting up to 4 devices
SICAM PQS (SICAM Q80) 7KE9000-1RA10-7BA0
SICAM PQS (SIMEAS R) 7KE9000-1RA10-7CA0
SICAM PQS (IEC 61850 (monitoring direction)) 7KE9000-1RA10-7DA0
Supporting up to 15 devices
SICAM PQS (SICAM Q80) 7KE9000-1MA10-7BA0
SICAM PQS (SIMEAS R) 7KE9000-1MA10-7CA0
SICAM PQS (IEC 61850 (monitoring direction)) 7KE9000-1MA10-7DA0
Supporting more than 15 devices
SICAM PQS (SICAM Q80) 7KE9000-1AA10-7BA0
SICAM PQS (SIMEAS R) 7KE9000-1AA10-7CA0
SICAM PQS (IEC 61850 (monitoring direction)) 7KE9000-1AA10-7DA0
SICAM PQS V7.0 upgrades
Functional upgrades with respect to number of supported devices
“Full Server” (Runtime) (up to 15 devices) 6MD9004-0RA10-7AA0 7KE9000-1RA10-7.A0
“Full Server” (Runtime) (more than 15 devices) 6MD9004-0MA10-7AA0 7KE9000-1MA10-7.A0
SICAM PQS V7.0 options & addons
Master protocols Power Quality
SIMEAS R Master 7KE9000-0CB11-7AA0
SICAM Q80 7KE9000-0CB12-7AA0
Master protocols Power Automation (monitoring direction)
IEC 60870-5-103 Master (monitoring direction) 6MD9000-0CB00-7MA0
Client IEC 61850 (monitoring direction) 6MD9000-0CE00-7MA0
Applications power quality
Automatic Comtrade Import 7KE9000-0BA60-7AA0
Automatic Comtrade Export 7KE9000-0BA61-7AA0
Automatic PQDIF Import 7KE9000-0BA62-7AA0
Automatic PQDIF Export 7KE9000-0BA63-7AA0
Automatic Report Export 7KE9000-0BA64-7AA0
Automatic Fault Location 7KE9000-0BA65-7AA0
Notifi cation (E-Mail, SMS) 7KE9000-0BA66-7AA0
Automatic Grid Code Evaluation 7KE9000-0BA67-7AA0
Scheduled PQ Reports * 7KE9000-0BA68-7AA0
* only makes sense in combination with the following license:Automatic GridCode Evaluation
Note:The SICAM PQS system can be extended with SICAM PAS applications. For confi guring such a system a confi guration license is needed.Either the existing runtime license can be expanded with a confi guration license [➝ a)]or the confi guration can be done on a separate confi guration PC [➝ b)]
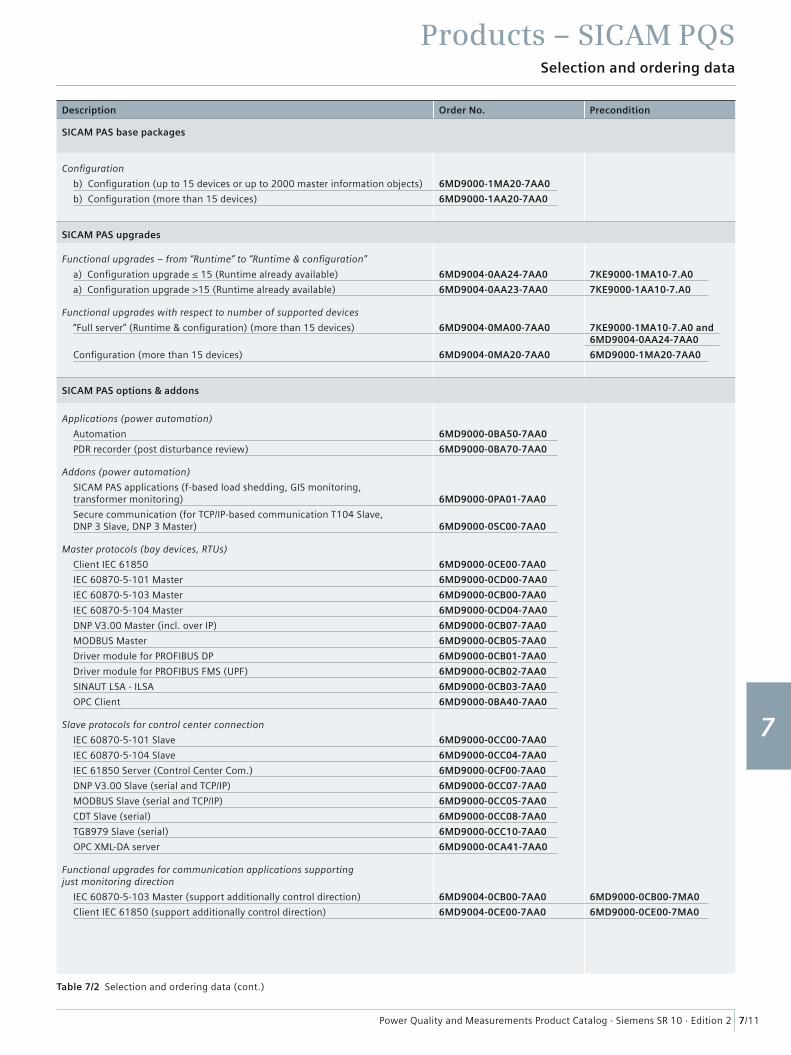
Power Quality and Measurements Product Catalog · Siemens SR 10 · Edition 2
Products – SICAM PQS
7/11
1
2
3
4
5
6
7
8
9
Selection and ordering data
Table 7/2 Selection and ordering data (cont.)
Description Order No. Precondition
SICAM PAS base packages
Confi guration
b) Confi guration (up to 15 devices or up to 2000 master information objects) 6MD9000-1MA20-7AA0
b) Confi guration (more than 15 devices) 6MD9000-1AA20-7AA0
SICAM PAS upgrades
Functional upgrades – from “Runtime” to “Runtime & confi guration”
a) Confi guration upgrade ≤ 15 (Runtime already available) 6MD9004-0AA24-7AA0 7KE9000-1MA10-7.A0
a) Confi guration upgrade >15 (Runtime already available) 6MD9004-0AA23-7AA0 7KE9000-1AA10-7.A0
Functional upgrades with respect to number of supported devices
“Full server” (Runtime & confi guration) (more than 15 devices) 6MD9004-0MA00-7AA0 7KE9000-1MA10-7.A0 and 6MD9004-0AA24-7AA0
Confi guration (more than 15 devices) 6MD9004-0MA20-7AA0 6MD9000-1MA20-7AA0
SICAM PAS options & addons
Applications (power automation)
Automation 6MD9000-0BA50-7AA0
PDR recorder (post disturbance review) 6MD9000-0BA70-7AA0
Addons (power automation)
SICAM PAS applications (f-based load shedding, GIS monitoring, transformer monitoring) 6MD9000-0PA01-7AA0
Secure communication (for TCP/IP-based communication T104 Slave, DNP 3 Slave, DNP 3 Master) 6MD9000-0SC00-7AA0
Master protocols (bay devices, RTUs)
Client IEC 61850 6MD9000-0CE00-7AA0
IEC 60870-5-101 Master 6MD9000-0CD00-7AA0
IEC 60870-5-103 Master 6MD9000-0CB00-7AA0
IEC 60870-5-104 Master 6MD9000-0CD04-7AA0
DNP V3.00 Master (incl. over IP) 6MD9000-0CB07-7AA0
MODBUS Master 6MD9000-0CB05-7AA0
Driver module for PROFIBUS DP 6MD9000-0CB01-7AA0
Driver module for PROFIBUS FMS (UPF) 6MD9000-0CB02-7AA0
SINAUT LSA - ILSA 6MD9000-0CB03-7AA0
OPC Client 6MD9000-0BA40-7AA0
Slave protocols for control center connection
IEC 60870-5-101 Slave 6MD9000-0CC00-7AA0
IEC 60870-5-104 Slave 6MD9000-0CC04-7AA0
IEC 61850 Server (Control Center Com.) 6MD9000-0CF00-7AA0
DNP V3.00 Slave (serial and TCP/IP) 6MD9000-0CC07-7AA0
MODBUS Slave (serial and TCP/IP) 6MD9000-0CC05-7AA0
CDT Slave (serial) 6MD9000-0CC08-7AA0
TG8979 Slave (serial) 6MD9000-0CC10-7AA0
OPC XML-DA server 6MD9000-0CA41-7AA0
Functional upgrades for communication applications supporting just monitoring direction
IEC 60870-5-103 Master (support additionally control direction) 6MD9004-0CB00-7AA0 6MD9000-0CB00-7MA0
Client IEC 61850 (support additionally control direction) 6MD9004-0CE00-7AA0 6MD9000-0CE00-7MA0

Power Quality and Measurements Product Catalog · Siemens SR 10 · Edition 2
Products – SICAM PQS
7/12
1
2
3
4
5
6
7
8
9
Selection and ordering data
Description Order No.
SICAM PQ Analyzer V2.0
Incident Explorer for evaluation of fault records
Usage on SICAM PAS fullserver 6MD5530-0AA10-2AA0
Up to 5 clients, archive transfer from 1 server/fullserver 6MD5530-0AA10-2BA0
Up to 5 clients, archive transfer from up to 5 server/fullserver 6MD5530-0AA10-2BB0
Up to 5 clients, archive transfer from more than 5 server/fullserver 6MD5530-0AA10-2BC0
More than 5 clients, archive transfer from 1 server/fullserver 6MD5530-0AA10-2CA0
More than 5 clients, archive transfer from up to 5 server/fullserver 6MD5530-0AA10-2CB0
More than 5 clients, archive transfer from more than 5 server/fullserver 6MD5530-0AA10-2CC0
Hints: – two redundant PAS/PQS Fullserver count as 1 Server. – SIMEAS R provides not only fault records but also continuous records which are managed with the PQ Explorer. –> for a complete evaluation of SIMEAS R-data at least the usage of PQ Basic is recommended.
PQ Basic 1)
including Incident Explorer for evaluation of fault records and PQ Explorer
Usage on SICAM PAS fullserver 7KE9200-0BA10-2AA0Up to 5 clients, archive transfer from 1 server/fullserver 7KE9200-0BA10-2BA0Up to 5 clients, archive transfer from up to 5 server/fullserver 7KE9200-0BA10-2BB0Up to 5 clients, archive transfer from more than 5 server/fullserver 7KE9200-0BA10-2BC0More than 5 clients, archive transfer from 1 server/fullserver 7KE9200-0BA10-2CA0More than 5 clients, archive transfer from up to 5 server/fullserver 7KE9200-0BA10-2CB0More than 5 clients, archive transfer from more than 5 server/fullserver 7KE9200-0BA10-2CC0
PQ Standard 1) 2)
including PQ Basic and enhanced PQ Explorer and Report Browser
Usage on SICAM PAS fullserver 7KE9200-0CA10-2AA0Up to 5 clients, archive transfer from 1 server/fullserver 7KE9200-0CA10-2BA0Up to 5 clients, archive transfer from up to 5 server/fullserver 7KE9200-0CA10-2BB0Up to 5 clients, archive transfer from more than 5 server/fullserver 7KE9200-0CA10-2BC0More than 5 clients, archive transfer from 1 server/fullserver 7KE9200-0CA10-2CA0More than 5 clients, archive transfer from up to 5 server/fullserver 7KE9200-0CA10-2CB0More than 5 clients, archive transfer from more than 5 server/fullserver 7KE9200-0CA10-2CC0
PQ Professional 1) 2)
including PQ Standard and PQ Inspector
Usage on SICAM PAS fullserver 7KE9200-0DA10-2AA0Up to 5 clients, archive transfer from 1 server/fullserver 7KE9200-0DA10-2BA0Up to 5 clients, archive transfer from up to 5 server/fullserver 7KE9200-0DA10-2BB0Up to 5 clients, archive transfer from more than 5 server/fullserver 7KE9200-0DA10-2BC0More than 5 clients, archive transfer from 1 server/fullserver 7KE9200-0DA10-2CA0
More than 5 clients, archive transfer from up to 5 server/fullserver 7KE9200-0DA10-2CB0
More than 5 clients, archive transfer from more than 5 server/fullserver 7KE9200-0DA10-2CC0
Functional upgradesPower Quality – features
From Incident Explorer to PQ Basic 7KE9200-4BA00-2AA0
From PQ Basic to PQ Standard 7KE9200-4CB00-2AA0
From PQ Basic to PQ Professional 7KE9200-4DB00-2AA0
From PQ Standard to PQ Professional 7KE9200-4DC00-2AA0
Number of clients
Up to 5 clients 6MD5530-4AA00-2BA0
More than 5 clients 6MD5530-4AA00-2CA0
Number of fullserver
Up to 5 fullserver 6MD5530-4AA00-2AB0
More than 5 fullserver 6MD5530-4AA00-2AC0
Version upgrade
Version upgrade to SICAM PQ Explorer V2.0 (from SICAM Recpro V6.0) 6MD5530-3AA00-2AA0
Table 7/2 Selection and ordering data
Hint for all SICAM PQ Analyzer packages: SICAM PQ Analyzer can be extended with SIGRA (separate ordering) for enhanced fault record analysis
1) Recommended SICAM PAS/PQS options: “Automatic Grid Code Evaluation” <–> 7KE9000-0BA67-7AA02) Recommended SICAM PAS/PQS options: “Scheduled PQ Reports” <–> 7KE9000-0BA68-7AA0

Energy Automation
Answers for infrastructure and cities.
SIGUARD PDP Phasor Data Processing
Power Quality and Measurements Product Catalog · Siemens SR 10 · Edition 2 8/2
Contents – SIGUARD PDP
1
2
3
4
5
6
7
8
9
Page
Description and applications 8/3
Synchrophasor technology, PMU 8/6
SIGUARD system structure 8/7
Selection and ordering data 8/10
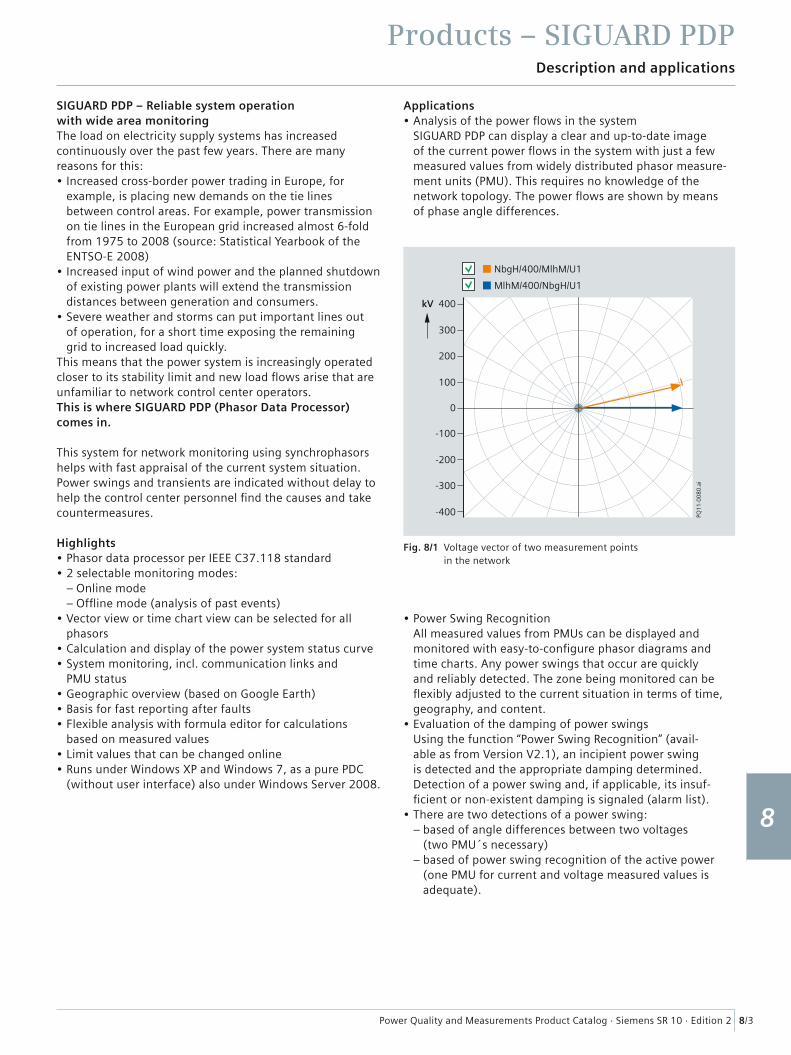
Power Quality and Measurements Product Catalog · Siemens SR 10 · Edition 2
Products – SIGUARD PDP
8/3
Description and applications
1
2
3
4
5
6
7
8
9
SIGUARD PDP – Reliable system operation with wide area monitoringThe load on electricity supply systems has increased continuously over the past few years. There are many reasons for this:• Increased cross-border power trading in Europe, for
example, is placing new demands on the tie lines between control areas. For example, power transmission on tie lines in the European grid increased almost 6-fold from 1975 to 2008 (source: Statistical Yearbook of the ENTSO-E 2008)
• Increased input of wind power and the planned shutdown of existing power plants will extend the transmission distances between generation and consumers.
• Severe weather and storms can put important lines out of operation, for a short time exposing the remaining grid to increased load quickly.
This means that the power system is increasingly operated closer to its stability limit and new load fl ows arise that are unfamiliar to network control center operators.This is where SIGUARD PDP (Phasor Data Processor) comes in.
This system for network monitoring using synchrophasors helps with fast appraisal of the current system situation. Power swings and transients are indicated without delay to help the control center personnel fi nd the causes and take countermeasures.
Highlights• Phasor data processor per IEEE C37.118 standard• 2 selectable monitoring modes:
– Online mode – Offl ine mode (analysis of past events)
• Vector view or time chart view can be selected for all p hasors
• Calculation and display of the power system status curve• System monitoring, incl. communication links and
PMU status• Geographic overview (based on Google Earth)• Basis for fast reporting after faults• Flexible analysis with formula editor for calculations
based on measured values• Limit values that can be changed online• Runs under Windows XP and Windows 7, as a pure PDC
(without user interface) also under Windows Server 2008.
Applications• Analysis of the power fl ows in the system
SIGUARD PDP can display a clear and up-to-date image of the current power fl ows in the system with just a few measured values from widely distributed phasor measure-ment units (PMU). This requires no knowledge of the network topology. The power fl ows are shown by means of phase angle differences.
• Power Swing RecognitionAll measured values from PMUs can be displayed and monitored with easy-to-confi gure phasor diagrams and time charts. Any power swings that occur are quickly and reliably detected. The zone being monitored can be fl exibly adjusted to the current situation in terms of time, geography, and content.
• Evaluation of the damping of power swingsUsing the function “Power Swing Recognition” (avail-able as from Version V2.1), an incipient power swing is detected and the appropriate damping determined. Detection of a power swing and, if applicable, its insuf-fi cient or non-existent damping is signaled (alarm list).
• There are two detections of a power swing: – based of angle differences between two voltages (two PMU´s necessary) – based of power swing recognition of the active power (one PMU for current and voltage measured values is adequate).
kV 400
300
200
100
-100
-200
-300
-400
0
PQ1
1-0
08
0.a
i
MlhM/400/NbgH/U1
NbgH/400/MlhM/U1
Fig. 8/1 Voltage vector of two measurement points in the network
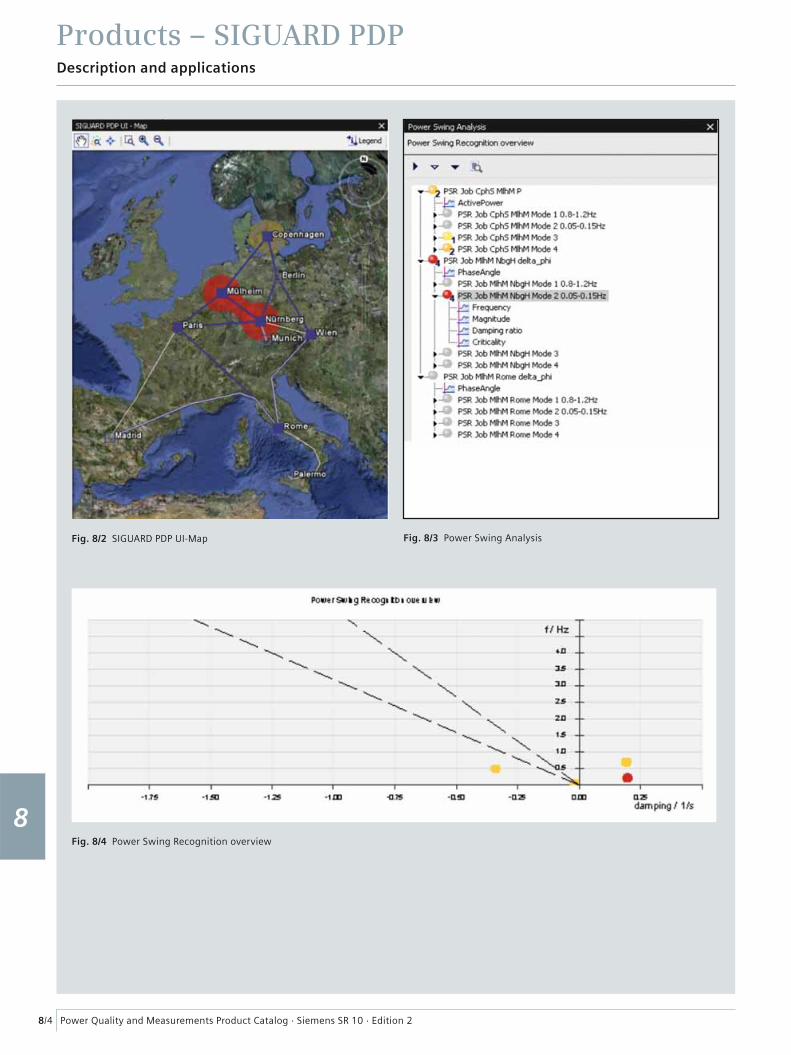
Power Quality and Measurements Product Catalog · Siemens SR 10 · Edition 2
Products – SIGUARD PDP
8/4
Description and applications
1
2
3
4
5
6
7
8
9
Fig. 8/2 SIGUARD PDP UI-Map
Fig. 8/4 Power Swing Recognition overview
Fig. 8/3 Power Swing Analysis

Power Quality and Measurements Product Catalog · Siemens SR 10 · Edition 2
Products – SIGUARD PDP
8/5
Description and applications
1
2
3
4
5
6
7
8
9
Applications (cont.)
• Monitoring of the load on transmission corridors.The voltage-stability curve is especially suitable for displaying the instantaneous load on a transmission corridor. The currently measured operating point is shown on the work curve of the line (voltage as a function of the transmitted power). In this way, the remaining reserve can be shown at any time. This requires PMUs at both ends of the line.
• Island state detectionThis function automatically indicates if parts of the network become detached from the rest of the network. For this purpose, frequency differences and rates of frequency changes can be automatically monitored. If islands are detected, warnings and event messages are output. Additionally, the area of the islands are marked in color in the graphic overview.
11:09:52.... 2010-... Island detection
ISD potential network subsplit
appearing
11:09:52.... 2010-... Island detection
ISD network subsplit
appearing
11:09:52.... 2010-... Island detection
ISD potential network subsplit
disap-pearing
• Retrospective event analysisSIGUARD PDP is ideal for analyzing critical events in the network. After switchover to offl ine mode, the entire archive can be systematically analyzed and the events played back as often as necessary. This makes dynamic events transparent, and reports can be quickly and precisely compiled. Simply copy the informative diagrams from SIGUARD PDP into your reports.
• Alarming on limit value violation with an alarm list and color change in the geographic network overview map. This allows you to locate the position and cause of the disturbance quickly. This function is also available for analyzing the archive.
• Display of the power system status as a characteristic value for the stability of the power system.Due to the constant availability of the power system status curve in the upper part of the screen, the operator is constantly informed about trends in system dynamics and any remaining reserves. This curve shows a weighted average of the distances of all measured values, to their limit values.
kV
GW
400
500
300
200
100
0 SIG
_00
02
.EN
.ai
MlhM to NbgH
0.00 0.50-0.50-1.00-1.50 1.00 1.50
Fig. 8/5 Voltage stability curve
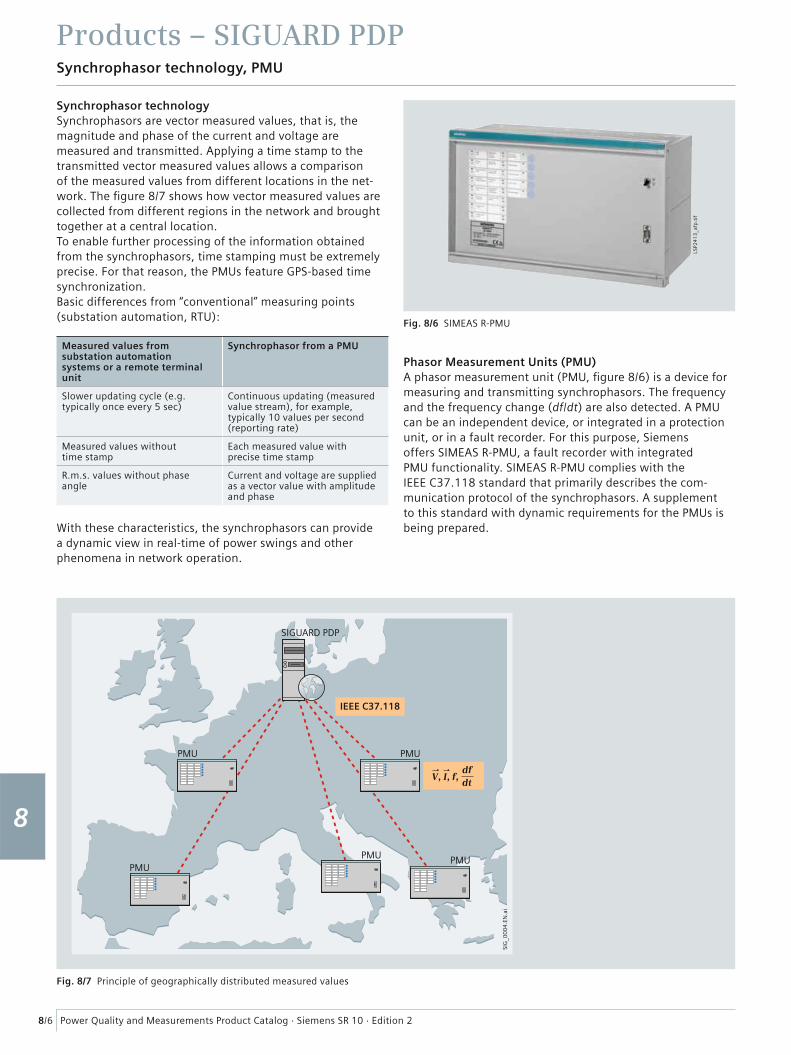
Power Quality and Measurements Product Catalog · Siemens SR 10 · Edition 2
Products – SIGUARD PDP
8/6
Synchrophasor technology, PMU
1
2
3
4
5
6
7
8
9
Synchrophasor technologySynchrophasors are vector measured values, that is, the magnitude and phase of the current and voltage are measured and transmitted. Applying a time stamp to the transmitted vector measured values allows a comparison of the measured values from different locations in the net-work. The fi gure 8/7 shows how vector measured values are collected from different regions in the network and brought together at a central location.To enable further processing of the information obtained from the synchrophasors, time stamping must be extremely precise. For that reason, the PMUs feature GPS-based time synchronization.Basic differences from “conventional” measuring points (substation automation, RTU):
Measured values from substation automation systems or a remote terminal unit
Synchrophasor from a PMU
Slower updating cycle (e.g. typically once every 5 sec)
Continuous updating (measured value stream), for example, typically 10 values per second (reporting rate)
Measured values without time stamp
Each measured value with p recise time stamp
R.m.s. values without phase angle
Current and voltage are supplied as a vector value with amplitude and phase
With these characteristics, the synchrophasors can provide a dynamic view in real-time of power swings and other phenomena in network operation.
Phasor Measurement Units (PMU)A phasor measurement unit (PMU, fi gure 8/6) is a device for measuring and transmitting synchrophasors. The frequency and the frequency change (df/dt) are also detected. A PMU can be an independent device, or integrated in a protection unit, or in a fault recorder. For this purpose, Siemens offers SIMEAS R-PMU, a fault recorder with integrated PMU functionality. SIMEAS R-PMU complies with the IEEE C37.118 standard that primarily describes the com-munication protocol of the synchrophasors. A supplement to this standard with dynamic requirements for the PMUs is being prepared.
IEEE C37.118
SIGUARD PDP
PMU
PMUPMU
PMU
PMU
SIG
_00
04
.EN
.ai
V, I, f,dfdt
Fig. 8/7 Principle of geographically distributed measured values
Fig. 8/6 SIMEAS R-PMU
LSP2
41
3_a
fp.t
if
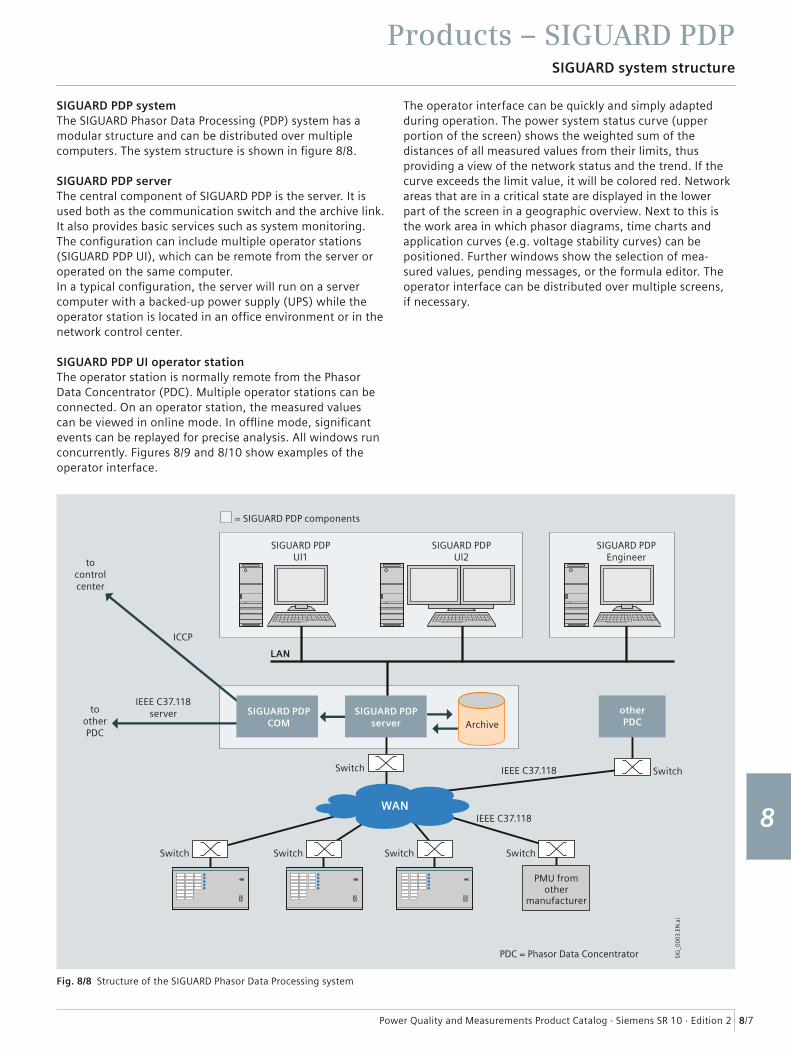
Power Quality and Measurements Product Catalog · Siemens SR 10 · Edition 2
Products – SIGUARD PDP
8/7
SIGUARD system structure
1
2
3
4
5
6
7
8
9
SIGUARD PDP systemThe SIGUARD Phasor Data Processing (PDP) system has a modular structure and can be distributed over multiple computers. The system structure is shown in fi gure 8/8.
SIGUARD PDP serverThe central component of SIGUARD PDP is the server. It is used both as the communication switch and the archive link. It also provides basic services such as system monitoring. The confi guration can include multiple operator stations (SIGUARD PDP UI), which can be remote from the server or operated on the same computer.In a typical confi guration, the server will run on a server computer with a backed-up power supply (UPS) while the operator station is located in an offi ce environment or in the network control center.
SIGUARD PDP UI operator stationThe operator station is normally remote from the Phasor Data Concentrator (PDC). Multiple operator stations can be connected. On an operator station, the measured values can be viewed in online mode. In offl ine mode, signifi cant events can be replayed for precise analysis. All windows run concurrently. Figures 8/9 and 8/10 show examples of the operator interface.
The operator interface can be quickly and simply adapted during operation. The power system status curve (upper portion of the screen) shows the weighted sum of the distances of all measured values from their limits, thus providing a view of the network status and the trend. If the curve exceeds the limit value, it will be colored red. Network areas that are in a critical state are displayed in the lower part of the screen in a geographic overview. Next to this is the work area in which phasor diagrams, time charts and application curves (e.g. voltage stability curves) can be positioned. Further windows show the selection of mea-sured values, pending messages, or the formula editor. The operator interface can be distributed over multiple screens, if necessary.
SIGUARD PDPUl1
SIGUARD PDPUl2
SIGUARD PDPEngineer
LAN
Switch Switch
WAN
Switch Switch Switch Switch
ICCP
IEEE C37.118
IEEE C37.118
PDC = Phasor Data Concentrator
Archive
SIG
_00
03
.EN
.ai
= SIGUARD PDP components
IEEE C37.118server
tocontrolcenter
tootherPDC
SIGUARD PDPCOM
SIGUARD PDPserver
otherPDC
PMU fromother
manufacturer
Fig. 8/8 Structure of the SIGUARD Phasor Data Processing system

Power Quality and Measurements Product Catalog · Siemens SR 10 · Edition 2
Products – SIGUARD PDP
8/8
SIGUARD system structure
1
2
3
4
5
6
7
8
9
Fig. 8/9 User interface of SIGUARD PDP (example 1, online)
Fig. 8/10 Operator interface of SIGUARD PDP (example 2, offl ine)
SR1
0-0
09
.tif
SR1
0-0
10
.tif

Power Quality and Measurements Product Catalog · Siemens SR 10 · Edition 2
Products – SIGUARD PDP
8/9
SIGUARD system structure
1
2
3
4
5
6
7
8
9
SIGUARD PDP COMThis system module provides the communications link to the other PDCs. Again, protocol IEEE C37.118 is used. SIGUARD PDP COM sends the confi gured data to up to fi ve recipients at a settable transmission rate (frames per second). The transmission rates can be set separately, and the measured values to be transmitted can be selected from all the available PMU measured values for each channel.
SIGUARD PDP EngineerSIGUARD PDP Engineer is a user-friendly confi guration tool for the entire SIGUARD PDP system. The fi ve work areas on the main screen clearly designate the task groups:• PMU confi guration• Mathematical calculations• Graphics for the geographical overview• Applications (voltage stability curve, island state
d etection)• Communication, data distribution.
An integrated plausibility check ensures the consistency of the confi guration.
Power swing recognitionPower swing recognition analyzes the progression of the active power curve and outputs alarm messages if damping is too low or negative.
Communication links• IEEE C37.118 server / client• OPC-to-OPC clients (application: automation functions)• ICCP (to network control centers).
Fig. 8/11 SIGUARD PDP Engineer
SR1
0-0
11
.tif
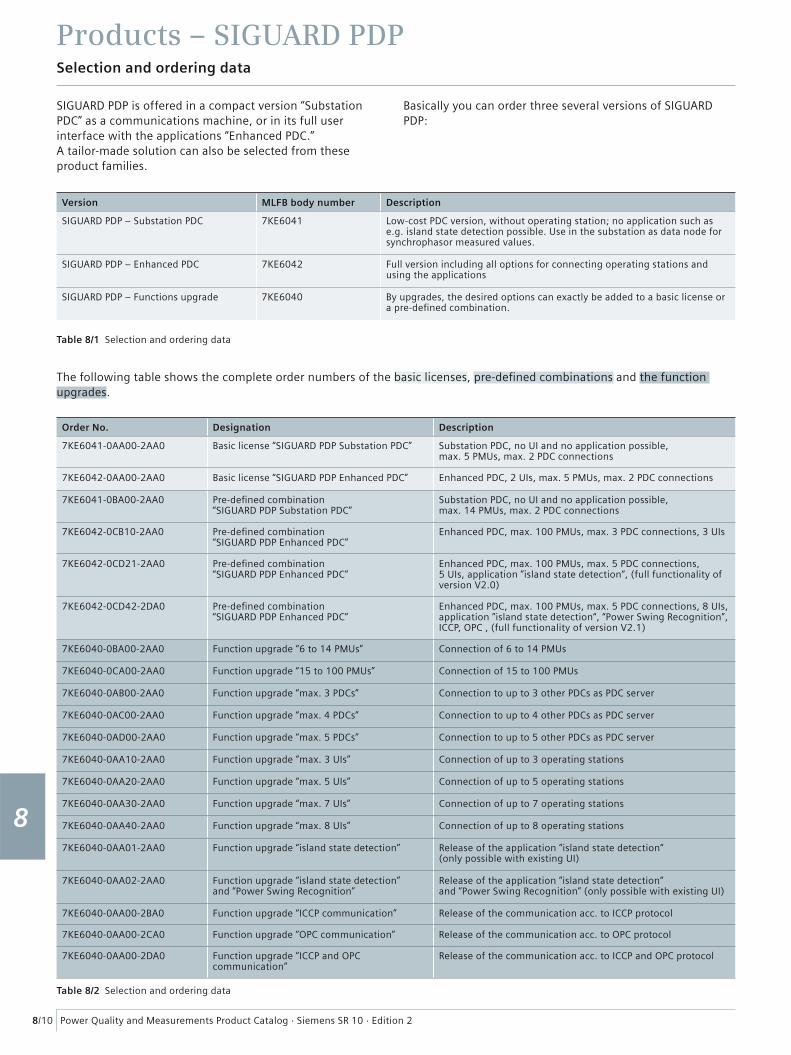
Power Quality and Measurements Product Catalog · Siemens SR 10 · Edition 2
Products – SIGUARD PDP
8/10
Selection and ordering data
1
2
3
4
5
6
7
8
9
SIGUARD PDP is offered in a compact version “Substation PDC” as a communications machine, or in its full user interface with the applications “Enhanced PDC.”A tailor-made solution can also be selected from these product families.
Basically you can order three several versions of SIGUARD PDP:
Version MLFB body number Description
SIGUARD PDP – Substation PDC 7KE6041 Low-cost PDC version, without operating station; no application such as e.g. island state detection possible. Use in the substation as data node for synchrophasor measured values.
SIGUARD PDP – Enhanced PDC 7KE6042 Full version including all options for connecting operating stations and using the applications
SIGUARD PDP – Functions upgrade 7KE6040 By upgrades, the desired options can exactly be added to a basic license or a pre-defi ned combination.
The following table shows the complete order numbers of the basic licenses, pre-defi ned combinations and the function upgrades.
Order No. Designation Description
7KE6041-0AA00-2AA0 Basic license “SIGUARD PDP Substation PDC” Substation PDC, no UI and no application possible, max. 5 PMUs, max. 2 PDC connections
7KE6042-0AA00-2AA0 Basic license “SIGUARD PDP Enhanced PDC” Enhanced PDC, 2 UIs, max. 5 PMUs, max. 2 PDC connections
7KE6041-0BA00-2AA0 Pre-defi ned combination “SIGUARD PDP Substation PDC”
Substation PDC, no UI and no application possible, max. 14 PMUs, max. 2 PDC connections
7KE6042-0CB10-2AA0 Pre-defi ned combination “SIGUARD PDP Enhanced PDC”
Enhanced PDC, max. 100 PMUs, max. 3 PDC connections, 3 UIs
7KE6042-0CD21-2AA0 Pre-defi ned combination “SIGUARD PDP Enhanced PDC”
Enhanced PDC, max. 100 PMUs, max. 5 PDC connections, 5 UIs, application ”island state detection“, (full functionality of version V2.0)
7KE6042-0CD42-2DA0 Pre-defi ned combination “SIGUARD PDP Enhanced PDC”
Enhanced PDC, max. 100 PMUs, max. 5 PDC connections, 8 UIs,application ”island state detection“, “Power Swing Recognition”, ICCP, OPC , (full functionality of version V2.1)
7KE6040-0BA00-2AA0 Function upgrade “6 to 14 PMUs” Connection of 6 to 14 PMUs
7KE6040-0CA00-2AA0 Function upgrade “15 to 100 PMUs” Connection of 15 to 100 PMUs
7KE6040-0AB00-2AA0 Function upgrade “max. 3 PDCs” Connection to up to 3 other PDCs as PDC server
7KE6040-0AC00-2AA0 Function upgrade “max. 4 PDCs” Connection to up to 4 other PDCs as PDC server
7KE6040-0AD00-2AA0 Function upgrade “max. 5 PDCs” Connection to up to 5 other PDCs as PDC server
7KE6040-0AA10-2AA0 Function upgrade “max. 3 UIs” Connection of up to 3 operating stations
7KE6040-0AA20-2AA0 Function upgrade “max. 5 UIs” Connection of up to 5 operating stations
7KE6040-0AA30-2AA0 Function upgrade “max. 7 UIs” Connection of up to 7 operating stations
7KE6040-0AA40-2AA0 Function upgrade “max. 8 UIs” Connection of up to 8 operating stations
7KE6040-0AA01-2AA0 Function upgrade “island state detection” Release of the application “island state detection“ (only possible with existing UI)
7KE6040-0AA02-2AA0 Function upgrade “island state detection” and “Power Swing Recognition”
Release of the application “island state detection“ and “Power Swing Recognition” (only possible with existing UI)
7KE6040-0AA00-2BA0 Function upgrade “ICCP communication” Release of the communication acc. to ICCP protocol
7KE6040-0AA00-2CA0 Function upgrade “OPC communication” Release of the communication acc. to OPC protocol
7KE6040-0AA00-2DA0 Function upgrade “ICCP and OPC communication”
Release of the communication acc. to ICCP and OPC protocol
Table 8/1 Selection and ordering data
Table 8/2 Selection and ordering data

Energy Automation
Answers for infrastructure and cities.
DAKON PQS Data Concentrator for SICAM PQS

Power Quality and Measurements Product Catalog · Siemens SR 10 · Edition 2 9/2
1
2
3
4
5
6
7
8
9
Contents – DAKON PQS
Page
Description 9/3
Special features of DAKON PQS 9/4
Selection and ordering data 9/4
Legal notice 9/5
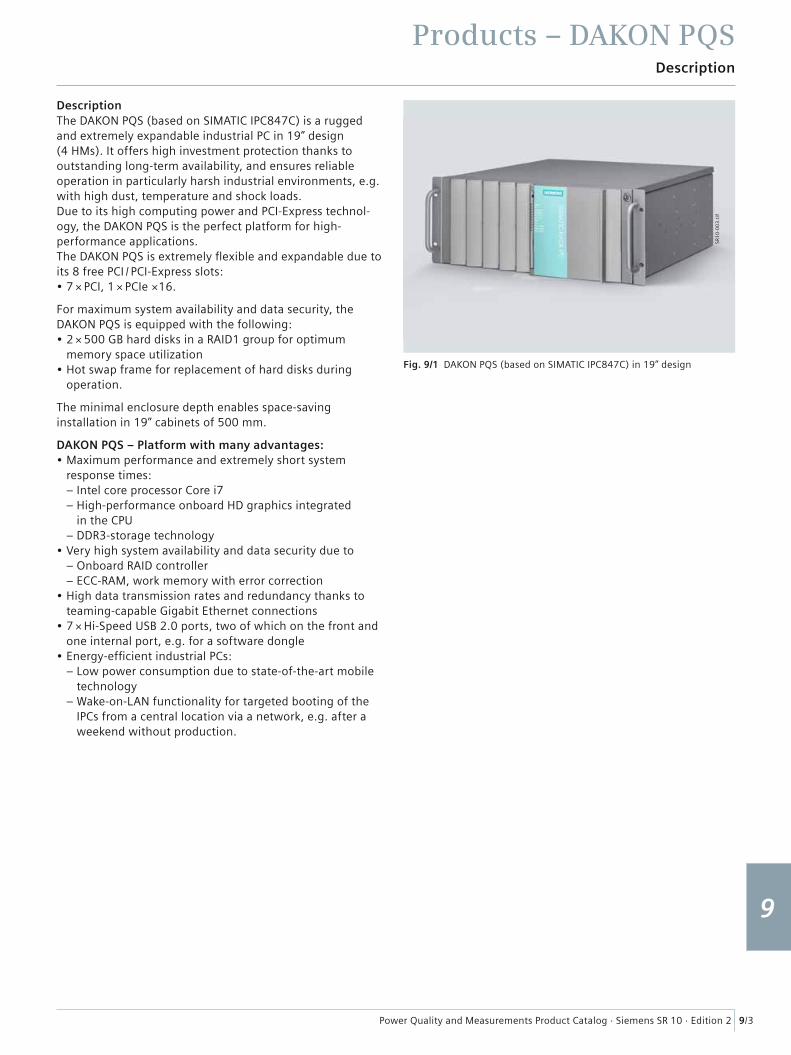
Power Quality and Measurements Product Catalog · Siemens SR 10 · Edition 2
Products – DAKON PQS
9/3
1
2
3
4
5
6
7
8
9
Description
DescriptionThe DAKON PQS (based on SIMATIC IPC847C) is a rugged and extremely expandable industrial PC in 19” design (4 HMs). It offers high investment protection thanks to outstanding long-term availability, and ensures reliable operation in particularly harsh industrial environments, e.g. with high dust, temperature and shock loads.Due to its high computing power and PCI-Express technol-ogy, the DAKON PQS is the perfect platform for high-performance applications. The DAKON PQS is extremely fl exible and expandable due to its 8 free PCI / PCI-Express slots:• 7 × PCI, 1 × PCIe ×16.
For maximum system availability and data security, the DAKON PQS is equipped with the following:• 2 × 500 GB hard disks in a RAID1 group for optimum
memory space utilization• Hot swap frame for replacement of hard disks during
operation.
The minimal enclosure depth enables space-saving installation in 19” cabinets of 500 mm.
DAKON PQS – Platform with many advantages:• Maximum performance and extremely short system
response times:– Intel core processor Core i7– High-performance onboard HD graphics integrated
in the CPU– DDR3-storage technology
• Very high system availability and data security due to– Onboard RAID controller– ECC-RAM, work memory with error correction
• High data transmission rates and redundancy thanks to teaming-capable Gigabit Ethernet connections
• 7 × Hi-Speed USB 2.0 ports, two of which on the front and one internal port, e.g. for a software dongle
• Energy-effi cient industrial PCs:– Low power consumption due to state-of-the-art mobile
technology– Wake-on-LAN functionality for targeted booting of the
IPCs from a central location via a network, e.g. after a weekend without production.
Fig. 9/1 DAKON PQS (based on SIMATIC IPC847C) in 19” design
SR1
0-0
03
.tif
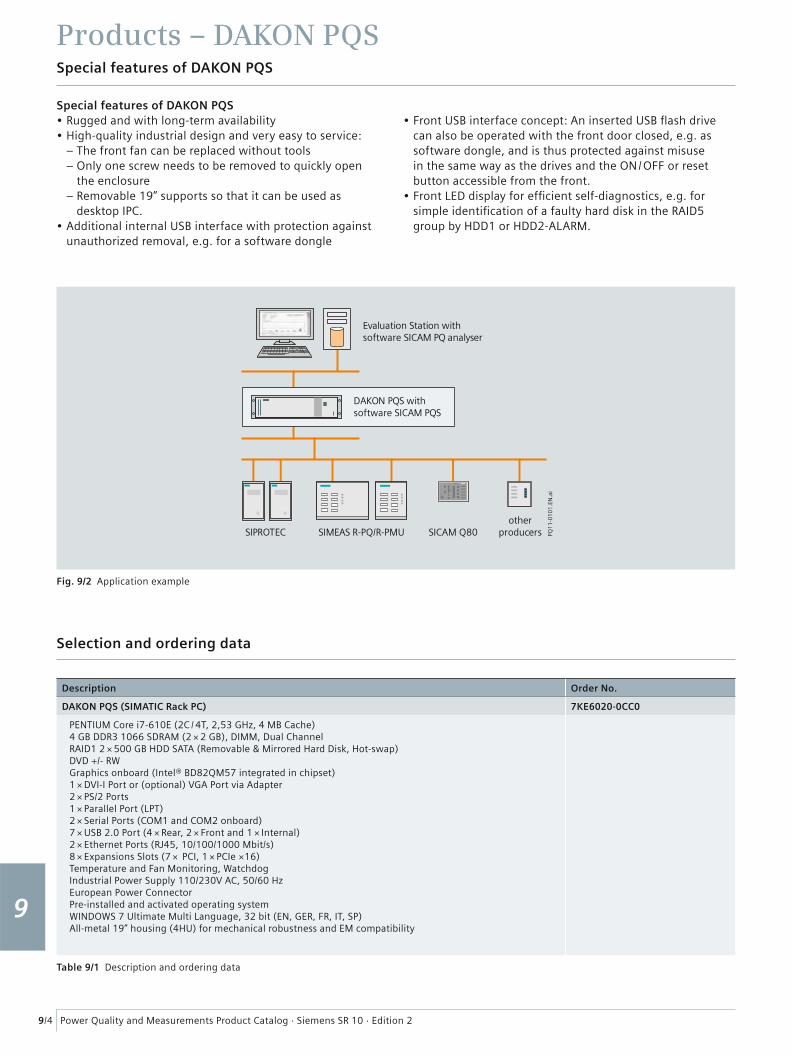
Power Quality and Measurements Product Catalog · Siemens SR 10 · Edition 2
Products – DAKON PQS
9/4
1
2
3
4
5
6
7
8
9
Selection and ordering data
Special features of DAKON PQS
Special features of DAKON PQS• Rugged and with long-term availability• High-quality industrial design and very easy to service:
– The front fan can be replaced without tools– Only one screw needs to be removed to quickly open
the enclosure– Removable 19” supports so that it can be used as
desktop IPC.• Additional internal USB interface with protection against
unauthorized removal, e.g. for a software dongle
• Front USB interface concept: An inserted USB fl ash drive can also be operated with the front door closed, e.g. as software dongle, and is thus protected against misuse in the same way as the drives and the ON / OFF or reset button accessible from the front.
• Front LED display for effi cient self-diagnostics, e.g. for simple identifi cation of a faulty hard disk in the RAID5 group by HDD1 or HDD2-ALARM.
Evaluation Station withsoftware SICAM PQ analyser
DAKON PQS withsoftware SICAM PQS
SIPROTEC SIMEAS R-PQ/R-PMU SICAM Q80other
producers PQ1
1-0
10
1.E
N.a
i
Fig. 9/2 Application example
Description Order No.
DAKON PQS (SIMATIC Rack PC) 7KE6020-0CC0
PENTIUM Core i7-610E (2C / 4T, 2,53 GHz, 4 MB Cache)4 GB DDR3 1066 SDRAM (2 × 2 GB), DIMM, Dual ChannelRAID1 2 × 500 GB HDD SATA (Removable & Mirrored Hard Disk, Hot-swap)DVD +/- RWGraphics onboard (Intel® BD82QM57 integrated in chipset)1 × DVI-I Port or (optional) VGA Port via Adapter2 × PS/2 Ports1 × Parallel Port (LPT)2 × Serial Ports (COM1 and COM2 onboard)7 × USB 2.0 Port (4 × Rear, 2 × Front and 1 × Internal)2 × Ethernet Ports (RJ45, 10/100/1000 Mbit/s)8 × Expansions Slots (7 × PCI, 1 × PCIe ×16)Temperature and Fan Monitoring, WatchdogIndustrial Power Supply 110/230V AC, 50/60 HzEuropean Power ConnectorPre-installed and activated operating systemWINDOWS 7 Ultimate Multi Language, 32 bit (EN, GER, FR, IT, SP)All-metal 19” housing (4HU) for mechanical robustness and EM compatibility
Table 9/1 Description and ordering data

Power Quality and Measurements Product Catalog · Siemens SR 10 · Edition 2
Legal Notice
9/5
CE conformity
This product complies with the directive of the Council of the European Communities on the approximation of the laws of the Member States relating to electromagneticcompatibility (EMC Council Directive
2004/108/EC) and concerning electrical equipment for use within specifi ed voltage limits (Low-Voltage Directive 2006/95/EC).This conformity has been established by means of tests con-ducted by Siemens AG according to the Council Directivein agreement with the generic standards EN 61000-6-2 andEN 61000-6-4 for the EMC directives, and with the standardEN 61010-1 for the low-voltage directive.The device has been designed and produced for industrial use. The product conforms to the standard EN 60688.
Disclaimer of liabilityThis document has been subjected to rigorous technical review before being published. It is revised at regular intervals, and any modifi cations and amendments are included in the subsequent issues. The content of this document has been compiled for information purposes only. Although Siemens AG has made best efforts to keep the document as precise and up-to-date as possible, Siemens AG shall not assume any liability for defects and damage which result through use of the information contained herein.This content does not form part of a contract or of business relations; nor does it change these. All obligations of Siemens AG are stated in the relevant contractual agree-ments. Siemens AG reserves the right to revise this docu-ment from time to time.
Document version: 01Release status: 04.2012Version of the product described: Edition 2
Copyright
Copyright © Siemens AG 2012. All rights reserved.The disclosure, duplication, distribution and editing of this document, or utilization and communication of the content are not permitted, unless authorized in writing. All rights, including rights created by patent grant or registration of a utility model or a design, are reserved.
Registered trademarks
SIMEAS, DIGSI, SICAM, SIGUARD, DAKON, and SIMATIC are registered trademarks of Siemens AG. Any unauthorized use is illegal. All other designations in this document can be trademarks whose use by third parties for their own purposes can infringe the rights of the owner.
For more information, please contact
our Customer Support Center.
Customer Support Center.
Tel.: +49 180 524 84 37
Fax: +49 180 524 24 71
(Charges depending on provider)
E-Mail: [email protected]
Order No. IC1000-K4000-A101-A2-7600
Printed in Germany
Dispo 06200, c4bs 752
KG 04.12 1.0 146 En
7500 / 41236 WÜ
Printed on elementary chlorine-free bleached paper.
Published by and copyright © 2012:
Siemens AG
Infrastructure & Cities Sector
Smart Grid Division
Energy Automation
Humboldtstr. 59
90459 Nuremberg, Germany
www.siemens.com/powerquality
All rights reserved.
If not stated otherwise on the individual pages of this
catalog, we reserve the right to include modifications,
especially regarding the stated values, dimensions and
weights.
Drawings are not binding.
All product designations used are trademarks or
product names of Siemens AG or other suppliers.
lf not stated otherwise, all dimensions in this catalog
are given in mm/inch.
Subject to change without prior notice.
The information in this document contains general
descriptions of the technical options available, which
may not apply in all cases. The required technical
options should therefore be specified in the contract.


![ALTEA: 2012 radiation measurements in the ISS - …wrmiss.org/workshops/eighteenth/Narici.pdf · ALTEA: 2012 radiation measurements in the ISS L ... (cm^2 sr s )] Shielding (Poles](https://img.pdfslide.us/doc/110x75/5b09cad17f8b9a3d018e3bed/altea-2012-radiation-measurements-in-the-iss-2012-radiation-measurements-in-the.jpg)