Embed Size (px)
Citation preview
/l/lk},4 - TIJl-35790
NASA Technical Memorandum 85790
NASA-TM-85790 19840017357
Installation Noise Measurementsof Model SR and CR Propellers
P.J. W.Block
May 1984
...
L~BRARY COpy,; oj j.) f) 1984
I_ANGLEY RESEARCH CENTEf<LIBRARY, NASA
HAMPTON" VIRGINIA
NI\SI\National Aeronautics andSpace Administration
Langley Research centerHampton, Virginia 23665
https://ntrs.nasa.gov/search.jsp?R=19840017357 2019-04-12T14:13:13+00:00Z


INTRODUCTION
Recent studies have shown that turboprop-powered aircraft may offer signifi
cant fuel savings over turbofan-powered aircraft (ref. 1). Thus, new aircraft
propulsion systems are being studied which incorporate new and advanced propeller
concepts such as highly swept and tapered blades, pusher configurations, and
counter-rotating propellers. The noise impact of these propellers and the effect
of their installation on the noise radiation pattern is of concern from the
standpoint of cabin or interior noise as well as from the community noise impact.
To assess the magnitude of the noise impact, propeller noise measurements are
needed on these advanced propeller concepts. However, the measurement of propel
ler noise is complicated by the fact that the installed configuration has a
non-uniform directivity pattern (ref. 2). That is, the radiation pattern of a
free propeller is modified or distorted when it is installed on the aircraft and
tne amount of additional noise from the installed propeller is dependent on the
location of the observer (or microphone). Thus, a comprehensive experimental
study of the noise from an installed propeller requires many microphone measure
ments. These measurements can then be used to validate available prediction
methods and to supplement the data base on advanced propeller installation
effects.
This paper summarizes noise measurements on a 0.1 scale SR-2 propeller in a
single and counter rotation mode, in a pusher and tractor configuration, and
operating at non-zero angles of attack. A measurement scheme which permitted 143
measurements of each of these configurations is also described.
B
Cp
SYMBOLS AND ABBREVIATIONS
Fourier coefficients
number of blades per row or per propeller disk
power coefficient = P/pn3d5
CTd
f
J
M
n
P
BPF
CR
CRT
ips
mic
OTS
rpm
thrust coefficient = T/pn2d4
propeller diameter
frequency
propeller advance ratio, U/nd
Mach number
number of revolutions per second
power absorbed by the propeller
free stream dynamic pressure
propeller thrust
air temperature
tunne1 vel oc ity
angle of attack or pitch angle of the propeller nacelle withrespect to the airstream
propeller pitch setting at .75 radial station with respect tothe plane of rotation
air density
Abbreviations
blade passage frequency = nB
counter rotation propeller
CR tractor
inches per second
microphone
open test section
revolutions per minute
SPL
SR
SRP
SRT
sound pressure level
single rotation propeller
SR pusher
SR tractor2
DESCRIPTION OF THE EXPERIMENT
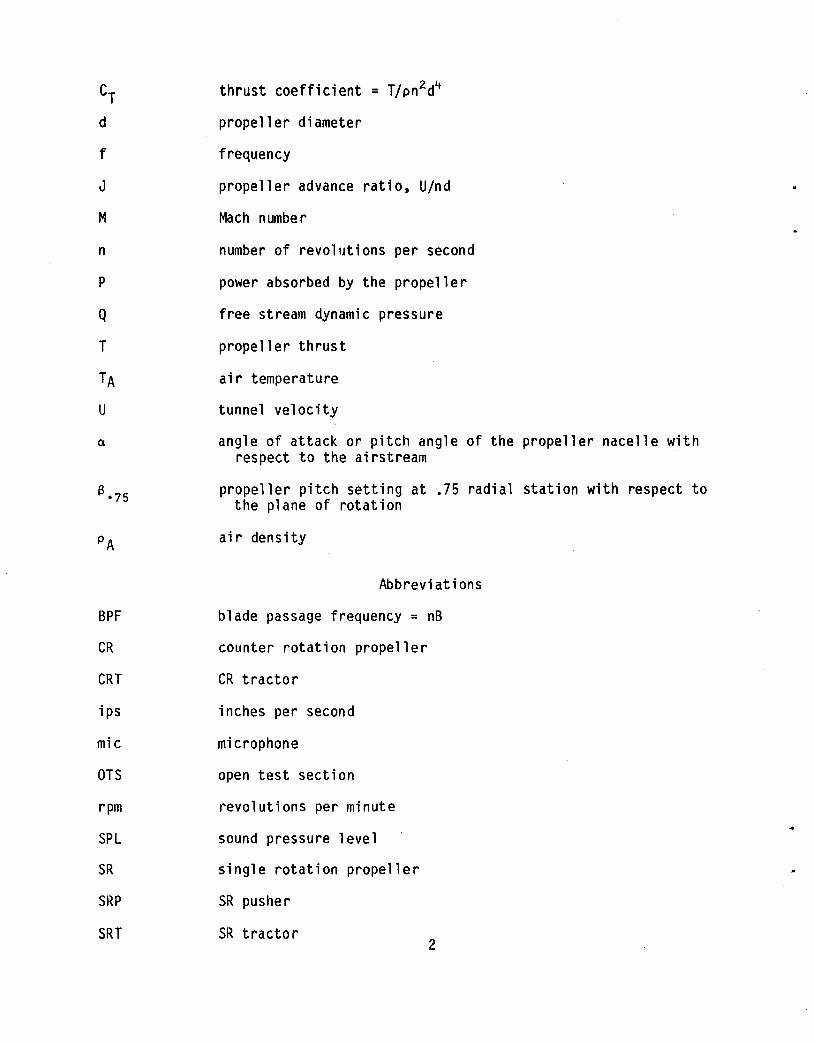
Propellers.- The SR2 propeller design was employed in this study. The coord
inates of this design are documented (ref. 2) and are displayed in 3-0 form in
figure 1. The blades were fabricated on a numerically controlled milling machine
to a tolerance of ± .003 inches (.076 lOm) on the airfoil contour and ± .005 inches
(.127 mm) on span warpage. When placed in the hub, the radial position tolerance
was ± .0025 inches (.064 mm).
The hubs for the single rotation propeller (SR) and counter rotation propel
lers (CR) permitted 2, 4, or 8 blade operation over a blade pitch range from _2°
to 60°. The blades were set into a collective pitch angle gear and clamped in the
hub such that when assembled the blades did not wobble. The spinner, hub, and
blades were dynamically balanced to 4000 rpm, not to exceed .01 ounce-inches (7.06
x 10-5 n-m) of imbalance*, and tested for failure at 10500 rpm for 30 seconds in a
partial vacuum. Both the SR and CR systems were driven by a single 29 hp (10000
rpm) electric motor.
The SR and CR systems differed in the following ways. The SR was 16.9 inches
(.429 m) in diameter, and the blade pitch angles were adjustable in one degree
increments. To set the angle a pin was placed in a labeled hole in the hub. With
this arrangement the collective blade angle was exactly repeatable. The actual
blade pitch angle setting at the 75 percent radial station (S.75) is obtained from
the labeled hole or nominal setting by S.75 (degrees) = .98522 x (nominal setting)
+ .89°. The SR rotated clockwise looking upstream.
The CR coordinates were obtained by scaling the SR coordinates down by a
factor of 0.88757 to a diameter of 15 inches (.381 m). The blades were then
*At 4000 rpm the rotating system appeared to have a resonance. This imbalance wasnever exceeded throughout the rpm range tested.
3
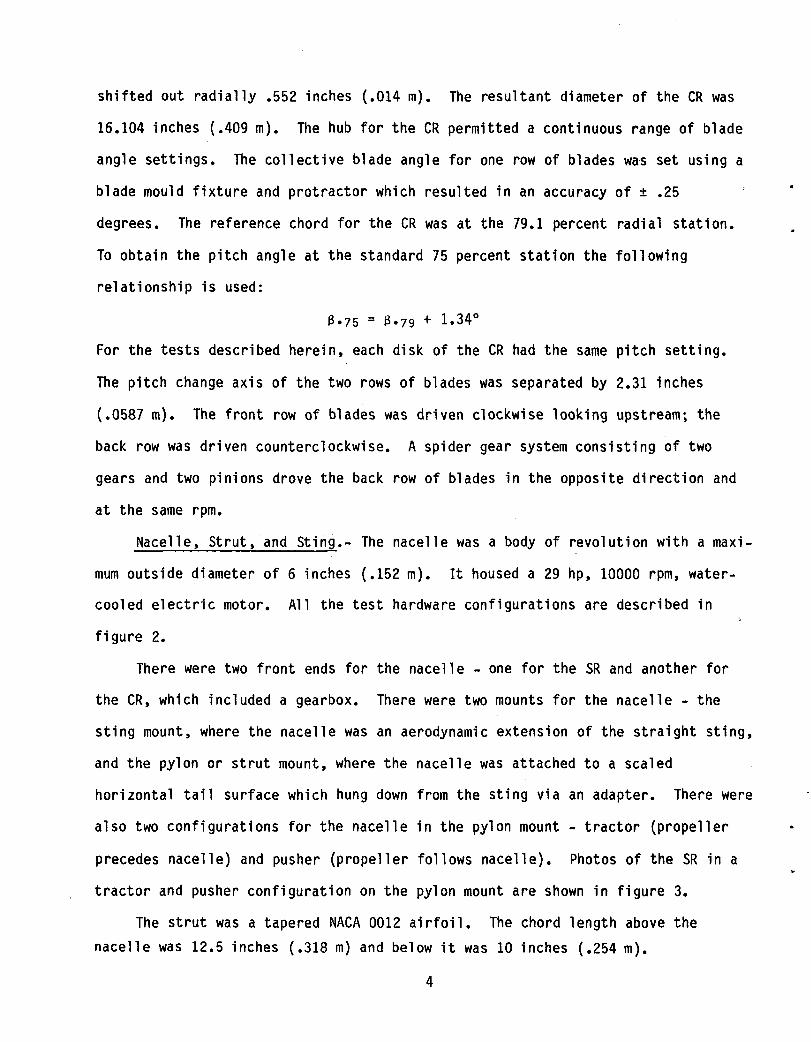
shifted out radially .552 inches (.014 m). The resultant diameter of the CR was
16.104 inches (.409 m). The hub for the CR permitted a continuous range of blade
angle settings. The collective blade angle for one row of blades was set using a
blade mould fixture and protractor which resulted in an accuracy of ± .25
degrees. The reference chord for the CR was at the 79.1 percent radial station.
To obtain the pitch angle at the standard 75 percent station the following
relationship is used:
8.75 = 8.79 + 1.34°
For the tests described herein, each disk of the CR had the same pitch setting.
The pitch change axis of the two rows of blades was separated by 2.31 inches
(.0587 m). The front row of blades was driven clockwise looking upstream; the
back row was driven counterclockwise. A spider gear system consisting of two
gears and two pinions drove the back row of blades in the opposite direction and
at the same rpm.
Nacelle, Strut, and Sting.- The nacelle was a body of revolution with a maxi
mum outside diameter of 6 inches (.152 m). It housed a 29 hp, 10000 rpm, water
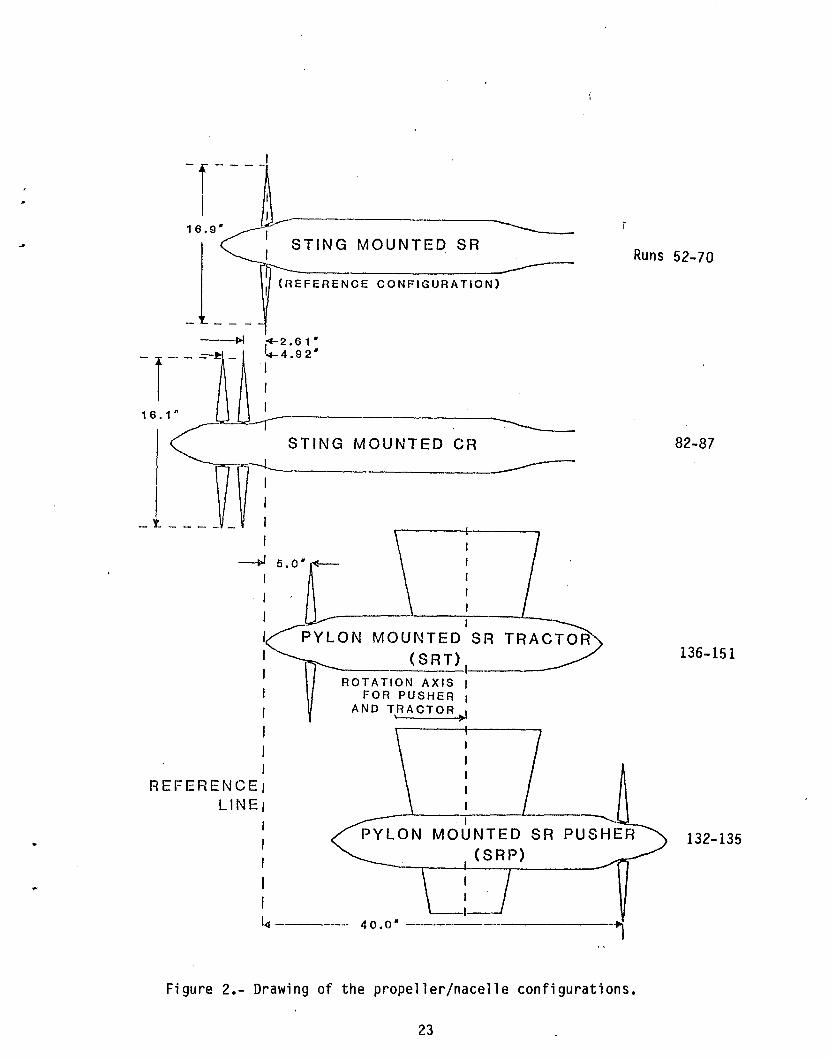
cooled electric motor. All the test hardware configurations are described in
figure 2.
There were two front ends for the nacelle - one for the SR and another for
the CR, which included a gearbox. There were two mounts for the nacelle - the
sting mount, where the nacelle was an aerodynamic extension of the straight sting,
and the pylon or strut mount, where the nacelle was attached to a scaled
horizontal tail surface which hung down from the sting via an adapter. There were
also two configurations for the nacelle in the pylon mount - tractor (propeller
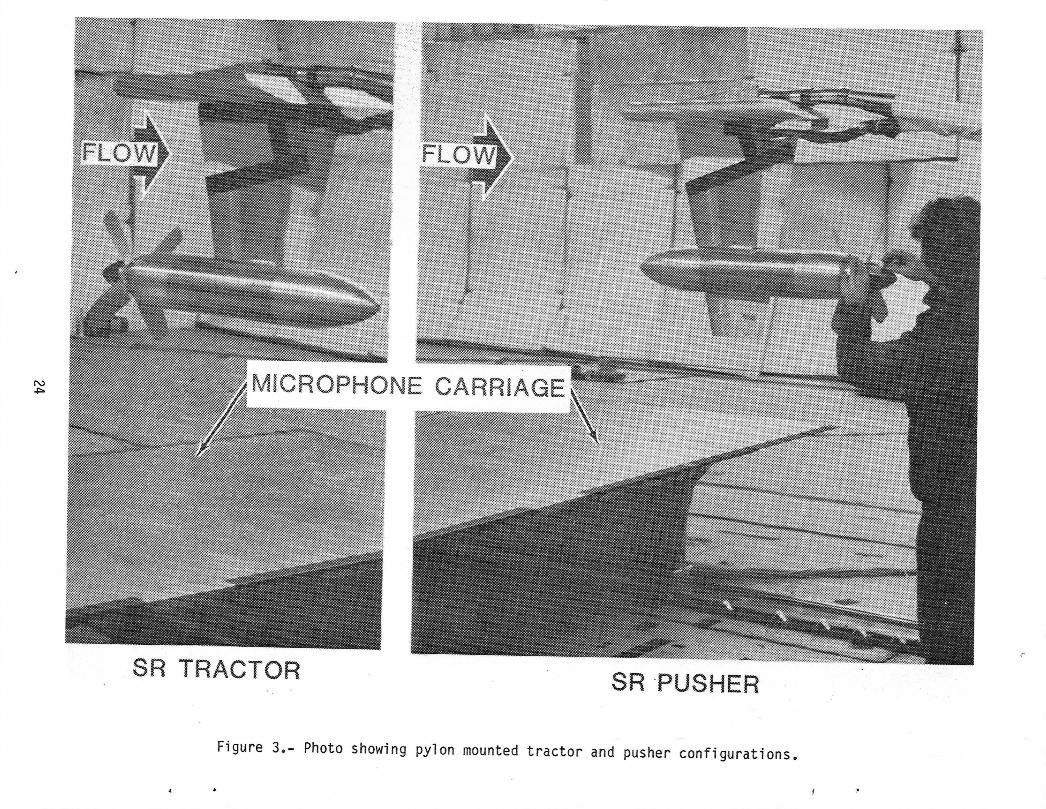
precedes nacelle) and pusher (propeller follows nacelle). Photos of the SR in a
tractor and pusher configuration on the pylon mount are shown in figure 3.
The strut was a tapered NACA 0012 airfoil. The chord length above the
nacelle was 12.5 inches (.318 m) and below it was 10 inches (.254 m).
4

The location of the propeller disk plane for the sting mounted SR at zero
angle of attack defines the reference plane for this test (see fig. 2). This
location is the a-stop for the microphone carriage which will be described next.
In other hardware configurations the propeller disk plane was displaced from this
reference line as shown in figure 2. These displacements are given for the zero
angle-of-attack case in figure 2. At non-zero angles of attack the location of
the disk plane was moved slightly forward (upstream) or backward from this posi
tion. The actual location of the propeller disk plane for all configurations and
angles of attack is given in the test configurations table.
The straight sting was used to change the propeller pitch while keeping the
. height of the propeller axis 35 inches (.889 m) above the microphone carriage.
The adapter, which connected the pylon or horizontal tail surface to the sting
permitted the nacelle to be yawed in ± 5° increments, with the position of the
centerline of the propeller disk kept constant.
Microphone Carriage.- The microphone carriage was a streamlined rectangular
flat plate holding an array of eleven flush mounted microphones (see figure 4).
It was designed to circumvent the complexity of reflections from the floor while
providing the capability of making numerous streamwise noise measurements of all
the propeller configurations.
The carriage was 72 inches (1.83 m) wide (streamwise dimension), 168 inches
(4.27 m) long (cross stream dimension), and 2.3 inches (.0584 m) thick. Its
construction included an aluminum frame, a rigid foam core, and an aluminum skin
all sandwiched and bonded together using an epoxy adhesive with a wooden beam
running spanwise down the center of the chord for microphone mounting.
The microphones were slip fit into phenolic holders which were secured to the
wooden beam. A three-view drawing of the carriage showing the microphone loca
tionsis given in figure 5 along with a description of the microphone mount.
5

The microphones t labeled 1 through lIt were positioned at nominally 12.50
increments in the cross stream direction (azimuthally) from the propeller axis t
which was 35 inches (.889 m) above the carriage.
The carriage was moved in the streamwise direction on Thompson bearings and a
set of one inch stainless steel rods (see figure 4). The drive system consisted
of an electric motor t gearbox t sprocket t and continuous cable t which moved the
carriage at a velocity of 4.4 inches/sec (.112 m/sec). The carriage was stopped
at 13 to 15 fixed streamwise positions which corresponded to nominal 100 incre
ments from the propeller disk planet beginning at 600 in front of the disk plane
and ending 600 behind for the reference condition. These stoPSt which were indi
cated by a microswitch t were labeled 6t5t ••• ltOt-lt ••• -5t-6t respectively. Two
more stoPSt labeled 7 and 8t were added t which measured the noise at 720 and 780
in front of the disk plane. When at the stop labeled Ot the microphone array was
in the disk plane of the reference configuration t namely the sting mounted SRT at
zero angle of attack (see fig. 2). At stop 0 the noise at 00 from the disk plane
was recorded t and at stop +4 the noise 400 in front of the disk plane was
recorded t etc. For configurations other than this reference condition t the stop
label does not correspond to the measurement angle with respect to the disk
plane. The actual angles of the microphone with respect to the disk plane for all
the carriage stops and test configurations (which will be discussed in a later
section) are given in Table 1.
Thus t the noise radiation pattern for each of the propeller configurations
was measured at a minimum of 143 locations covering the range from 60 0 upstream to
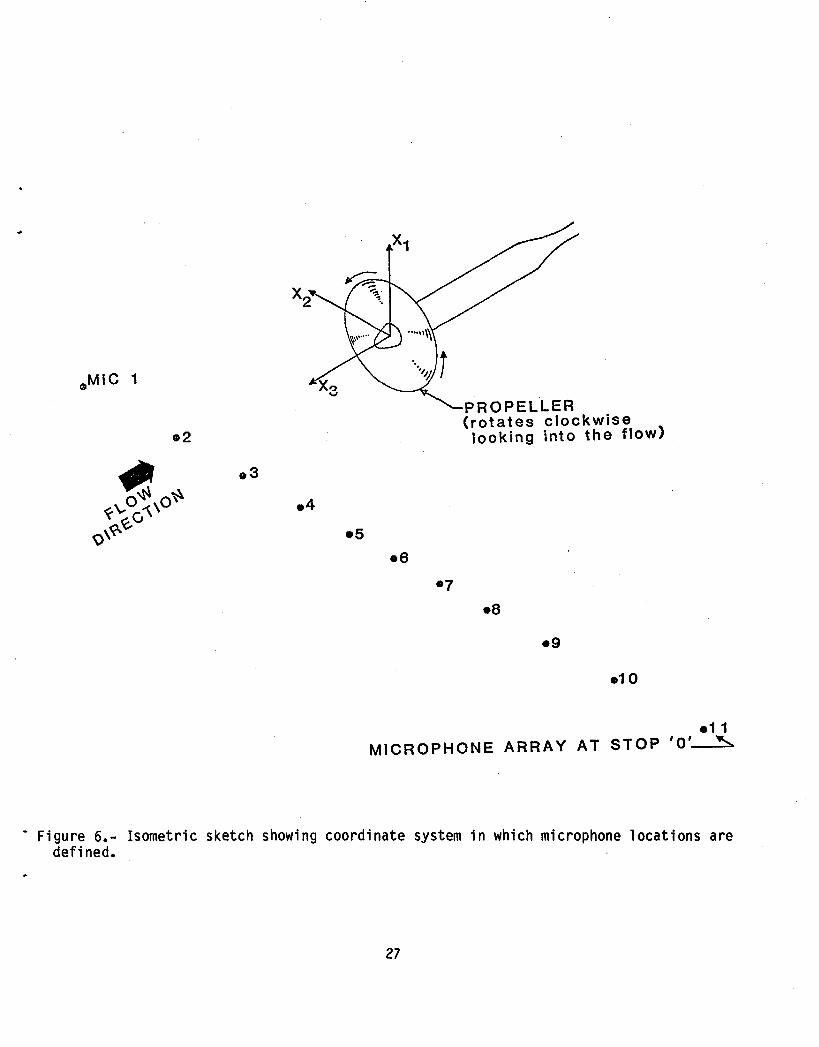
600 downstream and about 580 on both sides of the propeller axis. Figure 6 shows
the coordinate system defining the microphone locations. This system is fixed t
with respect to the tunnel t with its origin on the axis of the disk plane for the
sting mounted SR at 00 pitch and 00 yaw (reference configuration). The microphone
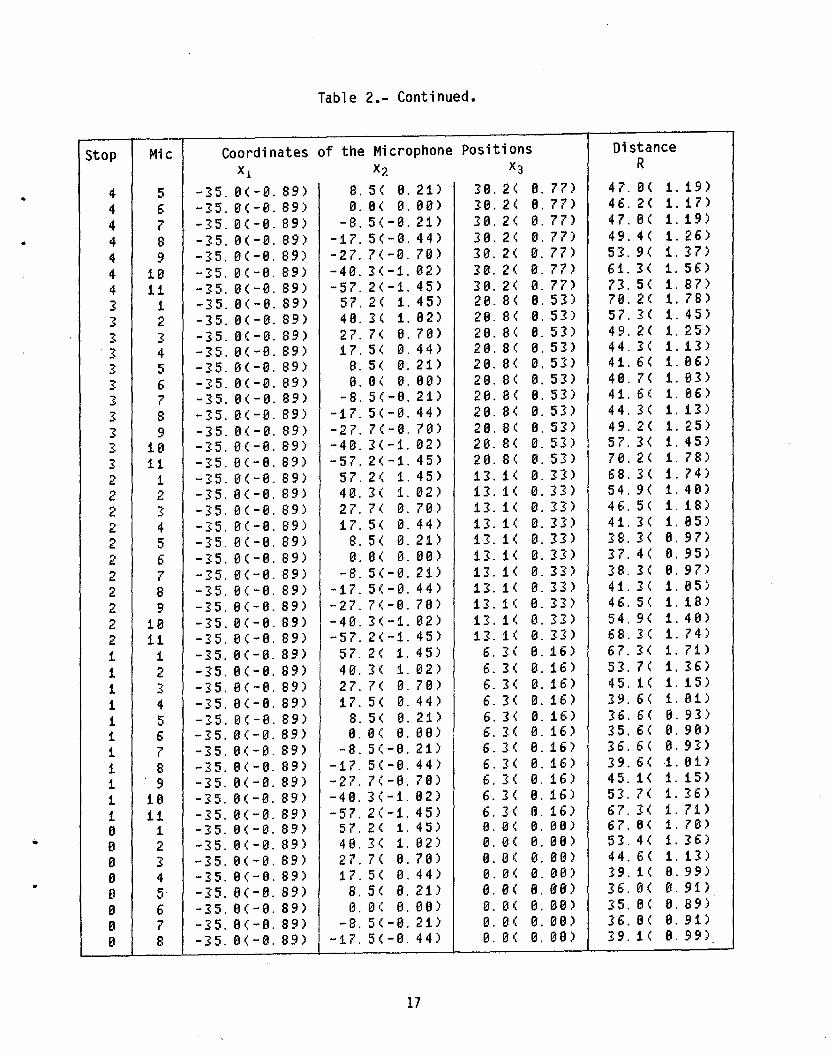
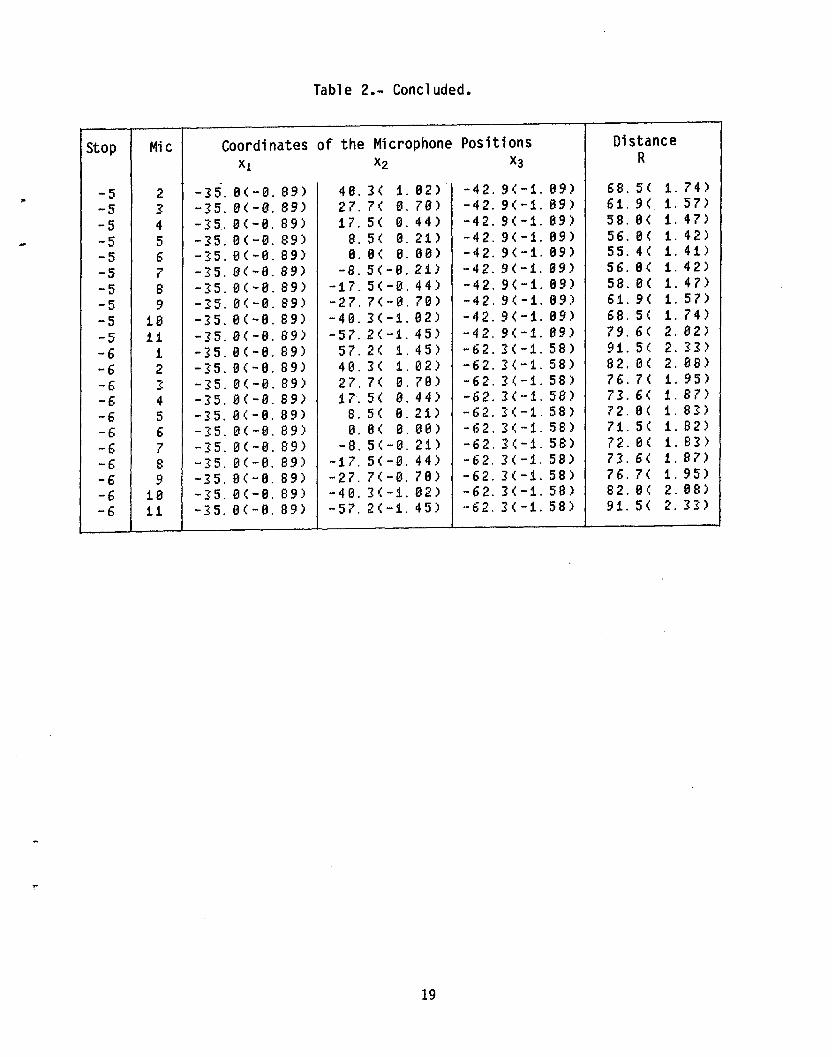
coordinates are given in Table 2 for all 15 carriage stops.
6

Since a microphone that is flush mounted in a large rigid surface will record
a pressure doubling, a correction to all the data is made to obtain free field
levels. This correction (6 dB) has been subtracted from all the acoustic data
presented herein. The data have not been normalized to a reference distance from
the propeller axis.
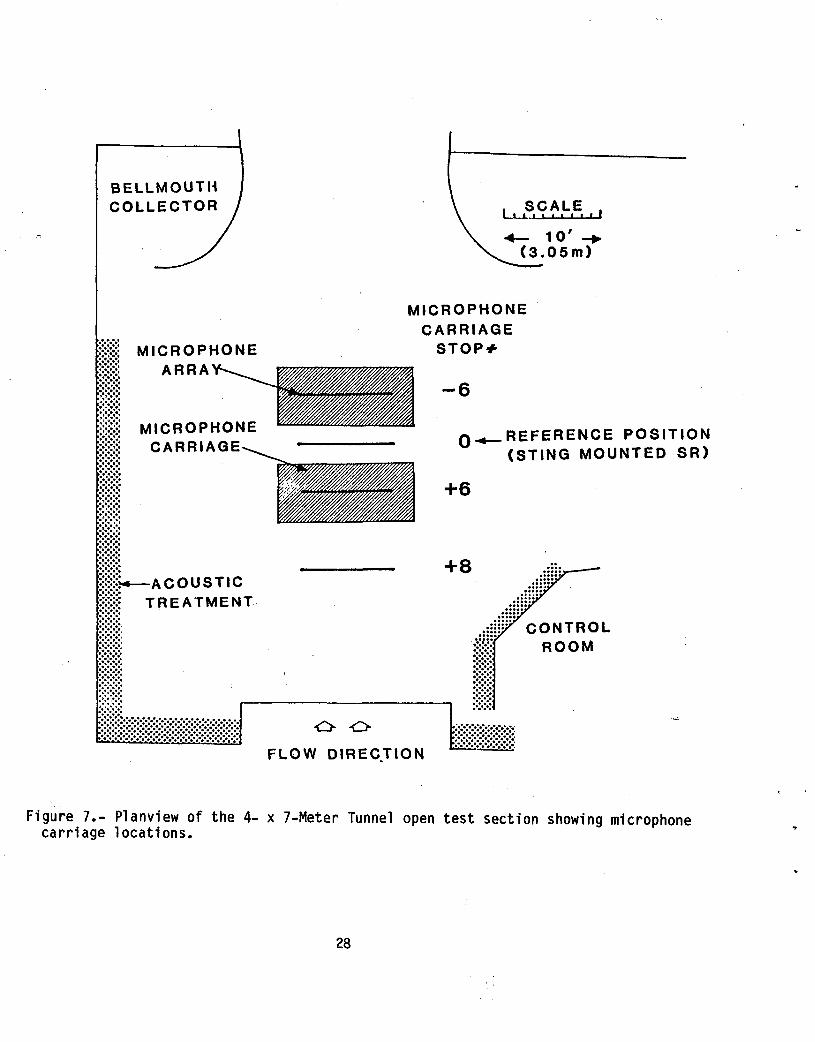
Facility.- The tests were conducted in the Langley 4- x 7-Meter Tunnel. This
is a closed single-return atmospheric wind tunnel allowing open or closed test
section operation. A more detailed description of this facility and an acoustic
evaluation of the open test section (OTS) are given in reference 2. Figure 7 is a
plan view of the OTS showing two of the extreme microphone carriage stops (+6 and
-6), propeller plane location, and locations of the acoustic treatment. Unlike
the previous test, described in reference 2, open cell foam bats 6 inches (.152 m)
thick were applied to the raised ceiling, sidewalls, and control room wall. A
reevaluation of the reflection characteristics of the OTS showed that within the
dynamic range of the recording instrumentation the microphone systems were not
able to detect reflections from these surfaces.
A typical background noise spectrum is given in figure 8. This was measured
with no propeller on the sting-mounted nacelle. The results are from microphone 6
(tunnel centerline) with the microphone carriage at stop +4. The frequency band
width for this analysis is 9.765 Hz. To adjust for the difference in analysis
bandwidth between these levels and the propeller data, the quantity
bdB = 10 log BPF9:76"5
is added to the band levels in figure 8 to obtain the level of the corresponding
background noise in the figures which give the propeller noise (figs. 9-14). Here
BPF is the blade passage frequency of the propeller, which may change for each
propeller noise run. The nominal flow velocity for this and all the propeller
noise runs was 101 fps (30.5 mjs).
7
TEST CONDITIONS
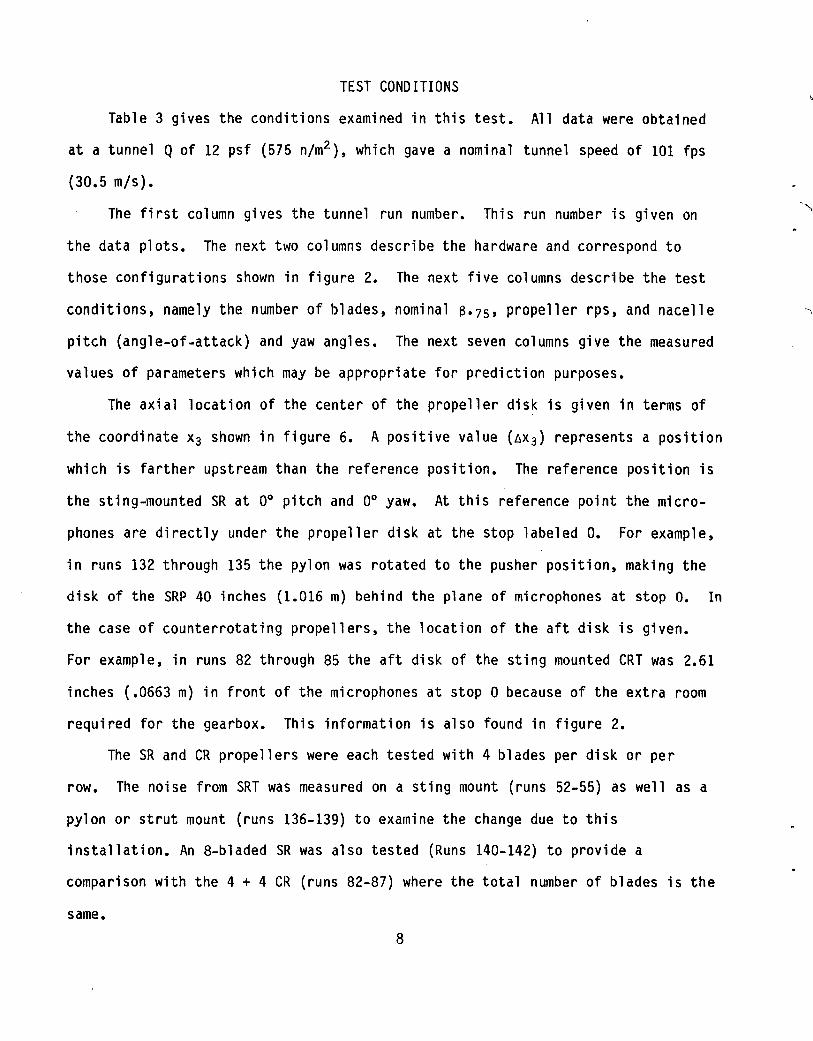
Table 3 gives the conditions examined in this test. All data were obtained
at a tunnel Q of 12 psf (575 n/m2 ), which gave a nominal tunnel speed of 101 fps
(30.5 m/s).
The first column gives the tunnel run number. This run number is given on
the data plots. The next two columns describe the hardware and correspond to
those configurations shown in figure 2. The next five columns describe the test
conditions, namely the number of blades, nominal 6.75' propeller rps, and nacelle
pitch (angle-of-attack) and yaw angles. The next seven columns give the measured
values of parameters which may be appropriate for prediction purposes.
The axial location of the center of the propeller disk is given in terms of
the coordinate x3 shown in figure 6. A positive value (~X3) represents a position
which is farther upstream than the reference position. The reference position is
the sting-mounted SR at 00 pitch and 00 yaw. At this reference point the micro
phones are directly under the propeller disk at the stop labeled O. For example,
in runs 132 through 135 the pylon was rotated to the pusher position, making the
disk of the SRP 40 inches (1.016 m) behind the plane of microphones at stop O. In
the case of counterrotating propellers, the location of the aft disk is given.
For example, in runs 82 through 85 the aft disk of the sting mounted CRT was 2.61
inches (.0663 m) in front of the microphones at stop 0 because of the extra room
required for the gearbox. This information is also found in figure 2.
The SR and CR propellers were each tested with 4 blades per disk or per
row. The noise from SRT was measured on a sting mount (runs 52-55) as well as a
pylon or strut mount (runs 136-139) to examine the change due to this
installation. An 8-bladed SR was also tested (Runs 140-142) to provide a
comparison with the 4 + 4 CR (runs 82-87) where the total number of blades is the
same.
8
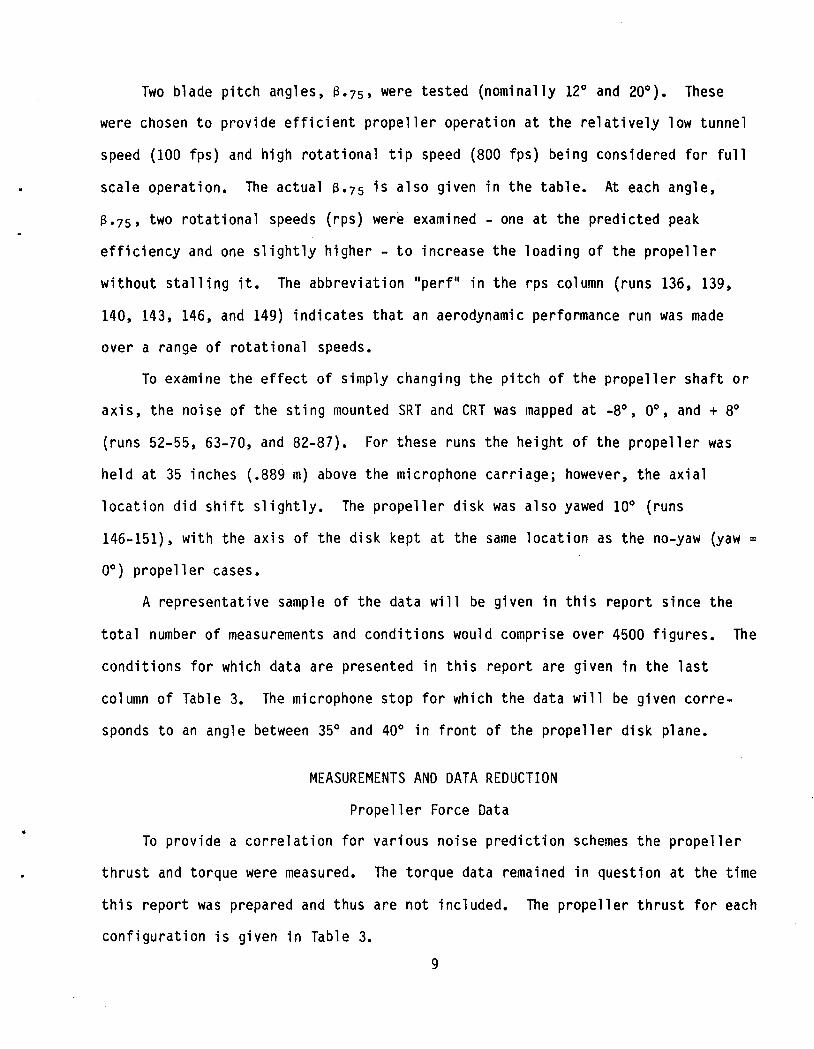
Two blade pitch angles, e.7S, were tested (nominally 12° and 20°). These
were chosen to provide efficient propeller operation at the relatively low tunnel
speed (100 fps) and high rotational tip speed (800 fps) being considered for full
scale operation. The actual S.7S is also given in the table. At each angle,
S.7S, two rotational speeds (rps) were examined - one at the predicted peak
efficiency and one slightly higher - to increase the loading of the propeller
without stalling it. The abbreviation "perf" in the rps column (runs 136, 139,
140, 143, 146, and 149) indicates that an aerodynamic performance run was made
over a range of rotational speeds.
To examine the effect of simply changing the pitch of the propeller shaft or
axis, the noise of the sting mounted SRT and CRT was mapped at _8°, 0°, and + 8°
(runs 52-55, 63-70, and 82-87). For these runs the height of the propeller was
held at 35 inches (.889 m) above the microphone carriage; however, the axial
location did shift slightly. The propeller disk was also yawed 10° (runs
146-151), with the axis of the disk kept at the same location as the no-yaw (yaw =
0°) propeller cases.
A representative sample of the data will be given in this report since the
total number of measurements and conditions would comprise over 4500 figures. The
conditions for which data are presented in this report are given in the last
column of Table 3. The microphone stop for which the data will be given corre
sponds to an angle between 35° and 40° in front of the propeller disk plane.
MEASUREMENTS AND DATA REDUCTION
Propeller Force Data
To provide a correlation for various noise prediction schemes the propeller
thrust and torque were measured. The torque data remained in question at the time
this report was prepared and thus are not included. The propeller thrust for each
configuration is given in Table 3.
9

Noi se Data
The microphone data were high-pass filtered at 80 Hz and FM recorded on one
inch magnetic tape at 60 ips. A once-per-revolution pulse which was generated by
a magnetic pick-up on the shaft was also recorded. A triple redundancy system was
employed for recording the attenuator settings. The recorded data were digitized
using the once-per-revolution pulse to obtain 512 points of data for each revolu
tion of the shaft. A minimum of 120 revolutions of data were stored for each
microphone (61440 points).
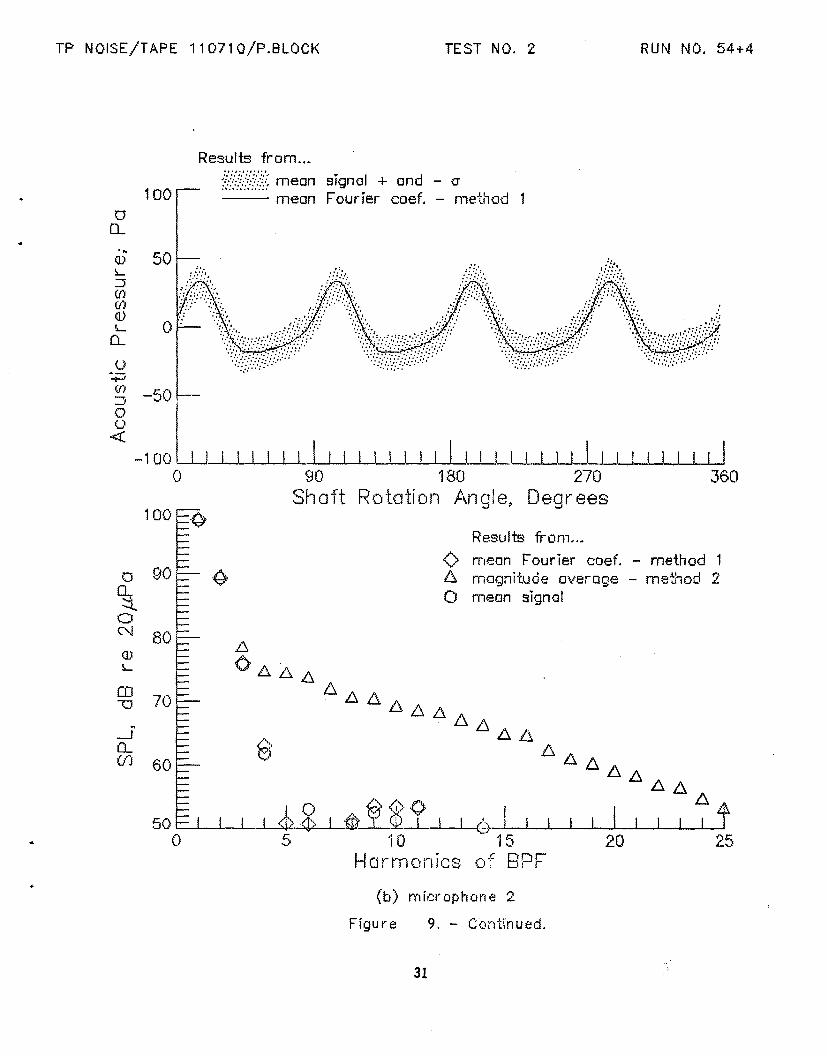
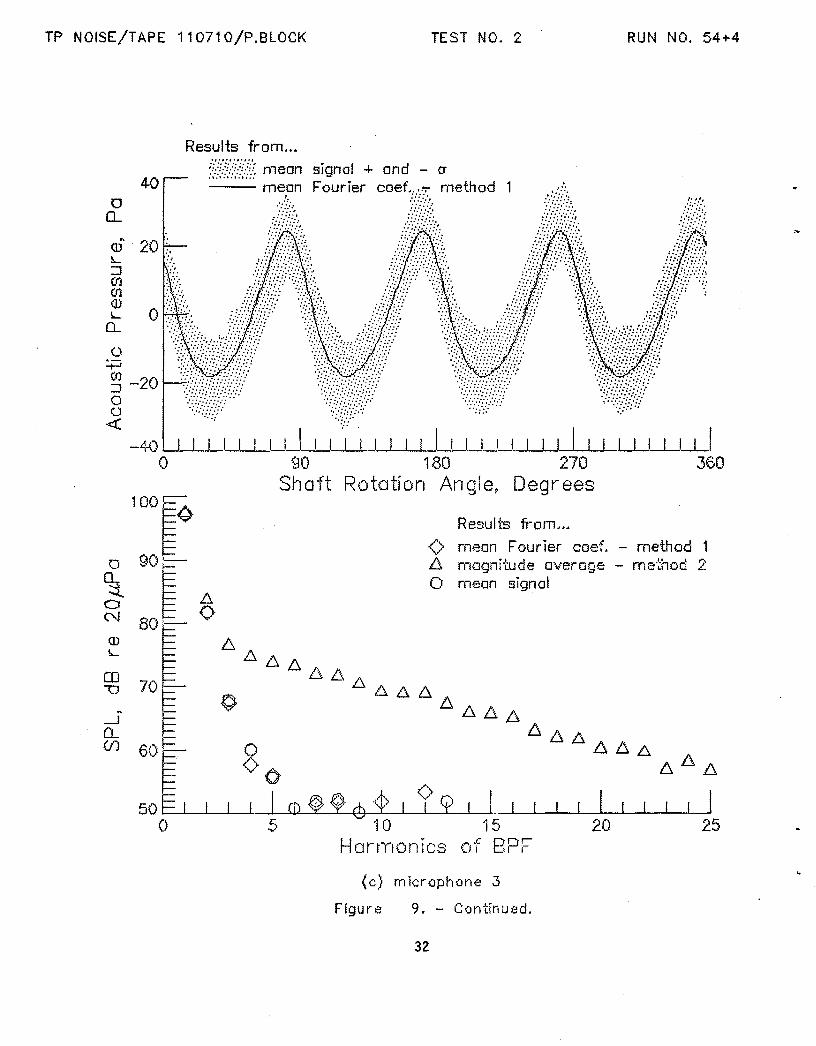
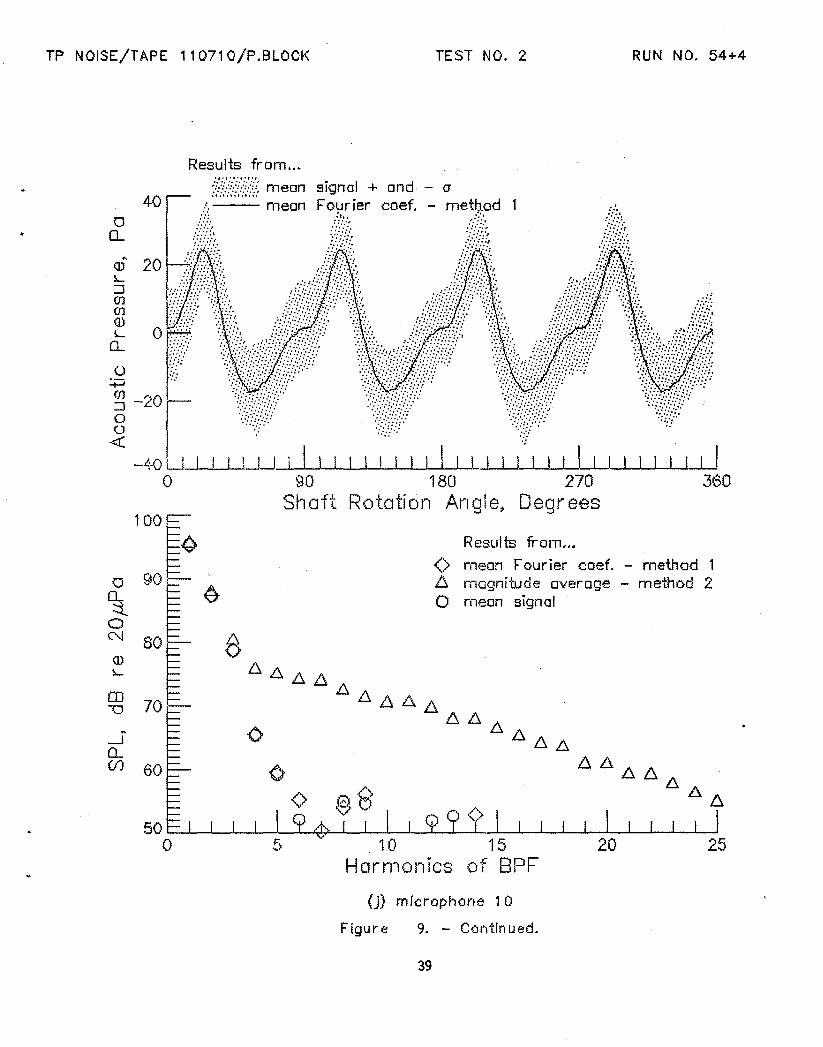
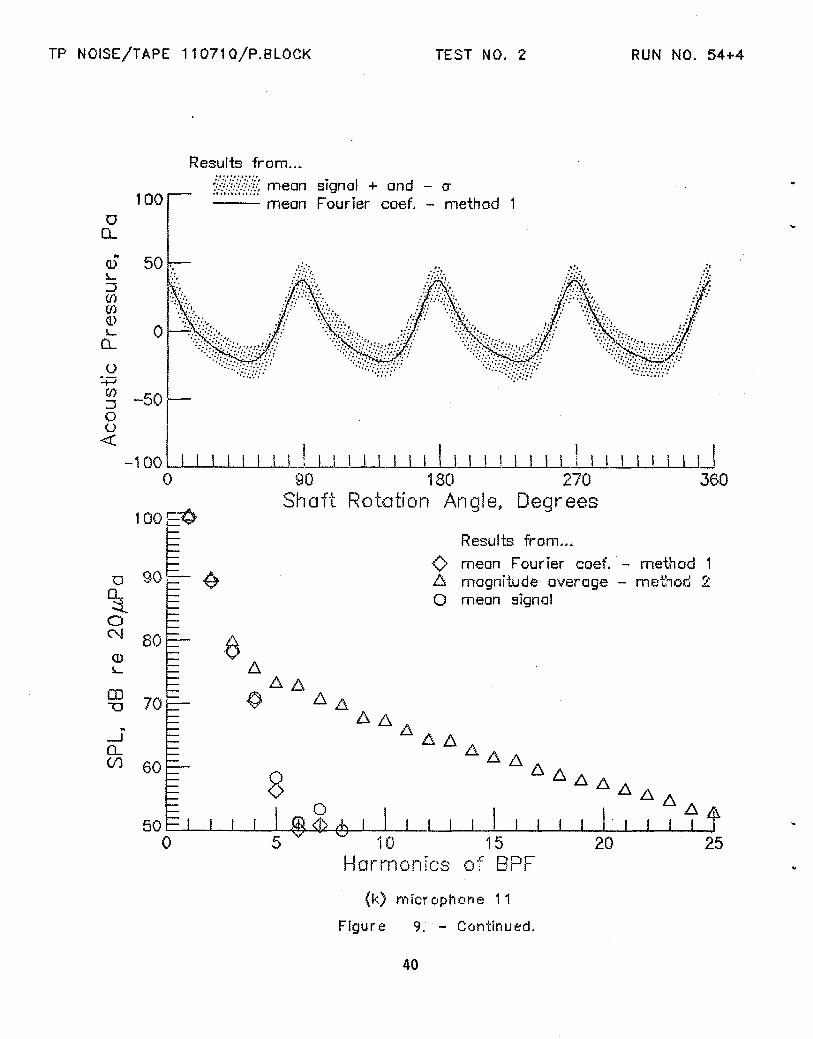
The data were analyzed in the time domain and the frequency domain and are
presented in the time domain as pressure time histories and in the frequency
domain as sound pressure levels for each of the first 25 harmonics of the blade
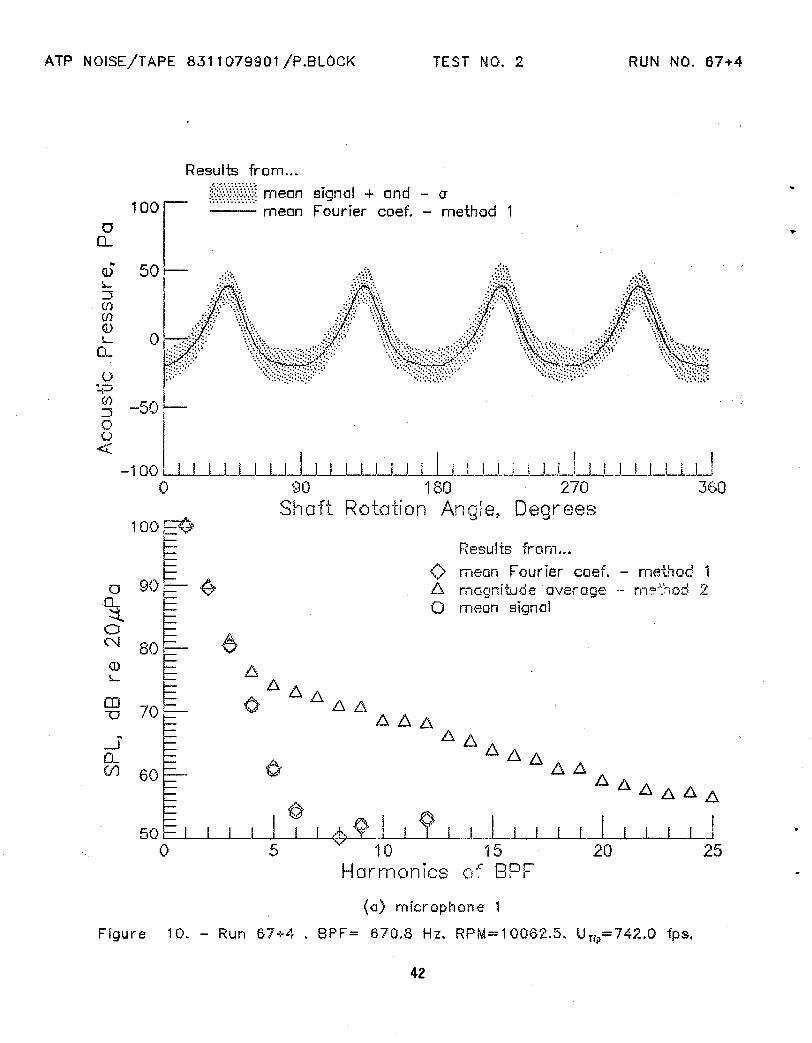
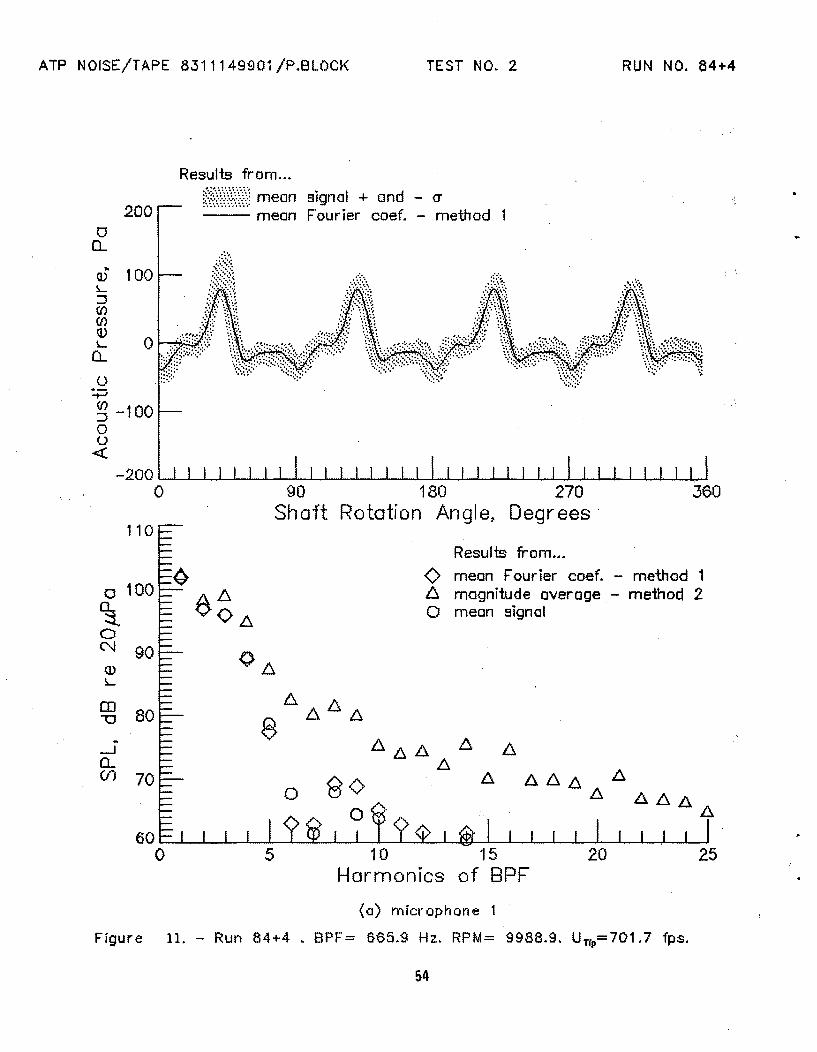
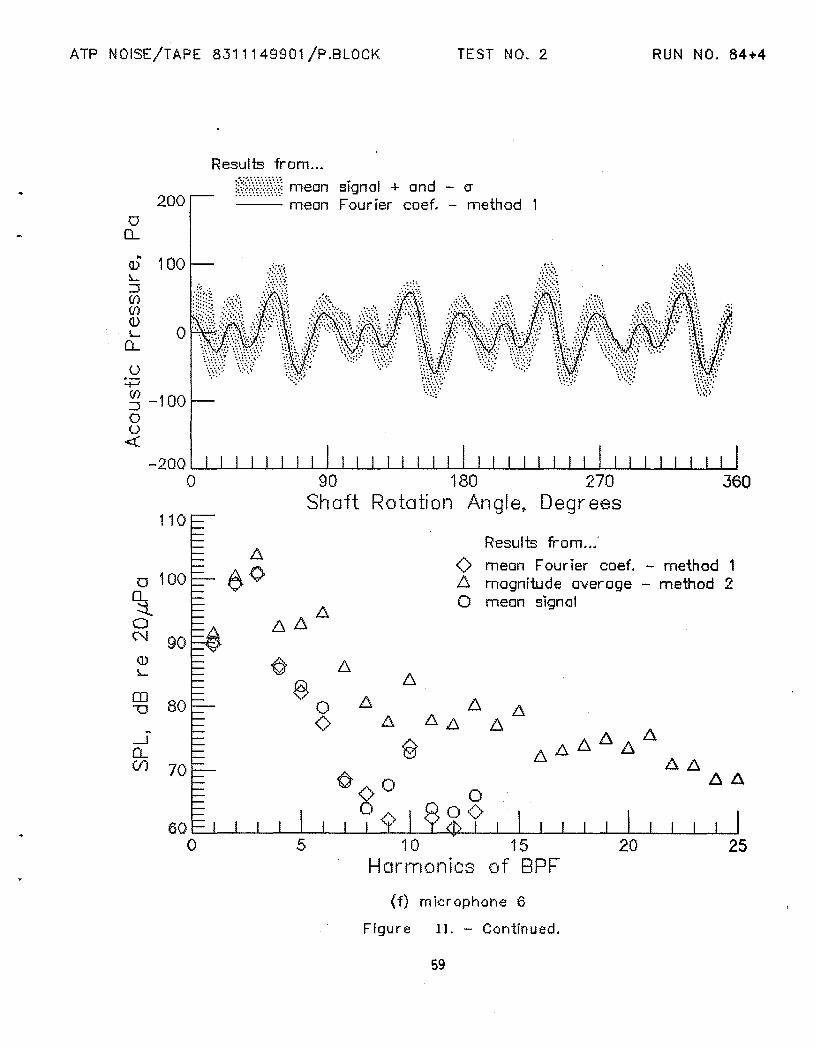
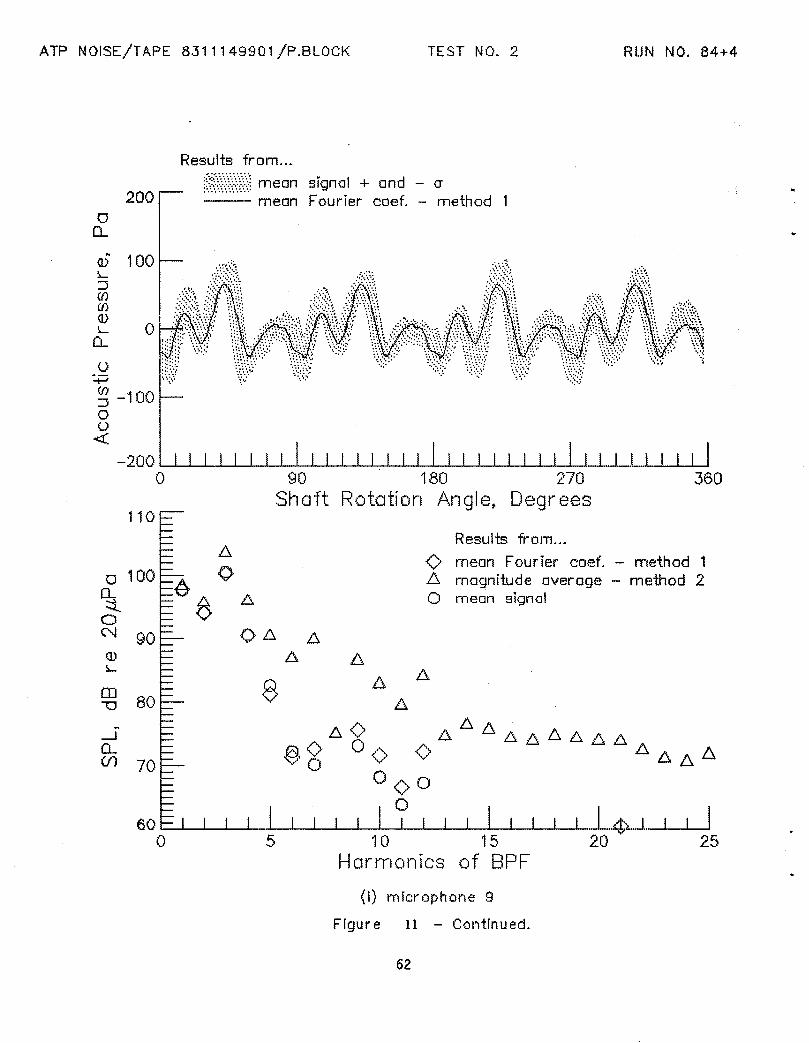
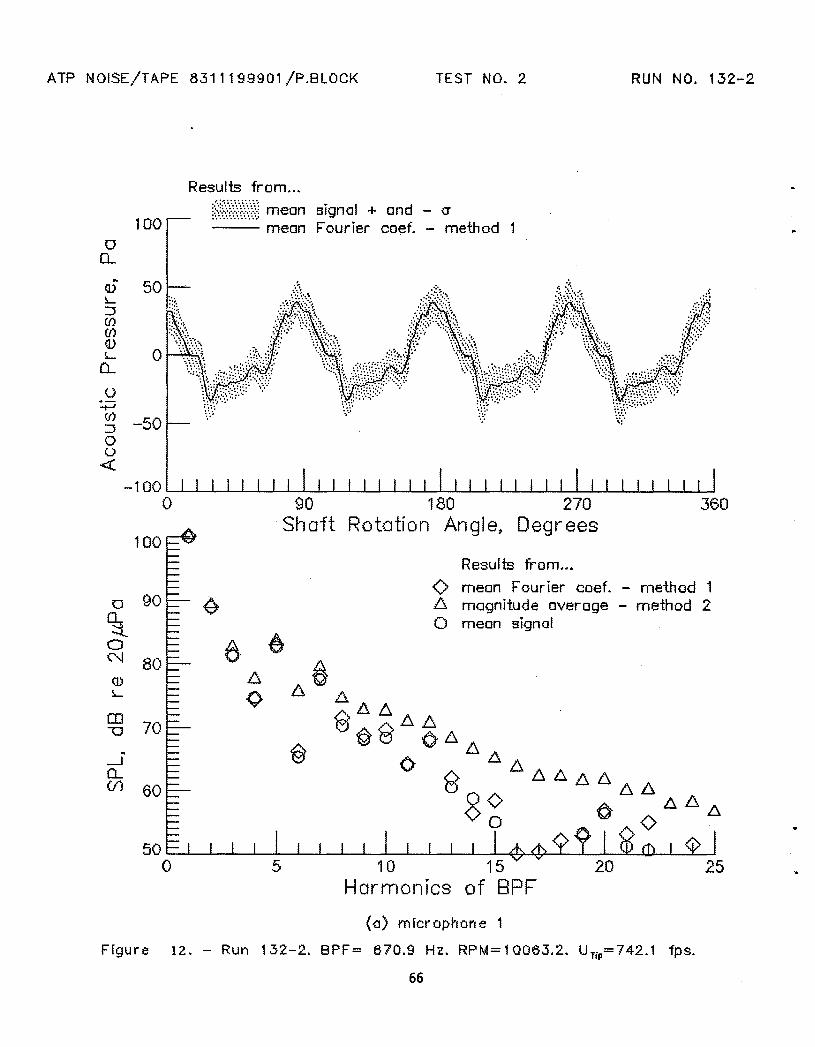
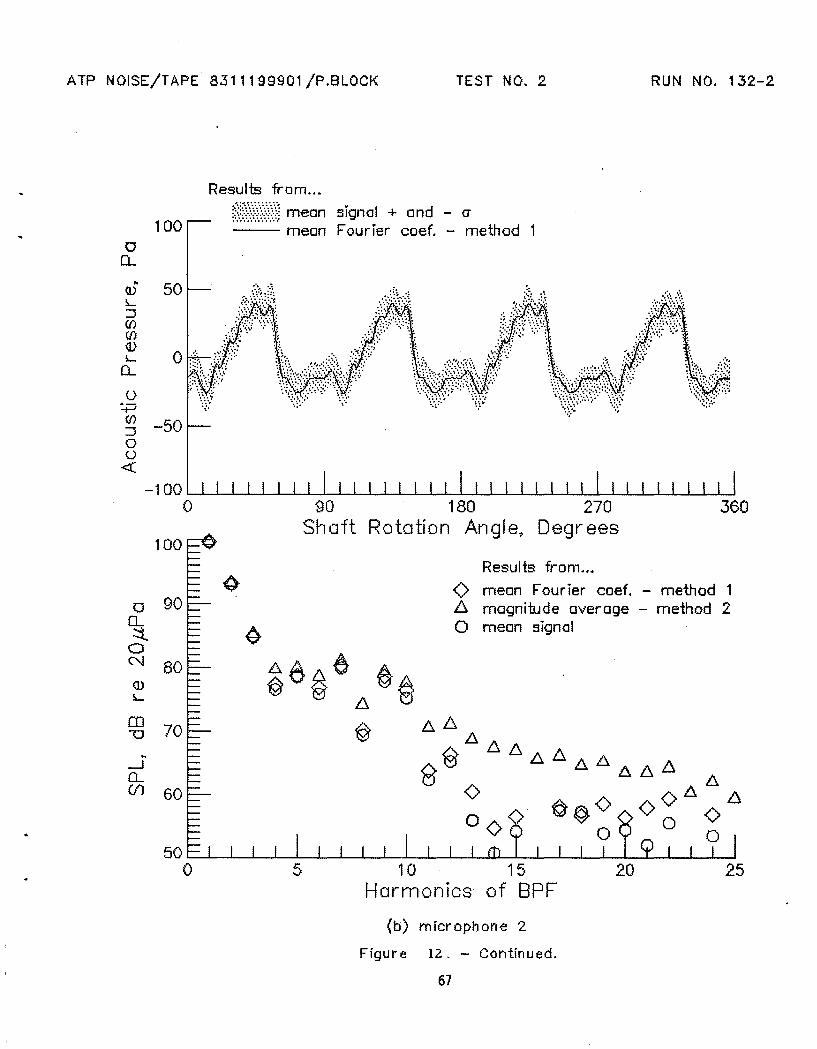
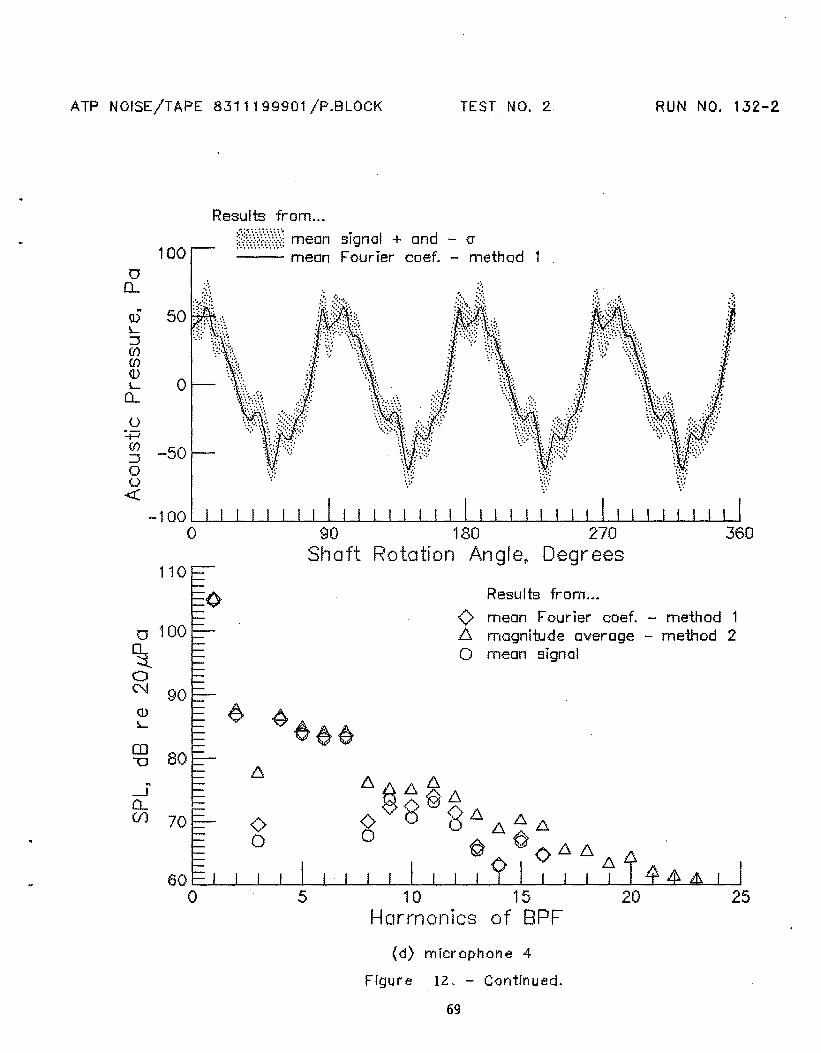
passage frequency. In the time domain an average time history or mean signal was
computed by averaging the sampled pressure signal over the 120 revolutions of the
shaft. This resulted in a mean value of the signal and standard deviation (0) for
each of the 512 points. These results are presented as a function of the shaft
rotation angle and labeled "mean signal + and - 0" on the data plots. These
results show how much data scatter exists at a particular microphone location and
for a given propeller configuration. The mean signal is Fourier analyzed and
presented in the frequency domain as a function of the harmonics of the blade
passage frequency (BPF).
In the frequency domain two methods of analysis were used. In the first
method each revolution of data was Fourier analyzed to produce the sine and cosine
coefficients for the first 25 harmonics of the BPF (an and bn; n = 1-25,
respectively). These coefficients are averaged over the 120 revolutions of data
yielding an and 5n• The root mean square (rms) amplitude of the noise
contribution for each of the harmonics is computed from these using
cn = Jan2 + 5n2/ 12
10
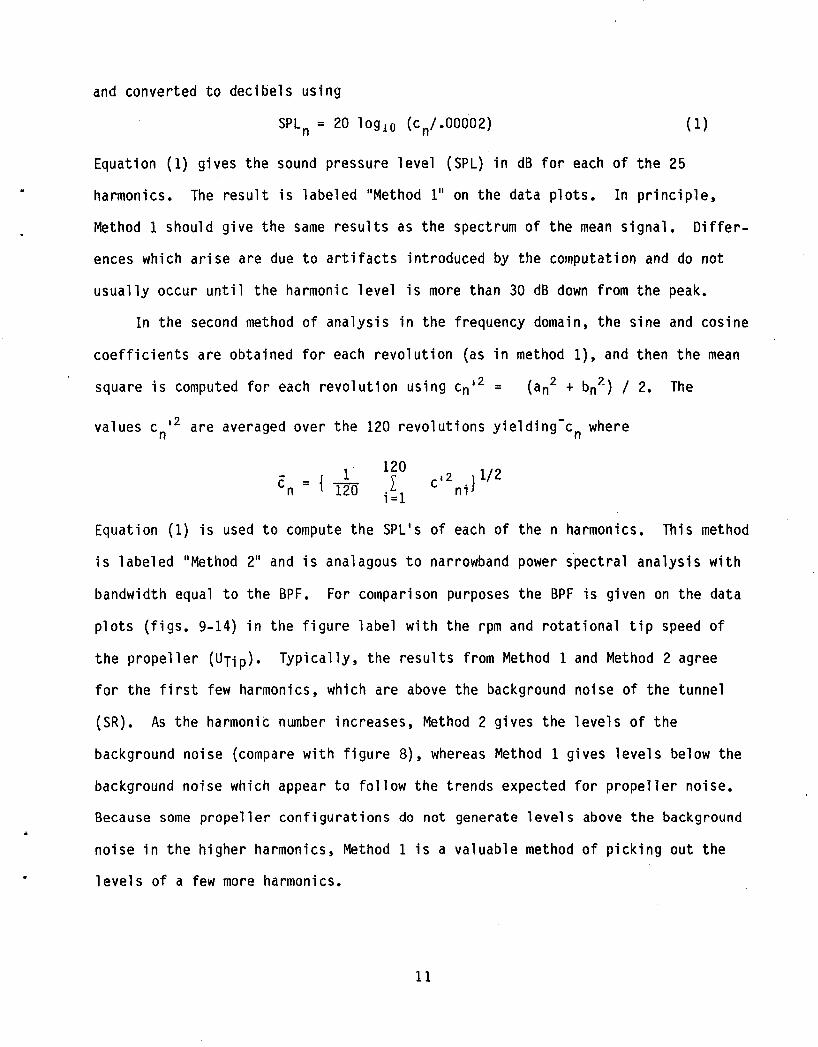
and converted to decibels using
( 1)
Equation (1) gives the sound pressure level (SPL) in dB for each of the 25
harmonics. The result is labeled IIMethod 111 on the data plots. In principle,
Method 1 should give the same results as the spectrum of the mean signal. Differ
ences which arise are due to artifacts introduced by the computation and do not
usually occur until the harmonic level is more than 30 dB down from the peak.
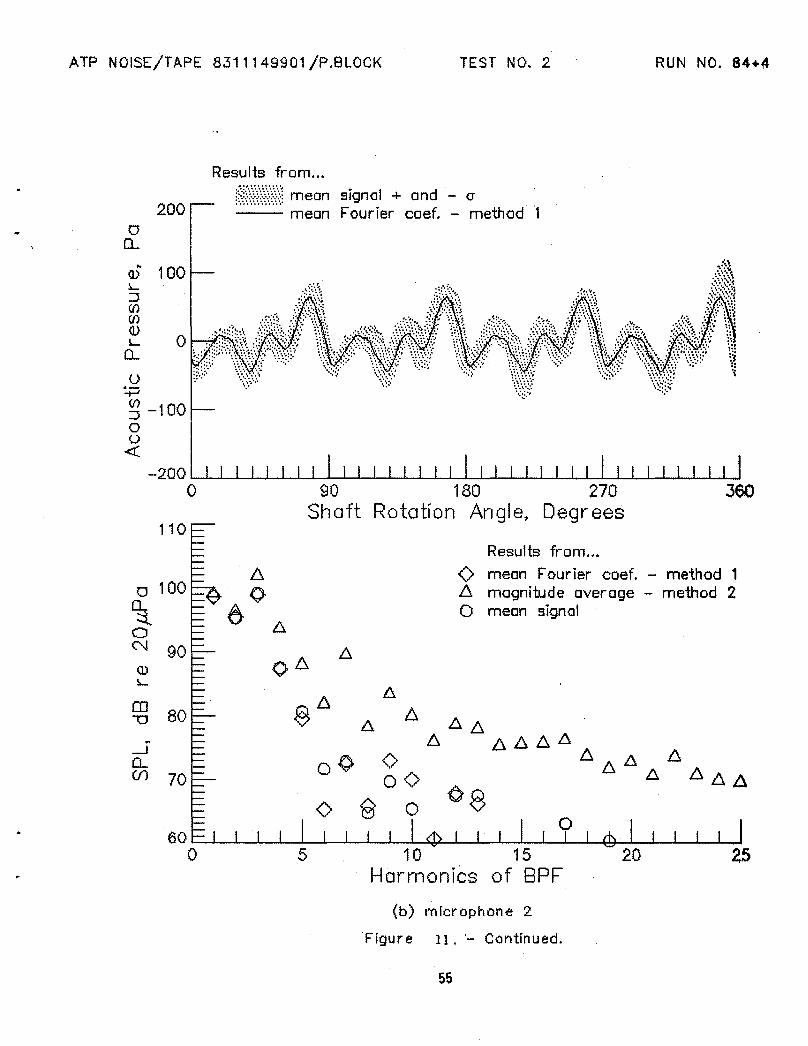
In the second method of analysis in the frequency domain, the sine and cosine
coefficients are obtained for each revolution (as in method 1), and then the mean
square is computed for each revolution using cn,2 = (an2 + bnl ) / 2. The
values cnl2 are averaged over the 120 revolutions yielding-c n where
- {Ic n = 120
120I
i=1
Equation (1) is used to compute the SPLts of each of the n harmonics. This method
is labeled "Method 211 and is analagous to narrowband power s'pectral analysis with
bandwidth equal to the BPF. For comparison purposes the BPF is given on the data
plots (figs. 9-14) in the figure label with the rpm and rotational tip speed of
the propeller (UTip). Typically, the results from Method 1 and Method 2 agree
for the first few harmonics, which are above the background noise of the tunnel
(SR). As the harmonic number increases, Method 2 gives the levels of the
background noise (compare with figure 8), whereas Method 1 gives levels below the
background noise which appear to follow the trends expected for propeller noise.
Because some propeller configurations do not generate levels above the background
noise in the higher harmonics, Method 1 is a valuable method of picking out the
levels of a few more harmonics.
11

Finally, the results from method 1, namely in and 6n are used to reproduce the
pressure time history for one revolution of the shaft. This time history, which
is truly periodic, is plotted with the mean signal. Comparison of these time
history results reveals differences in the noise generated by differences in the
blades themselves or in their pitch setting. The above calculations are presented
for each of the eleven microphones at a carriage stop corresponding to angles
between 36.4 and 40.8 degrees upstream of the propeller disk plane (refer to Table
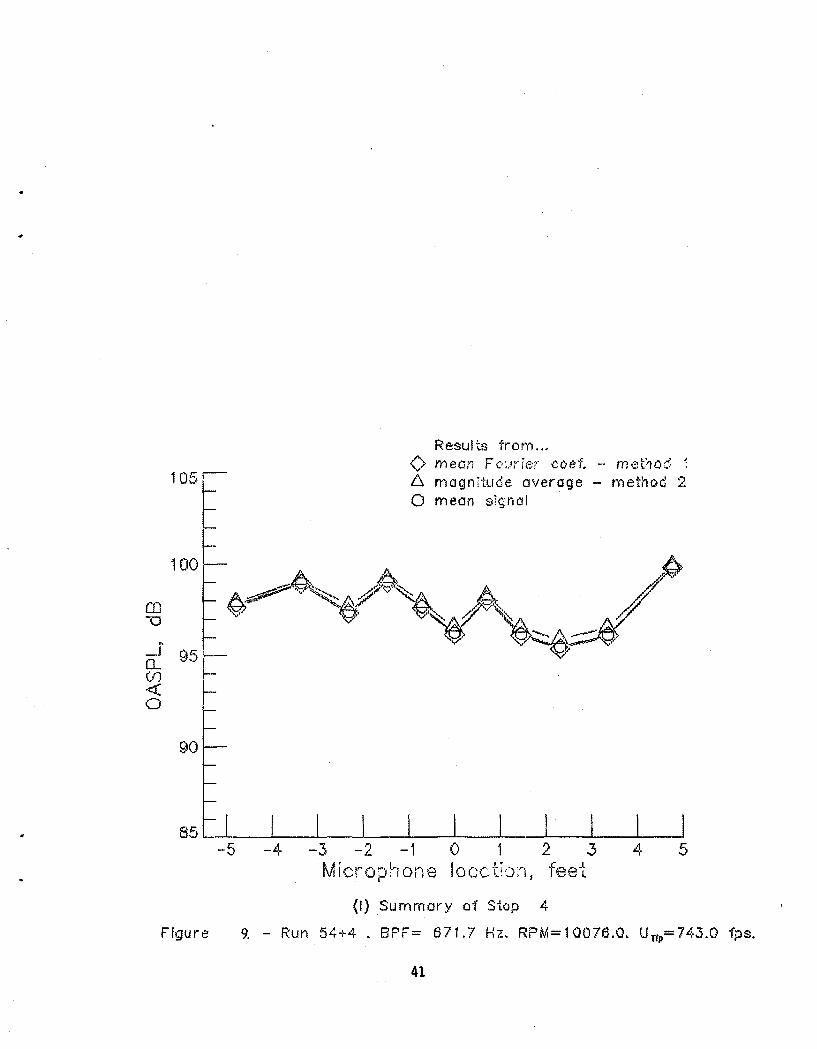
1). The data for the eleven microphones are followed by a summary of that stop.
This summary consists of the OASPL, calculated all three ways, plotted against the
microphone location.
DATA RESULTS
The data which are presented were obtained at angles corresponding to between
36.4° and 40.8° forward (upstream) of the propeller disk plane (refer to Table
1). These angles were chosen because they tend to show the effect of the unsteady
loading of the propeller. The data have not been corrected,for differences in
distances in order to release the data in a timely manner.
The data obtained from the sting-mounted SR at ~.75 = 12° with 4 blades is
shown in figure 9. Figures 9(a) through 9(k) give the results for each of the
individual microphones (1 through 11) respectively. Figure 9(1) is a summary of
the OASPLls for the particular carriage stop - in this case stop 4. Figure 10
shows the results from the same condition, except the angle of attack is +8°. The
format of presentation is the same. Figure 11 shows the CR results. Figures 12,
13, and 14 show the SR pusher, SR tractor with 8 blades, and SR tractor with 4
blades, espectively.
Finally, since the number of points per revolution was held constant while
the BPF increased by a factor of 2 on the data for run 141 (SR tractor with
8-blades), harmonics above 20 are affected by aliasing.
12

REFERENCES
1. Mitchell, G. A.; Mikkelson, D. C.: Summary and Recent Results from the NASAAdvanced High-Speed Propeller Research Program. NASA TM 82891, 1983.
2. Block, P. J. W. and Gentry, G. L.: Evaluation of the 4- x 7-Meter Tunnel forPropeller Noise Measurements. NASA TM 85721, 1984.
13


......(J'I
Table 1.- Angles of the microphone array with respect to the propeller disk plane forall configurations, in degrees.
Microphone carriage stop labelRuns Configuration 8x3
in. 8 7 6 5 4 3 2 1 0 -1 -2 -3 -4 -5 -6.. -
52-54 SRT/sting 0 77 .8 72.6 60.7 50.8 40.8 30.7 20.5 10.2 0 -10.2 -20.5 -30.7 -40.8 -50.8 -60.763,64,67,68 SRT .. +8° 3.75 77.5 72.1 59.1 48.2 37.1 26.0 15.0 4.2 - 6.1 -16.0 -25.7 -35.0 -44.1 -53.1 -62.165,66,69,70 SRT .. _8° -.75 77 .9 72.7 61.0 51.3 41.5 31.6 21.6 11.4 1.2 - 9.0 -19.4 -29.8 -40.1 -50.3 -60.4
82-85 CRT 0° 2.61 77.6 72.3 59.6 49.0 38.3 27.5 16.7 6.0 - 4.3 -14.3 -24.2 -33.8 -43.2 -52.4 -61. 786 .. +8° 6.36 77 .3 71.7 58.0 46.2 34.3 22.4 10.9 .1 -10.3 -19.9 -29.1 -37.8 -46.6 -54.6 -63.0
87 .. _8° 1.86 77.7 72.4 59.9 49.5 39.0 28.4 17.8 7.2 - 3.0 -13.1 -23.1 32.9 -42.5 -52.0 -61.4
132-135 SRP (pylon) -40. 80.2 77 .0 71.1 67.1 63.5 60.1 56.6 52.9 48.8 43.9 37.5 28.8 15.6 -4.74 -32.5
136-151 SRT (pylon) - 5. 78.2 73.4 62.5 53.8 45.2 36.4 27.4 17 .9 8.1 - 2.1 -13.0 -24.3 -35.7 -47.3 -58.6
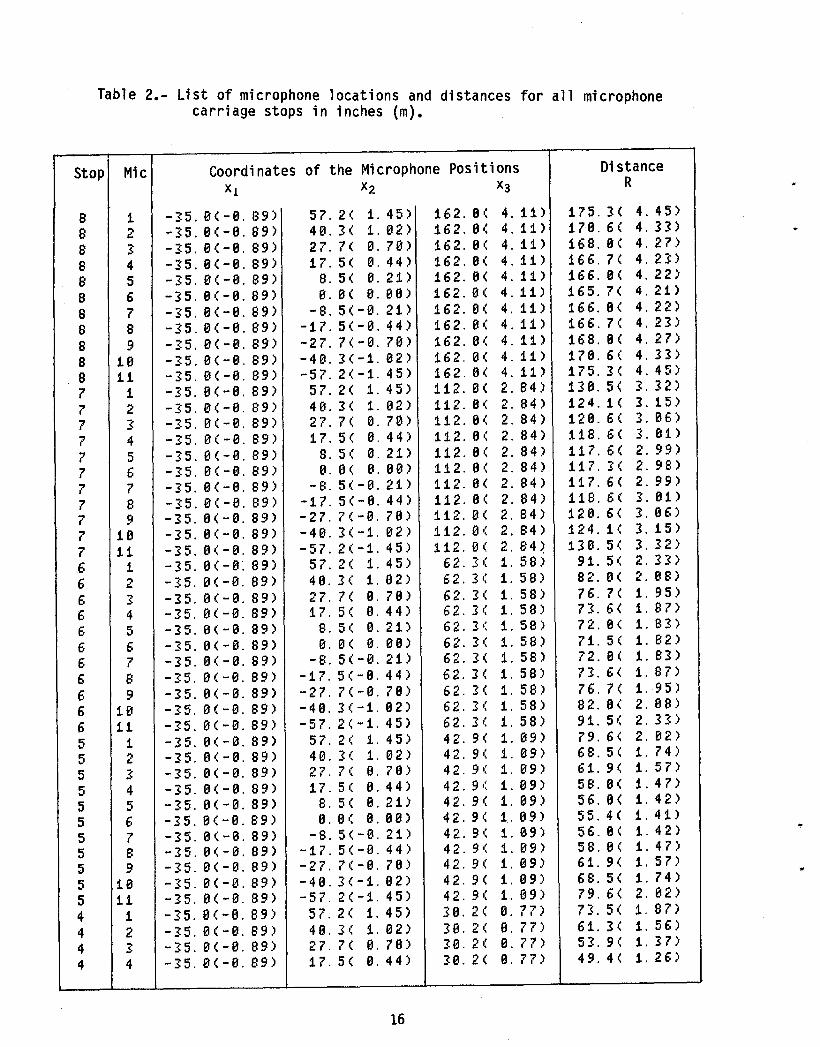
Table 2.- List of microphone locations and distances for all microphonecarriage stops in inches (m).
Stop Mic Coordinates of the Microphone Positions DistanceXl X2 X3 R
8 1 -35.0(-0.139) 57. 2 ( 1. 45) 162. a( 4. 11) 175.1( 4. 45)
8 2 -35.13<-0.89) 40. 3 ( 1. 02) 162.0': 4. 11) 170.6( 4. :n)
8 3 -35.0(-0.89) 27. 7 ( 0. 70) 162.9( 4. 11) 168.0( 4.27)
8 4 -35.13<-0.89) 17. 5 ( 0. 44) 162.9( 4. 11) 166.7( 4. 23)
8 5 -35.0(-9.89) 8. 5 ( 9. 21) 162.9( 4. 11) 166.9( 4. 22)
8 6 -35.9(-9.89) 9. 9 ( 9. 99) 162.0( 4. 11) 165.7( 4. 21)
8 7 -35.9(-0.89) -8.5(-9.21) 162.13< 4. 11) 166.9( 4. 22)
8 8 -35.9(-9.89) -17.5(-0.44) 162.9( 4.11> 166.7( 4.23:)
8 9 -35.0(-9.89) -27.7(-0.70) 162.IH 4.11> 168. (H 4.27>
8 10 -35.9(-0.89) -49.3(-1.02) 162.0( 4. 11) 179.6( 4.13:)
8 11 -35.13<-9.89) -57.2(-1. 45) 162.9( 4. 11) 175.3( 4. 45)
7 1 -35. ~l(-0. 89) 57. 2 ( 1. 45) 112.9( 2. 84) 139.5( 3. 32)
7 2 -35.0(-0.89) 40. 3 ( 1. 92) 112.9( 2. 84) 124.1( 3. 15)
7 3 -35.13<-0.89) 27. 7 ( 0. 79) 112. a( 2. 84) 120.6( 3. 06)
7 4 -35.9(-9.89) 17. 5 ( 9. 44) 112. 0': 2. 84) 118.6( 3.01>
7 5 -35.0(-0.89) 8. 5 ( 13.21> 112.e( 2. 84) 117.6( 2. 99)
7 6 -35; 0(-0. 89) 0. 9 ( 0. 01D 112.0( 2. 84) 117. H 2.98)
7 7 -35.9(-9.89) -8.5(-0.21> 112.9( 2. 84) 117.6( 2. 99)
7 8 -35.0(-9.89) -17.5(-0.44) 112.9( 2. 84) 118.6( 3.9U
7 9 -35.13<-0.89) -27.7(-9.79) 112.9( 2. 84) 129.6( 3. 96)
7 10 -35.13<-0.89) -49.3(-1.92) 112.13< 2. 84) 124.1< 3. 15)
7 11 -35.9(-13.89) -57.2(-1.45) 112.9( 2. 84 ~ 1313.5( 3. 32)
6 1 -35.9(-13.89) 57. 2 ( 1. 45) 62. 3 ( 1. 58) 91. 5 ( 2. :n)
6 2 -35.9(-9.89) 49. 3 ( 1. 132) 62. 3'; 1. 58) 82. 9 ( 2. es)6 3 -35.9(-9.89) 27. 7 ( 0. 70) 62. 3 ( 1. 5 B) 76. 7 ( 1. 95)
6 4 -15.0(-0.89) 17. 5 ( 0. 44) 62. 1 ( 1. 58) 73:.6( 1. B7)
6 5 -35.0(-0.89) B. 5 ( 0.21> 62. 3: ': 1. 58) 72. 9 ( 1. s:n
6 6 -35. ~l(-9. 89) 0. 0 ( 0. 90) 62.3': 1. 58) 71. 5 ( 1.82)
6 7 -15.9(-0.89) -8.5(-0.21) 62. 1 ( 1. 58) 72. 0 ( 1. s:n6 8 -35.0(-0.89) -17.5(-9.44) 62. 3: ( 1. 58) 71.6( 1. 87)
6 9 -15.0(-9.89) -27.7(-9.79) 62. 3 ( 1. 58) 76. 7 ( 1. 95)
6 10 -35.9(-9.89) -49.3(-1.92) 62. 3 -I~ 1. 58) 82. a ( 2. 0 B)
6 11 -35.9(-13.89) -57.2(-1.45) 62. 3 ( 1. 58) 91. 5'; 2.3:n
:5 1 -35.9(-9.89) 57. 2 ( 1. 45) 42. 9 ( 1. 09) 79. 6 ( 2. e2)
5 2 -35.0(-9.89) 40. 3 ( 1. 02) 42. 9 ( 1. 09) 68. 5 ( 1. 74)
5 3 -35.13<-9.89) 27. 7 ( 13. 79) 42. 9 ( 1. 09) 61. 9 ( 1.57>
5 4 -35.9(-9.89) 17. 5 ( 9. 44) 42. 9': 1. 99) 58. 9 ( 1.47>
:5 :5 -35.9(-0.89) 8. 5 ( 9. 21) 42. 9( 1. 99) 56. 9 ( 1. 42)
:5 6 -35.9(-9.89) 0. 9 ( B. 90) 42. 9 ( 1. 09) 55. 4 ( 1.41>
5 7 -35.0(-9.89) -8.5(-9.21> 42. 9 ': 1. 99) 56. 0 ( 1. 42)
5 8 -35.9(-9.89) -17.5(-£1.44) 42. 9 ( 1. 09) 58. 9 ( 1.47)
:5 9 -35.9(-9.89) -27.7(-9.79) 42. 9 ( 1. 09) 61. 9 ( 1.57>
:5 19 -35.9(-9.89) -40.3(-1. 02) 42. 9 ( 1. 09) 68. 5 ( 1. 74)
5 11 -35.0(-0.89) -57.2(-1.45) 42. 9 ( 1. 09) 79. 6 ( 2. 02)
4 1 -35. ~)(-9. 89) 57. 2 ( 1. 4:5) 313. 2 ( 0.77> 73. 5 ( 1. 87)
4 2 -35.0(-9.89) 40. 3': 1. 02) 39. 2 ( 0.77> 61. 3 ( 1. 56)
4 3 -35.0(-0.89) 27. 7 ( 0. 70) 30. 2( 0.77> 53. 9 ( 1.37>
4 4 -35.0(-0.89) 17. 5 ( e. 44) 39. 2 ( e. 77) 49. 4 ( 1. 26)
16
..
Table 2.- Continued.
Stop Mic Coordinates of the Microphone Positions Distance
Xl X2 X3 R
4 5 -35.9(-0.89) 8. 5 ( 9. 21) 3B. 2 ( 0.7n 47. 0 ( 1. 19)
4 6 -35.0(-0.89) 9. a ( B.IHD 39. 2 ( 0.77) 46. 2 ( 1.17)
4 7 -35.9(-9.89) -8.5(-9.21) 39. 2': 9.7n 47. IH 1. 19)
4 8 -35.0(-13.89) -17.5(-9.44) 3B. 2 ( 0.77) 49. 4 ( 1. 26)
4 9 -35.0(-9.89) -27. 7(-B. 70) 30. 2 ( 9. 77) 53. 9 ( 1.37)
4 10 -35.13(-9.89) -49.3(-1. 132) 30. 2 ( a.7n 61. 3 ( 1. 56)
4 11 -35. IH-13. 89) -57.2(-1.45) 39. 2 ( 13.7n 73. 5 ( 1. £In
3 1 -35.0(-13.89) 57. 2 ( 1. 45) 29. 8 ( 0. 53) 713. 2 ( 1. (8)
3 2 -35.13(-9.89) 49. 3 ( 1.132) 213. 8 ( 0. 53) 57. 3 ( 1. 45)
3 3 -35.13(-13.89) 27. 7 ( 9. 79) 213. 8 ( a. 53) 49. 2 ( 1. 25)
3 4 -35.0(-13.89) 17. 5 ( 9. 44) 213. 8 ( 9. 53) 44. 3 ( 1. 13)
3 5 -35.1:)(-9.89) 8. 5 ( 13.21) 29. 8 ( 9. 53) 41. 6 ( 1. 06)
3 6 -35. IH-e. 89) 9. 9 ( e. 913) 213. 8 ( e. 53) 49. 7 ( 1. e 3)
J 7 -35.9(-13.89) -8.5(-13.21) 20. 8 ( e. 53) 41. 6 ( 1. a 6)
3 8 -35.0(-9.89) -17.5(-9.44) 29. 8 ( 9. 53) 44.3( 1. 13)
3 9 -35.9(-9.89) -27.7(-9.79) 213. 8 ( B. 53) 49. 2 ( 1. 25)
3 113 -35.13(-9.89) -413.3(-1. B2) 29. 8 ( 13.5:n 57. 3 ( 1. 45)
3 11 -35.9(-9.89) -57.2(-1.45) 2B. 8': e. 53) 79. 2 ( 1. (8)
2 1 -35.9(-9.89) 57. 2 ( 1. 45) 13. it: 9. 33) 68. 3 ( 1. (4)
2 2 -35.13(-13.89) 4 a. 3 ( 1. 132) 13. 1 ( 9. 33) 54. 9 ( 1. 4 a)
2 " -35. B(-9. 89) 27. 7 ( 9. 713) 13. 1 ( B. 33) 46. 5 ( 1. 18)-'
2 4 -35.9(-13.89) 17. 5 ( 9. 44) 13. 1 ( e. 33) 41. 3 ( 1. a 5)
2 5 -15. (H-9. 89) 8. 5 ( e. 21) 13. 1': e. 33) 38. 3 ( 13.9n
2 6 -35.13(-9.89) e. 13 ( e. e 9) 13. 1 ( e. 33) 37. 4 ( a. 95)
2 7 -35.13(-9.89) -8.5(-13.21> 13. 1 ( 9. 33) 38. 3 ( 0.9n
2 8 -35.9(-13.89) -17.5(-13.44) 13. 1 ( 0. 33) 41. 3 ( 1. a 5)
2 9 -35.13(-0.89) -27.7(-13.79) 13.1': 0. 33) 46. 5 ( 1. 18)
2 113 -35.13(-13.89) -49.3(-1.92) 13. 1 ( e. 33) 54. 9 ( 1. 4 a)
2 11 -35.13(-13.89) -57.2(-1. 45) 13. 1 ( 0. 33) 68. 3 ( 1. (4)
1 1 -35.13(-13.89) 57. 2 ( 1. 45) 6. 3 ( 9. 16) 67. 3 ( 1.(1)
1 2 -35.9(-13.89) 4 e. 3 ( 1. 13 2) 6. 3 ( 0. 16) 53. 7 ( 1. 36)
1 3: -35.13(-13.89) 27. 7 ( e. (0) 6. 3 ( 9. 16) 45. 1 ( 1. 15)
1 4 -35.9(-9.89) 17. 5 ( 0. 44) 6. 3 ( 0. 16) 39. 6 ( 1.0U
1 5 -35.9(-9.89) 8. 5 ( 0.21> 6. 3 ( 9. 16) 36. 6 ( 0. 93)
1 6 -35.13(-9.89) 9. 9': e. 90) 6. 3 ( 0. 16) 35. 6 ( a. 90)
1 7 -35.9(-9.89) -8.5(-0.21) 6. 3': 0. 16) 36. 6 ( a. 93)
1 8 -35. (H-0. 89) -17.5(-13.44) 6. 3 ( 9. 16) 39. 6 ( .1. 0 U
1 9 -35.9(-0.89) -27.7(-9.70) 6. 3 ( 0. 16) 45. 1 ( 1. 15)
1 10 -35. IH-13. 89) -413.3(-1.92) 6. 3 ( e. 16) 53. 7 ( 1. 36)
1 11 -35.9(-13.89) -57.2(-1. 45) 6. 3 ( 0. 16) 67. J( 1.(1)
e 1 -35.9(-9.89) :; 7'. 2 ( 1. 4:;) e. e( e. ee) 67'. B( 1. (' B)
0 2 -35.13(-9.89) 49. 3 ( 1. 92) 9. 13 ( e. 0(3) 53. 4 ( 1. 36)
0 3 -35.13(-0.89) 27. 7 ( 0. 79) 9. 9 ( 9.01n 44. 6 ( 1. 13)
a 4 -35.9(-9.89) 17. 5 ( 9. 44) 0. a·: a. 139) 39.1( 9. 99)
f) 5 -35.13<-13.89) 8. 5 ( a. 21) a. e ( a. 00) 36.ft( e.91>
0 6 -35.13(-13.89) 9.IH 0.aln 0. 9 ( e. 00) 35.IH a. 89)
0 7 -35.9(-9.89) -8.5(-9.21) 9. 9 ( 9. 90) 36. e ( 0.9U
e 8 -35. f)(-9. 89) -17.5(-9.44) 0. 9 ( e. 99) J 9. 1 ( 0. 99)
17

Table 2.- Continued.
Stop Mic Coordinates of the Microphone Positions Distance
Xl X2 X3 R
9 9 -35.9(-9.89) -27.7(-9.79) 0. 9 ( e. 89) 44. 6 ( 1. 13)
9 19 -35. IH-9. 89) -40. :H-1. 92) 9. 9 ( 9. 99) 53. 4 ( 1. 36)
9 11 -35.9(-0.89) -57.2(-1. 45) 9. 0 ( 9. 99) 67. 9 ( 1. 79)
-1 1 -35.9(-0.89) 57. 2 ( 1. 45) -6.3(-9.16) 67. 3 ( 1.71'
-1 2 -35. fH-9. 89) 49. 3 ( 1. 92) -6.3(-9.16) :5 3. 7 ( 1. 36)
-1 3 -35.9(-9.89) 27. 7 ( 9. 79) -6.3(-9.16) 45. 1 ( 1. 15))
-1 4 -35.9(-9.89) 17. 5 ( 9. 44) -6.3(-0.16) 39. 6 ( 1.8U
-1 :5 -35. fH-9. 89) 8. 5 ( 9. 21) -6.3(-9.16) 36. 6 ( 9. 93)
-1 6 -35.0(-9.89) 9. 9 ( 9. 99) -6.3(-9.16) 35. 6 ( 8. 98)
-1 7 -35.0(-0.89) -8.5(-0.21) -6.3':-9.16) 36. 6 ( 9. 93)
-1 8 -35.0(-9.89) -17.5(-9.44) -6.3(-0.16) 39. 6 ( 1.91'
-1 9 -35.0(-9.89) -27.7(-0.70) -6.3(-0.16) 45. 1 ( 1. 15)
-1 10 -35.0(-9.89) -49.3(-1. 02) -6.3(-0.16) 53. 7 ( 1. 36)
-1 11 -35. fH-9. 89) -57.2(-1.45) -6.3('-0.16) 67. 3 ( 1. 71)
-2 1 -35.9(-9.89) 57. 2 ( 1. 45) -13.1(-9.33) 68. :n 1. 74)
-2 2 -35. fH-0. 89) 49. 3 ( 1. 92) -13.1':-9.33) . 54. 9 ( 1. 49)
-2 3 -35.0(-9.89) 27. 7 ( 9. 79) -13.1':-9.13) 46. 5 ( 1. 18)
-2 4 -35.9(-0.89) 17. 5 ( 9. 44) -13.1':-9.33) 41. "3 ( 1. 85)
-2 :5 -35.9(-9.89) 8. 5 ( 9.21> -13.1(-9.33) 38. J( 8. 97>
-2 6 -35. fH-9. 89) 9. 9 ( e. 913) -13.1(-9.3:n 37. 4 ( 9. 9:5)
-2 7 -35.0(-9.89) -8.5(-9.21> -13.1(-9.33) 38. 3 ( 9.97>
-2 8 -35.9(-0.89) -17.5':-13.44) -13.1(-9.33) 41. 3 ( 1. 95)
-2 9 -35.0(-9.89) -27.7(-9.7ID -13.1<-13.33) 46. 5 ( 1. 18)
-2 10 -35.0(-0.89) -49.3(-1.92) -13.1(-9. J3) 54. 9 ( 1. 48)
-2 11 -15.0(-9.89) -57.2(-1. 45) -11.1(-9.11) 68. 3 ( 1. 74)
-~ 1 -35.9(-9.89) 57. 2 ( 1. 45) -29.8(-9.53) 70. 2 ( 1. 78)
-3 2 -35.0(-0.89) 49. 3 ( 1. 02) - 2 9. 8( - 9. 5 3 ) 57. 3 ( 1. 45)
-3 3 -35.13(-9.89) 27. 7 ( 9. (0) -29.8(-B.5:n 49. 2 ( 1. 25)
-3 4 -35.0(-9.89) 17. 5 ( 9. 44) -29.8(-9.53) 44. 3 ( 1. 13)
-3 5 -15.0(-9.89) B. 5 ( 0. 21) -213.8(-9.53) 41. 6 ( 1'. 96)
-3 6 -35.0(-13.89) B. 9 ( 9. BID -29.8('-9.53) 40. 7 ( 1.9:n
-3 7 -35.9(-0.89) -8.5(-0.21> -20.8(-0.53) 41. 6 ( 1. a 6)
-3 8 -35.9(-9.89) -17.5(-9.44) -29.8(-9.5:n 44. 3 ( 1.1:n
-3 9 -35.9(-9.89) -27.7(-9. (9) -29.8(-9.53) 49. 2 ( 1. 25)
-3 19 -35. IH-9. 89) -49.3(-1.92) -29.8('-9.53) 57. 3 ( 1. 45)
-3 11 -35.9(-9.89) -57.2(-1.45) -29.8(-9.53) 79. 2 ( 1. 7S)
-4 1 -35.9(-0.89) 57. 2 ( 1. 45) -39.2(-9.77> 73. 5 ( 1. 87)
-4 2 -35.9(-9.89) 49. 3 ( 1. 92) -39.2(-9.77> 61. 3 ( 1. 56)
-4 3: -35. IH-9. 89) 27. 7 ( 9. (9) -39.2(-9.77> 53. 9 ( 1.37>
-4 4 -35. ~H-9. 89) 17. 5 ( 9 44) -39.2(-9.77> 49. 4 ( 1. 26)
-4 5 -35.9(-9.89) 8. 5 ( 9.21> -HI. 2(-9. 77> 47. 9 ( 1. 19)
-4 6 -35.9(-9.89) 9. 9 ( 9. 13 9) -313.2(-9.77) 46. 2 ( 1.17>
-4 7 -35. tl(-9. 89) -S. 5(-9.21) -39.2(-13.77> 47. 13 ( 1. 19)
-4 8 -35.9(-0.89) -17.5(-9.44) -39.2('·9.77) 49. 4 ( 1. 26)
-4 9 -35.13(-9.89) -27.7(-9.713) -39.2('-13.77> 53. 9 ( 1.37>
-4 19 -35.9(-9.89) -413.3(-1. 92) -39.2(-9.77> 61. 3 ( 1. 56)
-4 11 -35.9(-0.89) -57.2(-1.45) -313.2(-9.77> 73. 5 ( 1.87>
-5 1 -35.9(-9.89) 57. 2 ( 1. 45) -42.9(-1. 99) 79. 6 ( 2. e2)
18
..
Table 2.- Concluded.
Stop Mic Coordinates of the Microphone Positions DistanceXi X2 X3 R
--5 2 -35.9(-9.89) 49. 3 ( 1. 92) -42.9(-1. 99) 68. 5 ( 1. 74)
-5 3 -35. /H-9. 89) 27. 7 ( 0. 79) -42.9(-1. (9) 61. 9 ( 1. 57>
-5 4 -35. /H-9. 89) 17. 5 ( 0. 44) -42.9(-1. 99) 58. 8 ( 1. 47)
-5 5 -35.13<-0.89) 8. 5 ( 9. 21) -42.9(-1. 99) 56. 9 ( 1. 42)
-5 6 -35.13<-9.89) 0.IH 9. 99) -42.9(-1. 99) 55. 4 ( 1.41>
-5 '( -35. /H-9. 89) -8.5(-9.21> -42.9(-1. 69) 56. 6 ( 1. 42)
-5 B -35.0(-9.89) -17.5(-9.44) -42.9(-1. 89) 58. 8 ( 1.47>
-5 9 -15.9(-9.89) -27.7(-9.78) -42.9(-1.139) 61. 9 ( 1.57>
-5 10 -15.9(-8.89) -40.3(-1. 82) -42.9(-1.139) 68. 5 (, 1. 74)
-5 11 -35.9(-9.89) -57.2(-1. 45) -42.9(-1. 139) 79. 6 ( 2. 82)
-6 1 -35.9(-0.89) 57. 2 ( 1. 45) -62.3(-1. 58) 91. 5 ( 2. J 3)
-6 2 -35.13(-0.89) 40.3( 1. 02) -62.3(-1.58) 82. e ( 2. 0 B)
-6 3 -35.0(-9.89) 27. 7 ( 8. (8) -62.3(-1. 5B) 76. 7 (, 1. 95)
-6 4 -35. IH-9. 89) 17. 5 ( B. 44) -62.3(-1.58) 73. 6 ( 1. Bn
-6 5 -35.13(-0.89) 8. 5 ( 9. 21) -62.3(-1.58) 72. 9 ( 1. s:n-6 6 -35.9(-9.89) 9. 8 ( 0. e 0) -62.3(-1.58) 71. 5 ( 1. 82)
-6 7 -35.0(-9.89) -S. 5(-0. 21> -62.3':-1. S8) 72. 0 ( 1. 83)
-6 8 -35. ~,l(-e. 89) -17. :5<-0. 44) -62.3(-1. 58) 73. 6 ( 1.87)
-6 9 -35. ~,l(-9. 89) -27.7(-0.70) -62.3(-1. 58) 76. ·7 ( 1. 95)
-6 19 -35.0(-0.89) -49.3(-1. 132) -62.3(-1. 58) 82. 9 ( 2. 98)
-6 11 -35.9(-9.89) -57.2(-1. 45) '-62.3(-1. 58) 91. 5 ( 2.3:0
19

Table 3.- Test conditions.
HARDWARE CONDITIONS
Run Mount/ Type Number of Nominal Pitch, Yaw,# Conf; gu rat; on Propell er Blades 8. 75' rps deg. deg.
deg. -52 Sting/tractor SR 4 20 100 0 053 II II II II 20 120 II II
54 II II II II 12 168 II II
55 II II II II 12 190 II II
63 St i ngft ractor SR 4 20 100 8 064 II 120 865 II 100 -866 II 120 -867 12 168 868 II 190 869 II 190 -870 II 168 -8 II
82 St; ng/t ractor CR 4+4 20 100 0 083 II II II II II 120 II II
84 II II II II 12 168 II II
85 II II II II II 190 II II
86 II II II II II 168 +8 II
87 II II II II II 168 -8 II
132 Pylon/pusher SR 4 12 168 0 0133 II II II II II 190 II II
134 II II II II 20 100 II II
135 II II II II II 120 II II
136 Pylon/tractor SR 4 16 perf 0 0137 II II II 168138 II II II 190139 II II 20 perf140 SR 8 12 perf141 II II 168142 II II 190143 SR 4 perf144 II 168145 II 190146 II perf 10147 II 168 II
148 II II 190 II
149 II 20 perf II
150 II II 100 II
151 II II 120 II
20

Table 3 (contld)
Measured ValuesActual Posltlon of8.75 , disk plane TA, PA' U, T, Figure
with respect fps lbf No.deg. to reference,* OF slugs/ft3
inches (ax3)
20.6 o. 43.0 .00243 99.6 17.720.6 II 43.0 II 99.6 26.412.7 II 43.7 II 99.7 X ** 912.7 II 43.9 II 99.8 X **
20.6 3.75 62.5 .00235 101.0 6.0II 3.75 II 15.5II - 0.75 62.6 II 101.4 6.3II - 0.75 62.7 II 101.4 16.1
12.7 3.75 60.0 .00236 100.5 16.8 10II 3.75 59.0 .00237 100.5 27.5II - 0.75 57.0 28.6II - 0.75 56.7 .00238 100.4 17.8
21.3 2.61 67.5 .00228 102.4 9.821.3 II 65.6 .00229 21.913.3 II 52.6 .00239 100.5 25.5 11
II II 55.0 .00238 100.8 39.3II 6.36 55.1 .00238 101.2 25.2II 1.86 55.1 26.5
12.7 -40. 56.8 .00237 100.4 15.0 1212.7 II 59.0 .00237 100.5 26.220.6 II 65.0 .00233 101.7 14.120.6 II 67.1 .00232 102.2 25.8
17.5 - 5. 69.1 .00231 101.0 -II 69.0 .00232 102.2 34.1II 66.5 .00232 102.7 50.6
20.6 62.7 .00234 101.5 -12.7 59.6 .00236 102.0 -
58.7 .00236 101.2 20.6 1358.2 .00237 101.1 34.857.4 101.1 -58.0 101.5 15.4 1458.0 101.5 26.356.7 101.1 -56.7 101.4 12.956.4 101.4 23.0
20.6 55.3 .00238 101.5 -II 55.3 II 101.3 4.4II 54.8 II 101.2 13.2
*Reference position is the sting mounted SR at 0° angle of attack.**Balance data in question.
21

-
ttf~~f-== r==... .
~""--~ "",F:::::::---=~ \\ ~-,...J--~ J:---=~
l- t-I ~-;;:::
~r-. I--. r-= ::::,.-
~
\~I~-
.\ II
,\n\\
-\
II
-
\ \ \\
\+~~
•
Figure 1.- Three dimensional display of SR2 propeller design which was used in this study.
22
Runs 52-70
,+2.01·-.-4.92·IJ
I
STING MOUNTED CR 82-87
132-135
136-151
IIIII
-----''---. .-,---'--------MOUNTED SR PUSHER
(SRP)
MOUNTED I SR TRAC~~__ (SRT)I ~
ROTATION AXIS IFOR PUSHER I
AND T,RACTOR ~I
I n------------_1. I
I-tJ
II
IIIr
I
IIIJ
REFERENCE IL1NEj
III
II14 -----_._-
Figure 2.- Drawing of the propeller/nacelle configurations.
23
N-+:>0
SR TRACTORSR 'PUSHER
"
Figure 3.- Photo showing pylon mounted tractor and pusher configurations.

-Figure 4.- Isometric sketch of the microphone carriage in the Langley 4- x 7-Meter Tunnel.
25

FRONT VIEW
I j
~ELOCATIONS
SIDE VIEW
+I 1.50-(.0381m)
Ift:---~--t----=r
... ..... ~ '1"" .... - ....
MICROPHONE CABLE TAPEDTO UNDERSIDE OF MICROPHONE
CARRIAGE
N0'1
PLAN VIEW
MICROPHONE MOUNTi 57.20- (1.45m)40.27- (1.02m)
6- (.914m) ~
27.71- (.704m)
I >-+~:17.47- (.444m)8.46- (.215m)
.-·t +++ +......il- -<
MIC 1 2 3 4 5 6 7 8 9 10 11
36- (.914m)
3
Figure 5.- Sketch of microphone carriage showing dimensions and microphone locations_
~MIC 1
PROPELLER(rotates clockwiselooking into the flow)
-5-6
-8
-9
_10
_11MICROPHONE ARRAY AT STOP '0' "
. Figure 6.- Isometric sketch showing coordinate system in which microphone locations aredefined.
27
BELLMOUTHCOLLECTOR SCALE
LL.L.1' • , , , , I
-4- 10' .....(3.05m)
+8
MICROPHONECARRIAGE
STOP+
-6
0"- REFERENCE POSITION(STING MOUNTED SR)
+6
................
.'!iiiiiiiiii!~i: NTR 0 L
~~~~~~~ ROO M
.------o--o-----t::J!:::::::;W:::::::::::::::
FLOW DIREC.TION
Figure 7.- Planview of the 4- x 7-Meter Tunnel open test section showing microphonecarriage locations.
28

MIC 6 ORSPL= 9q.21q
~
, J
I I
76
74:
72
70
68OJ0
66
d6L1>w62-.J
~60:J(f) 58(f)wn:: 560-
o 5lfz6 52(f)
50
q8
q6 1..LL-LL.~u...J..J...L.1-L.1-L.LJ,...I...I-l..L.L.L..L.J....L.1..l....I....I...Ju....L.L.I-J.~.LL.L.L.L..L...L.I....L.Lu....L..I-U...LJ....U..J....L.U...U •.u.JIIIw....L1IJ...J...1111..u...11L..L.L111..L..LJIIIL...LJ.d.L.L.J11IU-.l-II.L..J,..L"O,.11111
o 1000 2000 3000 qOOO 5000 6000 7000~ 8000 9000 10000FREQUENCY, HZ
Figure 8.- Typical background noise spectra of the 4~ x 7-M Tunnel opentest section; U=lOO fps (30.5 m/s).
29

TP NOISE/TAPE 11071 OjP.BLOCK TEST NO.2 RUN NO. 54+4
Results from ...
I I I_LD.-J-.J-.li..LJ-L_L1.J.-J_LLJJ~J-l--l-..L.-J_-J....-l--lI.J90 180 270 360
Shaft Rototion Angle, Deq~~ees
"'.""""
~:<:X:;~:·;/,/ mean signal + and - cr-- mean Fourier coef. - method 1 .
·f;',:..50
a= :)\ill 25L::JmmQ)l-
n..
o I "'::
(J
«-50 l-_L.LLLJ
o
100 !--
~O0 0(\:'-- -e
0... v, ~::t
00.! 80 ---(l) ~L
~'CD"D 70r
~
-.JCL(f) GO[
500
o<>
5
Results from...
(> mean Fourier coer. - method 1I:::. magnitude overage - method 2o rneon signa!
HOrnl()nICS ()";: BQC', I
{a) rn fer op'-' Ot"!€:
Ffgure 9. - Run 54+4 . BPF= 671.7 Hz. RPM=10076.0. UTiP=743.0 fl1:3.
30
TP NOISE/TAPE 11071 OjP.8LOCK
Results from ...
TEST NO.2 RUN NO. 54+4
o0..
100
.",.,' .. ,.,
;~<:':"::/:':::/~ mean signal + and - cr-- mean Fourrer coef. - met.hod
' ..illL::J(f)(j)C!>L
o~
~ -50oo
-<-1 00 U-J'~-J-""""""-J.-l...J...lJ-3 I
o 90She-a100r
.()a Q0
r'<01' .I'
II::t
00J 80[IJ..1
.6L O·~ Li
CD6/:;:.
""D 70,
--.JD- €;.(/)
,I
60
I I I I I IJ-l.--l-.J_I-l_-LLJJ_.L-'-J<--!--J~I-....;II.-JI180 270 360
RotatIon Angle~ Degrees
Results from...
<> mean Fourier coef. - method 16. magnitude av'erage - me"thod 2o mean signal
~}_LJ,"-L.---.,,-,--I'15 20
O"~ BPF
(b) mfcrophone 2
Ffgure 9. - Contrnued.
31
TP NOISE/TAPE 11071 OjP.BLOCK TEST NO.2 RUN NO. 54+4
Results from...
Results frol11 ...
(> m,,~on Fourier coef. - method 1b. magnitude overoge - rne'~hod 2o meon signal
25I I I
20I I
15BPF
L.LiJ.-J I I I I I L.LJJ_lJ.__LJ_L I ,J-LJ_LU_L_L.LI~~O 180 270 360
Shott Rotation Ang!e~ Degrees
.,.,., .;::.:::.:::/:/}~ mean signal + and - (T
-- mean Fourier coef...... method40o
0....
o+:i~ -20o()
<C-4-0
0
100 c::-
~o0 gOt- .
0....
8J:::t~0 O·0J
(I)L
co70-0
-l~CL
(j) eot50(= I
0
{c) rnkrcphcne .3
Figure 9. - Ccntfn ued.
32

TP NOISE/TAPE 11071 O/P.BLOCK TEST NO.2 RUN NO. 54+4
•Results from ...
- method 1 4
I ! I I J-LLlLLJ.-LJJ270 360
Results from ...
<> mean Four ier coef.I:::. magnitude o\,"erage - methoc 2o mean signal
,-LLLJ.-J180
Rototfon Ancle.;;;.J ,
., , ..~/////;:,: mean signal + and - cr-- mean Fourier- coef. - method
/1\:[;::.:.,:\:,
I I I I I I I-LJ I I I I I90
Shaft
50
o-50
aj' 25·~
::J(f)(f)Q)I.....
Q
o:.t3(r) -"">5::J L.'~
ao«
aII
{d) micr ophone 4
Figure 9. - Ccntinued.
33

TP NOISE/TAPE 11071 a/p.BLOCK TEST NO. 2 RUN NO. 54+4
Results from...
I25
I20
I I I I L..LJ,--,-I-,--I-'---l.......J-...JIJ270 360
Degrees
(> mean Fourier coef. - method 1l::. magnitude overage - rnet,od 2o mean signal
Results from...
"""""0'
;::X:.:;".:::.:::/'; mean signal + and - cr-- mean Fourier coef,;:..,.- method
:," :::::::. ..•...•..•.••..:.•..:..~...~. .::::':.:::t:: . ',' , r :'::;~~';'.
[IA:. tllJ);\§:;.iJ',1{1. ;&il1;;;;\ ~;f'f%~'i"""" j;~;;;i;;1
I I I I I I LJ .;:?\... I I I I I I-LLJ I
90 180Sh aft Rototi on An gl e~
-40 Io
()
illL
40a
CL
~
-'0-(f) 60
{e) m krcphcne 5
Ffgure 9. - Ccntfnued.
34

TP NOISE/TAPE 11071 O/p.BLOCK TEST NO. 2 RUN NO. 54+4
Results from ....
o0..
o
40
.,.,.,.,.",~::::::::.:X:::/ mean signal + and - cr-- mean Fourier coef. - method
ResLlIts ft-om ...
<> mean Fourier eClef. - method 16 magnitude overage - method 2o mean signal
(j)I I I I
10Horrnonics
5
<{
-40 J-LLLLLIlJi..-J.-...J..I--"'f.-..i.-1....LI~I ...J-.I-LI---JI I I U-.LL_L1J'-'-....l-...'LJ.....LJ-LJo 90 180 270 360
Shaft Rototion Ang!e~ Degrees
{f} microphone (3
Ffgur e 9. - Contfnued.
35

TP NOISE/TAPE 11071 O/P.BLOCK TEST NO. 2 RUN NO. 54+4
Results from...
50
.,.,., ... ,.,
~::X:::X'X:/~ mean signal + and - cr-- mean Fourier coef. - method
LL........,--JII.-..-J-I_20 2515
,.r: B',DFUi
Results from...
(> mean Fourier caef. - method 1l::. magnitude O\lerage - me'a'lOd 2o mean signal
I I I I I LlLl-l.-.J I I I 1...J.....J.-1..l.-..J-.J1_LLJJ'180 270 360
Rotation Angle~ Degrees90
Shaft
50 '--'--'--'--.l.-.l.-~~.1.-.1.-.1.-='l>--J---L.--L.J I Io 5 10
HOrtT10nics
0
100r0 gO=-
Q.. aJ ~~00J
())
lorן.-
m-a
"---I(L(() 60
(g) microphone 7
Frgure 9. - Ccntinued.
36

TP NOISE/TAPE 11 071 O/P.8LOC~< TEST NO. 2 RUN NO. 54+4
Results from ...
..,'-Of
};\}:.'.'"
'::'::",
Results f,-ofl1...
<> mean Fourier coef. - method 1t::. magnitude average - me-thed 2o mean signal
0'_"'0""'
~/::-x:x}r mean signal + and - cr-- mean Fourier coef. - method
J'--I--Jl......lI....LJ-l_hU-LLLulJ-.J.....LLJ--LLLlLJ.-'--J.--<--.J'--'--'--'I90 180 270 360
Sho-ft Rotation Angle~ Degrees
40
-40o
ui' 20L:J(J)(J)<I.)L
n...
a0... ...//.:.
~ g}~/
~ -20oo
<:'(
;"
50 '---'---'---'---'--.L-..-I.----E"'t--'---<-t~f_·-'----'L.....-J-~~-'--.1....--.J.--L-.--'-----'--...L._.J"--'-~,Jo '10 15 25
Hornlonlcs ejf BPF
~ 70
lOaFa 90,
0...~oC'..J 80illL
~
-In...(f) 60
(h) rnfcropl1one 8
Ffgur e 9. - Ccntfnued.
37

TP NOISE/TAPE 11071 O/p.BLOCK TEST NO. 2 RUN NO. 54+4
Results from ...
•
I I I I ! I I LJ,--l-...J..-Ji-lJ270 360
Degrees
.,
......':.":
Results from..•
o mean Fourier coef. - method 1/J. magnitude average - me-thod 2o mean signal
I I I I I I 1.-l.J-.J...J180
Rotation Ang!e~
0,_"""",
;////// mean signal + and - cr-- mean Fourier caef. - method
L..-!--I--}_l-.J-,--,I~90
Shott
f350 L-...L...---'--...l.--'-~~~-'--'--"I~~",,-'-'---L---,_-.1-lo---Jlo---Jl............J-.....J-.....J-.....J-.....J---I---I-____
o 5 10 '1 5 20 25Hortll()nics of BPF
400
0.....
20<DL::J(J)(J)Q)L
0...
10°fa 90~
0...::t - 6
00J 80 -<D f1L <)~ ~
CD ~~b./J.'"D 70r
.....JQ...(f) 60
(i) microphone 9
Ffgure 9, - Contfnued.
38
TP NOISE/TAPE 11071 O/p.BLOCK TEST NO. 2 RUN NO. 54+4
Results from ...
I I L.Ll360
40
(1)" 20L::lQ')Q')
illL
0...
., ,.,;~:X«:X:/~ mean signal + and - (J
:':. mean Fo,:-!rier caef. - met~.od.~, . ,"'::':':1
•••• J' ':"'''':::::: "::",:::::.:.:::::. ,.:.:::::::.~.
1'://'/:::: ':;+:':', .:.::::,.::/./.f-.:.::.::::::.'.::. ..:::::'::::;;:: :..: ·:.::':'·k ·<?2//·:: '.:::':;:.r- ['" :. ::.. '::":'1:" ':." :. ':", ":'?i!~/ '" .:.
~ -20 [':;'::::':'::'::: ::.:::::::::'::'~'S;P' \),};;/
-4-0 UJ LLJ~ I I I I ! I I 1..L.LJ I I ! I I Io 90 '180 270
Shaft Rotation Angle~ Degrees
oIl
10°F0 gOr ~Il~
.....:t..00.l 80
i-
IDL
IT!'U 70-
--I0...ifJ 60
50o
Results fro Ill...
<> mean Fourier coef. - method 1I:::. magnitude overage - method 2o mean signal
{j) mfcrophone 10
Figut" e 9. - Continued.
39
TP NOISE/TAPE 11071 0/p.BLOCK TEST NO.2 RUN NO. 54+4
Results from...
o0...
100
.",.,.,.",
;::.;~:./;::./?~ mean signal + and - cr-- mean Fourier coef. - method
Results fro 111 ...
-0 mean Fourier coef. - method 1I:::. magnitude overage - method 2o mean signal
Horrnonfcs
8
0
100 r:-.Q
0 90l ~Il. sol::t00J
illL
~ 70
"-.JCL(f) 60
..IDL:J(j)(j)(1)L
CL
o+.tlfJ::J -50
] -1 00 L'~...l.-J..-L..JL-I-'...!-\I L.LJ-.LL I I I LJ I I I. J I I I J I 1.-J.-..I-'--J-....I--JIJ90 180 270 360
Shaft Rotation Angle, Degrees
{k) mfcr c.1pl'lone 11
Figure 9. - Continued.
40
105
Resul ts fror'o ...A n' eo!'1 F "'J,·r"",- ....oe'"'\,/" I ," il\.:l I ... j H::~ \... I ~
b. m agnitucie averag eo mean signal
- n1er'lOc) ;
- method 2
90
-4-585 _l_....l.---__-J..._~l_"'-----JI_-'------..I..-__I
-3 -2 -1 0 1 2 3 4 5MICTophone locctI,O:""i j feet
(I) Surnrnary of SlOP 4
9. - Run 54+4 . BPF= 671.7 Hz. RPM= 10076.0. UTiP=743.0 fps.
41
ATP NOISE/TAPE 8311079901 jP.BLOCK TEST NO.2 RUN NO. 67+4
Results from ...
..
rnagnitude O\leroge -- rn8'>::~!od 2meon signal
Results from...
o rneon Fourier coef. - method 1b.o
I ~~,),)f.1~1 If 1,,~ 10Harrnonics
100 c:¢\
:::t
~ 801:: ~~ 6,
L t:: b. I:::.CD F ~.. l:1 l:1 t..::.'\"D 70 : '....... ~ I:::. £::..
£::..1:::.I:::.l:::.l:::.
6,b.
b. A b.£::..A.6,
._L..1 .1-1--,IL--L~I,-LL 1 J15 20 25
()": BPF
-'0_(f) 60
{a) mict'l:'lphone
Figure 10. - Run 67+4. BPF= 670.8 Hz. RPM=10062.5. UTijl::;=742.0 1·ps.
42
ATP NOISE/TAPE 8311079901 /P.8LOCK TEST NO.2 RUN NO. 67+4
o0...
100
Results from...
@};};}\\~ mean signal + and - (J
-- mean Fourier coef. - method
CD"'0
.....':':'.~~
I I liJ I I270
Degrees
Results frolll ...
(> mean Fourier coef. - method 1f:j, mGgnitude overage - me-thod 2o mean signal
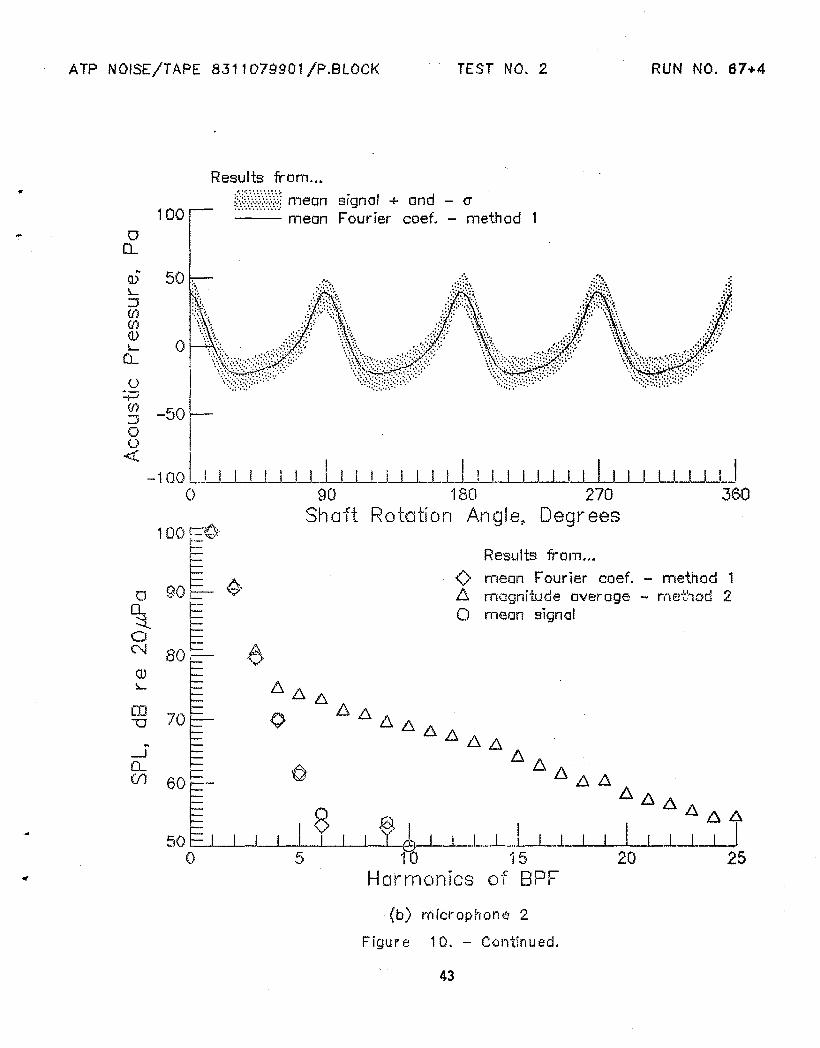
{b) microphone 2
Figure 10. - Continued.
43
ATP NOISE/TAPE 8311079901 /P.BLOCK TEST NO.2 RUN NO. 67+4
oCl.
100
Results from ...
~~/{;\?% mean signal + and - cr-~ mean Fourier coef. - method
Results fr-on1...
<> mean Fourier c'Jef. - method 1l:::. magnitude overage - me·~:~od 2o mean signal
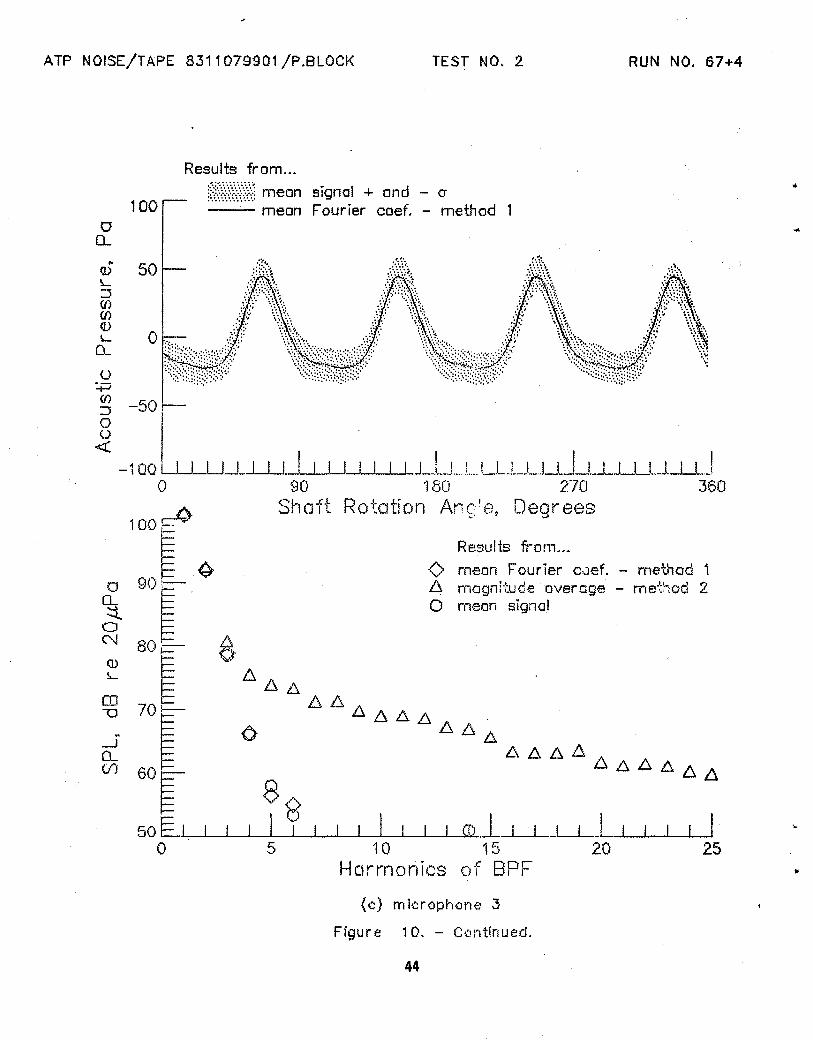
(c) rnicr<lph<ll'l€ 3
Frgure 10. - C'.:H,tfnued.
44
..
ATP NOISE/TAPE 8311079901 /P.BLOCK
Results from ...
TEST NO.2 RUN NO. 67+4
..Q)
~
:J(J)(J)~}
L
Results from...
<> mean Fourier coef. - method 1I.':,. rnognitude average - method 2.o mean signal
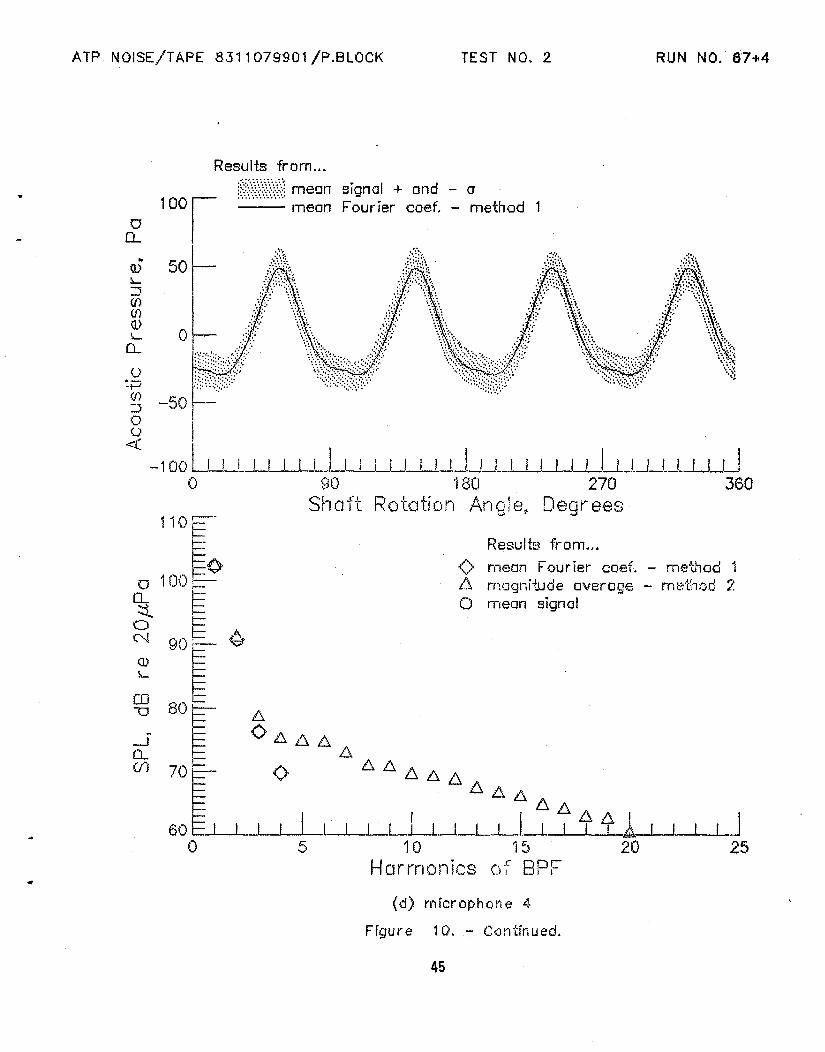
(d) t'nicrophcne i.~.
Figure 10. - C'.Jntinued.
45
ATP NOISE/TAPE 8311079901 /P.8LOCK TEST NO.2 RUN NO. 67+4
o0..
100
Results from ..•
ft(~\\\~ mean signal + and - cr-- mean Fourier coef. - method
mean signal
., I
rncgi1~T.UGe D\ler-Gg~3
Re;Jults from...
<> mean Fourier coef. - met~loG 1!:::.o
..illL:::)(f)(f)
VL
0...
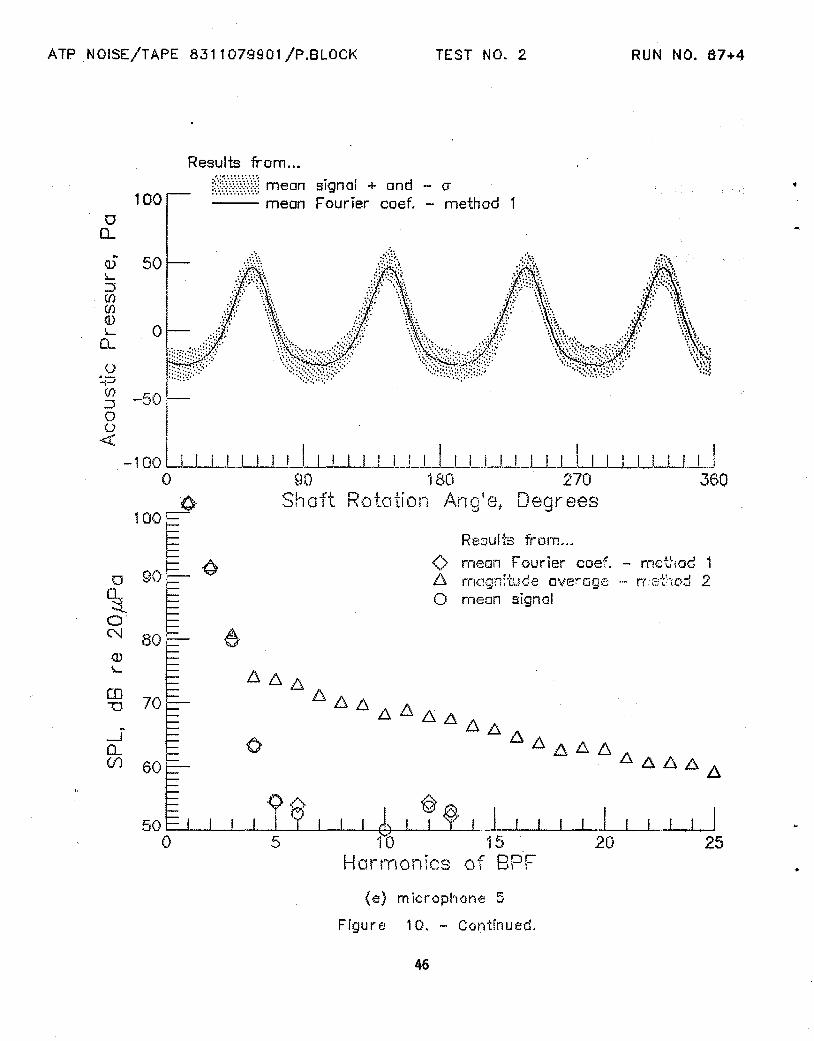
{e) rn icr()ph~~ne 5
Figure 10. - Continued.
46

ATP NOISE/TAPE 8311079901 /P.BLOCK TEST NO.2 RUN NO. 67+4
oCL
100
Results from ...
f~?\\\) mean signal + and - cr-- mean Fourier coef. - method
Results from...
<> mean Fourier coef. - method 1~ magnitude overage - method 2o mean signal
50
Ob-Wi-50!-'
I I ! LUJ-l-l-l..J-'_.l_I_.1J..-LLJ-l"""_J.-1...J--J180 270
Rototfon AnQ:e~ Degi'"ees
{f} microphone eFfgure10. - Continued.
47
,.J360
AlP NOISE/TAPE 8311079901!P.8LOCK
Results from..•
TEST NO.2 RUN NO. 67+4
110 1-
~¢\":'1 100.'::"'-
0 __ t=::t ,r=0 l= ¢r('.~
90~-illl.-
eo\J 80
--.I0_Cf1 70
Results f,-olll ...
o mean Four ier coef. - methoc 1l::. rnagnftuce overage - me-t''lod 2o mean signal
DL-_. ClC"
'1 I
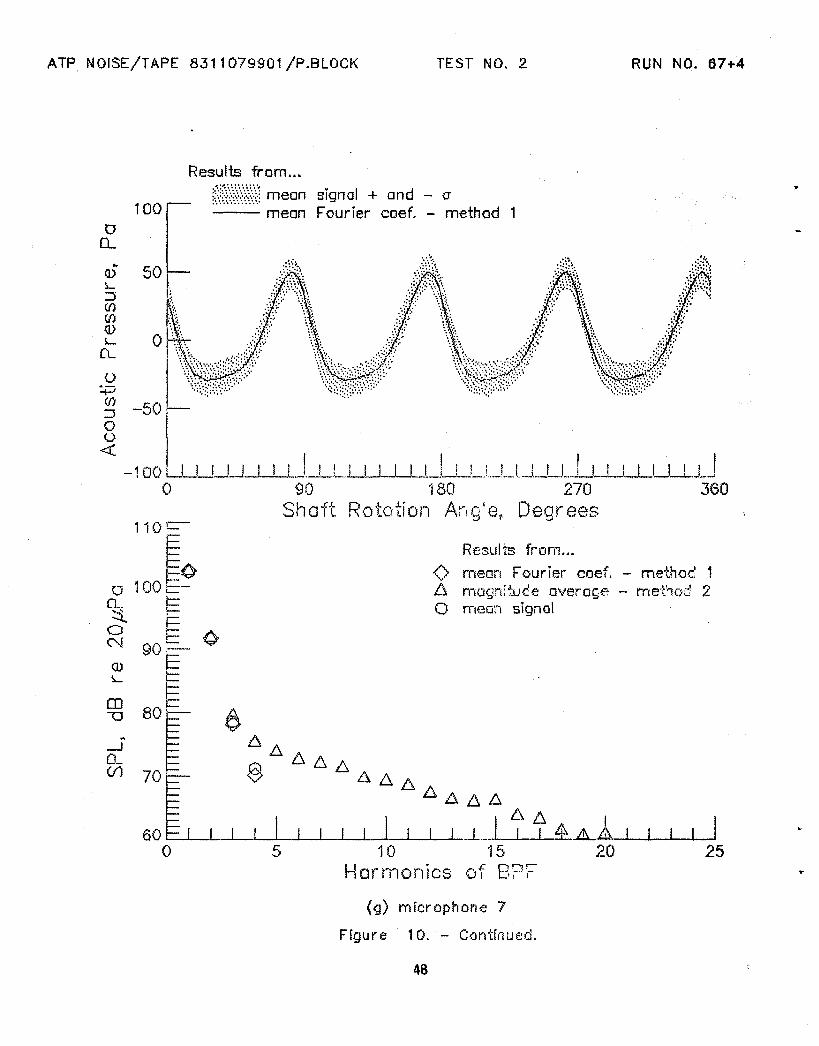
(g) microphone 7
Figure 10.
48
ATP NOISE/TAPE 8311079901 /P.BLOCK TEST NO.2 RUN NO. 67+4
Results from ...
?t~\\\\ mean signal + and - (T
({ 100~ mean Fourier coef. - method
~ 50 .:":::'. .:?; /~Vt\ .;·.~::~t(\
~ 0 ".~.:.:"~:':"'~':"""'~"":'::":"""""" ::..::..:,......•::::.':.:: :li'.:::~:..~::: t\f\"0: -: . .,# \.,'io.:::..!..:-.::.:::::.,:':.:.::::::::::.~::::: :: :,':7.'::!::.:.·;.;,l \\.:..:.~~::.;.::..::.:.::'.:.: :::.:.:.:;:.:.·.:: _.:.·.:;:.:.:=:.~:· ::.~:.Ii'".L.::.<:Jit%.:·;,t:.tf;o \~!~.~.·..·.~:::·.;.·:.:::::.·.,.:.;.·.;.:.~:::.i.:ij,r·,':' :.~ ~;'.'-:--' .'\::~~~:~}~~::::;:;'(j)
--&JO[] -1 ~~ LUD_I_L.LL-LLl.-LU_d-Ll..l.J
o 90 'jaoShaft Rototion I~..nc:e.
...J ,
I I I i I LJ---I.-...L-J.LJ...-L.LJ270 360
Deorees;;J11O[
(J '100'·_ 'II
~::t~.
0('.J 90 c.- (.).IJ) ~L
co801"D
-'0-(f) 70~
~608
0
Results from...
<> mean Fourier coef . - rneJ.:hod 1f:::. magnitude overage - method 2o mean signc!
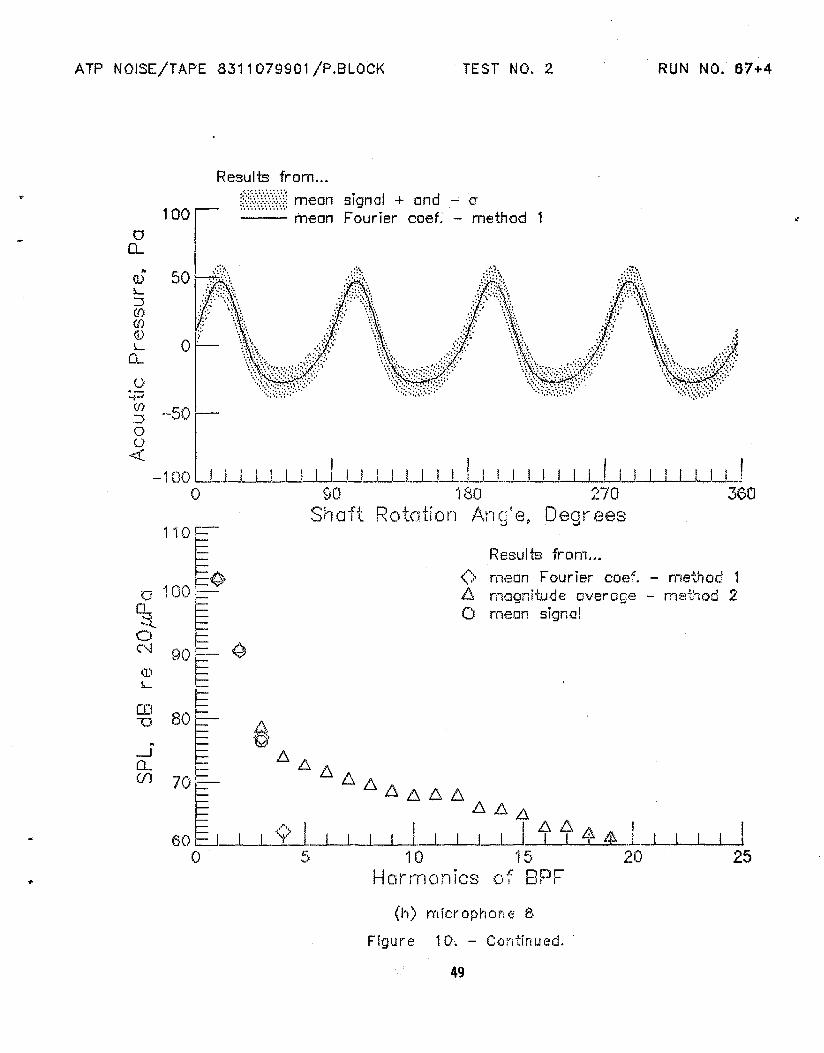
{h) microphone g
Figure 10. - Contfnued.
49

ATP NOISE/TAPE 8311079901 /P.8LOCK TEST NO.2 RUN NO. 67+4
Results from..•
.:'::.#.
Results from...
<> mean FourIer coef. - method 16 magnitude averoge -. me~:;,oC: 2o mean signal
'00 i-.C;ll>
col <)0 ~ J g
CL:.t
0 1=C'\J
::[ill"-
IT!-0
-l0_0'1 60
.-:':~~'.~'.~'.~'..,~;/:\\\\;:~ mean sIgnal + and - a
~ 100~ .. mean Fourier coef. - method
Q) .:.:.:. .,;::~L::J(f)(f)([)L
CL
()+J~ -50>-oo<
- i 00 LJ_LJ_LLJ_J_JJ_J_I_I._LL_L-UJ_L.LJ-1..-J I I I J-1_J-1-1.-J-1..J.-JJo ~W 180 270 360
Shoft Rototfon AnQ:e? Degrees
50E Io
.0I---,,~tc..../ ~IL..-,-l .....<~p~1---,---,--,---,-'..J , I5 10 'j 5·
Horn,onlcs o·e BPF
I20
I25
..
(i) micr ophone 9
Figure 10. - C'ontfnued.
so
ATP NOISE/TAPE 8311079901 jP.BLOCK TEST NO.2 RUN NO. 67+4
Results from...
..;~.~N{;\/:~;) meon signal + ond - cr-- meOlt:·.Fourier
o0..
..(]JL:JmmQ)L
0..
o
-< -50 LL.L.L1J_LJ...J_J_U_LJ-l-LJ-lJ...J_ J...J --1_, J-l_I-L.L_LJ_J_I..-J__L_i-l_Jo 90 180 270 3$0
Shaft Rot.ation A'l'··'A Decreesj ~p >oJ., '-J
100 C::-~"C?-~1.> v'
!=l=
;0 0CI E=- .(;.>0_.
~'.' §::::t i=080~
I~c-..l .(-:)
tJ}
~l.-
eo'"'0 70r_I0_(f) 60b
1-
~50f=1
0
Results fronl,,"
<> mean Fourier coef. - method 1I:::. magnitude ovef'age - me-t:1od 2.o mean signal
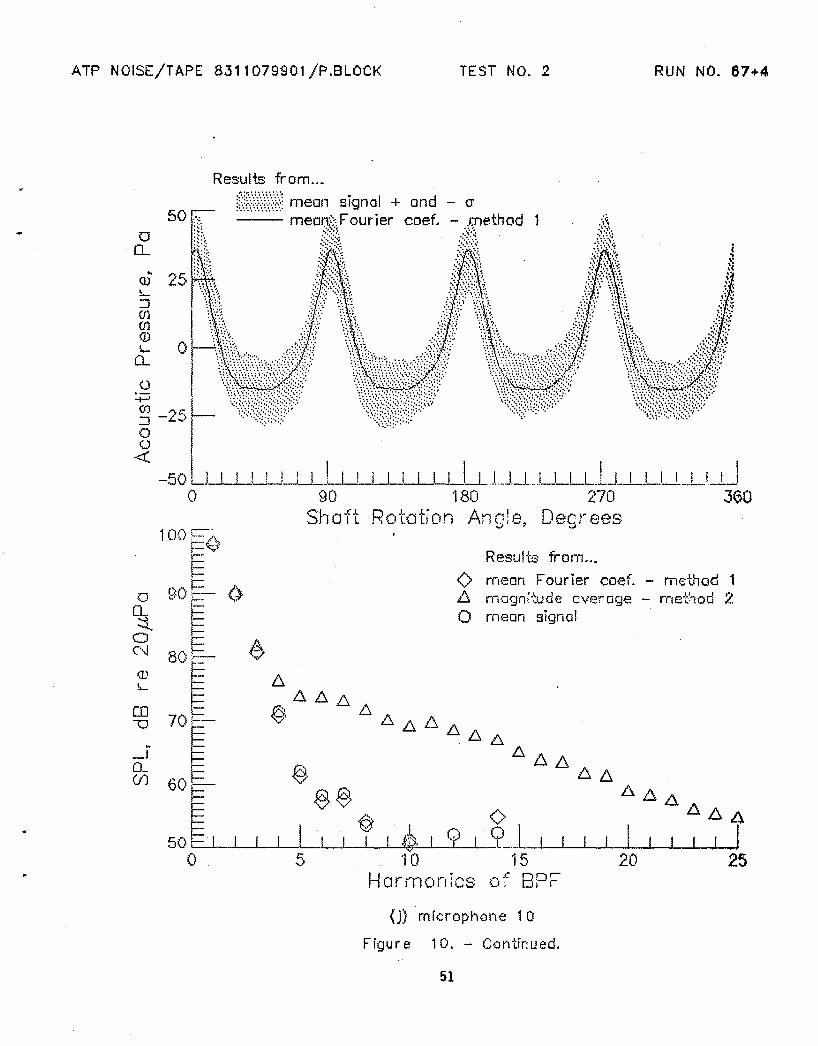
{j} microphone 10
Figur e 10. - Continued.
51

ATP NOISE/TAPE 8311079901 /P.BLOCK TEST NO.2 RUN NO. 67+4
oQ..
100
Results from...
~~)\\??~ mean signal + and - cr-- mean Fourier coef. - method
I I I L.LJ LJ_U-l-LJJ270 360
Dearees;;;l
Results from...
<> meiJr, Four ier coef. - rnE,I~hod 1l:::. mcgnitude overage - ITlf::d:'-il::>G 2.o mean signal
I I LJ I I !.-J_L..l. I'180
Rototion Angle 1
@I !
--L---L--L---L---I.'---I.1---L---I.--f-lc9-!-""O I I I5 10
Harrnonlcs ()f
50
-50
i 00: {}FE ¢tC:
0 90r-CL E:::t.0 § ~c'./ BOL-ID EL
Em"D 70:-
~"--JCL(f) t=
6°1-50 I
0
u+(j)::;oo
<:(
-1 00 u_LJ_1LJ-.lJ.J._LJo ~W
Sh aft
(k) mIcrophone 11
Figure 10. - C(Hy~inuE~d.
52

Resu~t9 frot('~.""
.-,--_l-~ I I~,----,-_l-3 ~2 -'I 0 2 3 4 5
tviicr 0 Dhon e I·:,) c·::d:ion j feetI
{I) Summa!'}/, o·f Step 4
Fil;}ure 10. - Run 67+4 . BPF= 670.8 Hz. .RPM=10062.5. Unp=742.0 fp$.
53
ATP NOISE/TAPE 8311149901/P.8l0CK TEST NO.2 RUN NO. 84+4
200
Results from..•
jWf;~;X?~ mean signol + and - CT
-- mean Fourier coef. - method
110
oD...
05 100L~({)({)
~ 0 ~-.:.r,0....
()~
~ -100ou«
- 200 L.-I-~--I--I--I--J...-I---'-'--J--'--'---I.I-,I,---,--I......1-1..1--1.1-11---,--1..L-1.......1...L1-I1_1L-.L-1.......1....1--/.1......1-..I...-i-...I--I.I,--1o 90 180 270 360
Shaft Rotation Angle~ Degrees'
a 100
~oN 90(l)L
Results from...
<> mean Fourier coef. - method 16. magnitude overage - method 2o mean signal
fg 80
....JCLifJ 70
5
o
10 15Harmonics of BPF
20 25
(0) mrcrophone 1
Frgure 11. - Run 84+4 . 8PF= 665.9 Hz. RPM= 9988.9. Unp=701.7 fps.
54
ATP NOISE/TAPE 8311149901!P.8LOCK TEST NO. 2. RUN NO. 84+4
200
Results from...
f?\\\;) mean signal + and - (J
-- mean Fourier coef. - method
110
oD-
05 100L::J(()(()
~ 00-
o+-~ -100
~ - 2001'--.1.-1............--'--.1'--.1.-...1-1...1..1--,-1--11'--1-.1 ..1-'...1..1-1-1--11--1--1 ..1-1 ...1..1-1-1-..1.1_ 11--1-1 ...1-1 ......1-..1.1--11'--.1.-1...1-1 ...1..1-.L--I'---i.-...............L-1 Io 90 180 270 3eO
Sh aft Rotation An gl e, Degr ees
Results from...
o mean Fourier coef. - method 1I::::. magnitude average - method 2o mean signal
o 100
%.aN 90
OJL
~ 80
"-ICL.(f) 70
5
00
o
<>0<>B 0
10 15Harmonics of BPF
{b) mfcl'ophone 2.
Ffgur e 11 . '- Contfnued.
55
20 25
ATP NOISE/TAPE 8311149901/P.BLOCK TEST NO.2 RUN NO. 84+4
o0..
..Q)L:::l({)(j)(1)L
n..
100
100
Results from..•
ft~~~\{{~~ mean signal + and - cr-- mean Fourier coef. - method
I I360
a 90
~oN 80(J)L
OJ"D 70
~
-JCL(.f) 60
o
Results fro"m ....mean Fourier coef. -. method 1magnitude overage - method 2mean signal
<>
10 15Hornl0nics of 8PF
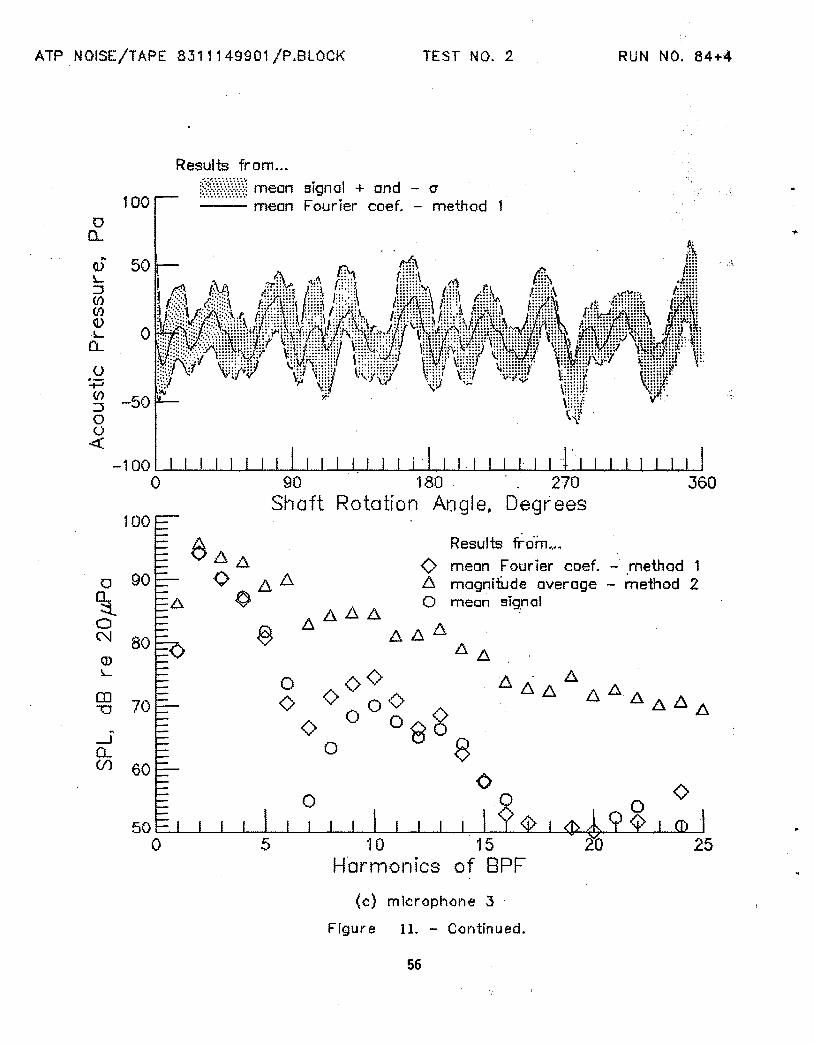
(c) mIcrophone 3
Figure 11. - Continued.
56

ATP NOISE/TAPE 8311149901/P.8LOCK TEST NO.2 RUN NO. 84+4
3$090 180 270Shaft Rotation Angle, Degrees
Results from...
@nNN~~ mean signal + and - cr-- mean Fourlercoef. - method
110
2000
0....
100lJ)L:J({)(f)(1)L
CL
(J;...-~ -100ou«
-·200 I..-L......L-..J......J-.l-..i.-J..-J..--'--....L-I---L-.....L-J.-.-I,.--I.......!.-L-...L......L-..J......J-..L.-..i.-L-...!-.......J.-....L-I--I-..i.-.L-.l.--I......J-...I
o
~ 80
a 100
%.o"" 90Q)L
-..JCL(f) 70
Results from..•
<> mean Fourier coef. - method 1~ magnitude average - method 2o mean signal
5 20 25
{d) n"licr ophone 4
Figure 11, -0 Continued.
57
ATP NOISE/TAPE 8311149901/P.BLOCK TEST NO.2 RUN NO. 84+4
Results from..•
(> mean Fourier coef. - method 1b. magnitude overage - method 2o mean signal
Results from..•
~tf{{{{~~ mean signal + and - {T
-- mean Fourier coef. - method
110
~ 80
"---ICL(f) 70
a 100
~oC'\I 90(l)L
2000
0...h
100IDL::J(()(()(l)L
CL
()~
~ -100oo
-<- 200 L.....I-..l-.-.L......I..-L--I-...JL..-I.-l.....J--..l-.-.L......I..-L--I-...JL..-I.-l.....J--...l-.J--L..-J......l.-.J---!-I.-.-l......l-.J-....I..-L--I-W
o 90 180 270 360Shaft Rotation Angle, Degrees
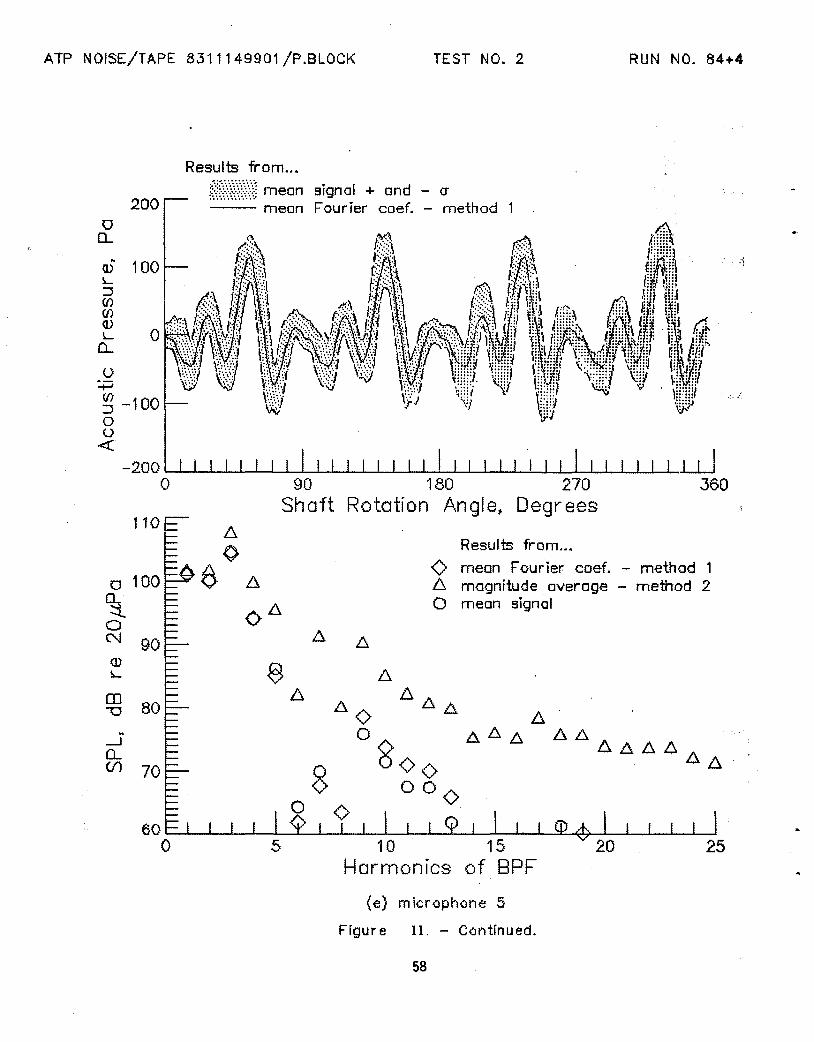
{e} microphone 5
Ffgure 11. - ContInued.
58
ATP NOISE/TAPE 8.311149901/P.BLOCK TEST NO.2 RUN NO. 84+4
36090 180 270Shaft Rototion Angle~ Degrees
Results from ..•
1~g\~::\~~';\;~ mean signal + and - cr-- mean Fourier coef. - method
110
2000
0.....
100IDL::J({)(()<J.)L
0...
()~
~ -100oo<
- 200 '---'---'---'---'--'--'--J....-L.--'--'--'--'--'--'--'--I--'---''---'--I.-.l-..L-I-..l..-.<'--'---J--............-.1..-'--L--L-L--'--I
o
Results from....
o mean Fourier coef. - method 16 magnitude overage - method 2o mean signal
a 100
%o0J 90(J)L
~ 80ft
---.JCL(f) 70
5 10 15Harrnonics of BPF
20 25
(f) microphone 6
Ffgur e 11. - Continued.
59

ATP NOISE/TAPE 8311149901/P.BLOCK TEST NO.2 RUN NO. 84+4
200
Results from ...
~%\?\:) mean signal + and - cr-- mean Fourier coef. - method
..
36090 180 270Shaft Rotation Angle, Degrees
110
..(1)L:J(f)(j)(I)L.
0...
():j:i
~ -100oo
4':- 200 L.-..1--L-..L......J---l-.....L..-.l..--L....l-....I-..JI-..L.-L-.l.-....l.---l--I--L.-..1--L-..L......J---l-.....L..-.l..--L....l-....I-..JL..-J...-I-..L......J--J...--L.....J
o
o 100
~o0J 90Q)L
Results from..•
(> mean Fourier coef. - method 1l:::. magnitude overage - method 2o mean signal
~ 80
"~
0...(f) 70
o<>
5
oS
10 15Horrnonics of BPF
20 25
{g) mfcl'ophone 7
Ffgur e 11. - Ccntfnued.
60

ATP NOISE/TAPE. 8311149901!P.BLOCK
Results from ..•
TEST NO.2 RUN NO. 84+4
Results from...
<> mean Fourier coef. - method 11::. magnitude average - method 2o mean signal
o 100~...:l.oN 90illL
;g 80
5 20 25
(h) rnicrophone 8
Frgure ll. - Contrnued.
61
ATP NOISE/TAPE 8311149901/P.BLOCK
Results from ...
TEST NO.2 RUN NO. 84+4
200o
CL
<is 100L:::J(f)(f)(])L
CL
.... :~ ..~\\?:?:\ mean signal + and - cr--- mean Fourier coef. - method
...,',:::,
~ -100oo-«
- 200 ............---I...-.L--l..---'--...L.--1.--'--'---'--'--'--'--'-....t...-J'--'--'--I...-...1--J.-..............-&..-.L...-.L..---'---'--l...LL..t-1-'---L......1I_1o 90 180 270 360
Shaft Rotation Angle~ Degrees110
o 100
~o0J 90Q)L
;g 80
Results from...
<> rnean Fourier coef. - rnethod 1I::::. rnagnitude overage - method 2o mean signal
{i) rnicrophone 9
Figure 11 - Continued.
62

ATP NOISE/TAPE 8311149901!P.8LOCK TEST NO.2 RUN NO. 84+4
Results from...
o
Results from...
<>o<>
o<>
°0
~ill.6Q
O· ~ ~~ ~& "V" II II (> mean Fourier coef. - method 1
~ £::A magnitude overage - method 2f0 ~ 06me~ &gnol
~ J\ ~ J\~ ~!:J.~~
6~~
'~ <>e)?~ 0
<> ~<> <>8o<>@.oooo
40 '---1..--'-._.L....L ....1.....J --,--,-I--1--1--1-1--1-1--11--1...--1----1-1--1-1--,--,-I----1-1? 1 1 1 <j> 1o 5 '1 0 15 20 25
Harrnonics of BPF
90
50
".--J0-f.f) 50
96 60
o 80
%.o('.J 70illL
(\{{{{~~ mean signal + and - cr-"_ mean Fouf:~er coef. - method
o 1:\, f;{\ . r."1Q.. ....':-: I) ."':" :I;:.:
..(l)L:::JillillQ)!0.-
Il
()
:J - ..;, (::r 1?:;N:j ~r b" (::;;, ~:) \[:jil:) ..... ~f::;t ~o ,.j.1 \:1 I,f I ~::::l \ V·'~ ;11 ~i:~io I~:f \. ':::J·:::·.:I .~ ~ '\, ~':':':1
4. -50 U ..J..J ......L...Ll...J I I I 1 I I I I I I I I \Z:' I I 1_'......1.1.-1..............................----L-JIi......'1o 90 180 270 360
~. Shaft Rototlon Angle~ Degrees
(j) microphone 10
Ffgure 11. - Continued.
63

ATP NOISE/TAPE 8311149901/P.BLOCK TEST NO.2 RUN NO. 84+4
,',.:-:....
:'::::
I 1 I I I 1 I I 1 1 1.-..11_11.-.-1-1..1-1-J-I-l.I-..1I--L-.J-...J--J--I......I.I--J1180 270 360
Rotation Angle, Degt"ees
Results from ..•
?)\\\\~ meon signal + ond - cr-- meon Fourier coef. - method100
..IDL::Jif)if)(1)L
0....
()~
~ -50
o Iu
<( -1 00 --,-I-'--'--'---'--L--J.-I.....1_1 I Io 90
Sh ott
oCL
100/:).
906-0 6 <>
~ ~
6 0o
%o0J 80illL
fg 70
50o
o0<>
<>
10Horn'lon IeS
Results from...
meon Fourier coef. - method 1magnitude overage - method 2mean signal
<3 <>
<t> ??~ f~.....t....-....L---L..---L-I15 20 25
of BPF
{k) rn fer apl'lOn e 11
Figure 11. - Contfnued.
64

110
105
co\J
--1 1000-(f)
«o
95
Results frot'n ...~ mean Fourier coef. - method 1
/~~agnltudelJ.verage - method 2
~,\// ~
<>
-5 -4 ....3 - 2 -1 0 1 2 3Microphone location j feet
4 5
{I} Summar y of Stop 4
Figure 11 .. - Run 84+4 . BPF= 665.9 Hz. RPM= 9988.9. UTiP=701.7 fps.
65
ATP NOISE/TAPE 8311199901/P.BLOCK TEST NO.2 RUN NO. 132-2
100
Results from...
y~~(~~~\\~j mean signal + and - <r-- mean Fourier coef. - method
36090 180 270Shaft Rotation Angle~ Degrees
100
o0-
ID 50L::Jen(J)
VL 0
CL
o~
~ -50oo
<:(
- 100 '--'----I...-..J..-I----'--'--.L-J..--'-..I..-J----L.......l-.L.-.L--L-...L..-'--'-.....l-.L-.I.--L-....L.-J..--L.--l...-...L-l-.J........l-.l--I.--L-..I..--l
o
o 900....:::toC'..J 80
<J)
L
f?3 70
---'0...(f) 60
6.6.
<>
Results from...
<> mean Fourier coef. - method 1.6. magnitude overage - method 2o mean signal
10Harmonics
(a) microphorle
Figure 12. - Run 132-2. BPF= 670.9 Hz. RPM=1Q063.2. U TiP=742.1 fps.
66
ATP NOISE/TAPE 8311199901/P.BLOCK TEST NO.2 RUN NO. 132-2
36090 180 270Shott Rotation Angle, Degrees
Results from...
[f{{~{/;) mean signal + and - cr-- mean Fourier coef. - method
100
1000
0.....
50IDL::J(f)(f)
VL
CL
()~
~ -50oo
<C
- 100 ~-'--..L-,.L-'-.....L-l"""""'~'---'----'--'-.1--.L-'--'--'--'--1-L--L.---'--'-.J.--L-'-..J.......I--'-...L-L--L.-'--.l--L--'--J
o
0 90CL~
0N 80(])L
CD70u
"-l0...(f) 60
Results fr-om...
-0 mean Fourier coef. - method 1~ magnitude overage - method 2o mean signal
{b) microphone 2
Figure 12. - Continued.
67

ATP NOISE/TAPE 8311199901/P.BLOCK TEST NO.2 RUN NO. 132-2
36090 180 270Shaft Rotation Angle~ Degrees
Results from..•
~N~~~{{~~~~~ mean signal + and - cr-- mean coef. - method
110
1000
CL..
50Q)L:J(f)(f)Q)L
(L
<.);...,~ -50oo«
-1 00 L-L--I--..1.-.JI...-.I.--'--.L...1.--'-...L.-I'--J..-'--.L..-L--L.....1..-L-.L.-'--...L.-.I--L....J.-..........--I--....I..-.I--l--'--.L.-.L--L.....I-..-I
o
Results from..•
o mean Fourier coef. - method 1b. magnitude average - method 2o mean signal
o 100
~oN 90(J)L
~ 80
5 10 15Hart110nics of 8PF
20 25
{c) ml<:rophone 3
Ffgure ~2. - Contfnued.
68
ATP NOISE/TAPE 8311199901!P.8LOCK TEST NO.2 RUN NO. 132-2
360
".:'. ;::.....
\<~d/ %~J.• \~U \"\~,:;/
90 180 270Shaft Rotation Angle~ Degrees
Results from...
N{~~~\\< mean signal + and - cr-- mean Fourier coef. - method100
110
o0....
..IDL:J(f)(f)
~ 0CL.
()~
(j) -50:Joo
<C- 100 L.-L.-1..--'--I.---'--I-...JL...-1..--'--.1...-l..--'-..1...-L---'-...l-Jl.......I.---'--~--'--'--I.~-I-...J'---'---'--.L--l---'-..J..-..J.---'--'
o
o 100
~oC'J 90(J)L
~ 80
Results ft-om .••
o mean Four ier coef. - method 11::. magnitude mlerage - method 2o mean signal
..-'CL.
~ ::l---L- g,,---,-_Io 5
I I I I I10
Hor rnon les
I25
{d) microphone 4
Figure 12. - Continued.
69
ATP NOISE/TAPE 8311199901/P.BLOCK TEST NO.2 RUN NO. 132-2
100
Results from..•
NA{<~ mean signal + and - cr-- mean Fourier coef. - method
360
Results from...
o mean Fourier coef. - method 1lJ. magnitude overage - method 2o mean signal
90 '180 270Shaft RotatIon Angle~ Degrees
110
<)
o 100
%.00.l 90 ~<)OJL
CO80-0 b.
ft 0-1CL(() 70
..IDL:::J(f)(f)(J)L
0...
o;...,(f)
:::Joo«
- 100 '---'--'--...I....-'--L...-'--............--'--...J...-.l---'--'-"---'---'---'--''--'--'--'----'---L...o.............'--'---'--..J...-.l,--'--'--'---'---'--...I....-'
o
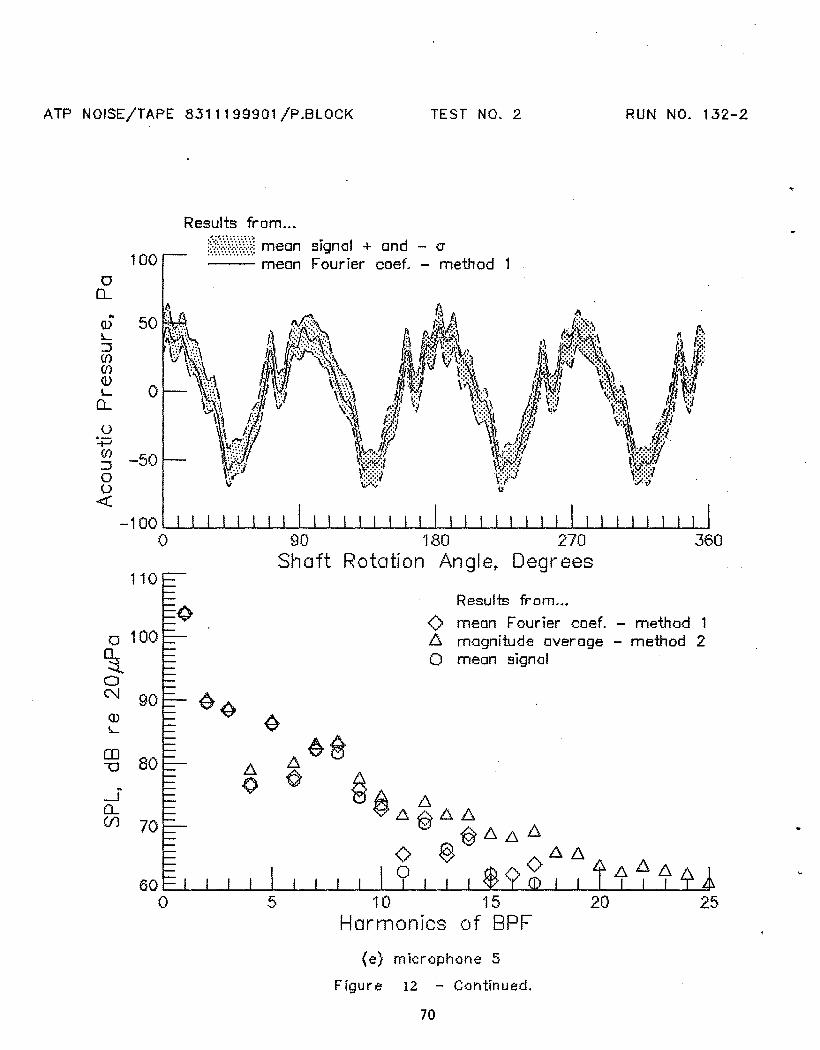
{e} microphone 5
Frgure 12 - Continued.
70
ATP NOISE/TAPE 8311199901!P.BLOCK TEST NO.2 RUN NO. 132-2
100
Results from..•
fH{\\~~;j mean signal + and - cr-- mean Fourier coef. - method
36090 180 270Shaft Rotation Angle, Degr ees
110
..Q)L::J({)(ll(\)L
CL
()~
~ -50oo«
- 100 '---'---I-....L..--l..-1---I-....L.....JL..-\...--I-....I---JL..-\......J.......1--I---I.....J........I....-L---I.....J................--L....I.--..........-I-...I.--.l-...L-'--...I.--1-...J
o
Results from..•
o mean Fourier coef. - method 1b. magnitude overage - method 2o mean signal
a 100II~oN 90(I)
L
~ 80ft
--.J0...(f) 70
5 10 15Harmonics of 8PF
20 25
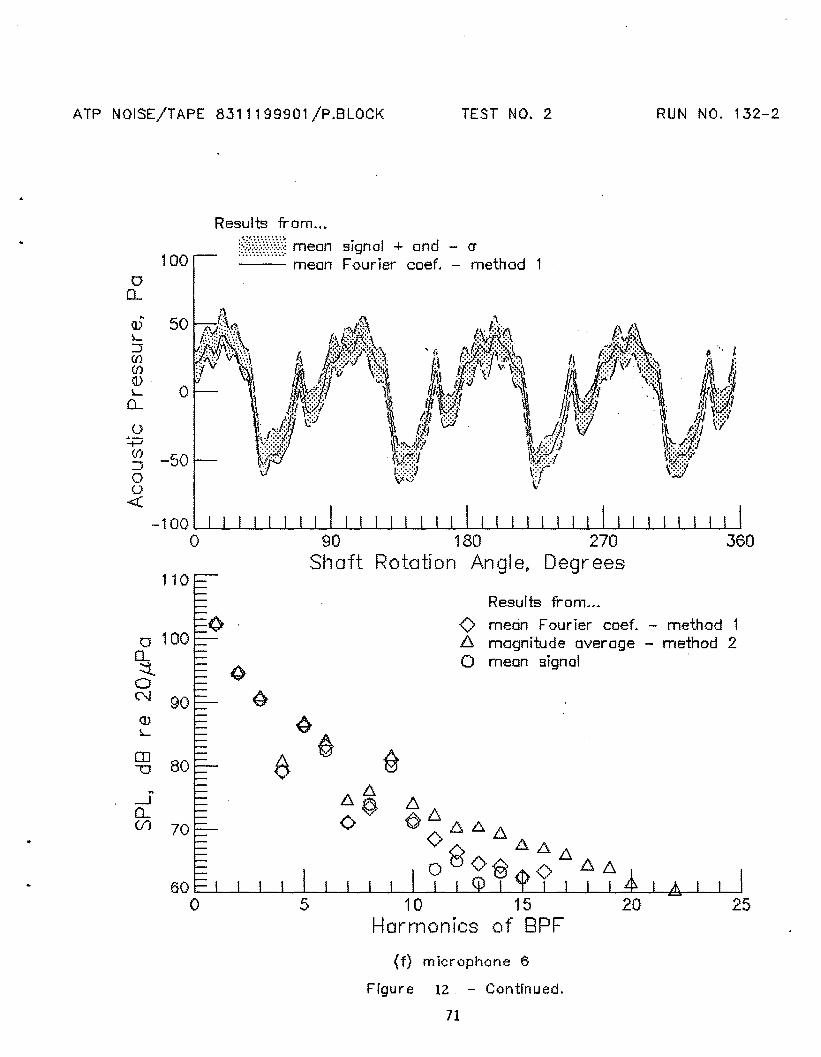
(f) microphone 6
Frgure 12 - Continued.
71
ATP NOISE/TAPE 8311199901!P.BLOCK
Results from...
TEST NO.2 RUN NO. 132-2
oCL
100
.~: ... ~ ~',:",',',:.,
~;:;:;:\\;:\\~ mean signal + and - cr-- mean Fourier coef. - method
Results korn..•
<> mean Fourier coef. - method 1f::t. magnitude overage - method 2o mean signal
100
o 90
~o0J 80ill!.-
~ 70..
---lCL(f) 60
5
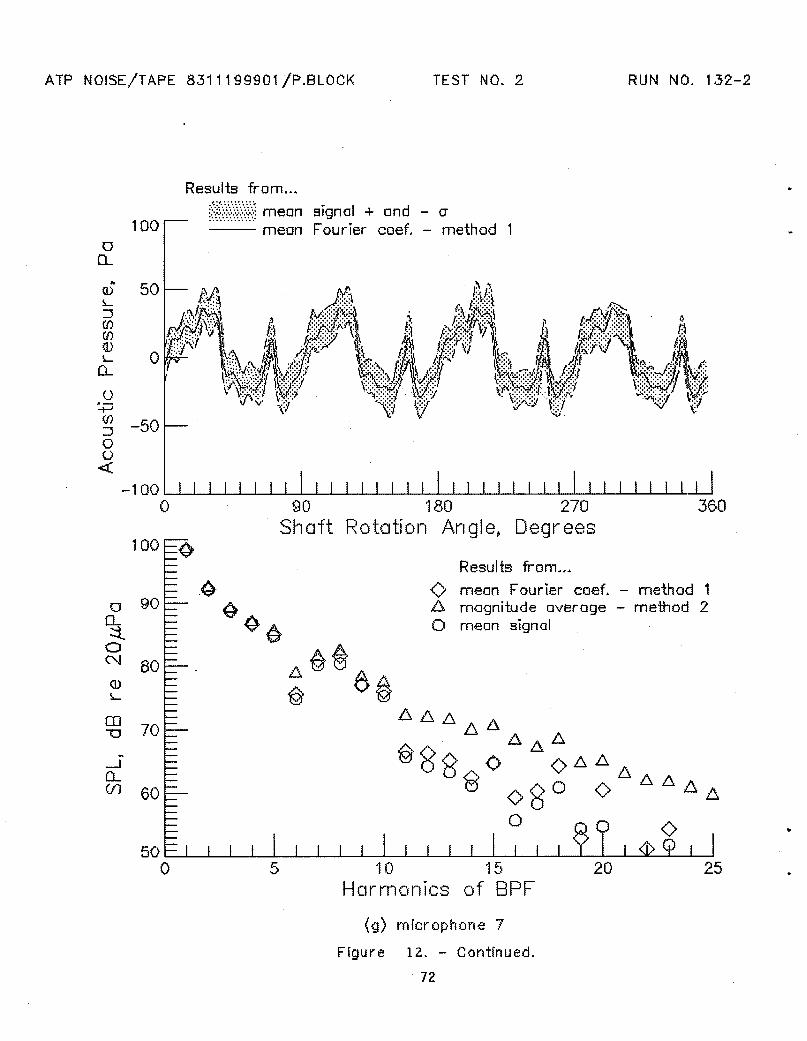
(g) microphone 7
Figur e 12. - Continued.
72
20 25
ATP NOISE/TAPE 8311199901/P.8LOCK TEST NO. 2 RUN NO. 132-2
o0....
50
100
Results from...
1~;!N{))j mean signal + and - (J
-- mean Fourier coef. - method
90 180 270Shaft Rotation Angle~ Degrees
360
Results ft-om...
-0 mean Four ier coef. - method 16. magnitude average - method 2o mean signal
o 90
%.o0J 80())L
~ 70
"-l0..(f) 60
5
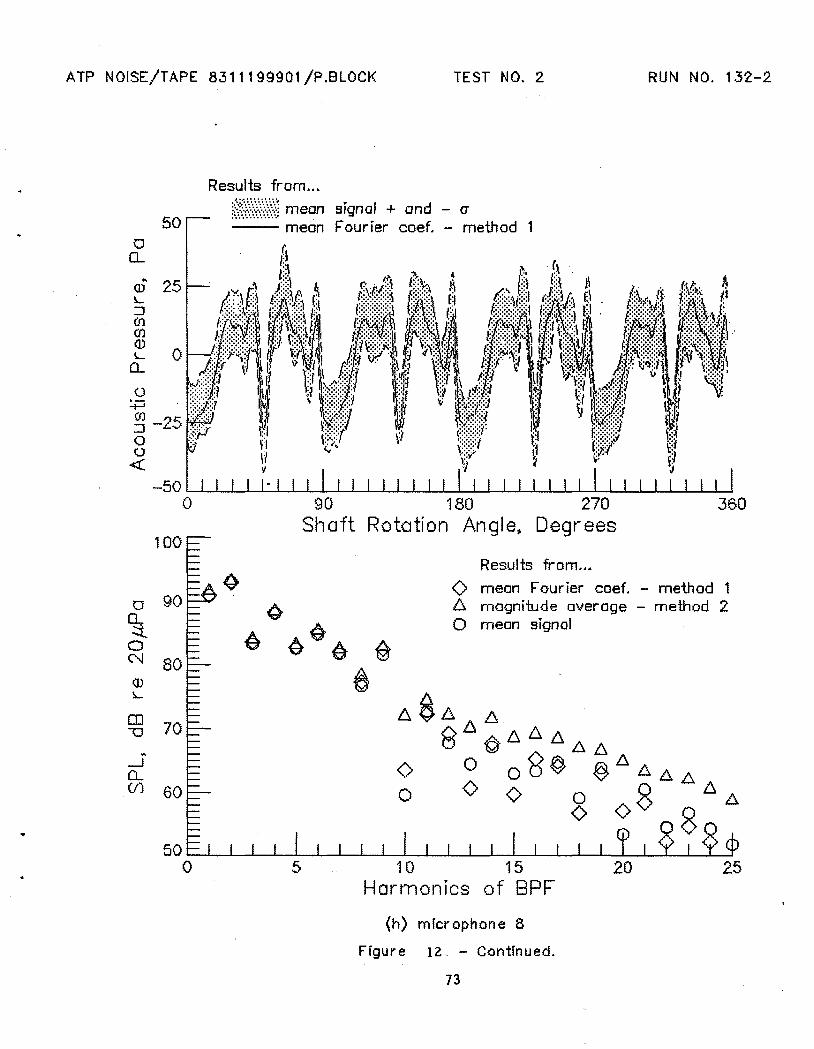
(h) microphone 8
Figure 12 .. - Continued.
73
20 25
ATP NOISE/TAPE 8311199901/P.BLOCK TEST NO.2 RUN NO. 132-2
o0..
100
Results from..•
ff;~S~\\? mean signal + and - cr-- mean Fourier coef. - method
36090 180 270Shaft Rotation Angle, Degrees
100
..Q)L:J(f)(f)(1)L
0....
o~
~ -50oo
<'(
- 100 l--1.-.I-..L-J.--I-....L-JL.-I.......I.-l.-I..-.I-..l-.J.--'-....L-J--J.......I.-'--J..-.I-.J...-L--I-..I-...IL.-I.......I.-.I...-I..-.I-..J.......I---'---I
o
Results from•.•
<> mean Fourier coef. - method 1l:::. magnitude overage - method 2o mean signal
(} 90
~oC'-J 80Q)L
CD'""0 70
ft
-lQ...
(f) 60
5 10 15Harmonics of BPF
20 25
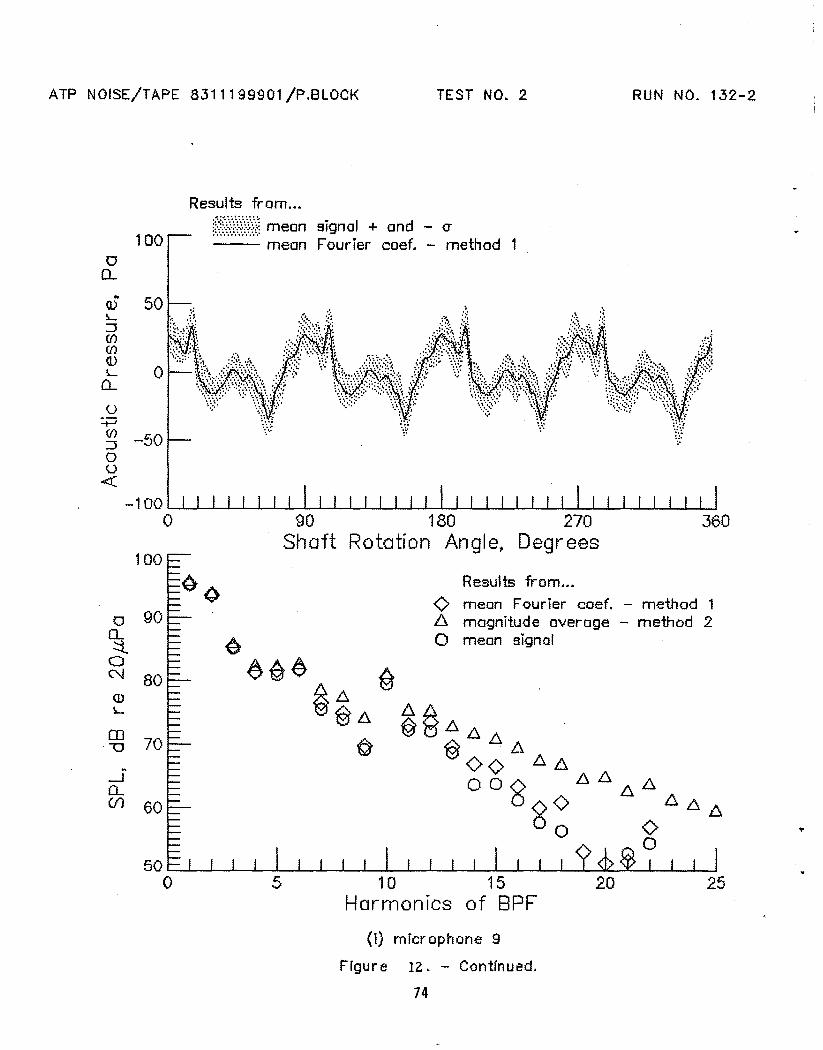
(1) mfcr ophone 9
Frgure 12. - Contrnued.
74

ATP NOISE/TAPE 8311199901/P.8LOCK TEST NO.2 RUN NO. 132-2
100
Results from...
(~N({(;j mean signal + and - <1
-- mean Fourier coef. - method·l
25
360
20
Results from..•
<> mean Fourier coef. - method 1fj, magnitude average - method 2o mean signal
10 15Harmonics of 8PF
B
90 180 270Shaft Rotation Angle, Degrees
5
100(>
~ 70..
---I0..(f) 60
a 90
~aN 80(J)L
o0...
05 50L:::J(()(fJ
~ 0CL
o~(f):::Joo«
- 100 '---J..-L-...........--'--~--'-..L-'--'--L-.L---'---'--...I..-I,--'--'--''--'--'--''--'---'-- ..........--'-~'--'-.....L-''--'--'--'
o
(j) mfcrophone 10
Frgure 12. - Contrnued.
75

ATP NOISE/TAPE 8311199901 jP.8l0CK TEST NO.2 RUN NO. 132-2
..
360
Results from•••
-0 mean Fourier coef. - method 1lJ. magnitude overage - method 2o mean signal
10Harmonics
90 180 270Shaft Rotation Angle, Degrees
Results from..•
1N{~;~;~;\~;j mean signal + and - cr-- mean Fourier coef. - method
~ 70
100
ft
-'0....(f) 60
a 90
~o('.J 80(])L
1000
0..... 50(l)
L::J({)({)(J)L
n...o~
gj -50oo
<{
-1 00 l--I--I...-.l-..L---I........J.--I--L.....L-L-...I--I...-.l.-.L---I........L-..J.--L..-L..-IL......L.-I...-.L-.L---I........L-J.--L......L..-.oL......L.....L.-.L-.L~
o
(k) microphone 11
Figure 12. - Continued.
76
, 10
Results from .••<> mean Fourier coef. - method 16. magnitude average ... method 2o mean s19nal
105
co"'0
-.i'1000...(f)
«o
95
90 L..-..L.-_-'--_......._-L._--L._---I__..L.-_-'--_......._--'-_.........
54-5 -4 -3 - 2 -1 0 1 2 3Microphone location, feet
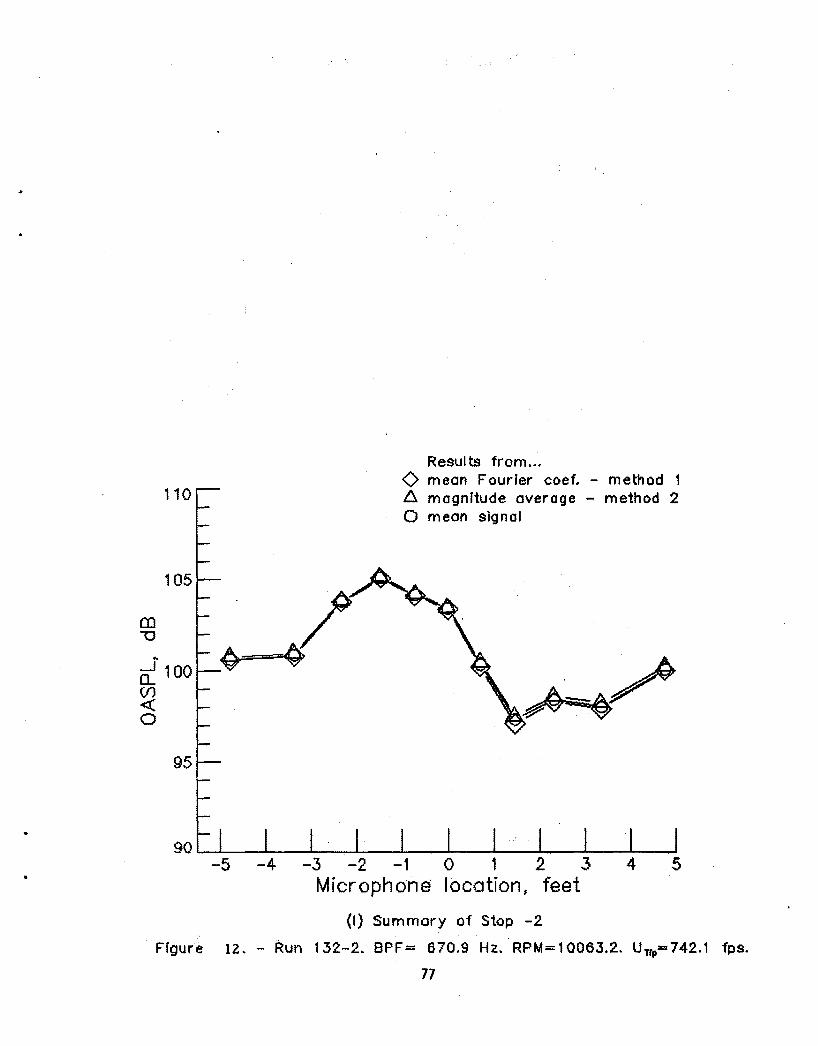
(I) Summary of Stop -2
Frgure 12. - Run 132-2. BPF = 670.9 Hz. RPM= 10063.2. UT(p=742.1 fps.
77
ATP NOISE/TAPE 8311199905/P.BLOCK TEST NO.2 RUN NO. 141 +3
36090 180 270Shaft Rotation Angle t Degrees
Results from...
1~:.Y{)\~ mean signal + and - cr--:-:-- mean FourTer coef. - method40
100
oQ..
..(J)L:J((]((]<J)L
CL
o:.j::i
~ -20o()
<C
-40 '--'----'--...........--'--'--..........--'--'--'--'----'--..........--'--'--..........---'--'"'--'--'--'--..........--'-...........--'----'--..........--'--'--'o
Results ft-om..•
-0 mean Fourier coef. - method 16 magnitude average - method 2o mean signal
o 90
%.oN 80
(J)L
~ 70
-'CL(f) 60
5 20 25
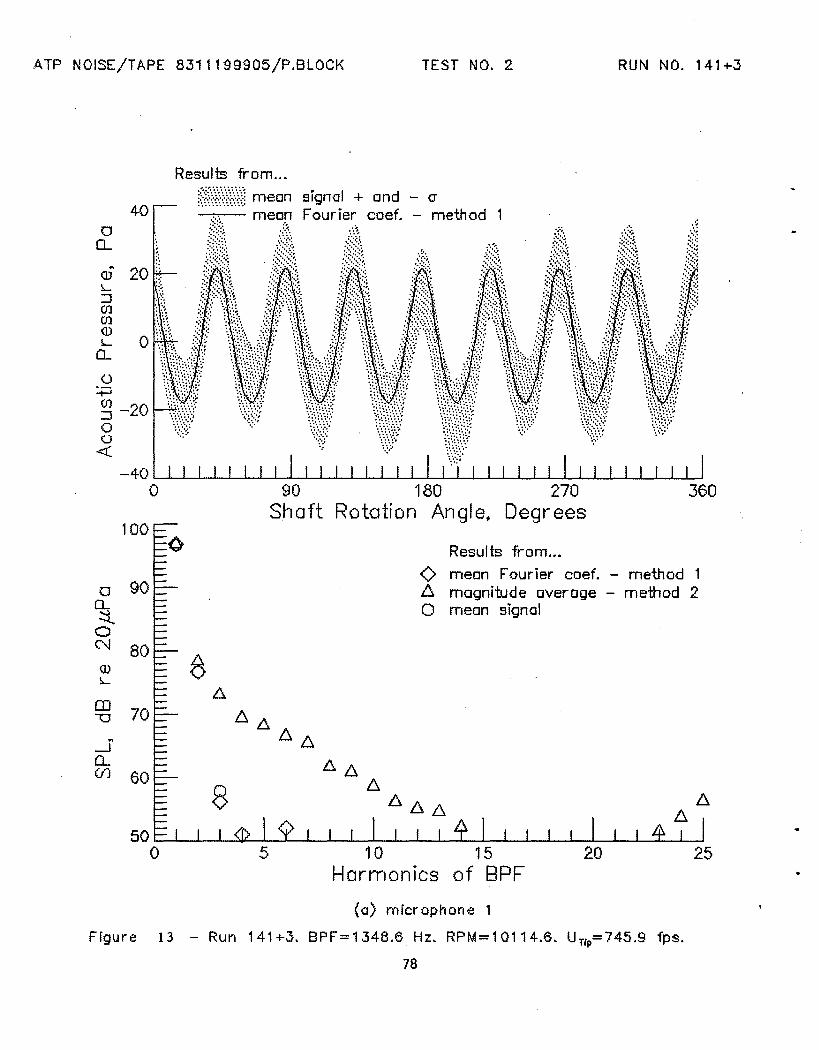
(a) I"t'licrophone 1
Figure 13 - Run 141+3. BPF=1348.6 Hz. RPM=10114.6. UTiP=745.9 fps.
78

ATP NOISE/TAPE 8311199905/P.BLOCK TEST NO.2 RUN NO. 141+3
40
Results from...
jNN~~\~~? mean signal + and - cr-- mean Fourier coef. - method
36090 180 270Shaft Rotation Angle, Degrees
100
"Q)L::J(f)(f)illL
0...
o~
~ -20o(J
<:(
- 40 L.-l..-J....-...L.......I-1-.....L..-J-..I..--.1.--'--'--'---J--J.-..J.--'--'---L.-l..--J--..L-...J.--'--'--.L.-J.--J....-...L..-i-..l-.....L..-J...-,L-L-.J--.I
o
Results from...
<> mean Fourier coef. - method 1fj, magnitude overage - method 2o mean signal
•
a 90
~oC\l 80(J)L
~ 70
5 10 15HarmonIcs of BPF
20 25
{b) microphone 2
Figure 13 .. - Continued.
79

ATP NOISE/TAPE 8311199905/P.8LOCK TEST NO.2 RUN NO. 141+3
Results from ...
o0...
..([JL:J(J)(J)(I)L
0..
30
90
signal + and - <r
90 180 270Shaft Rotation Angle~ Degrees
360
2520
Results from ...
o mean Fourier coef. - method 1f:j, magnitude overage - method 2o mean signal
10 15Harmonics of BPF
54OL...-"---"---"---"---"-"'--"'--'''''--'''---'---'--'''----'--'__-'---'--"''---"''---"''----'----'----'---'--....L...-,-I
o
.....J0-(f) 50
o 80
%oN 70IDL
96 60
(c) microphone 3
Figure 13. - Continued.
80

ATP NOISE/TAPE 8311199905/P.8LOCK TEST NO.2 RUN NO. 141 +3
100
Results from ..•
D@)))~ mean sIgnal + and - cr-- mean FourIer coef. - method
o0....
40
I I I I90
Shaft
I I I I I I I---l-I.l-l...L..l-.L1.....J.1_11-.L-1...L-.l-L1.....J.1--l1---l--I......L..--L...-J--..J..-1I'180 270 360
Rototfon An gl e~ Degt" ees
90 ~
..
o0....:::i.o
N 80illL
co-0 70
5
Results ft-om ...
<> mean Fourier coef. - method 1f::. magnitude average - method 2o mean signal
(d) rnicrophone 4
Figure 13. - Ccntrnued.
81
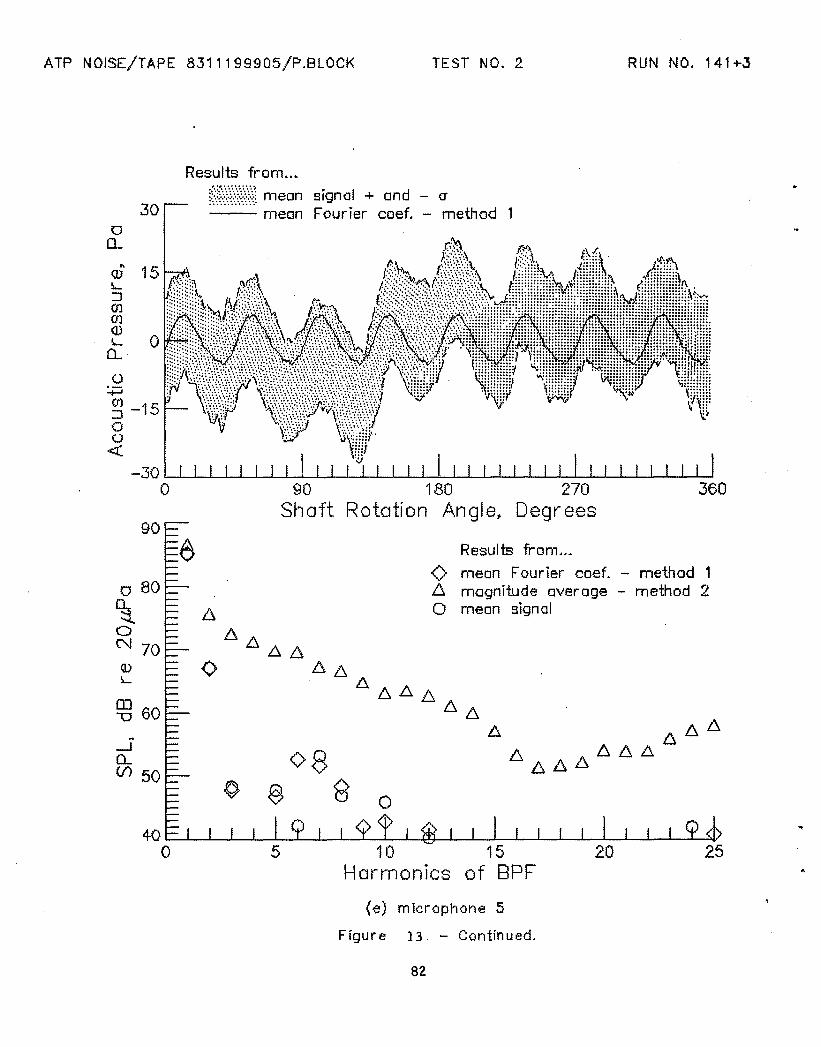
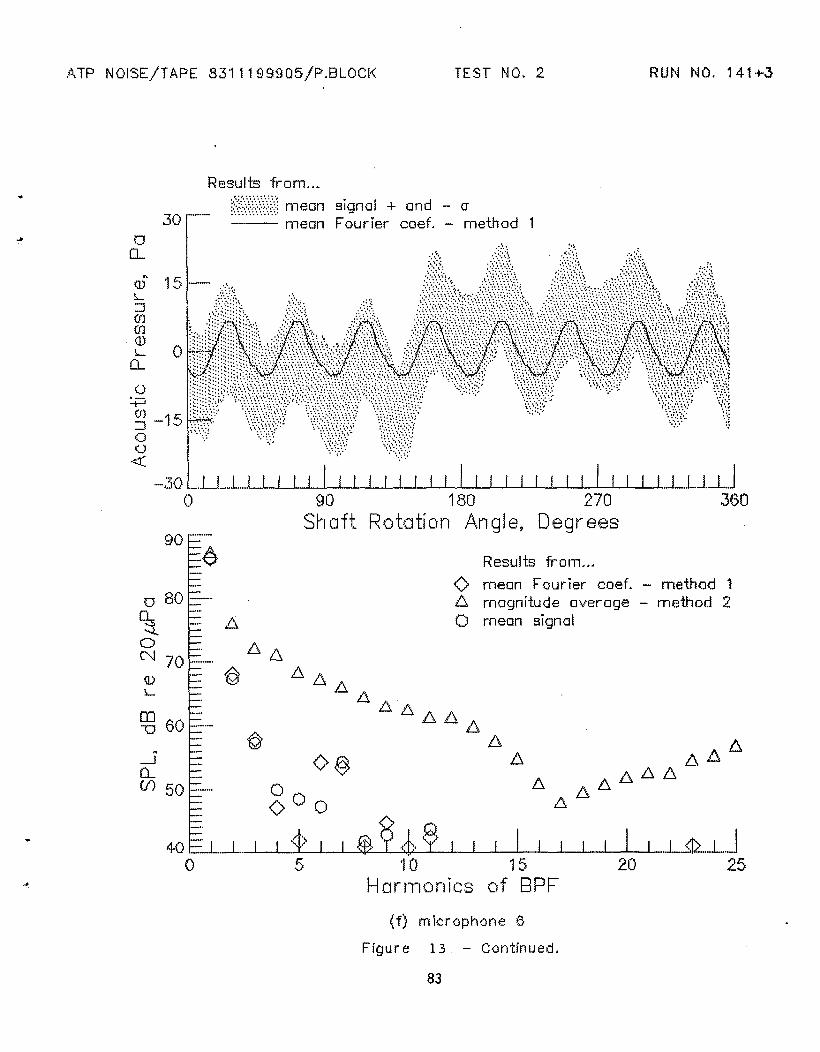
ATP NOISE/TAPE 8311199905/P.BLOCK TEST NO.2 RUN NO. 141 +3
30
Results from...
1~«~~((:~ mean signal + and - cr-- mean Fourier caef. - method
90
6o 80
%.0N 70(J)L
~ 60~
...JCL(f) 50
5
Results from..•
¢' mean Fourier caef. - method 1.6. magnitude overage - method 2o mean signal
o
20
{e) microphone 5
Figure 13. - Continued.
82
ATP NOISE/TAPE 8311199905/P.BLOC~< TEST NO.2 RUN NO. 141 +3
oCL
30
Results from ...
?(\\\\\ mean signal + and - cr_..._- mean Fourier coef. - method
(j
...(l)L::Jillill(J)L
Q.. o "",1;""'\i·"4""",\"-";~,:,,.-\,,.%":.}1'4;'-.".''X":':":'~'?';"""';;""":~
. - 30 L.LLJ.......I-l..J-l....l..1-J...-J1,---,--'..J-I-,-I-1.1--,1,--,--'oL-l-,-'-.1..1--11--1--1..1-1..J-I-.1..1-1.1--,11..-.L-1oL-l-1-1-1.1--11--,---,-1.LJ...J..-L....1
o 'gO 180 270 360Shoft RototlOIl Angle~ Degrees
1--1-1--J,.1-l..--L..--I---1.--.L.-<c?_..LJ15 20 25
of BPF
Results frotll ...
<) mean Four ier coef. - method 1f:l magnitude a\lerage - method 2o mean signal
(>~
°0<> 0
<t> VN )'..? 1 8·4-0 _.J...._J..........I--'-_l:--J.--J._sv· Y<~.:. ~/ 1 I
o 5 '10HortTI()1l leS
<DL
90 ._.....-
,-.~
......J0..(f) 50 -
OJ -'\J 60·_..·..-
o 80 -'-0... ••
::toN
(f) rnk:r~Jph(Jne 6
Ffgur e 13 - C~Jntfnued.
83
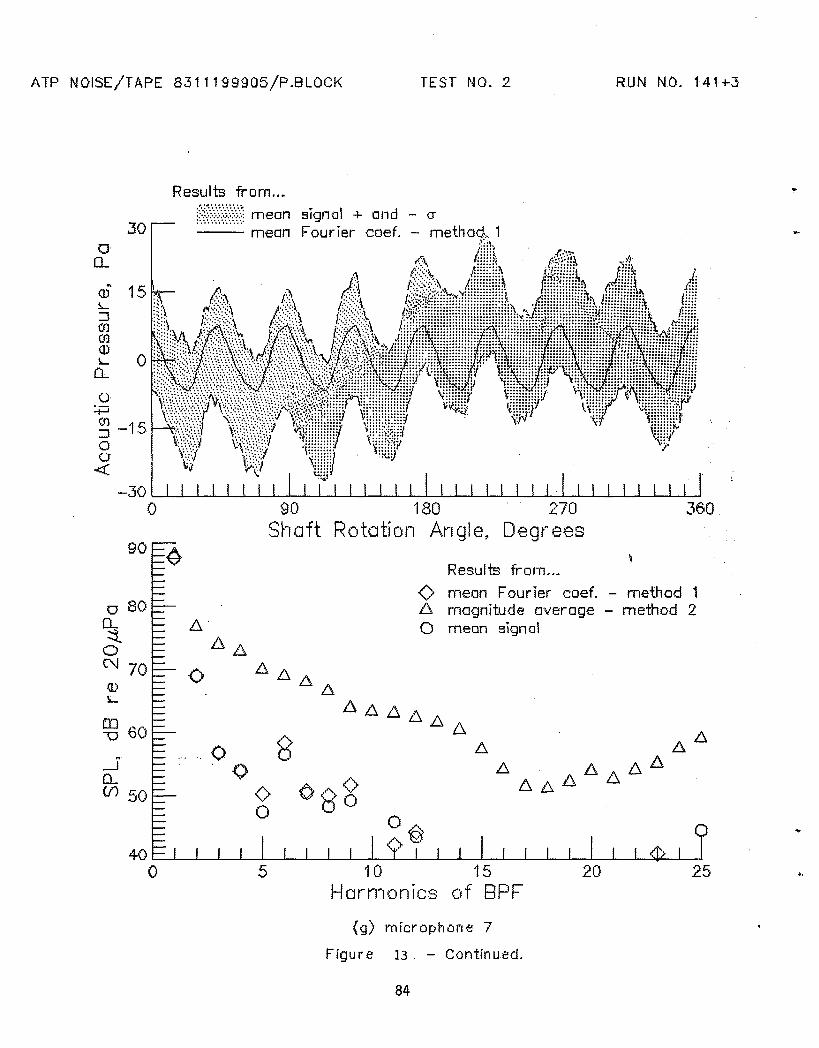
ATP NOISE/TAPE 8311199905/P.BLOCK TEST NO.2 RUN NO. 141 +3
Results from ...
0,25
360
20'IS()f BPF
Results ft-om ...
<> mean Four ler coef. - method 1f::J. magnitude average - method 2o mean signal
90 '180 270Shaft Rototion Angle~ Degrees
.0·0
<>o
-:30 '---'---1--'-->-....1...--1--'--'--'---1-....L...-'--'--J--....L...-'--'--'--'--'--'--J--..L-I--'-"""O-..L-I---'--"""O-...........---'-"""O-~
o
90 ~
o 80CL::toN 70IJ.)L
9,B 60
-lD-(j) 50
30o
0...
(g) mfcrophone 7
Ffgu reB. - Ccntfn ued.
84
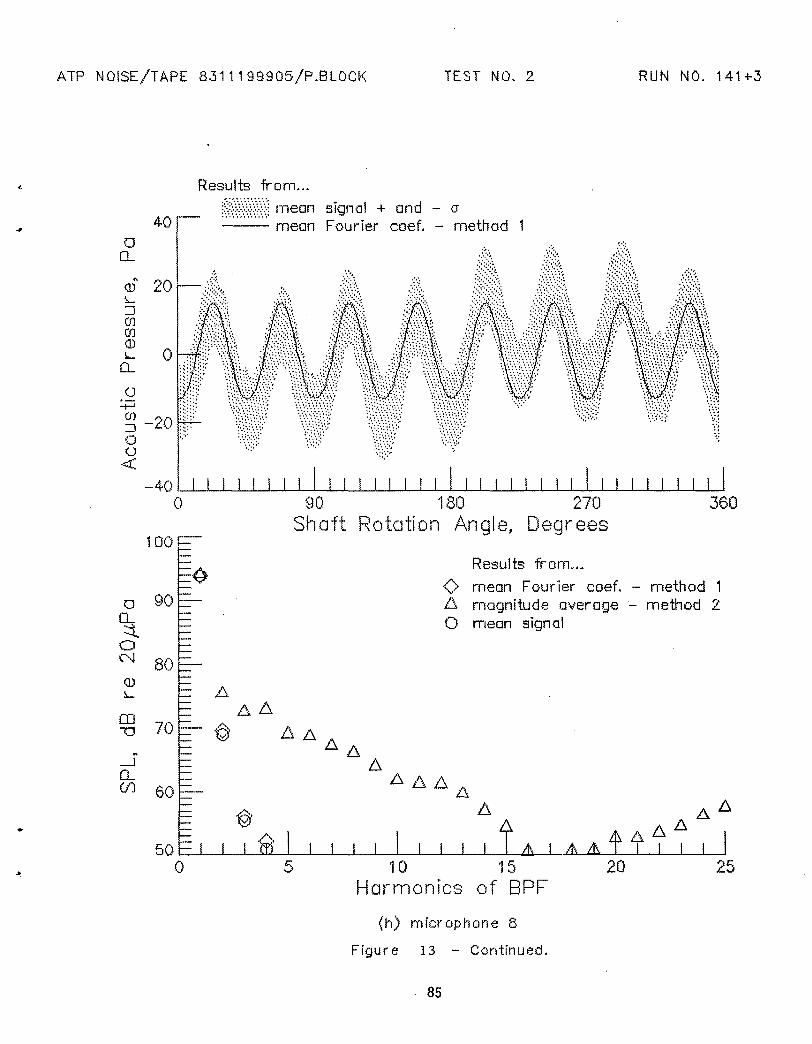
ATP NOISE/TAPE 83111 999 05!P.8 LOCt\ TEST NO.2 RUN NO. 141 +3
Results from ...
360~lO '180 270Sh aft Rotot[ on ~.n gl e, Degr ees
"':':':"
f%\\\;) mean signal + and - cr-- mean Fourier coef. - method40
100~
-40 '--'--'--...l.-..L-'--...I-..J'---'--'--.L-..L.-'--~-'---'---''---'--'--'--'--'--J..-4-'--~--'--'---"'--'--1-",---,----L-..J
o
..illL:JmmillLII
():pm:Jo(J
<.{
o!l
~ 70
--.JII(/) 60
o
~o(,..J
Q)L
90
80
Results from ...(> mean Fourier coef. - method 1f::" magnitude m"'erage - method 2o mean signal
b..~
1 /0' 6. ./::;, IL:!..50 l..--'--..J..--'--.:..J.!..-L-~~--1----''---J.--'---..J..--'---l-.-L--.u.l..---l-_.L.lA;.>-.0,0.....&""'-\ I I I I
o 5 10 15 20 25HOt~rn()nICS of BPF
(h) rnic:r ophone 8
Figur e 13 - Continued.
. 85
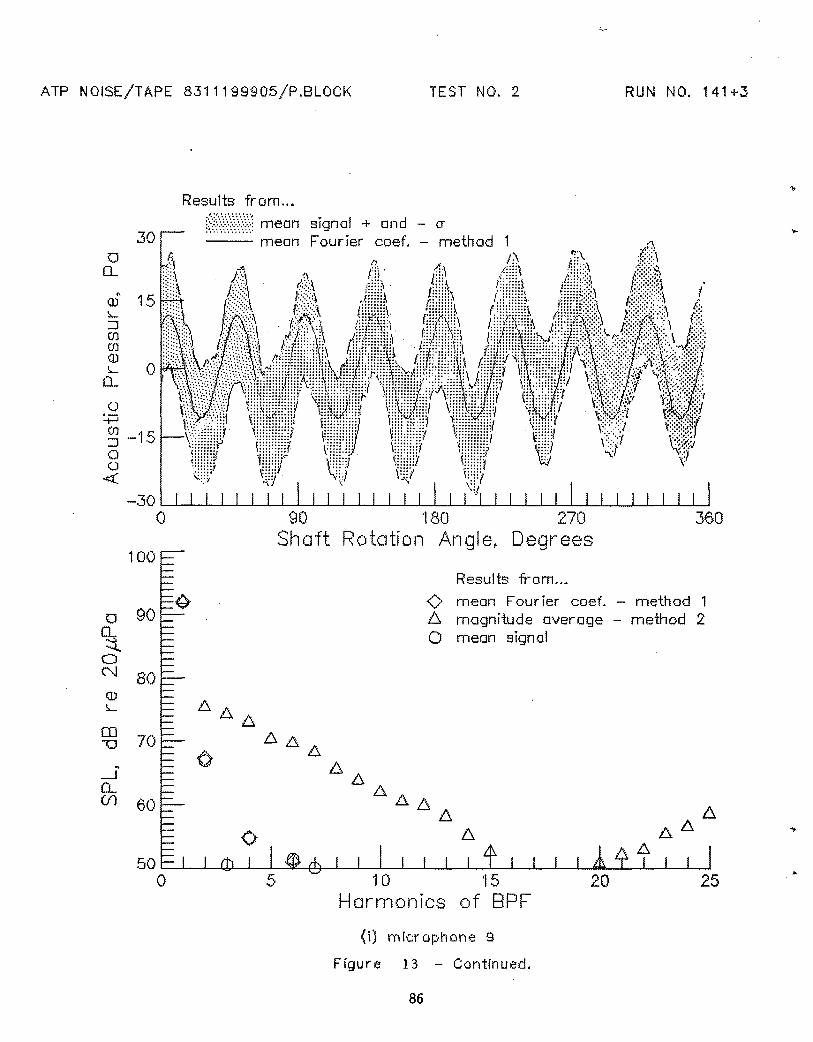
ATP NOISE/TAPE 8311199905/P.8LOCK TEST NO.2 RUN NO. 141 +3
Results from...
{}:'}'~~~:'~~::\:::1 mean signal + and - cr30 .- mean Fourier coef. - method 1 ;~,
o (; ;\ ":.\ .t::/\(l
..OJ~
::JOJOJill!.....
II
(j
-+-'m 'It::::J - .....'au-<
100
90 '180 270Shaft Rotc1tfon Angle 1 Deg-rees
360
Results ft-om ...
(> mean Fourier coef. - method 1I::::. magnitude average - method 2o mean signal
o%aN
ill!.....
90
80
70
60
~.
5 '10 '15Harrn·:,)nics of BPF
{O rnlcr ophone 9
FIgure 13 - ContInued.
86
20 25...
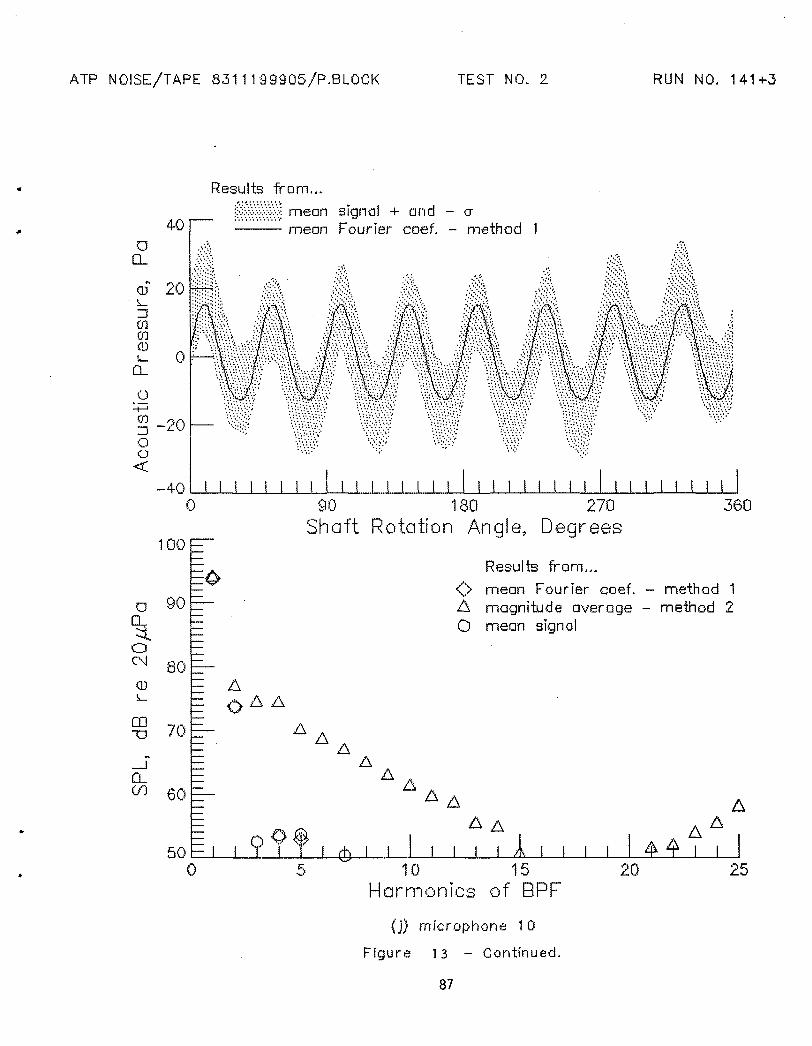
ATP NOISE/TAPE 83111'99905/P.8LOC~< TEST NO.2 RUN NO. 141+3
..(JJ
'I.::Jmm(1)l.-
n...
4-0
Results from ...
f)~}:}}::) mean slgnol + and - cr-- mean Fourier coef. - method
o:.;:;0') ,)r)::J -Lt
oo-«
- 40 '--J..-'--...l-I..--J.,.-'--....L.-J.
o
100
180 270ROtc1tion Anr~le, Degrees
I I360
o 90[l.
:::t.oc'J 80(J)I.-
~ 70
Results from ...
<> mean Fourier coef. - method 11:::. magnitude overage - method 2o mean signal
(j) microphone 10
Ffgure ] 3 - Contfnued.
87

ATP NOISE/TAPE 8311199905/P.8LOCK TEST NO.2 RUN NO, 141 +3
Results from ...•
.'.':',
;:i:h.
1~S~~\\(~\ mean signal + and - cr40 ;,,\'0, Fourier coet. - method
ci: j}j$,Q1 20!>::J(l)(l)
illL-
0...
o :~I!
<t _40 '--'--'-...l....-l.-.L.-'-..J........JI'---'--'-.J---J~·--'·;~::-_?.J---J--,---,\_~T......../ -'-..I..-.-L--,--,-",---,---,--,-,--,---,--,--L..L..L..Jo 90 '1030 270 360
Shaft Rototlon ft,ngle, Degrees100
a 90CL:::toC',~ 80illL
~ 70
Results from ....
<> meon Fourier coef. - met.hod 1L::. magnitude overoge - method 2o meon signal
l::.l::.
l::.iJ.l::.
/j./j.
50 '---'---"--~i9--""---'---'----'----'--'--'----'----'---J---1.---'---'---'---'---'---'---l.---,";~...!:±:._fo 5 '1 0 15 20 25
Horrnonics ()f BPF
{l<.) mfcrophone 11
Ffgure 13 - Contfnued.
88

..
..
100
95
Q)\J
_J 90II(f).~
C::J
8'.)
Resul ts frorn '"<> I"neon Fourier coef. - method 1fj, I'nagnitude average - method 2o I'neon sIgnal
80 ....._1 I I I II
-5 -4 -3, rl -1 0 1 2 .3 4 5-L
tvlicrc)phone I,'" ("""l+ion feet--' .....,'- ... 1
{ IJ" <' . "t...:>urnrnar y ot S op
Figure 13. - Run 141+3. BPF=1.:548.6 Hz. RPM=10114.6. IJ np=745.9 fps.
89
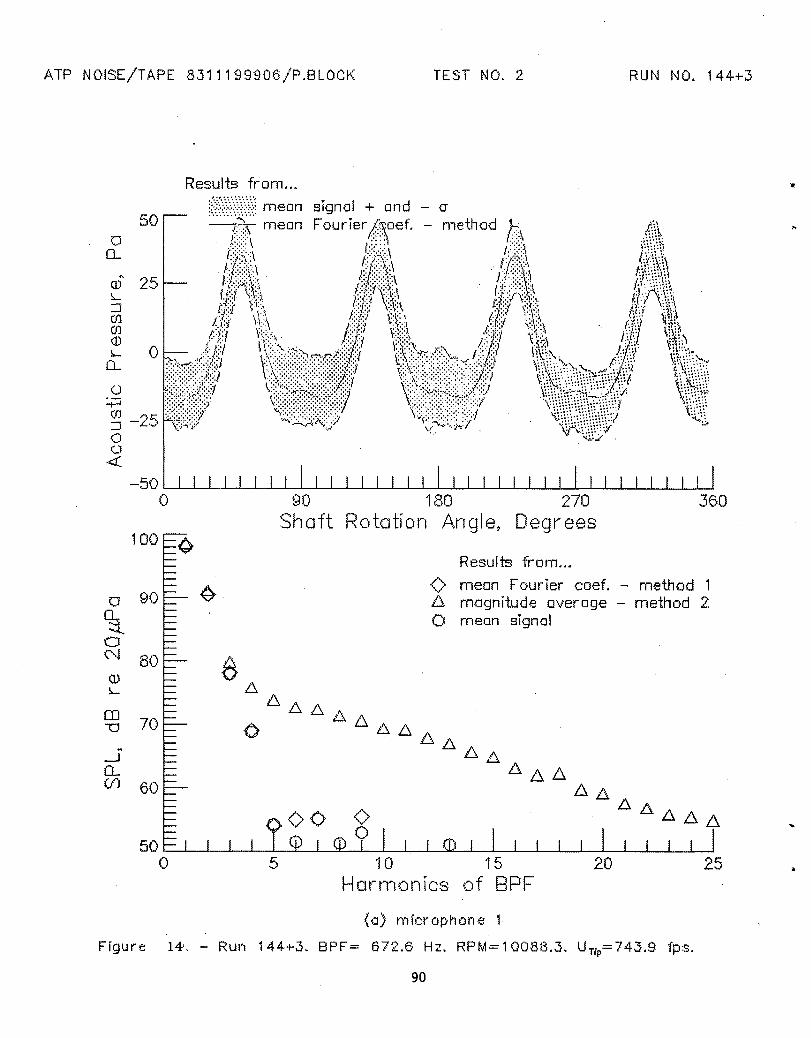
I-\TP NOISE/TAPE 8,311199906/P.8LOCK TEST NO.2 RUN NO. 144+3
Results from ...
270Degrees
I I I I I I I I I I I180
Rc)totf on A.n 1;;]1 e~
I 1 I 1 I
90Shaft
50
100
?)\'~\\~}1 mean signal + and - cr
-/0\ mean Fouriert0ref. - method /]\ l\.\l:.•;.:.',~.~..'.;.':~.'.~.>.'.;,(:::;:;., /:,~t\ (,;,:i:\ .
I,:lf"",::••:.·,(;:;:,:/~::,:\,,~,·.j.~:·;:.~\:{:.\:::," (J:-"i:\ Jl.{~\~ dAM(J)" 25 . ._, r. ,!:~t:\l::\ ./' ::::l', rr.l:.:t\
I (. \ .~::i:::t\:::h (.i::.:':':~'::~:\ j;/'" "d','~ 1'1':+ \; ;", /. , ., \" "J'.'J \:\·••••••l~..:.':,. " , \ .,..'
. 1'" "/"" ,"'1"\ 'r:"' :,t•• ~ t,"1"\,:J I":~'" '..', .'..', . '. .' .'; t' .
.•(.;'J ,.;:, J.:-:~"< ::'\:" .•..•:.-:;. ,."'.< ,,' r .' '\m I: 1,l':J, (:.f::.I\:P, 'l'i' ~,!:
m \+:), kt:' :;~I.',i.,::,.:~::,., ~f.,.~·.·,l:I.;::l':· ,in\~;:\;::~ ;:; <:·1,N:1 ~~\;1,
~ 0 ,',:)\\.:'.:'.·.:.:-.:',\:,.:.\i.;i.:.\.:l:;:.._.,..;.;:.':~~.::F::\::::•.:..::•.•:',,':'l':.,:i:.::
7
:.,:.:::.·.:::.,:.; :.f::::,::..:'.":'::'~::::·":~":'I::'~';~/~':••"'" \~~~i!l \(,:;:,\:~.~,~..~.~.'.~::.~.:~.'.~o \ - ~:-·\~l'l~~Y \~l(.1
<-50 _I
o
Results frorl1 ...
(> mean Fourier coef. - method 1h. magnitude average - method 2o meon signal
..2520
<>-. 0
50 L-...I.---L...--l---L--L-..::It:.:..-.L-::±::...l-L...--l---L--L--::..LL-.l..-..L----l-.-L--1..--L_L-.l..-..L----l--.l.----I
o 5 10 '15-HOrtTIOnfcs ()f BPF
70
80
60
a0...~o0J
Q)L
-.J0...(f)
«(I) rnfc:ropl"'OIH: 1
Figure 14'. - Run 144+3. BPF= 672.6 Hz. RPM= 10088.3. IJ Tip=743.9 fp:s,
90
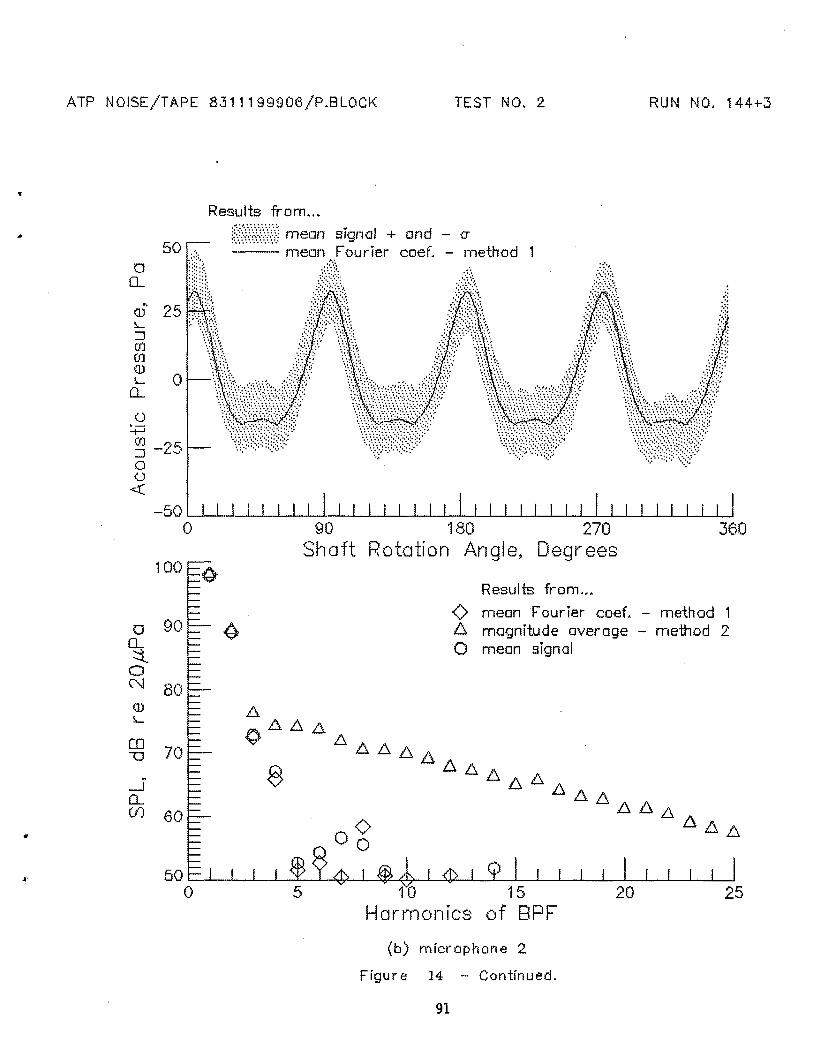
ATP NOISE/TAPE 8.311199·906/P.8LOCK TEST NO.2 RUN NO. 144+3
•Results frorn ..•
360
Results ft-orn ...
<> mean Fourier coef. - method 1~ magnitude overage - method 2o mean signal
90 180 270Shaft Rototfon Angle, Degt"ees
- 50 L.-J..-I.-..J..-L.-.L..-..L-..J-.Jo-....1..-l......l-.-.J'---ol---l.-..L.-1---L.....L-.J--l.---L....l.-.L.....L--L..-l.-.L.....L-l-...L.-L.-J..-..L-...l-.JL......J
o
<>°050 '--~-'---'---'---'--'--~--'--"r~••~...........-->./><--..>--''---'---'---'---'---'---'--'---"'---'---'---'
o 10HanTlOnfcs
o:;:;
OJ "&:..::::J -[.;.
ou
<t:
100 O.
~ 70
o 90
~oN 80OJL
{b) mfcrophone 2
Ffgure 14 - Continued.
91

ATP NOISE/TAPE 83111·99906/P.8LOC~< TEST NO.2 RUN NO. 144+·3
Results from ... »
...
360
20
::..~.
Results from...
<> mean Fourier coef. - method 1f1 magnitude a\lerage - method 2o mean signal
.'../i/\.
10HOrtTlonlCS of BPF
90 180 270Shaft Rototion Angle~ Degrees
5
{;~\~\\\) mean sIgnal + and - cr-- mean Fourier coef. - method
100
~
90
680 e70
cE W[cD 20L::imm(l)!.....
CL
o:p
r.J) r,.-)::i - Ll.
o()
<C
- 40 L-l.-l..-...l..-l...-l.-l..-...l..-L-L-l..-...L-L-L-L...L-L-L.-L..L-J:...-J...-L.L.-l:...-J...-l-.L.-l--L.-l-.L.-l--L.-l-.J-.J
o
.....JCLifJ 60
o~o(,••J
illL
(c) microphone ,3
Figure 14 - Continued.
92

ATP NOISE/TAPE 831119990e/p.BLOCK TEST NO.2 RUN NO. 144+3
Results from...
~~{;\<{t mean signal + and - cr-- mean FourTer coef. - method
•
• 500
0......
25<l)L::J(Jl(Jl
:-~:.(\)L
CL
0:.p
Io
100
I I I I I90
Shaft
I I I I I I I I I I I180
Rotation Angle~
I I I I 1L..-1L....J1L.-l-1..-l.-L.....L.-1.-1I270 360
Degrees
o 90
%.o0~ 80(DL
~ 70
<>o
Results from..•
-0 mean Fourier coef. - method 1l:::. magnitude overage - method 2o mean signal
5
(d) microphone 4
Figure 14. - Continued.
93
20 25
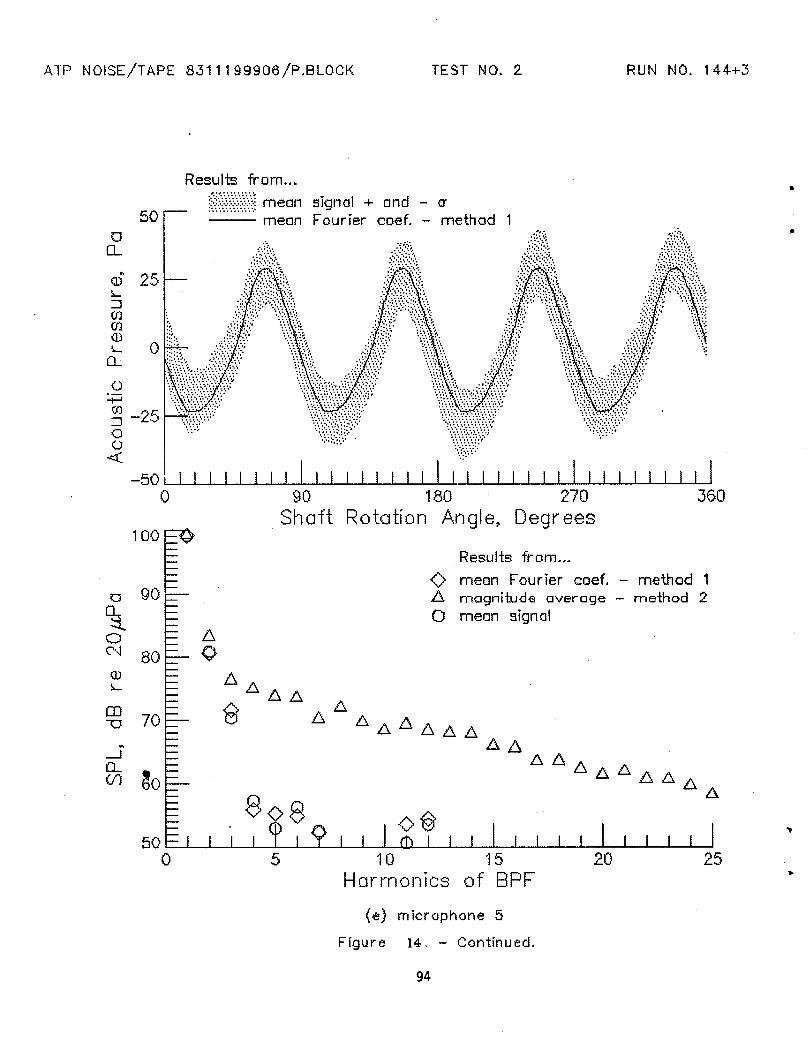
ATP NOISE/TAPE 8311199906/P.BLOC~< TEST NO.2 RUN NO. 144-+3
..
360
\\w~;~?'\\.\~:::
90 180 270Shatt Rotation Angle, Degrees
Results from...
~W~\\\\~ mean sIgnal + and - cr-- mean Fourier coef. - method
'.
0:[:\:::::"::"
50
(I)" 25L::J(f.J(f.J
<D!...
0...
o0...
o=-.--.m "){;'.::J - L. .••)
oo«
- 50 L-L---I.-..L-..I.-L.....J-..JI...-l-...J.-l.-J...---I.-..I..-L-L.....J..-.II...-l-...J.-I..-I..---I.-..I-.J..-L...J...--I.I...-l--L-..I..-I.......L.......I-.J..--1-..l
o
100Results from...
<> mean FourIer coef. - method 1h. magnit.ude average - method 2o mean signal
a 90~
....:.t.a0~ 80illL
IT!-0 70
5 10 15Horrnonics of BPF
20 25 ...
{e) microphone 5
Frgure 14. - Continued.
94

ATP NOISE/TAPE ~B11199906/P.8LOCK TEST NO.2 RUN NO. 144+3
1-1---,--,-1-1.1_120 25
Results from..•
<> mean Fourier coef. - method 1I:::. magnitude average - method 2o mean signal
??:';\{}) mean signal + and - crmean Fourier coef..S); method
){~i~i,~\
_1......1-1..l-..I........L..-I1......J1L-L-1..1.-1 ...I...·..J...··"·-J...I-LI......J-L-.L.-..l-..J......l-..L--1......JL-L-1.1-1 ...1...1..J...I-J...I.....L..-II....,.;IL.....I.-I..I.-...L.....I-II90 180 270 360
Shaft Rotation Angle~ Degrees
Results from...
50 ._._,.......1 -.1--&>--1?--I-.-I.B__�.____.L~_t~<l>fL__I_~__I.____.L,_1 I Io 5 10 15
Harrnonics of BPF
100
..(l)L::JCflCfl(l)L
0...
50o
0..
~ 70 -~
-.J0...(() 60 .....'
o:.r-.
0") ..... &:::J -L...)oo«
-50o
o 900..:::toN 80(J)L
~'
...
•
•
{f} micrcph<me (3
Figure 14. - Ccntlnued.
95
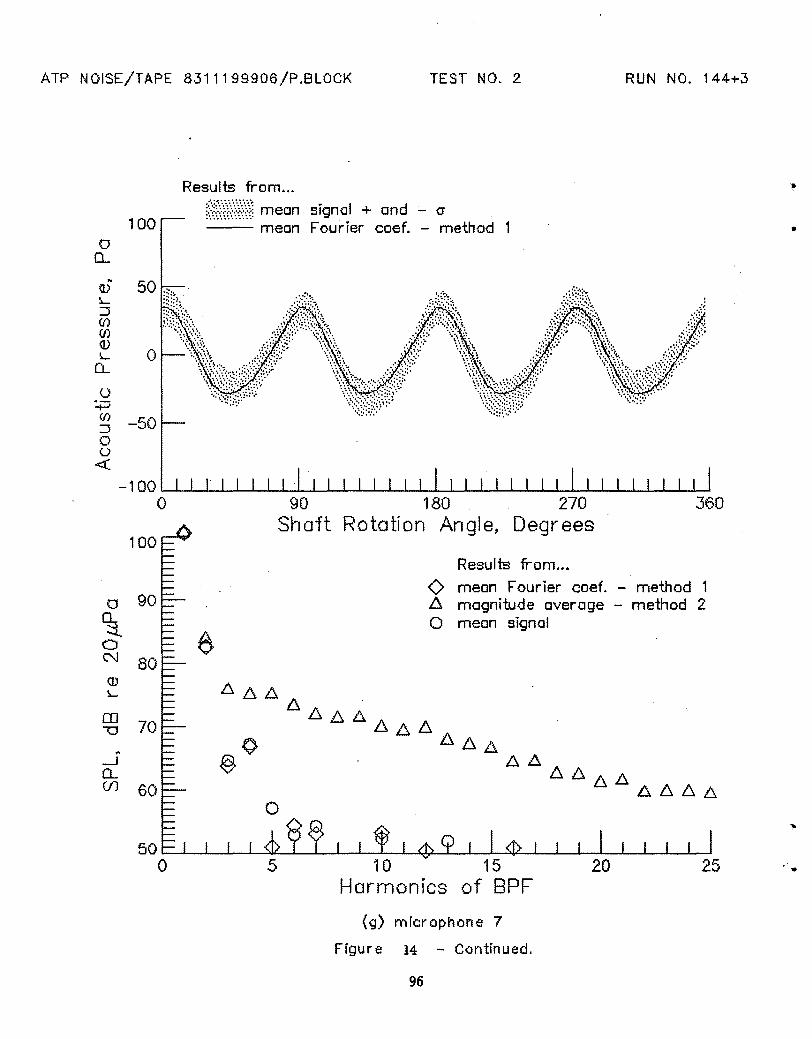
ATP NOISE/TAPE 831119990e/p.8LOCK TEST NO.2 RUN NO. 144+3
oCL
100
Results from...
??\\W) mean signal + and - 0"
-- mean Fourier coef. - method •
•25
360
20
.:~..~~.~
Results from..•
o mean Fourier coef. - method 1fj, magnitude average - method 2o mean signal
10 15Harmonics of BPF
90 180 270Shaft Rotation Angle, Degrees
5
~ 70
100
..-.JCLifJ 60
a 90
~oC'J 80IJ)L
..ID
::J(f)(f)
~ 0CL
<-)~
~ -50oo«
- 100 ............--I.....-'--'--'-....L-J.--l---'--...1.......J---I---I..............--'--'--L.-.I..--I.....-'--'--'-....L-J.--l---'--.........---I---I..............--'-..........
o
(g) microphone 7
Ffgure 14 - Contfnued.
96

ATP NOISE/TAPE 831119990e/p.8LOCK TEST NO.2 RUN NO. 144-+3
36090 180 270Shaft Rotation Angle, Degrees
Results from..•
~~;r;\\?) mean signal + and - cr-- mean Fourier coef. - method 1
100
1000
CL..
50IDL::;i(f)(f)<l)L
0...
<->~
~ -50ou«
- 100 '---L---'--...L--J--'--'-...........--'-.............--L..-'-J-...I.~ .........I---L--'-.I...-I.~ .........---'--...........--'--'-'--'---'-...L--J
o
III
•
Results from..•
(> mean Fourier coef. - method 1fj, magnitude overage - method 2o mean signal
a 90
~o0J 80())L
~ 70
10 15Harmonics of BPF
25
(h) mfcl"ophone 8
Ffgure 14 - Ccntfnued.
97

ATP NOISE/TAPE 831119990ejp.8LOCK TEST NO. 2 RUN NO. 144+3
Results from...
jf:~~~~~\\>~i mean signal + and - cr-- mean Fourier coef. - method50
0fl
..25(I)
L::J(Jl(JlQ)L
n...()
100 <)
o 90
~ ~oC'J 80
1 1 I 1 190
Shaft
I I 1 I 1 I 1--Jll.......I..-l",-'..J..-J...I......I--.L1---l1~1",-I...1-1 ..L..-L......L.-J~.L-.;II180 270 360
Rotation Angle, Degr ees
Results from..•
<> mean Fourier coef. - method 16 magnitude overage -method 2o mean signal
•
•
~ 70
"-'0....(f) 60
50 L,--.L....-.I.-o.-'---.L.--'---'--....1-....L--....1--=---'---'---'--'---'---'---'---'----L---'-----"----'---''--'---'
o 5 10 15 20 25"Harrnonics of BPF
{l} microphone 9
Figu r e 14 - Cantin ued.
98

ATP NOISE/TAPE 831119990a/p.BLOCK TEST NO.2 RUN NO. 144-+3
"
o!l.
100
Results from...
?~N~A:{~ mean signal + and - cr-- mean Fourier coef. - method
..(I)
L:J(f)(j)())L
CL
o+-t
(f) -50
6 Io
-« -1 00 ,--,-I-L-.,--,--,-,--,-I......1_1 I Io 90
Shaft100
I I I I 1 1 I I I I 1180
Rotation Angle,
I I I 1 '_1,"-,,--1"'--'-.........--'--11"--'1270 360
Degrees
Results ft-om...
o mean Fourier coef. - method 1lJ. magnitude overage - method 2o mean signal
00....:::t
0N(])L
OJ-0
..-'CL(j)
II
90
80
70
60
5 10 15Harrnonics of BPF
(j) rnfcrophone 10
Ffgure 14. - Contfnued.
99
20 25

ATP NOISE/TAPE 8311199906!P.8LOCK TEST N~O. 2'
aCL
50
ResuJts fr om...
{r~)\\\j mean-- mel9n
signal + and - aFourier coef'iC\ method
2520
Results, fr-om...
<> memn Four ier coef. - method 1L':l magnitude mveroge - method 2o mean signal
10 15Harmonics of BPF
5
<>o 00o
100. ~
:.j::i
Cf) _')&;.:J ,1;......,
oo
<{ - 50lL-..Lr-J-.L-...L.-'--.J......J.1--l1'--'-.l-1-L1-I-1..L1.....I1_.L-1-1.1-1-1 ..J-1--l1---'..-1-L1-I-1 ..L.1.....11-.1-1...1;,1_1.....·· ..J-1.....II"--L--Io-'"--L.-Ji-..L.-'Io 90 180 270 360
Shaft Rota:tion Angl'e~ Degrees
-'CL(f) 60
a 90
~o0J 80illL
fg 70
(k) mfcrop~lone11
Ffgur e 14. - Cantfn ued.
100

•
•
105
Results from ...<> mean Fourier coef. - method 1l::J. magnitude average - method 2o mean signal
100
CO-0
..--.J 950....(f)«0
90
-4-585 ~--'----L-_._J _-'---'-----'-I--'-----'1_1
-3 -2 -1 0 1 2 .3 4 5Microphone locotlon j feett
(I) Surnrnary of SklP 3
Figure 14. - Run 144-+3. BPF= 672.6 Hz. RPM= 10088.3. UTfp=743.9 fps.
101
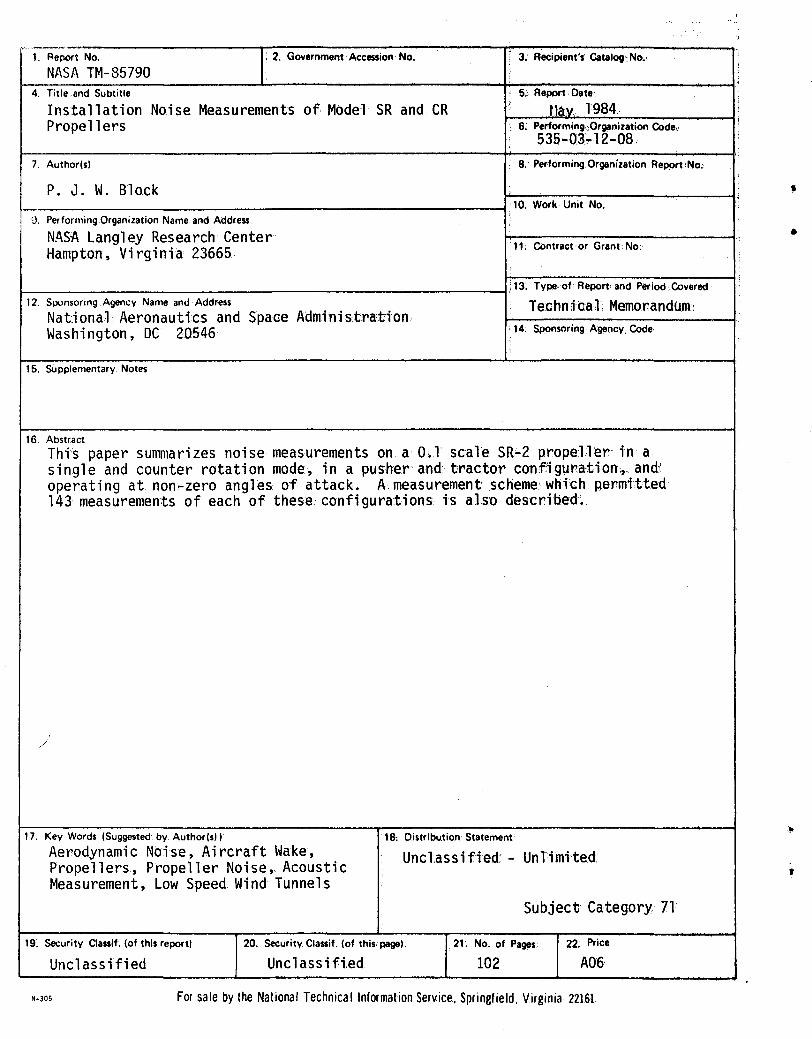
'O"---~-'--'--------"'T""'::-::,------:------".-------- .....1. ~;r;~ ~M-85790 2. Government Accession No. !) 3.' Recipient(f,Catalog' No., 1\
4. Title and Subtitle
Installation Noise Measurements of Model SR and CRPropellers
I; 5: Re~rt Date, I:I t,l~v 1984 I'I' 6;, Pel'forming)OrllilDizationCOde., I,: 535~03-12-08 I:
7. Author(sl I: 8. PerformingOrllilniZation Re~rt iNo;,
•I
I'1'1; COntractor, Grant·, No.
P. J. W. Block~ --II; 10. Work Unit No.
: 0, Performing Organization Name and Address I:NASA Langley Research CenterHampton~ Virginia 23665
,14. Sponsoring Agency, COde,
12. Sponsoring Agency Name and, Address
Na ti onal Aeronautics and Space Admini s,tna:tion,Washington~ DC 20546
I,........:-::-~:-::----::--------l !
1------------------------------11:13. TypeiOf Re~rt, and Period COvered
Te.chn deal Memorandum':
15. Supplementary, Notes
16. Abstract
Thi~ paper summarizes noise measurements on a 0.1 scale SR~2 propeller in asingle and counter rotation mode, in a pusher and, tractor conf:ig~H'ation;,.and:operati ng at nom-zero angles of attack. A. measurement scHeme which permUted143 measurements of each of these configurations is also described~
17. Key Words (Suggested by Author(s) I
Aerodynamic Noise, Aircraft Wake,Propellers, Propeller Noise, AcousticMeasurement, Low Speed Wind Tunnels
18: Distribution Statement
Unclassified:' - Unlimited,I
Subject Category 71
19. Security Classif. (of this report)
Unclassified20. Security Classif; (of this, page)
Unclassified2,1. No; of Pages
102
22; Price
A06
N-JOS For sale by the National Technical Information Service. Springfield. Virginia 22161


![Design and Fabrication of Tilt -Hexacopter with Image ... · pentacopter [ five propellers], hexacopter [ six propellers], octocopter [ eight propellers], etc. Here , the design methodologies,](https://img.pdfslide.us/doc/110x75/5e21c800611caa04ab6d729c/design-and-fabrication-of-tilt-hexacopter-with-image-pentacopter-five-propellers.jpg)