Embed Size (px)
Citation preview
June 2010Olav Bolland, EPTProfessor Magne Hillestad, IKP
Master of Science in Energy and EnvironmentSubmission date:Supervisor:Co-supervisor:
Norwegian University of Science and TechnologyDepartment of Energy and Process Engineering
Power Plant with CO2 Capture based onAbsorptionIntegration Study
Paul Andreas Marchioro Ystad


Problem DescriptionBakgrunn:CO2-fangst, -transport og -lagring i forbindelse med kraftproduksjon er på verdensbasispotensielt en av de viktigste teknologiene for å begrense utslippet av CO2 til atmosfæren. CO2-fangst innebærer behov for å bruke energi. Dem mest aktuelle teknologien for CO2-fangst på kortsikt er absorpsjon ved hjelp av aminer eller andre løsningsmidler. CO2-fangst krever bruk avenergi, og i en absorpsjonsprosess kreves bruk at varme i form av damp på ca. 130 °C, samttrykktap som innebærer bruk av mekanisk arbeid i pumper og vifter. Energibruken for å separereCO2 fra eksosgass øker et kraftverks brenselforbruk ca. 15-40%.
Denne oppgaven fokuserer på bruk av integrasjon mellom kraftverk og absorpsjonsanlegget, samtintegrasjon internt i absorpsjonsanlegget.
Mål:Finne optimal, med hensyn til energibruk, måte å integrere en gitt kraftprosess og etabsorpsjonsanlegg for CO2-fangst.
Oppgaven bearbeides ut fra følgende punkter:1. Litteraturstudie: Gi en oversikt over publikasjoner som omhandler integrasjon av post-combustion CO2-fangstteknologier og kraftverk. Spesiell fokus skal rettes mot absorpsjon/desorpsjonsteknologier. Sammenhengen mellom energiforbruk og grad av og type integrasjonskal rapporteres. Videre skal type verktøy og beregningsmetode som har blitt bruktdokumenteres.2. Basert på litteraturstudie og evt. andre kilder, skal state-of-the-art, i den grad det er mulig ådefinere, for absorpsjonsanlegg for CO2-fangst beskrives. Integrasjon og energiforbruk skaldokumenteres.3. For å kunne analysere virkning av ulike integrasjonstiltak på masse- og varmebalanse ikraftverk og i absorpsjonsanlegg, skal det lages hensiktmessige regnemodeller i verktøy som GP-Pro, ProTreat, GTPro, Hysys/Unisim. Det vil mest sannsynlig være fornuftig å lage modeller forkraftverk og absorpsjonsanlegg hver for seg, og i tillegg ha et system for å samordne dataflyt oginteraksjon. En bestemt absorbent, for eksempel MEA, bør velges.4. Det skal identifiseres tiltak for energieffektiv integrasjon mellom kraftverk ogabsorpsjonsprosess og internt i absorpsjonsprosessen. Regnemodellene skal benyttes til åkvantifisere evt. fordeler med hensyn til energibruk.
Assignment given: 26. January 2010Supervisor: Olav Bolland, EPT


Preface
I
Preface
This report, Power plant with CO2 capture based on absorption, is written as the Master’s Thesis of stud. techn. Paul Andreas Marchioro Ystad. The report was produced at the Department of Energy and Process Engineering at the Norwegian University of Science and Technology in Trondheim, Norway. The report was written as the final thesis for the 5-year Master of Science Degree in the field of Energy and Environmental Engineering.
The content of the report is a detailed integration study on power plants with post-combustion CO2 capture based on absorption. The report looks at integration of both natural gas- and coal-fired power plants. Additionally, several alternative configurations of the absorption process have been investigated, aiming at reducing the reboiler energy demand. Part load analysis has been performed in order to check the power plants and capture process behavior at various plant loads.
The author of the report is hopeful that the information and results provided in this report can contribute as an element in the campaign of mitigating CO2 emissions from fossil fuel based power production.
June 9th 2010, Trondheim
Paul Andreas Marchioro Ystad


Acknowledgements
III
Acknowledgements
I would like to express my gratitude to my supervisors Professor Olav Bolland and Professor Magne Hillestad for their help and guidance through the project period. Their enthusiasm on the topic of ‘Carbon Capture and Storage’ has been a great inspiration to me. I would also like to thank my fellow students for their unambiguous support and patience through periods of high work load. Special thanks are addressed to my dear friends Anders Gåre Søraunet, Ida Andreas Braathen Sognnæs, Ivar Vestbøstad, Kari Sørnes and Nicolai Meltveit, with whom I have had the honor of sharing memorable moments and experiences with the last 4 years in Trondheim.
Finally, I wish to express my deepest thankfulness and love to my family, Bjørn (father), Ann (mother), Michelle (sister), Sunniva (sister) and Patrick (brother), for their endless support throughout the duration of my studies.

Abstract
V
Abstract
This thesis gives a detailed evaluation of the integration of power plants and post-combustion CO2 capture based on absorption. The study looks at natural gas combined cycles and pulverized coal power plants. Also the absorption process has been evaluated separately, aiming at reducing energy requirements in the capture process. In the first part of the thesis a theoretical part was given on fundamentals of CO2 capture by absorption, power generation, and process integration. Based on this theory, several case studies were defined for each of the three main processes. Simulation models were built accordingly and investigated.
Simulation results from the capture process showed that there was a reboiler energy saving potential of 29% and 27% for NGCC and PC plant, respectively, when including vapor compression and absorption intercooling in the capture process. Another interesting observation made was reduced cooling duty in the overhead condenser of the stripper when applying vapor compression.
Analysis of steam extraction from the NGCC plant showed it was possible to cover 1 MJ/kg CO2 directly from the HRSG. This steam can be provided directly from the LPB. For duties above 1 MJ/kg CO2 a secondary extraction point was required. In this study the IP/LP crossover was considered the most appropriate point to extract the remaining steam. The efficiency penalty when integrated with the different CO2 capture cases ranged from 7-8%, giving a net plant efficiency of 49.6-50.5%. At part load it was shown that the LPT should be throttled in order to secure constant pressure at the extraction point.
For the PC plant the feedwater heat system showed potential in terms heat recovery in the return stream from the capture process. By integrating the return stream with FWH2, energy savings of 11.9% compared to the base case plant were found. Also it was found that the IP/LP crossover pressure should be set to 4.5 bar, since the IPT has the highest efficiency and therefore power production in this unit should be maximized. The final results for the PC plant efficiency range from 30-31.7% and the percentual efficiency penalty was 10-11.7% for the four capture case studies. As was the case for the NGCC plant, the LPT should be throttled when operating at part load.

Sammendrag
VII
Sammendrag
Denne oppgaven gir en detaljert evaluering av integrasjon mellom kraftverk og CO2-fangst basert på absorpsjon. Studiet ser både på gasskraftverk og kullkraftverk. I tillegg til dette, undersøkes absorpsjonsprosessen separate, med formål om å redusere energiforbruket i fangstprosessen. I første del av oppgaven er det gitt en teoretisk introduksjon til grunnprinisippene av CO2-fangst basert på absorpsjon, kraftgenerering og prosessintegrasjon. Med bakgrunn i denne teorien ble flere casestudier definert for hver av de tre hovedprosessene. Simuleringsmodeller ble følgelig modellert og evaluert.
Resultatene fra simuleringene av fangstprosessen viste et energisparingspotensial i dampkjelen på 29% for gasskraftverket og 27% for kullkraftverket. Konfigurasjonene som ble brukt var absorpsjonsmellomkjøling og rekompresjon av damp. En annen interessant observasjon var at kjølebehovet i kjøleren i stripper-kolonnen ble redusert når prosesskonfigurasjoner der rekompresjon av damp ble benyttet.
Analyser av damp ekstraksjon fra gasskraftverket viste at det var mulig å dekke 1 MJ/kg CO2 direkte fra LPB-kjelen i HRSG. For energibehov høyere enn 1 MJ/kg CO2 kreves det et sekundært ekstraksjonspunkt. IP/LP crossover ble betraktet som det mest hensiktsmessige punktet for å ekstrahere resten av dampen. Tap i virkningsgrad ved integrasjon med de ulike fangstprosessmodifikasjonene var fra 7-8%, og resulterte i virkningsgrader for kraftverket fra 49.6-50.5%. Ved kjøring av kraftverket på dellast viste det seg mest hensiktsmessig å struperegulere LPT for å oppnå konstant trykk i ekstraksjonspunktet.
For kullkraftverket viste fødevannsforvarmer systemet potensialet for å gjenvinne varme fra returstrømmen fra fangstprosessen. Ved å integrere returstrømmen med FWH2 kunne det spares 11.9% energi sammenlignet med kraftverk uten CO2-fangst. I tillegg ble det funnet hensiktmessig å sette IP/LP crossover trykket til 4.5 bar, da IPT opererer med en høyere virkningsgrad enn de øvrige turbinene. På denne måten maksimeres kraftproduksjonen i IPT og energitapet reduseres. Det siste resultatet for kullkraftverket viste at virkningsgraden varierte fra 30-31%, mens det prosentvise tapet i virkningsgrad var 10-11.7% for de fire fangst casestudiene. I likhet med gasskraftverket, ble det anbefalt å struperegulere LPT ved dellastkjøring.

Acronyms and abbreviations
IX
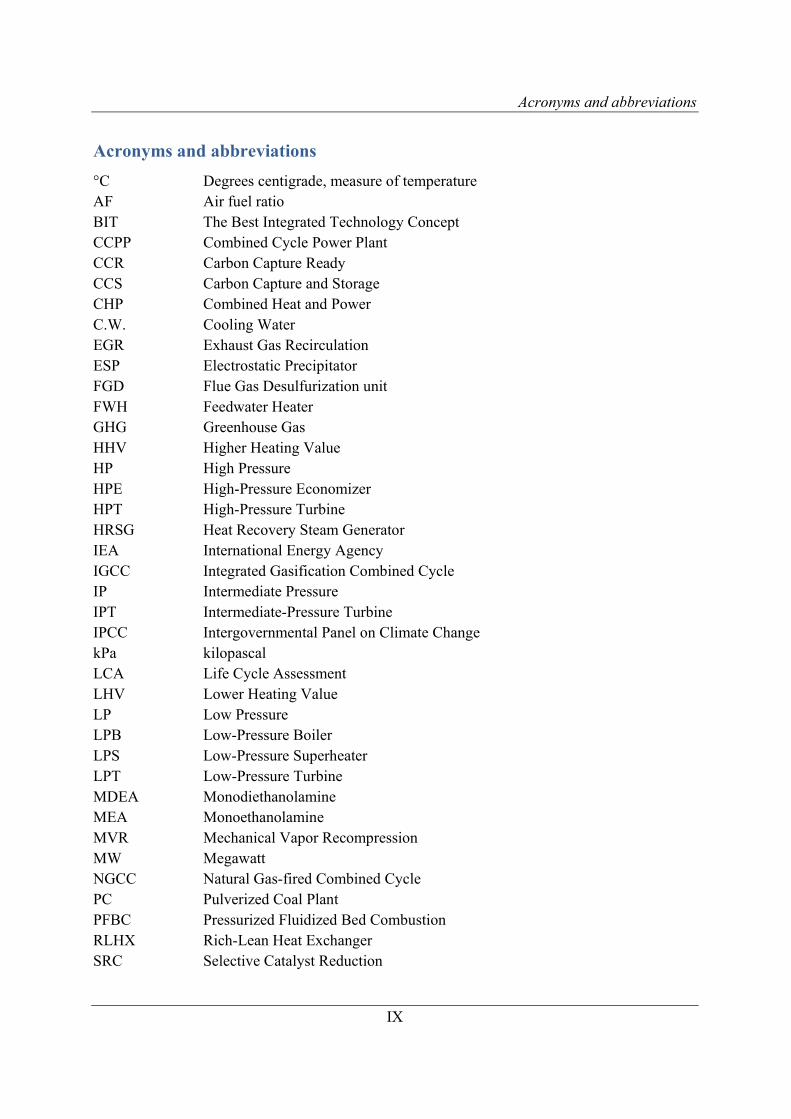
Acronyms and abbreviations
°C Degrees centigrade, measure of temperature AF Air fuel ratio BIT The Best Integrated Technology Concept CCPP Combined Cycle Power Plant CCR Carbon Capture Ready CCS Carbon Capture and Storage CHP Combined Heat and Power C.W. Cooling Water EGR Exhaust Gas Recirculation ESP Electrostatic Precipitator FGD Flue Gas Desulfurization unit FWH Feedwater Heater GHG Greenhouse Gas HHV Higher Heating Value HP High Pressure HPE High-Pressure Economizer HPT High-Pressure Turbine HRSG Heat Recovery Steam Generator IEA International Energy Agency IGCC Integrated Gasification Combined Cycle IP Intermediate Pressure IPT Intermediate-Pressure Turbine IPCC Intergovernmental Panel on Climate Change kPa kilopascal LCA Life Cycle Assessment LHV Lower Heating Value LP Low Pressure LPB Low-Pressure Boiler LPS Low-Pressure Superheater LPT Low-Pressure Turbine MDEA Monodiethanolamine MEA Monoethanolamine MVR Mechanical Vapor Recompression MW Megawatt NGCC Natural Gas-fired Combined Cycle PC Pulverized Coal Plant PFBC Pressurized Fluidized Bed Combustion RLHX Rich-Lean Heat Exchanger SRC Selective Catalyst Reduction

Acronyms and abbreviations
X
TIT Turbine Inlet Temperature WFGD Wet scrubber Flue Gas Desulphurization WGS Water-Gas Shift reactor
Chemical symbols
XI
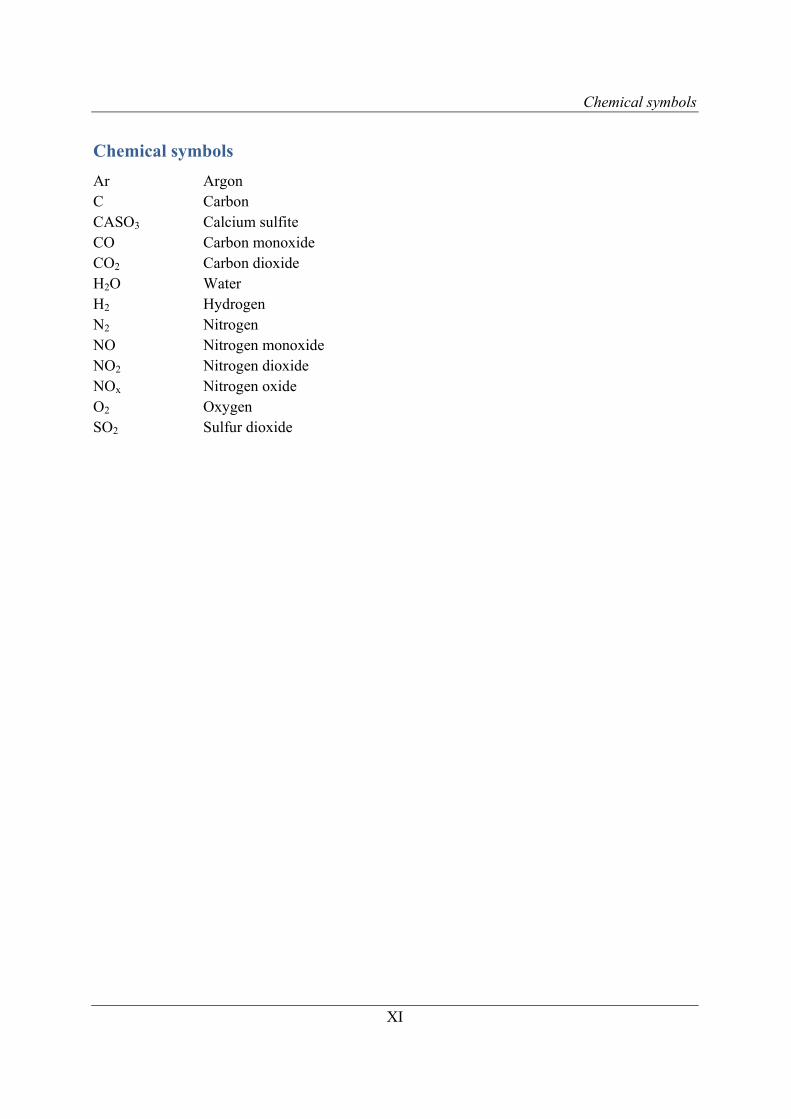
Chemical symbols
Ar Argon C Carbon CASO3 Calcium sulfite CO Carbon monoxide CO2 Carbon dioxide H2O Water H2 Hydrogen N2 Nitrogen NO Nitrogen monoxide NO2 Nitrogen dioxide NOx Nitrogen oxide O2 Oxygen SO2 Sulfur dioxide

Nomenclature
XIII
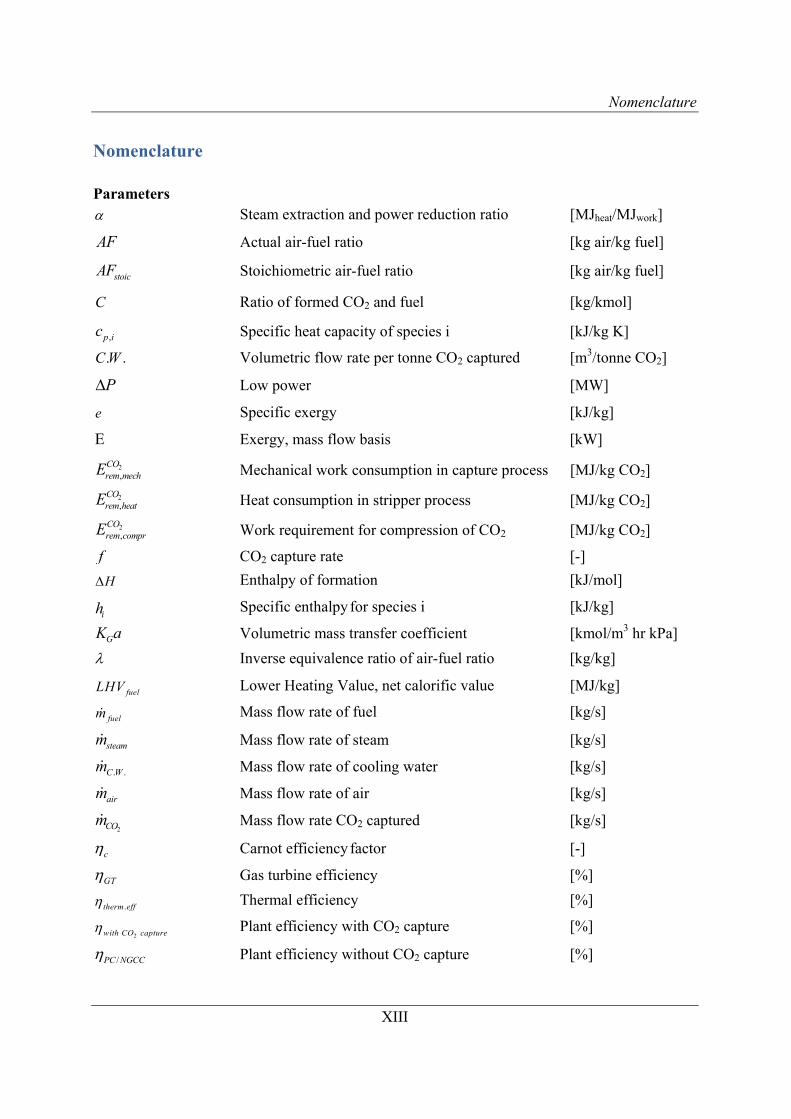
Nomenclature Parameters Steam extraction and power reduction ratio [MJheat/MJwork]
AF Actual air-fuel ratio [kg air/kg fuel]
stoicAF Stoichiometric air-fuel ratio [kg air/kg fuel]
C Ratio of formed CO2 and fuel [kg/kmol]
,p ic Specific heat capacity of species i [kJ/kg K]
. .C W Volumetric flow rate per tonne CO2 captured [m3/tonne CO2]
P Low power [MW]
e Specific exergy [kJ/kg]
Exergy, mass flow basis [kW]
2,
COrem mechE Mechanical work consumption in capture process [MJ/kg CO2]
2,
COrem heatE Heat consumption in stripper process [MJ/kg CO2]
2,
COrem comprE Work requirement for compression of CO2 [MJ/kg CO2]
f CO2 capture rate [-]
H Enthalpy of formation [kJ/mol]
ih Specific enthalpy for species i [kJ/kg]
GK a Volumetric mass transfer coefficient [kmol/m3 hr kPa]
Inverse equivalence ratio of air-fuel ratio [kg/kg]
fuelLHV Lower Heating Value, net calorific value [MJ/kg]
fuelm Mass flow rate of fuel [kg/s]
steamm Mass flow rate of steam [kg/s]
. .C Wm Mass flow rate of cooling water [kg/s]
airm Mass flow rate of air [kg/s]
2COm Mass flow rate CO2 captured [kg/s]
c Carnot efficiency factor [-]
GT Gas turbine efficiency [%]
.therm eff Thermal efficiency [%]
2with CO capture Plant efficiency with CO2 capture [%]
/PC NGCC Plant efficiency without CO2 capture [%]
Nomenclature
XIV
LPT Low-Pressure turbine efficiency [%]
IPT Intermediate-Pressure turbine efficiency [%]
HPT High-Pressure turbine efficiency [%]
water Density of water [kg/m3]
extrQ Heat extracted from power plant process [MW]
rebQ Heat requirement in reboiler [MJ]
sensQ Sensible heat [MJ]
2,vap H OQ Heat of evaporation [MJ]
2,abs COQ Heat of absorption [MJ]
GTW Gas turbine work output [MWe]
STW Steam turbine work output [MWe]
PW Work input pump [MWe]
cW Work input compressor [MWe]
NGCCW Net plant power output [MWe]


Table of Contents
Preface ............................................................................................................................................... I
Acknowledgements ........................................................................................................................ III
Abstract ........................................................................................................................................... V
Sammendrag ................................................................................................................................ VII
Acronyms and abbreviations ........................................................................................................ IX
Chemical symbols .......................................................................................................................... XI
Nomenclature .............................................................................................................................. XIII
1 Introduction ................................................................................................................................ 1
1.1 CO2 mitigation by CCS ......................................................................................................... 2
1.2 Post-combustion .................................................................................................................... 2
1.3 Economics ............................................................................................................................. 3
1.4 Life cycle assessment ............................................................................................................ 3
1.5 Thesis scope and outline ........................................................................................................ 3
2 CO2 capture by absorption ........................................................................................................ 5
2.1 Definition: State-of-the-art CO2 capture ............................................................................... 6
2.2 Absorption process ................................................................................................................ 6
2.3 Desorption process ................................................................................................................ 7
2.4 Aqueous monoethanolamine solvent ..................................................................................... 8
2.5 Energy consumption .............................................................................................................. 9
2.6 Fundamentals of absorption and modeling theory .............................................................. 10
2.6.1 General design approach ......................................................................................... 10
2.6.2 Gas-liquid equilibrium ............................................................................................ 10
2.6.3 Material and heat balances ...................................................................................... 11
2.6.4 Absorption and mass transfer coefficients .............................................................. 13
2.6.5 Volumetric mass transfer coefficient ...................................................................... 14
2.6.6 Absorber height ....................................................................................................... 15
2.6.7 Cooling water requirements .................................................................................... 16
2.6.8 Reaction kinetics and heat of reaction .................................................................... 17
3 Power generation ...................................................................................................................... 19
3.1 Natural gas combined cycle power plant ............................................................................. 19
3.1.1 Heat recovery steam generator ................................................................................ 21
3.1.2 Combined cycle efficiency – Carnot-factor ............................................................ 23
3.2 Pulverized coal power plant ................................................................................................ 24
3.2.1 Flue gas cleaning ..................................................................................................... 25
3.2.2 Feedwater heater system ......................................................................................... 26
3.3 Steam turbine cycle ............................................................................................................. 27
4 CO2 compression ...................................................................................................................... 31
5 Integration of capture process and power plant .................................................................... 33
5.1 Steam extraction .................................................................................................................. 33
5.2 Efficiency penalty ................................................................................................................ 36
5.3 Steam extraction points ....................................................................................................... 37
5.3.1 Steam turbine casing ............................................................................................... 37
5.3.2 IP/LP crossover ....................................................................................................... 38
5.3.3 LP boiler.................................................................................................................. 39
5.4 Internal integration in capture process ................................................................................ 39
5.4.1 Absorber intercooling ............................................................................................. 40
5.4.2 Vapor compression ................................................................................................. 41
5.4.3 Combined intercooling and vapor compression ..................................................... 43
5.5 Part load operation ............................................................................................................... 43
5.6 Conclusions ......................................................................................................................... 45
6 Literature study ........................................................................................................................ 47
6.1 Retrofit options for natural gas- and coal-fired power plants .............................................. 47
6.1.1 Natural gas combined cycle plant ........................................................................... 47
6.1.2 Supercritical pulverized coal-fired power plants .................................................... 49
6.1.3 Integration and optimization of a capture process model and power plant model . 51
6.2 Conceptual integration studies ............................................................................................ 53
6.2.1 The Best Integrated Technology (BIT) concept ..................................................... 53
6.2.1.1 Exhaust gas recycle ............................................................................................. 53
6.2.1.2 HRSG integrated amine reboiler ......................................................................... 54
6.2.1.3 Low-Cost-Amine-Plant Design ........................................................................... 54
6.2.1.4 Efficiency penalty ............................................................................................... 54
6.2.2 SARGAS concept ................................................................................................... 55
7 Simulation models and methodology ...................................................................................... 57
7.1 CO2 capture simulation model............................................................................................. 57
7.1.1 Simulation software ................................................................................................ 57
7.1.2 Process design and specifications, base case .......................................................... 57
7.1.3 Definition of capture process case studies .............................................................. 58
7.2 NGCC simulation model ..................................................................................................... 58
7.2.1 Simulation software ................................................................................................ 58
7.2.2 Process design and specifications ........................................................................... 59
7.2.3 Definition of NGCC case studies ............................................................................ 59
7.3 Pulverized coal plant ........................................................................................................... 60
7.3.1 Simulation software ................................................................................................ 60
7.3.2 Process design and specifications ........................................................................... 60
7.3.3 Definition of case studies ........................................................................................ 60
7.4 Methodology ....................................................................................................................... 61
8 Results and discussion .............................................................................................................. 63
8.1 NGCC without CO2 capture ................................................................................................ 63
8.2 Pulverized coal plant without CO2 capture ......................................................................... 65
8.3 Operational performance of CO2 capture process ............................................................... 67
8.3.1 Base case ................................................................................................................. 67
8.3.2 Internal integration .................................................................................................. 70
8.3.3 Conclusions ............................................................................................................. 73
8.4 Integration and operational performance of NGCC plant with CO2 capture ...................... 74
8.5 Integration and operational performance of PC plant with CO2 capture ............................. 78
8.6 Part load operation ............................................................................................................... 83
8.6.1 NGCC and PC plant analysis .................................................................................. 83
8.6.2 CO2 capture process ................................................................................................ 86
8.6.3 Conclusions ............................................................................................................. 86
8.7 Power plant comparison ...................................................................................................... 87
8.8 General recommendations based on results ........................................................................ 88
8.8.1 CO2 capture process ................................................................................................ 88
8.8.2 NGCC plant ............................................................................................................ 88
8.8.3 PC plant ................................................................................................................... 89
9 Conclusion ................................................................................................................................. 91
10 Further work ............................................................................................................................. 93
11 References ................................................................................................................................. 95
12 Appendices ................................................................................................................................ 99
A Derivations and expressions .............................................................................................. 101
B Data sheets and figures ...................................................................................................... 102
B.1 Power plants without capture ................................................................................ 102
B.2 CO2 capture process .............................................................................................. 105
B.3 Power plants with CO2 capture ............................................................................. 108
C Unisim simulation model flow sheets ............................................................................... 111
D GT PRO simulation model flow sheets ............................................................................. 114
E STEAM PRO simulation model flow sheets ..................................................................... 117
F Part load results ................................................................................................................. 123


Introduction
1
1 Introduction
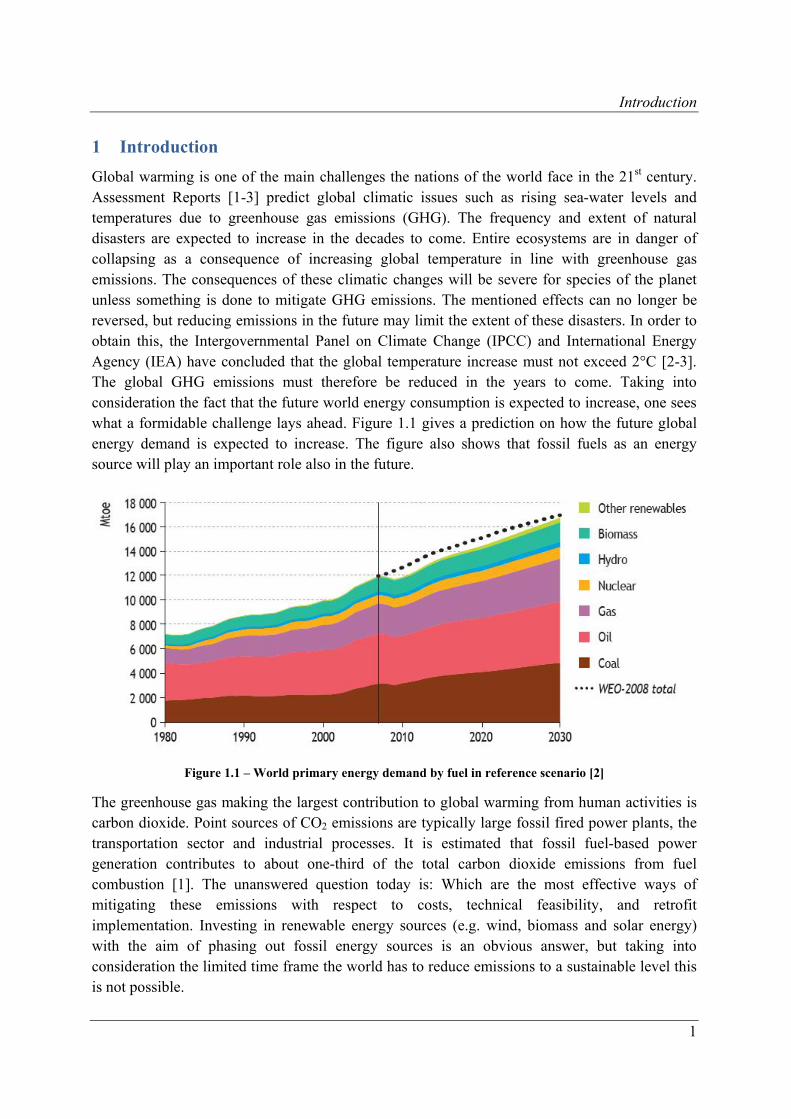
Global warming is one of the main challenges the nations of the world face in the 21st century. Assessment Reports [1-3] predict global climatic issues such as rising sea-water levels and temperatures due to greenhouse gas emissions (GHG). The frequency and extent of natural disasters are expected to increase in the decades to come. Entire ecosystems are in danger of collapsing as a consequence of increasing global temperature in line with greenhouse gas emissions. The consequences of these climatic changes will be severe for species of the planet unless something is done to mitigate GHG emissions. The mentioned effects can no longer be reversed, but reducing emissions in the future may limit the extent of these disasters. In order to obtain this, the Intergovernmental Panel on Climate Change (IPCC) and International Energy Agency (IEA) have concluded that the global temperature increase must not exceed 2°C [2-3]. The global GHG emissions must therefore be reduced in the years to come. Taking into consideration the fact that the future world energy consumption is expected to increase, one sees what a formidable challenge lays ahead. Figure 1.1 gives a prediction on how the future global energy demand is expected to increase. The figure also shows that fossil fuels as an energy source will play an important role also in the future.
Figure 1.1 – World primary energy demand by fuel in reference scenario [2]
The greenhouse gas making the largest contribution to global warming from human activities is carbon dioxide. Point sources of CO2 emissions are typically large fossil fired power plants, the transportation sector and industrial processes. It is estimated that fossil fuel-based power generation contributes to about one-third of the total carbon dioxide emissions from fuel combustion [1]. The unanswered question today is: Which are the most effective ways of mitigating these emissions with respect to costs, technical feasibility, and retrofit implementation. Investing in renewable energy sources (e.g. wind, biomass and solar energy) with the aim of phasing out fossil energy sources is an obvious answer, but taking into consideration the limited time frame the world has to reduce emissions to a sustainable level this is not possible.
Introduction
2
1.1 CO2 mitigation by CCS
One possible way of reducing CO2 emissions is by developing large scale capture plants for fossil-fired power generation, and storing the CO2 in storage sites (e.g. geological formations). Carbon capture and storage (CCS) is primarily intended to be implemented at large point sources of emission such as coal and natural gas-fired power plants. CCS is only thought to be a temporary solution for CO2 mitigation, pending renewable technologies to mature and further replace fossil energy.
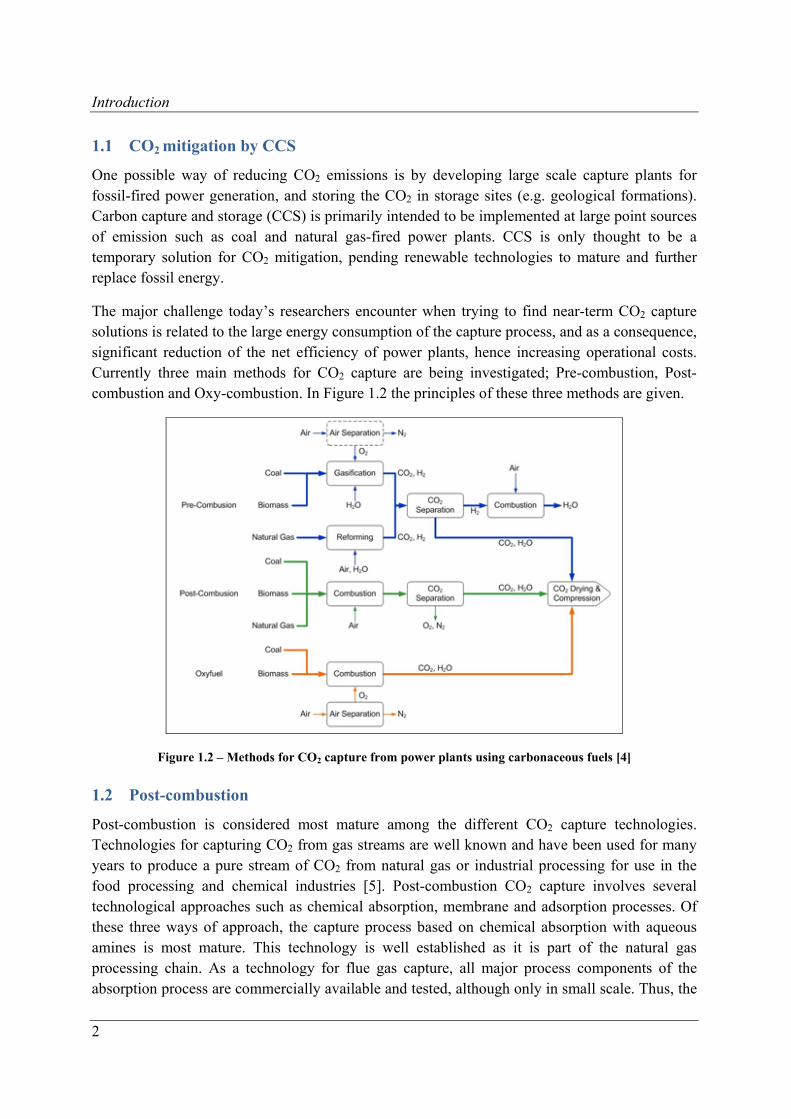
The major challenge today’s researchers encounter when trying to find near-term CO2 capture solutions is related to the large energy consumption of the capture process, and as a consequence, significant reduction of the net efficiency of power plants, hence increasing operational costs. Currently three main methods for CO2 capture are being investigated; Pre-combustion, Post-combustion and Oxy-combustion. In Figure 1.2 the principles of these three methods are given.
Figure 1.2 – Methods for CO2 capture from power plants using carbonaceous fuels [4]
1.2 Post-combustion
Post-combustion is considered most mature among the different CO2 capture technologies. Technologies for capturing CO2 from gas streams are well known and have been used for many years to produce a pure stream of CO2 from natural gas or industrial processing for use in the food processing and chemical industries [5]. Post-combustion CO2 capture involves several technological approaches such as chemical absorption, membrane and adsorption processes. Of these three ways of approach, the capture process based on chemical absorption with aqueous amines is most mature. This technology is well established as it is part of the natural gas processing chain. As a technology for flue gas capture, all major process components of the absorption process are commercially available and tested, although only in small scale. Thus, the
Introduction
3
capture process has not been integrated and optimized for CO2 capture from power plants in large scale.
1.3 Economics
An economic assessment by McKensey, 2008 [6] indicates that CCS costs (capture, transport and storage costs) could come down to 30-45 Euro per tonne CO2 in 2030 which is in line with the expected carbon prices in the same period. The capture costs amounts to 14-19 Euro per tonne CO2 of the total CCS costs. The economical challenges that lay ahead, which mainly are related to energy consumption in the CO2 capturing process, become evident when today’s capturing technology has an estimated cost of 50-60 Euro per tonne CO2. Nevertheless it should be noted that a conceptual study performed by Sargas indicates a considerable reduction of the capture costs in the order of 20-30 Euro per tonne CO2 [7]. Improvements related to plant modification and integration methods aiming at reducing efficiency penalties, as well as less energy intensive solvents are expected to reduce costs significantly in the future.
1.4 Life cycle assessment
As mentioned CCS is an energy intensive process. In addition to this, new infrastructure and use of chemicals in order to capture CO2 are required. These factors lead to further environmental impacts in the form of increased emissions of both CO2 and other components originating from the capture process. Life-cycle assessment (LCA) is a well-established method accounting for all direct and indirect emissions from a system. When examining emissions related to CCS, LCA provides a systematic process evaluation of all stages in the CCS chain [8].
In research work on different capture technologies an important parameter is the capture effectiveness of a capture plant, indicating how many percent CO2 is captured. A value commonly used is 90% capture efficiency, meaning 90% of the CO2 content in the flue gas is captured by the solvent, and 10% emitted. However, this interpretation of capture efficiency has limitations. It only considers the capture process isolated, excluding indirect emissions from other parts of the power plant value chain. In order to get a realistic picture of the actual CO2 captured, LCA studies are required. Related to CO2 emissions from power plants, factors such as production and transportation of fuels and building of infrastructure, and additional fuel requirements are accounted for. Singh, 2010 [8] has performed a LCA study on an natural gas-fired power plant. The results from the study show that the actual CO2 avoidance is not 90%, but 74% from an LCA perspective. Also emissions of other polluting components are included. The value of LCA is vital in relation to CCS research.
1.5 Thesis scope and outline
This thesis presents a detailed evaluation of coal- and natural gas-fired power plants with CO2 capture based on MEA-absorption, focusing on reducing the efficiency penalty of power plants. Steam demand in the capture process accounts for the majority of this efficiency penalty. Therefore, a subtask in the evaluation is assessing different process modifications internally in the capture process aiming at reducing energy demands of this process.
Introduction
4
The focus of this thesis is twofold: In the first part a detailed theoretical introduction is given of the fundamentals of CO2 capture and power generation, respectively. This is done as the thesis combines two disciplines. Also theory on process integration will be presented, looking both at steam extraction and internal integration within the capture process. This theory will form the basis for the definition of simulation case studies. Finally a literature study has been carried out, providing results from similar research studies on the topic of integration of power plants with CO2 capture. The focus will be on retrofit solutions as well as new power plant integration concepts.
The second part of the thesis presents the simulation models, case study definitions, methodology, and simulation results for both power plants and the capture process. The simulation software being used is GT PRO for the natural gas power plant, STEAM PRO for the coal power plant, and UniSim for the capture process. Each process will first be evaluated separately before integration is performed by linking results in Microsoft Excel. Since the thesis contains a large amount of relevant results, a systematic approach is required in the presentation. The results will be presented in the following order: First, both power plants without CO2 capture will be presented in order to get base case operation characteristics and flue gas properties for the capture process inlet stream. Secondly, the results from the capture process will be presented. Thirdly, the influence of steam extraction on power plant operations for different plant configurations will be investigated, and finally the capture cases will be integrated with the power plant process. In the last part of the thesis focus will be addressed to part load operation with respect to effects on the power plant processes, capture process, and plant processes integrated with CO2 capture.
CO2 capture by absorption
5
2 CO2 capture by absorption
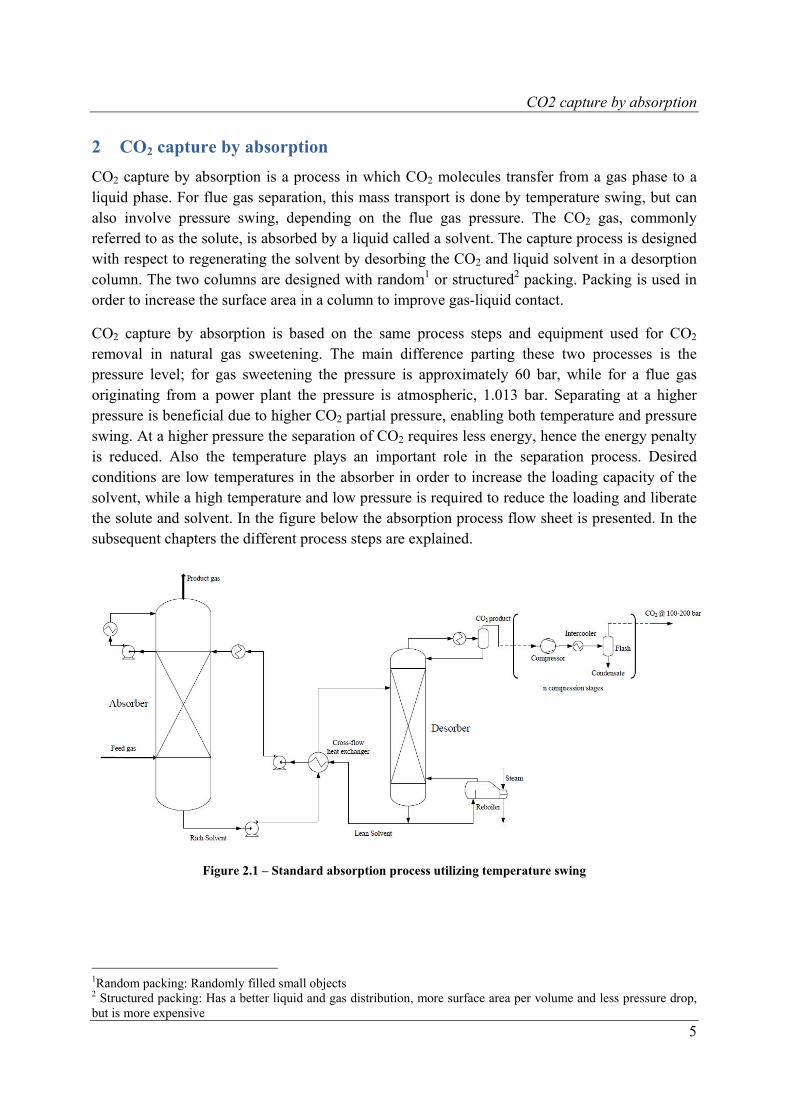
CO2 capture by absorption is a process in which CO2 molecules transfer from a gas phase to a liquid phase. For flue gas separation, this mass transport is done by temperature swing, but can also involve pressure swing, depending on the flue gas pressure. The CO2 gas, commonly referred to as the solute, is absorbed by a liquid called a solvent. The capture process is designed with respect to regenerating the solvent by desorbing the CO2 and liquid solvent in a desorption column. The two columns are designed with random1 or structured2 packing. Packing is used in order to increase the surface area in a column to improve gas-liquid contact.
CO2 capture by absorption is based on the same process steps and equipment used for CO2 removal in natural gas sweetening. The main difference parting these two processes is the pressure level; for gas sweetening the pressure is approximately 60 bar, while for a flue gas originating from a power plant the pressure is atmospheric, 1.013 bar. Separating at a higher pressure is beneficial due to higher CO2 partial pressure, enabling both temperature and pressure swing. At a higher pressure the separation of CO2 requires less energy, hence the energy penalty is reduced. Also the temperature plays an important role in the separation process. Desired conditions are low temperatures in the absorber in order to increase the loading capacity of the solvent, while a high temperature and low pressure is required to reduce the loading and liberate the solute and solvent. In the figure below the absorption process flow sheet is presented. In the subsequent chapters the different process steps are explained.
Figure 2.1 – Standard absorption process utilizing temperature swing
1Random packing: Randomly filled small objects 2 Structured packing: Has a better liquid and gas distribution, more surface area per volume and less pressure drop, but is more expensive
CO2 capture by absorption
6
2.1 Definition: State-of-the-art CO2 capture
A lot of research is being done on CO2 capture based on absorption. Numerous technological approaches and concepts are under research, and it is for this reason necessary to define a state-of-the-art absorption-based capture technology. The author of this report has chosen to define state-of-the-art CO2 capture as a technical feasible, commercially available, and a long-term reliable process. At the same time the process should be designed in a way that allows the process to be retrofitted in the future. This might be related to internal integration in the process as well as replacement of solvent with new and more efficient solvents. Based on this the standard absorption process based on temperature swing and cross-flow heat exchange depicted in Figure 2.1 with 90% capture efficiency is referred to as a state-of-the-art capture solution. This process has been verified commercially by CO2 capture technology vendors Aker Clean Carbon and Fluor [9-10].
2.2 Absorption process
In the absorption process the CO2 is captured from the flue gas. Due to large amounts of other by-products in the flue gas (e.g. H2O, O2, N2) the CO2 amount to only a few percent of the total flue gas composition. CO2 concentrations of flue gases originating from combustion of natural gas typically range from 3-4 mol.%, while flue gases from coal-combustion are slightly higher, typically 15 mol.%. At atmospheric conditions this results in a low CO2 partial pressure in the order of 3-15kPa.
Before entering the absorption column, the flue gas requires some pretreatment. Removal of substances such as NOx and SO2 is crucial in order to prevent solvent degradation. The flue gas from a power plant holds a temperature in the range of 60-100°C, while the optimal temperature in the absorber is 40-60°C. Cooling of the flue gas is therefore required before entering the absorption column. This cooling is performed in a flue gas cooler. Condensed liquid, mainly water, is removed from the cooled flue gas. A fan is placed between the flue gas cooler and inlet section of the absorption column. The fan is used to overcome the pressure drop in the column. It should be noted that the main parameter affecting this pressure drop, and consequently the required work input for the fan, is the height of the absorption column.
CO2 capture by absorption
7
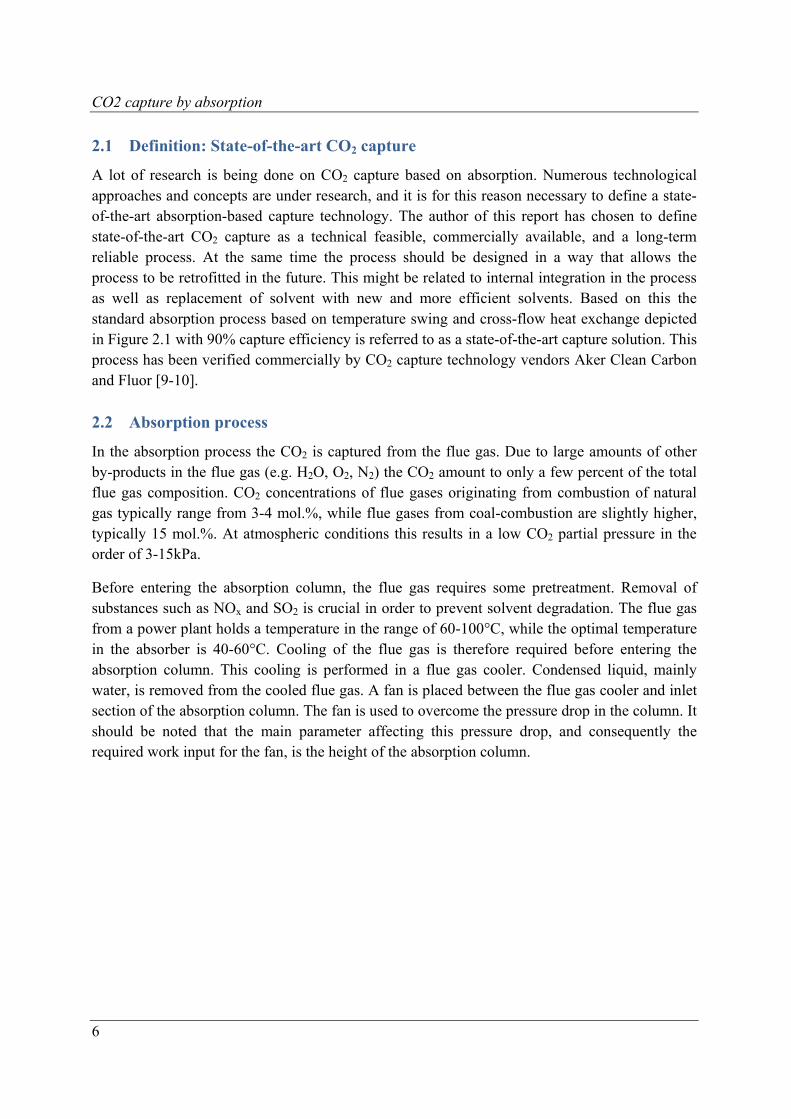
Figure 2.2 – Absorption column schematic [11]
Figure 2.2 shows a typical absorber layout and the main component found inside the column. The flue gas enters the absorption columns lower part flowing upwards, while the lean solvent enters at the upper part flowing counter-current to the flue gas stream. A mass transfer between the CO2 and the solvent occurs through the column. The CO2-rich solution leaves the bottom of the absorber, while the treated flue gas is vented out at the top. Depending on design and operating conditions it is possible to obtain a capture rate higher than 90% CO2 capture [12].
The rich CO2 leaving the absorber at approximately 1 bar and 40-50°C, is pumped through a heat exchanger before entering the stripper column. The main point of this heat exchange is to utilize heat contained in the lean solvent being transported at 120°C back to the absorption column. By preheating the rich solvent, one saves energy in for the desorption process, and at the same time cooling duty for the solvent entering the absorption column.
2.3 Desorption process
In the stripping process the captured CO2 is separated from the solvent by adding heat. The desorption process is the reverse process of absorption. The stripper column is operated as a distillation column, although chemical reactions also take place. The preheated solvent enters the middle part of the stripper column and is further heated in a reboiler. The reboiler is a critical part of the capturing process, as it consumes a lot of energy. The steam in the reboiler holds a temperature of about 122°C at 2 bar.
The target of the stripper column is to secure high gas-liquid contact, resulting in high mass transfer. As was the case for the absorption column, the stripper column is designed with packing to increase the surface area.
CO2 capture by absorption
8
At the bottom of the column the lean solvent is transported back through the cross-flow heat exchanger and further cooled by a cooling water heat exchanger before re-entering the absorber at a temperature of 40°C. The CO2 gas is vented out at the top of the column, cooled in an overhead heat exchanger in order to condense steam, and finally sent for compression and conditioning to transport and storage specifications.
2.4 Aqueous monoethanolamine solvent
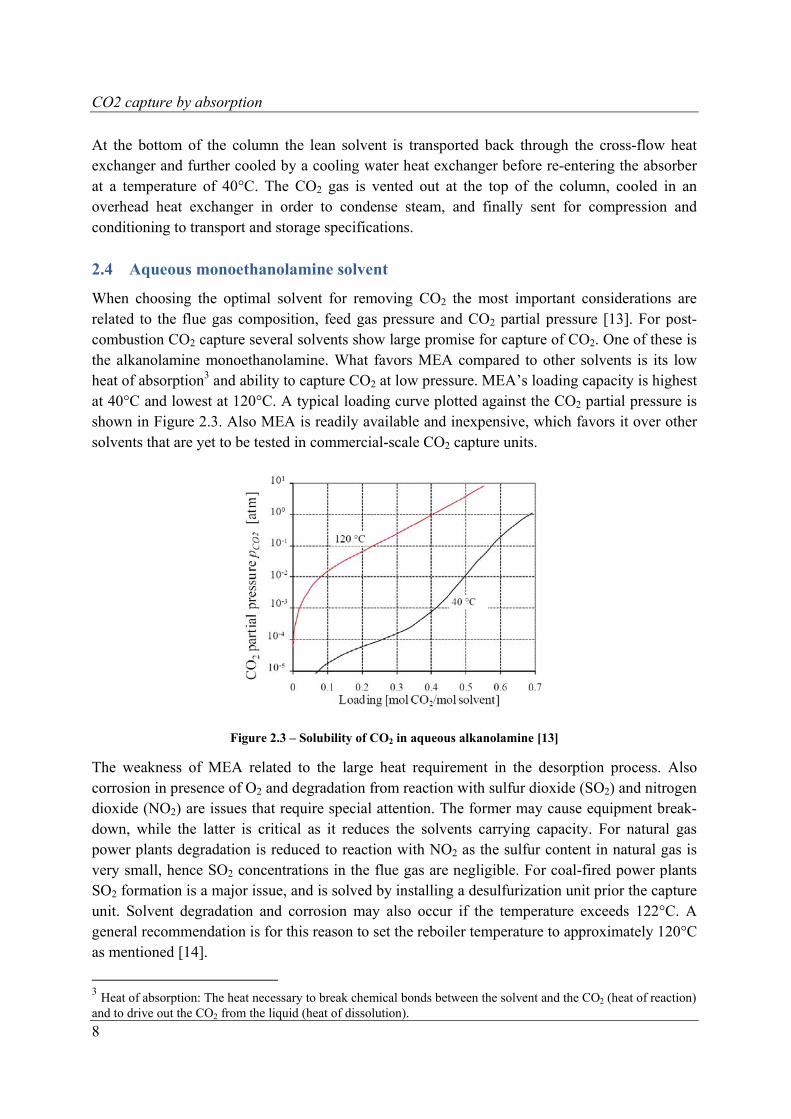
When choosing the optimal solvent for removing CO2 the most important considerations are related to the flue gas composition, feed gas pressure and CO2 partial pressure [13]. For post-combustion CO2 capture several solvents show large promise for capture of CO2. One of these is the alkanolamine monoethanolamine. What favors MEA compared to other solvents is its low heat of absorption3 and ability to capture CO2 at low pressure. MEA’s loading capacity is highest at 40°C and lowest at 120°C. A typical loading curve plotted against the CO2 partial pressure is shown in Figure 2.3. Also MEA is readily available and inexpensive, which favors it over other solvents that are yet to be tested in commercial-scale CO2 capture units.
Figure 2.3 – Solubility of CO2 in aqueous alkanolamine [13]
The weakness of MEA related to the large heat requirement in the desorption process. Also corrosion in presence of O2 and degradation from reaction with sulfur dioxide (SO2) and nitrogen dioxide (NO2) are issues that require special attention. The former may cause equipment break-down, while the latter is critical as it reduces the solvents carrying capacity. For natural gas power plants degradation is reduced to reaction with NO2 as the sulfur content in natural gas is very small, hence SO2 concentrations in the flue gas are negligible. For coal-fired power plants SO2 formation is a major issue, and is solved by installing a desulfurization unit prior the capture unit. Solvent degradation and corrosion may also occur if the temperature exceeds 122°C. A general recommendation is for this reason to set the reboiler temperature to approximately 120°C as mentioned [14].
3 Heat of absorption: The heat necessary to break chemical bonds between the solvent and the CO2 (heat of reaction) and to drive out the CO2 from the liquid (heat of dissolution).
CO2 capture by absorption
9
In recent years focus on environmental issues related to emissions of MEA to the atmosphere has been addressed. In the absorption process some of the amine solution is vented out together with the treated flue gas. The problem this MEA emission poses is photo-oxidation between the amine and components in the atmosphere forming photo-oxidation products. One of these products, nitrosamine, can be toxic and carcinogen. Research is being done in order to map the possible effects on human health and the environment [15].
2.5 Energy consumption
As mentioned, the main disadvantage of the amine absorption process is the significant heat required in the desorber in order to regenerate the amine solution. According to Botero, 2009 [16] 30% of the steam flow in the power plant steam cycle is needed to cover the reboiler energy requirement. This energy penalty lay in three endothermic processes taking place in the regeneration process; heat of desorption, heating requirements to bring the amine to its boiling point, and evaporation of water as stripper steam. Also, mechanical work is required to drive fans and pumps in the process, and compress the captured CO2 in order to meet transport and storage specifications. All these energy requiring components account for an energy penalty of up to 20% decrease in the power plant efficiency [17]. The equation below shows the three mechanisms that are a part of the total reboiler heat demand.
2 2, ,reb sens vap H O abs COQ Q Q Q (2.1)
rebQ = Heat required to regenerate the solution in the stripper column
sensQ = Heat to raise the solvent from inlet stripper temperature to reboiler temperature.
2,vap H OQ = Heat of evaporation required to produce that part of the stripper steam that does not
condense on its way up through the column, before being condensed in the overhead condenser.
2,abs COQ = The heat of absorption of the solvent with CO2. In the stripper heat equal to the
heat released in the absorber needs to be supplied back to the solvent in the reverse process.
As explained, the stripping process requires a substantial amount of energy. This energy requirement is related to exergy loss in the separation process. Exergy loss in the CO2 capture process is loss of work that must be regenerated by use of external energy (e.g. steam extraction from steam turbine). In order to identify where in the process these losses take place, an exergy analysis of the system can be performed. This analysis is useful as it gives valuable information of which parts of the process need improvements in the case of process optimization. A study performed by Geuzebroek, 2004 [18] gives an indication of which process components are sources of exergy losses. The study indicates that the components giving the largest losses are the flue gas cooler and fan, the absorption column, and the overhead condenser of the desorption column, accounting for a percentual exergy loss of 18, 16, 32 and 24%, respectively.
CO2 capture by absorption
10
2.6 Fundamentals of absorption and modeling theory
In Kohl, 1997 [19] and Rousseau, 1987 [20] the principals of absorption and gas purification are presented. The theoretical design principles for acid gas removal applied in CO2 capture by absorption are described. The design of an absorber is most commonly performed by a computer-assisted, tray-by-tray, heat- and material-balance calculation. From these calculations the necessary number of equilibrium stages can be decided, and further used to determine the actual number of trays dependent on the tray efficiency.
In this chapter the most important design principles and correlations applied for computer modeling of an absorption-based process will be presented. Since the stripping process is exactly the reverse process, only the absorption case will be explained in detail.
2.6.1 General design approach
According to Kohl, 1997 [19] the most important function of an absorber is to provide sufficient liquid surface area between the gas phase, hence fulfilling mass transfer requirements. A state-of-the-art CO2 capture unit has a capture rate of 90%, indicating the mass transfer requirements in the absorption column as well as solvent selection.
According to literature on the absorption process, vertical packed columns are most commonly used when applied for CO2 capture [13, 21]. The benefits of packed columns are very high liquid-gas ratios, corrosion resistant, non-foaming, and low pressure drop through the vessel.
Kohl, 1997 and Rousseau, 1987 [19-20] have given the most important design aspects of countercurrent absorbers.
I. Solvent selection. II. Selection of absorber/stripper, including type of trays or packing, based on process
requirements and expected service conditions. III. Calculation of heat and material balances. IV. Estimation of required column height (number of trays or height of packing) based on
mass transfer analysis. V. Calculation of required column diameter and tray or packing parameters based on gas and
liquid flow rates and hydraulic considerations. VI. Mechanical design of the hardware.
2.6.2 Gas-liquid equilibrium
When designing an absorber the most important physical property is the gas-liquid equilibrium. The equilibrium data represents the limiting conditions of the gas-liquid contact. Therefore this data is required to determine maximum purity, rich solution concentration attained in the absorber, and lean solution purity attained in the stripper. Also the mass transfer driving force at any stage of the absorber is based on the equilibrium conditions.
CO2 capture by absorption
11
2.6.3 Material and heat balances
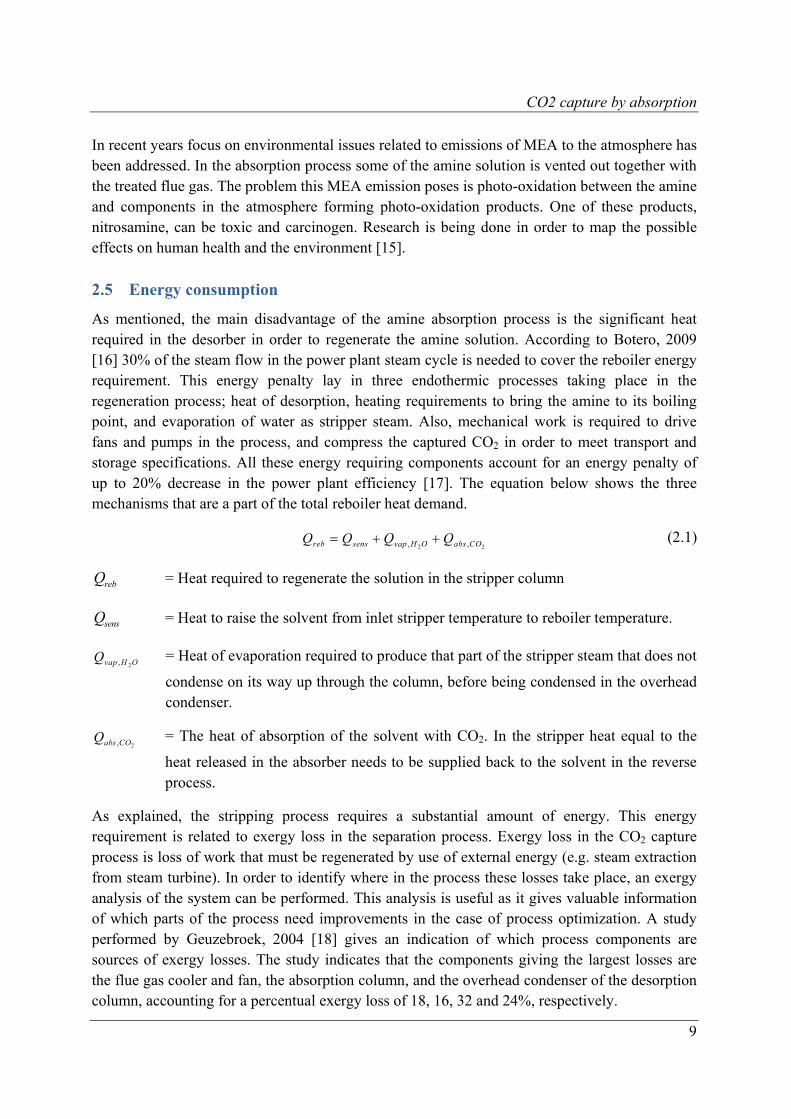
When working with a gas and liquid flowing at a constant flow rate through the absorber, solute-free flow rates and mole ratios are applied. The material balance applied at the top portion of an absorber is given in equation (2.2). Figure 2.4 indicated the various flows and flow directions as well as the corresponding mole ratios.
Figure 2.4 – Material balance for an absorber/stripper [22]
' '2 2M MG Y Y L X X (2.2)
'MG G = solute-free gas flow rate [kmol/(sm)]
'ML L = solute-free liquid flow rate [kmol/(sm)]
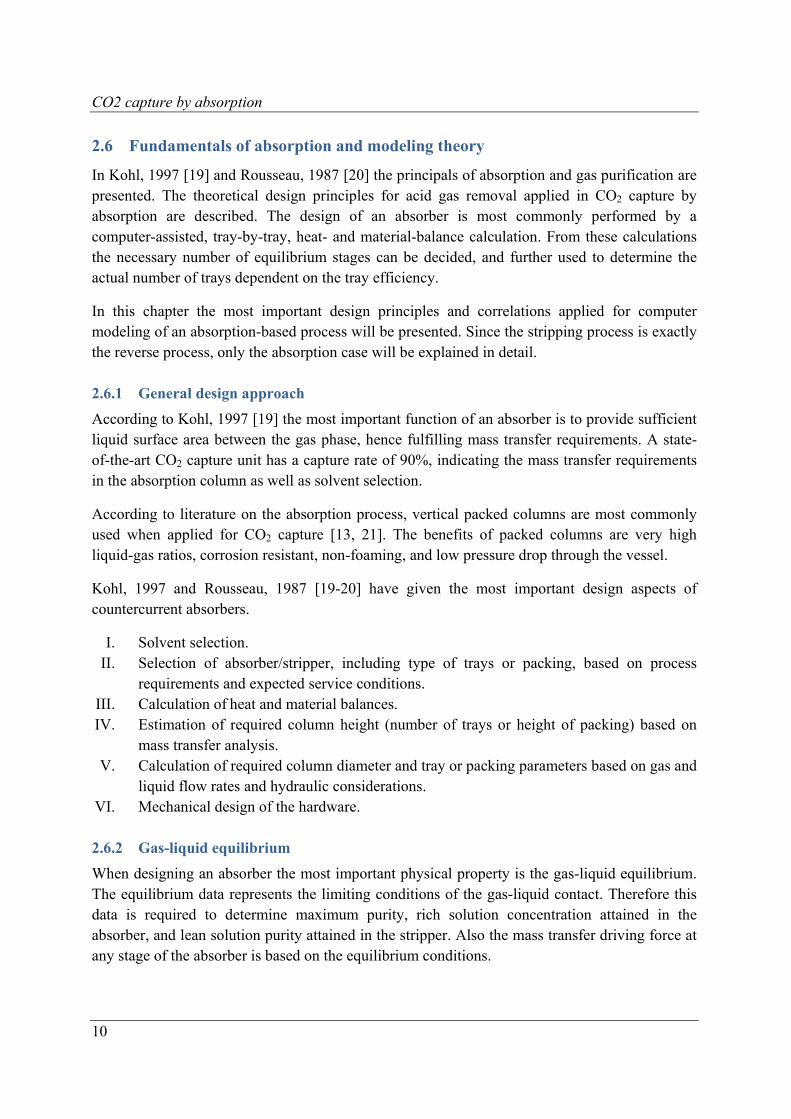
X = mole ratio CO2 in the liquid phase: x / (1 - x), x = mole fraction Y = mole ratio CO2 in the gas phase: y / (1 – y), y = mole fraction In order to get an idea of the absorber performance, a diagram giving operating lines and equilibrium curve can be designed. In Figure 2.5 three operating lines in addition to the equilibrium curve have been plotted. Line A represents the design conditions, while line B indicates the minimum liquid flow rate and meets the equilibrium line at the lowest part of the absorber.
Figure 2.5 – Operating line-equilibrium curve diagram [22]
Xeq
A B
Equilibrium curve
CO2 capture by absorption
12
The operating lines can be found by rearranging equation (2.2).
'
22'
( )M
M
L X XY Y
G
(2.3)
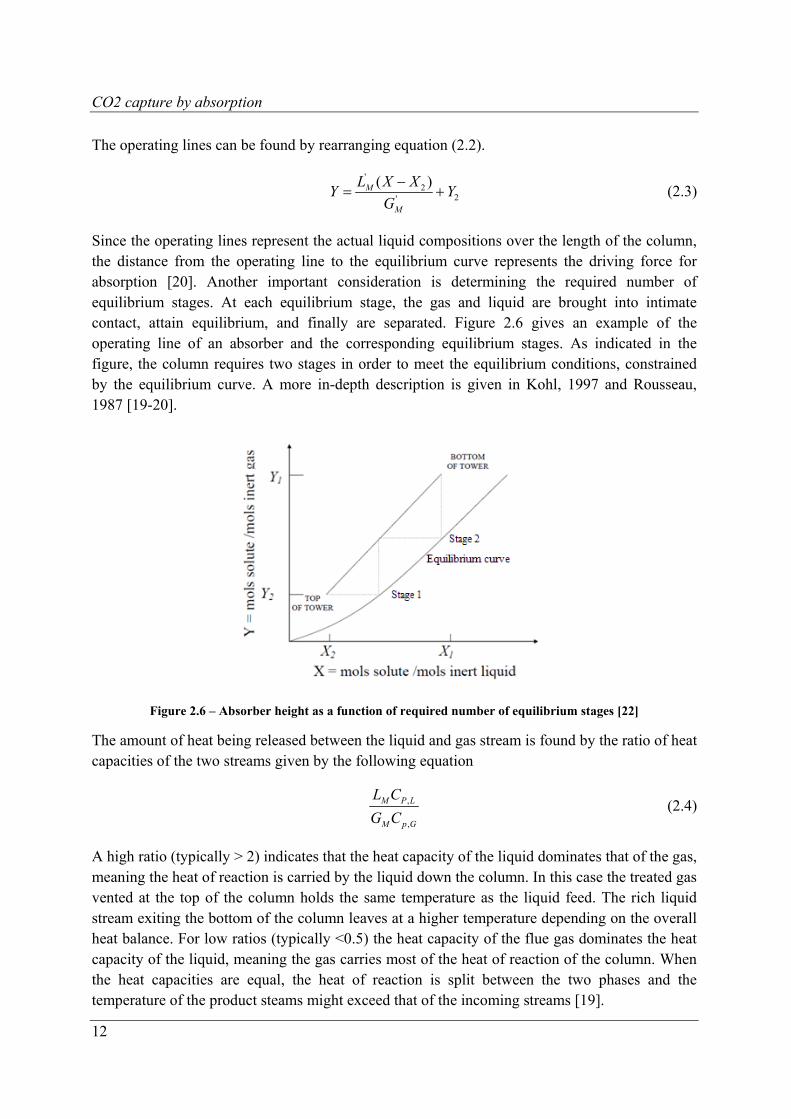
Since the operating lines represent the actual liquid compositions over the length of the column, the distance from the operating line to the equilibrium curve represents the driving force for absorption [20]. Another important consideration is determining the required number of equilibrium stages. At each equilibrium stage, the gas and liquid are brought into intimate contact, attain equilibrium, and finally are separated. Figure 2.6 gives an example of the operating line of an absorber and the corresponding equilibrium stages. As indicated in the figure, the column requires two stages in order to meet the equilibrium conditions, constrained by the equilibrium curve. A more in-depth description is given in Kohl, 1997 and Rousseau, 1987 [19-20].
Figure 2.6 – Absorber height as a function of required number of equilibrium stages [22]
The amount of heat being released between the liquid and gas stream is found by the ratio of heat capacities of the two streams given by the following equation
,
,
M P L
M p G
L C
G C (2.4)
A high ratio (typically > 2) indicates that the heat capacity of the liquid dominates that of the gas, meaning the heat of reaction is carried by the liquid down the column. In this case the treated gas vented at the top of the column holds the same temperature as the liquid feed. The rich liquid stream exiting the bottom of the column leaves at a higher temperature depending on the overall heat balance. For low ratios (typically <0.5) the heat capacity of the flue gas dominates the heat capacity of the liquid, meaning the gas carries most of the heat of reaction of the column. When the heat capacities are equal, the heat of reaction is split between the two phases and the temperature of the product steams might exceed that of the incoming streams [19].
CO2 capture by absorption
13
2.6.4 Absorption and mass transfer coefficients
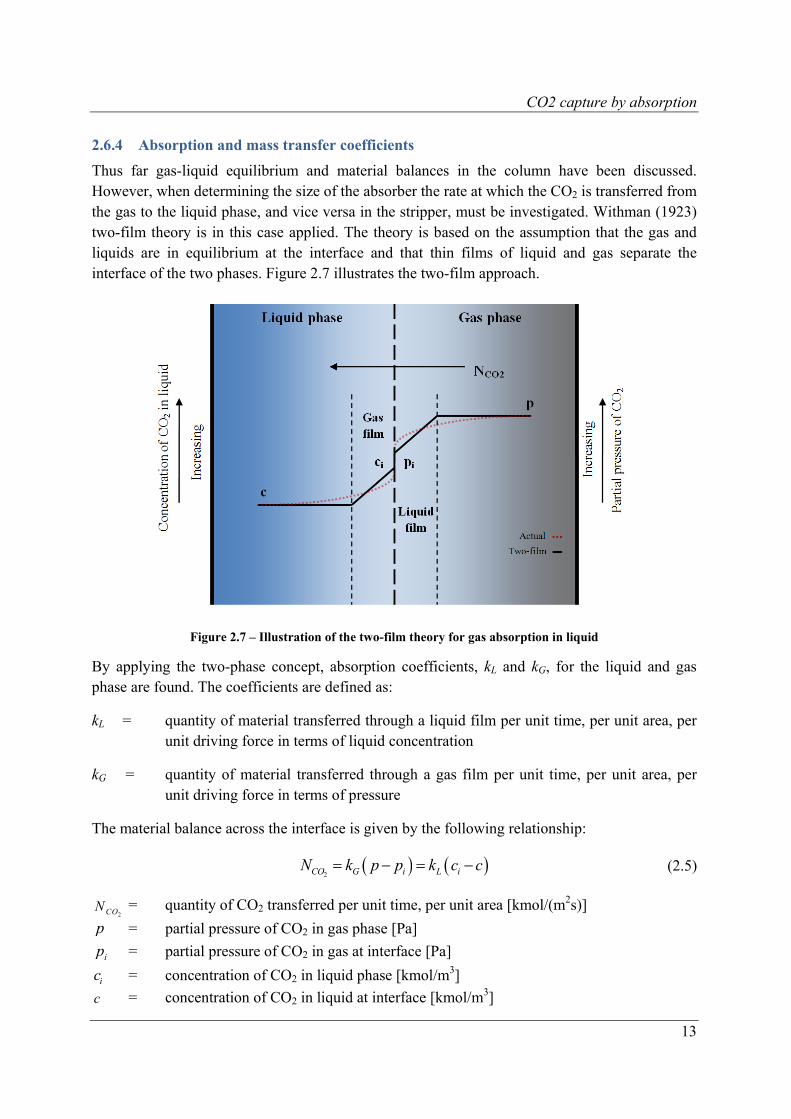
Thus far gas-liquid equilibrium and material balances in the column have been discussed. However, when determining the size of the absorber the rate at which the CO2 is transferred from the gas to the liquid phase, and vice versa in the stripper, must be investigated. Withman (1923) two-film theory is in this case applied. The theory is based on the assumption that the gas and liquids are in equilibrium at the interface and that thin films of liquid and gas separate the interface of the two phases. Figure 2.7 illustrates the two-film approach.
Figure 2.7 – Illustration of the two-film theory for gas absorption in liquid
By applying the two-phase concept, absorption coefficients, kL and kG, for the liquid and gas phase are found. The coefficients are defined as:
kL = quantity of material transferred through a liquid film per unit time, per unit area, per unit driving force in terms of liquid concentration
kG = quantity of material transferred through a gas film per unit time, per unit area, per unit driving force in terms of pressure
The material balance across the interface is given by the following relationship:
2CO G i L iN k p p k c c (2.5)
2CON = quantity of CO2 transferred per unit time, per unit area [kmol/(m2s)]
p = partial pressure of CO2 in gas phase [Pa]
ip = partial pressure of CO2 in gas at interface [Pa]
ic = concentration of CO2 in liquid phase [kmol/m3]
c = concentration of CO2 in liquid at interface [kmol/m3]
CO2 capture by absorption
14
A more applicable way of representing equation (2.5) is by replacing the absorption coefficients with the overall coefficients, which are based on the total driving force from the gas phase to the liquid phase. The overall coefficients, KGa and KLa, relate directly to the absorber volume rather than the interfacial area which is the case for the gas and liquid absorption coefficients. The modified equation is given by
2CO G e L eN adV K a p p dV K a c c dV (2.6)
a = interfacial area per volume of the absorber
ep = partial pressure of CO2 in equilibrium with a solution having the composition of the
liquid phase
ec = concentration of CO2 in a solution in equilibrium with the gas phase
V = Total volume of packing The interfacial area per volume of the absorber is given by
c
dAa
A dz (2.7)
where dA is the transfer area, Ac the absorber cross section area, and dz height of the column.
Finally, the overall gas and liquid coefficients for chemical absorption are given by
,
1 1
G G e L ref
He
K a k a I k a (2.8)
,
1 1 1
L e L ref GK a I k a Hek a (2.9)
He = Henry constant
eI = enhancement factor
,L refk = liquid side mass transfer coef. without chemical absorption [kmol/(m2s kmol/m3)]
2.6.5 Volumetric mass transfer coefficient
Several operating parameters will affect the mass transfer coefficient. Among these are the liquid flow rate, liquid-phase CO2 loading, and the absorber liquid feed temperature. For simplification, only the effect of the liquid flow rate will be given attention in this report. The liquid flow rate has a great impact on the absorption efficiency. For high solvent flow rates the CO2 concentration in the treated flue gas will decrease, indicating higher absorption efficiency. This effect occurs for two reasons. Firstly, higher flow rates lead to larger wetted packing surface areas increasing the rate of mass transfer. Secondly, high flow rates provide a lower overall loading of the solvent through the absorption column. This can be observed as the net cyclic
CO2 capture by absorption
15
loading is lower for high flow rates. The following benefit is that the solvent retains its absorption capacity throughout the entire height column.
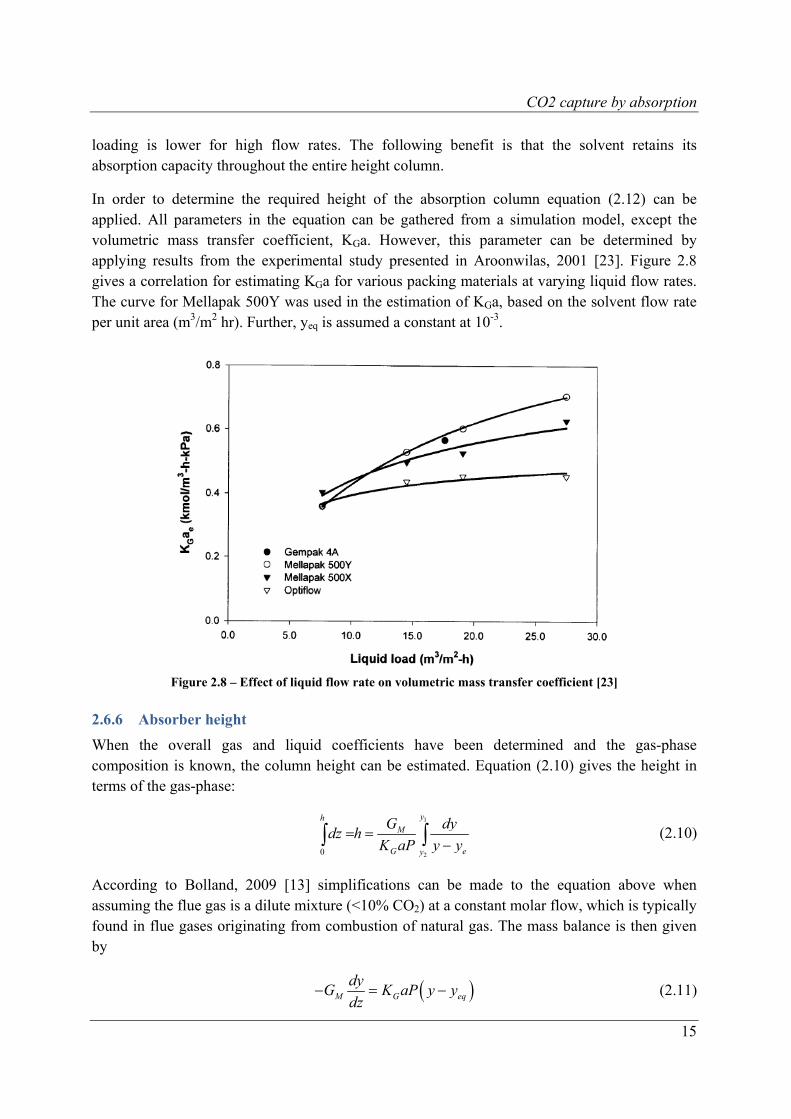
In order to determine the required height of the absorption column equation (2.12) can be applied. All parameters in the equation can be gathered from a simulation model, except the volumetric mass transfer coefficient, KGa. However, this parameter can be determined by applying results from the experimental study presented in Aroonwilas, 2001 [23]. Figure 2.8 gives a correlation for estimating KGa for various packing materials at varying liquid flow rates. The curve for Mellapak 500Y was used in the estimation of KGa, based on the solvent flow rate per unit area (m3/m2 hr). Further, yeq is assumed a constant at 10-3.
Figure 2.8 – Effect of liquid flow rate on volumetric mass transfer coefficient [23]
2.6.6 Absorber height
When the overall gas and liquid coefficients have been determined and the gas-phase composition is known, the column height can be estimated. Equation (2.10) gives the height in terms of the gas-phase:
1
20
yhM
G ey
G dydz h
K aP y y
(2.10)
According to Bolland, 2009 [13] simplifications can be made to the equation above when assuming the flue gas is a dilute mixture (<10% CO2) at a constant molar flow, which is typically found in flue gases originating from combustion of natural gas. The mass balance is then given by
M G eq
dyG K aP y y
dz (2.11)
CO2 capture by absorption
16
2
2
eq COCO
Hey x
p = equilibrium mole fraction of CO2
By manipulation of equation (2.11), the column height can be found for the given assumptions:
2
1
1
20
lnyh
eqM M
G eqy G eq
y yG Gdz h dy
K aP y yK aP y y
(2.12)
As can be seen from the equation, the overall mass transfer coefficient, KGa, needs to be determined. The mass transfer coefficient is independent of the gas flow rate, decreases at increasing CO2 partial pressure, and increases as the liquid flow rate in the absorber increases. Also the solvent temperature influences the coefficient, as high temperatures give higher reaction rates and low temperatures increase the solvents loading capacity. Finally, the type of solvent gives different mass transfer coefficients [23].
2.6.7 Cooling water requirements
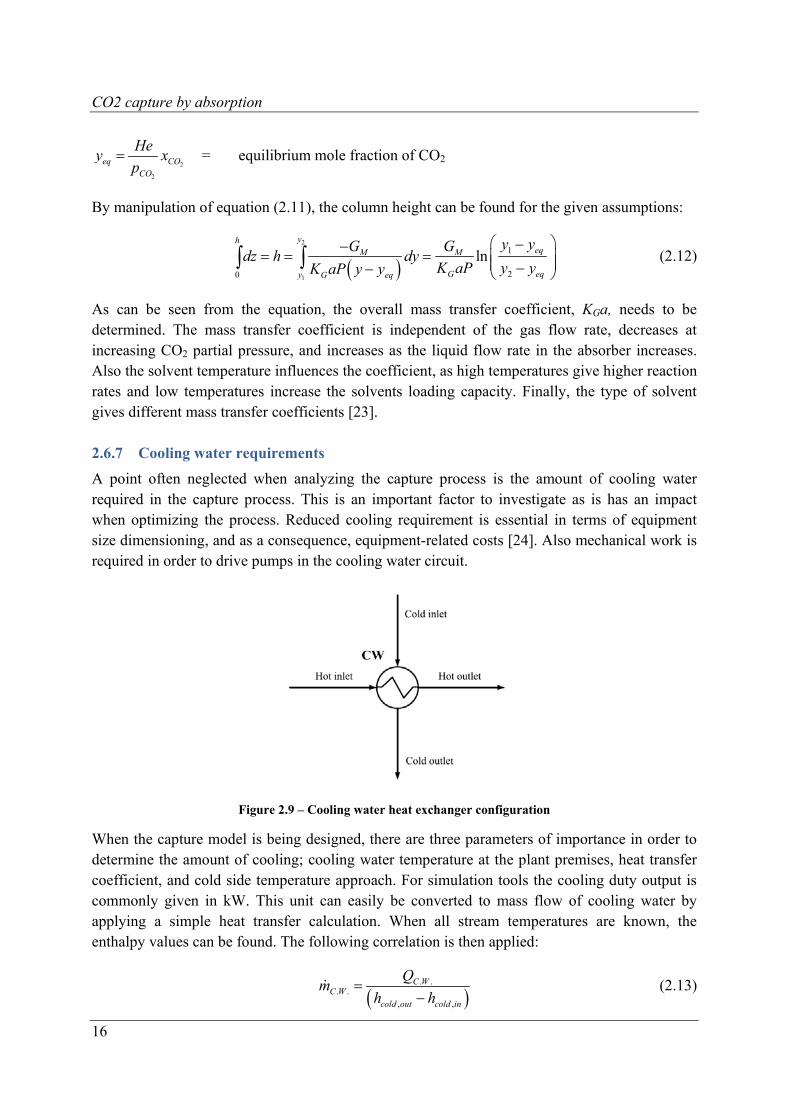
A point often neglected when analyzing the capture process is the amount of cooling water required in the capture process. This is an important factor to investigate as is has an impact when optimizing the process. Reduced cooling requirement is essential in terms of equipment size dimensioning, and as a consequence, equipment-related costs [24]. Also mechanical work is required in order to drive pumps in the cooling water circuit.
Figure 2.9 – Cooling water heat exchanger configuration
When the capture model is being designed, there are three parameters of importance in order to determine the amount of cooling; cooling water temperature at the plant premises, heat transfer coefficient, and cold side temperature approach. For simulation tools the cooling duty output is commonly given in kW. This unit can easily be converted to mass flow of cooling water by applying a simple heat transfer calculation. When all stream temperatures are known, the enthalpy values can be found. The following correlation is then applied:
. .. .
, ,
C WC W
cold out cold in
Qm
h h
(2.13)
CO2 capture by absorption
17
Further, it is practical to represent the cooling requirement as the volumetric flow of water per ton CO2 captured (m3/tonne CO2). The conversion is given as
2
. .. .1000
C W
water CO
mC W
m
(2.14)
2.6.8 Reaction kinetics and heat of reaction
When looking at absorption of CO2 in a liquid solvent, the principals of reaction kinetics are of particular interest. The use of reaction kinetics is widely used when designing and analyzing suitable reactors. The mechanism and corresponding kinetics provide the rate at which the chemical or biochemical species in the reactor system react at the prevailing conditions of temperature, pressure, composition, mixing, flow, heat, and mass transfer [25]. This section will only touch those principles related to how operating temperature affects the reaction rates in an absorption column.
When CO2 is absorbed in the aqueous solvent, heat is released. This heat release increases the temperature in the column, and occurs due to the heat of reaction from the absorption of CO2 in
solvent, which is an exothermic reaction. The equation below gives the global reaction equation when
Higher temperature in the column leads to faster reaction kinetics, but reduces the solvents loading capacity. Therefore it is desired to operate the column at different temperature levels, in order to reduce the solvent circulation rate. Ideally, the top of the column should operate at high temperatures in order to secure fast reaction kinetics (high absorption rates) between the lean solvent and CO2. At the bottom part where the solvent is rich, low temperature are desired in order to increase the loading capacity for further absorption of CO2.
One disadvantage with a state-of-the-art CO2 capture process is that, when designed, it is not flexible in terms of varying the temperature levels. However, some internal integration can be performed, giving the temperature profile described above. This process arrangement will be described in chapter 5.4.1.

Power generation
19
3 Power generation
Most modern fossil fired power plants are design in a way that allows utilization of the energy obtained in the flue gas stream. This heat potential can either be used for heating purpose in processes known as cogeneration and combined heat and power (CHP), or it can be used to produce additional power in a steam turbine cycle. For a gas turbine cycle, this latter configuration is called a combined cycle. Combined cycle power plant (CCPP) is a collective name for a power plant combining two cycles by a heat recovery steam generator (HRSG). Most commonly hot flue gas from a power cycle is used to produce steam in the HRSG which is expanded in a steam turbine for further power generation. By operating power plants as CHP or combined cycles the thermal efficiency of the power plant is increased.
This chapter aims at giving the reader a thorough introduction to the most focal points for heat and power generation. Related to CO2 capture, steam extraction from the steam turbine cycle is of importance. This topic will also be explained in detail.
3.1 Natural gas combined cycle power plant
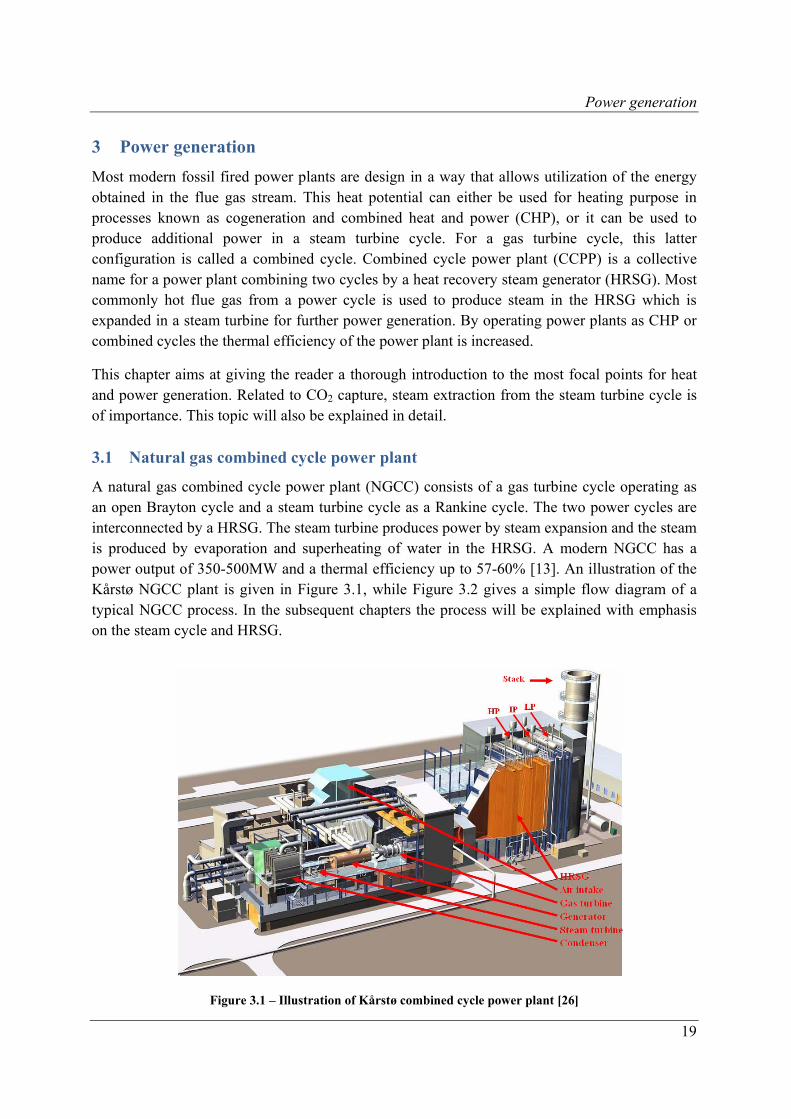
A natural gas combined cycle power plant (NGCC) consists of a gas turbine cycle operating as an open Brayton cycle and a steam turbine cycle as a Rankine cycle. The two power cycles are interconnected by a HRSG. The steam turbine produces power by steam expansion and the steam is produced by evaporation and superheating of water in the HRSG. A modern NGCC has a power output of 350-500MW and a thermal efficiency up to 57-60% [13]. An illustration of the Kårstø NGCC plant is given in Figure 3.1, while Figure 3.2 gives a simple flow diagram of a typical NGCC process. In the subsequent chapters the process will be explained with emphasis on the steam cycle and HRSG.
Figure 3.1 – Illustration of Kårstø combined cycle power plant [26]
Power generation
20
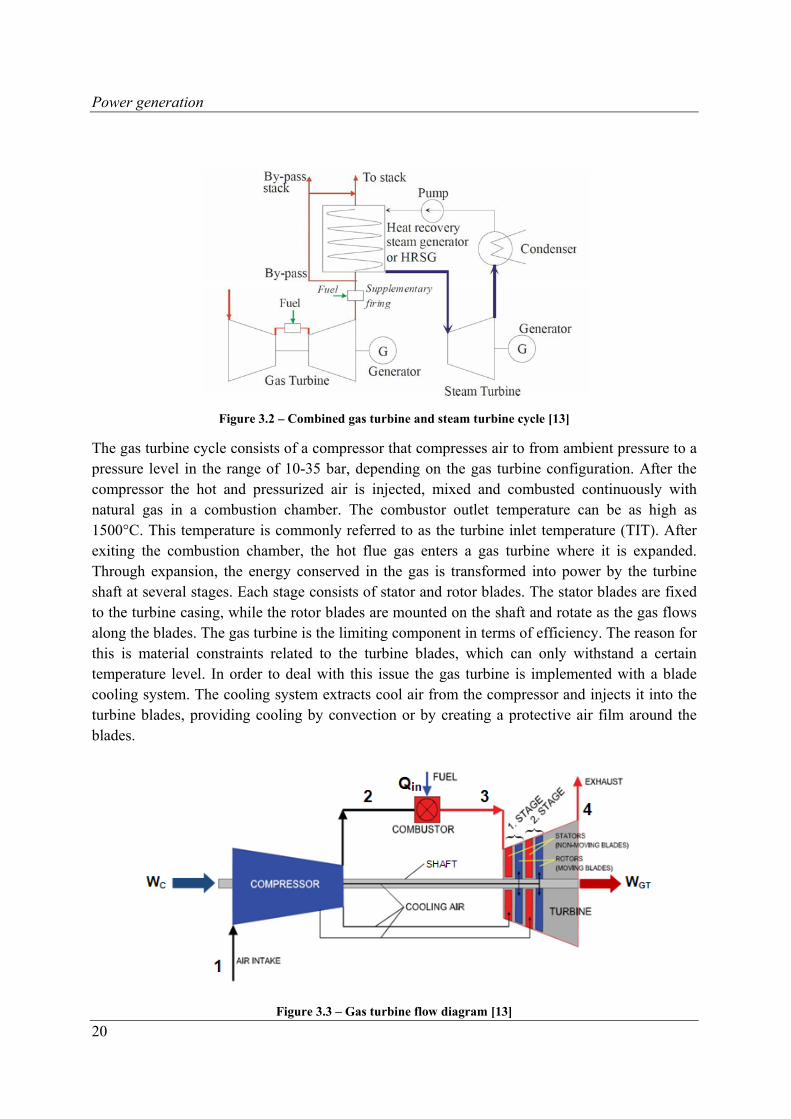
Figure 3.2 – Combined gas turbine and steam turbine cycle [13]
The gas turbine cycle consists of a compressor that compresses air to from ambient pressure to a pressure level in the range of 10-35 bar, depending on the gas turbine configuration. After the compressor the hot and pressurized air is injected, mixed and combusted continuously with natural gas in a combustion chamber. The combustor outlet temperature can be as high as 1500°C. This temperature is commonly referred to as the turbine inlet temperature (TIT). After exiting the combustion chamber, the hot flue gas enters a gas turbine where it is expanded. Through expansion, the energy conserved in the gas is transformed into power by the turbine shaft at several stages. Each stage consists of stator and rotor blades. The stator blades are fixed to the turbine casing, while the rotor blades are mounted on the shaft and rotate as the gas flows along the blades. The gas turbine is the limiting component in terms of efficiency. The reason for this is material constraints related to the turbine blades, which can only withstand a certain temperature level. In order to deal with this issue the gas turbine is implemented with a blade cooling system. The cooling system extracts cool air from the compressor and injects it into the turbine blades, providing cooling by convection or by creating a protective air film around the blades.
Figure 3.3 – Gas turbine flow diagram [13]
Power generation
21
The gas leaves the turbine at a temperature in the range of 450-650°C. The hot gas contains a significant amount of energy that can be utilized. The energy contained in the flue gas represents about all of the remaining fuel heating value that has not been converted to power in the gas turbine. In a combined cycle this energy is utilized by heat exchange with a steam cycle, producing steam that can be expanded in a steam turbine (see Figure 3.2). This is explained further in the following chapter [13].
As mentioned, the gas turbine cycle has a configuration resembling an open Brayton cycle with a recuperator (HRSG) at the outlet. The power balance equations of the cycle are given in appendix A.
The following thermal efficiency of a NGCC power plant is given by the equations below. The power balance consists of the power output of the gas and steam turbine, respectively, and work requirements for driving auxiliary equipments, such as pumps and compressors.
NGCC GT ST C PW W W W W (3.1)
, ( )NGCC
th eff NGCCfuel fuel
W
m LHV
(3.2)
3.1.1 Heat recovery steam generator
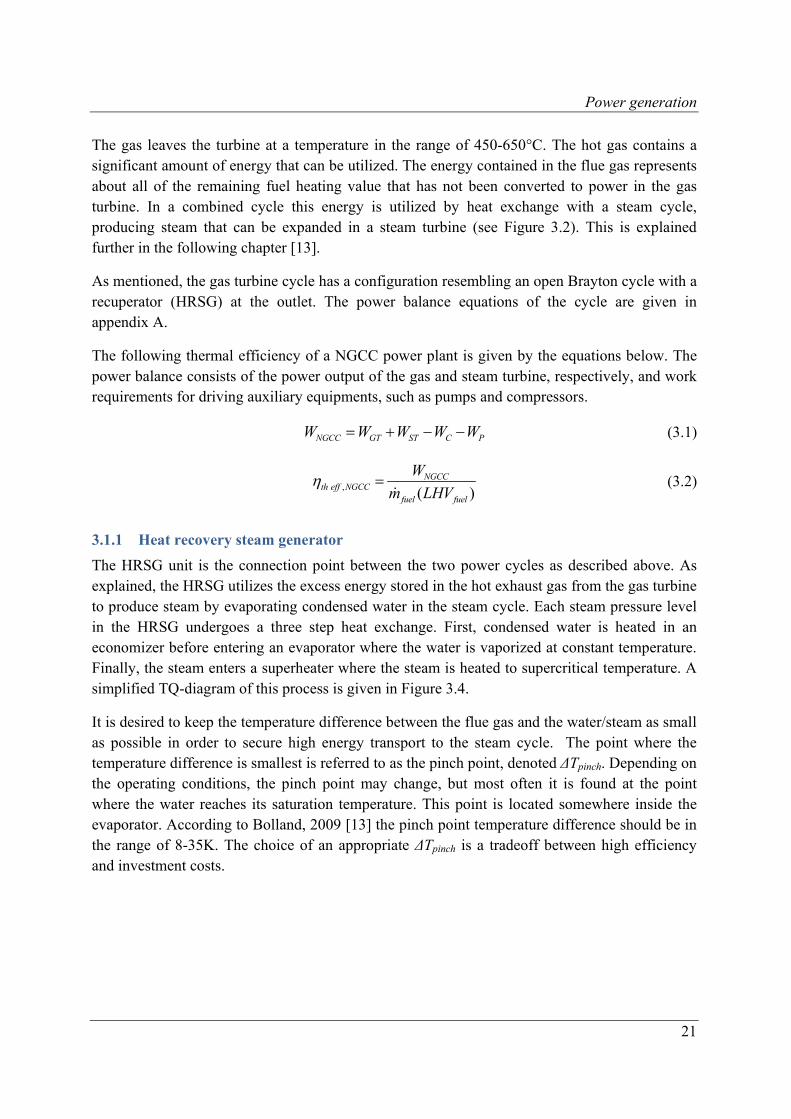
The HRSG unit is the connection point between the two power cycles as described above. As explained, the HRSG utilizes the excess energy stored in the hot exhaust gas from the gas turbine to produce steam by evaporating condensed water in the steam cycle. Each steam pressure level in the HRSG undergoes a three step heat exchange. First, condensed water is heated in an economizer before entering an evaporator where the water is vaporized at constant temperature. Finally, the steam enters a superheater where the steam is heated to supercritical temperature. A simplified TQ-diagram of this process is given in Figure 3.4.
It is desired to keep the temperature difference between the flue gas and the water/steam as small as possible in order to secure high energy transport to the steam cycle. The point where the temperature difference is smallest is referred to as the pinch point, denoted ΔTpinch. Depending on the operating conditions, the pinch point may change, but most often it is found at the point where the water reaches its saturation temperature. This point is located somewhere inside the evaporator. According to Bolland, 2009 [13] the pinch point temperature difference should be in the range of 8-35K. The choice of an appropriate ΔTpinch is a tradeoff between high efficiency and investment costs.
Power generation
22
Figure 3.4 – Simplified TQ-diagram for a 1-pressure level HRSG [27]
The saturation temperature of water at a given pressure level is the limiting factor in terms of heat recovery, as the flue gas stream cannot fall below the saturation temperature. By introducing multiple pressure levels the heat recovery process is more flexible in terms of fitting the heating curve to the flue gas temperature, hence increasing heat recovery.
The heat balance in the HRSG is essential when determining the flow rate of steam. The mass flow for a given steam cycle can be derived as
, 1 3 , 3, 4,( ) ( )steam Exh p Exh Exh steam Exh p Exh Exh ExhQ m c T m h h m c T T (3.3)
, 3, 4
1 3
fg p fg fg fg
steam
m c T Tm
h h
(3.4)
When looking at the HRSG operational characteristics in a steam cycle, the TQ-diagram gives a good representation of the heat transfer taking place between the hot flue gas and the water/steam heat exchangers. When looking at extended process integration, the TQ-diagram is a useful visualization tool of how the process is affected by different process modifications.
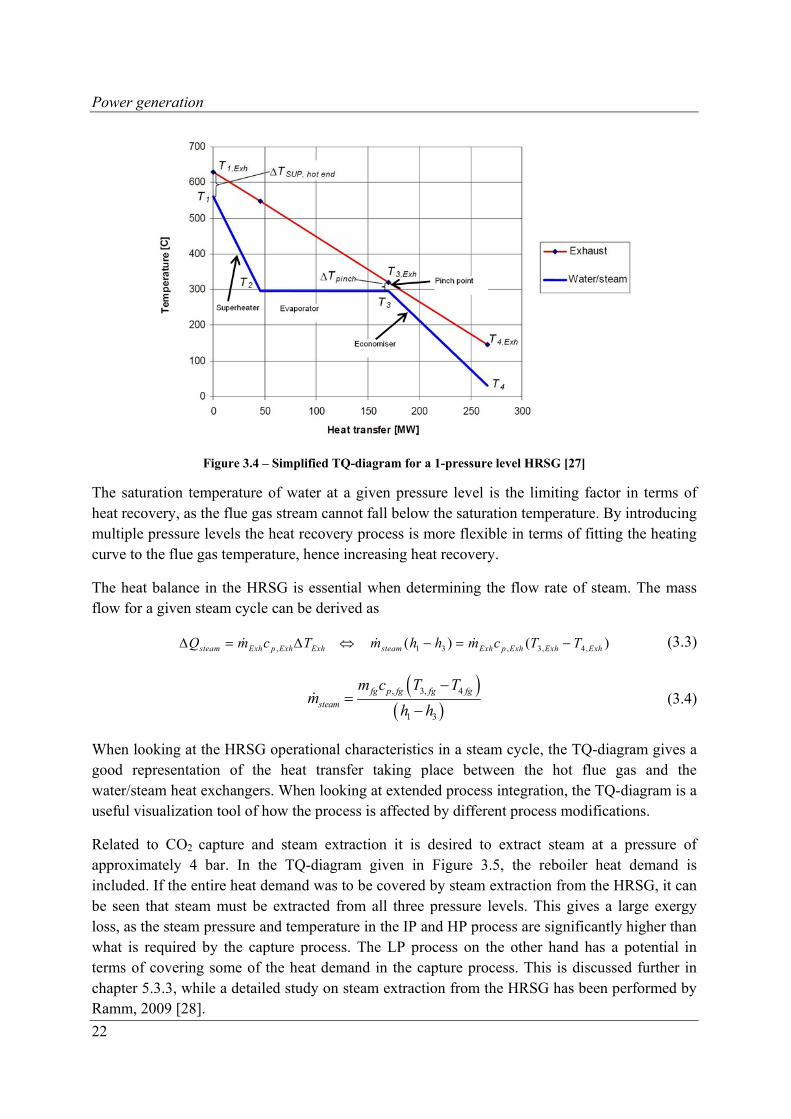
Related to CO2 capture and steam extraction it is desired to extract steam at a pressure of approximately 4 bar. In the TQ-diagram given in Figure 3.5, the reboiler heat demand is included. If the entire heat demand was to be covered by steam extraction from the HRSG, it can be seen that steam must be extracted from all three pressure levels. This gives a large exergy loss, as the steam pressure and temperature in the IP and HP process are significantly higher than what is required by the capture process. The LP process on the other hand has a potential in terms of covering some of the heat demand in the capture process. This is discussed further in chapter 5.3.3, while a detailed study on steam extraction from the HRSG has been performed by Ramm, 2009 [28].
Power generation
23
Figure 3.5 – TQ-diagram for triple pressure with reheat steam cycle [27]
3.1.2 Combined cycle efficiency – Carnot-factor
The combined cycle efficiency is based on the Carnot-factor or Carnot-efficiency. The Carnot-factor given by
1 lC
h
T
T (3.5)
A full derivation of the equation is given in appendix A.
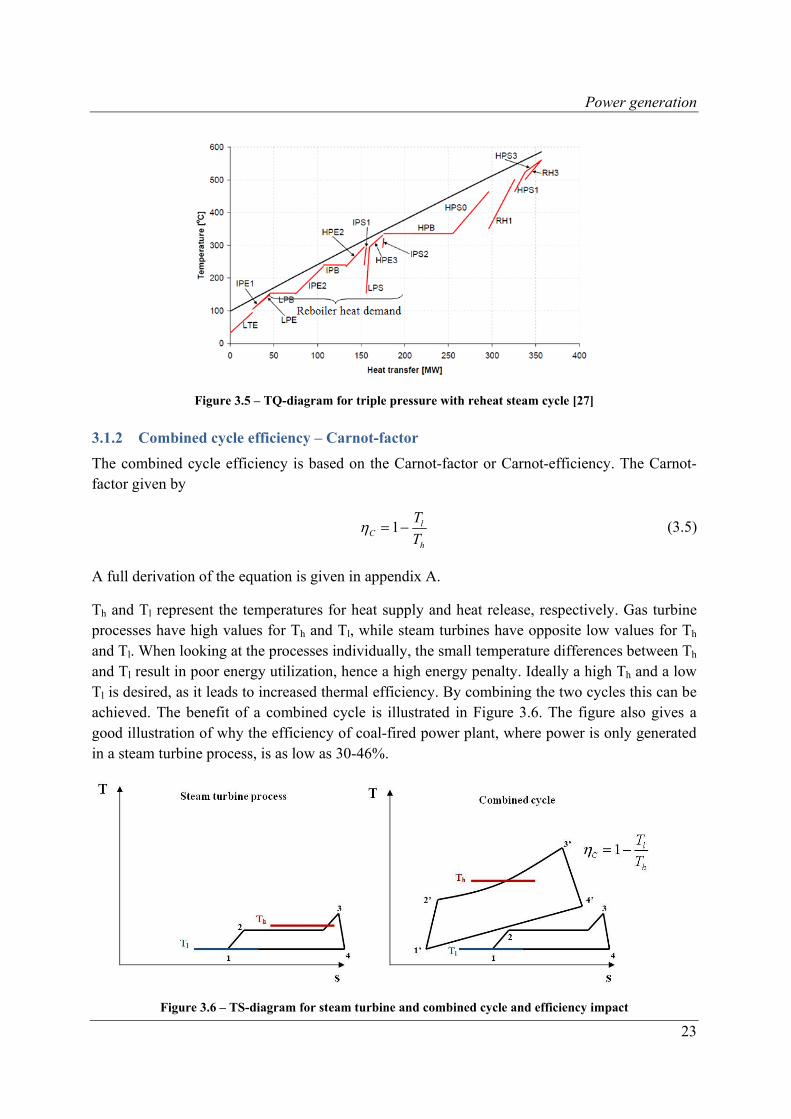
Th and Tl represent the temperatures for heat supply and heat release, respectively. Gas turbine processes have high values for Th and Tl, while steam turbines have opposite low values for Th and Tl. When looking at the processes individually, the small temperature differences between Th and Tl result in poor energy utilization, hence a high energy penalty. Ideally a high Th and a low Tl is desired, as it leads to increased thermal efficiency. By combining the two cycles this can be achieved. The benefit of a combined cycle is illustrated in Figure 3.6. The figure also gives a good illustration of why the efficiency of coal-fired power plant, where power is only generated in a steam turbine process, is as low as 30-46%.
Figure 3.6 – TS-diagram for steam turbine and combined cycle and efficiency impact
Power generation
24
3.2 Pulverized coal power plant
The pulverized coal power plant (PC) is the most commonly used plant configuration for power production utilizing coal in the world. A typical PC plant including the most important process components is depicted in Figure 3.7. Most PC plants have a power output of about 500MWe, but modern plants produce up to 1000MWe. The entire power conversion is done by steam expansion in a closed steam turbine cycle. The net plant efficiency of a coal power plant is lower than what is the case for NGCC plants. High-efficiency power plants (advanced ultra-critical/supercritical pulverized coal power plants) can attain net plant efficiencies up to 46% of the higher heating value4 (HHV).
A pulverized coal plant process starts with coal being fed into a pulverizer where the coal is ground into small powder-sized particles. After this the pulverized coal is injected into a furnace and combusted with a fraction of the combustion air at a temperature of approximately 1300-1700°C. The coal particles undergo pyrolysis and ignite. The bulk of the combustion air is mixed with the flame in the furnace, and complete combustion of the coal char is obtained. After combustion, hot flue gas circulates through a boiler where the thermal energy contained in the gas is transferred to water/steam through furnace boiler tubes, producing steam which is partially fed into the high-pressure and intermediate steam turbine for power generation. This boiler section works in the same way as the HRSG unit in a combined cycle. Before entering the boiler, the feedwater is preheated in feedwater heaters (FWH) [29-30].
The flue gas contains several contaminants such as NOx, fly ash, and SO2 that need to be removed in order to meet environmental emission regulations. Related to CO2 capture, flue gas cleaning is of importance to prevent solvent degradation and equipment corrosion, in order to maintain capture effectiveness and equipment lifetime. Therefore, power plant emission control is obtained by installing equipment cleaning the flue gas. After the boiler, selective catalyst reduction (SRC) is used to remove NOx from the flue gas. An electrostatic precipitator (ESP) for ash handling and a flue gas desulfurization unit (FGD) for SO2 removal follow after the SRC [31].
4 Higher heating value (HHV): Heat of combustion assuming that all water in the products has condensed to liquid.
Lower heating value (LHV): Heat of combustion assuming no water is condensed. For methane, LHV is approximately 11% lower than HHV [33].
Power generation
25
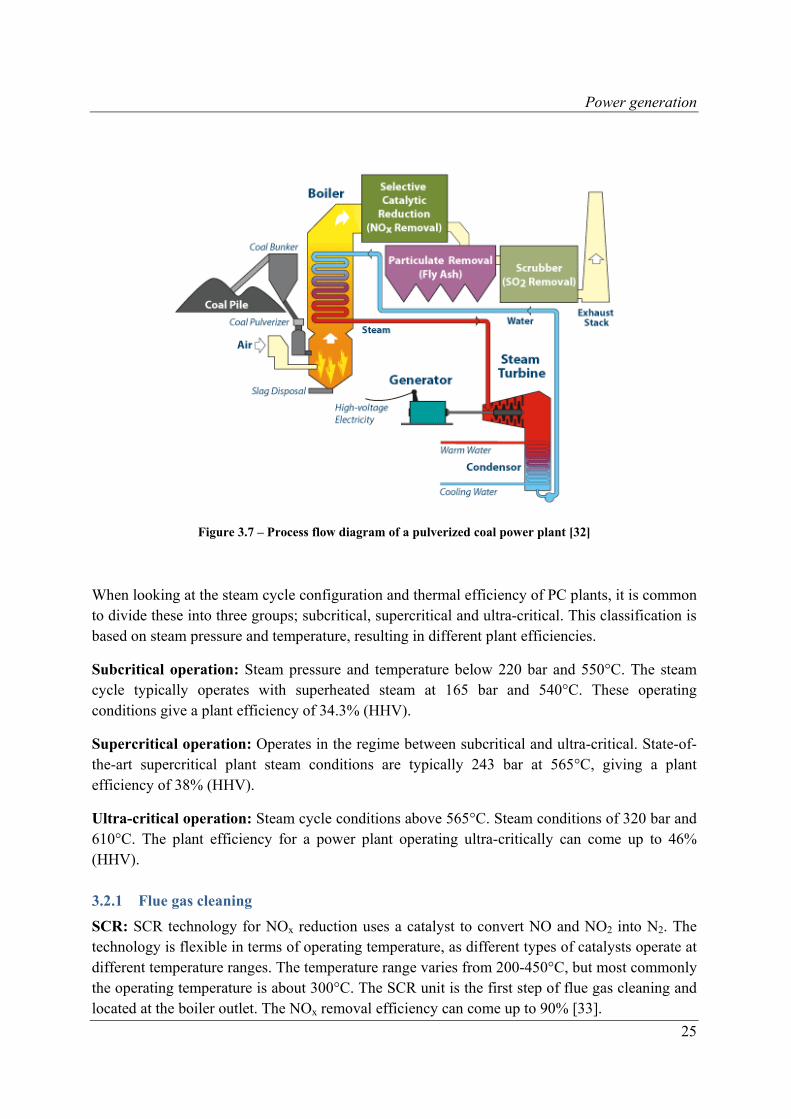
Figure 3.7 – Process flow diagram of a pulverized coal power plant [32]
When looking at the steam cycle configuration and thermal efficiency of PC plants, it is common to divide these into three groups; subcritical, supercritical and ultra-critical. This classification is based on steam pressure and temperature, resulting in different plant efficiencies.
Subcritical operation: Steam pressure and temperature below 220 bar and 550°C. The steam cycle typically operates with superheated steam at 165 bar and 540°C. These operating conditions give a plant efficiency of 34.3% (HHV).
Supercritical operation: Operates in the regime between subcritical and ultra-critical. State-of-the-art supercritical plant steam conditions are typically 243 bar at 565°C, giving a plant efficiency of 38% (HHV).
Ultra-critical operation: Steam cycle conditions above 565°C. Steam conditions of 320 bar and 610°C. The plant efficiency for a power plant operating ultra-critically can come up to 46% (HHV).
3.2.1 Flue gas cleaning
SCR: SCR technology for NOx reduction uses a catalyst to convert NO and NO2 into N2. The technology is flexible in terms of operating temperature, as different types of catalysts operate at different temperature ranges. The temperature range varies from 200-450°C, but most commonly the operating temperature is about 300°C. The SCR unit is the first step of flue gas cleaning and located at the boiler outlet. The NOx removal efficiency can come up to 90% [33].
Power generation
26
ESP: After De-NOx the flue gas enters an ESP unit at a temperature of 130-180°C where particulate matter such as soot, fly ash and metal fumes is removed. Discharge electrodes induce a negative charge to the particles. Plates/tubes surrounding the particles are positively grounded and work as a magnet on the negatively charged particles, effectively removing them from the flue gas. The removal efficiency of the ESP unit is as high as 99-99.9% [13].
FGD: The final step in flue gas cleaning is the FGD unit. The most commonly used technology is wet scrubber flue gas desulphurization (WFGD). Typically a lime slurry consisting of a limestone and water reacts with SO2, forming calcium sulfite (CASO3). The inlet temperature of the WFDG is in the range of 130-140°C. The removal efficiency is up to 97-99% [13].
3.2.2 Feedwater heater system
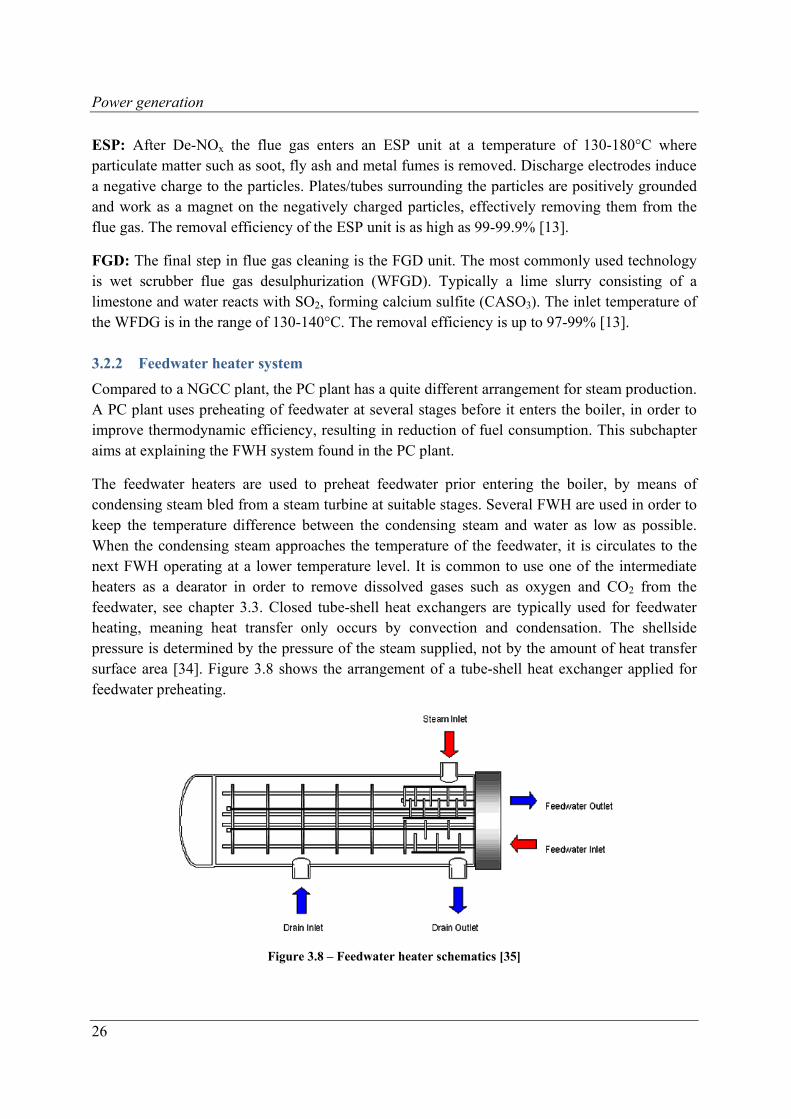
Compared to a NGCC plant, the PC plant has a quite different arrangement for steam production. A PC plant uses preheating of feedwater at several stages before it enters the boiler, in order to improve thermodynamic efficiency, resulting in reduction of fuel consumption. This subchapter aims at explaining the FWH system found in the PC plant.
The feedwater heaters are used to preheat feedwater prior entering the boiler, by means of condensing steam bled from a steam turbine at suitable stages. Several FWH are used in order to keep the temperature difference between the condensing steam and water as low as possible. When the condensing steam approaches the temperature of the feedwater, it is circulates to the next FWH operating at a lower temperature level. It is common to use one of the intermediate heaters as a dearator in order to remove dissolved gases such as oxygen and CO2 from the feedwater, see chapter 3.3. Closed tube-shell heat exchangers are typically used for feedwater heating, meaning heat transfer only occurs by convection and condensation. The shellside pressure is determined by the pressure of the steam supplied, not by the amount of heat transfer surface area [34]. Figure 3.8 shows the arrangement of a tube-shell heat exchanger applied for feedwater preheating.
Figure 3.8 – Feedwater heater schematics [35]
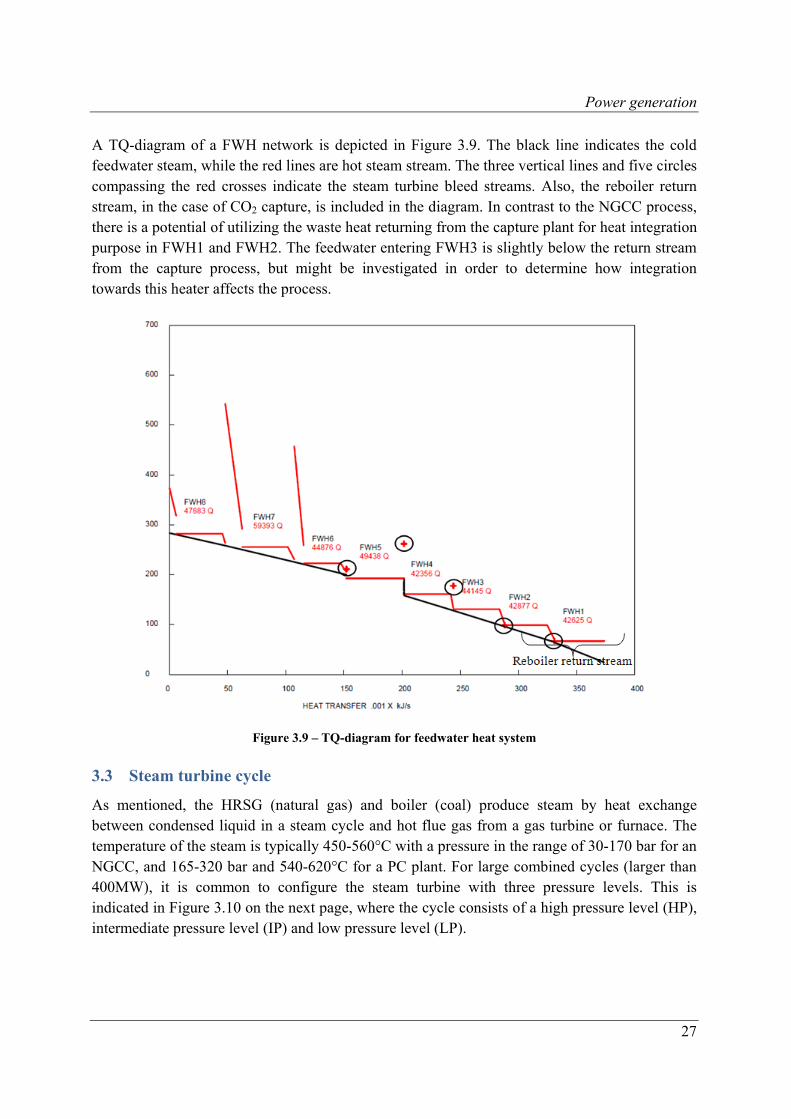
Power generation
27
A TQ-diagram of a FWH network is depicted in Figure 3.9. The black line indicates the cold feedwater steam, while the red lines are hot steam stream. The three vertical lines and five circles compassing the red crosses indicate the steam turbine bleed streams. Also, the reboiler return stream, in the case of CO2 capture, is included in the diagram. In contrast to the NGCC process, there is a potential of utilizing the waste heat returning from the capture plant for heat integration purpose in FWH1 and FWH2. The feedwater entering FWH3 is slightly below the return stream from the capture process, but might be investigated in order to determine how integration towards this heater affects the process.
Figure 3.9 – TQ-diagram for feedwater heat system
3.3 Steam turbine cycle
As mentioned, the HRSG (natural gas) and boiler (coal) produce steam by heat exchange between condensed liquid in a steam cycle and hot flue gas from a gas turbine or furnace. The temperature of the steam is typically 450-560°C with a pressure in the range of 30-170 bar for an NGCC, and 165-320 bar and 540-620°C for a PC plant. For large combined cycles (larger than 400MW), it is common to configure the steam turbine with three pressure levels. This is indicated in Figure 3.10 on the next page, where the cycle consists of a high pressure level (HP), intermediate pressure level (IP) and low pressure level (LP).
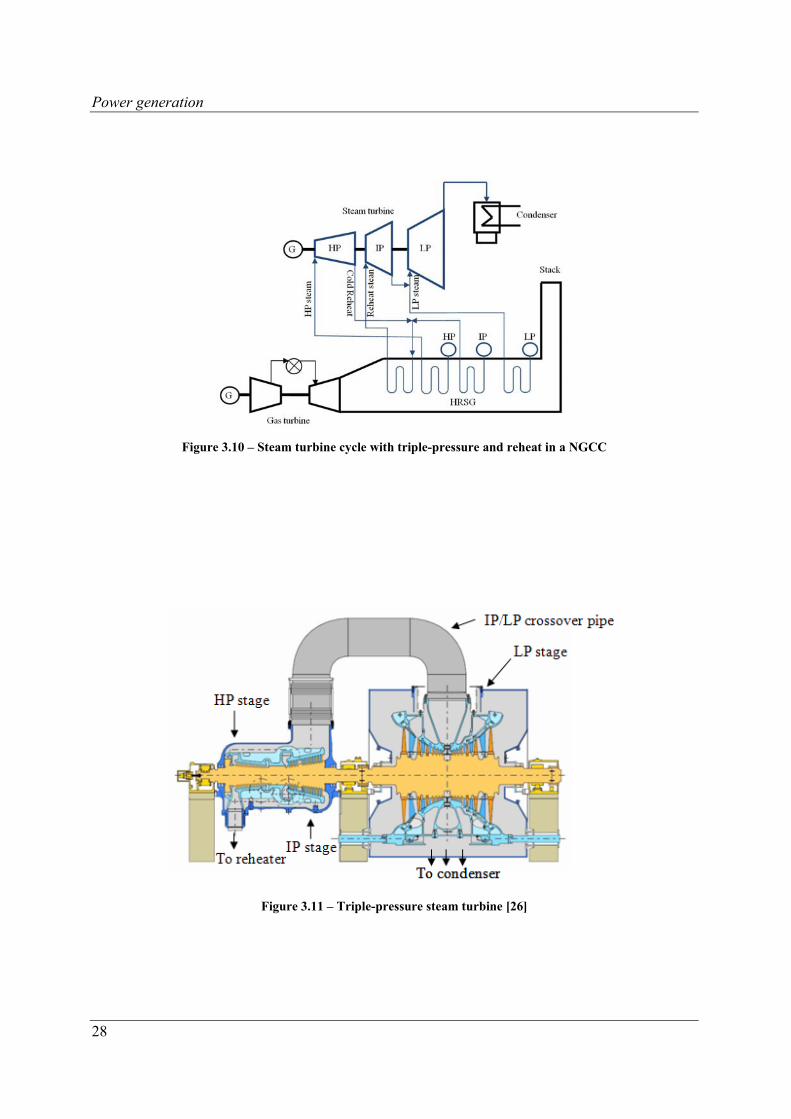
Power generation
28
Figure 3.10 – Steam turbine cycle with triple-pressure and reheat in a NGCC
Figure 3.11 – Triple-pressure steam turbine [26]
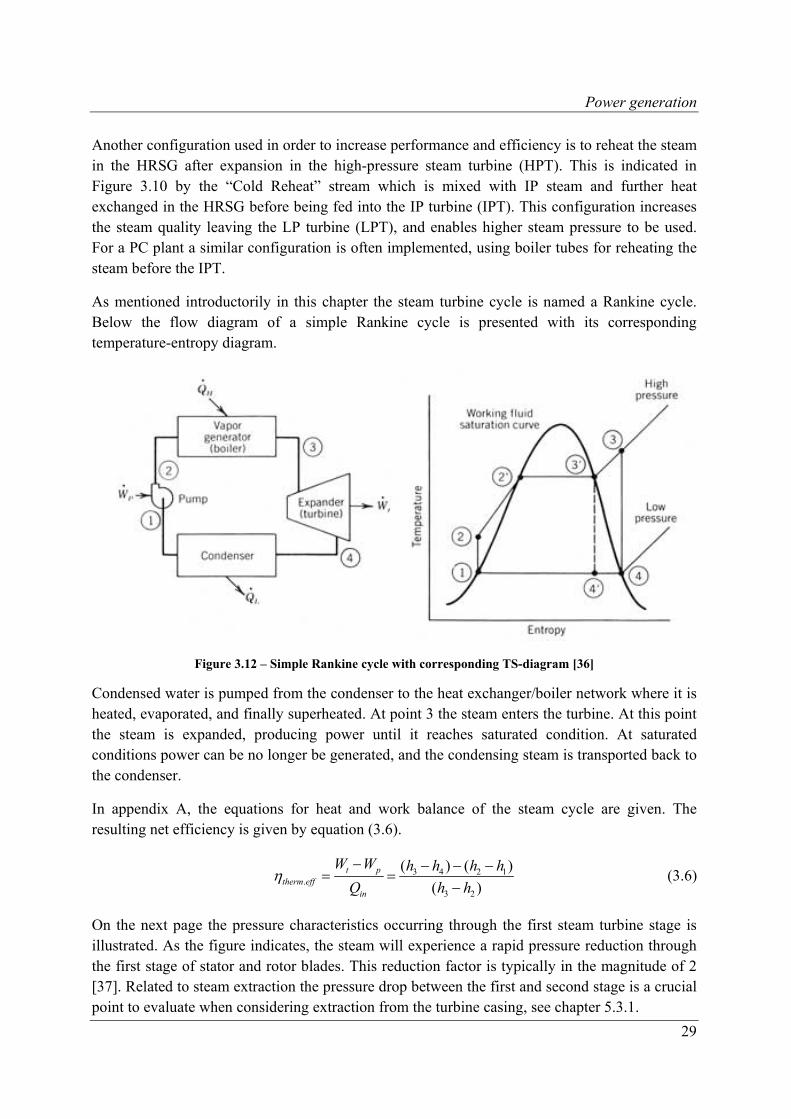
Power generation
29
Another configuration used in order to increase performance and efficiency is to reheat the steam in the HRSG after expansion in the high-pressure steam turbine (HPT). This is indicated in Figure 3.10 by the “Cold Reheat” stream which is mixed with IP steam and further heat exchanged in the HRSG before being fed into the IP turbine (IPT). This configuration increases the steam quality leaving the LP turbine (LPT), and enables higher steam pressure to be used. For a PC plant a similar configuration is often implemented, using boiler tubes for reheating the steam before the IPT.
As mentioned introductorily in this chapter the steam turbine cycle is named a Rankine cycle. Below the flow diagram of a simple Rankine cycle is presented with its corresponding temperature-entropy diagram.
Figure 3.12 – Simple Rankine cycle with corresponding TS-diagram [36]
Condensed water is pumped from the condenser to the heat exchanger/boiler network where it is heated, evaporated, and finally superheated. At point 3 the steam enters the turbine. At this point the steam is expanded, producing power until it reaches saturated condition. At saturated conditions power can be no longer be generated, and the condensing steam is transported back to the condenser.
In appendix A, the equations for heat and work balance of the steam cycle are given. The resulting net efficiency is given by equation (3.6).
3 4 2 1.
3 2
( ) ( )
( )t p
therm effin
W W h h h h
Q h h
(3.6)
On the next page the pressure characteristics occurring through the first steam turbine stage is illustrated. As the figure indicates, the steam will experience a rapid pressure reduction through the first stage of stator and rotor blades. This reduction factor is typically in the magnitude of 2 [37]. Related to steam extraction the pressure drop between the first and second stage is a crucial point to evaluate when considering extraction from the turbine casing, see chapter 5.3.1.
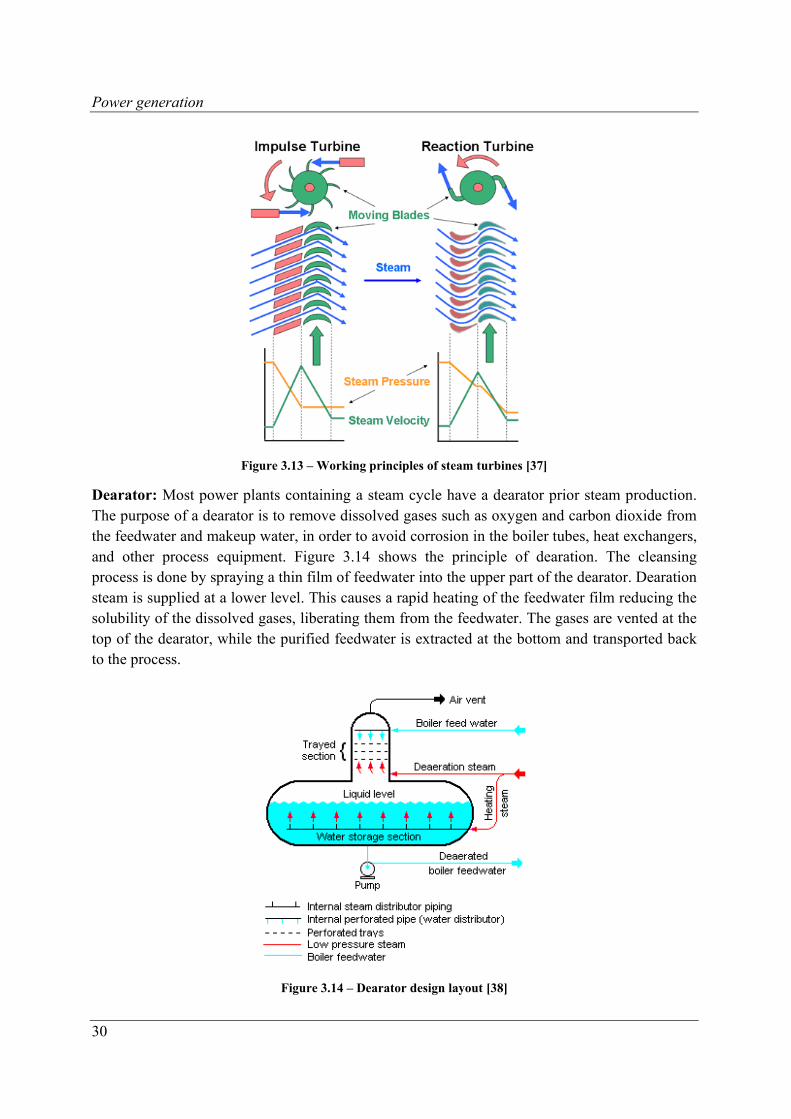
Power generation
30
Figure 3.13 – Working principles of steam turbines [37]
Dearator: Most power plants containing a steam cycle have a dearator prior steam production. The purpose of a dearator is to remove dissolved gases such as oxygen and carbon dioxide from the feedwater and makeup water, in order to avoid corrosion in the boiler tubes, heat exchangers, and other process equipment. Figure 3.14 shows the principle of dearation. The cleansing process is done by spraying a thin film of feedwater into the upper part of the dearator. Dearation steam is supplied at a lower level. This causes a rapid heating of the feedwater film reducing the solubility of the dissolved gases, liberating them from the feedwater. The gases are vented at the top of the dearator, while the purified feedwater is extracted at the bottom and transported back to the process.
Figure 3.14 – Dearator design layout [38]
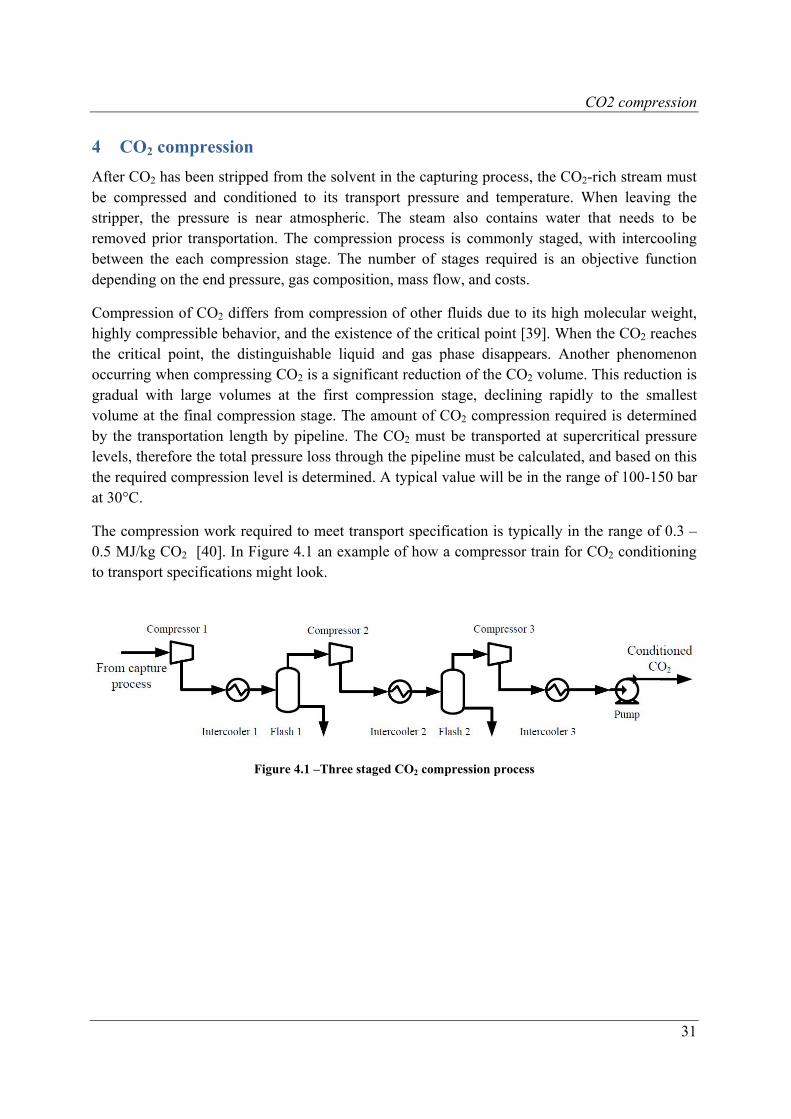
CO2 compression
31
4 CO2 compression
After CO2 has been stripped from the solvent in the capturing process, the CO2-rich stream must be compressed and conditioned to its transport pressure and temperature. When leaving the stripper, the pressure is near atmospheric. The steam also contains water that needs to be removed prior transportation. The compression process is commonly staged, with intercooling between the each compression stage. The number of stages required is an objective function depending on the end pressure, gas composition, mass flow, and costs.
Compression of CO2 differs from compression of other fluids due to its high molecular weight, highly compressible behavior, and the existence of the critical point [39]. When the CO2 reaches the critical point, the distinguishable liquid and gas phase disappears. Another phenomenon occurring when compressing CO2 is a significant reduction of the CO2 volume. This reduction is gradual with large volumes at the first compression stage, declining rapidly to the smallest volume at the final compression stage. The amount of CO2 compression required is determined by the transportation length by pipeline. The CO2 must be transported at supercritical pressure levels, therefore the total pressure loss through the pipeline must be calculated, and based on this the required compression level is determined. A typical value will be in the range of 100-150 bar at 30°C.
The compression work required to meet transport specification is typically in the range of 0.3 – 0.5 MJ/kg CO2 [40]. In Figure 4.1 an example of how a compressor train for CO2 conditioning to transport specifications might look.
Figure 4.1 –Three staged CO2 compression process

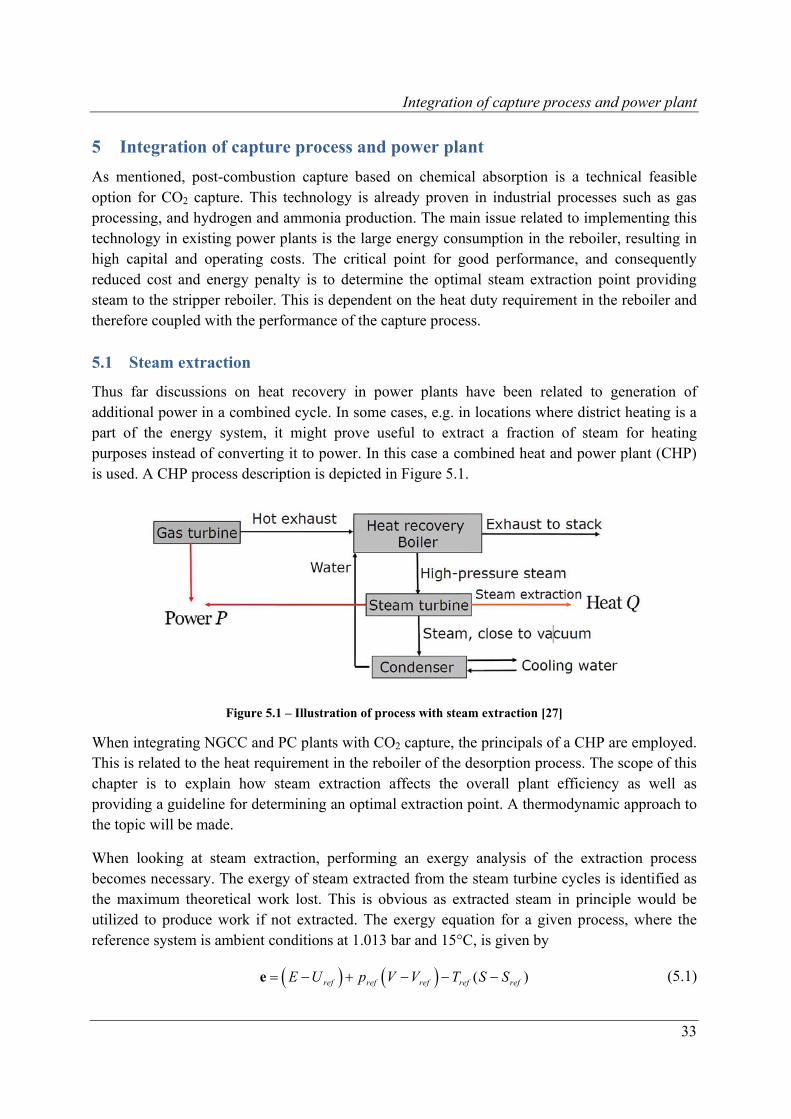
Integration of capture process and power plant
33
5 Integration of capture process and power plant
As mentioned, post-combustion capture based on chemical absorption is a technical feasible option for CO2 capture. This technology is already proven in industrial processes such as gas processing, and hydrogen and ammonia production. The main issue related to implementing this technology in existing power plants is the large energy consumption in the reboiler, resulting in high capital and operating costs. The critical point for good performance, and consequently reduced cost and energy penalty is to determine the optimal steam extraction point providing steam to the stripper reboiler. This is dependent on the heat duty requirement in the reboiler and therefore coupled with the performance of the capture process.
5.1 Steam extraction
Thus far discussions on heat recovery in power plants have been related to generation of additional power in a combined cycle. In some cases, e.g. in locations where district heating is a part of the energy system, it might prove useful to extract a fraction of steam for heating purposes instead of converting it to power. In this case a combined heat and power plant (CHP) is used. A CHP process description is depicted in Figure 5.1.
Figure 5.1 – Illustration of process with steam extraction [27]
When integrating NGCC and PC plants with CO2 capture, the principals of a CHP are employed. This is related to the heat requirement in the reboiler of the desorption process. The scope of this chapter is to explain how steam extraction affects the overall plant efficiency as well as providing a guideline for determining an optimal extraction point. A thermodynamic approach to the topic will be made.
When looking at steam extraction, performing an exergy analysis of the extraction process becomes necessary. The exergy of steam extracted from the steam turbine cycles is identified as the maximum theoretical work lost. This is obvious as extracted steam in principle would be utilized to produce work if not extracted. The exergy equation for a given process, where the reference system is ambient conditions at 1.013 bar and 15°C, is given by
( )ref ref ref ref refE U p V V T S S e (5.1)
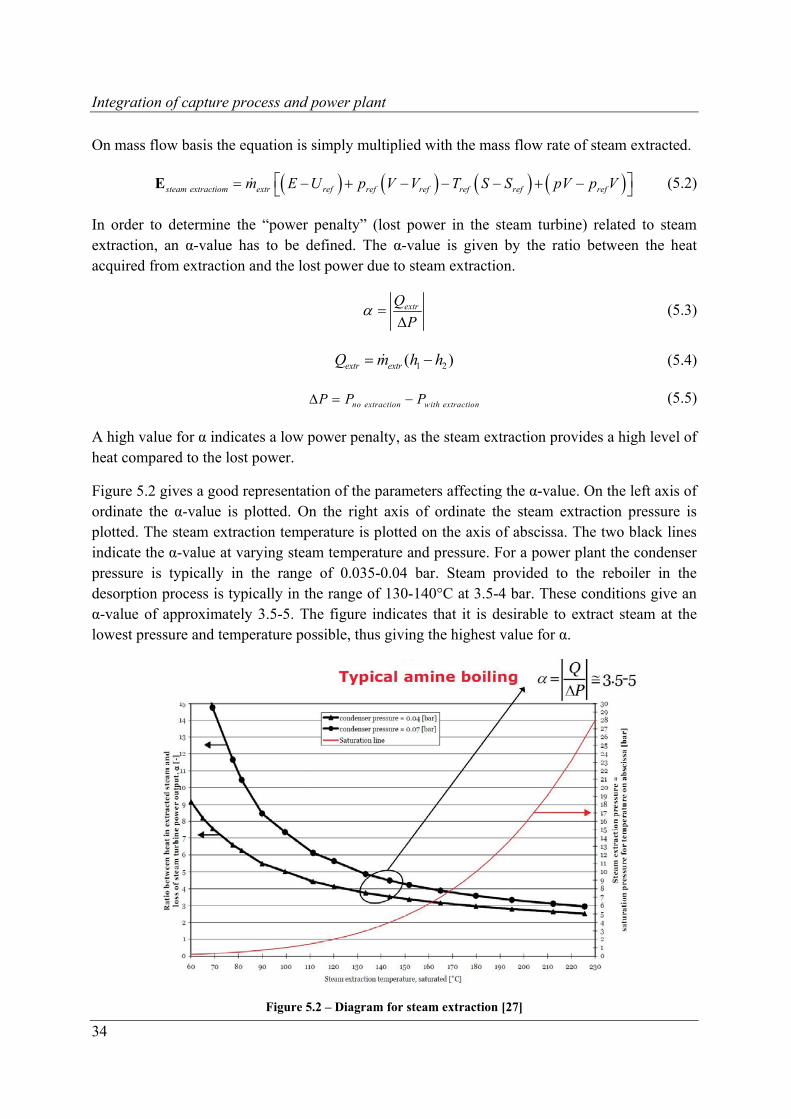
Integration of capture process and power plant
34
On mass flow basis the equation is simply multiplied with the mass flow rate of steam extracted.
steam extractiom extr ref ref ref ref ref refm E U p V V T S S pV p V E (5.2)
In order to determine the “power penalty” (lost power in the steam turbine) related to steam extraction, an α-value has to be defined. The α-value is given by the ratio between the heat acquired from extraction and the lost power due to steam extraction.
extrQ
P
(5.3)
1 2( )extr extrQ m h h (5.4)
no extraction with extractionP P P (5.5)
A high value for α indicates a low power penalty, as the steam extraction provides a high level of heat compared to the lost power.
Figure 5.2 gives a good representation of the parameters affecting the α-value. On the left axis of ordinate the α-value is plotted. On the right axis of ordinate the steam extraction pressure is plotted. The steam extraction temperature is plotted on the axis of abscissa. The two black lines indicate the α-value at varying steam temperature and pressure. For a power plant the condenser pressure is typically in the range of 0.035-0.04 bar. Steam provided to the reboiler in the desorption process is typically in the range of 130-140°C at 3.5-4 bar. These conditions give an α-value of approximately 3.5-5. The figure indicates that it is desirable to extract steam at the lowest pressure and temperature possible, thus giving the highest value for α.
Figure 5.2 – Diagram for steam extraction [27]
Integration of capture process and power plant
35
The steam extraction effect on the power plant efficiency can be found by the equation below.
extr
no extraction
with extraction
QP
LHV
(5.6)
In order to determine the optimal steam extraction conditions, the required pressure and temperature in the reboiler must be determined. It is also desirable that the steam is saturated, as this gives the lowest enthalpy values, hence minimizing the exergy loss. Water injection is used in order to bring superheated steam to saturated state.
As mentioned in chapter 2.3-2.4, the temperature requirement of steam in the reboiler must be in the range of 120°C, not exceeding 122°C. Assuming a differential temperature approach of 10°C between the extracted steam supply and reboiler, the steam provided from extraction in the power plant must hold a temperature of no less than 130°C at saturated conditions. This corresponds to a pressure of 2.7 bar. Considering pressure drops through piping, the author has decided the steam extraction pressure should not deceed 4 bar.
In a three-pressure level steam turbine there are four possible steam extraction points; the turbine outlet, the turbine inlet stream at all three pressure levels, from the casing of the turbine providing an intermediate pressure level between the inlet and outlet pressure, or from the crossover pipe between the IP and LP section. In an NGCC, steam can also be extracted directly from the HRSG. When this is done problems related to superheated steam are avoided [41].
The amount of heat demand in the regeneration process can be described by equation (5.7).
reb extr extr condQ m h h (5.7)
hextr is identified as the enthalpy at the extraction point. When the heat requirement, temperature and pressure levels are known, equation (5.7) can be rearranged and the necessary flow rate of steam extracted can be determined.
rebextr
extr cond
Qm
h h
(5.8)
Integration of capture process and power plant
36
5.2 Efficiency penalty
When integrating a power plant with a post-combustion absorption process, energy penalties are introduced at several points in the process. The energy penalties are related to increased mechanical work, heat requirements in the reboiler, and compression work in order to meet transport and storage specifications. The efficiency for a power plant with CO2 capture based on absorption can be determined by the following equation presented in Bolland, 2003 [40]:
22 2
2
,, ,/
12 3 4
COCO COrem comprrem mech rem heat
with CO capture NGCC PC
E CfE C E Cf
LHV LHV LHV
(5.9)
1: Net electric efficiency of a baseline plant without CO2 capture.
2: Efficiency penalty related to mechanical work when integrating the absorption process.
Erem,mech, given in MJ/kg CO2, represents the energy consumption used for mechanical and electrical work to drive pumps and fans, while C is the ratio between CO2 formed per unit fuel consumed (kg CO2/kg fuel). LHV is the lower heating value of fuel given in MJ/kg fuel.
3: Efficiency penalty related to steam extraction and consequently lost power production in the steam turbine cycle.
Erem,heat, given in MJ/kg CO2, describes the energy consumption of heat extracted to provide necessary heat duty in the amine reboiler, while f represent the CO2 capture ratio and α the power penalty given by equation (5.3).
4: Efficiency penalty for compressing CO2 to specified transport pressure. Erem,compr, given in MJ/kg CO2, is the energy consumption required by the compressors.
By minimizing the effect of the points 2-4, the energy penalty of a plant with CO2 capture is reduced. Point 2 and 4 are not dependent of the power plant process, and only improvements internally in the capture process can reduce their individual impact. Point 3 on the other hand is dependent on steam extraction. In order to identify which parameters are affecting the energy penalty in this case the equation below can be analyzed. By evaluating the effect of the parameters in this equation at varying conditions it is possible to find what parameters should be centre of attention.
Cf
LHV
(5.10)
In the equation there are only two variables; χ and α. χ is related to the absorbent, and can be assumed constant for a chosen absorbent, while α depends on the extraction point. Therefore when trying to reduce the energy penalty, α should be maximized [28]. In the subsequent chapter the equations representing the α-value at different extraction points of the steam process will be derived and discussed.
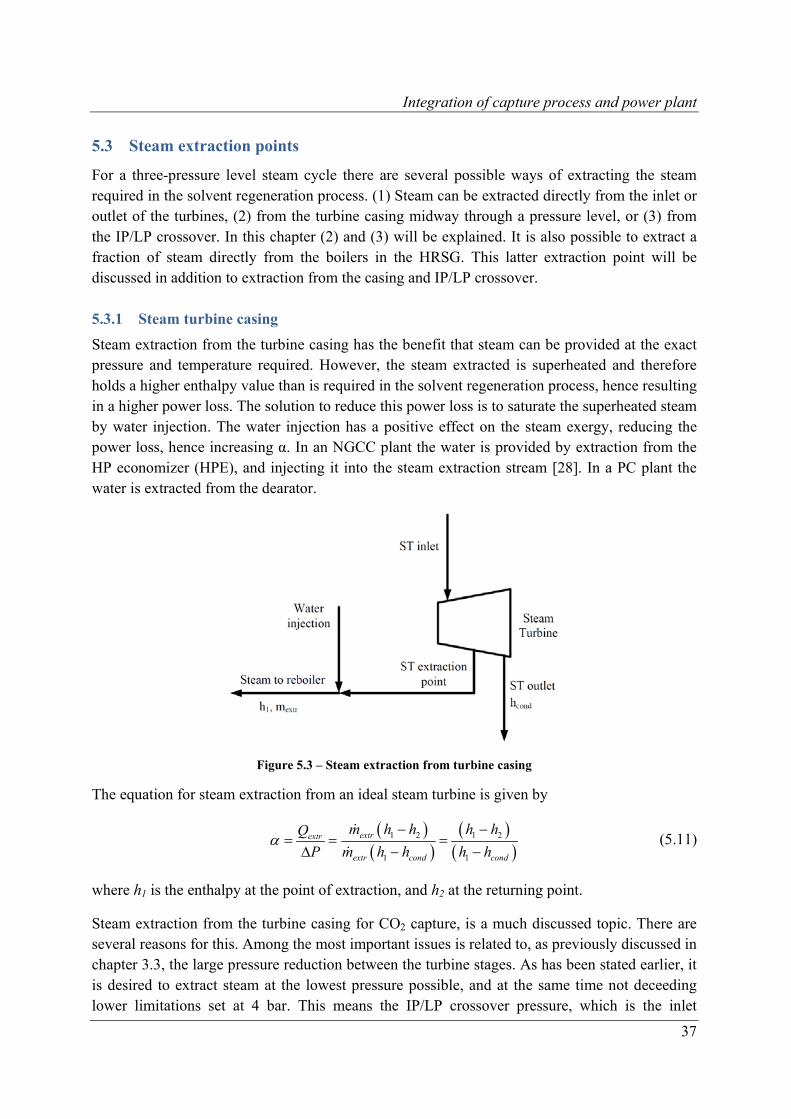
Integration of capture process and power plant
37
5.3 Steam extraction points
For a three-pressure level steam cycle there are several possible ways of extracting the steam required in the solvent regeneration process. (1) Steam can be extracted directly from the inlet or outlet of the turbines, (2) from the turbine casing midway through a pressure level, or (3) from the IP/LP crossover. In this chapter (2) and (3) will be explained. It is also possible to extract a fraction of steam directly from the boilers in the HRSG. This latter extraction point will be discussed in addition to extraction from the casing and IP/LP crossover.
5.3.1 Steam turbine casing
Steam extraction from the turbine casing has the benefit that steam can be provided at the exact pressure and temperature required. However, the steam extracted is superheated and therefore holds a higher enthalpy value than is required in the solvent regeneration process, hence resulting in a higher power loss. The solution to reduce this power loss is to saturate the superheated steam by water injection. The water injection has a positive effect on the steam exergy, reducing the power loss, hence increasing α. In an NGCC plant the water is provided by extraction from the HP economizer (HPE), and injecting it into the steam extraction stream [28]. In a PC plant the water is extracted from the dearator.
Figure 5.3 – Steam extraction from turbine casing
The equation for steam extraction from an ideal steam turbine is given by
1 2 1 2
1 1
extrextr
extr cond cond
m h h h hQ
P m h h h h
(5.11)
where h1 is the enthalpy at the point of extraction, and h2 at the returning point.
Steam extraction from the turbine casing for CO2 capture, is a much discussed topic. There are several reasons for this. Among the most important issues is related to, as previously discussed in chapter 3.3, the large pressure reduction between the turbine stages. As has been stated earlier, it is desired to extract steam at the lowest pressure possible, and at the same time not deceeding lower limitations set at 4 bar. This means the IP/LP crossover pressure, which is the inlet
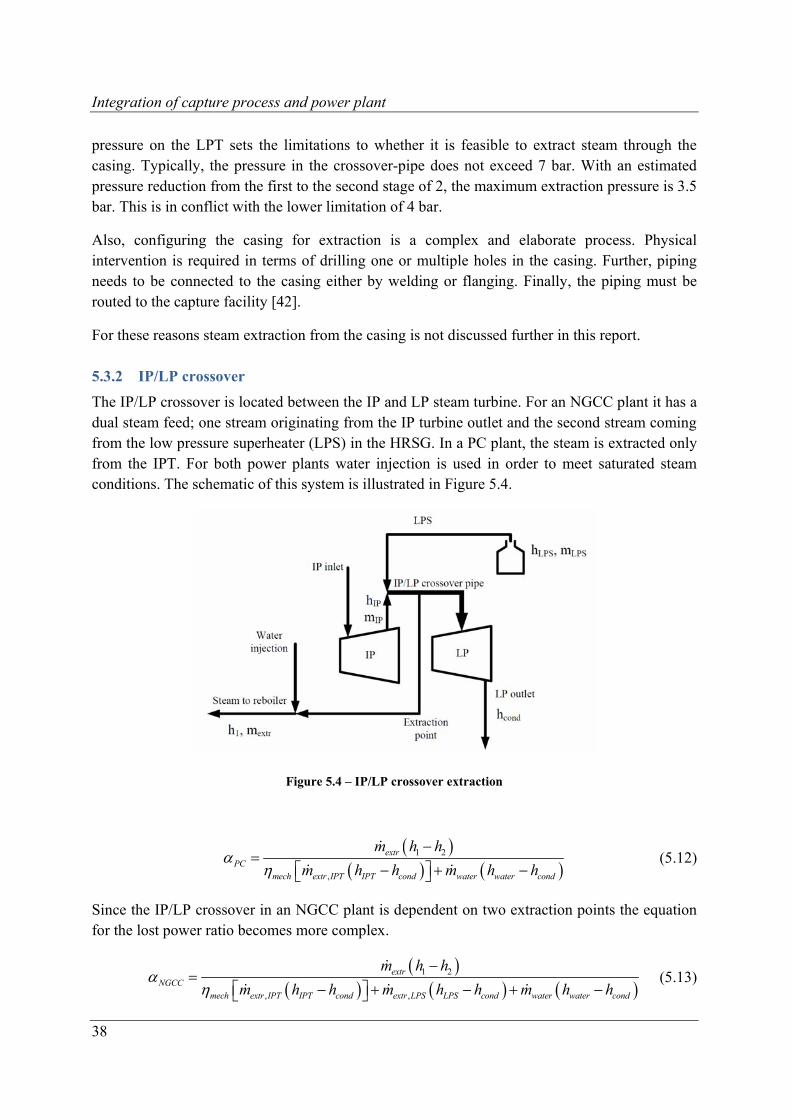
Integration of capture process and power plant
38
pressure on the LPT sets the limitations to whether it is feasible to extract steam through the casing. Typically, the pressure in the crossover-pipe does not exceed 7 bar. With an estimated pressure reduction from the first to the second stage of 2, the maximum extraction pressure is 3.5 bar. This is in conflict with the lower limitation of 4 bar.
Also, configuring the casing for extraction is a complex and elaborate process. Physical intervention is required in terms of drilling one or multiple holes in the casing. Further, piping needs to be connected to the casing either by welding or flanging. Finally, the piping must be routed to the capture facility [42].
For these reasons steam extraction from the casing is not discussed further in this report.
5.3.2 IP/LP crossover
The IP/LP crossover is located between the IP and LP steam turbine. For an NGCC plant it has a dual steam feed; one stream originating from the IP turbine outlet and the second stream coming from the low pressure superheater (LPS) in the HRSG. In a PC plant, the steam is extracted only from the IPT. For both power plants water injection is used in order to meet saturated steam conditions. The schematic of this system is illustrated in Figure 5.4.
Figure 5.4 – IP/LP crossover extraction
1 2
,
extrPC
mech extr IPT IPT cond water water cond
m h h
m h h m h h
(5.12)
Since the IP/LP crossover in an NGCC plant is dependent on two extraction points the equation for the lost power ratio becomes more complex.
1 2
, ,
extrNGCC
mech extr IPT IPT cond extr LPS LPS cond water water cond
m h h
m h h m h h m h h
(5.13)
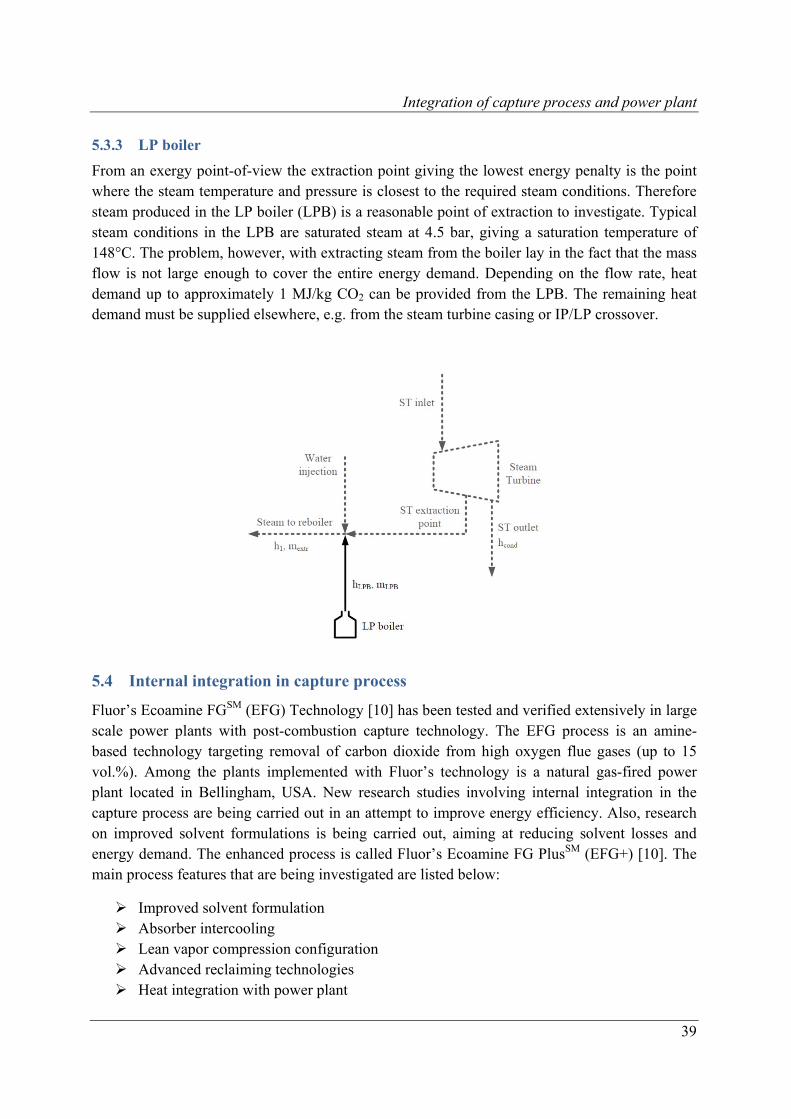
Integration of capture process and power plant
39
5.3.3 LP boiler
From an exergy point-of-view the extraction point giving the lowest energy penalty is the point where the steam temperature and pressure is closest to the required steam conditions. Therefore steam produced in the LP boiler (LPB) is a reasonable point of extraction to investigate. Typical steam conditions in the LPB are saturated steam at 4.5 bar, giving a saturation temperature of 148°C. The problem, however, with extracting steam from the boiler lay in the fact that the mass flow is not large enough to cover the entire energy demand. Depending on the flow rate, heat demand up to approximately 1 MJ/kg CO2 can be provided from the LPB. The remaining heat demand must be supplied elsewhere, e.g. from the steam turbine casing or IP/LP crossover.
5.4 Internal integration in capture process
Fluor’s Ecoamine FGSM (EFG) Technology [10] has been tested and verified extensively in large scale power plants with post-combustion capture technology. The EFG process is an amine-based technology targeting removal of carbon dioxide from high oxygen flue gases (up to 15 vol.%). Among the plants implemented with Fluor’s technology is a natural gas-fired power plant located in Bellingham, USA. New research studies involving internal integration in the capture process are being carried out in an attempt to improve energy efficiency. Also, research on improved solvent formulations is being carried out, aiming at reducing solvent losses and energy demand. The enhanced process is called Fluor’s Ecoamine FG PlusSM (EFG+) [10]. The main process features that are being investigated are listed below:
Improved solvent formulation Absorber intercooling Lean vapor compression configuration Advanced reclaiming technologies Heat integration with power plant
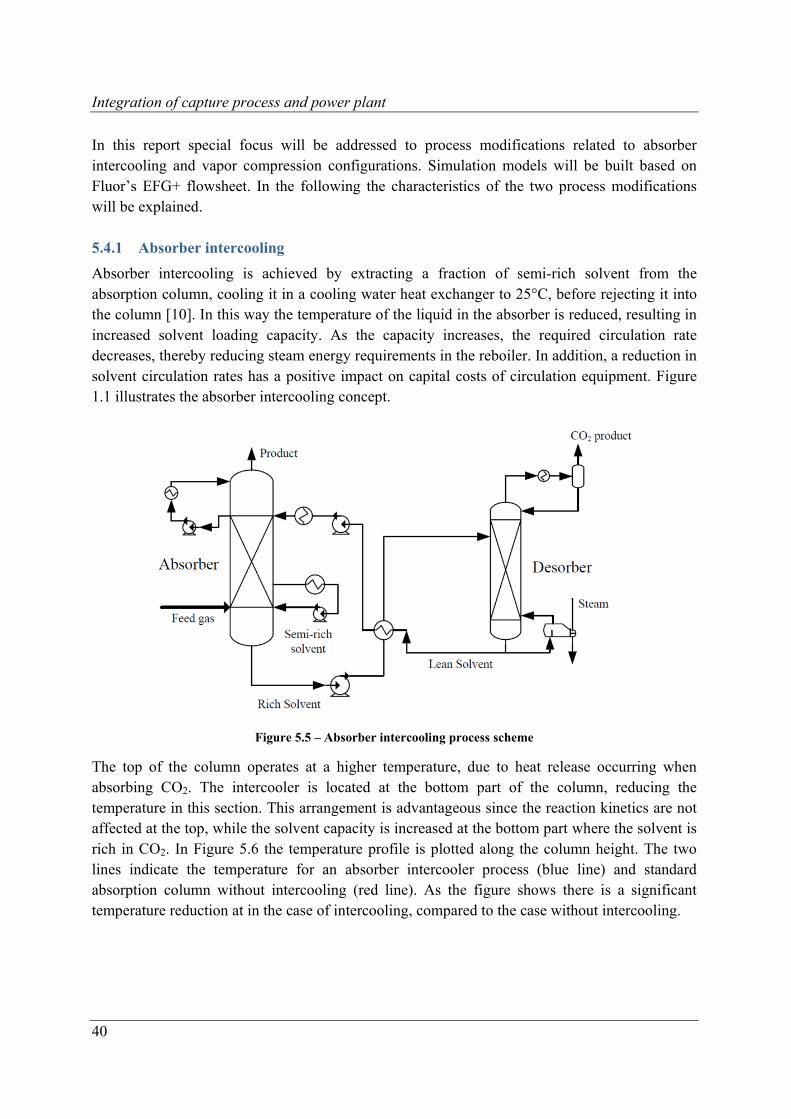
Integration of capture process and power plant
40
In this report special focus will be addressed to process modifications related to absorber intercooling and vapor compression configurations. Simulation models will be built based on Fluor’s EFG+ flowsheet. In the following the characteristics of the two process modifications will be explained.
5.4.1 Absorber intercooling
Absorber intercooling is achieved by extracting a fraction of semi-rich solvent from the absorption column, cooling it in a cooling water heat exchanger to 25°C, before rejecting it into the column [10]. In this way the temperature of the liquid in the absorber is reduced, resulting in increased solvent loading capacity. As the capacity increases, the required circulation rate decreases, thereby reducing steam energy requirements in the reboiler. In addition, a reduction in solvent circulation rates has a positive impact on capital costs of circulation equipment. Figure 1.1 illustrates the absorber intercooling concept.
Figure 5.5 – Absorber intercooling process scheme
The top of the column operates at a higher temperature, due to heat release occurring when absorbing CO2. The intercooler is located at the bottom part of the column, reducing the temperature in this section. This arrangement is advantageous since the reaction kinetics are not affected at the top, while the solvent capacity is increased at the bottom part where the solvent is rich in CO2. In Figure 5.6 the temperature profile is plotted along the column height. The two lines indicate the temperature for an absorber intercooler process (blue line) and standard absorption column without intercooling (red line). As the figure shows there is a significant temperature reduction at in the case of intercooling, compared to the case without intercooling.
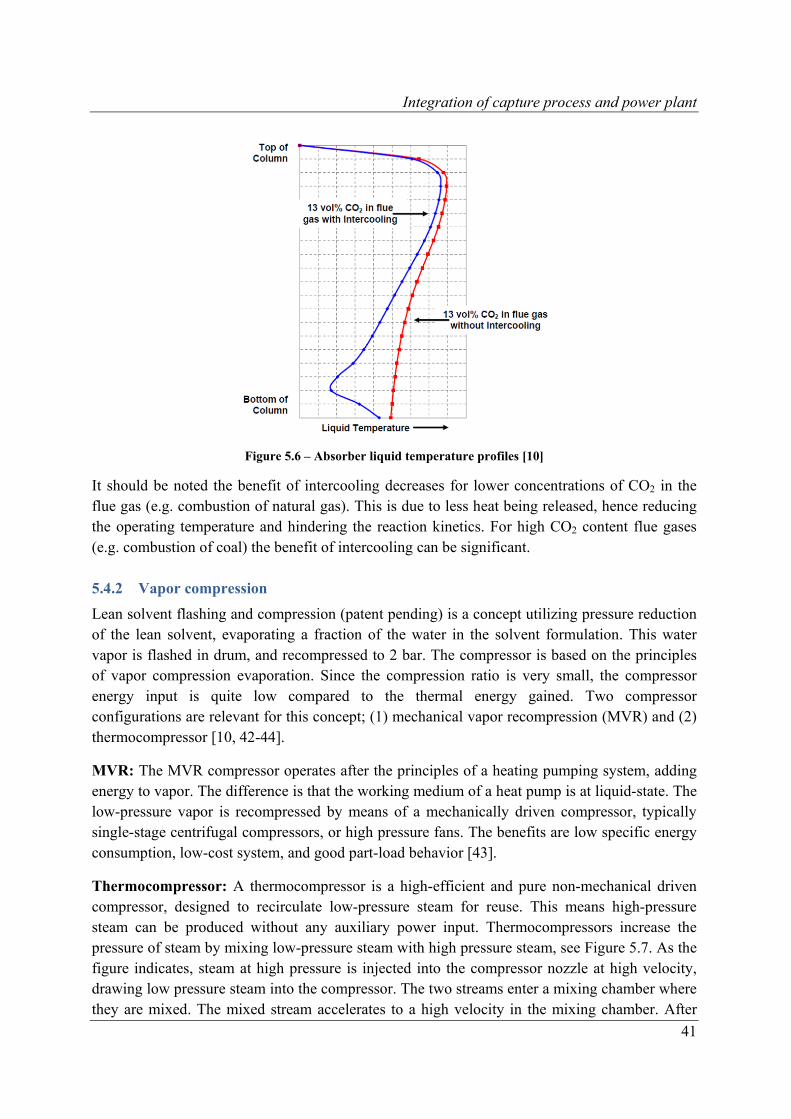
Integration of capture process and power plant
41
Figure 5.6 – Absorber liquid temperature profiles [10]
It should be noted the benefit of intercooling decreases for lower concentrations of CO2 in the flue gas (e.g. combustion of natural gas). This is due to less heat being released, hence reducing the operating temperature and hindering the reaction kinetics. For high CO2 content flue gases (e.g. combustion of coal) the benefit of intercooling can be significant.
5.4.2 Vapor compression
Lean solvent flashing and compression (patent pending) is a concept utilizing pressure reduction of the lean solvent, evaporating a fraction of the water in the solvent formulation. This water vapor is flashed in drum, and recompressed to 2 bar. The compressor is based on the principles of vapor compression evaporation. Since the compression ratio is very small, the compressor energy input is quite low compared to the thermal energy gained. Two compressor configurations are relevant for this concept; (1) mechanical vapor recompression (MVR) and (2) thermocompressor [10, 42-44].
MVR: The MVR compressor operates after the principles of a heating pumping system, adding energy to vapor. The difference is that the working medium of a heat pump is at liquid-state. The low-pressure vapor is recompressed by means of a mechanically driven compressor, typically single-stage centrifugal compressors, or high pressure fans. The benefits are low specific energy consumption, low-cost system, and good part-load behavior [43].
Thermocompressor: A thermocompressor is a high-efficient and pure non-mechanical driven compressor, designed to recirculate low-pressure steam for reuse. This means high-pressure steam can be produced without any auxiliary power input. Thermocompressors increase the pressure of steam by mixing low-pressure steam with high pressure steam, see Figure 5.7. As the figure indicates, steam at high pressure is injected into the compressor nozzle at high velocity, drawing low pressure steam into the compressor. The two streams enter a mixing chamber where they are mixed. The mixed stream accelerates to a high velocity in the mixing chamber. After
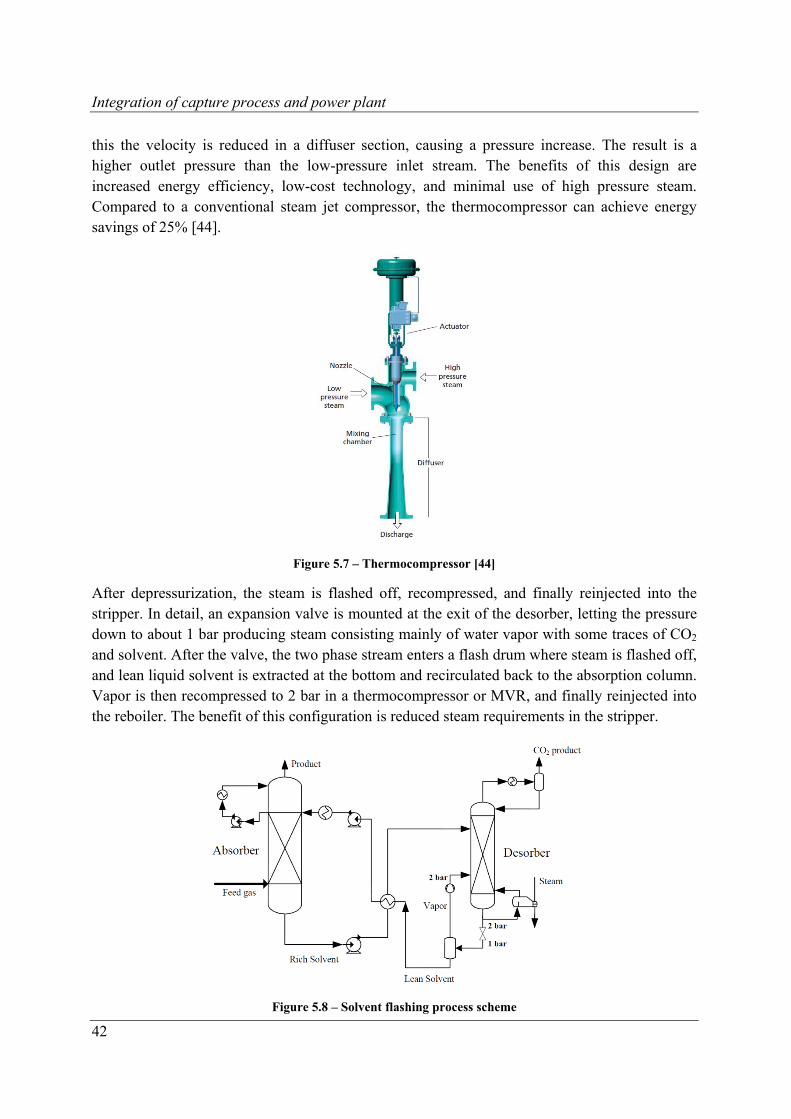
Integration of capture process and power plant
42
this the velocity is reduced in a diffuser section, causing a pressure increase. The result is a higher outlet pressure than the low-pressure inlet stream. The benefits of this design are increased energy efficiency, low-cost technology, and minimal use of high pressure steam. Compared to a conventional steam jet compressor, the thermocompressor can achieve energy savings of 25% [44].
Figure 5.7 – Thermocompressor [44]
After depressurization, the steam is flashed off, recompressed, and finally reinjected into the stripper. In detail, an expansion valve is mounted at the exit of the desorber, letting the pressure down to about 1 bar producing steam consisting mainly of water vapor with some traces of CO2 and solvent. After the valve, the two phase stream enters a flash drum where steam is flashed off, and lean liquid solvent is extracted at the bottom and recirculated back to the absorption column. Vapor is then recompressed to 2 bar in a thermocompressor or MVR, and finally reinjected into the reboiler. The benefit of this configuration is reduced steam requirements in the stripper.
Figure 5.8 – Solvent flashing process scheme
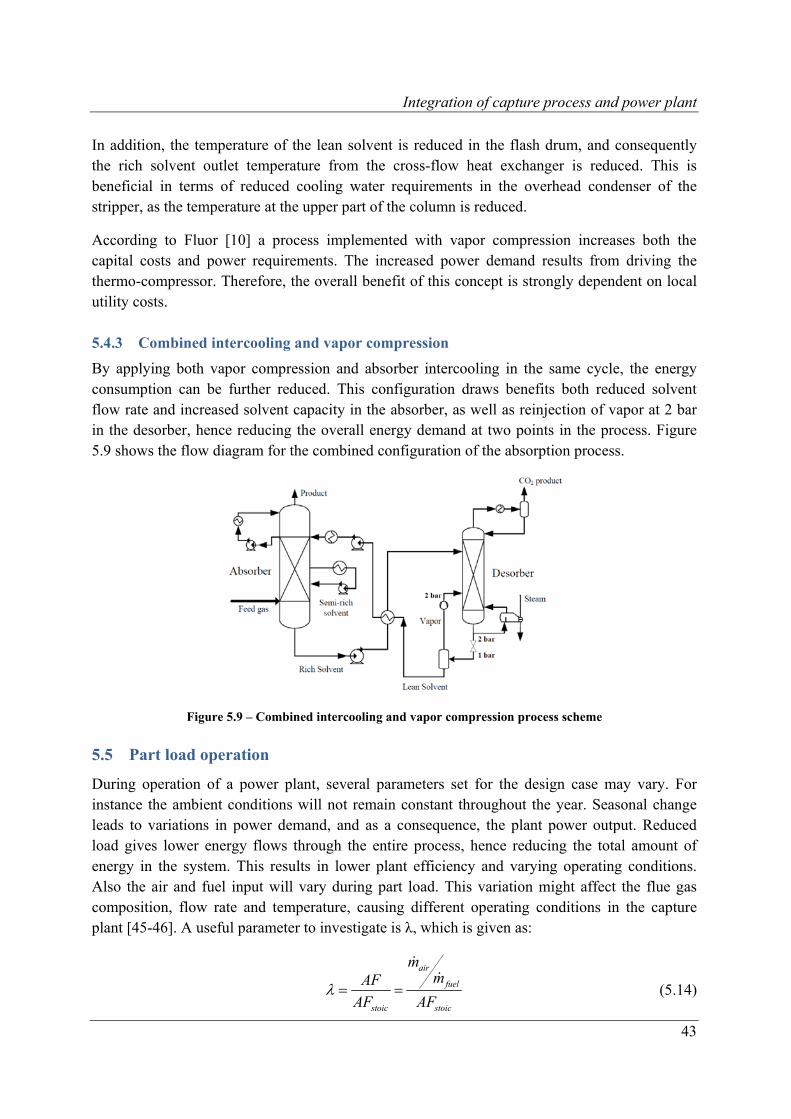
Integration of capture process and power plant
43
In addition, the temperature of the lean solvent is reduced in the flash drum, and consequently the rich solvent outlet temperature from the cross-flow heat exchanger is reduced. This is beneficial in terms of reduced cooling water requirements in the overhead condenser of the stripper, as the temperature at the upper part of the column is reduced.
According to Fluor [10] a process implemented with vapor compression increases both the capital costs and power requirements. The increased power demand results from driving the thermo-compressor. Therefore, the overall benefit of this concept is strongly dependent on local utility costs.
5.4.3 Combined intercooling and vapor compression
By applying both vapor compression and absorber intercooling in the same cycle, the energy consumption can be further reduced. This configuration draws benefits both reduced solvent flow rate and increased solvent capacity in the absorber, as well as reinjection of vapor at 2 bar in the desorber, hence reducing the overall energy demand at two points in the process. Figure 5.9 shows the flow diagram for the combined configuration of the absorption process.
Figure 5.9 – Combined intercooling and vapor compression process scheme
5.5 Part load operation
During operation of a power plant, several parameters set for the design case may vary. For instance the ambient conditions will not remain constant throughout the year. Seasonal change leads to variations in power demand, and as a consequence, the plant power output. Reduced load gives lower energy flows through the entire process, hence reducing the total amount of energy in the system. This results in lower plant efficiency and varying operating conditions. Also the air and fuel input will vary during part load. This variation might affect the flue gas composition, flow rate and temperature, causing different operating conditions in the capture plant [45-46]. A useful parameter to investigate is λ, which is given as:
air
fuel
stoic stoic
mmAF
AF AF
(5.14)
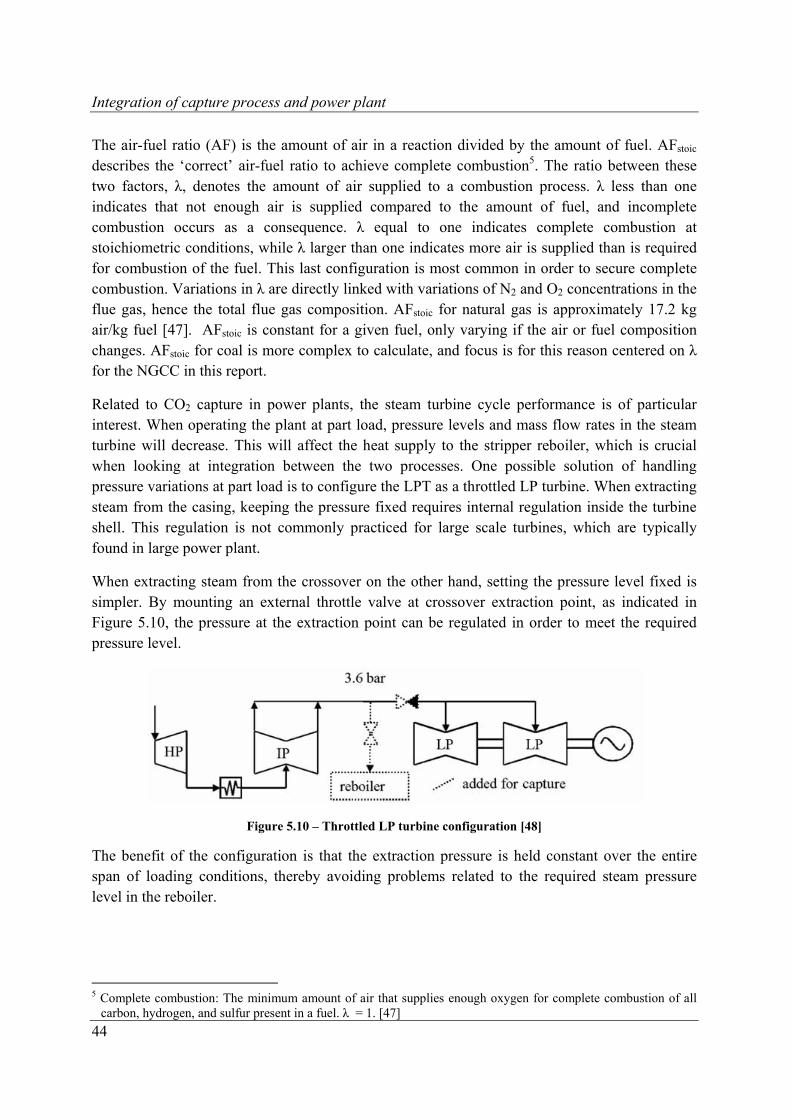
Integration of capture process and power plant
44
The air-fuel ratio (AF) is the amount of air in a reaction divided by the amount of fuel. AFstoic describes the ‘correct’ air-fuel ratio to achieve complete combustion5. The ratio between these two factors, λ, denotes the amount of air supplied to a combustion process. λ less than one indicates that not enough air is supplied compared to the amount of fuel, and incomplete combustion occurs as a consequence. λ equal to one indicates complete combustion at stoichiometric conditions, while λ larger than one indicates more air is supplied than is required for combustion of the fuel. This last configuration is most common in order to secure complete combustion. Variations in λ are directly linked with variations of N2 and O2 concentrations in the flue gas, hence the total flue gas composition. AFstoic for natural gas is approximately 17.2 kg air/kg fuel [47]. AFstoic is constant for a given fuel, only varying if the air or fuel composition changes. AFstoic for coal is more complex to calculate, and focus is for this reason centered on λ for the NGCC in this report.
Related to CO2 capture in power plants, the steam turbine cycle performance is of particular interest. When operating the plant at part load, pressure levels and mass flow rates in the steam turbine will decrease. This will affect the heat supply to the stripper reboiler, which is crucial when looking at integration between the two processes. One possible solution of handling pressure variations at part load is to configure the LPT as a throttled LP turbine. When extracting steam from the casing, keeping the pressure fixed requires internal regulation inside the turbine shell. This regulation is not commonly practiced for large scale turbines, which are typically found in large power plant.
When extracting steam from the crossover on the other hand, setting the pressure level fixed is simpler. By mounting an external throttle valve at crossover extraction point, as indicated in Figure 5.10, the pressure at the extraction point can be regulated in order to meet the required pressure level.
Figure 5.10 – Throttled LP turbine configuration [48]
The benefit of the configuration is that the extraction pressure is held constant over the entire span of loading conditions, thereby avoiding problems related to the required steam pressure level in the reboiler.
5 Complete combustion: The minimum amount of air that supplies enough oxygen for complete combustion of all
carbon, hydrogen, and sulfur present in a fuel. λ = 1. [47]
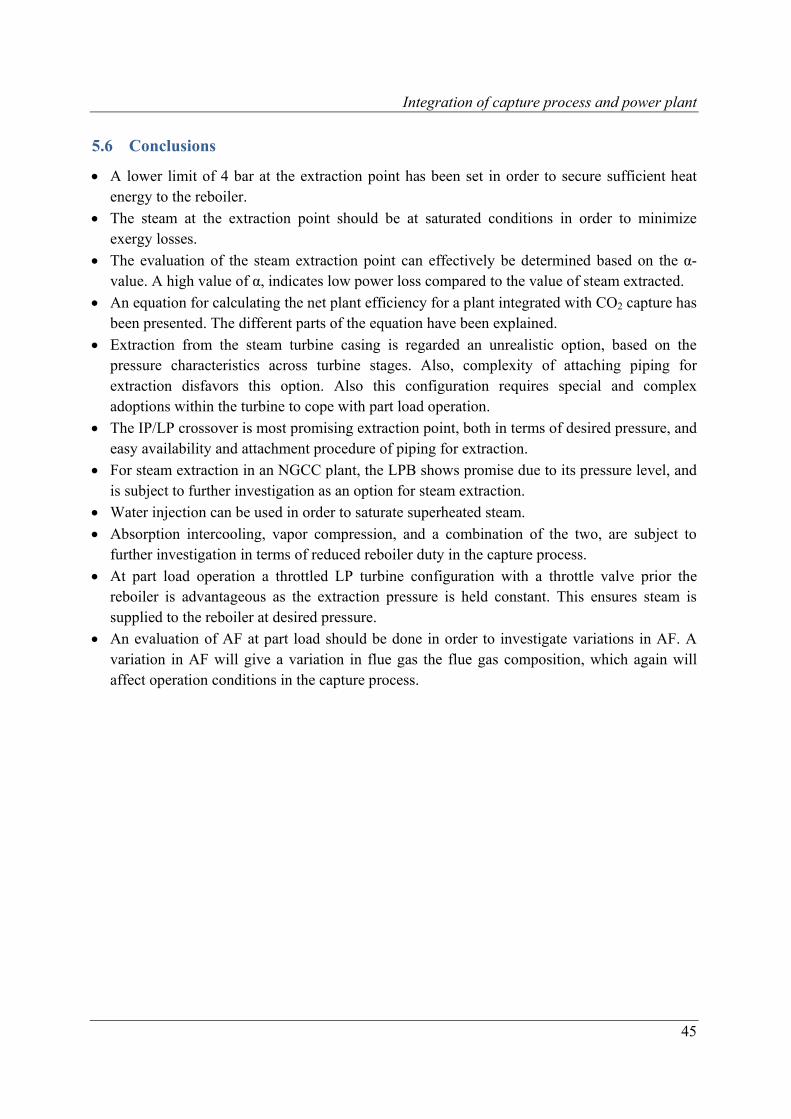
Integration of capture process and power plant
45
5.6 Conclusions
A lower limit of 4 bar at the extraction point has been set in order to secure sufficient heat energy to the reboiler.
The steam at the extraction point should be at saturated conditions in order to minimize exergy losses.
The evaluation of the steam extraction point can effectively be determined based on the α-value. A high value of α, indicates low power loss compared to the value of steam extracted.
An equation for calculating the net plant efficiency for a plant integrated with CO2 capture has been presented. The different parts of the equation have been explained.
Extraction from the steam turbine casing is regarded an unrealistic option, based on the pressure characteristics across turbine stages. Also, complexity of attaching piping for extraction disfavors this option. Also this configuration requires special and complex adoptions within the turbine to cope with part load operation.
The IP/LP crossover is most promising extraction point, both in terms of desired pressure, and easy availability and attachment procedure of piping for extraction.
For steam extraction in an NGCC plant, the LPB shows promise due to its pressure level, and is subject to further investigation as an option for steam extraction.
Water injection can be used in order to saturate superheated steam.
Absorption intercooling, vapor compression, and a combination of the two, are subject to further investigation in terms of reduced reboiler duty in the capture process.
At part load operation a throttled LP turbine configuration with a throttle valve prior the reboiler is advantageous as the extraction pressure is held constant. This ensures steam is supplied to the reboiler at desired pressure.
An evaluation of AF at part load should be done in order to investigate variations in AF. A variation in AF will give a variation in flue gas the flue gas composition, which again will affect operation conditions in the capture process.

Literature study
47
6 Literature study
Several research studies have been carried out in an attempt to identify what integration measures and process modifications can be made in order to reduce the energy penalty when integrating CO2 capture and a power plant process. These studies look at both the options for retrofitting existing power plants as well as new and adapted processes for future new-built power plants.
In this chapter a selection of studies covering the topic of integration of power plants and CO2 capture will be presented. The main process steps and results from the publications will be discussed.
6.1 Retrofit options for natural gas- and coal-fired power plants
A major issue when retrofitting power plants with post-combustion CO2 capture lay in the fact that some plants are regarded capture impossible. The term ‘capture impossible’ signifies that it is cheaper to shut a plant down and building a new plant with a higher efficiency, and at the same time designing it in a way enabling future integration with CCS. This is often the case for old low-efficient coal power plants. Also, the plants location can impose problems, due to lack of local CO2 storage sites and/or lack of space for the capture unit. Therefore, the power plant premises is an essential point requiring attention when considering a plants capture readiness. Finally, power plants may have a design not adapted for integration of capture equipment, but can still be retrofitted at a higher cost [48].
This section looks at the work of two retrofitting studies [48-49] performed on a natural gas combined cycle and pulverized coal plant. In both studies Fluor’s Econamine FG technologies for MEA-based flue gas scrubbing systems has been applied. The most focal points in terms of challenges and possible solutions will be presented. The studies focus mostly on how new power plants can be designed in order to be carbon capture-ready (CCR) for future integration of post-combustion capturing systems. There are some general criterions that should be fulfilled in order for a plant to be capture-ready:
1. The efficiency of the CCR plant should be the same as a standard plant 2. The efficiency of a CCR plant before capture should be the same as the efficiency of a new
plant built with CCS – and with the same steam conditions – at the time when the retrofit occurs.
3. No additional up-front costs for CCR plant 4. The retrofitted plant can operate without CO2 capture 5. The CCR plant should allow implementation of new future capture technology.
6.1.1 Natural gas combined cycle plant
The main challenge with respect to retrofitting an NGCC with post-combustion capture is the steam extraction pressure and flow that provides steam to the stripper reboiler. The gas turbine performance is unaffected as there is no direct link between the gas turbine and the CO2 capture
Literature study
48
plant. The parts of the power plant affected when introducing CO2 capture are the steam turbine cycle and HRSG unit, due to required steam for the regeneration of solvent used in the capture process. The steam quality and amount required is coupled with solvent characteristics and heat of regeneration. Lucquiaud, 2009 [49] presents the main measures that are necessary for a capture-ready NGCC plant.
1. Designing the steam turbine cycle and HRSG in a way that provides same power plant performance before and after retrofit.
2. Design the steam turbine cycle in a ‘capture friendly’ way, meaning flexibility in terms of steam extraction required for regeneration of the solvent with minimum loss of plant performance.
3. Design HRSG in a ‘capture friendly’ way to accommodate modified condensate stream returning from the retrofitted steam cycle.
The basis of the NGCC retrofit plant model investigated in the research study consists of two 260MWe gas turbines, two HRSG units and one steam turbine. In order to fulfill the three measures for capture readiness presented above, three plant modifications have been examined. It should be noted that the steam extraction point in this study is at the crossover between the IP and the LP, not the LP process alone. Below the case studies are defined.
Case 1: The LP turbine replacement involves replacing the LP turbine cylinder with a new LP turbine. The design steam flow for the new turbine matches the flow available once the steam has been extracted for the CO2 capture process.
Case 2: For a throttled LP turbine configuration the turbine remains unchanged, and a throttling valve is applied at the LP inlet in order to maintain the exit pressure of the IP turbine and LP evaporator.
Case 3: The last retrofit option involves setting the IP/LP crossover pressure at an elevated pressure that would be flexible in terms of the required steam conditions for a given solvent. This last alternative is expected to require additional investments as it affects the heat transfer in the HRSG heat exchangers, requiring extensive modifications in this section. For this reason the study was confined to the first two cases.
Results from show an efficiency drop from 56.7% for a CCR plant without CCS, to 48.2% for Case 1, and 47.6% for Case 2. For today’s reboiler energy demand, Case 1 gives the highest plant efficiency. However, as reduction in energy requirement for the reboiler can be expected as a result of improved solvent formulation in the future, power plant performance at different steam extraction rates should be investigated. This is illustrated in Figure 6.1.
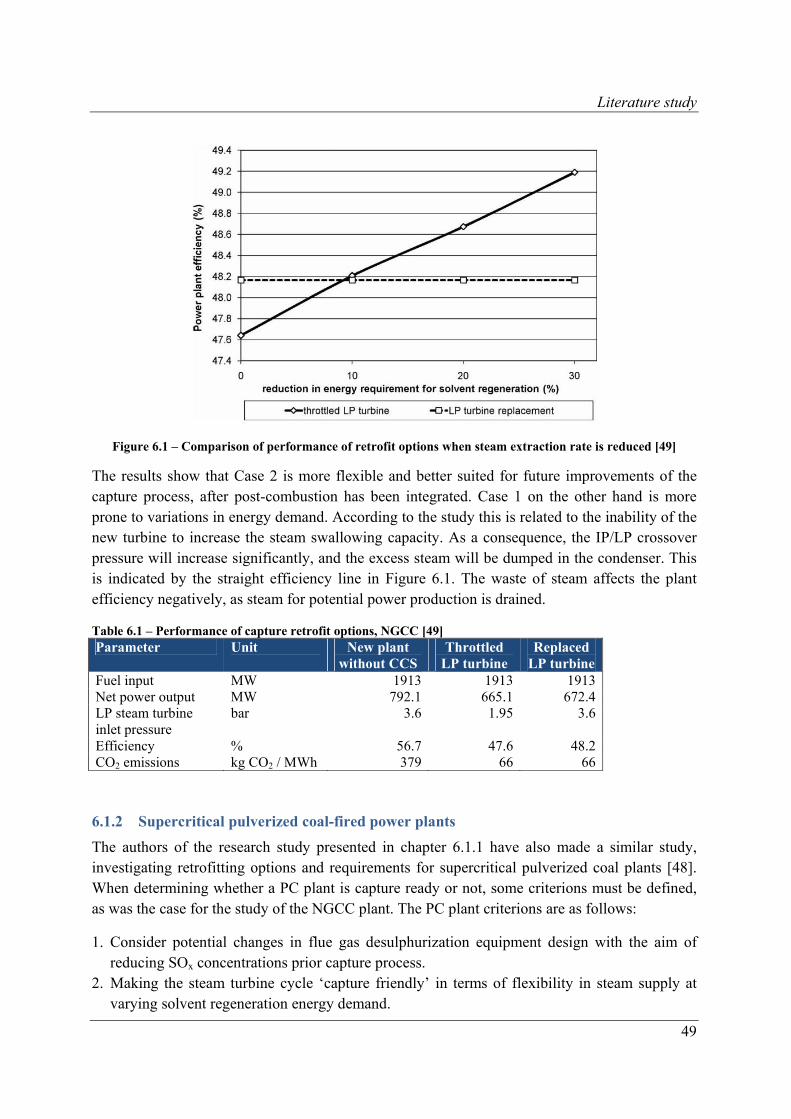
Literature study
49
Figure 6.1 – Comparison of performance of retrofit options when steam extraction rate is reduced [49]
The results show that Case 2 is more flexible and better suited for future improvements of the capture process, after post-combustion has been integrated. Case 1 on the other hand is more prone to variations in energy demand. According to the study this is related to the inability of the new turbine to increase the steam swallowing capacity. As a consequence, the IP/LP crossover pressure will increase significantly, and the excess steam will be dumped in the condenser. This is indicated by the straight efficiency line in Figure 6.1. The waste of steam affects the plant efficiency negatively, as steam for potential power production is drained.
Table 6.1 – Performance of capture retrofit options, NGCC [49] Parameter Unit New plant
without CCS Throttled
LP turbine Replaced
LP turbine Fuel input MW 1913 1913 1913 Net power output MW 792.1 665.1 672.4 LP steam turbine inlet pressure
bar 3.6 1.95 3.6
Efficiency % 56.7 47.6 48.2 CO2 emissions kg CO2 / MWh 379 66 66
6.1.2 Supercritical pulverized coal-fired power plants
The authors of the research study presented in chapter 6.1.1 have also made a similar study, investigating retrofitting options and requirements for supercritical pulverized coal plants [48]. When determining whether a PC plant is capture ready or not, some criterions must be defined, as was the case for the study of the NGCC plant. The PC plant criterions are as follows:
1. Consider potential changes in flue gas desulphurization equipment design with the aim of reducing SOx concentrations prior capture process.
2. Making the steam turbine cycle ‘capture friendly’ in terms of flexibility in steam supply at varying solvent regeneration energy demand.
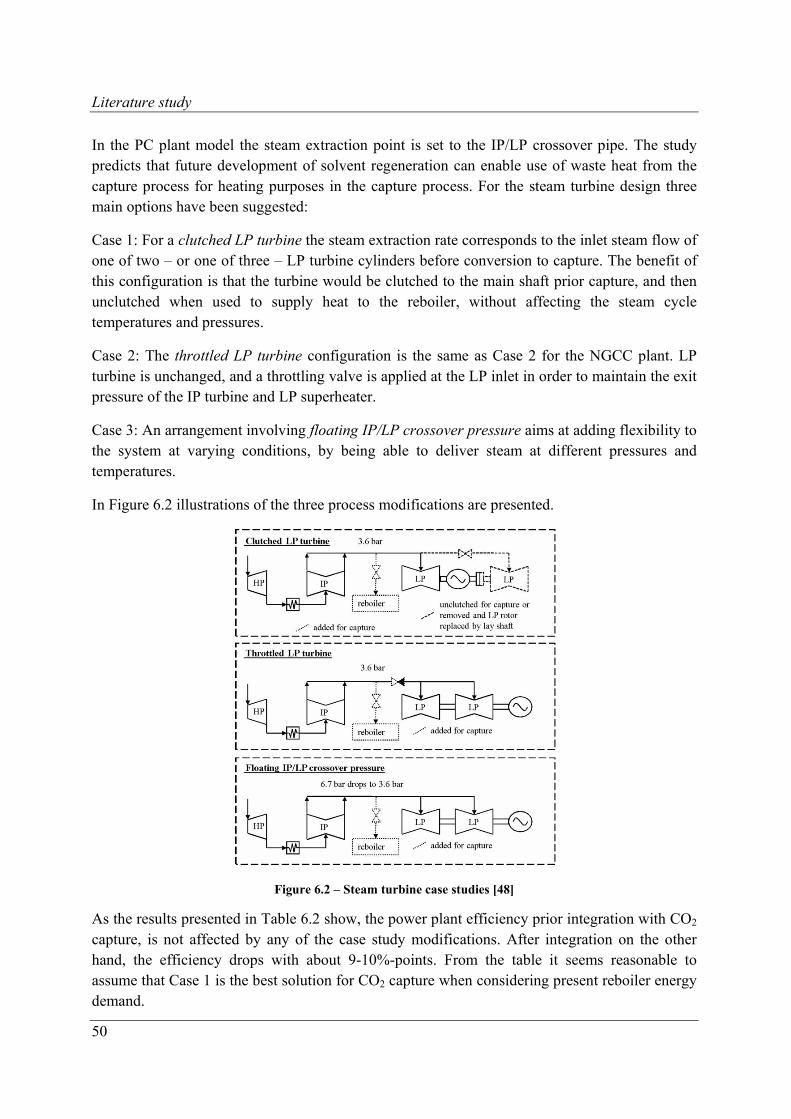
Literature study
50
In the PC plant model the steam extraction point is set to the IP/LP crossover pipe. The study predicts that future development of solvent regeneration can enable use of waste heat from the capture process for heating purposes in the capture process. For the steam turbine design three main options have been suggested:
Case 1: For a clutched LP turbine the steam extraction rate corresponds to the inlet steam flow of one of two – or one of three – LP turbine cylinders before conversion to capture. The benefit of this configuration is that the turbine would be clutched to the main shaft prior capture, and then unclutched when used to supply heat to the reboiler, without affecting the steam cycle temperatures and pressures.
Case 2: The throttled LP turbine configuration is the same as Case 2 for the NGCC plant. LP turbine is unchanged, and a throttling valve is applied at the LP inlet in order to maintain the exit pressure of the IP turbine and LP superheater.
Case 3: An arrangement involving floating IP/LP crossover pressure aims at adding flexibility to the system at varying conditions, by being able to deliver steam at different pressures and temperatures.
In Figure 6.2 illustrations of the three process modifications are presented.
Figure 6.2 – Steam turbine case studies [48]
As the results presented in Table 6.2 show, the power plant efficiency prior integration with CO2 capture, is not affected by any of the case study modifications. After integration on the other hand, the efficiency drops with about 9-10%-points. From the table it seems reasonable to assume that Case 1 is the best solution for CO2 capture when considering present reboiler energy demand.
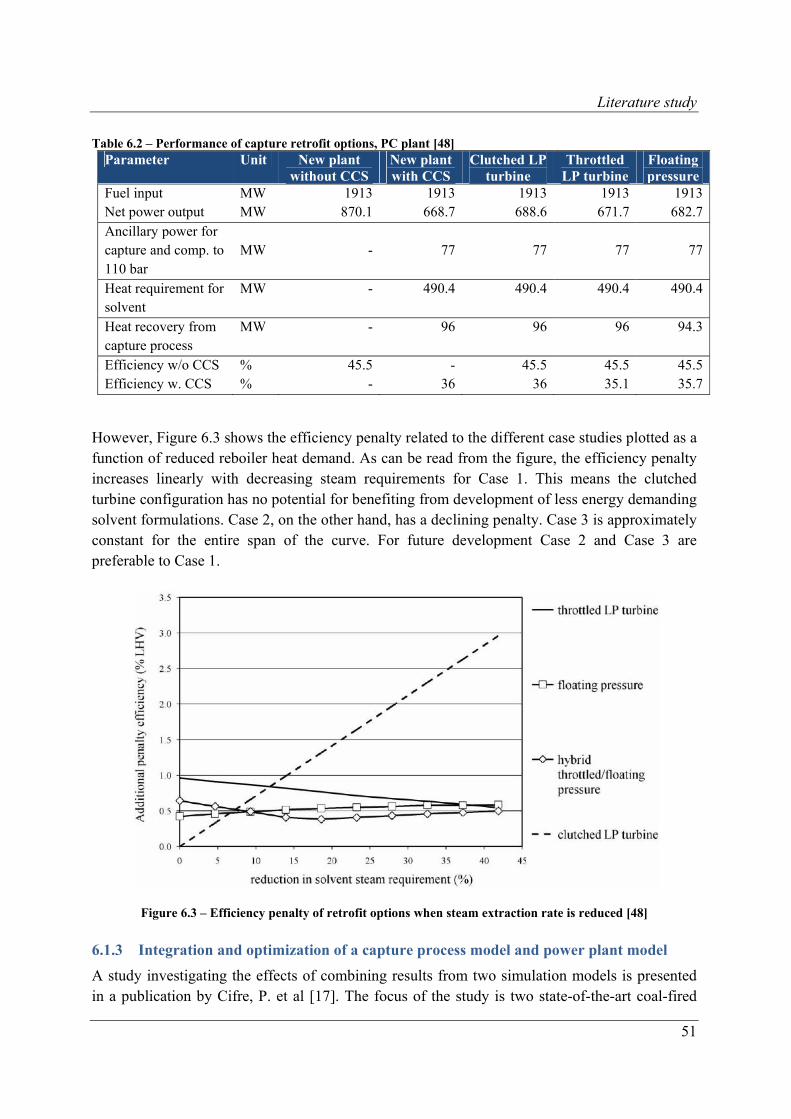
Literature study
51
Table 6.2 – Performance of capture retrofit options, PC plant [48] Parameter Unit New plant
without CCSNew plant with CCS
Clutched LP turbine
Throttled LP turbine
Floating pressure
Fuel input MW 1913 1913 1913 1913 1913Net power output MW 870.1 668.7 688.6 671.7 682.7Ancillary power for capture and comp. to 110 bar
MW
-
77
77
77
77
Heat requirement for solvent
MW - 490.4 490.4 490.4 490.4
Heat recovery from capture process
MW - 96 96 96 94.3
Efficiency w/o CCS % 45.5 - 45.5 45.5 45.5Efficiency w. CCS % - 36 36 35.1 35.7
However, Figure 6.3 shows the efficiency penalty related to the different case studies plotted as a function of reduced reboiler heat demand. As can be read from the figure, the efficiency penalty increases linearly with decreasing steam requirements for Case 1. This means the clutched turbine configuration has no potential for benefiting from development of less energy demanding solvent formulations. Case 2, on the other hand, has a declining penalty. Case 3 is approximately constant for the entire span of the curve. For future development Case 2 and Case 3 are preferable to Case 1.
Figure 6.3 – Efficiency penalty of retrofit options when steam extraction rate is reduced [48]
6.1.3 Integration and optimization of a capture process model and power plant model
A study investigating the effects of combining results from two simulation models is presented in a publication by Cifre, P. et al [17]. The focus of the study is two state-of-the-art coal-fired
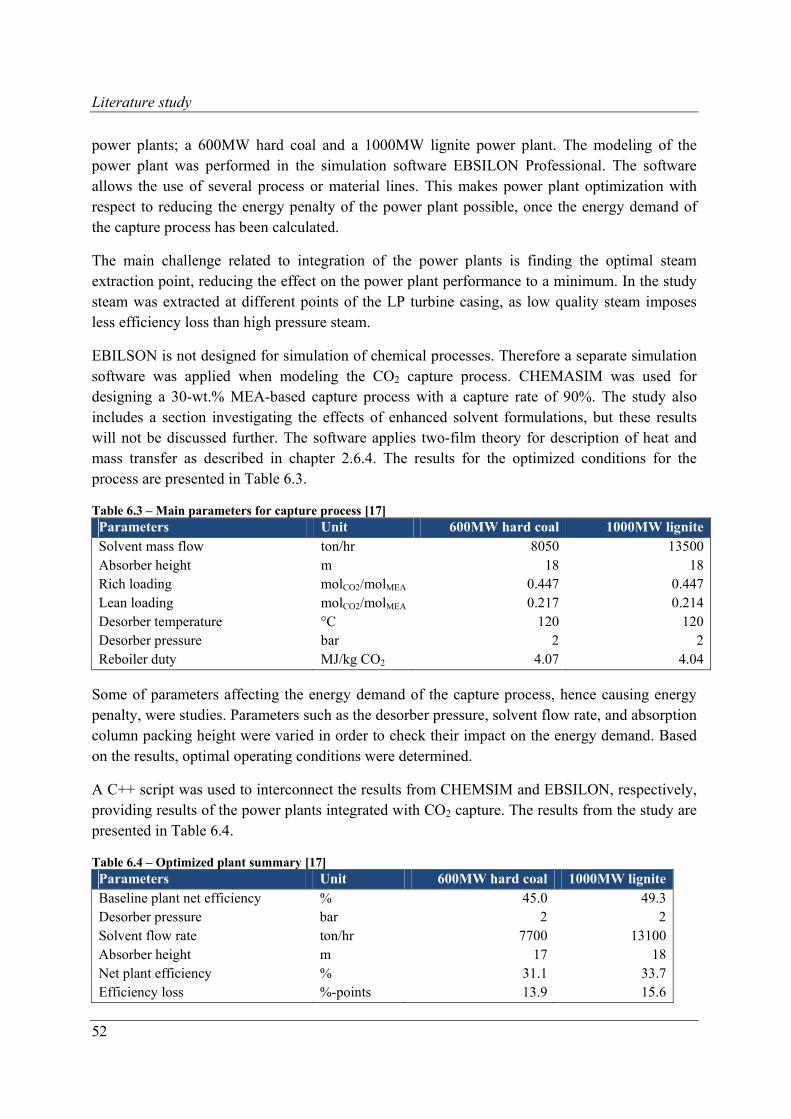
Literature study
52
power plants; a 600MW hard coal and a 1000MW lignite power plant. The modeling of the power plant was performed in the simulation software EBSILON Professional. The software allows the use of several process or material lines. This makes power plant optimization with respect to reducing the energy penalty of the power plant possible, once the energy demand of the capture process has been calculated.
The main challenge related to integration of the power plants is finding the optimal steam extraction point, reducing the effect on the power plant performance to a minimum. In the study steam was extracted at different points of the LP turbine casing, as low quality steam imposes less efficiency loss than high pressure steam.
EBILSON is not designed for simulation of chemical processes. Therefore a separate simulation software was applied when modeling the CO2 capture process. CHEMASIM was used for designing a 30-wt.% MEA-based capture process with a capture rate of 90%. The study also includes a section investigating the effects of enhanced solvent formulations, but these results will not be discussed further. The software applies two-film theory for description of heat and mass transfer as described in chapter 2.6.4. The results for the optimized conditions for the process are presented in Table 6.3.
Table 6.3 – Main parameters for capture process [17] Parameters Unit 600MW hard coal 1000MW ligniteSolvent mass flow ton/hr 8050 13500Absorber height m 18 18Rich loading molCO2/molMEA 0.447 0.447Lean loading molCO2/molMEA 0.217 0.214Desorber temperature °C 120 120Desorber pressure bar 2 2Reboiler duty MJ/kg CO2 4.07 4.04
Some of parameters affecting the energy demand of the capture process, hence causing energy penalty, were studies. Parameters such as the desorber pressure, solvent flow rate, and absorption column packing height were varied in order to check their impact on the energy demand. Based on the results, optimal operating conditions were determined.
A C++ script was used to interconnect the results from CHEMSIM and EBSILON, respectively, providing results of the power plants integrated with CO2 capture. The results from the study are presented in Table 6.4.
Table 6.4 – Optimized plant summary [17] Parameters Unit 600MW hard coal 1000MW ligniteBaseline plant net efficiency % 45.0 49.3Desorber pressure bar 2 2Solvent flow rate ton/hr 7700 13100Absorber height m 17 18Net plant efficiency % 31.1 33.7Efficiency loss %-points 13.9 15.6
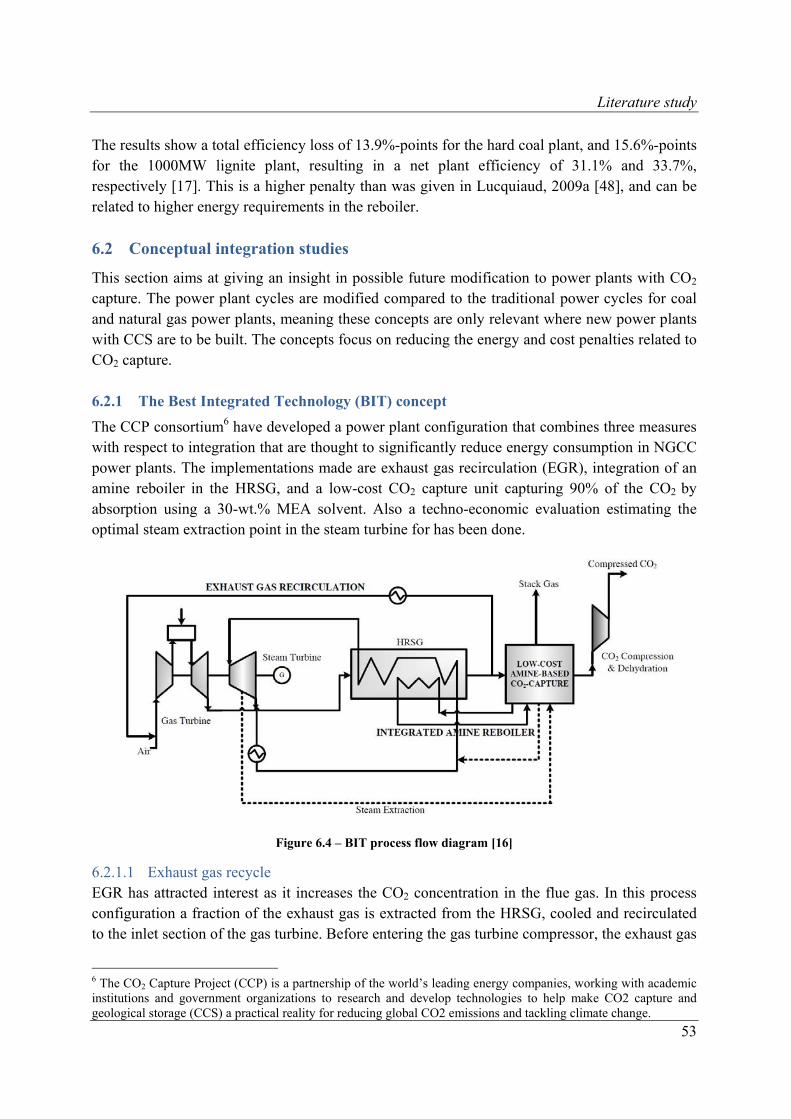
Literature study
53
The results show a total efficiency loss of 13.9%-points for the hard coal plant, and 15.6%-points for the 1000MW lignite plant, resulting in a net plant efficiency of 31.1% and 33.7%, respectively [17]. This is a higher penalty than was given in Lucquiaud, 2009a [48], and can be related to higher energy requirements in the reboiler.
6.2 Conceptual integration studies
This section aims at giving an insight in possible future modification to power plants with CO2 capture. The power plant cycles are modified compared to the traditional power cycles for coal and natural gas power plants, meaning these concepts are only relevant where new power plants with CCS are to be built. The concepts focus on reducing the energy and cost penalties related to CO2 capture.
6.2.1 The Best Integrated Technology (BIT) concept
The CCP consortium6 have developed a power plant configuration that combines three measures with respect to integration that are thought to significantly reduce energy consumption in NGCC power plants. The implementations made are exhaust gas recirculation (EGR), integration of an amine reboiler in the HRSG, and a low-cost CO2 capture unit capturing 90% of the CO2 by absorption using a 30-wt.% MEA solvent. Also a techno-economic evaluation estimating the optimal steam extraction point in the steam turbine for has been done.
Figure 6.4 – BIT process flow diagram [16]
6.2.1.1 Exhaust gas recycle EGR has attracted interest as it increases the CO2 concentration in the flue gas. In this process configuration a fraction of the exhaust gas is extracted from the HRSG, cooled and recirculated to the inlet section of the gas turbine. Before entering the gas turbine compressor, the exhaust gas
6 The CO2 Capture Project (CCP) is a partnership of the world’s leading energy companies, working with academic institutions and government organizations to research and develop technologies to help make CO2 capture and geological storage (CCS) a practical reality for reducing global CO2 emissions and tackling climate change.
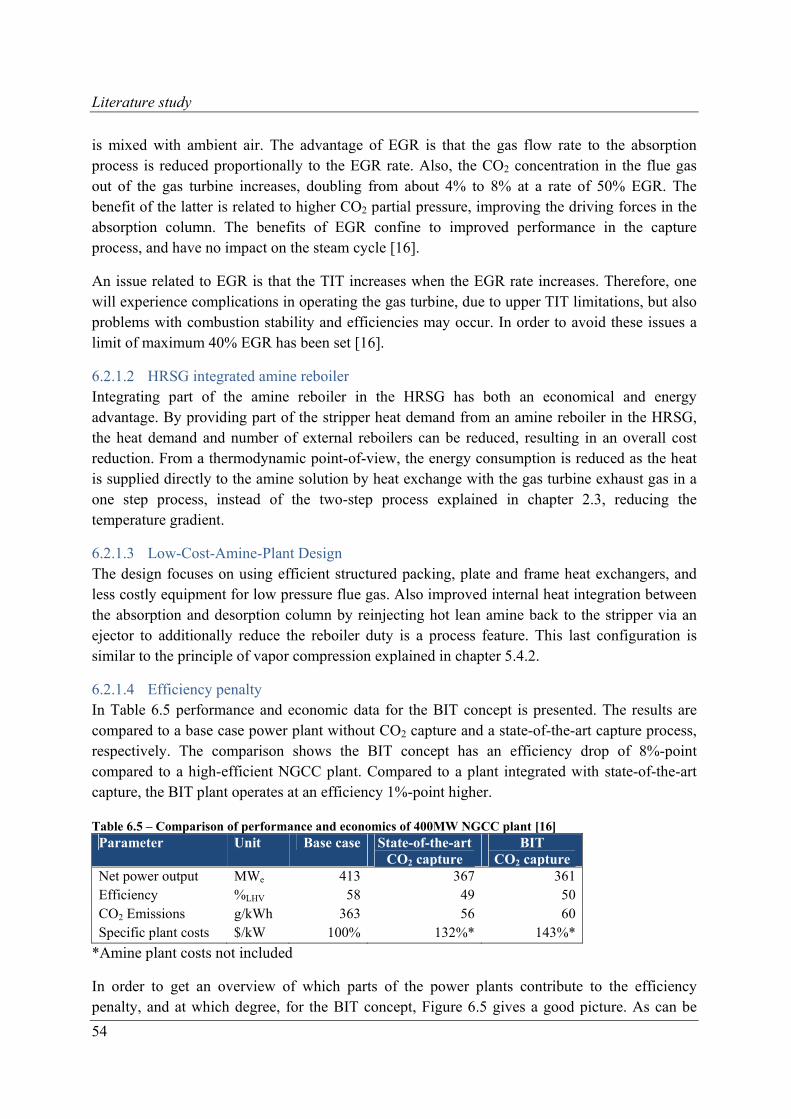
Literature study
54
is mixed with ambient air. The advantage of EGR is that the gas flow rate to the absorption process is reduced proportionally to the EGR rate. Also, the CO2 concentration in the flue gas out of the gas turbine increases, doubling from about 4% to 8% at a rate of 50% EGR. The benefit of the latter is related to higher CO2 partial pressure, improving the driving forces in the absorption column. The benefits of EGR confine to improved performance in the capture process, and have no impact on the steam cycle [16].
An issue related to EGR is that the TIT increases when the EGR rate increases. Therefore, one will experience complications in operating the gas turbine, due to upper TIT limitations, but also problems with combustion stability and efficiencies may occur. In order to avoid these issues a limit of maximum 40% EGR has been set [16].
6.2.1.2 HRSG integrated amine reboiler Integrating part of the amine reboiler in the HRSG has both an economical and energy advantage. By providing part of the stripper heat demand from an amine reboiler in the HRSG, the heat demand and number of external reboilers can be reduced, resulting in an overall cost reduction. From a thermodynamic point-of-view, the energy consumption is reduced as the heat is supplied directly to the amine solution by heat exchange with the gas turbine exhaust gas in a one step process, instead of the two-step process explained in chapter 2.3, reducing the temperature gradient.
6.2.1.3 Low-Cost-Amine-Plant Design The design focuses on using efficient structured packing, plate and frame heat exchangers, and less costly equipment for low pressure flue gas. Also improved internal heat integration between the absorption and desorption column by reinjecting hot lean amine back to the stripper via an ejector to additionally reduce the reboiler duty is a process feature. This last configuration is similar to the principle of vapor compression explained in chapter 5.4.2.
6.2.1.4 Efficiency penalty In Table 6.5 performance and economic data for the BIT concept is presented. The results are compared to a base case power plant without CO2 capture and a state-of-the-art capture process, respectively. The comparison shows the BIT concept has an efficiency drop of 8%-point compared to a high-efficient NGCC plant. Compared to a plant integrated with state-of-the-art capture, the BIT plant operates at an efficiency 1%-point higher.
Table 6.5 – Comparison of performance and economics of 400MW NGCC plant [16] Parameter Unit Base case State-of-the-art
CO2 captureBIT
CO2 capture Net power output MWe 413 367 361 Efficiency %LHV 58 49 50 CO2 Emissions g/kWh 363 56 60 Specific plant costs $/kW 100% 132%* 143%*
*Amine plant costs not included
In order to get an overview of which parts of the power plants contribute to the efficiency penalty, and at which degree, for the BIT concept, Figure 6.5 gives a good picture. As can be
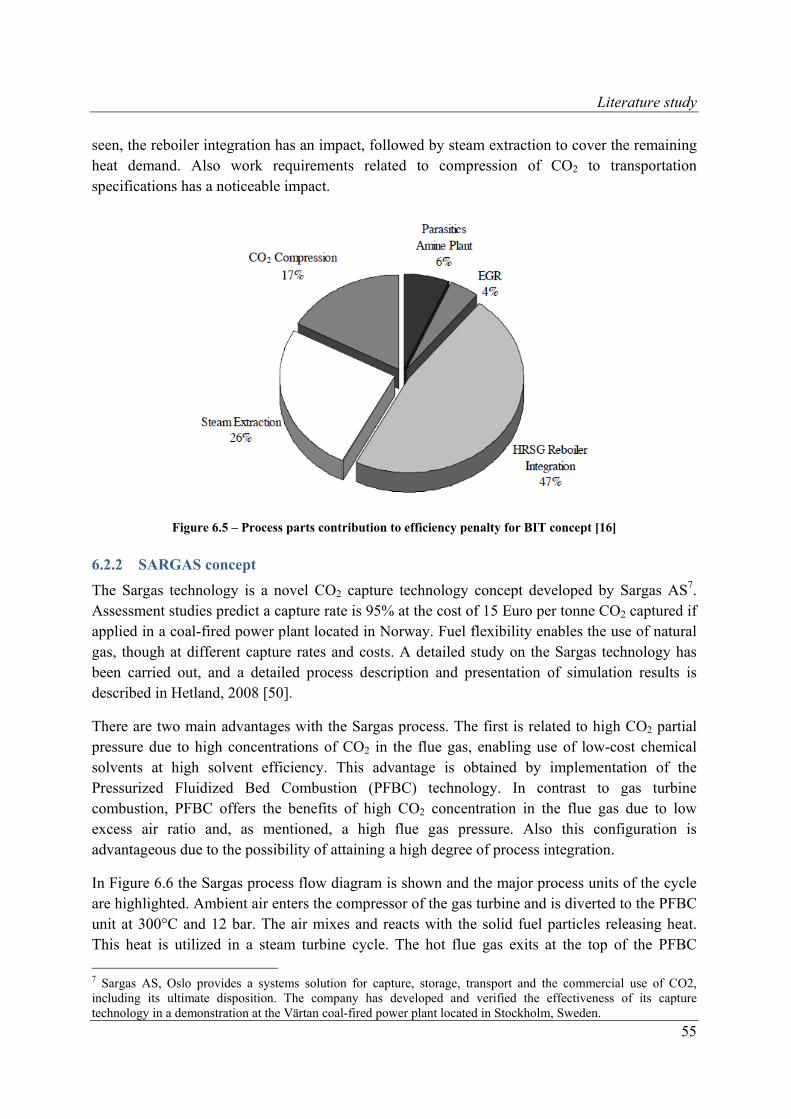
Literature study
55
seen, the reboiler integration has an impact, followed by steam extraction to cover the remaining heat demand. Also work requirements related to compression of CO2 to transportation specifications has a noticeable impact.
Figure 6.5 – Process parts contribution to efficiency penalty for BIT concept [16]
6.2.2 SARGAS concept
The Sargas technology is a novel CO2 capture technology concept developed by Sargas AS7. Assessment studies predict a capture rate is 95% at the cost of 15 Euro per tonne CO2 captured if applied in a coal-fired power plant located in Norway. Fuel flexibility enables the use of natural gas, though at different capture rates and costs. A detailed study on the Sargas technology has been carried out, and a detailed process description and presentation of simulation results is described in Hetland, 2008 [50].
There are two main advantages with the Sargas process. The first is related to high CO2 partial pressure due to high concentrations of CO2 in the flue gas, enabling use of low-cost chemical solvents at high solvent efficiency. This advantage is obtained by implementation of the Pressurized Fluidized Bed Combustion (PFBC) technology. In contrast to gas turbine combustion, PFBC offers the benefits of high CO2 concentration in the flue gas due to low excess air ratio and, as mentioned, a high flue gas pressure. Also this configuration is advantageous due to the possibility of attaining a high degree of process integration.
In Figure 6.6 the Sargas process flow diagram is shown and the major process units of the cycle are highlighted. Ambient air enters the compressor of the gas turbine and is diverted to the PFBC unit at 300°C and 12 bar. The air mixes and reacts with the solid fuel particles releasing heat. This heat is utilized in a steam turbine cycle. The hot flue gas exits at the top of the PFBC
7 Sargas AS, Oslo provides a systems solution for capture, storage, transport and the commercial use of CO2, including its ultimate disposition. The company has developed and verified the effectiveness of its capture technology in a demonstration at the Värtan coal-fired power plant located in Stockholm, Sweden.
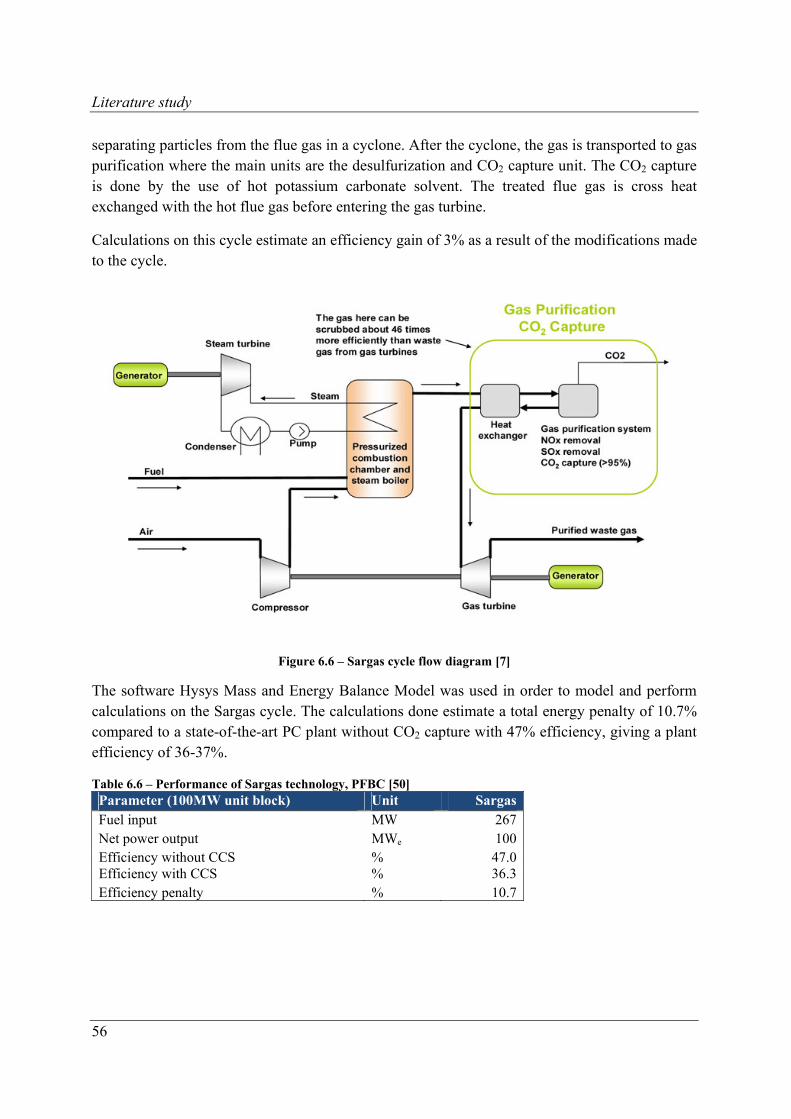
Literature study
56
separating particles from the flue gas in a cyclone. After the cyclone, the gas is transported to gas purification where the main units are the desulfurization and CO2 capture unit. The CO2 capture is done by the use of hot potassium carbonate solvent. The treated flue gas is cross heat exchanged with the hot flue gas before entering the gas turbine.
Calculations on this cycle estimate an efficiency gain of 3% as a result of the modifications made to the cycle.
Figure 6.6 – Sargas cycle flow diagram [7]
The software Hysys Mass and Energy Balance Model was used in order to model and perform calculations on the Sargas cycle. The calculations done estimate a total energy penalty of 10.7% compared to a state-of-the-art PC plant without CO2 capture with 47% efficiency, giving a plant efficiency of 36-37%.
Table 6.6 – Performance of Sargas technology, PFBC [50] Parameter (100MW unit block) Unit Sargas Fuel input MW 267Net power output MWe 100Efficiency without CCS % 47.0Efficiency with CCS % 36.3Efficiency penalty % 10.7
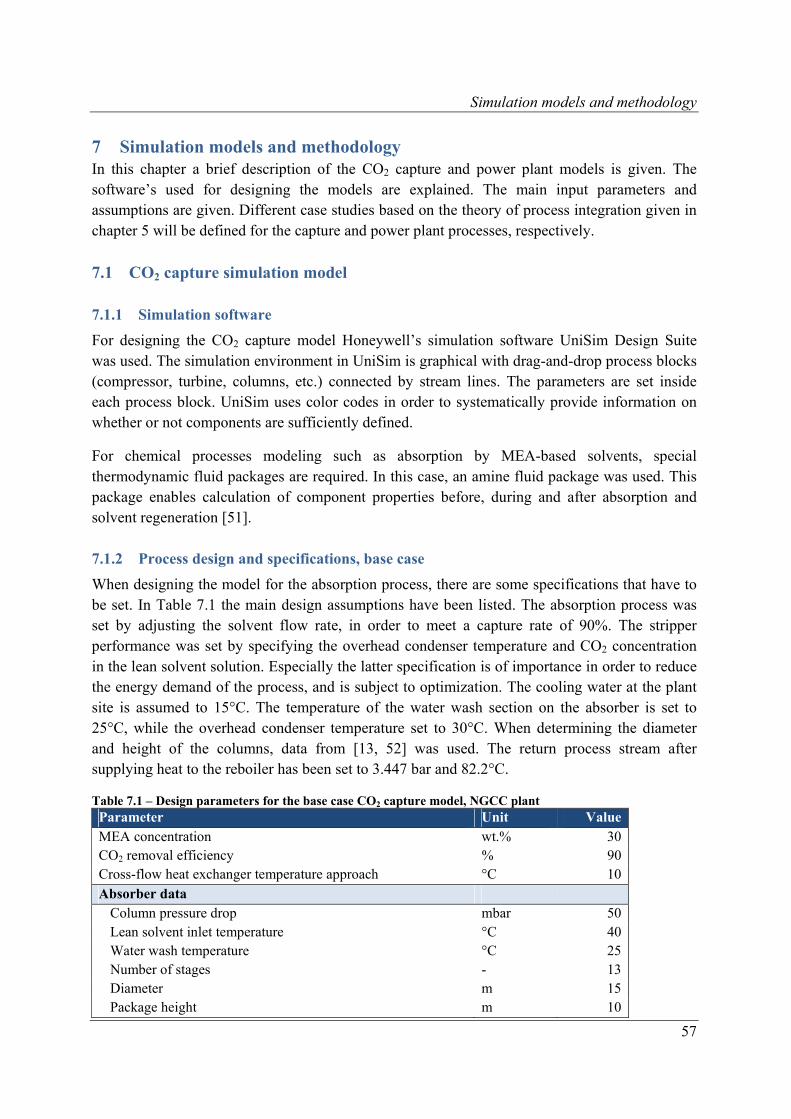
Simulation models and methodology
57
7 Simulation models and methodology In this chapter a brief description of the CO2 capture and power plant models is given. The software’s used for designing the models are explained. The main input parameters and assumptions are given. Different case studies based on the theory of process integration given in chapter 5 will be defined for the capture and power plant processes, respectively.
7.1 CO2 capture simulation model
7.1.1 Simulation software
For designing the CO2 capture model Honeywell’s simulation software UniSim Design Suite was used. The simulation environment in UniSim is graphical with drag-and-drop process blocks (compressor, turbine, columns, etc.) connected by stream lines. The parameters are set inside each process block. UniSim uses color codes in order to systematically provide information on whether or not components are sufficiently defined.
For chemical processes modeling such as absorption by MEA-based solvents, special thermodynamic fluid packages are required. In this case, an amine fluid package was used. This package enables calculation of component properties before, during and after absorption and solvent regeneration [51].
7.1.2 Process design and specifications, base case
When designing the model for the absorption process, there are some specifications that have to be set. In Table 7.1 the main design assumptions have been listed. The absorption process was set by adjusting the solvent flow rate, in order to meet a capture rate of 90%. The stripper performance was set by specifying the overhead condenser temperature and CO2 concentration in the lean solvent solution. Especially the latter specification is of importance in order to reduce the energy demand of the process, and is subject to optimization. The cooling water at the plant site is assumed to 15°C. The temperature of the water wash section on the absorber is set to 25°C, while the overhead condenser temperature set to 30°C. When determining the diameter and height of the columns, data from [13, 52] was used. The return process stream after supplying heat to the reboiler has been set to 3.447 bar and 82.2°C.
Table 7.1 – Design parameters for the base case CO2 capture model, NGCC plant Parameter Unit Value MEA concentration wt.% 30 CO2 removal efficiency % 90 Cross-flow heat exchanger temperature approach °C 10 Absorber data
Column pressure drop mbar 50 Lean solvent inlet temperature °C 40 Water wash temperature °C 25 Number of stages - 13 Diameter m 15 Package height m 10
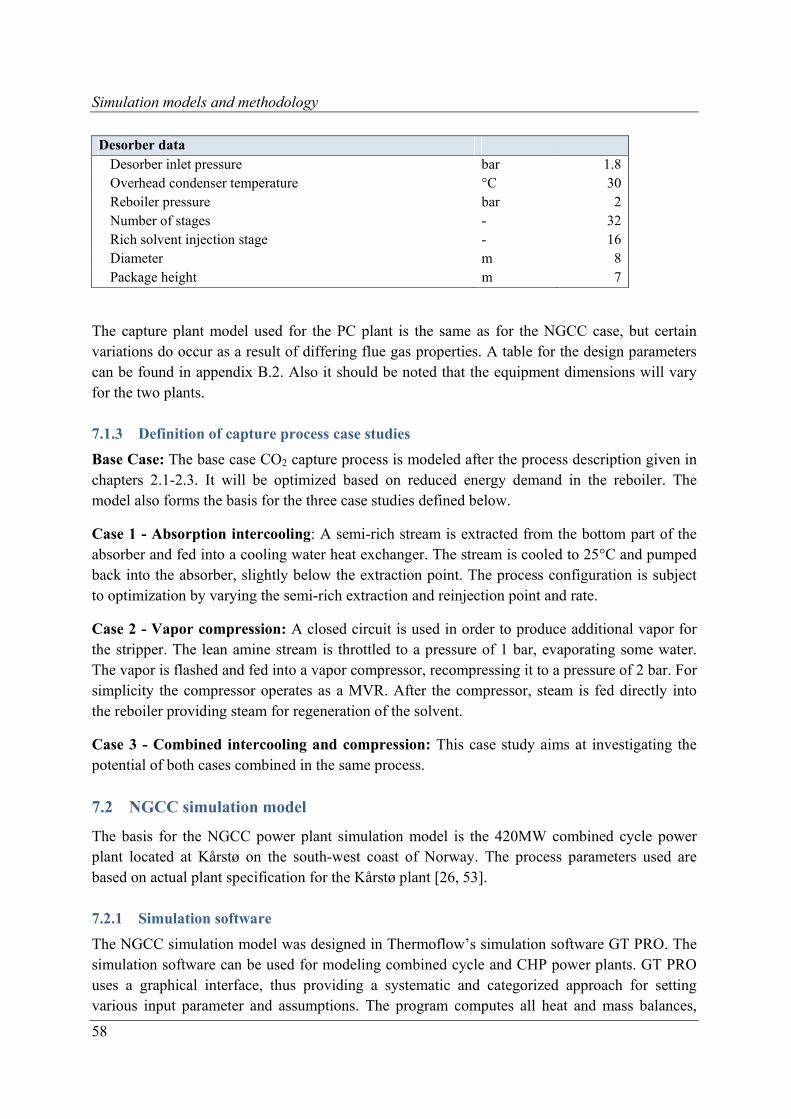
Simulation models and methodology
58
Desorber data Desorber inlet pressure bar 1.8 Overhead condenser temperature °C 30 Reboiler pressure bar 2 Number of stages - 32 Rich solvent injection stage - 16 Diameter m 8 Package height m 7
The capture plant model used for the PC plant is the same as for the NGCC case, but certain variations do occur as a result of differing flue gas properties. A table for the design parameters can be found in appendix B.2. Also it should be noted that the equipment dimensions will vary for the two plants.
7.1.3 Definition of capture process case studies
Base Case: The base case CO2 capture process is modeled after the process description given in chapters 2.1-2.3. It will be optimized based on reduced energy demand in the reboiler. The model also forms the basis for the three case studies defined below.
Case 1 - Absorption intercooling: A semi-rich stream is extracted from the bottom part of the absorber and fed into a cooling water heat exchanger. The stream is cooled to 25°C and pumped back into the absorber, slightly below the extraction point. The process configuration is subject to optimization by varying the semi-rich extraction and reinjection point and rate.
Case 2 - Vapor compression: A closed circuit is used in order to produce additional vapor for the stripper. The lean amine stream is throttled to a pressure of 1 bar, evaporating some water. The vapor is flashed and fed into a vapor compressor, recompressing it to a pressure of 2 bar. For simplicity the compressor operates as a MVR. After the compressor, steam is fed directly into the reboiler providing steam for regeneration of the solvent.
Case 3 - Combined intercooling and compression: This case study aims at investigating the potential of both cases combined in the same process.
7.2 NGCC simulation model
The basis for the NGCC power plant simulation model is the 420MW combined cycle power plant located at Kårstø on the south-west coast of Norway. The process parameters used are based on actual plant specification for the Kårstø plant [26, 53].
7.2.1 Simulation software
The NGCC simulation model was designed in Thermoflow’s simulation software GT PRO. The simulation software can be used for modeling combined cycle and CHP power plants. GT PRO uses a graphical interface, thus providing a systematic and categorized approach for setting various input parameter and assumptions. The program computes all heat and mass balances,
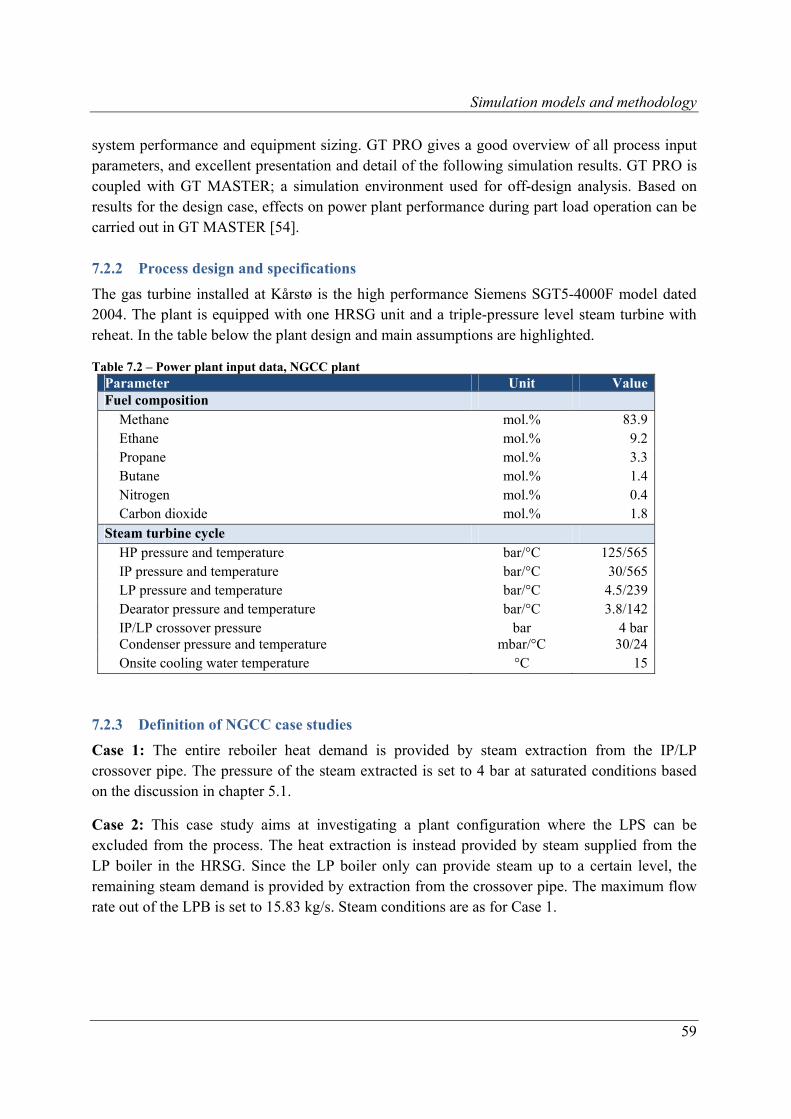
Simulation models and methodology
59
system performance and equipment sizing. GT PRO gives a good overview of all process input parameters, and excellent presentation and detail of the following simulation results. GT PRO is coupled with GT MASTER; a simulation environment used for off-design analysis. Based on results for the design case, effects on power plant performance during part load operation can be carried out in GT MASTER [54].
7.2.2 Process design and specifications
The gas turbine installed at Kårstø is the high performance Siemens SGT5-4000F model dated 2004. The plant is equipped with one HRSG unit and a triple-pressure level steam turbine with reheat. In the table below the plant design and main assumptions are highlighted.
Table 7.2 – Power plant input data, NGCC plant Parameter Unit Value Fuel composition
Methane mol.% 83.9 Ethane mol.% 9.2 Propane mol.% 3.3 Butane mol.% 1.4 Nitrogen mol.% 0.4 Carbon dioxide mol.% 1.8
Steam turbine cycle HP pressure and temperature bar/°C 125/565 IP pressure and temperature bar/°C 30/565 LP pressure and temperature bar/°C 4.5/239 Dearator pressure and temperature bar/°C 3.8/142 IP/LP crossover pressure bar 4 bar Condenser pressure and temperature mbar/°C 30/24 Onsite cooling water temperature °C 15
7.2.3 Definition of NGCC case studies
Case 1: The entire reboiler heat demand is provided by steam extraction from the IP/LP crossover pipe. The pressure of the steam extracted is set to 4 bar at saturated conditions based on the discussion in chapter 5.1.
Case 2: This case study aims at investigating a plant configuration where the LPS can be excluded from the process. The heat extraction is instead provided by steam supplied from the LP boiler in the HRSG. Since the LP boiler only can provide steam up to a certain level, the remaining steam demand is provided by extraction from the crossover pipe. The maximum flow rate out of the LPB is set to 15.83 kg/s. Steam conditions are as for Case 1.
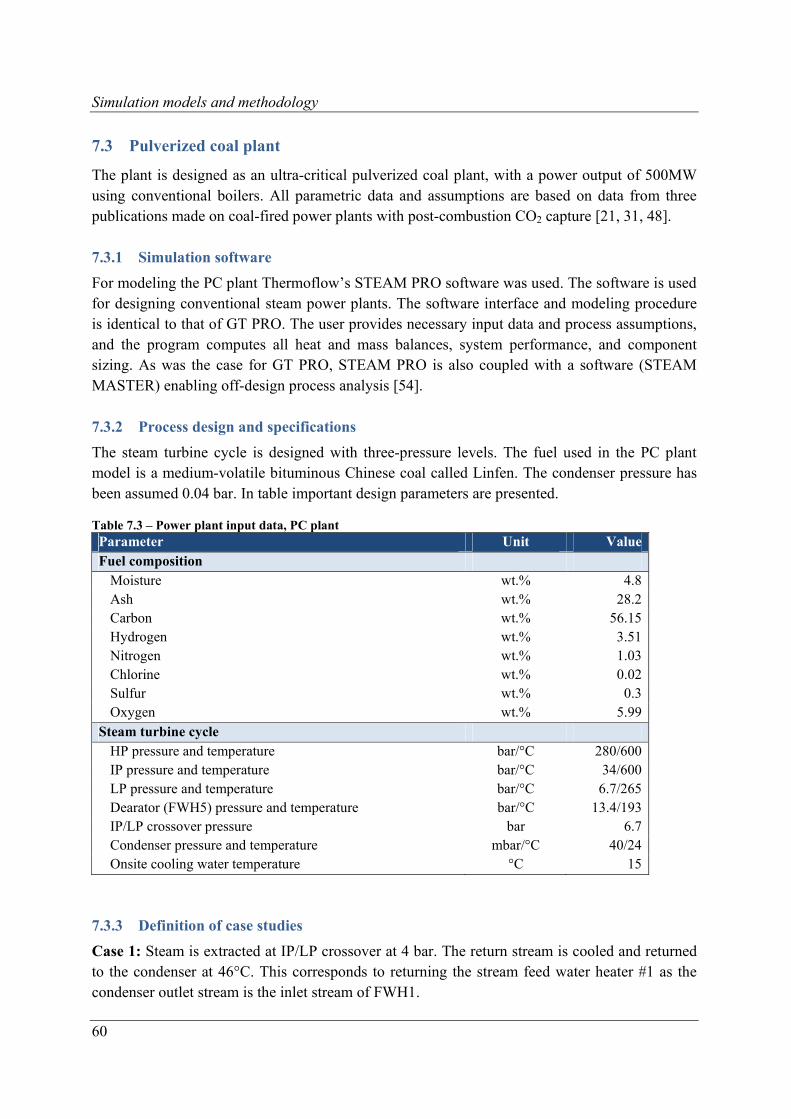
Simulation models and methodology
60
7.3 Pulverized coal plant
The plant is designed as an ultra-critical pulverized coal plant, with a power output of 500MW using conventional boilers. All parametric data and assumptions are based on data from three publications made on coal-fired power plants with post-combustion CO2 capture [21, 31, 48].
7.3.1 Simulation software
For modeling the PC plant Thermoflow’s STEAM PRO software was used. The software is used for designing conventional steam power plants. The software interface and modeling procedure is identical to that of GT PRO. The user provides necessary input data and process assumptions, and the program computes all heat and mass balances, system performance, and component sizing. As was the case for GT PRO, STEAM PRO is also coupled with a software (STEAM MASTER) enabling off-design process analysis [54].
7.3.2 Process design and specifications
The steam turbine cycle is designed with three-pressure levels. The fuel used in the PC plant model is a medium-volatile bituminous Chinese coal called Linfen. The condenser pressure has been assumed 0.04 bar. In table important design parameters are presented.
Table 7.3 – Power plant input data, PC plant Parameter Unit Value Fuel composition
Moisture wt.% 4.8 Ash wt.% 28.2 Carbon wt.% 56.15 Hydrogen wt.% 3.51 Nitrogen wt.% 1.03 Chlorine wt.% 0.02 Sulfur wt.% 0.3 Oxygen wt.% 5.99
Steam turbine cycle HP pressure and temperature bar/°C 280/600 IP pressure and temperature bar/°C 34/600 LP pressure and temperature bar/°C 6.7/265 Dearator (FWH5) pressure and temperature bar/°C 13.4/193 IP/LP crossover pressure bar 6.7 Condenser pressure and temperature mbar/°C 40/24 Onsite cooling water temperature °C 15
7.3.3 Definition of case studies
Case 1: Steam is extracted at IP/LP crossover at 4 bar. The return stream is cooled and returned to the condenser at 46°C. This corresponds to returning the stream feed water heater #1 as the condenser outlet stream is the inlet stream of FWH1.
Simulation models and methodology
61
Case 2: Steam is extracted at IP/LP crossover at 4 bar, and returned to feed water heater #2 at 3.447 bar and 82.22°C.
Case 3: Steam is extracted at IP/LP crossover at 4 bar, and returned to feed water heater #3 at 3.447 bar and 82.22°C.
7.4 Methodology
In the following chapter the results from the simulations will be presented and discussed. Since the report contains a substantial amount of different case studies, a point-by-point description of the simulation procedure is presented.
The two power plant processes without CO2 capture will be simulated in two base case models. The main reason for this is to establish baseline conditions that will be used when comparing the power plants with and without capture. In addition to this, flue gas properties are important input parameters required when performing simulations in the CO2 capture model.
The next step is to simulate the capture process. Based on the flue composition, flow rate, temperature, and pressure, base case capture models for coal and natural gas will be optimized with respect to reduced energy demand as defined in chapter 7.1.3. Due to a large amount of data and graphs, only the optimization procedure for the NGCC capture plant is presented. Data tables and figures for the coal plant are given in the appendix B.2.
Integration between plant and capture process for the power plants will be analyzed independently. It is placed emphasis on variations in heat demand of the capture process as future energy savings are expected. This section also focuses on how the power plants operate when integrated with the four capture case studies. Microsoft Excel will be used in order to couple the results from the power plants and capture process simulations.
Behavior at part load operation for all three processes (NGCC, PC, and capture process) will be carried out. For both power plants the reboiler duty, mechanical work, and CO2 compression work are assumed constant for all loads. The reboiler duty was set to 3.75 MJ/kg CO2 for the NGCC plant and 3.65 MJ/kg CO2 for the PC plant.
A comparison based on other integration literature studies will be made, in order to determine the validity of the results.
Recommendations based on the results presented are given in the last part of the chapter.

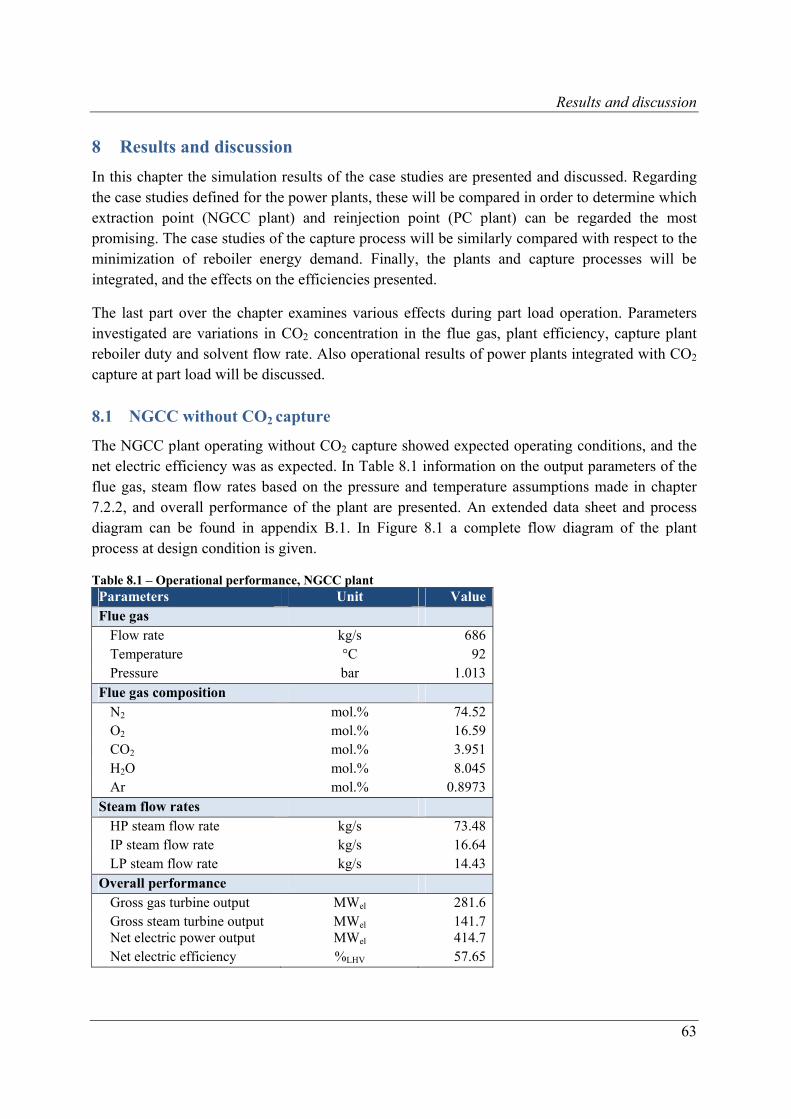
Results and discussion
63
8 Results and discussion
In this chapter the simulation results of the case studies are presented and discussed. Regarding the case studies defined for the power plants, these will be compared in order to determine which extraction point (NGCC plant) and reinjection point (PC plant) can be regarded the most promising. The case studies of the capture process will be similarly compared with respect to the minimization of reboiler energy demand. Finally, the plants and capture processes will be integrated, and the effects on the efficiencies presented.
The last part over the chapter examines various effects during part load operation. Parameters investigated are variations in CO2 concentration in the flue gas, plant efficiency, capture plant reboiler duty and solvent flow rate. Also operational results of power plants integrated with CO2 capture at part load will be discussed.
8.1 NGCC without CO2 capture
The NGCC plant operating without CO2 capture showed expected operating conditions, and the net electric efficiency was as expected. In Table 8.1 information on the output parameters of the flue gas, steam flow rates based on the pressure and temperature assumptions made in chapter 7.2.2, and overall performance of the plant are presented. An extended data sheet and process diagram can be found in appendix B.1. In Figure 8.1 a complete flow diagram of the plant process at design condition is given.
Table 8.1 – Operational performance, NGCC plant Parameters Unit ValueFlue gas
Flow rate kg/s 686Temperature °C 92Pressure bar 1.013
Flue gas composition N2 mol.% 74.52O2 mol.% 16.59CO2 mol.% 3.951H2O mol.% 8.045Ar mol.% 0.8973
Steam flow rates HP steam flow rate kg/s 73.48IP steam flow rate kg/s 16.64 LP steam flow rate kg/s 14.43
Overall performance Gross gas turbine output MWel 281.6Gross steam turbine output MWel 141.7 Net electric power output MWel 414.7Net electric efficiency %LHV 57.65
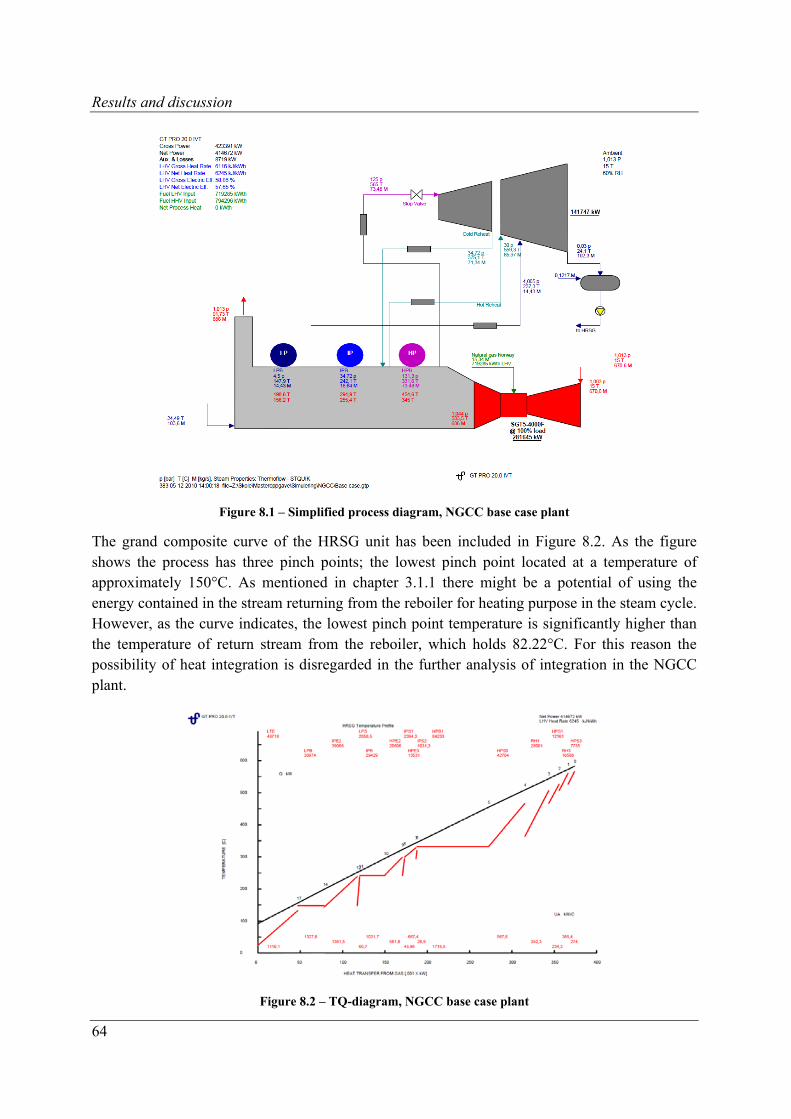
Results and discussion
64
Figure 8.1 – Simplified process diagram, NGCC base case plant
The grand composite curve of the HRSG unit has been included in Figure 8.2. As the figure shows the process has three pinch points; the lowest pinch point located at a temperature of approximately 150°C. As mentioned in chapter 3.1.1 there might be a potential of using the energy contained in the stream returning from the reboiler for heating purpose in the steam cycle. However, as the curve indicates, the lowest pinch point temperature is significantly higher than the temperature of return stream from the reboiler, which holds 82.22°C. For this reason the possibility of heat integration is disregarded in the further analysis of integration in the NGCC plant.
Figure 8.2 – TQ-diagram, NGCC base case plant
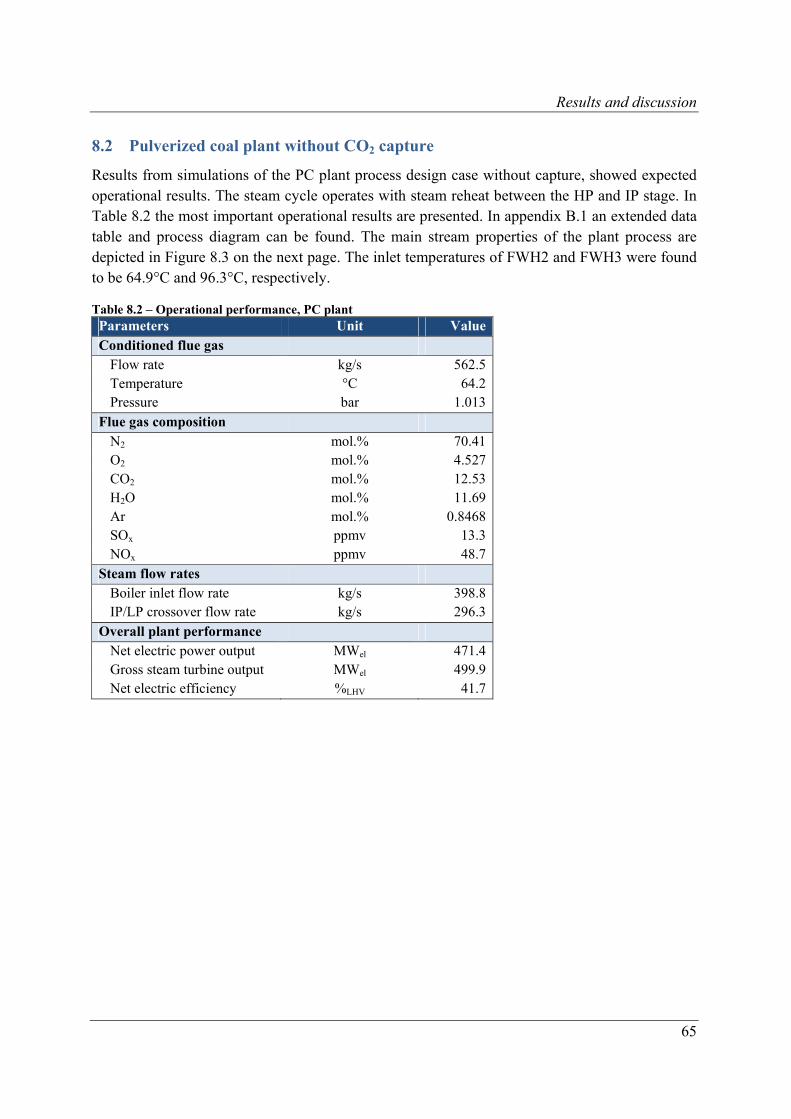
Results and discussion
65
8.2 Pulverized coal plant without CO2 capture
Results from simulations of the PC plant process design case without capture, showed expected operational results. The steam cycle operates with steam reheat between the HP and IP stage. In Table 8.2 the most important operational results are presented. In appendix B.1 an extended data table and process diagram can be found. The main stream properties of the plant process are depicted in Figure 8.3 on the next page. The inlet temperatures of FWH2 and FWH3 were found to be 64.9°C and 96.3°C, respectively.
Table 8.2 – Operational performance, PC plant Parameters Unit ValueConditioned flue gas
Flow rate kg/s 562.5Temperature °C 64.2Pressure bar 1.013
Flue gas composition N2 mol.% 70.41O2 mol.% 4.527CO2 mol.% 12.53H2O mol.% 11.69Ar mol.% 0.8468SOx ppmv 13.3NOx ppmv 48.7
Steam flow rates Boiler inlet flow rate kg/s 398.8IP/LP crossover flow rate kg/s 296.3
Overall plant performance Net electric power output MWel 471.4Gross steam turbine output MWel 499.9Net electric efficiency %LHV 41.7
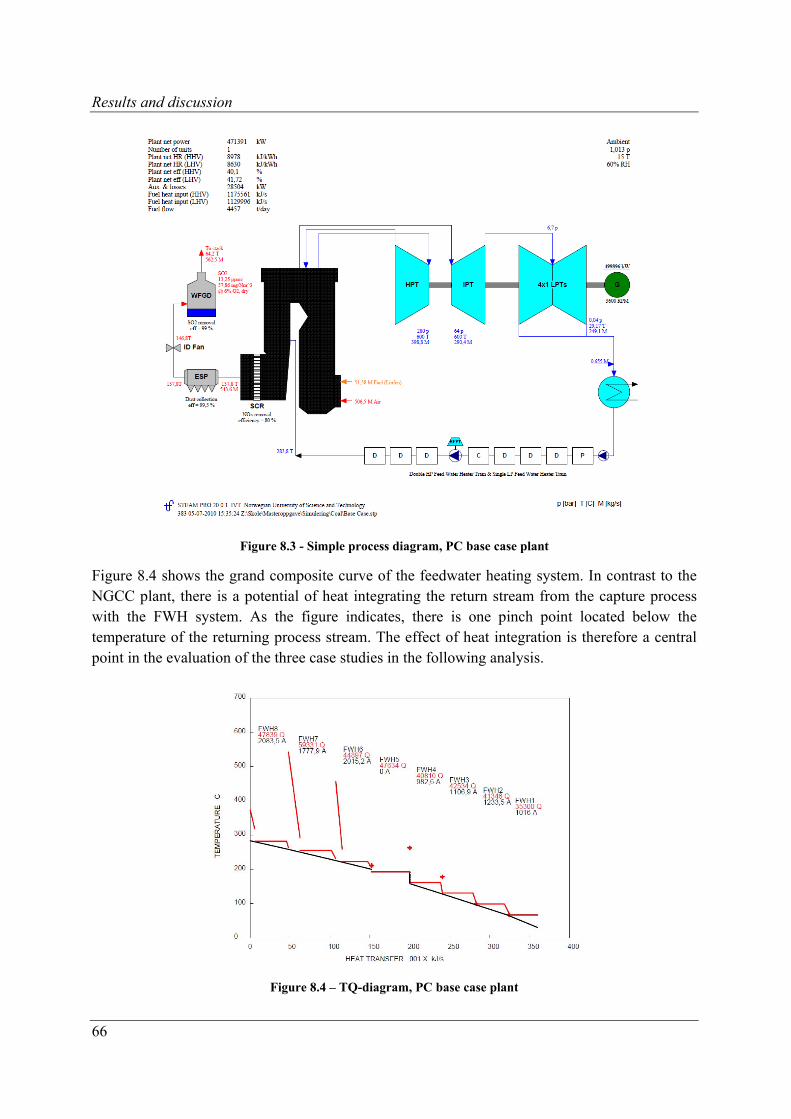
Results and discussion
66
Figure 8.3 - Simple process diagram, PC base case plant
Figure 8.4 shows the grand composite curve of the feedwater heating system. In contrast to the NGCC plant, there is a potential of heat integrating the return stream from the capture process with the FWH system. As the figure indicates, there is one pinch point located below the temperature of the returning process stream. The effect of heat integration is therefore a central point in the evaluation of the three case studies in the following analysis.
Figure 8.4 – TQ-diagram, PC base case plant
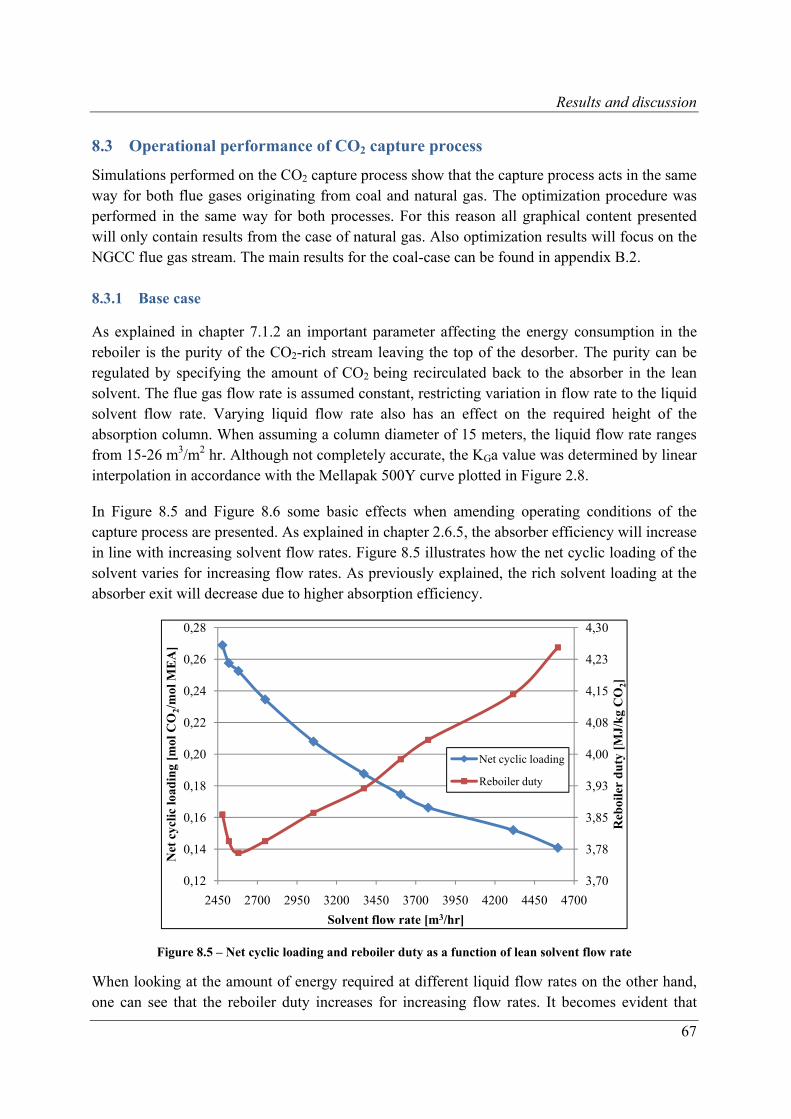
Results and discussion
67
8.3 Operational performance of CO2 capture process
Simulations performed on the CO2 capture process show that the capture process acts in the same way for both flue gases originating from coal and natural gas. The optimization procedure was performed in the same way for both processes. For this reason all graphical content presented will only contain results from the case of natural gas. Also optimization results will focus on the NGCC flue gas stream. The main results for the coal-case can be found in appendix B.2.
8.3.1 Base case
As explained in chapter 7.1.2 an important parameter affecting the energy consumption in the reboiler is the purity of the CO2-rich stream leaving the top of the desorber. The purity can be regulated by specifying the amount of CO2 being recirculated back to the absorber in the lean solvent. The flue gas flow rate is assumed constant, restricting variation in flow rate to the liquid solvent flow rate. Varying liquid flow rate also has an effect on the required height of the absorption column. When assuming a column diameter of 15 meters, the liquid flow rate ranges from 15-26 m3/m2 hr. Although not completely accurate, the KGa value was determined by linear interpolation in accordance with the Mellapak 500Y curve plotted in Figure 2.8.
In Figure 8.5 and Figure 8.6 some basic effects when amending operating conditions of the capture process are presented. As explained in chapter 2.6.5, the absorber efficiency will increase in line with increasing solvent flow rates. Figure 8.5 illustrates how the net cyclic loading of the solvent varies for increasing flow rates. As previously explained, the rich solvent loading at the absorber exit will decrease due to higher absorption efficiency.
Figure 8.5 – Net cyclic loading and reboiler duty as a function of lean solvent flow rate
When looking at the amount of energy required at different liquid flow rates on the other hand, one can see that the reboiler duty increases for increasing flow rates. It becomes evident that
3,70
3,78
3,85
3,93
4,00
4,08
4,15
4,23
4,30
0,12
0,14
0,16
0,18
0,20
0,22
0,24
0,26
0,28
2450 2700 2950 3200 3450 3700 3950 4200 4450 4700
Reb
oile
r d
uty
[M
J/k
g C
O2]
Net
cyc
lic lo
adin
g [m
ol C
O2/
mol
ME
A]
Solvent flow rate [m3/hr]
Net cyclic loading
Reboiler duty
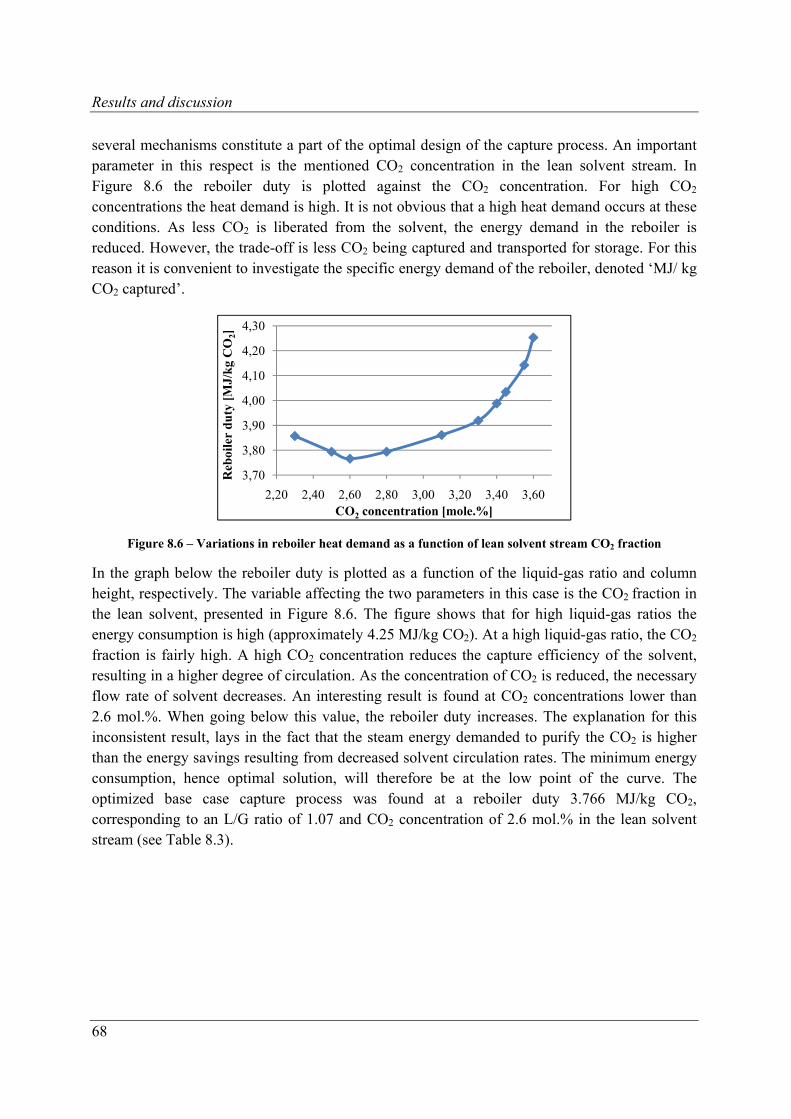
Results and discussion
68
several mechanisms constitute a part of the optimal design of the capture process. An important parameter in this respect is the mentioned CO2 concentration in the lean solvent stream. In Figure 8.6 the reboiler duty is plotted against the CO2 concentration. For high CO2 concentrations the heat demand is high. It is not obvious that a high heat demand occurs at these conditions. As less CO2 is liberated from the solvent, the energy demand in the reboiler is reduced. However, the trade-off is less CO2 being captured and transported for storage. For this reason it is convenient to investigate the specific energy demand of the reboiler, denoted ‘MJ/ kg CO2 captured’.
Figure 8.6 – Variations in reboiler heat demand as a function of lean solvent stream CO2 fraction
In the graph below the reboiler duty is plotted as a function of the liquid-gas ratio and column height, respectively. The variable affecting the two parameters in this case is the CO2 fraction in the lean solvent, presented in Figure 8.6. The figure shows that for high liquid-gas ratios the energy consumption is high (approximately 4.25 MJ/kg CO2). At a high liquid-gas ratio, the CO2 fraction is fairly high. A high CO2 concentration reduces the capture efficiency of the solvent, resulting in a higher degree of circulation. As the concentration of CO2 is reduced, the necessary flow rate of solvent decreases. An interesting result is found at CO2 concentrations lower than 2.6 mol.%. When going below this value, the reboiler duty increases. The explanation for this inconsistent result, lays in the fact that the steam energy demanded to purify the CO2 is higher than the energy savings resulting from decreased solvent circulation rates. The minimum energy consumption, hence optimal solution, will therefore be at the low point of the curve. The optimized base case capture process was found at a reboiler duty 3.766 MJ/kg CO2, corresponding to an L/G ratio of 1.07 and CO2 concentration of 2.6 mol.% in the lean solvent stream (see Table 8.3).
3,70
3,80
3,90
4,00
4,10
4,20
4,30
2,20 2,40 2,60 2,80 3,00 3,20 3,40 3,60
Reb
oile
r d
uty
[M
J/k
g C
O2]
CO2 concentration [mole.%]
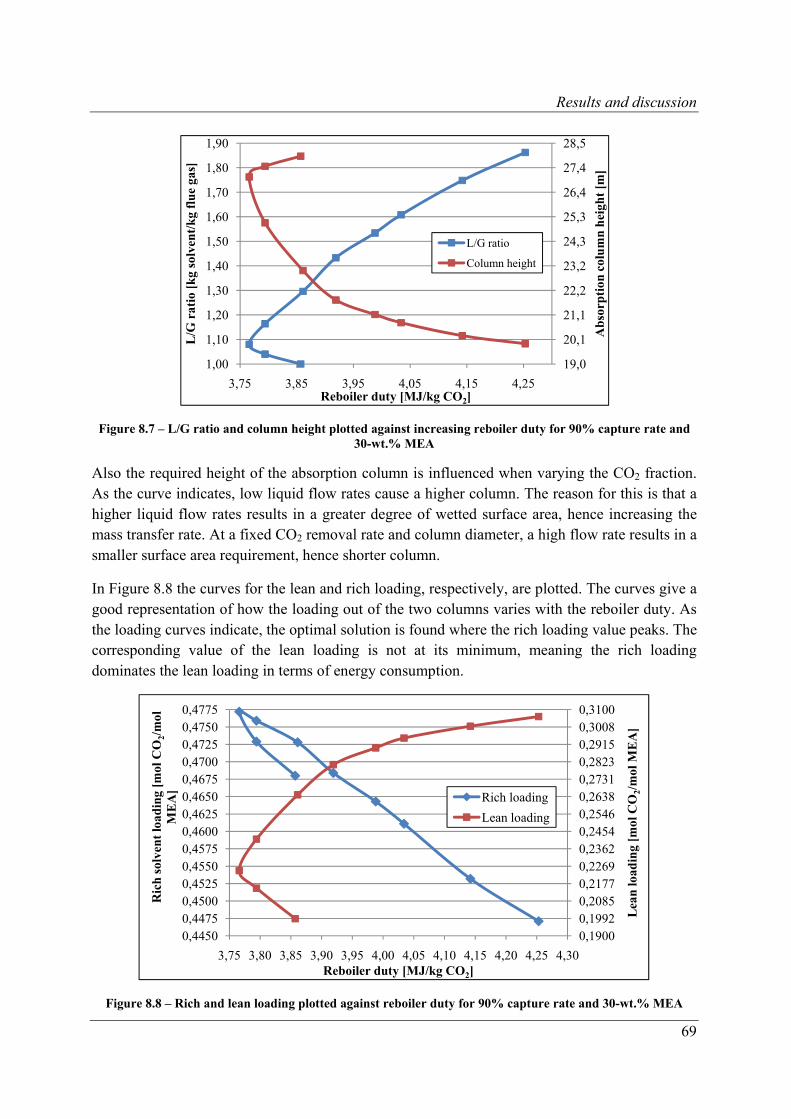
Results and discussion
69
Figure 8.7 – L/G ratio and column height plotted against increasing reboiler duty for 90% capture rate and 30-wt.% MEA
Also the required height of the absorption column is influenced when varying the CO2 fraction. As the curve indicates, low liquid flow rates cause a higher column. The reason for this is that a higher liquid flow rates results in a greater degree of wetted surface area, hence increasing the mass transfer rate. At a fixed CO2 removal rate and column diameter, a high flow rate results in a smaller surface area requirement, hence shorter column.
In Figure 8.8 the curves for the lean and rich loading, respectively, are plotted. The curves give a good representation of how the loading out of the two columns varies with the reboiler duty. As the loading curves indicate, the optimal solution is found where the rich loading value peaks. The corresponding value of the lean loading is not at its minimum, meaning the rich loading dominates the lean loading in terms of energy consumption.
Figure 8.8 – Rich and lean loading plotted against reboiler duty for 90% capture rate and 30-wt.% MEA
19,0
20,1
21,1
22,2
23,2
24,3
25,3
26,4
27,4
28,5
1,00
1,10
1,20
1,30
1,40
1,50
1,60
1,70
1,80
1,90
3,75 3,85 3,95 4,05 4,15 4,25
Ab
sorp
tion
col
um
n h
eigh
t [m
]
L/G
rat
io [
kg
solv
ent/
kg
flu
e ga
s]
Reboiler duty [MJ/kg CO2]
L/G ratio
Column height
0,19000,19920,20850,21770,22690,23620,24540,25460,26380,27310,28230,29150,30080,3100
0,44500,44750,45000,45250,45500,45750,46000,46250,46500,46750,47000,47250,47500,4775
3,75 3,80 3,85 3,90 3,95 4,00 4,05 4,10 4,15 4,20 4,25 4,30
Lea
n lo
adin
g [m
ol C
O2/
mol
ME
A]
Ric
h s
olve
nt
load
ing
[mol
CO
2/m
ol
ME
A]
Reboiler duty [MJ/kg CO2]
Rich loading
Lean loading
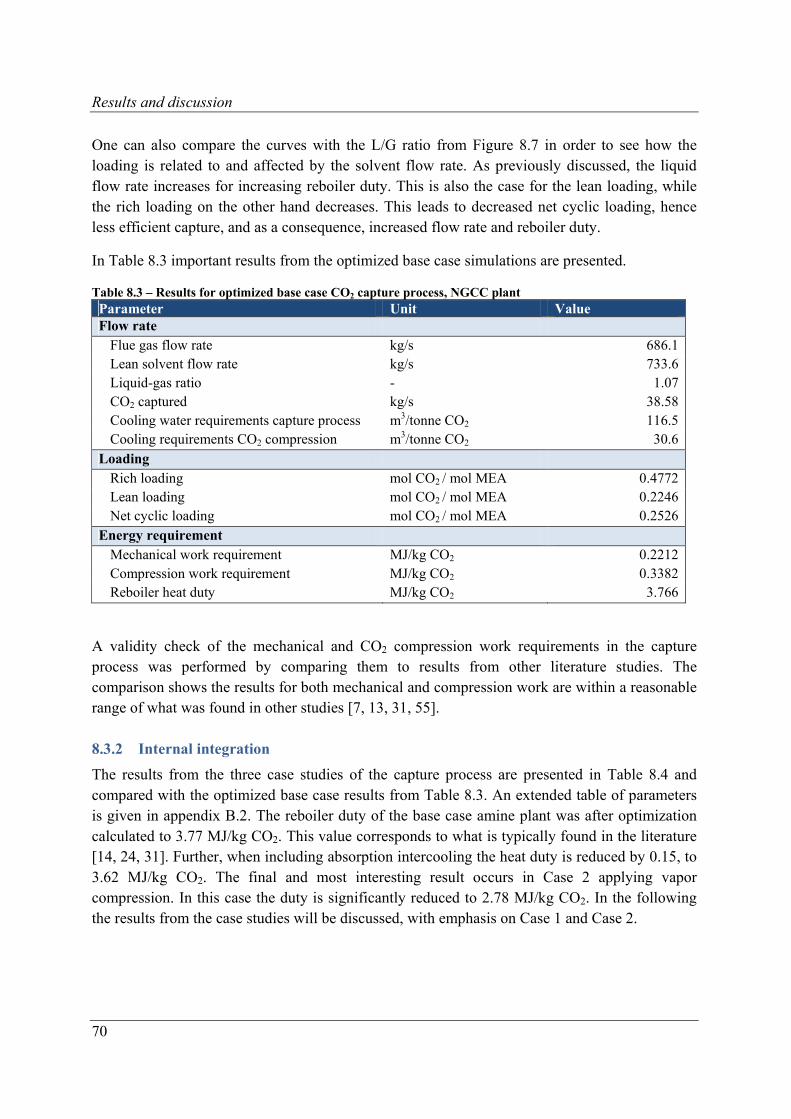
Results and discussion
70
One can also compare the curves with the L/G ratio from Figure 8.7 in order to see how the loading is related to and affected by the solvent flow rate. As previously discussed, the liquid flow rate increases for increasing reboiler duty. This is also the case for the lean loading, while the rich loading on the other hand decreases. This leads to decreased net cyclic loading, hence less efficient capture, and as a consequence, increased flow rate and reboiler duty.
In Table 8.3 important results from the optimized base case simulations are presented.
Table 8.3 – Results for optimized base case CO2 capture process, NGCC plant Parameter Unit Value Flow rate
Flue gas flow rate kg/s 686.1Lean solvent flow rate kg/s 733.6Liquid-gas ratio - 1.07CO2 captured kg/s 38.58Cooling water requirements capture process m3/tonne CO2 116.5Cooling requirements CO2 compression m3/tonne CO2 30.6
Loading Rich loading mol CO2 / mol MEA 0.4772Lean loading mol CO2 / mol MEA 0.2246Net cyclic loading mol CO2 / mol MEA 0.2526
Energy requirement Mechanical work requirement MJ/kg CO2 0.2212Compression work requirement MJ/kg CO2 0.3382Reboiler heat duty MJ/kg CO2 3.766
A validity check of the mechanical and CO2 compression work requirements in the capture process was performed by comparing them to results from other literature studies. The comparison shows the results for both mechanical and compression work are within a reasonable range of what was found in other studies [7, 13, 31, 55].
8.3.2 Internal integration
The results from the three case studies of the capture process are presented in Table 8.4 and compared with the optimized base case results from Table 8.3. An extended table of parameters is given in appendix B.2. The reboiler duty of the base case amine plant was after optimization calculated to 3.77 MJ/kg CO2. This value corresponds to what is typically found in the literature [14, 24, 31]. Further, when including absorption intercooling the heat duty is reduced by 0.15, to 3.62 MJ/kg CO2. The final and most interesting result occurs in Case 2 applying vapor compression. In this case the duty is significantly reduced to 2.78 MJ/kg CO2. In the following the results from the case studies will be discussed, with emphasis on Case 1 and Case 2.
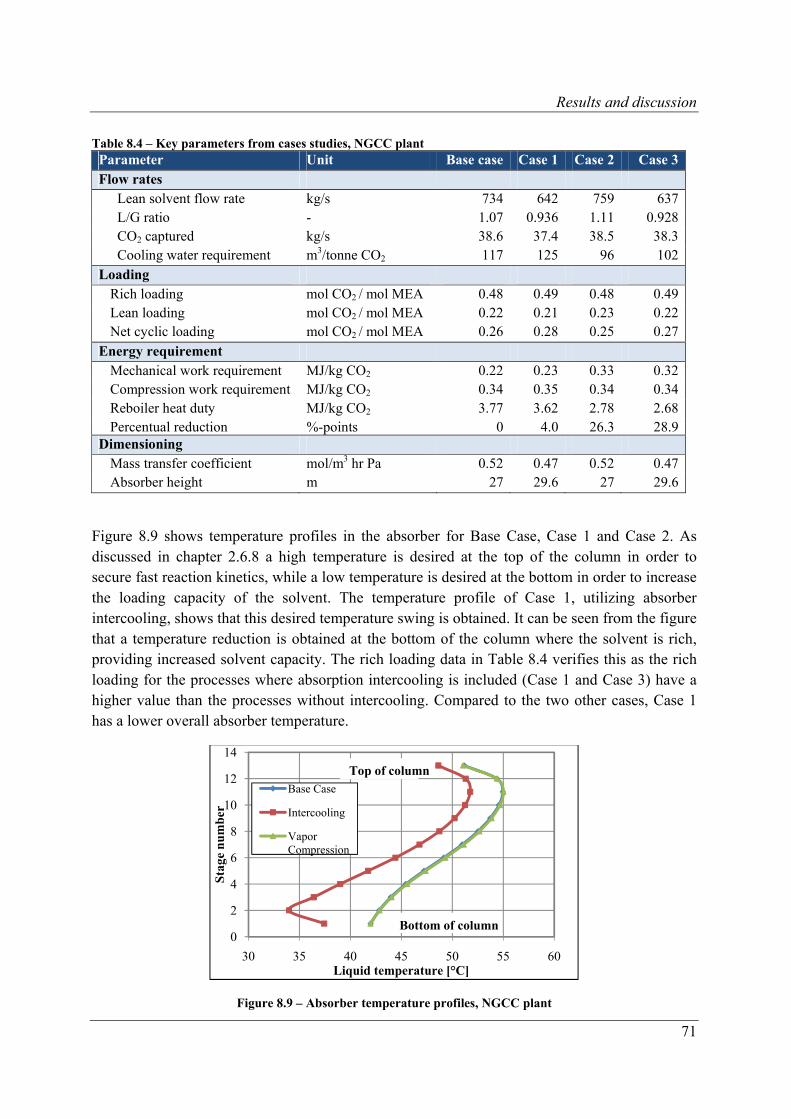
Results and discussion
71
Table 8.4 – Key parameters from cases studies, NGCC plant Parameter Unit Base case Case 1 Case 2 Case 3Flow rates
Lean solvent flow rate kg/s 734 642 759 637 L/G ratio - 1.07 0.936 1.11 0.928 CO2 captured kg/s 38.6 37.4 38.5 38.3 Cooling water requirement m3/tonne CO2 117 125 96 102
Loading Rich loading mol CO2 / mol MEA 0.48 0.49 0.48 0.49Lean loading mol CO2 / mol MEA 0.22 0.21 0.23 0.22Net cyclic loading mol CO2 / mol MEA 0.26 0.28 0.25 0.27
Energy requirement Mechanical work requirement MJ/kg CO2 0.22 0.23 0.33 0.32Compression work requirement MJ/kg CO2 0.34 0.35 0.34 0.34Reboiler heat duty MJ/kg CO2 3.77 3.62 2.78 2.68Percentual reduction %-points 0 4.0 26.3 28.9
Dimensioning Mass transfer coefficient mol/m3 hr Pa 0.52 0.47 0.52 0.47Absorber height m 27 29.6 27 29.6
Figure 8.9 shows temperature profiles in the absorber for Base Case, Case 1 and Case 2. As discussed in chapter 2.6.8 a high temperature is desired at the top of the column in order to secure fast reaction kinetics, while a low temperature is desired at the bottom in order to increase the loading capacity of the solvent. The temperature profile of Case 1, utilizing absorber intercooling, shows that this desired temperature swing is obtained. It can be seen from the figure that a temperature reduction is obtained at the bottom of the column where the solvent is rich, providing increased solvent capacity. The rich loading data in Table 8.4 verifies this as the rich loading for the processes where absorption intercooling is included (Case 1 and Case 3) have a higher value than the processes without intercooling. Compared to the two other cases, Case 1 has a lower overall absorber temperature.
Figure 8.9 – Absorber temperature profiles, NGCC plant
0
2
4
6
8
10
12
14
30 35 40 45 50 55 60
Sta
ge n
um
ber
Liquid temperature [°C]
Base Case
Intercooling
Vapor Compression
Bottom of column
Top of column
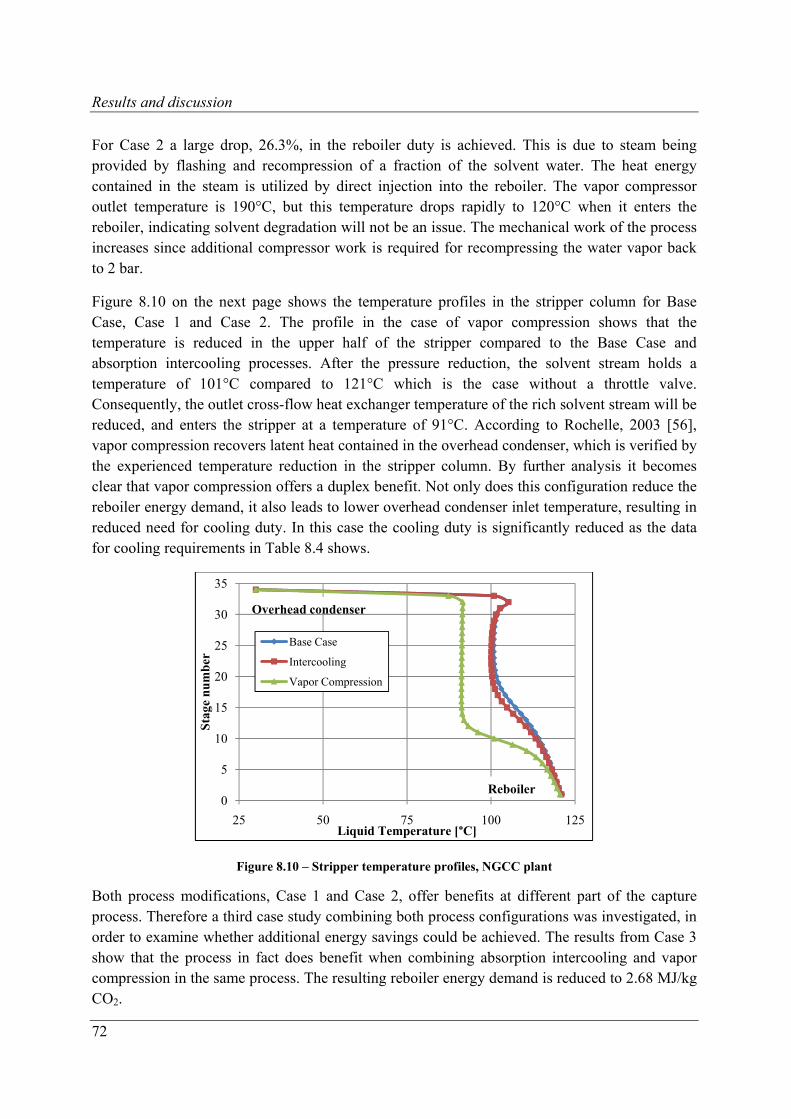
Results and discussion
72
For Case 2 a large drop, 26.3%, in the reboiler duty is achieved. This is due to steam being provided by flashing and recompression of a fraction of the solvent water. The heat energy contained in the steam is utilized by direct injection into the reboiler. The vapor compressor outlet temperature is 190°C, but this temperature drops rapidly to 120°C when it enters the reboiler, indicating solvent degradation will not be an issue. The mechanical work of the process increases since additional compressor work is required for recompressing the water vapor back to 2 bar.
Figure 8.10 on the next page shows the temperature profiles in the stripper column for Base Case, Case 1 and Case 2. The profile in the case of vapor compression shows that the temperature is reduced in the upper half of the stripper compared to the Base Case and absorption intercooling processes. After the pressure reduction, the solvent stream holds a temperature of 101°C compared to 121°C which is the case without a throttle valve. Consequently, the outlet cross-flow heat exchanger temperature of the rich solvent stream will be reduced, and enters the stripper at a temperature of 91°C. According to Rochelle, 2003 [56], vapor compression recovers latent heat contained in the overhead condenser, which is verified by the experienced temperature reduction in the stripper column. By further analysis it becomes clear that vapor compression offers a duplex benefit. Not only does this configuration reduce the reboiler energy demand, it also leads to lower overhead condenser inlet temperature, resulting in reduced need for cooling duty. In this case the cooling duty is significantly reduced as the data for cooling requirements in Table 8.4 shows.
Figure 8.10 – Stripper temperature profiles, NGCC plant
Both process modifications, Case 1 and Case 2, offer benefits at different part of the capture process. Therefore a third case study combining both process configurations was investigated, in order to examine whether additional energy savings could be achieved. The results from Case 3 show that the process in fact does benefit when combining absorption intercooling and vapor compression in the same process. The resulting reboiler energy demand is reduced to 2.68 MJ/kg CO2.
0
5
10
15
20
25
30
35
25 50 75 100 125
Sta
ge n
um
ber
Liquid Temperature [°C]
Base Case
Intercooling
Vapor Compression
Reboiler
Overhead condenser
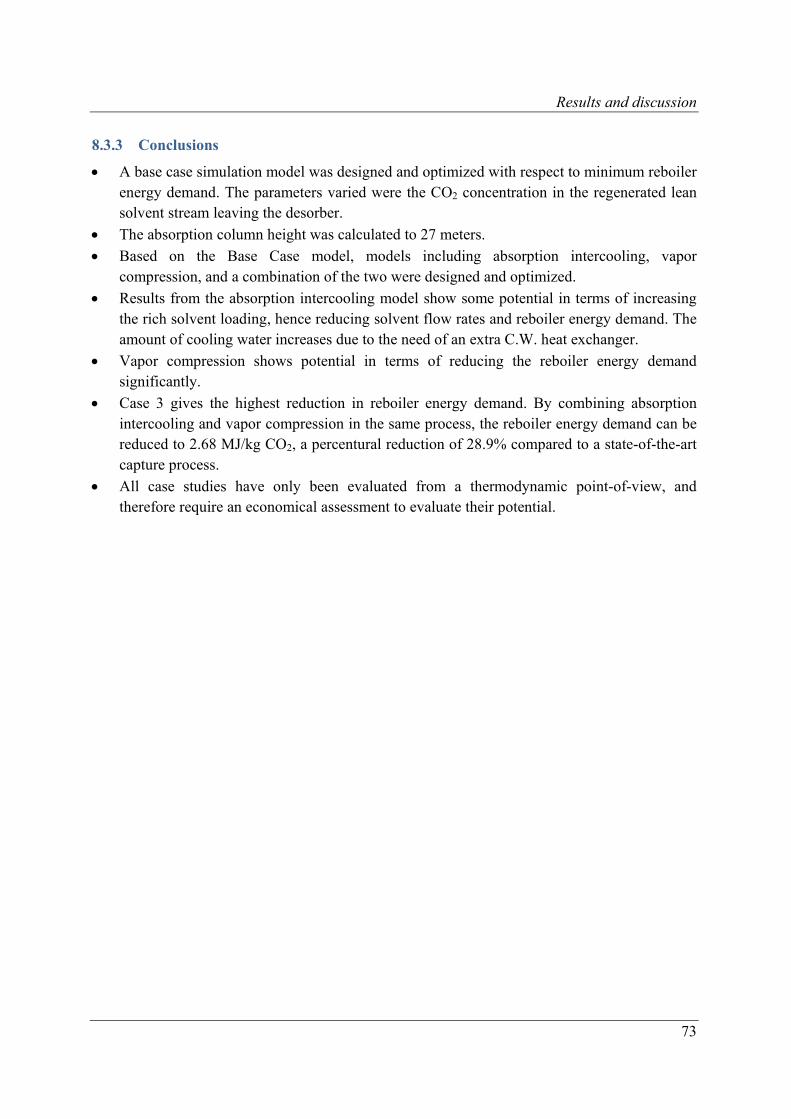
Results and discussion
73
8.3.3 Conclusions
A base case simulation model was designed and optimized with respect to minimum reboiler energy demand. The parameters varied were the CO2 concentration in the regenerated lean solvent stream leaving the desorber.
The absorption column height was calculated to 27 meters.
Based on the Base Case model, models including absorption intercooling, vapor compression, and a combination of the two were designed and optimized.
Results from the absorption intercooling model show some potential in terms of increasing the rich solvent loading, hence reducing solvent flow rates and reboiler energy demand. The amount of cooling water increases due to the need of an extra C.W. heat exchanger.
Vapor compression shows potential in terms of reducing the reboiler energy demand significantly.
Case 3 gives the highest reduction in reboiler energy demand. By combining absorption intercooling and vapor compression in the same process, the reboiler energy demand can be reduced to 2.68 MJ/kg CO2, a percentural reduction of 28.9% compared to a state-of-the-art capture process.
All case studies have only been evaluated from a thermodynamic point-of-view, and therefore require an economical assessment to evaluate their potential.
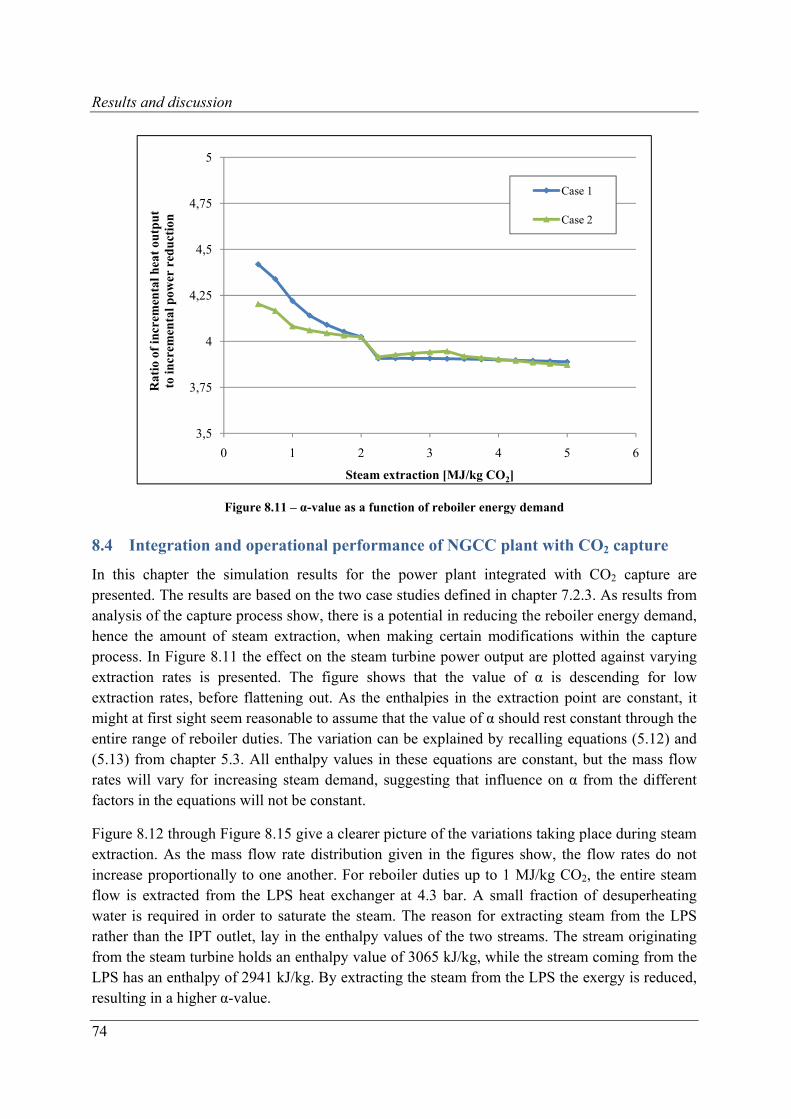
Results and discussion
74
Figure 8.11 – α-value as a function of reboiler energy demand
8.4 Integration and operational performance of NGCC plant with CO2 capture
In this chapter the simulation results for the power plant integrated with CO2 capture are presented. The results are based on the two case studies defined in chapter 7.2.3. As results from analysis of the capture process show, there is a potential in reducing the reboiler energy demand, hence the amount of steam extraction, when making certain modifications within the capture process. In Figure 8.11 the effect on the steam turbine power output are plotted against varying extraction rates is presented. The figure shows that the value of α is descending for low extraction rates, before flattening out. As the enthalpies in the extraction point are constant, it might at first sight seem reasonable to assume that the value of α should rest constant through the entire range of reboiler duties. The variation can be explained by recalling equations (5.12) and (5.13) from chapter 5.3. All enthalpy values in these equations are constant, but the mass flow rates will vary for increasing steam demand, suggesting that influence on α from the different factors in the equations will not be constant.
Figure 8.12 through Figure 8.15 give a clearer picture of the variations taking place during steam extraction. As the mass flow rate distribution given in the figures show, the flow rates do not increase proportionally to one another. For reboiler duties up to 1 MJ/kg CO2, the entire steam flow is extracted from the LPS heat exchanger at 4.3 bar. A small fraction of desuperheating water is required in order to saturate the steam. The reason for extracting steam from the LPS rather than the IPT outlet, lay in the enthalpy values of the two streams. The stream originating from the steam turbine holds an enthalpy value of 3065 kJ/kg, while the stream coming from the LPS has an enthalpy of 2941 kJ/kg. By extracting the steam from the LPS the exergy is reduced, resulting in a higher α-value.
3,5
3,75
4
4,25
4,5
4,75
5
0 1 2 3 4 5 6
Rat
io o
f in
crem
enta
l hea
t ou
tpu
t to
incr
emen
tal p
ower
red
uct
ion
Steam extraction [MJ/kg CO2]
Case 1
Case 2
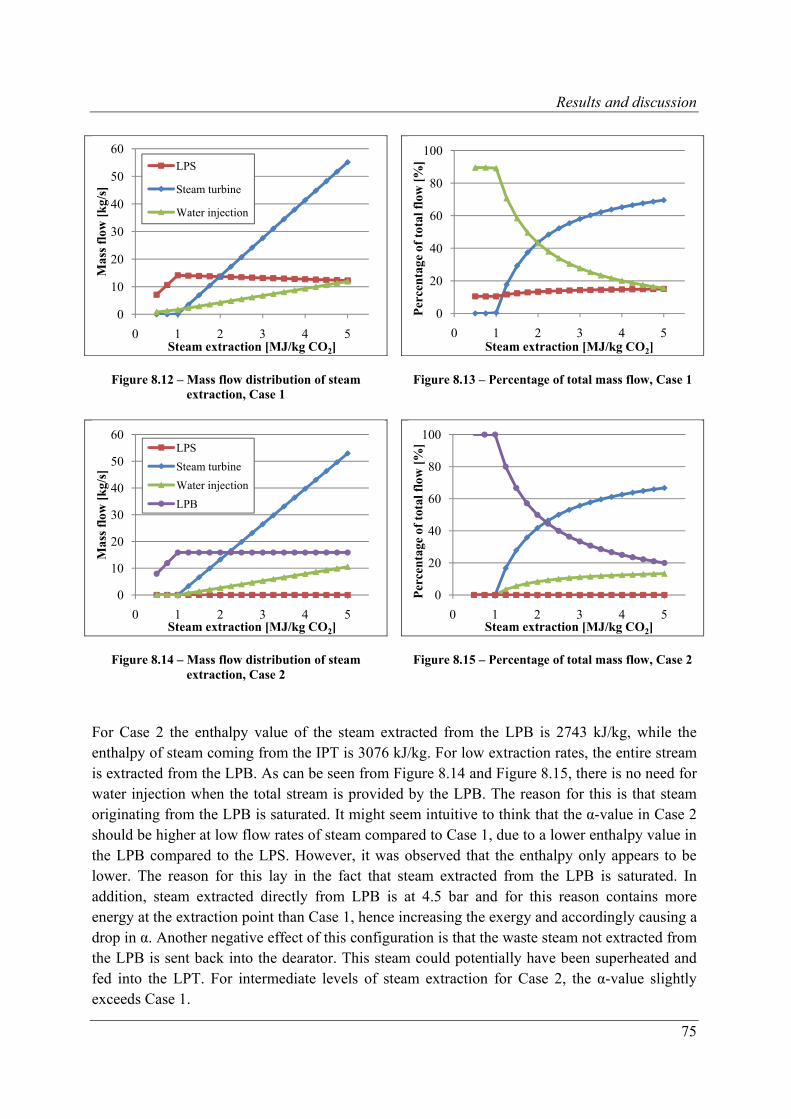
Results and discussion
75
Figure 8.12 – Mass flow distribution of steam extraction, Case 1
Figure 8.13 – Percentage of total mass flow, Case 1
Figure 8.14 – Mass flow distribution of steam extraction, Case 2
Figure 8.15 – Percentage of total mass flow, Case 2
For Case 2 the enthalpy value of the steam extracted from the LPB is 2743 kJ/kg, while the enthalpy of steam coming from the IPT is 3076 kJ/kg. For low extraction rates, the entire stream is extracted from the LPB. As can be seen from Figure 8.14 and Figure 8.15, there is no need for water injection when the total stream is provided by the LPB. The reason for this is that steam originating from the LPB is saturated. It might seem intuitive to think that the α-value in Case 2 should be higher at low flow rates of steam compared to Case 1, due to a lower enthalpy value in the LPB compared to the LPS. However, it was observed that the enthalpy only appears to be lower. The reason for this lay in the fact that steam extracted from the LPB is saturated. In addition, steam extracted directly from LPB is at 4.5 bar and for this reason contains more energy at the extraction point than Case 1, hence increasing the exergy and accordingly causing a drop in α. Another negative effect of this configuration is that the waste steam not extracted from the LPB is sent back into the dearator. This steam could potentially have been superheated and fed into the LPT. For intermediate levels of steam extraction for Case 2, the α-value slightly exceeds Case 1.
0
10
20
30
40
50
60
0 1 2 3 4 5
Mas
s fl
ow [
kg/
s]
Steam extraction [MJ/kg CO2]
LPS
Steam turbine
Water injection
0
20
40
60
80
100
0 1 2 3 4 5
Per
cen
tage
of
tota
l flo
w [
%]
Steam extraction [MJ/kg CO2]
0
10
20
30
40
50
60
0 1 2 3 4 5
Mas
s fl
ow [
kg/
s]
Steam extraction [MJ/kg CO2]
LPS
Steam turbine
Water injection
LPB
0
20
40
60
80
100
0 1 2 3 4 5
Per
cen
tage
of
tota
l flo
w [
%]
Steam extraction [MJ/kg CO2]
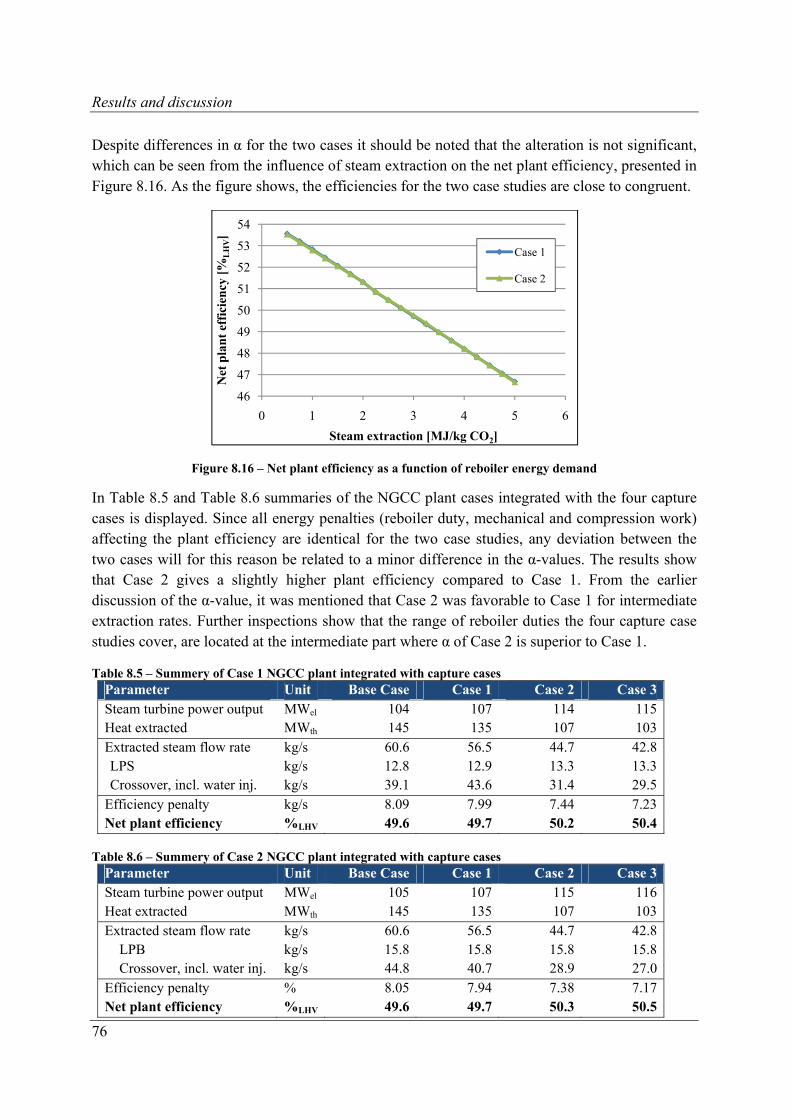
Results and discussion
76
Despite differences in α for the two cases it should be noted that the alteration is not significant, which can be seen from the influence of steam extraction on the net plant efficiency, presented in Figure 8.16. As the figure shows, the efficiencies for the two case studies are close to congruent.
Figure 8.16 – Net plant efficiency as a function of reboiler energy demand
In Table 8.5 and Table 8.6 summaries of the NGCC plant cases integrated with the four capture cases is displayed. Since all energy penalties (reboiler duty, mechanical and compression work) affecting the plant efficiency are identical for the two case studies, any deviation between the two cases will for this reason be related to a minor difference in the α-values. The results show that Case 2 gives a slightly higher plant efficiency compared to Case 1. From the earlier discussion of the α-value, it was mentioned that Case 2 was favorable to Case 1 for intermediate extraction rates. Further inspections show that the range of reboiler duties the four capture case studies cover, are located at the intermediate part where α of Case 2 is superior to Case 1.
Table 8.5 – Summery of Case 1 NGCC plant integrated with capture cases Parameter Unit Base Case Case 1 Case 2 Case 3Steam turbine power output MWel 104 107 114 115Heat extracted MWth 145 135 107 103Extracted steam flow rate kg/s 60.6 56.5 44.7 42.8LPS kg/s 12.8 12.9 13.3 13.3Crossover, incl. water inj. kg/s 39.1 43.6 31.4 29.5
Efficiency penalty kg/s 8.09 7.99 7.44 7.23Net plant efficiency %LHV 49.6 49.7 50.2 50.4
Table 8.6 – Summery of Case 2 NGCC plant integrated with capture cases
Parameter Unit Base Case Case 1 Case 2 Case 3Steam turbine power output MWel 105 107 115 116Heat extracted MWth 145 135 107 103Extracted steam flow rate kg/s 60.6 56.5 44.7 42.8
LPB kg/s 15.8 15.8 15.8 15.8Crossover, incl. water inj. kg/s 44.8 40.7 28.9 27.0
Efficiency penalty % 8.05 7.94 7.38 7.17Net plant efficiency %LHV 49.6 49.7 50.3 50.5
46
47
48
49
50
51
52
53
54
0 1 2 3 4 5 6
Net
pla
nt
effi
cien
cy [
%L
HV]
Steam extraction [MJ/kg CO2]
Case 1
Case 2
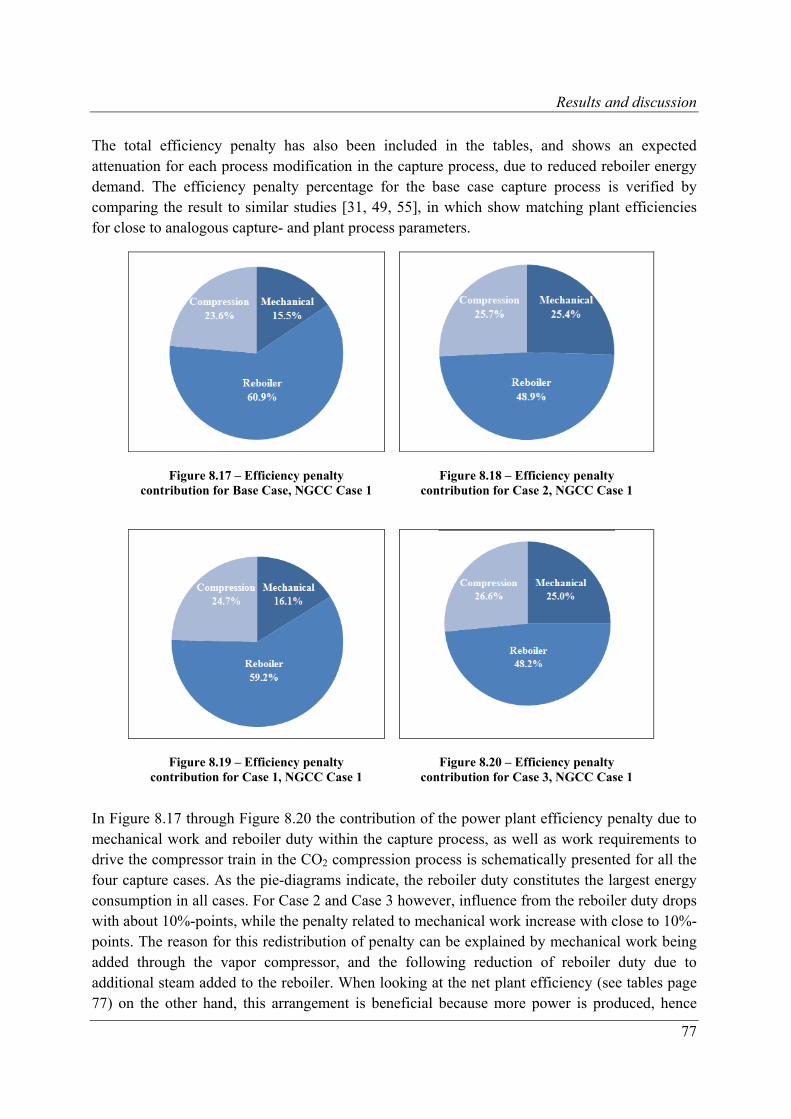
Results and discussion
77
The total efficiency penalty has also been included in the tables, and shows an expected attenuation for each process modification in the capture process, due to reduced reboiler energy demand. The efficiency penalty percentage for the base case capture process is verified by comparing the result to similar studies [31, 49, 55], in which show matching plant efficiencies for close to analogous capture- and plant process parameters.
Figure 8.17 – Efficiency penalty contribution for Base Case, NGCC Case 1
Figure 8.18 – Efficiency penalty contribution for Case 2, NGCC Case 1
Figure 8.19 – Efficiency penalty contribution for Case 1, NGCC Case 1
Figure 8.20 – Efficiency penalty contribution for Case 3, NGCC Case 1
In Figure 8.17 through Figure 8.20 the contribution of the power plant efficiency penalty due to mechanical work and reboiler duty within the capture process, as well as work requirements to drive the compressor train in the CO2 compression process is schematically presented for all the four capture cases. As the pie-diagrams indicate, the reboiler duty constitutes the largest energy consumption in all cases. For Case 2 and Case 3 however, influence from the reboiler duty drops with about 10%-points, while the penalty related to mechanical work increase with close to 10%-points. The reason for this redistribution of penalty can be explained by mechanical work being added through the vapor compressor, and the following reduction of reboiler duty due to additional steam added to the reboiler. When looking at the net plant efficiency (see tables page 77) on the other hand, this arrangement is beneficial because more power is produced, hence
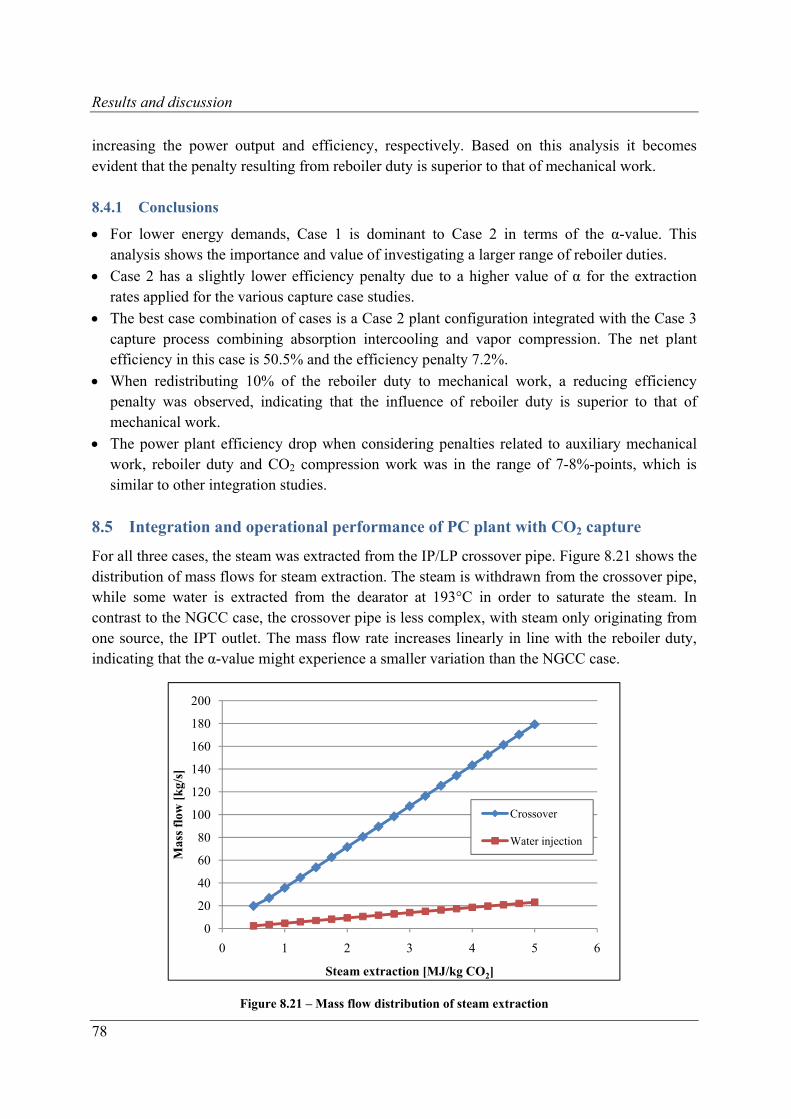
Results and discussion
78
increasing the power output and efficiency, respectively. Based on this analysis it becomes evident that the penalty resulting from reboiler duty is superior to that of mechanical work.
8.4.1 Conclusions
For lower energy demands, Case 1 is dominant to Case 2 in terms of the α-value. This analysis shows the importance and value of investigating a larger range of reboiler duties.
Case 2 has a slightly lower efficiency penalty due to a higher value of α for the extraction rates applied for the various capture case studies.
The best case combination of cases is a Case 2 plant configuration integrated with the Case 3 capture process combining absorption intercooling and vapor compression. The net plant efficiency in this case is 50.5% and the efficiency penalty 7.2%.
When redistributing 10% of the reboiler duty to mechanical work, a reducing efficiency penalty was observed, indicating that the influence of reboiler duty is superior to that of mechanical work.
The power plant efficiency drop when considering penalties related to auxiliary mechanical work, reboiler duty and CO2 compression work was in the range of 7-8%-points, which is similar to other integration studies.
8.5 Integration and operational performance of PC plant with CO2 capture
For all three cases, the steam was extracted from the IP/LP crossover pipe. Figure 8.21 shows the distribution of mass flows for steam extraction. The steam is withdrawn from the crossover pipe, while some water is extracted from the dearator at 193°C in order to saturate the steam. In contrast to the NGCC case, the crossover pipe is less complex, with steam only originating from one source, the IPT outlet. The mass flow rate increases linearly in line with the reboiler duty, indicating that the α-value might experience a smaller variation than the NGCC case.
Figure 8.21 – Mass flow distribution of steam extraction
0
20
40
60
80
100
120
140
160
180
200
0 1 2 3 4 5 6
Mas
s fl
ow [
kg/
s]
Steam extraction [MJ/kg CO2]
Crossover
Water injection
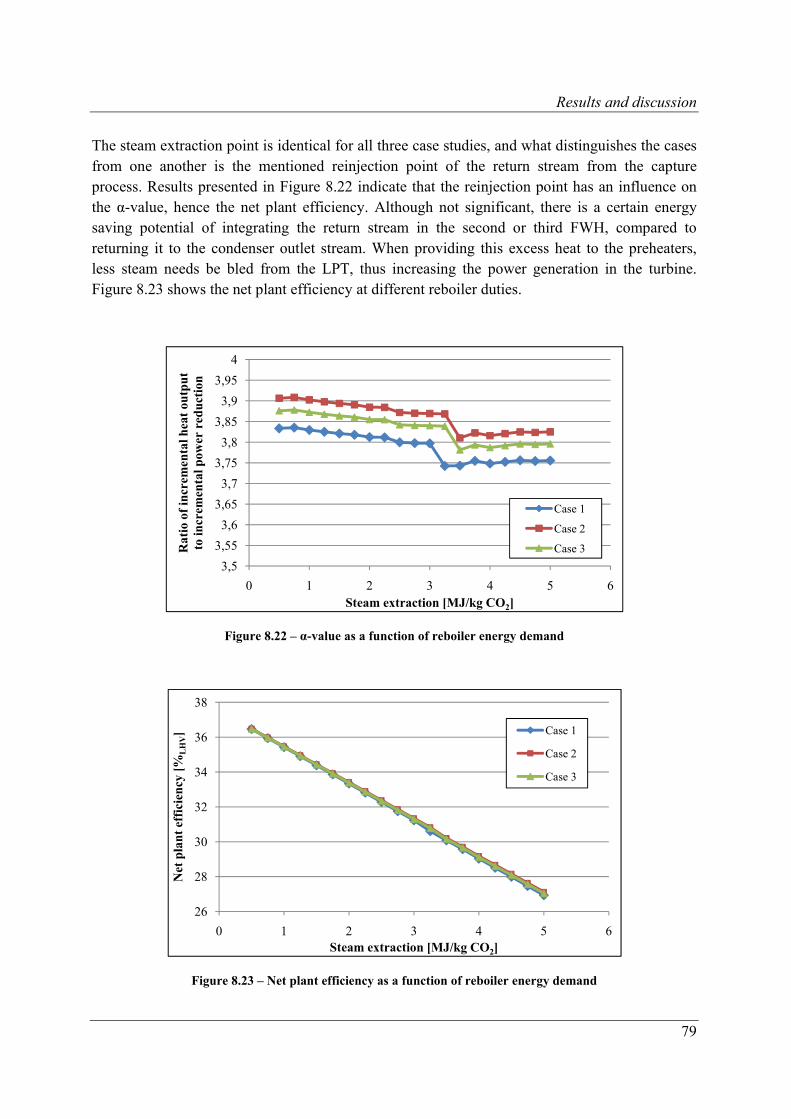
Results and discussion
79
The steam extraction point is identical for all three case studies, and what distinguishes the cases from one another is the mentioned reinjection point of the return stream from the capture process. Results presented in Figure 8.22 indicate that the reinjection point has an influence on the α-value, hence the net plant efficiency. Although not significant, there is a certain energy saving potential of integrating the return stream in the second or third FWH, compared to returning it to the condenser outlet stream. When providing this excess heat to the preheaters, less steam needs be bled from the LPT, thus increasing the power generation in the turbine. Figure 8.23 shows the net plant efficiency at different reboiler duties.
Figure 8.22 – α-value as a function of reboiler energy demand
Figure 8.23 – Net plant efficiency as a function of reboiler energy demand
3,5
3,55
3,6
3,65
3,7
3,75
3,8
3,85
3,9
3,95
4
0 1 2 3 4 5 6
Rat
io o
f in
crem
enta
l hea
t ou
tpu
t to
incr
emen
tal p
ower
red
uct
ion
Steam extraction [MJ/kg CO2]
Case 1
Case 2
Case 3
26
28
30
32
34
36
38
0 1 2 3 4 5 6
Net
pla
nt
effi
cien
cy [
%L
HV]
Steam extraction [MJ/kg CO2]
Case 1
Case 2
Case 3
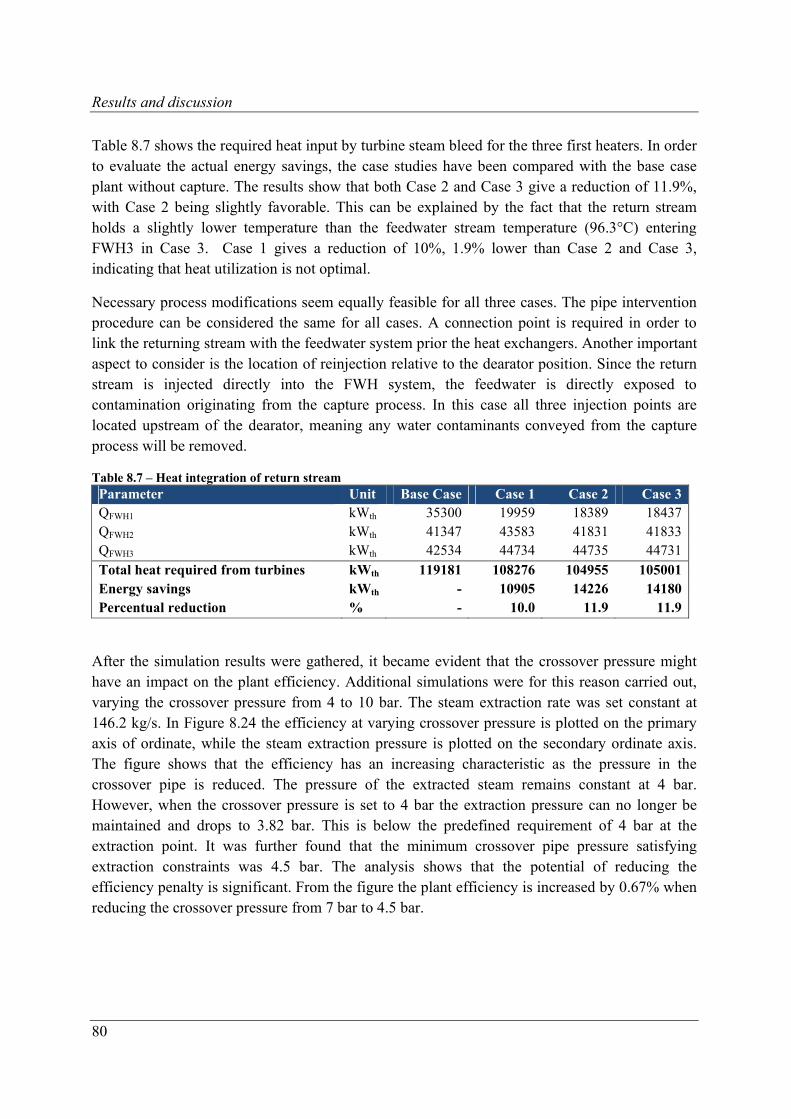
Results and discussion
80
Table 8.7 shows the required heat input by turbine steam bleed for the three first heaters. In order to evaluate the actual energy savings, the case studies have been compared with the base case plant without capture. The results show that both Case 2 and Case 3 give a reduction of 11.9%, with Case 2 being slightly favorable. This can be explained by the fact that the return stream holds a slightly lower temperature than the feedwater stream temperature (96.3°C) entering FWH3 in Case 3. Case 1 gives a reduction of 10%, 1.9% lower than Case 2 and Case 3, indicating that heat utilization is not optimal.
Necessary process modifications seem equally feasible for all three cases. The pipe intervention procedure can be considered the same for all cases. A connection point is required in order to link the returning stream with the feedwater system prior the heat exchangers. Another important aspect to consider is the location of reinjection relative to the dearator position. Since the return stream is injected directly into the FWH system, the feedwater is directly exposed to contamination originating from the capture process. In this case all three injection points are located upstream of the dearator, meaning any water contaminants conveyed from the capture process will be removed.
Table 8.7 – Heat integration of return stream Parameter Unit Base Case Case 1 Case 2 Case 3QFWH1 kWth 35300 19959 18389 18437QFWH2 kWth 41347 43583 41831 41833QFWH3 kWth 42534 44734 44735 44731Total heat required from turbines kWth 119181 108276 104955 105001Energy savings kWth - 10905 14226 14180Percentual reduction % - 10.0 11.9 11.9
After the simulation results were gathered, it became evident that the crossover pressure might have an impact on the plant efficiency. Additional simulations were for this reason carried out, varying the crossover pressure from 4 to 10 bar. The steam extraction rate was set constant at 146.2 kg/s. In Figure 8.24 the efficiency at varying crossover pressure is plotted on the primary axis of ordinate, while the steam extraction pressure is plotted on the secondary ordinate axis. The figure shows that the efficiency has an increasing characteristic as the pressure in the crossover pipe is reduced. The pressure of the extracted steam remains constant at 4 bar. However, when the crossover pressure is set to 4 bar the extraction pressure can no longer be maintained and drops to 3.82 bar. This is below the predefined requirement of 4 bar at the extraction point. It was further found that the minimum crossover pipe pressure satisfying extraction constraints was 4.5 bar. The analysis shows that the potential of reducing the efficiency penalty is significant. From the figure the plant efficiency is increased by 0.67% when reducing the crossover pressure from 7 bar to 4.5 bar.
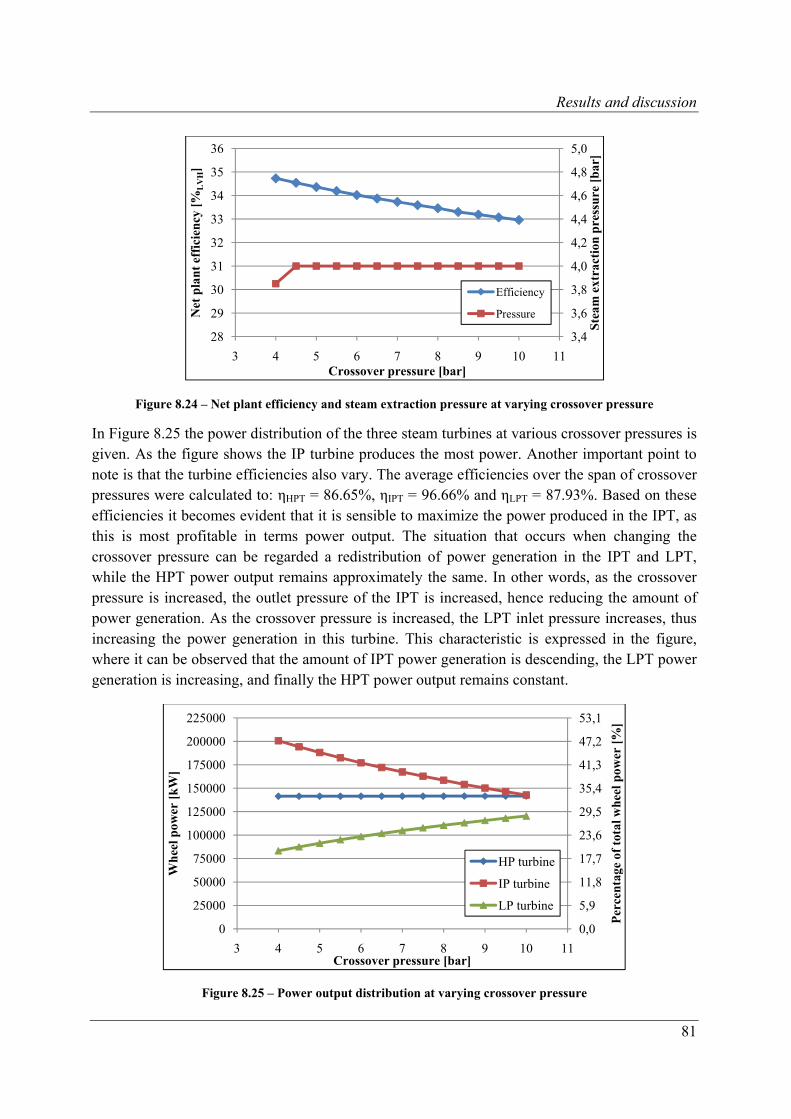
Results and discussion
81
Figure 8.24 – Net plant efficiency and steam extraction pressure at varying crossover pressure
In Figure 8.25 the power distribution of the three steam turbines at various crossover pressures is given. As the figure shows the IP turbine produces the most power. Another important point to note is that the turbine efficiencies also vary. The average efficiencies over the span of crossover pressures were calculated to: ηHPT = 86.65%, ηIPT = 96.66% and ηLPT = 87.93%. Based on these efficiencies it becomes evident that it is sensible to maximize the power produced in the IPT, as this is most profitable in terms power output. The situation that occurs when changing the crossover pressure can be regarded a redistribution of power generation in the IPT and LPT, while the HPT power output remains approximately the same. In other words, as the crossover pressure is increased, the outlet pressure of the IPT is increased, hence reducing the amount of power generation. As the crossover pressure is increased, the LPT inlet pressure increases, thus increasing the power generation in this turbine. This characteristic is expressed in the figure, where it can be observed that the amount of IPT power generation is descending, the LPT power generation is increasing, and finally the HPT power output remains constant.
Figure 8.25 – Power output distribution at varying crossover pressure
3,4
3,6
3,8
4,0
4,2
4,4
4,6
4,8
5,0
28
29
30
31
32
33
34
35
36
3 4 5 6 7 8 9 10 11
Ste
am e
xtra
ctio
n p
ress
ure
[b
ar]
Net
pla
nt
effi
cien
cy [
%L
VH
]
Crossover pressure [bar]
Efficiency
Pressure
0,0
5,9
11,8
17,7
23,6
29,5
35,4
41,3
47,2
53,1
0
25000
50000
75000
100000
125000
150000
175000
200000
225000
3 4 5 6 7 8 9 10 11
Per
cen
tage
of
tota
l wh
eel p
ower
[%
]
Wh
eel p
ower
[k
W]
Crossover pressure [bar]
HP turbine
IP turbine
LP turbine
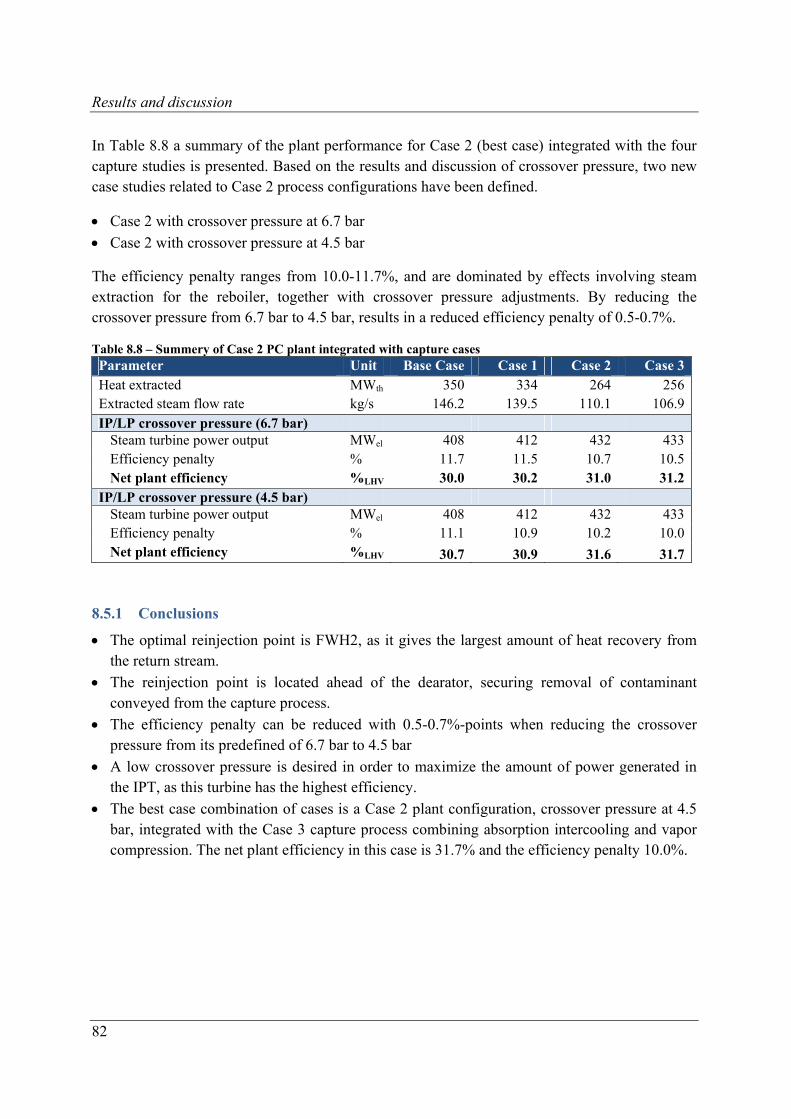
Results and discussion
82
In Table 8.8 a summary of the plant performance for Case 2 (best case) integrated with the four capture studies is presented. Based on the results and discussion of crossover pressure, two new case studies related to Case 2 process configurations have been defined.
Case 2 with crossover pressure at 6.7 bar
Case 2 with crossover pressure at 4.5 bar
The efficiency penalty ranges from 10.0-11.7%, and are dominated by effects involving steam extraction for the reboiler, together with crossover pressure adjustments. By reducing the crossover pressure from 6.7 bar to 4.5 bar, results in a reduced efficiency penalty of 0.5-0.7%.
Table 8.8 – Summery of Case 2 PC plant integrated with capture cases Parameter Unit Base Case Case 1 Case 2 Case 3Heat extracted MWth 350 334 264 256Extracted steam flow rate kg/s 146.2 139.5 110.1 106.9IP/LP crossover pressure (6.7 bar)
Steam turbine power output MWel 408 412 432 433Efficiency penalty % 11.7 11.5 10.7 10.5Net plant efficiency %LHV 30.0 30.2 31.0 31.2
IP/LP crossover pressure (4.5 bar) Steam turbine power output MWel 408 412 432 433Efficiency penalty % 11.1 10.9 10.2 10.0Net plant efficiency %LHV 30.7 30.9 31.6 31.7
8.5.1 Conclusions
The optimal reinjection point is FWH2, as it gives the largest amount of heat recovery from the return stream.
The reinjection point is located ahead of the dearator, securing removal of contaminant conveyed from the capture process.
The efficiency penalty can be reduced with 0.5-0.7%-points when reducing the crossover pressure from its predefined of 6.7 bar to 4.5 bar
A low crossover pressure is desired in order to maximize the amount of power generated in the IPT, as this turbine has the highest efficiency.
The best case combination of cases is a Case 2 plant configuration, crossover pressure at 4.5 bar, integrated with the Case 3 capture process combining absorption intercooling and vapor compression. The net plant efficiency in this case is 31.7% and the efficiency penalty 10.0%.
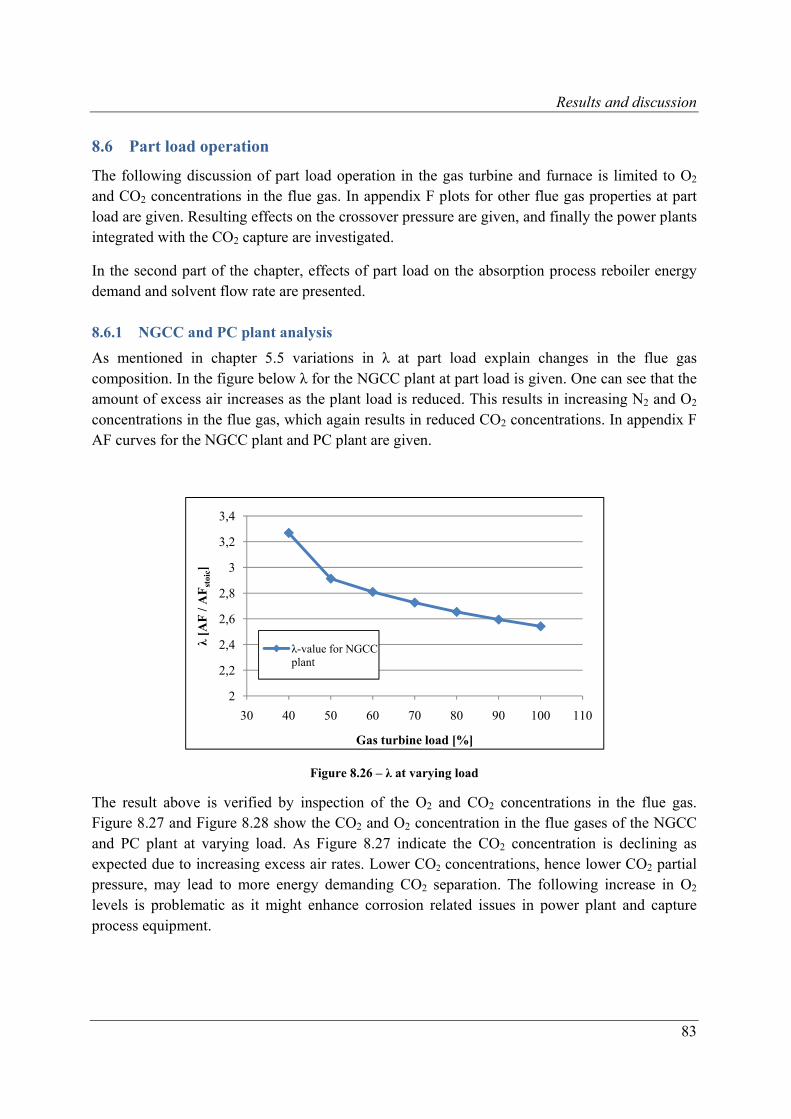
Results and discussion
83
8.6 Part load operation
The following discussion of part load operation in the gas turbine and furnace is limited to O2 and CO2 concentrations in the flue gas. In appendix F plots for other flue gas properties at part load are given. Resulting effects on the crossover pressure are given, and finally the power plants integrated with the CO2 capture are investigated.
In the second part of the chapter, effects of part load on the absorption process reboiler energy demand and solvent flow rate are presented.
8.6.1 NGCC and PC plant analysis
As mentioned in chapter 5.5 variations in λ at part load explain changes in the flue gas composition. In the figure below λ for the NGCC plant at part load is given. One can see that the amount of excess air increases as the plant load is reduced. This results in increasing N2 and O2 concentrations in the flue gas, which again results in reduced CO2 concentrations. In appendix F AF curves for the NGCC plant and PC plant are given.
Figure 8.26 – λ at varying load
The result above is verified by inspection of the O2 and CO2 concentrations in the flue gas. Figure 8.27 and Figure 8.28 show the CO2 and O2 concentration in the flue gases of the NGCC and PC plant at varying load. As Figure 8.27 indicate the CO2 concentration is declining as expected due to increasing excess air rates. Lower CO2 concentrations, hence lower CO2 partial pressure, may lead to more energy demanding CO2 separation. The following increase in O2
levels is problematic as it might enhance corrosion related issues in power plant and capture process equipment.
2
2,2
2,4
2,6
2,8
3
3,2
3,4
30 40 50 60 70 80 90 100 110
λ[A
F /
AF
stoi
c]
Gas turbine load [%]
λ-value for NGCC plant
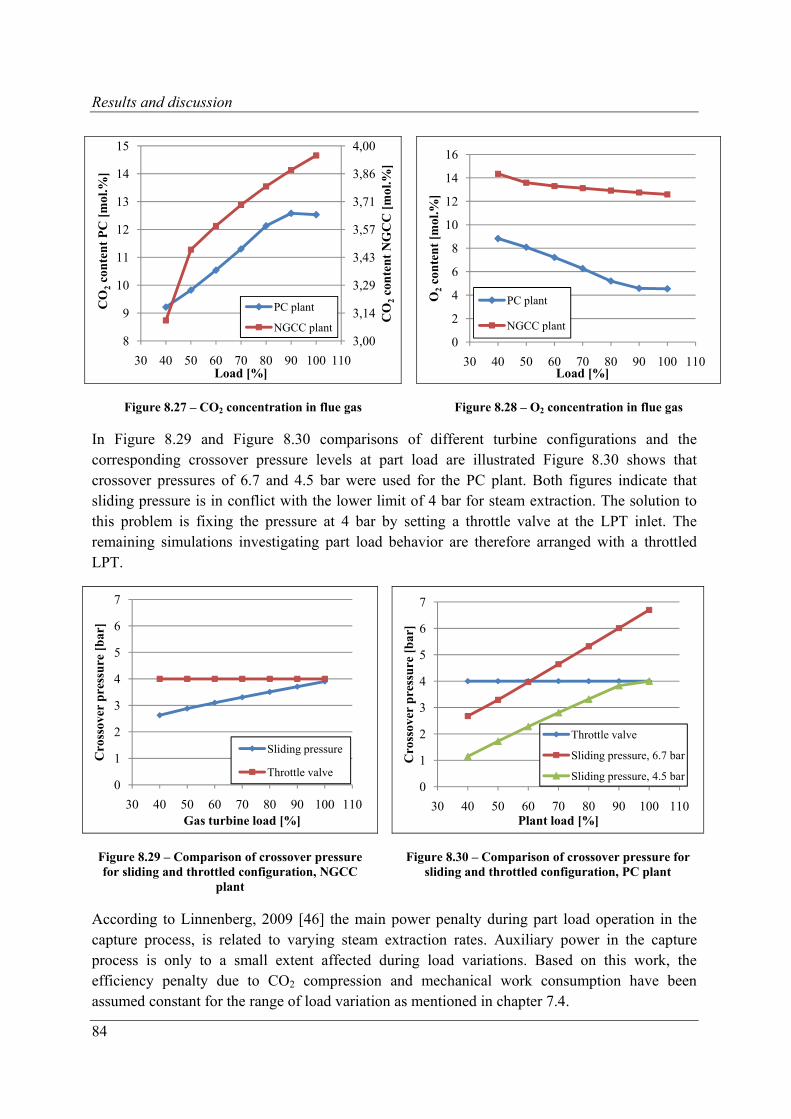
Results and discussion
84
Figure 8.27 – CO2 concentration in flue gas Figure 8.28 – O2 concentration in flue gas
In Figure 8.29 and Figure 8.30 comparisons of different turbine configurations and the corresponding crossover pressure levels at part load are illustrated Figure 8.30 shows that crossover pressures of 6.7 and 4.5 bar were used for the PC plant. Both figures indicate that sliding pressure is in conflict with the lower limit of 4 bar for steam extraction. The solution to this problem is fixing the pressure at 4 bar by setting a throttle valve at the LPT inlet. The remaining simulations investigating part load behavior are therefore arranged with a throttled LPT.
Figure 8.29 – Comparison of crossover pressure for sliding and throttled configuration, NGCC
plant
Figure 8.30 – Comparison of crossover pressure for sliding and throttled configuration, PC plant
According to Linnenberg, 2009 [46] the main power penalty during part load operation in the capture process, is related to varying steam extraction rates. Auxiliary power in the capture process is only to a small extent affected during load variations. Based on this work, the efficiency penalty due to CO2 compression and mechanical work consumption have been assumed constant for the range of load variation as mentioned in chapter 7.4.
3,00
3,14
3,29
3,43
3,57
3,71
3,86
4,00
8
9
10
11
12
13
14
15
30 40 50 60 70 80 90 100 110
CO
2co
nte
nt
NG
CC
[m
ol.%
]
CO
2co
nte
nt
PC
[m
ol.%
]
Load [%]
PC plant
NGCC plant0
2
4
6
8
10
12
14
16
30 40 50 60 70 80 90 100 110
O2
con
ten
t [m
ol.%
]
Load [%]
PC plant
NGCC plant
0
1
2
3
4
5
6
7
30 40 50 60 70 80 90 100 110
Cro
ssov
er p
ress
ure
[b
ar]
Gas turbine load [%]
Sliding pressure
Throttle valve0
1
2
3
4
5
6
7
30 40 50 60 70 80 90 100 110
Cro
ssov
er p
ress
ure
[b
ar]
Plant load [%]
Throttle valve
Sliding pressure, 6.7 bar
Sliding pressure, 4.5 bar
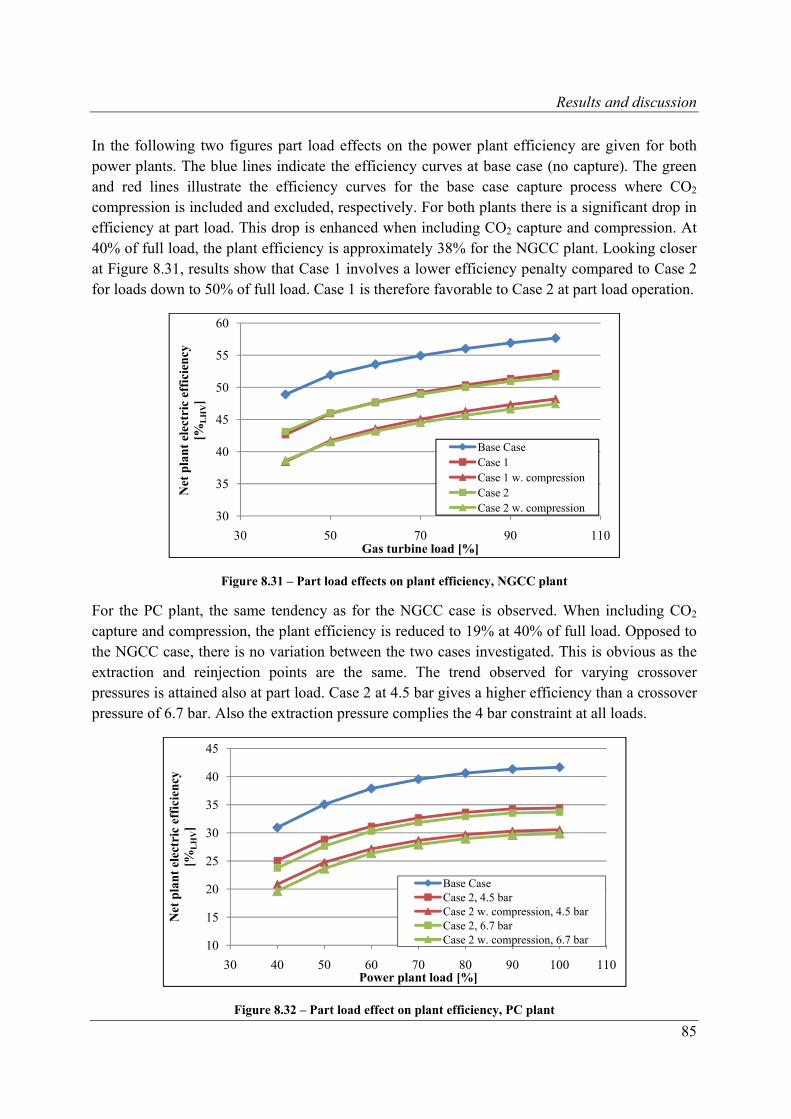
Results and discussion
85
In the following two figures part load effects on the power plant efficiency are given for both power plants. The blue lines indicate the efficiency curves at base case (no capture). The green and red lines illustrate the efficiency curves for the base case capture process where CO2 compression is included and excluded, respectively. For both plants there is a significant drop in efficiency at part load. This drop is enhanced when including CO2 capture and compression. At 40% of full load, the plant efficiency is approximately 38% for the NGCC plant. Looking closer at Figure 8.31, results show that Case 1 involves a lower efficiency penalty compared to Case 2 for loads down to 50% of full load. Case 1 is therefore favorable to Case 2 at part load operation.
Figure 8.31 – Part load effects on plant efficiency, NGCC plant
For the PC plant, the same tendency as for the NGCC case is observed. When including CO2 capture and compression, the plant efficiency is reduced to 19% at 40% of full load. Opposed to the NGCC case, there is no variation between the two cases investigated. This is obvious as the extraction and reinjection points are the same. The trend observed for varying crossover pressures is attained also at part load. Case 2 at 4.5 bar gives a higher efficiency than a crossover pressure of 6.7 bar. Also the extraction pressure complies the 4 bar constraint at all loads.
Figure 8.32 – Part load effect on plant efficiency, PC plant
30
35
40
45
50
55
60
30 50 70 90 110
Net
pla
nt
elec
tric
eff
icie
ncy
[%
LH
V]
Gas turbine load [%]
Base CaseCase 1Case 1 w. compressionCase 2Case 2 w. compression
10
15
20
25
30
35
40
45
30 40 50 60 70 80 90 100 110
Net
pla
nt
elec
tric
eff
icie
ncy
[%
LH
V]
Power plant load [%]
Base CaseCase 2, 4.5 barCase 2 w. compression, 4.5 barCase 2, 6.7 barCase 2 w. compression, 6.7 bar
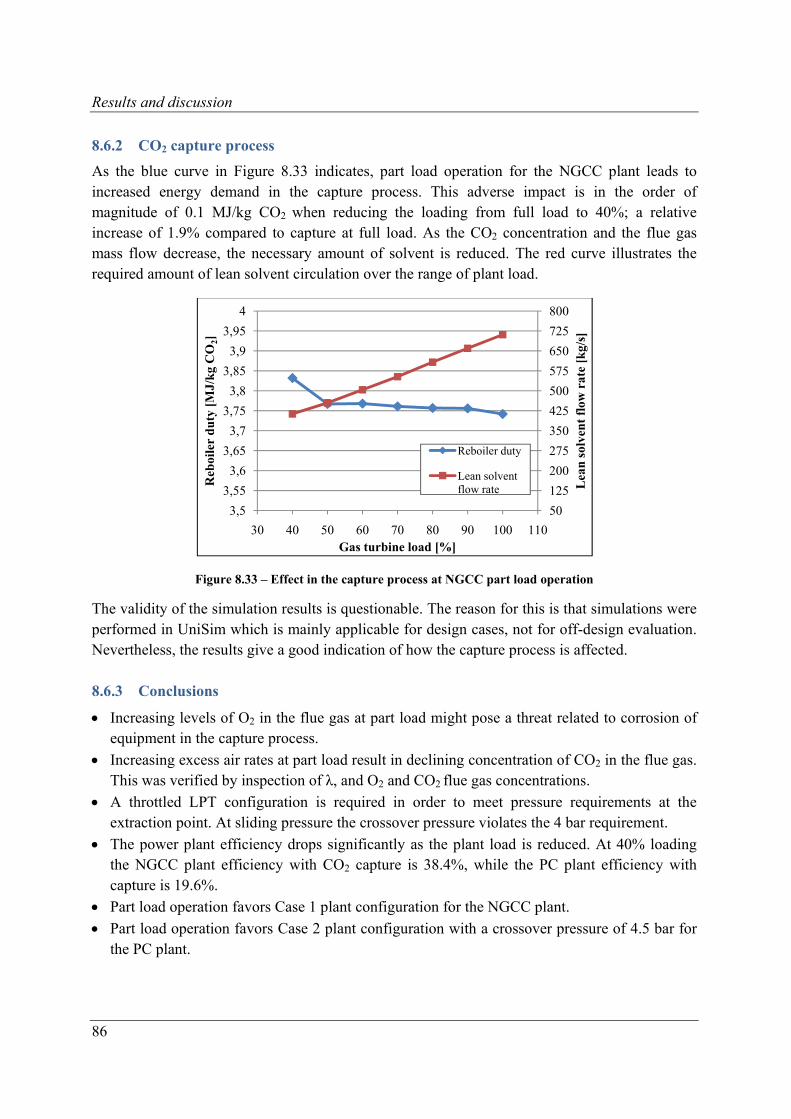
Results and discussion
86
8.6.2 CO2 capture process
As the blue curve in Figure 8.33 indicates, part load operation for the NGCC plant leads to increased energy demand in the capture process. This adverse impact is in the order of magnitude of 0.1 MJ/kg CO2 when reducing the loading from full load to 40%; a relative increase of 1.9% compared to capture at full load. As the CO2 concentration and the flue gas mass flow decrease, the necessary amount of solvent is reduced. The red curve illustrates the required amount of lean solvent circulation over the range of plant load.
Figure 8.33 – Effect in the capture process at NGCC part load operation
The validity of the simulation results is questionable. The reason for this is that simulations were performed in UniSim which is mainly applicable for design cases, not for off-design evaluation. Nevertheless, the results give a good indication of how the capture process is affected.
8.6.3 Conclusions
Increasing levels of O2 in the flue gas at part load might pose a threat related to corrosion of equipment in the capture process.
Increasing excess air rates at part load result in declining concentration of CO2 in the flue gas. This was verified by inspection of λ, and O2 and CO2 flue gas concentrations.
A throttled LPT configuration is required in order to meet pressure requirements at the extraction point. At sliding pressure the crossover pressure violates the 4 bar requirement.
The power plant efficiency drops significantly as the plant load is reduced. At 40% loading the NGCC plant efficiency with CO2 capture is 38.4%, while the PC plant efficiency with capture is 19.6%.
Part load operation favors Case 1 plant configuration for the NGCC plant.
Part load operation favors Case 2 plant configuration with a crossover pressure of 4.5 bar for the PC plant.
50
125
200
275
350
425
500
575
650
725
800
3,5
3,55
3,6
3,65
3,7
3,75
3,8
3,85
3,9
3,95
4
30 40 50 60 70 80 90 100 110
Lea
n s
olve
nt
flow
rat
e [k
g/s]
Reb
oile
r d
uty
[M
J/k
g C
O2]
Gas turbine load [%]
Reboiler duty
Lean solvent flow rate
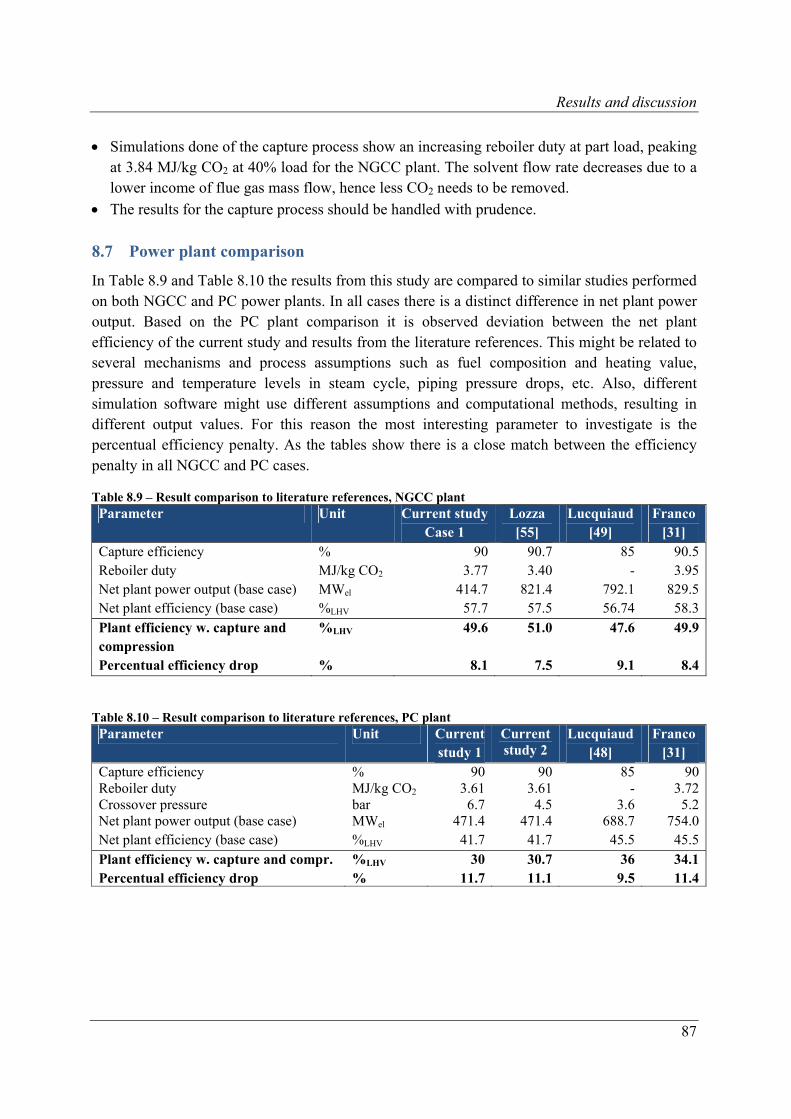
Results and discussion
87
Simulations done of the capture process show an increasing reboiler duty at part load, peaking at 3.84 MJ/kg CO2 at 40% load for the NGCC plant. The solvent flow rate decreases due to a lower income of flue gas mass flow, hence less CO2 needs to be removed.
The results for the capture process should be handled with prudence.
8.7 Power plant comparison
In Table 8.9 and Table 8.10 the results from this study are compared to similar studies performed on both NGCC and PC power plants. In all cases there is a distinct difference in net plant power output. Based on the PC plant comparison it is observed deviation between the net plant efficiency of the current study and results from the literature references. This might be related to several mechanisms and process assumptions such as fuel composition and heating value, pressure and temperature levels in steam cycle, piping pressure drops, etc. Also, different simulation software might use different assumptions and computational methods, resulting in different output values. For this reason the most interesting parameter to investigate is the percentual efficiency penalty. As the tables show there is a close match between the efficiency penalty in all NGCC and PC cases.
Table 8.9 – Result comparison to literature references, NGCC plant Parameter Unit Current study
Case 1 Lozza [55]
Lucquiaud [49]
Franco [31]
Capture efficiency % 90 90.7 85 90.5Reboiler duty MJ/kg CO2 3.77 3.40 - 3.95Net plant power output (base case) MWel 414.7 821.4 792.1 829.5Net plant efficiency (base case) %LHV 57.7 57.5 56.74 58.3Plant efficiency w. capture and compression
%LHV 49.6 51.0 47.6 49.9
Percentual efficiency drop % 8.1 7.5 9.1 8.4
Table 8.10 – Result comparison to literature references, PC plant Parameter Unit Current
study 1 Current study 2
Lucquiaud [48]
Franco [31]
Capture efficiency % 90 90 85 90Reboiler duty MJ/kg CO2 3.61 3.61 - 3.72Crossover pressure bar 6.7 4.5 3.6 5.2Net plant power output (base case) MWel 471.4 471.4 688.7 754.0Net plant efficiency (base case) %LHV 41.7 41.7 45.5 45.5Plant efficiency w. capture and compr. %LHV 30 30.7 36 34.1Percentual efficiency drop % 11.7 11.1 9.5 11.4
Results and discussion
88
8.8 General recommendations based on results
8.8.1 CO2 capture process
According to simulation results it is possible to reduce the reboiler energy demand from 3.77 to 2.68 MJ/kg CO2 when applying vapor compression and absorption intercooling in the capture process. From a thermodynamic point-of-view vapor compression is clearly profitable in terms of reducing the plant energy penalty occurring in the reboiler considerably. Obviously such modifications require extra investment costs related to additional process equipment. It is therefore essential to investigate the economics before determining which modifications are profitable from a combined energy savings and cost perspective. Absorption intercooling has a smaller impact on the reboiler energy demand than vapor compression. For this process modification it can be expected that the equipment costs versus energy savings will be more sensitive when considering its profitability.
It is recommended to consider both absorption intercooling and vapor compression, with primary focus on vapor compression.
8.8.2 NGCC plant
It has through literature studies and discussion become clear that steam extraction from the crossover is the most suitable point of steam extraction in terms of reducing efficiency penalty implied on the power plant, as well as for practical reasons. Since the results from the two case studies are so similar, it is difficult to give anything else than a general recommendation of which process configuration is favorable. Both cases have benefits and approximately the same net plant efficiency at varying steam extraction rates.
Case 1 gives the highest value of α for low reboiler duties. Since the reboiler duty is expected to be reduced in near future, this favors a Case 1 configuration. In terms of process modifications it is the simplest, as there are only two extraction points; the crossover pipe and desuperheated water from HPE2. Part load simulation results show that the efficiency penalty is lowest for Case 1.
Case 2 gives the highest value of α for the range of reboiler duties relevant for state-of-the-art capture processes available today. Also for the three other case studies performed on the capture process favor Case 2 integration. The benefit of using this configuration lay in exclusion of the LPS from the process, hence reducing equipment related costs. A drawback of this process configuration compared to Case 1 is the requirement of three extraction points. A pipe must be routed from the LPB and interconnected with the crossover pipe and pipe attached to the reboiler.
At part load the NGCC plant should be configured with a throttled LPT in order to secure 4 bar at the steam extraction point.

Results and discussion
89
8.8.3 PC plant
It is recommended to extract all steam from the IP/LP crossover pipe and desuperheating the steam by water injection from the dearator. The returning stream from the capture process should be reinjected into FWH2, as this provides the best heat recovery of the return stream, hence reducing the amount of steam bleed from the LPT. The pressure in the crossover pipe should be set to 4.5 bar as this gives the lowest power penalty.
At part load the PC plant should be configured with a throttled LPT in order to secure 4 bar at the steam extraction point.

Conclusion
91
9 Conclusion
This report has given an extensive overview of relevant integration measures that can be made for coal- and natural gas-fired power plants with CO2 capture based on absorption, aiming at reducing the overall efficiency penalty. The report has also investigated possible modifications within the capture process. Results from the capture process show that the reboiler energy demand can be reduced from 3.77 MJ/kg CO2 for a state-of-the-art capture process to 2.68 MJ/kg CO2 by implementing absorption intercooling and vapor compression for the NGCC power plant. For the PC plant, the corresponding values are 3.619 MJ/kg CO2 to 2.65 MJ/kg CO2. The energy demand is somewhat lower due to higher CO2 partial pressure, hence less energy intensive separation. Especially vapor compression has a large impact on the reboiler energy demand. In a standalone process this configuration reduces the energy demand to 2.78 MJ/kg CO2 for the NGCC case, and 2.71 MJ/kg CO2 for the PC case. Another interesting observation made when applying vapor compression was reduced cooling water requirements in the overhead condenser of the desorber. Investigations of the temperature profile of the desorber showed that less cooling water was needed due to reduced temperatures in the upper part of the column.
Further, analysis of different case studies investigating various steam extraction points, and reinjection points were investigated and evaluated based on the value of α. It was stated that the steam extraction pressure should not deceed 4 bar. A pinch point analysis was performed on the NGCC plant and concluded that the possibility of heat integrating the return stream from the capture process was limited, and therefore discarded. The NGCC plant had two potential points of steam extraction; directly from the crossover pipe, and a combination of extraction from the crossover pipe and LPB. The two configurations had benefits at different steam extraction rates making it difficult to give other than general recommendations on selection. Also, the plant efficiency results were approximately the same. The two cases have been integrated with the capture case studies and the net plant efficiency with CO2 was studied. The results show an efficiency penalty ranging from 7-8%-points giving a net plant efficiency of 49.6-50.5%.
For the PC plant the main focus involved the reinjection point of the return stream from the capture process. The reasoning was based on pinch point analysis of the feedwater heating system. In a PC plant the FWH system has several pinch points; the lowest located below the return stream, indicating heat integration potential. It was found that reinjecting the return stream into FWH2 gave the best heat recovery. Additional simulations were performed on the crossover pressure level. The results from these simulations showed that there was a significant potential of reducing the efficiency penalty by reducing the pressure from its initial pressure of 6.7 bar to 4.5 bar. The reason for this was related to the steam turbine efficiencies, which indicated that the IPT has the highest efficiency, thus maximizing power generation in this turbine is desirable. Expanding to 4.5 bar gave a increase in plant efficiency of 0.7% compared to the baseline settings operating at 6.7 bar. Results show an efficiency penalty of 10-11.7%-points giving a net plant efficiency of 30-31.7%.

Conclusion
92
Part load operation results for both power plants showed that in order to meet the 4 bar lower limitation at the extraction point a throttled LPT configuration should be applied. Also, flue gas properties showed expected behavior, with increased O2 fractions and reduced CO2 fractions. It was found that this behavior was due to increasing excess air rates for load reduction. The flue gas mass flow reduced in line with load reduction. For the part load results from the capture plant, it was pointed out that the results should be viewed on with caution. Since the simulations were carried out in UniSim which is only intended for design cases, off-design simulations might contain considerable errors. However, based on literature Lindenberg, 2009 [46], the results showed expected trends. Reduced solvent flow rates were observed and an increase in reboiler duty as the plant load was reduced.
Further work
93
10 Further work
Further work based on the results presented in this report should focus on future solvent formulations, part load behavior, economics, and life-cycle assessment. This study is limited to investigating the capture process based on absorption using an MEA-based solvent. Other solvents might have different properties, which might affect required steam temperature and pressure. Based on this it is recommended that similar studies are performed on capture processes using other solvent formulations. Attention should be given to auxiliary power demanding equipment in the capture process, such as pumps, fans and compressors. This is in order to get a clearer picture of the energy and power consumption this equipment. This involves both mechanical work within the capture process and CO2 compression. By configuring these components in an optimal way, both exergy losses within the capture process as well as power consumption in the compression process can be reduced.
Limited research has been performed on part load effects in the capture plant and this topic therefore needs to be better understood. The report only touches the surface of part load in the capture process. Thus, a comprehensive study on the capture process at part load should be executed. Investigating part load effects such as corrosion related issues, and variations in reaction kinetics and chemical reactions due to changing flue gas composition may prove valuable in terms of predicting energy and power demand as well as equipment material selection.
As mentioned in the introduction of the report, economical assessments are vital when reviewing whether CO2 capture for a given plant is possible. The thermodynamic results given in this report only form half of the study on CO2 capture. Economics is a key issue when considering the feasibility of CCS realization. Since variations in the different power plant case studies are very small, economical advantages might be the deciding factor when choosing which process configuration to adopt.
A brief introduction pointing out the importance of LCA in the context of the evaluation of CCS was given in the project introduction. A general recommendation is given, advising to perform detailed LCA evaluations in order to clarify the environmental impacts resulting from implementation CCS.

References
95
11 References
1. IPCC-CCS, IPCC Special report on Carbon Dioxide Capture and Storage. 2005. 2. IEA, World Energy Outlook from the International Energy Agency. 2009. 3. IPCC, Fourth Assessment Report: Climate Change 2007: The Physical Science Basis.
2007, Intergovernmental Panel on Climate Change, http://www.ipcc.ch/ipccreports/ar4-wg1.htm.
4. CCS Reg. CCSReg Project. 2010; Available from: http://www.ccsreg.org/. 5. Lackner, K.S., A.H.A. Park, and B.G. Miller, Eliminating CO2 Emissions from Coal-
Fired Power Plants, in Generating Electricity in a Carbon-Constrained World. 2010, Academic Press: Boston. p. 127-173.
6. McKensey, Carbon Capture & Storage: Asessing the Economics. 2008. p. 53. 7. Sargas. Sargas AS | Clean Power Solutions. 2010 [cited 2010 28.01.10]. 8. Singh, B., A.H. Strømman, and E. Hertwich, Life cycle assessment of natural gas
combined cycle power plant with post-combustion carbon capture, transport and storage. International Journal of Greenhouse Gas Control, 2010. In Press, Corrected Proof.
9. Aker Clean Carbon. Carbon capture technology. 2010 [cited 2010 28.01.10]; Available from: http://www.akercleancarbon.com/section.cfm?path=418,456.
10. Reddy, S., Johnson, D. & Gilmartin, J. Fluor's Econamine FG PlusSM Technology For CO2 Capture at Coal-fired Power Plants. in Power Plant Air Pollutant Control “Mega” Symposium. 2008. Baltimore.
11. Svendsen, H.F., Hägg, M-B., Bolland, O. & Eide-Haugmo, I., Carbon Capture Technologies. 2009, NTNU Innovation Norway Workshop Tokyo.
12. Bohm, M.C., Capture-Ready Power Plants - Options, Technologies and Economics. 2006, Massachusetts Institute of Technology, http://sequestration.mit.edu/pdf/Mark_Bohm_Thesis.pdf.
13. Bolland, O., Power Generation: CO2 Capture and Storage, Course material. 2009, Department of Energy and Process Engineering, NTNU.
14. Romeo, L.M., I. Bolea, and J.M. Escosa, Integration of power plant and amine scrubbing to reduce CO2 capture costs. Applied Thermal Engineering, 2008. 28(8-9): p. 1039-1046.
15. Knudsen, S., Karl, M. & Randall, S., Summary Report: Amine Emissions to Air during Carbon Capture, Phase I: CO2 and Amines Screening Study for Effects to the Environment. 2009. p. 17.
16. Botero, C., et al., Redesign, Optimization, and Economic Evaluation of a Natural Gas Combined Cycle with the Best Integrated Technology CO2 Capture. Energy Procedia, 2009. 1(1): p. 3835-3842.
17. Cifre, P.G., et al., Integration of a chemical process model in a power plant modelling tool for the simulation of an amine based CO2 scrubber. Fuel, 2009. 88(12): p. 2481-2488.
18. Geuzebroek, F.H., et al., Exergy analysis of alkanolamine-based CO2 removal unit with AspenPlus. Energy, 2004. 29(9-10): p. 1241-1248.
19. Kohl, A.L.N., Richard B., Gas Purification (5th Edition). 1997, Elsevier. 20. Rousseau, R.W., Handbook of Separation Process Technology. 1987: John Wiley &
Sons. 21. Fisher, K.S., Searcy, K., Rochelle, G. T., Ziaii, T. & Schubert, C., Advanced Amine
Solvent Formulations and Process Integration for Near-Term CO2 Capture Success. 2007, U.S. Department of Energy.
22. Kentish, S., IEA GHG Summer School on CCS: Course Material. 2009.
References
96
23. Aroonwilas, A., P. Tontiwachwuthikul, and A. Chakma, Effects of operating and design parameters on CO2 absorption in columns with structured packings. Separation and Purification Technology, 2001. 24(3): p. 403-411.
24. Abu-Zahra, M.R.M., et al., CO2 capture from power plants: Part I. A parametric study of the technical performance based on monoethanolamine. International Journal of Greenhouse Gas Control, 2007. 1(1): p. 37-46.
25. Green, D.W.P., Robert H. , Perry's Chemical Engineers' Handbook (8th Edition), McGraw-Hill, Editor. 2008.
26. Magnussen, P., Kårstø Combined Cycle Power Plant (CCPP), Lecture presentation. 2007.
27. Bolland, O., TEP4185 Industrial Process Engineering, Course material. 2008, Department of Energy and Process Engineering.
28. Ramm, B., Integration of steam exchange between a power plant and CO2 capture plant, in Department of Energy and Process Engineering. 2009, Norwegian University of Sience and Technology: Trondheim. p. 136.
29. Ansolabehere, S., Beer, J., Deutch, J., Ellerman, D., Friedmann, J., Herzog, H., Jacoby, H. D., Joskow, P. L., McRae, G., Lester, R., Moniz, E. J., Steinfeld, E. & Katzer, J., The Future of Coal - Options for a carbon-constrained world. 2007, Massachusetts Institute of Technology. p. 192.
30. IEA Clean Coal Centre. Clean Coal Technologies - Pulverized coal combustion (PCC). 2010 08.05.2010]; Available from: http://www.iea-coal.org.uk.
31. Franco, F., Anantharaman, R., Bolland, O., Booth, N., Fernandes, E. S., Macchi, E., Manzolini, G., Nikolic, D., Pfeffer, A. & Rezvani, S., Enabling advanced pre-combustion capture techniques and plants, in Test cases and preliminary benchmarking results from the three projects. 2010.
32. The Michigan Department of Environmental Quality. New Generation of Power. 2010 08.05.2010]; Available from: http://www.newgenmichigan.com/.
33. Turns, S.R., An Introduction to Combustion: Concepts and Applications. Second ed. 2006: McGraw-Hill Science/Engineering/Math
34. HEI, Tech Sheet #127, Heat Exchange Institute www.heatexchange.org, Editor. 2010: Cleveland.
35. NDT. Database of Nondestructive Testing, www.ndt.net. 2010; Available from: http://www.ndt.net/apcndt2001/papers/7/figa.gif.
36. Power From The Sun.net. Power Cycles for Electricity Generation. [cited 2010 Feb. 11th]; Available from: http://www.powerfromthesun.net/chapter12/Chapter12new_files/image003.jpg.
37. Electropaedia. Electricity Generation using Steam Turbines. 2010; Available from: http://www.mpoweruk.com/steam_turbines.htm.
38. Wikipedia. Deaerator. 2010a; Available from: http://en.wikipedia.org/wiki/Deaerator. 39. Jockenhövel, T., Schneider, R., Sandell, M. & Schlüter, L., Optimal Power Plant
Integration of Post-Combustion CO2 Capture, in POWER-GEN Europe 2009. 2009, Siemens AG: Cologne, Germany. p. 14.
40. Bolland, O. and H. Undrum, A novel methodology for comparing CO2 capture options for natural gas-fired combined cycle plants. Advances in Environmental Research, 2003. 7(4): p. 901-911.
41. Alie, C.F., CO2 Capture With MEA: Integrating the Absorption Process and Steam Cycle of an Existing Coal-Fired Power Plant. 2004, University of Waterloo.
42. Bolland, O., Personal Communication. 2010.
References
97
43. GEA Process Engineering Division, Evaporation Technology using Mechanical Vapour Recompression, G.E. Technologies, Editor. 2010.
44. Kadant (2009) Thermocompressors - Engineered for efficiency. 45. Kehlhofer, R., Rukes B., Hannemann F. & Stirnimann F., The Combined-Cycle Gas &
Steam Turbine Power 3rd edition. 2009. 46. Linnenberg, S., Jochen, O. & Kather, A., Desing Considerations of Post-Combustion
CO2 Capture Process during Part Load Operation of Coal-Fired Power Plants, in 12th International Post Combustion Capture Network Meeting. 2009.
47. Moran, M.J.S., H. N., Fundamentals of Engineering Thermodynamics, 5th edition. 2004. 48. Lucquiaud, M., Patel, P., Chalmers, H. & Gibbins, J., Retrofitting CO2 capture ready
fossil plants with post-combustion capture. Part 1: requirements for supercritical pulverized coal plants using solvent-based flue gas scrubbing. Proceedings of the Institution of Mechanical Engineers, Part A: Journal of Power and Energy, 2009a. 223(3).
49. Lucquiaud, M., Patel, P., Chalmers, H. & Gibbins, J., Retrofitting CO2 capture ready fossil plants with post-combustion capture. Part 2: requirements for natural gas combined cycle plants using solvent-based flue gas scrubbing. Proceedings of the Institution of Mechanical Engineers, Part A: Journal of Power and Energy, 2009b. 223(3): p. 227-238.
50. Hetland, J. and T. Christensen, Assessment of a fully integrated SARGAS process operating on coal with near zero emissions. Applied Thermal Engineering, 2008. 28(16): p. 2030-2038.
51. Honeywell Process Solutions, UniSim Design Suite. 2010, UniSim is a registred trademark of Honeywell Process Solutions, www.honeywell.com.
52. Kvamsdal, H.M., et al., Maintaining a neutral water balance in a 450 MWe NGCC-CCS power system with post-combustion carbon dioxide capture aimed at offshore operation. International Journal of Greenhouse Gas Control. In Press, Corrected Proof.
53. Bøe, S.E., Gas Fired Power Plant at Kårstø, in TPG 4140 Natural Gas, Course material. 2008, Department of Petroleum Engineering and Applied Geophysics.
54. Thermoflow, GT PRO 20.0 & STEAM PRO 20.0. 2010, GT PRO & STEAM PRO are registred trademarks of Thermoflow Inc, www.thermoflow.com.
55. Lozza, G., Chiesa, P., Romano, G. & Valenti, G. CO2 Capture from Natural Gas Combined Cycles. in 1st International Conference on Sustainable Fossil Fuels for Future Energy. 2009.
56. Rochelle, G.T., Innovative Stripper Configurations to Reduce the Energy Cost of CO2 Capture. Second Annual Carbon Sequestration Conference, Alexandria, VA, USA, 2003.


Appendices
99
12 Appendices

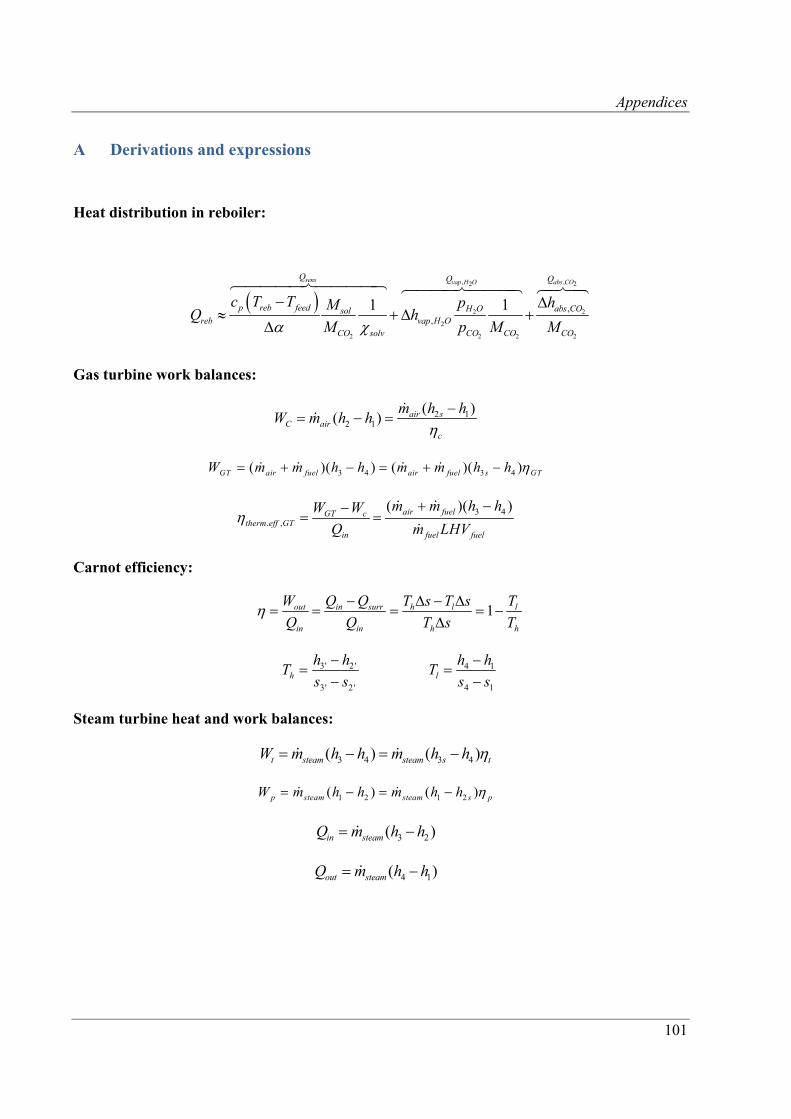
Appendices
101
A Derivations and expressions
Heat distribution in reboiler:
, ,2 2
2 2
2
2 2 2 2
,,
1 1
sens vap H O abs COQ Q Q
p reb feed H O abs COsolreb vap H O
CO solv CO CO CO
c T T p hMQ h
M p M M
Gas turbine work balances:
2 12 1
( )( ) air s
C airc
m h hW m h h
3 4 3 4( )( ) ( )( )GT air fuel air fuel s GTW m m h h m m h h
3 4. ,
( )( )air fuelGT ctherm eff GT
in fuel fuel
m m h hW W
Q m LHV
Carnot efficiency:
1out in surr h l l
in in h h
W Q Q T s T s T
Q Q T s T
3' 2 '
3' 2 'h
h hT
s s
4 1
4 1l
h hT
s s
Steam turbine heat and work balances:
3 4 3 4( ) ( )t steam steam s tW m h h m h h
1 2 1 2( ) ( )p steam steam s pW m h h m h h
3 2( )in steamQ m h h
4 1( )out steamQ m h h
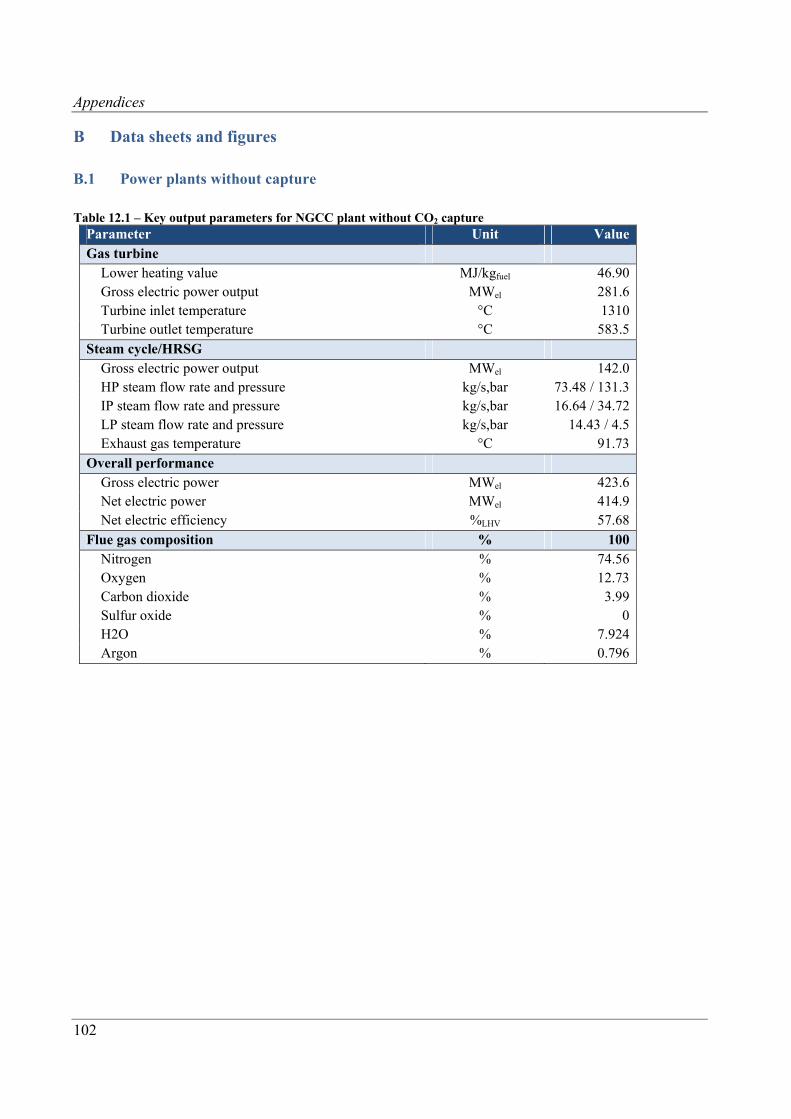
Appendices
102
B Data sheets and figures
B.1 Power plants without capture
Table 12.1 – Key output parameters for NGCC plant without CO2 capture
Parameter Unit Value Gas turbine
Lower heating value MJ/kgfuel 46.90 Gross electric power output MWel 281.6 Turbine inlet temperature °C 1310 Turbine outlet temperature °C 583.5
Steam cycle/HRSG Gross electric power output MWel 142.0 HP steam flow rate and pressure kg/s,bar 73.48 / 131.3 IP steam flow rate and pressure kg/s,bar 16.64 / 34.72 LP steam flow rate and pressure kg/s,bar 14.43 / 4.5 Exhaust gas temperature °C 91.73
Overall performance Gross electric power MWel 423.6 Net electric power MWel 414.9 Net electric efficiency %LHV 57.68
Flue gas composition % 100 Nitrogen % 74.56 Oxygen % 12.73 Carbon dioxide % 3.99 Sulfur oxide % 0 H2O % 7.924 Argon % 0.796
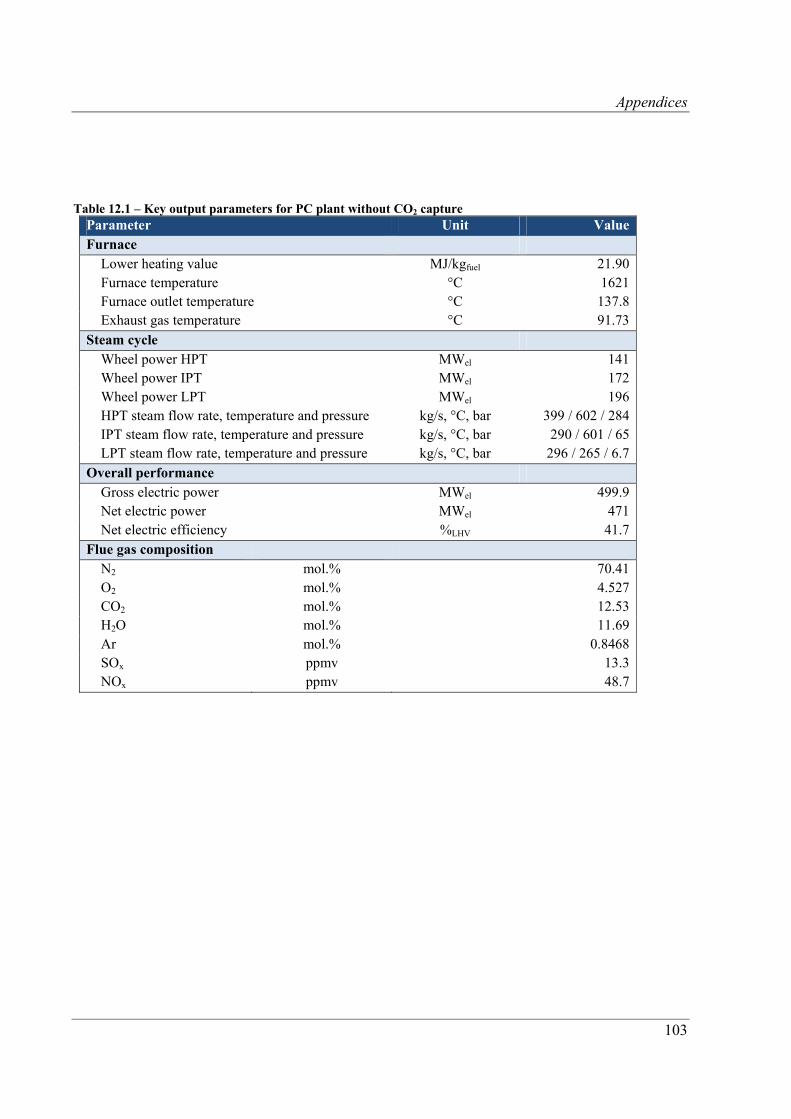
Appendices
103
Table 12.1 – Key output parameters for PC plant without CO2 capture
Parameter Unit Value Furnace
Lower heating value MJ/kgfuel 21.90 Furnace temperature °C 1621 Furnace outlet temperature °C 137.8 Exhaust gas temperature °C 91.73
Steam cycle Wheel power HPT MWel 141 Wheel power IPT MWel 172 Wheel power LPT MWel 196 HPT steam flow rate, temperature and pressure kg/s, °C, bar 399 / 602 / 284 IPT steam flow rate, temperature and pressure kg/s, °C, bar 290 / 601 / 65 LPT steam flow rate, temperature and pressure kg/s, °C, bar 296 / 265 / 6.7
Overall performance Gross electric power MWel 499.9 Net electric power MWel 471 Net electric efficiency %LHV 41.7
Flue gas composition N2 mol.% 70.41 O2 mol.% 4.527 CO2 mol.% 12.53 H2O mol.% 11.69 Ar mol.% 0.8468 SOx ppmv 13.3 NOx ppmv 48.7
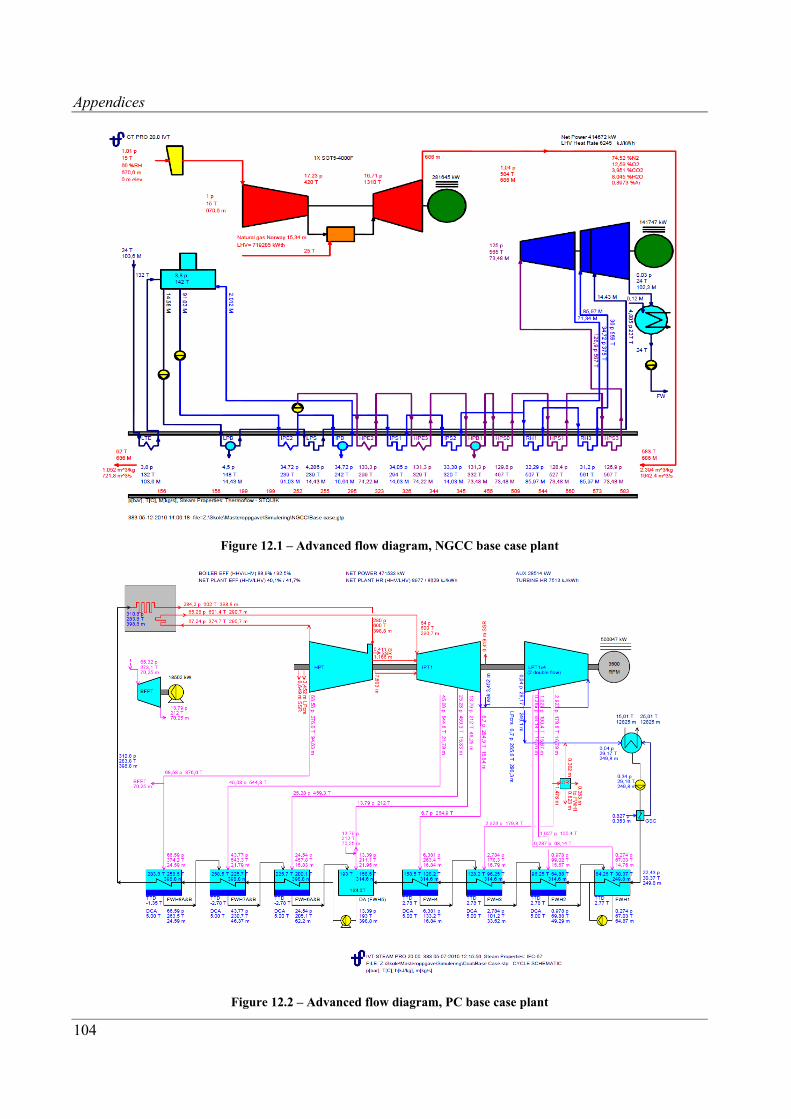
Appendices
104
Figure 12.1 – Advanced flow diagram, NGCC base case plant
Figure 12.2 – Advanced flow diagram, PC base case plant
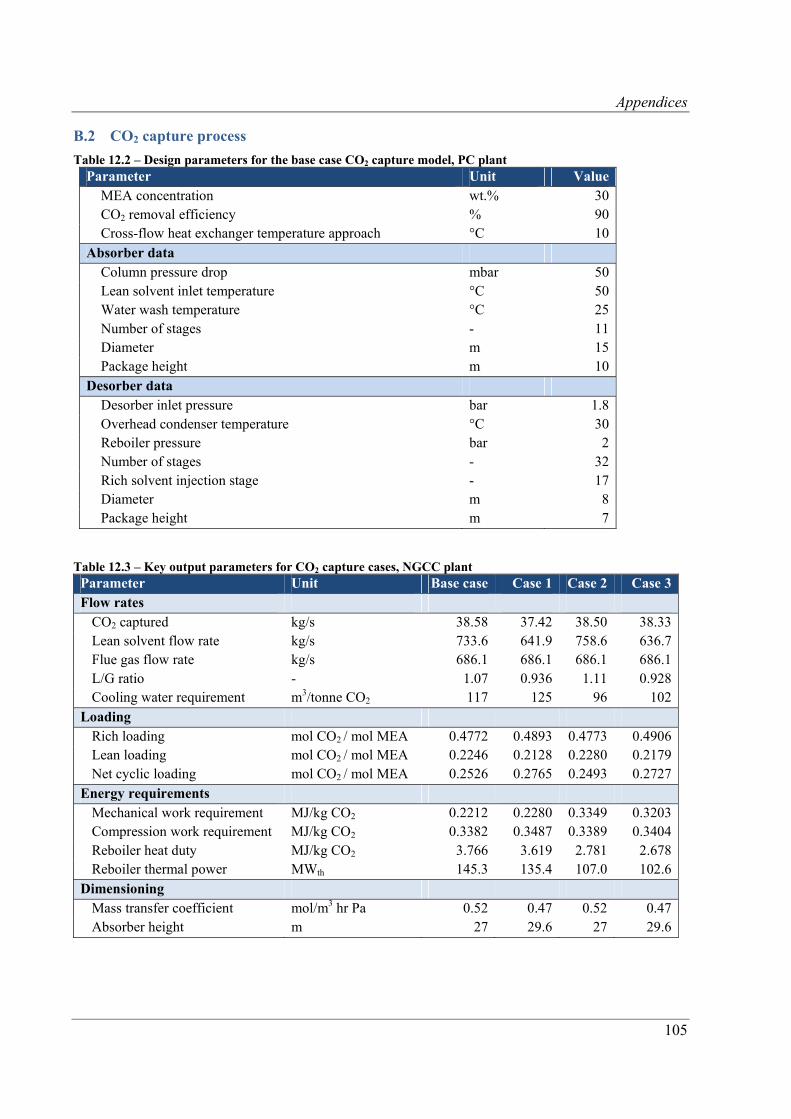
Appendices
105
B.2 CO2 capture process
Table 12.2 – Design parameters for the base case CO2 capture model, PC plant Parameter Unit Value
MEA concentration wt.% 30 CO2 removal efficiency % 90 Cross-flow heat exchanger temperature approach °C 10
Absorber data Column pressure drop mbar 50 Lean solvent inlet temperature °C 50 Water wash temperature °C 25 Number of stages - 11 Diameter m 15 Package height m 10
Desorber data Desorber inlet pressure bar 1.8 Overhead condenser temperature °C 30 Reboiler pressure bar 2 Number of stages - 32 Rich solvent injection stage - 17 Diameter m 8 Package height m 7
Table 12.3 – Key output parameters for CO2 capture cases, NGCC plant Parameter Unit Base case Case 1 Case 2 Case 3Flow rates
CO2 captured kg/s 38.58 37.42 38.50 38.33Lean solvent flow rate kg/s 733.6 641.9 758.6 636.7Flue gas flow rate kg/s 686.1 686.1 686.1 686.1L/G ratio - 1.07 0.936 1.11 0.928Cooling water requirement m3/tonne CO2 117 125 96 102
Loading Rich loading mol CO2 / mol MEA 0.4772 0.4893 0.4773 0.4906Lean loading mol CO2 / mol MEA 0.2246 0.2128 0.2280 0.2179Net cyclic loading mol CO2 / mol MEA 0.2526 0.2765 0.2493 0.2727
Energy requirements Mechanical work requirement MJ/kg CO2 0.2212 0.2280 0.3349 0.3203Compression work requirement MJ/kg CO2 0.3382 0.3487 0.3389 0.3404Reboiler heat duty MJ/kg CO2 3.766 3.619 2.781 2.678Reboiler thermal power MWth 145.3 135.4 107.0 102.6
Dimensioning Mass transfer coefficient mol/m3 hr Pa 0.52 0.47 0.52 0.47Absorber height m 27 29.6 27 29.6
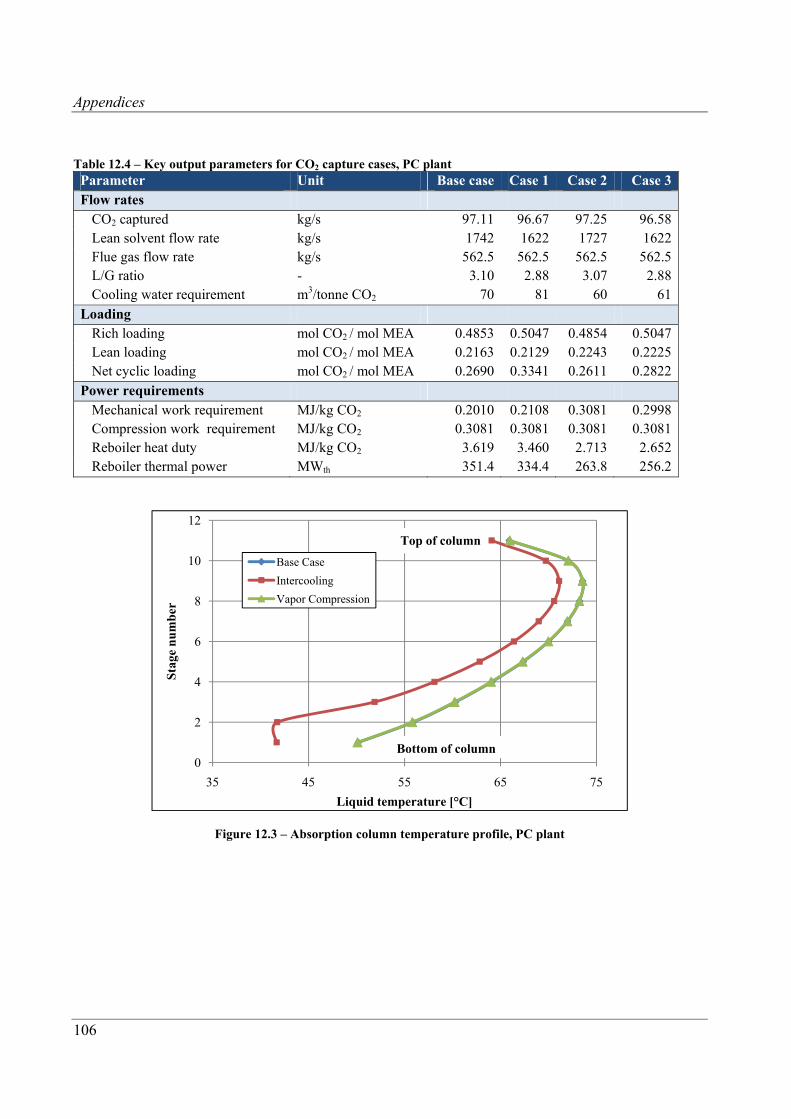
Appendices
106
Table 12.4 – Key output parameters for CO2 capture cases, PC plant Parameter Unit Base case Case 1 Case 2 Case 3Flow rates
CO2 captured kg/s 97.11 96.67 97.25 96.58Lean solvent flow rate kg/s 1742 1622 1727 1622Flue gas flow rate kg/s 562.5 562.5 562.5 562.5L/G ratio - 3.10 2.88 3.07 2.88Cooling water requirement m3/tonne CO2 70 81 60 61
Loading Rich loading mol CO2 / mol MEA 0.4853 0.5047 0.4854 0.5047Lean loading mol CO2 / mol MEA 0.2163 0.2129 0.2243 0.2225Net cyclic loading mol CO2 / mol MEA 0.2690 0.3341 0.2611 0.2822
Power requirements Mechanical work requirement MJ/kg CO2 0.2010 0.2108 0.3081 0.2998Compression work requirement MJ/kg CO2 0.3081 0.3081 0.3081 0.3081Reboiler heat duty MJ/kg CO2 3.619 3.460 2.713 2.652Reboiler thermal power MWth 351.4 334.4 263.8 256.2
Figure 12.3 – Absorption column temperature profile, PC plant
0
2
4
6
8
10
12
35 45 55 65 75
Sta
ge n
um
ber
Liquid temperature [°C]
Base Case
Intercooling
Vapor Compression
Bottom of column
Top of column
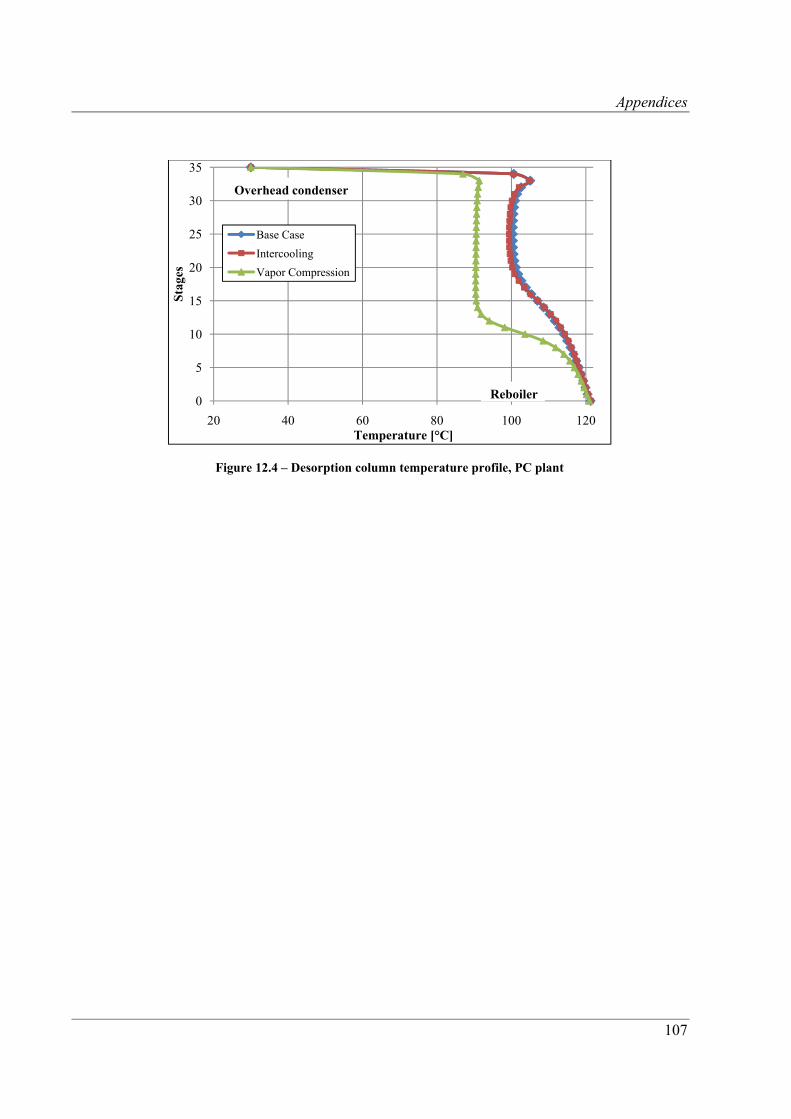
Appendices
107
Figure 12.4 – Desorption column temperature profile, PC plant
0
5
10
15
20
25
30
35
20 40 60 80 100 120
Sta
ges
Temperature [°C]
Base Case
Intercooling
Vapor Compression
Reboiler
Overhead condenser
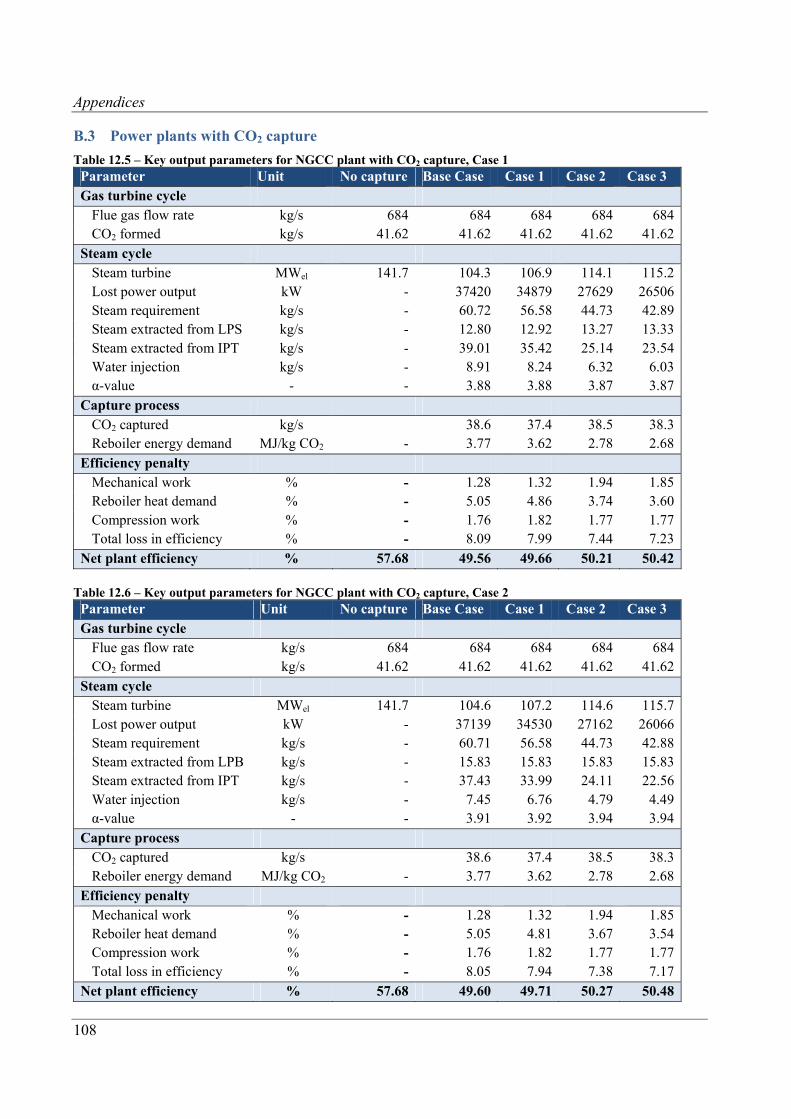
Appendices
108
B.3 Power plants with CO2 capture
Table 12.5 – Key output parameters for NGCC plant with CO2 capture, Case 1 Parameter Unit No capture Base Case Case 1 Case 2 Case 3 Gas turbine cycle
Flue gas flow rate kg/s 684 684 684 684 684CO2 formed kg/s 41.62 41.62 41.62 41.62 41.62
Steam cycle Steam turbine MWel 141.7 104.3 106.9 114.1 115.2Lost power output kW - 37420 34879 27629 26506Steam requirement kg/s - 60.72 56.58 44.73 42.89Steam extracted from LPS kg/s - 12.80 12.92 13.27 13.33Steam extracted from IPT kg/s - 39.01 35.42 25.14 23.54Water injection kg/s - 8.91 8.24 6.32 6.03α-value - - 3.88 3.88 3.87 3.87
Capture process CO2 captured kg/s 38.6 37.4 38.5 38.3Reboiler energy demand MJ/kg CO2 - 3.77 3.62 2.78 2.68
Efficiency penalty Mechanical work % - 1.28 1.32 1.94 1.85Reboiler heat demand % - 5.05 4.86 3.74 3.60Compression work % - 1.76 1.82 1.77 1.77Total loss in efficiency % - 8.09 7.99 7.44 7.23
Net plant efficiency % 57.68 49.56 49.66 50.21 50.42
Table 12.6 – Key output parameters for NGCC plant with CO2 capture, Case 2 Parameter Unit No capture Base Case Case 1 Case 2 Case 3 Gas turbine cycle
Flue gas flow rate kg/s 684 684 684 684 684CO2 formed kg/s 41.62 41.62 41.62 41.62 41.62
Steam cycle Steam turbine MWel 141.7 104.6 107.2 114.6 115.7Lost power output kW - 37139 34530 27162 26066Steam requirement kg/s - 60.71 56.58 44.73 42.88Steam extracted from LPB kg/s - 15.83 15.83 15.83 15.83Steam extracted from IPT kg/s - 37.43 33.99 24.11 22.56Water injection kg/s - 7.45 6.76 4.79 4.49α-value - - 3.91 3.92 3.94 3.94
Capture process CO2 captured kg/s 38.6 37.4 38.5 38.3Reboiler energy demand MJ/kg CO2 - 3.77 3.62 2.78 2.68
Efficiency penalty Mechanical work % - 1.28 1.32 1.94 1.85Reboiler heat demand % - 5.05 4.81 3.67 3.54Compression work % - 1.76 1.82 1.77 1.77Total loss in efficiency % - 8.05 7.94 7.38 7.17
Net plant efficiency % 57.68 49.60 49.71 50.27 50.48
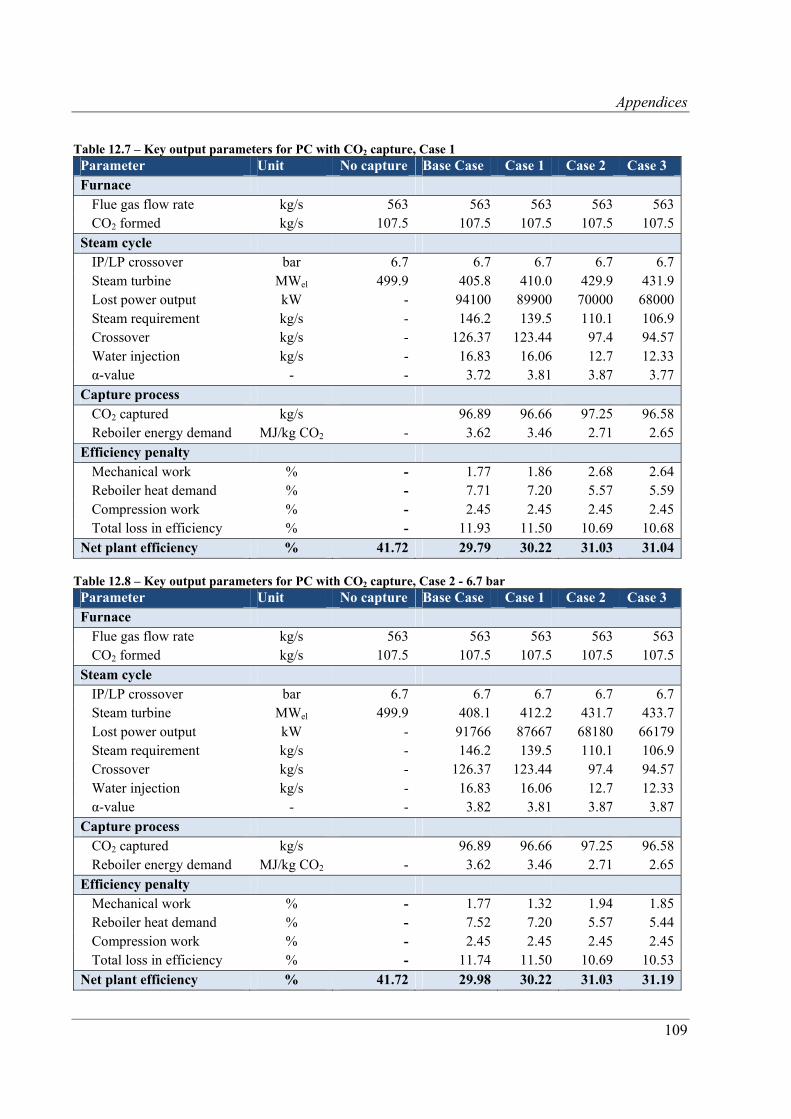
Appendices
109
Table 12.7 – Key output parameters for PC with CO2 capture, Case 1 Parameter Unit No capture Base Case Case 1 Case 2 Case 3 Furnace
Flue gas flow rate kg/s 563 563 563 563 563CO2 formed kg/s 107.5 107.5 107.5 107.5 107.5
Steam cycle IP/LP crossover bar 6.7 6.7 6.7 6.7 6.7Steam turbine MWel 499.9 405.8 410.0 429.9 431.9Lost power output kW - 94100 89900 70000 68000Steam requirement kg/s - 146.2 139.5 110.1 106.9Crossover kg/s - 126.37 123.44 97.4 94.57Water injection kg/s - 16.83 16.06 12.7 12.33α-value - - 3.72 3.81 3.87 3.77
Capture process CO2 captured kg/s 96.89 96.66 97.25 96.58Reboiler energy demand MJ/kg CO2 - 3.62 3.46 2.71 2.65
Efficiency penalty Mechanical work % - 1.77 1.86 2.68 2.64Reboiler heat demand % - 7.71 7.20 5.57 5.59Compression work % - 2.45 2.45 2.45 2.45Total loss in efficiency % - 11.93 11.50 10.69 10.68
Net plant efficiency % 41.72 29.79 30.22 31.03 31.04 Table 12.8 – Key output parameters for PC with CO2 capture, Case 2 - 6.7 bar Parameter Unit No capture Base Case Case 1 Case 2 Case 3 Furnace
Flue gas flow rate kg/s 563 563 563 563 563CO2 formed kg/s 107.5 107.5 107.5 107.5 107.5
Steam cycle IP/LP crossover bar 6.7 6.7 6.7 6.7 6.7Steam turbine MWel 499.9 408.1 412.2 431.7 433.7Lost power output kW - 91766 87667 68180 66179Steam requirement kg/s - 146.2 139.5 110.1 106.9Crossover kg/s - 126.37 123.44 97.4 94.57Water injection kg/s - 16.83 16.06 12.7 12.33α-value - - 3.82 3.81 3.87 3.87
Capture process CO2 captured kg/s 96.89 96.66 97.25 96.58Reboiler energy demand MJ/kg CO2 - 3.62 3.46 2.71 2.65
Efficiency penalty Mechanical work % - 1.77 1.32 1.94 1.85Reboiler heat demand % - 7.52 7.20 5.57 5.44Compression work % - 2.45 2.45 2.45 2.45Total loss in efficiency % - 11.74 11.50 10.69 10.53
Net plant efficiency % 41.72 29.98 30.22 31.03 31.19
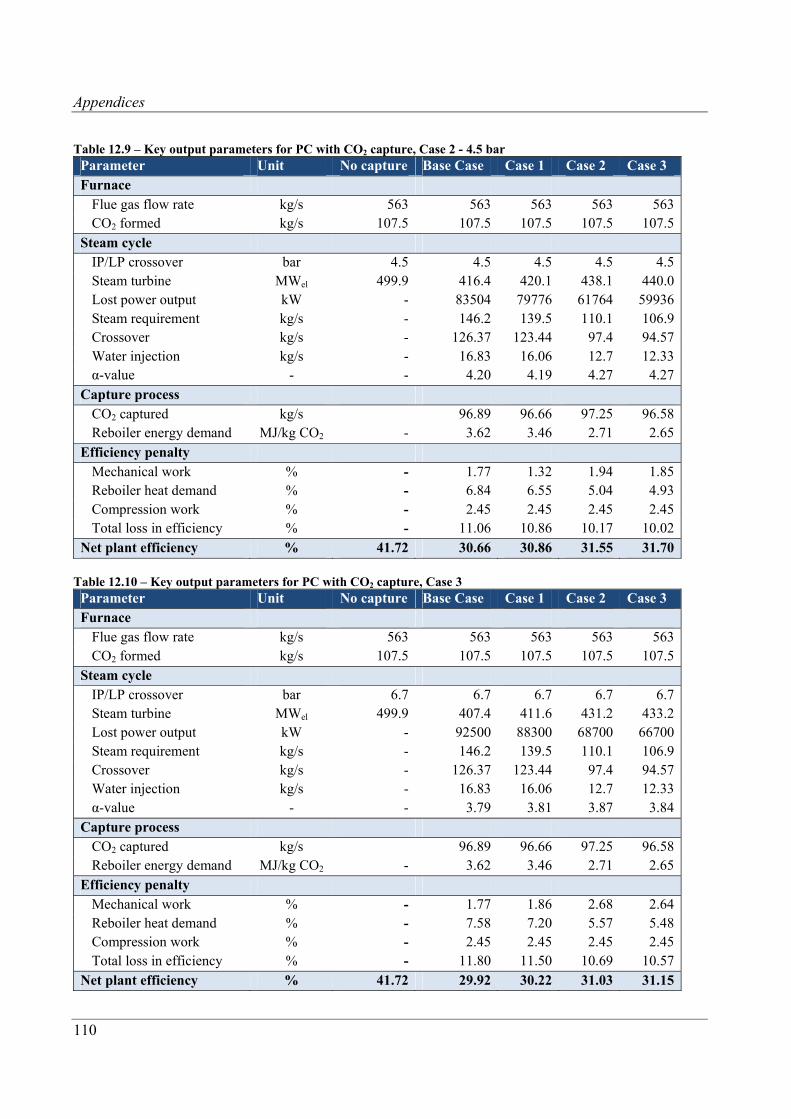
Appendices
110
Table 12.9 – Key output parameters for PC with CO2 capture, Case 2 - 4.5 bar Parameter Unit No capture Base Case Case 1 Case 2 Case 3 Furnace
Flue gas flow rate kg/s 563 563 563 563 563CO2 formed kg/s 107.5 107.5 107.5 107.5 107.5
Steam cycle IP/LP crossover bar 4.5 4.5 4.5 4.5 4.5Steam turbine MWel 499.9 416.4 420.1 438.1 440.0Lost power output kW - 83504 79776 61764 59936Steam requirement kg/s - 146.2 139.5 110.1 106.9Crossover kg/s - 126.37 123.44 97.4 94.57Water injection kg/s - 16.83 16.06 12.7 12.33α-value - - 4.20 4.19 4.27 4.27
Capture process CO2 captured kg/s 96.89 96.66 97.25 96.58Reboiler energy demand MJ/kg CO2 - 3.62 3.46 2.71 2.65
Efficiency penalty Mechanical work % - 1.77 1.32 1.94 1.85Reboiler heat demand % - 6.84 6.55 5.04 4.93Compression work % - 2.45 2.45 2.45 2.45Total loss in efficiency % - 11.06 10.86 10.17 10.02
Net plant efficiency % 41.72 30.66 30.86 31.55 31.70
Table 12.10 – Key output parameters for PC with CO2 capture, Case 3 Parameter Unit No capture Base Case Case 1 Case 2 Case 3 Furnace
Flue gas flow rate kg/s 563 563 563 563 563CO2 formed kg/s 107.5 107.5 107.5 107.5 107.5
Steam cycle IP/LP crossover bar 6.7 6.7 6.7 6.7 6.7Steam turbine MWel 499.9 407.4 411.6 431.2 433.2Lost power output kW - 92500 88300 68700 66700Steam requirement kg/s - 146.2 139.5 110.1 106.9Crossover kg/s - 126.37 123.44 97.4 94.57Water injection kg/s - 16.83 16.06 12.7 12.33α-value - - 3.79 3.81 3.87 3.84
Capture process CO2 captured kg/s 96.89 96.66 97.25 96.58Reboiler energy demand MJ/kg CO2 - 3.62 3.46 2.71 2.65
Efficiency penalty Mechanical work % - 1.77 1.86 2.68 2.64Reboiler heat demand % - 7.58 7.20 5.57 5.48Compression work % - 2.45 2.45 2.45 2.45Total loss in efficiency % - 11.80 11.50 10.69 10.57
Net plant efficiency % 41.72 29.92 30.22 31.03 31.15
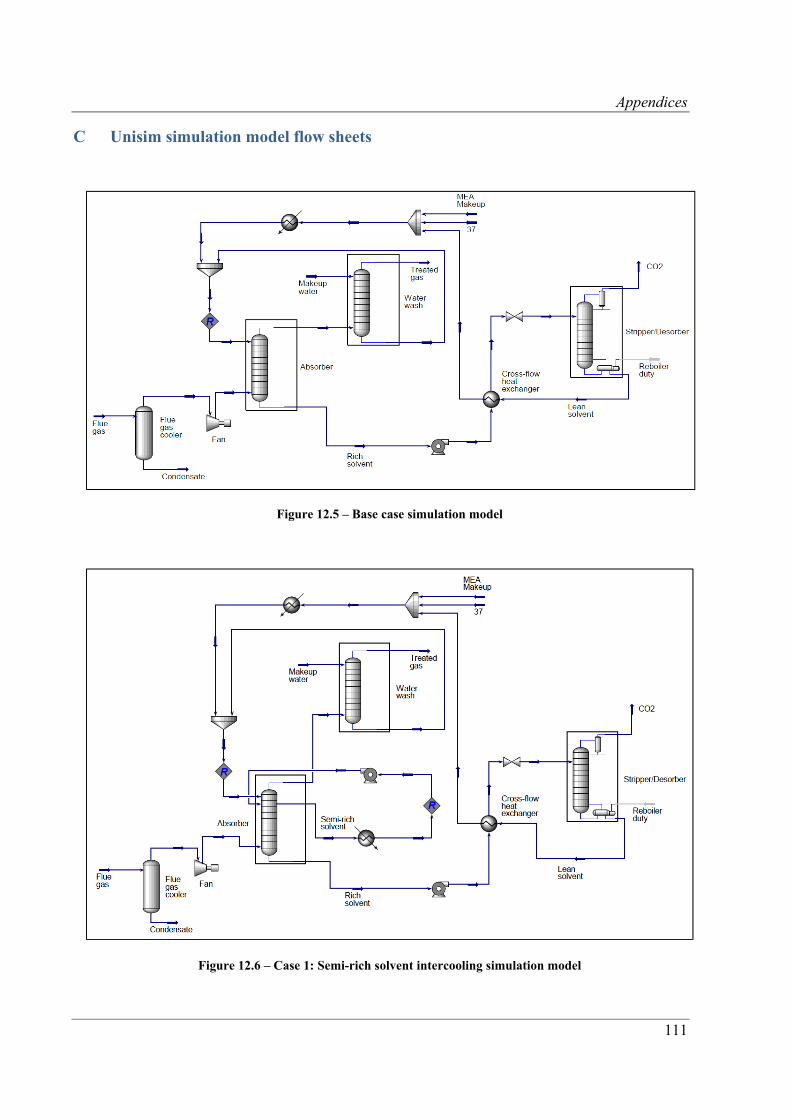
Appendices
111
C Unisim simulation model flow sheets
Figure 12.5 – Base case simulation model
Figure 12.6 – Case 1: Semi-rich solvent intercooling simulation model
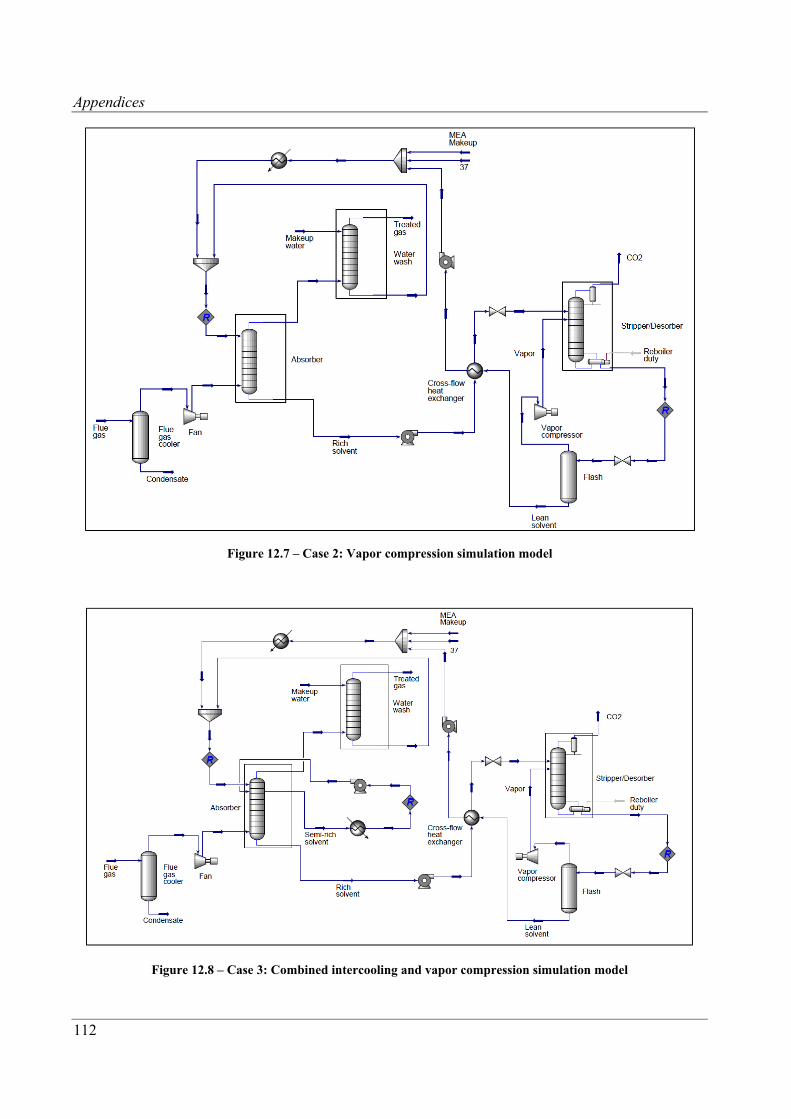
Appendices
112
Figure 12.7 – Case 2: Vapor compression simulation model
Figure 12.8 – Case 3: Combined intercooling and vapor compression simulation model
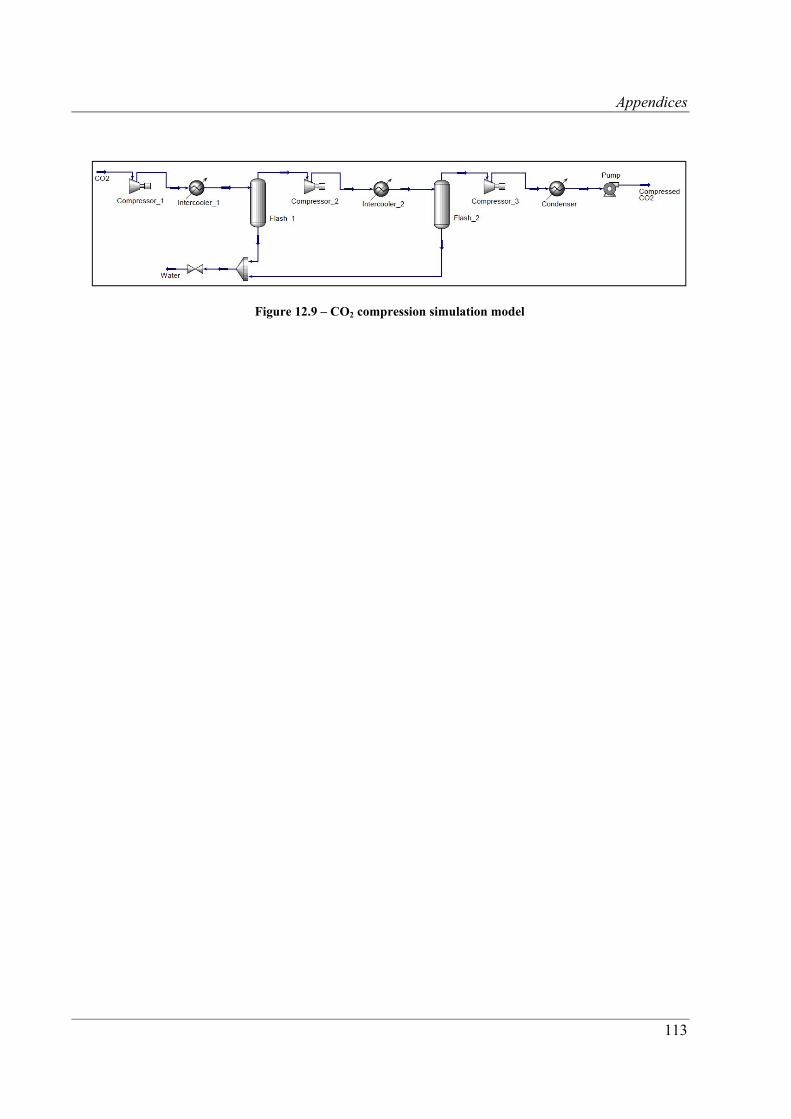
Appendices
113
Figure 12.9 – CO2 compression simulation model
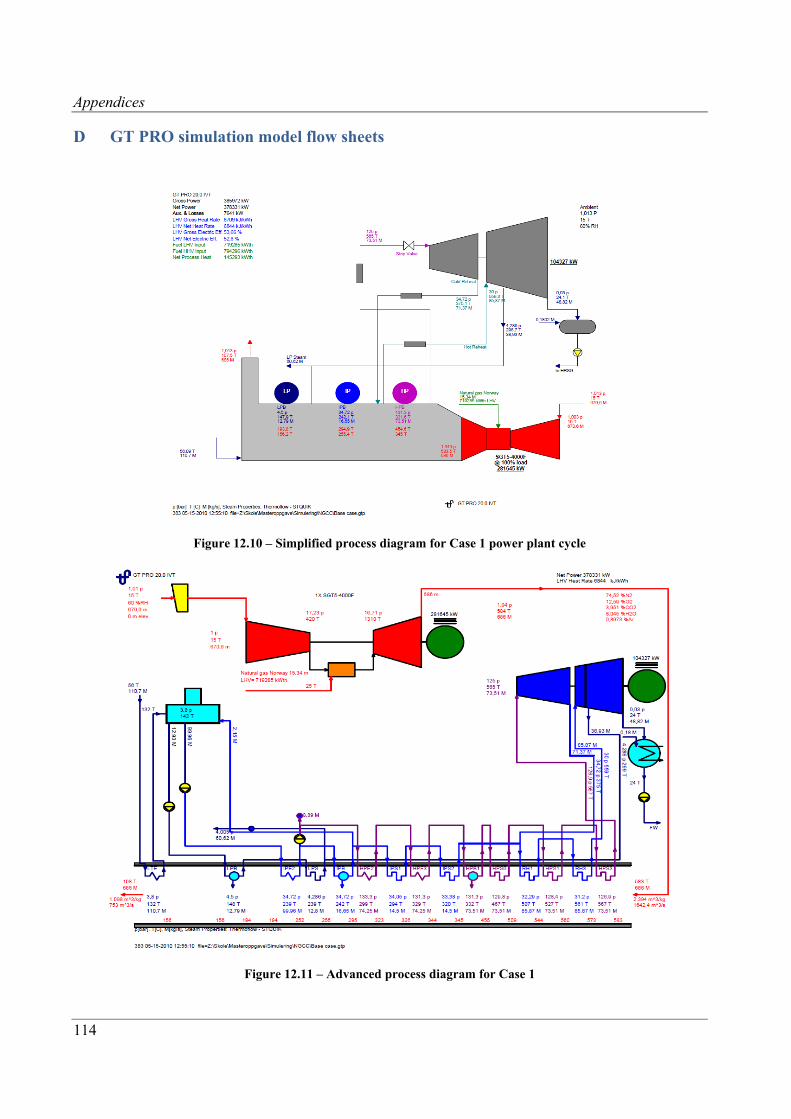
Appendices
114
D GT PRO simulation model flow sheets
Figure 12.10 – Simplified process diagram for Case 1 power plant cycle
Figure 12.11 – Advanced process diagram for Case 1
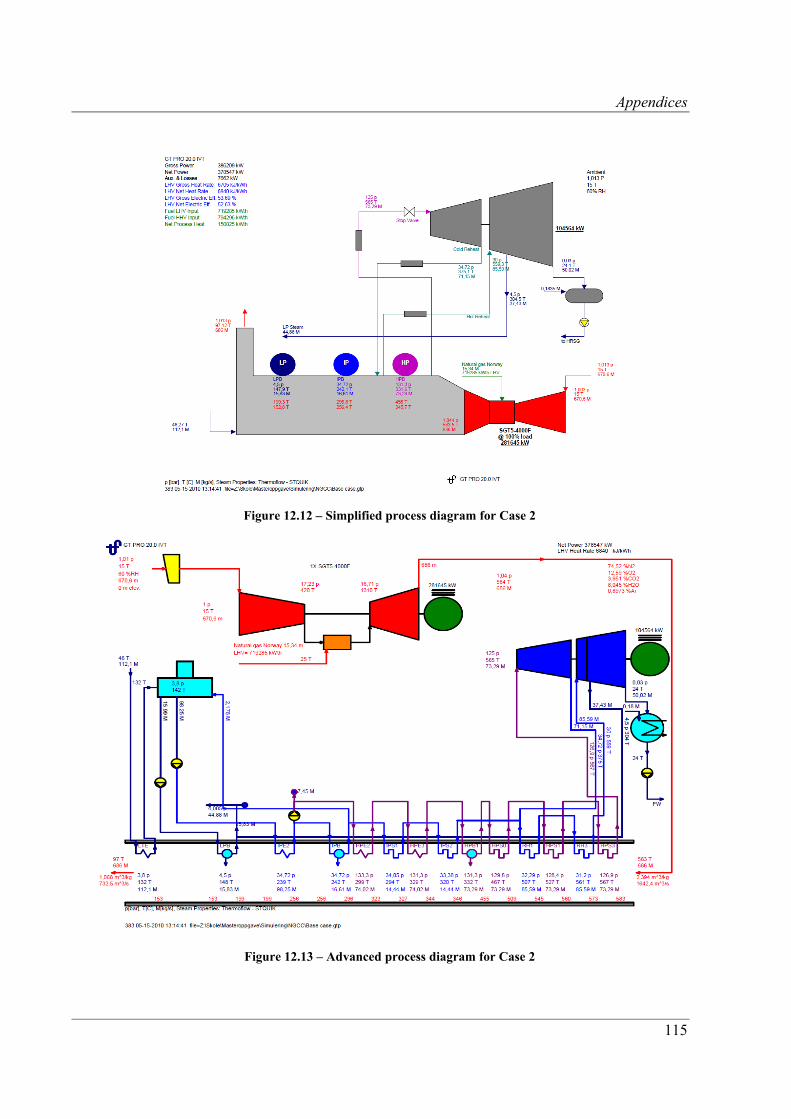
Appendices
115
Figure 12.12 – Simplified process diagram for Case 2
Figure 12.13 – Advanced process diagram for Case 2
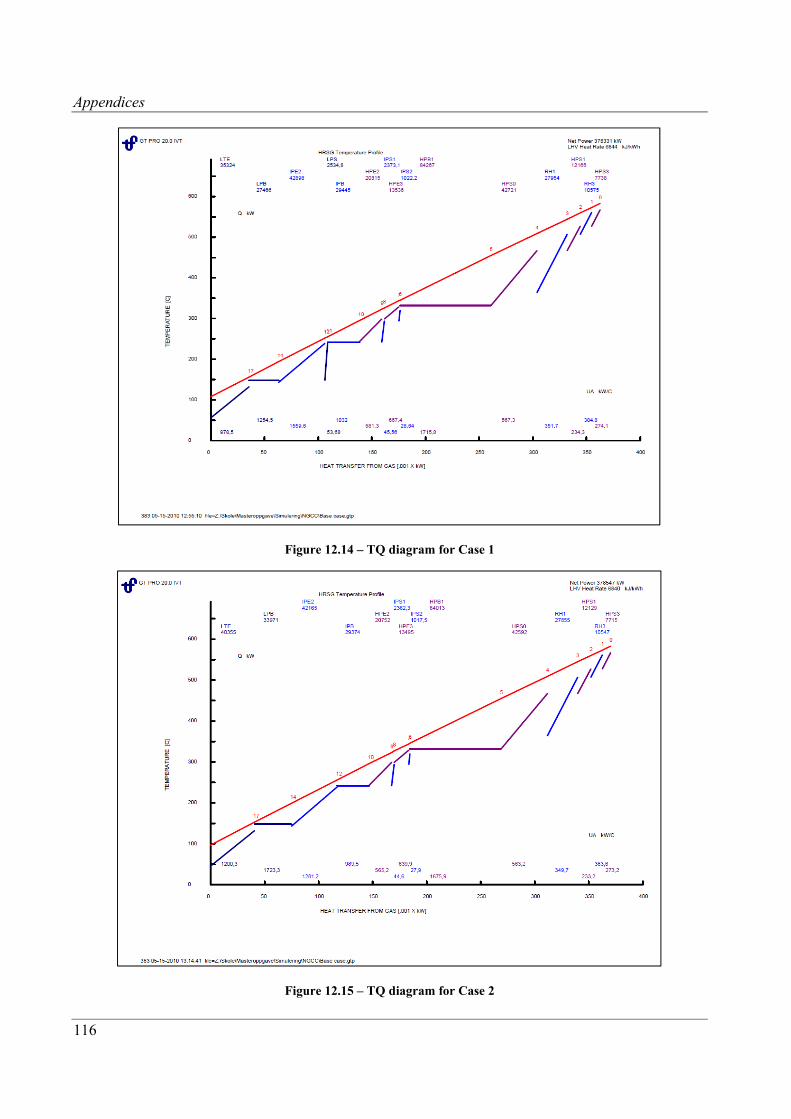
Appendices
116
Figure 12.14 – TQ diagram for Case 1
Figure 12.15 – TQ diagram for Case 2
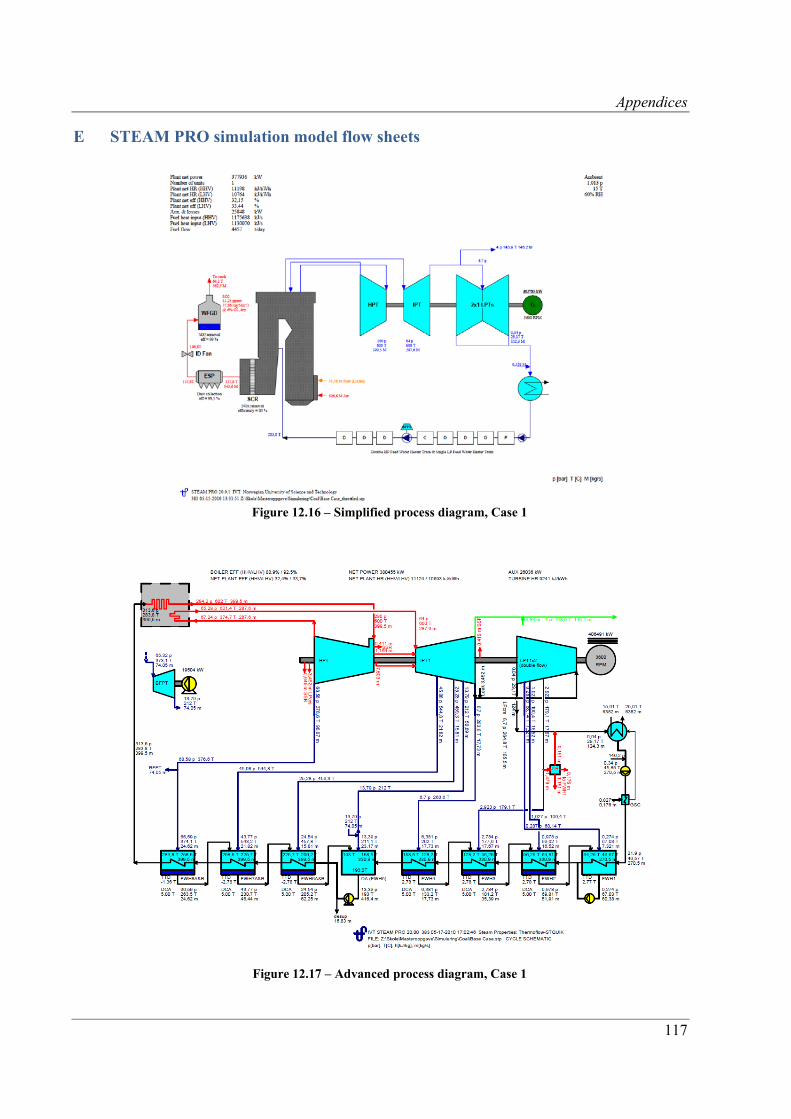
Appendices
117
E STEAM PRO simulation model flow sheets
Figure 12.16 – Simplified process diagram, Case 1
Figure 12.17 – Advanced process diagram, Case 1
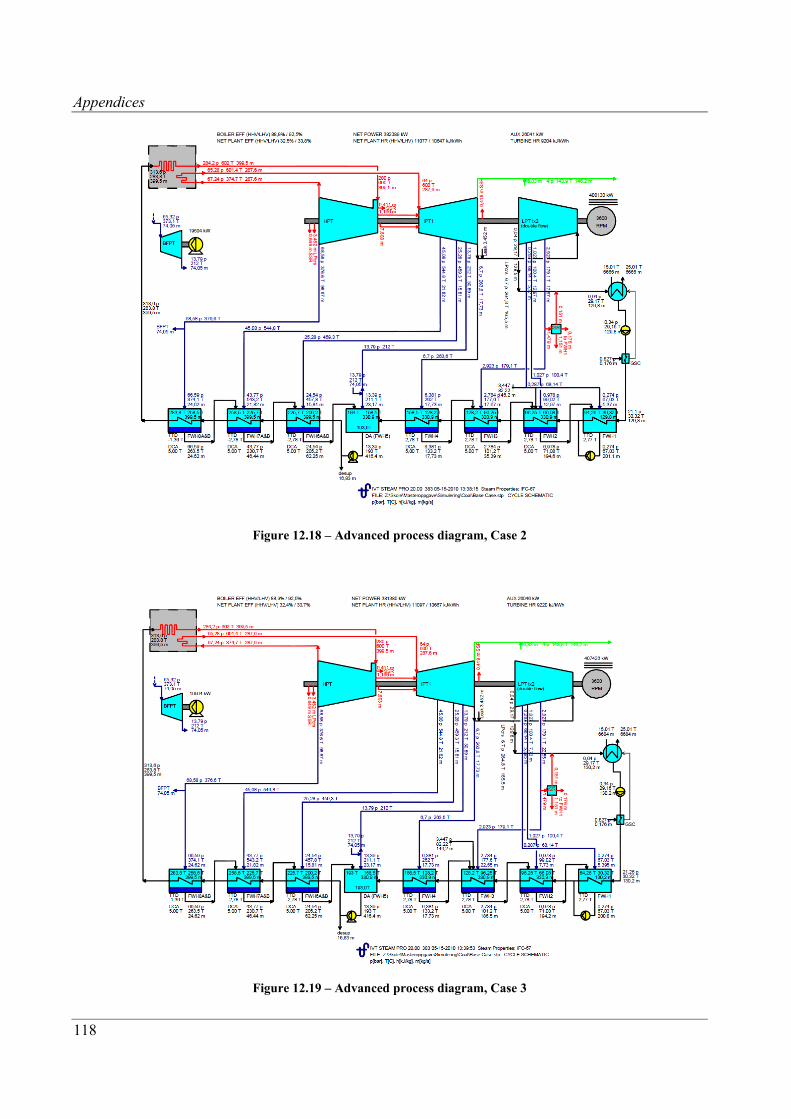
Appendices
118
Figure 12.18 – Advanced process diagram, Case 2
Figure 12.19 – Advanced process diagram, Case 3
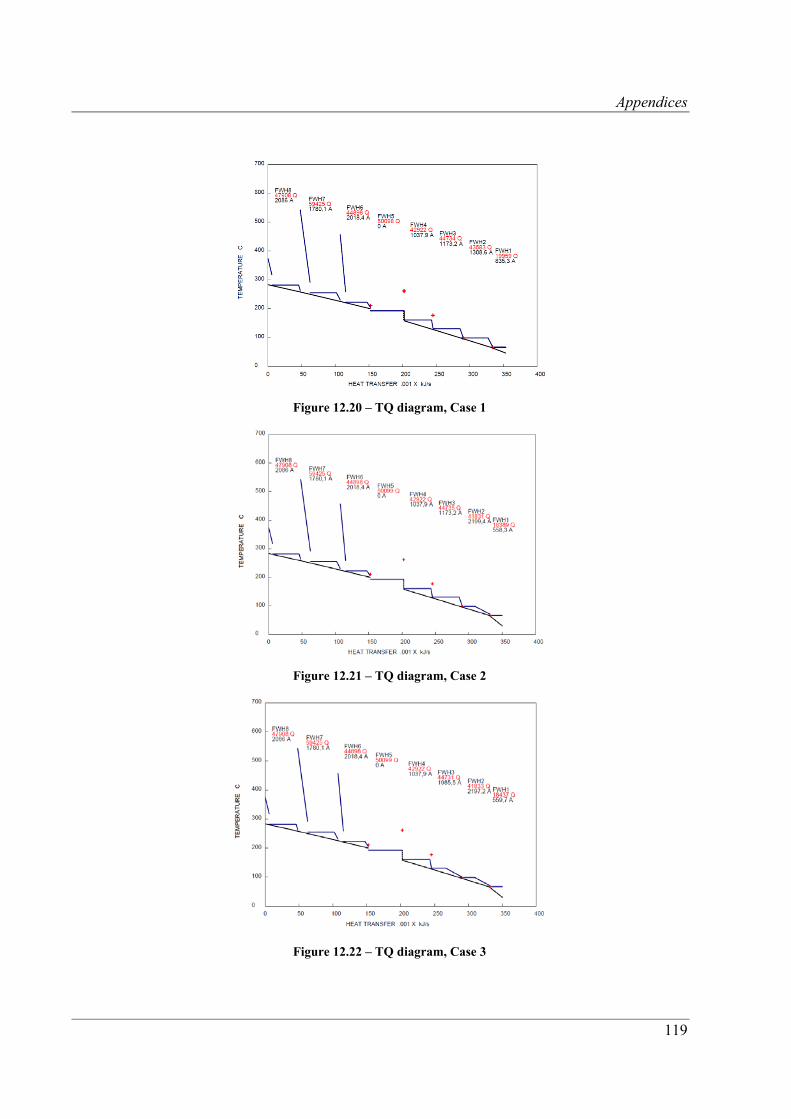
Appendices
119
Figure 12.20 – TQ diagram, Case 1
Figure 12.21 – TQ diagram, Case 2
Figure 12.22 – TQ diagram, Case 3

Appendices
120
Figure 12.23 – FWH1 Base Case
Figure 12.24 – FWH1 Case 1
Figure 12.25 – FWH1 Case 2
Figure 12.26 – FWH1 Case 3
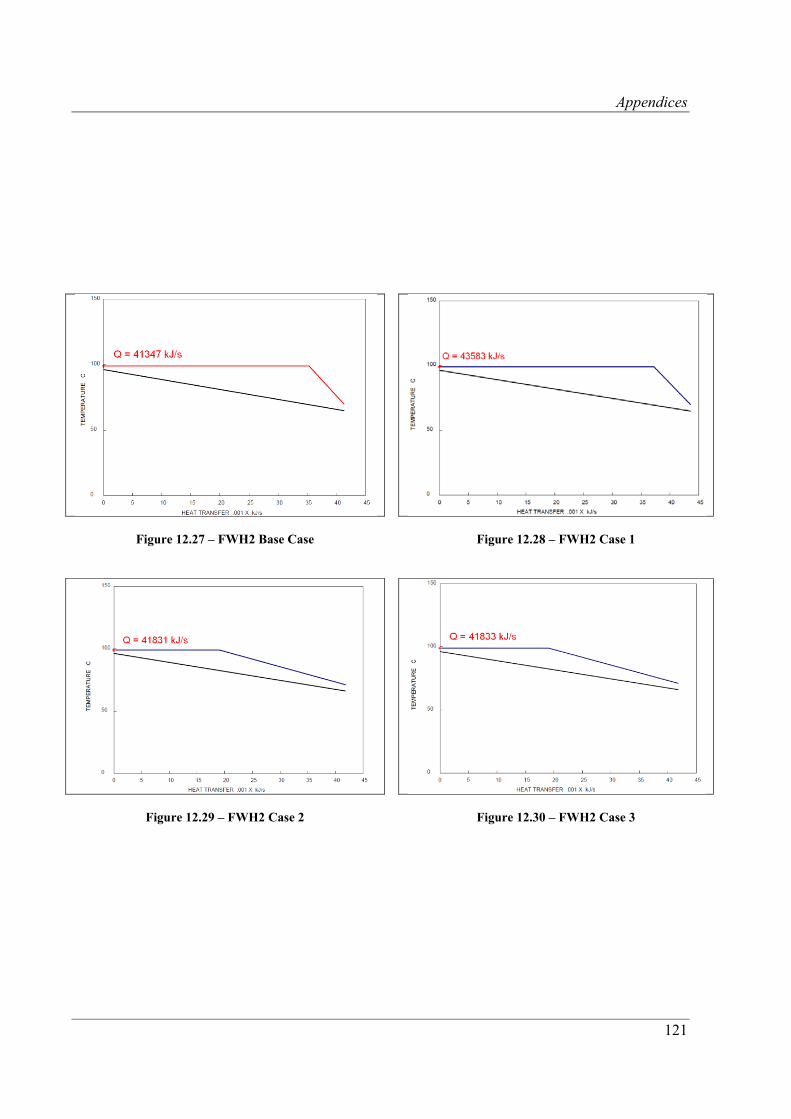
Appendices
121
Figure 12.27 – FWH2 Base Case
Figure 12.28 – FWH2 Case 1
Figure 12.29 – FWH2 Case 2
Figure 12.30 – FWH2 Case 3
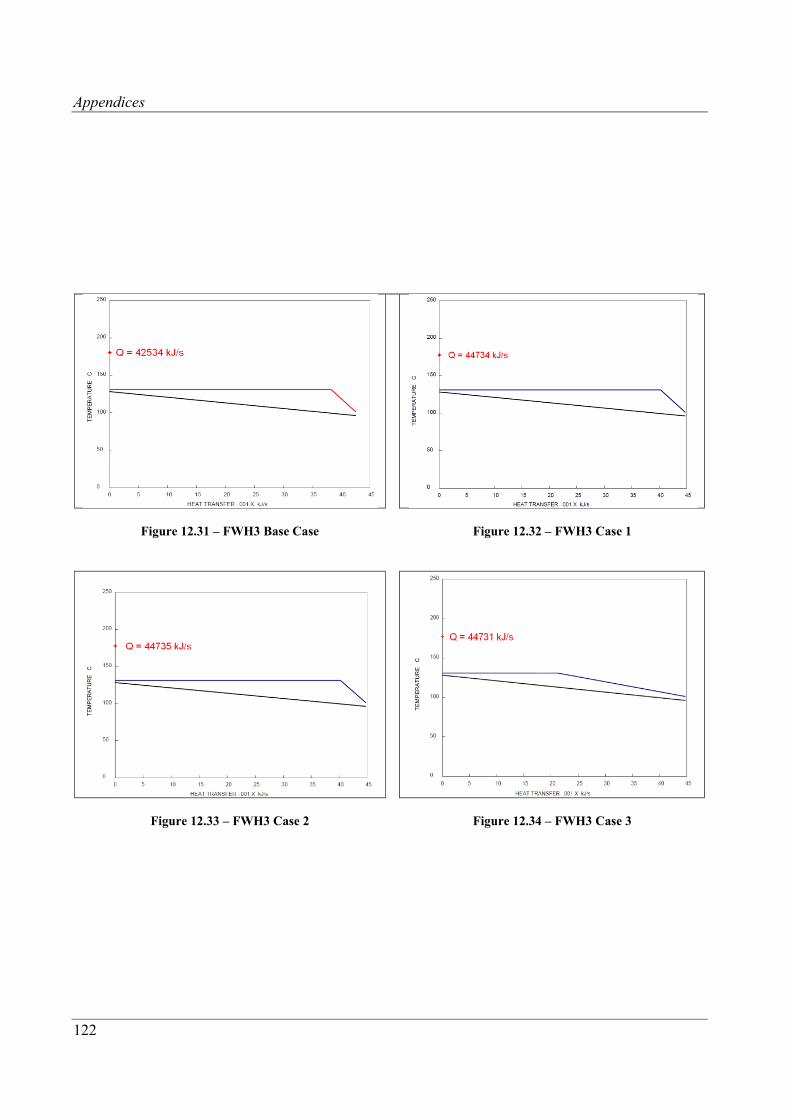
Appendices
122
Figure 12.31 – FWH3 Base Case
Figure 12.32 – FWH3 Case 1
Figure 12.33 – FWH3 Case 2
Figure 12.34 – FWH3 Case 3
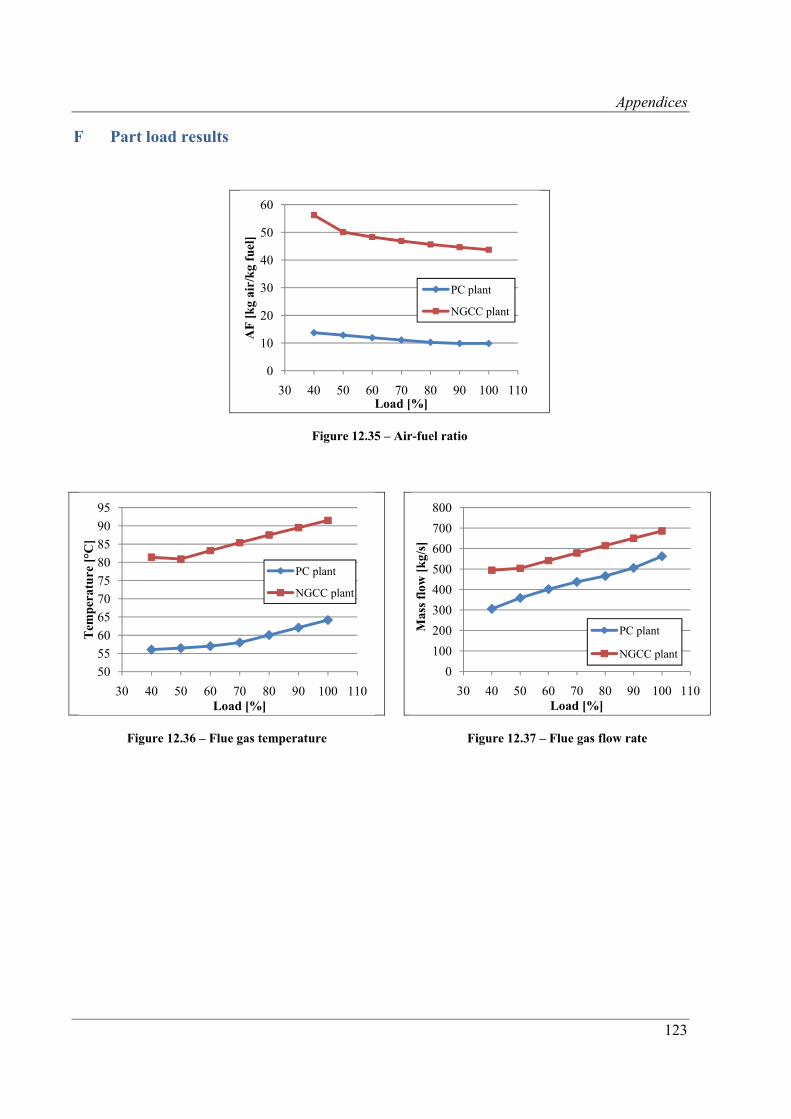
Appendices
123
F Part load results
Figure 12.35 – Air-fuel ratio
Figure 12.36 – Flue gas temperature
Figure 12.37 – Flue gas flow rate
0
10
20
30
40
50
60
30 40 50 60 70 80 90 100 110
AF
[k
g ai
r/k
g fu
el]
Load [%]
PC plant
NGCC plant
50
55
60
65
70
75
80
85
90
95
30 40 50 60 70 80 90 100 110
Tem
per
atu
re [
°C]
Load [%]
PC plant
NGCC plant
0
100
200
300
400
500
600
700
800
30 40 50 60 70 80 90 100 110
Mas
s fl
ow [
kg/
s]
Load [%]
PC plant
NGCC plant