Embed Size (px)
Citation preview

PowerPower
Importance of PowerImportance of Power
• Assume that a theory is true.Assume that a theory is true.
• If we conduct experiments to test If we conduct experiments to test that theory, will the results always that theory, will the results always support the theory? support the theory?

What Is Power?What Is Power?
• Probability of rejecting a false Probability of rejecting a false HH00
• Probability that you’ll find difference Probability that you’ll find difference that’s really therethat’s really there
• 1 - 1 - , where , where = probability of Type = probability of Type II errorII error
Uses of PowerUses of Power
• Two Primary Uses:Two Primary Uses: Estimate sample size required to detect a Estimate sample size required to detect a
specified effect with a specified probability.specified effect with a specified probability.• E.g., how many participants do I need to have a E.g., how many participants do I need to have a
high probability (e.g., .90) of detecting a high probability (e.g., .90) of detecting a moderate effect?moderate effect?
Estimate probability of detecting a specified Estimate probability of detecting a specified effect after an experiment has been conducted effect after an experiment has been conducted and the null hypothesis is not rejectedand the null hypothesis is not rejected

What Controls Power?What Controls Power?• The significance level (The significance level ())
• True difference between null and alternative True difference between null and alternative hypotheseshypotheses 11 - - 22
• Sample sizeSample size
• Population variancePopulation variance
• The particular test being usedThe particular test being used

Distributions Under Distributions Under 11 and and 00

Effect SizeEffect Size
• The degree to which the null is falseThe degree to which the null is false Depends on distance between Depends on distance between
andand
Also depends on standard error (of Also depends on standard error (of mean or of difference between means)mean or of difference between means)
01
d

Estimating Effect SizeEstimating Effect Size
• Past researchPast research
• What you consider importantWhat you consider important
• Cohen’s conventionsCohen’s conventions
Effect Size Small .20 Medium .50 large .80

Combining Effect Size and Combining Effect Size and nn
• We put them together and then We put them together and then evaluate power from the result.evaluate power from the result.
• General formulaGeneral formula
where where f f ((nn) is some function of ) is some function of nn
exact function depends on the testexact function depends on the test
)]([ nfd
Power for One-Sample Power for One-Sample tt
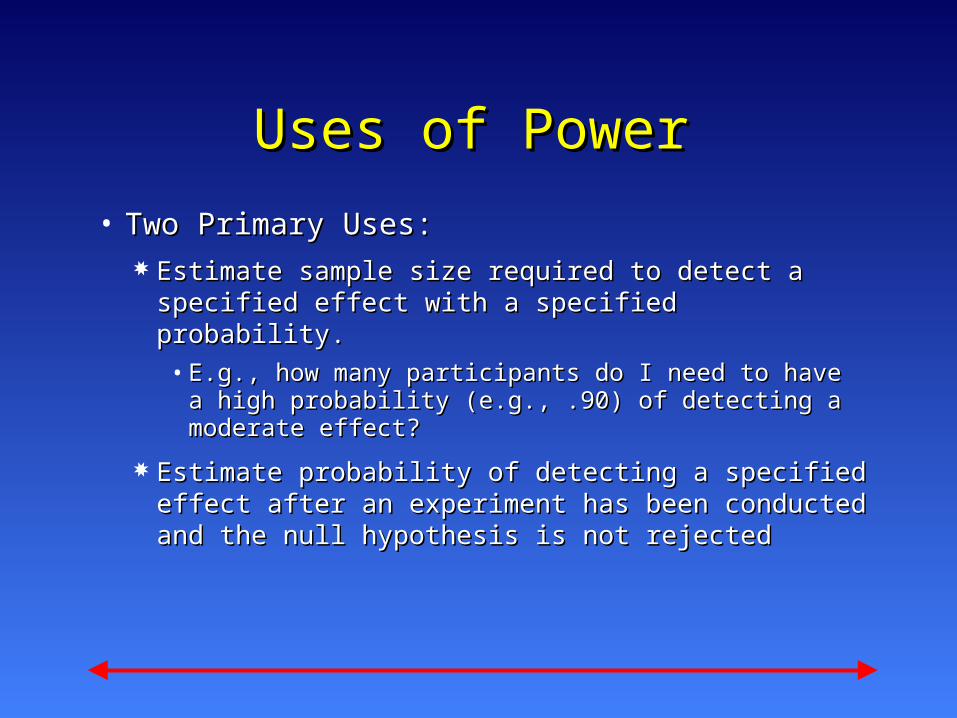
• Applies to difference scores (related Applies to difference scores (related samples) as wellsamples) as well
where where nn = size of sample and d is effect size = size of sample and d is effect size
• Look power up in table using Look power up in table using and and significance level (significance level ())
nd

Power for Related-Sample Power for Related-Sample tt
• Same as for one-sample Same as for one-sample tt
• The sample is the set of difference The sample is the set of difference scores.scores.
• Use related-sample example to Use related-sample example to cover both situations.cover both situations.

Power for Bushman’s Power for Bushman’s StudyStudy
• One sample One sample tt Compared violent video group with Compared violent video group with
population mean = 5.65population mean = 5.65
Used 100 subjectsUsed 100 subjects
Assume he expected sample mean of Assume he expected sample mean of 7.07.0
30.05.4
35.1
5.4
65.50.701
d
Cont.

Bushman--cont.Bushman--cont.
• d = 0.30d = 0.30
• nn = 100 = 100
• = 0.30= 0.30100 = 3.0100 = 3.0
• We are testing at We are testing at = .05 = .05

Alpha () .10 .05 .02
1.00 0.26 0.17 0.09
2.00 0.64 0.52 0.37
2.50 0.80 0.71 0.57
3.00 0.91 0.85 0.75
This table is severely abbreviated.
Power for = 3.0, = .05

Power for Two Power for Two Independent GroupsIndependent Groups
• What changes from preceding?What changes from preceding? Effect size deals with two sample Effect size deals with two sample
meansmeans
Take into account both values of Take into account both values of nn
• Effect sizeEffect size
21
d
Cont.

Estimating dEstimating d
• We could estimate d directly if we knew We could estimate d directly if we knew populations.populations.
• We could estimate from previous data.We could estimate from previous data.
• Here we will calculate using Bushman’s Here we will calculate using Bushman’s sample statistics --assumes Bushman’s sample statistics --assumes Bushman’s estimates of parameters are exact.estimates of parameters are exact.
Cont.
Two Independent Groups--Two Independent Groups--cont.cont.
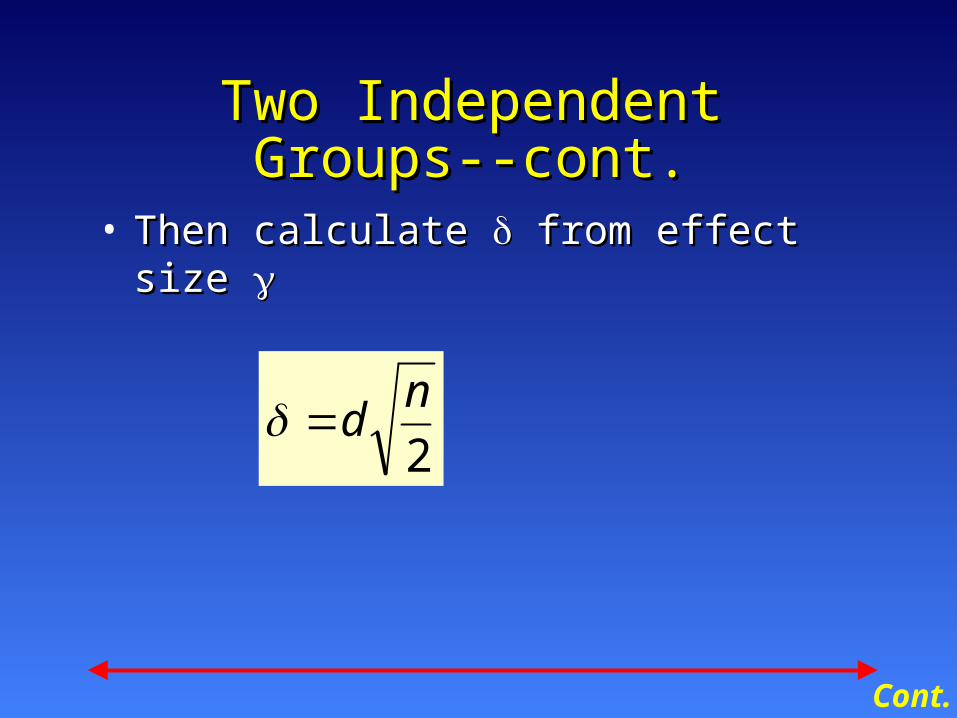
• Then calculate Then calculate from effect size from effect size
2
nd
Cont.

Two Independent Groups--Two Independent Groups--cont.cont.
• For our dataFor our data
66.22
10038.0
2
38.085.3
65.51.7
n
d
Cont.
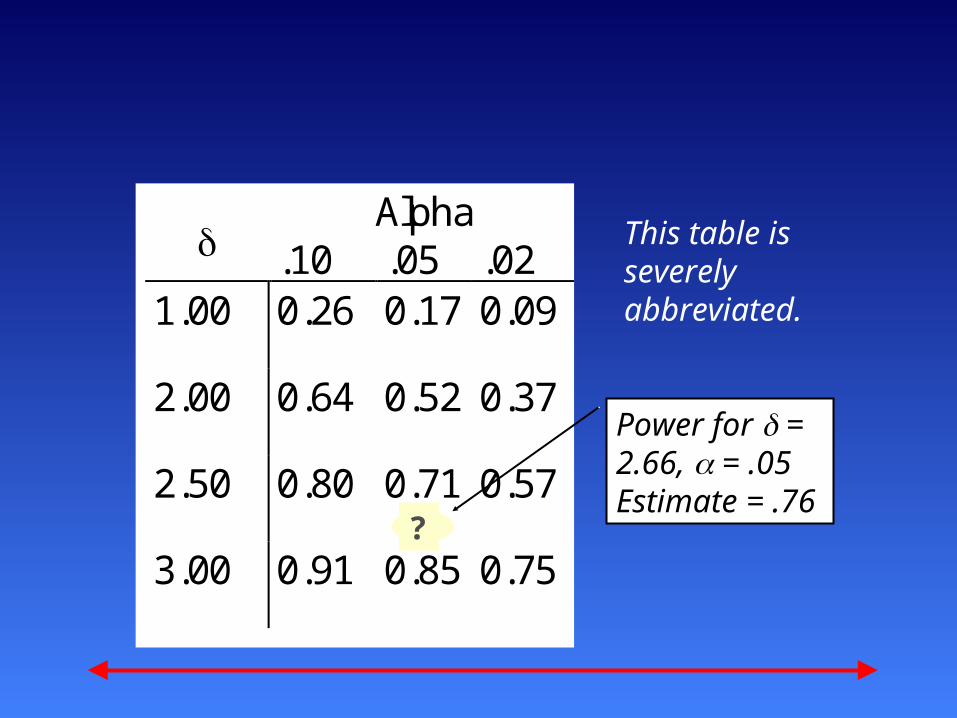
Alpha .10 .05 .02
1.00 0.26 0.17 0.09
2.00 0.64 0.52 0.37
2.50 0.80 0.71 0.57
3.00 0.91 0.85 0.75
This table is severely abbreviated.
Power for = 2.66, = .05Estimate = .76
?

ConclusionsConclusions
• If the parameters are as Bushman’s If the parameters are as Bushman’s estimates would suggest, then if estimates would suggest, then if this study were run repeatedly, 76% this study were run repeatedly, 76% of the time the result would be of the time the result would be significant.significant.
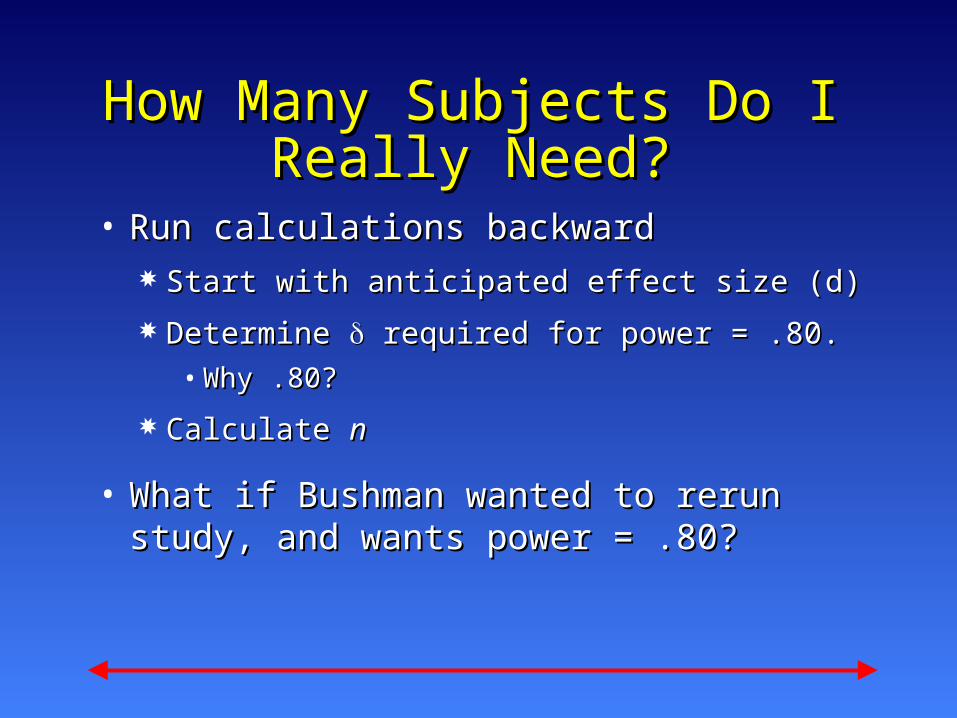
How Many Subjects Do I How Many Subjects Do I Really Need?Really Need?
• Run calculations backwardRun calculations backward Start with anticipated effect size (d)Start with anticipated effect size (d)
Determine Determine required for power = .80. required for power = .80.• Why .80?Why .80?
Calculate Calculate nn
• What if Bushman wanted to rerun What if Bushman wanted to rerun study, and wants power = .80?study, and wants power = .80?

Calculating Calculating nn
• Bushman estimates d = 0.38Bushman estimates d = 0.38
• Power table shows we need Power table shows we need = 2.80 = 2.80
• Calculations on next slideCalculations on next slide

Bushman’s Bushman’s nn
roupsubjects/g 1096.108
)(144.0)84.7(2
238.080.2
238.080.2
2
22
n
n
n
n
nd

Formulas for estimating nFormulas for estimating n
One sample/related samplesOne sample/related samples
N = (delta/d)N = (delta/d)22
Two sampleTwo sample
N (each group) = 2(deltaN (each group) = 2(delta22)/d)/d22

Power as a Function of delta and significance
Level (a)8 .10 .05.. .02 .01
1.00 .26 .17 .09 .06
1.10 .29 .20 .11 .07
1.20 .33 .22 .13 .081.30 .37 .26 .15 .101.40 .40 .29 .18 .121.50 .44 .32 .20 .141.60 .48 .36 .23 .171.70 .52 .40 .27 .191.80 .56 .44 .30 .221.90 .60 .48 .34 .25
2.00 .64.52
..37 .28
2.10 .68 .56 .41 .322.20 .71 .60 .45 .352.30 .74 .63 .49 .392.40 .78 .67 .53 .43
2.50 .80.71•
.57 .47
2.60 .83 .74 .61 .512.70 .85 .77 .65 .552.80 .88 .80 .68 .592.90 .90 .83 .72 .633.00 .91 .85 .75 .663.10 .93 .87 .78 .703.20 .94 .89 .81 .733.30 .95 .91 .84 .77

Sample problem: Estimating nSample problem: Estimating n
• Avoidance behavior in rabbits. Over Avoidance behavior in rabbits. Over many studies, RT for a task is 5.8 s many studies, RT for a task is 5.8 s with SD = 2. E expects lesion in with SD = 2. E expects lesion in amygdala to decrease RT by 1 s. How amygdala to decrease RT by 1 s. How many Ps needed to have 50/50 chance many Ps needed to have 50/50 chance of detecting this difference?of detecting this difference?
• How many Ps needed to have 80% How many Ps needed to have 80% chance of detecting this difference?chance of detecting this difference?