Embed Size (px)
Citation preview
UNIVERSITY OF CALIFORNIA
Los Angeles
Power Control Strategies and Variable BitAllocation for FH-CDMA Wireless Systems
A dissertation submitted in partial satisfaction of the
requirements for the degree Doctor of Philosophy
in Electrical Engineering
by
Charles Chien-Yao Wang
1996
Copyright by Charles Chien-Yao Wang, 1996
All Rights Reserved
ii
The dissertation of Charles Chien-Yao Wang is approved.
Kirby A. Baker
Nickolas Bambos
Kung Yao
Gregory J. Pottie, Committee Chair
University of California, Los Angeles
1996
iii
TABLE OF CONTENTSLIST OF FIGURES ...................................................................................... vi
LIST OF TABLES ....................................................................................... viii
ACKNOWLEDGMENTS ............................................................................ ix
VITA .............................................................................................................. xi
ABSTRACT OF THE DISSERTATION ................................................. xiii
1. INTRODUCTION ..........................................................................................1
1.1 Brief History of Wireless Communications .............................................1
1.2 Overview of the Thesis ............................................................................3
2. BACKGROUND .............................................................................................5
2.1 Digital Communication Systems .............................................................6
2.2 Propagation Environment ........................................................................7
2.2.1 Outdoor Cellular Environment ....................................................8
2.2.2 Indoor Environment ...................................................................10
2.3 Wireless Communication Systems ........................................................11
2.3.1 Cellular Structure .......................................................................12
2.3.2 Multiple Access .........................................................................14
2.3.2.1 FDMA .........................................................................14
2.3.2.2 TDMA .........................................................................15
2.3.2.3 CDMA ........................................................................17
iv
2.4 Power Control ........................................................................................21
2.4.1 Centralized SIR-Based Power Control Algorithms ...................21
2.4.2 Distributed SIR-Based Power Control Algorithms ...................23
2.5 Summary ................................................................................................24
3. POWER AND CHANNEL ASSIGNMENT ALGORITHMS ..................25
3.1 Interference Averaging ..........................................................................26
3.2 Interference Avoidance ..........................................................................26
3.2.1 Interference Avoidance (M/N) for Orthogonal Systems ...........27
3.2.2 Channel Probing ........................................................................31
3.3 Simulation Results .................................................................................38
3.4 Summary ................................................................................................44
4. BIT ALLOCATION ALGORITHMS ........................................................45
4.1 Equal Throughput FH-CDMA Systems ................................................46
4.1.1 Basic Idea ...................................................................................46
4.1.2 Exhaustive Searches ..................................................................50
4.1.3 Simulation Results .....................................................................55
4.1.3.1 Group-Coincidence Systems .......................................57
4.1.3.2 Orthogonal Hopping Patterns .....................................61
4.2 Single Channel with Variable Throughput ............................................63
4.2.1 Centralized Search Algorithm ...................................................64
v
4.2.2 Results ........................................................................................67
4.3 Summary ................................................................................................68
5. IMPLEMENTATION ISSUES OF FH-CDMA SYSTEMS .....................70
5.1 Channel Coding .....................................................................................71
5.1.1 M/N Outdoor Systems ...............................................................71
5.1.2 Variable Bit Indoor systems ......................................................75
5.2 Limited Dynamic Power Range .............................................................80
5.2.1 M/N Outdoor Systems ...............................................................80
5.2.2 Indoor Systems with Bit Allocation ...........................................82
5.3 Summary ................................................................................................84
6. CONCLUSION .............................................................................................86
A. Proof of Lemma 3.0 ...................................................................................... 89
B. Proof of Bit Allocation Problem is NP-Hard.............................................. 91
C. Glossary ......................................................................................................... 93
C.1 List of Acronyms and Abbreviations..................................................... 93
C.2 Definitions ............................................................................................. 95
Bibliography .................................................................................................100
vii
tems .........................................................................................58
Figure 4-5 Distribution of the bits allocated from simulations ................59
Figure 4-6 Simulation results for variable bit allocation and M/N
systems with all users having the same throughput ................61
Figure 4-7 Bit allocation simulations for orthogonal systems ..................63
Figure 4-8 Using det(H) as a channel resource measure ..........................65
Figure 4-9 Distribution of total throughput for variable throughput
system with four users ............................................................68
Figure 5-1 Multilevel TCM encoder for the indoor wireless system
with variable bit allocation .....................................................77
Figure 5-2 Pb as a function of weighted SIR for different orders of
diversity combining for 32-QAM ...........................................78
Figure 5-3 Pb as a function of SIR for the multilevel TCM code with
32-QAM constellation ............................................................79
Figure 5-4 System capacity of an M/N = 8/23 outdoor system with
various dynamic power ranges ...............................................82
Figure 5-5 System capacity of an equal throughput variable bit rate
system with various dynamic power ranges ...........................84
vi
LIST OF FIGURES
Figure 2-1 Block diagram for a digital communication system .................7
Figure 2-2 A simple idealized hexagonal cellular pattern with reuse
factor of 1/7 .............................................................................12
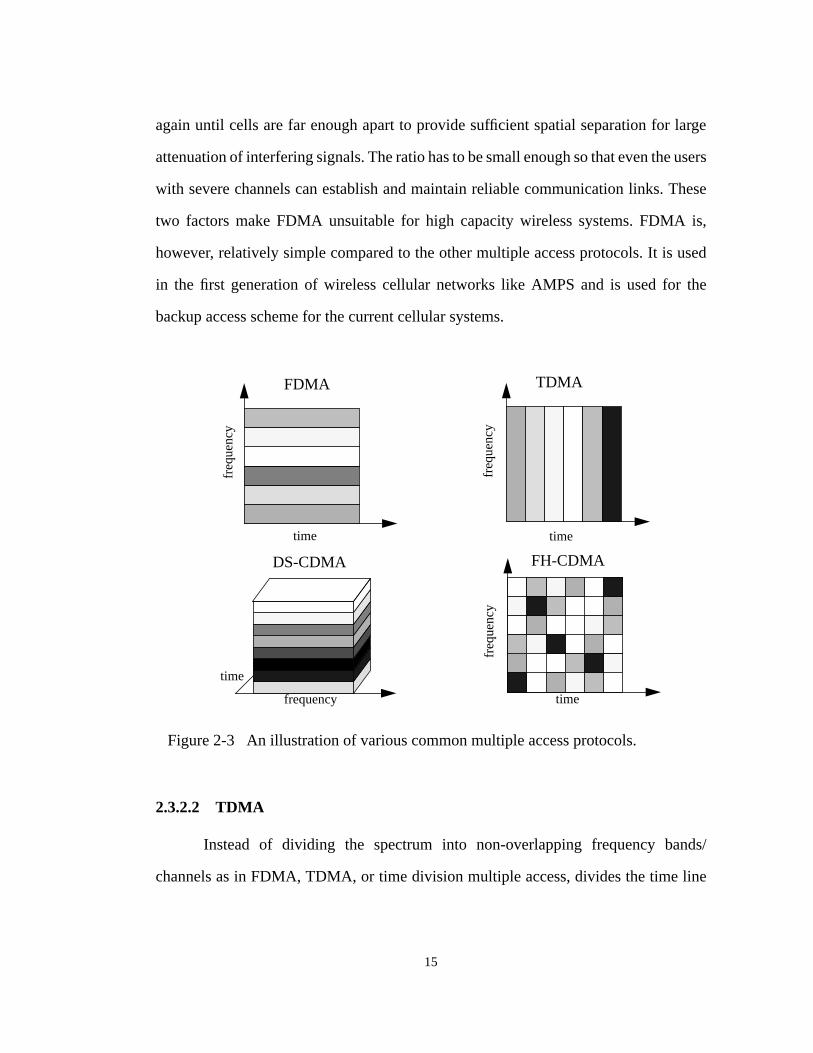
Figure 2-3 An illustration of various common multiple access pro-
tocols .......................................................................................15
Figure 3-1 Maximum achievable SIR of an orthogonal equal re-
ceived power system for various system capacities as a
function of M/N ......................................................................30
Figure 3-2 Pblock as a function of Erlang capacity for a group coin-
cidence system with stationary users for three different
values of M/N .........................................................................41
Figure 3-3 Pdrop as a function of Erlang capacity for M/N=10/23
and users moving at 0.5 m/frame ............................................43
Figure 4-1 Distribution of total throughput for four users and three
slots .........................................................................................53
Figure 4-2 Distribution of the bits allocated from the exhaustive
searches ...................................................................................54
Figure 4-3 Reverse water-filling of SIR for a multislot system ...............56
Figure 4-4 Bit allocation simulations for group-coincidence sys-
viii
LIST OF TABLES
Table 4-1 Results of exhaustive searches for the maximum average
bit allocation per slot ...............................................................51
Table 4-1 Coded FH-CDMA system with Pblock = 1% and
Pb=0.001 and perfect channel state information ....................74
Table 4-1 Coded FH-CDMA system with Pblock = 1% and
Pb=0.001 and estimated channel state information ................74
ix
ACKNOWLEDGMENTS
I first would like to express my deepest gratitude to Professor Gregory J. Pottie for
his support, direction, and encouragement. I am grateful for his time and efforts
guiding my research. I especially appreciate his interest not only in my academic
pursuit, but also in my personal life.
I’d also like to thank the other members of my dissertation committee: Dr. Kirby
Baker, Dr. Nicholas Bambos, and Dr. Kung Yao for their enthusiasm and
encouragement. I am most grateful for the helpful advice and comments from Dr.
Fuyun Ling and the generous financial support of Motorola Inc. I would like to
express my appreciation for the following friends for their friendship and assistance
in various technical subjects: Dr. Shou Chen in power control, Jaehyeong Kim in
trellis coded modulation, Dr. Victor Lin in coding, Prof. Khosrow Moshirvaziri in
algorithm complexity, and Christopher J Hansen in channel probing and many other
topics. I would also like to thank other members of the Pottie Group (Dennis
Connors, George Kondylis, Heung-No Lee, Eldad Perahia, Katayoun Sohrabi, and
Benjamin Tang) for their helpful comments. I am grateful to Bruce Kwan, Bob
x
Hsin, and Kirk Chang for their friendship. I would like to thank the Electrical
Engineering Department for the financial support and all the staff members who
have been so helpful. I’d like to apologize to those I have managed to leave out their
names and express my appreciation for their help throughout my years at UCLA.
To my parents, I would like to thank them for the sacrifices they have made bringing
me up over the years and for immigrating to the United States to give me a better
chance to get a good education. I would also like to thank my brother, James, and
sister, Sylvia, for their support.
Last, but certainly not least, to my wife, Ruby, I thank her for her love and caring.
I am extremely lucky to have her in my life.
I would like to acknowledge the re-publishing of previously copyrighted material.
Portions of sections 3.1, 3.2, and 5.1 were previously published in part in the
proceedings of International Conference on Communications, Seattle, Washington,
June 1995, pp. 1737-1741.
xii
for coded frequency hopped cellular systems,” IEEE InternationalConference of Communications, June 1995, pp. 1737-41. Seattle, WA.
xi
VITA
January 8, 1968 Born, Tainan, Taiwan
1990 B.S., Electrical EngineeringUniversity of California, San DiegoLa Jolla, California
1991 Hardware EngineerQualcomm Inc.San Diego, California
1992 M.S., Electrical EngineeringUniversity of California, Los AngelesLos Angeles, California
1992-1993 Teaching AssistantUniversityIthaca, New York
Summer 1992, 1993 System Engineer InternQualcomm Inc.San Diego, California
1993-1996 Research AssistantUniversity of California, Los AngelesLos Angeles, California
PUBLICATIONS AND PRESENTATIONS
C. C. Wang and G. J. Pottie, “Dynamic channel resource allocation in frequencyhopped wireless communication systems,” Proceeding of IEEE InformationTheory Symposium, pp 239, Norway, 1994.
C. J. Hansen, C. C. Wang, and G. J. Pottie, “Distributed dynamic channel resourceallocation in wireless systems,” Asilomar Conference on Signals, Systems,and Computers, Oct. 1994.
C. C. Wang and G. J. Pottie, “Interference avoidance and power control strategies
xiii
ABSTRACT OF THE DISSERTATION
Power Control Strategies and Variable BitAllocation For FH/CDMA Wireless Communication
Systems
by
Charles Chien-Yao Wang
Doctor of Philosophy in Electrical EngineeringUniversity of California, Los Angeles, 1996
Professor Gregory J. Pottie, Chair
Frequency hopped code-division multiple access (CDMA) is proposed for
wireless communication systems as it has the flexibility to provide a variety of
services to many users under different propagation conditions. With limited
spectrum, an FH-CDMA wireless communication system is interference limited.
Interference avoidance and interference averaging can reduce the
interference of the system and increase the system capacity. Two fully distributed
methods for a mobile user to avoid communicating in a slot with high interference
are proposed. Users can avoid large interferers by transmitting only in the M slots
out of the N slots in a frame. Users can also employ distributed channel probing
algorithms to determine in which of the M slots to transmit and to select the hopping
patterns that require the least transmitted power while meeting their signal-to-
interference ratio (SIR) requirements. In addition, coding and interleaving protect
the signals from the different interference levels in the slots used. Simulations show
that interference avoidance increases the capacity of FH-CDMA systems.
xiv
Simulations also show that a system with orthogonal hopping pattern can achieve
Erlang capacity close to a system with users continually searching for the best group
of users to share hopping patterns with much reduced complexity.
In the indoor environment, the channels may vary slowly. An FH-CDMA
system can take advantage of the different interference statistics in a hopping
pattern and assign different bit rates to the slots to minimize the system interference.
We show that the maximum throughput bit rate/channel assignment problem is NP-
hard. Several ad hoc bit allocation algorithms are proposed. The algorithms that
achieve the highest system capacity perform interference avoidance. Users
concentrate their throughputs in a small fraction of the slots by transmitting large
signal constellations and avoid sharing channels with large interferers. A system
with variable bit allocation has more flexibility than an M/N system as users can
vary their throughputs to adjust to the interference environment. Simulations show
that a variable bit allocation system can achieve capacity 50% or higher than an M/
N FH-CDMA system for blocking probability of 1%.
1
Chapter 1
INTRODUCTION
Wireless communication has brought many conveniences to modern daily lives.
It frees people from working at fixed locations and allows people to stay connected as
they travel. Wireless communication was born when G. Marconi first demonstrated the
radio’s ability to provide continuous contacts with ships in 1897. It has since then been
used in space exploration, navigation, dispatching emergency and police vehicles, and
many other applications. However, message and voice wireless communications
devices have only become affordable and popular in the last twenty years because of
the advances in signal processing and semiconductor fabrication. The demand for
wireless services has been growing rapidly ever since.
1.1 Brief History of Wireless Communications
Person-to-person wireless communication is different from broadcasting. While
there has been significant progress in broadcasting since Macroni’s first demonstration
2
in 1897, person-to-person wireless communication was mainly confined to military,
government, and industries until the 1960’s. It was not until the recent two decades that
the advances in communication theories, signal processing, and semiconductor
miniaturization were applied to wireless communication to make it accessible to the
general public.
The first widely deployed cellular system was developed by the Nippon
Telephone and Telegraph company (NTT) in 1979 using analog frequency modulation
(FM) techniques. Similar systems were deployed in Europe and North America shortly
after. The analog FM technologies used in these systems were based on the radio
communication techniques developed around World War II. They did not take full
advantage of the advances in digital communication and circuitry.
The first digital cellular standard, GSM (Global System for Mobile), was
adopted by the European community and was first deployed in 1991. GSM incorporated
the advances in digital speech and channel coding and used digital control for more
precise and flexible system management. A new spectrum was allocated throughout
Europe for the system to solve the problem of incompatible frequency bands used by
the various earlier analog systems in different countries. Similar digital cellular
standards were soon adopted in North America and Japan. All of these systems use
time-division multiple access (TDMA). TDMA increases the system capacity, or the
number of users a system can support simultaneously, by assigning users to cyclically
take turns to transmit in the same frequency bin.
While most of the cellular industry adopted the TDMA cellular standards,
Qualcomm Inc. proposed using the spread spectrum technique of direct sequence code-
division multiple access (DS-CDMA). Although the idea of using spread spectrum in
cellular environment was first proposed in 1978 [16], it was not until the late 1980’s that
3
the advances in semiconductor fabrication, more specifically very-large scale
integration (VLSI), made DS-CDMA viable. The proposed system was standardized in
1993. It has been shown to be able to provide services to more users than the TDMA
standards through more sophisticated signal processing and speech coding.
The public soon realized the conveniences wireless communication could bring.
The demand for better and more flexible wireless services continues to rise. The
concept of a communication service anywhere, anytime, in any form, or personal
communication systems (PCS), has recently arisen. Future wireless communications
systems will need to provide a variety of services like voice, video, and data to their
subscribers using the limited bandwidth designated by the government regulatory
agencies in very different propagation environments. These systems need to support
more users and yet be flexible enough to adapt to different channel impairments and to
accommodate different demands by the users.
1.2 Overview of the Thesis
Our goal is to design a high capacity wireless system that can operate under
different indoor and outdoor environments and provide enough flexibility to carry
different formats of information the users desire. Since the number of users a wireless
system can support is usually determined by the interference generated by the users
communicating in the system, we introduce the concept of interference avoidance and
variable bit allocation. The basic idea is for the users to intelligently select the channels
in which they transmit so that they do not share their channels with large interferers.
The overall system interference is reduced and more users can thus share these
channels. A slow hopped CDMA system is chosen as the baseline system for
comparisons of the various algorithms we propose. Slow hopped CDMA has the
4
potential to achieve high system capacity and can be flexible enough to support
different types of users.
This thesis is divided into six chapters. In Chapter 2, we introduce various
aspects of wireless systems including propagation environments and multiple access
techniques. We also describe the important issues and trade-offs that need to be
considered when designing a wireless communication system. In Chapter 3, we
describe the concept of interference avoidance in detail. We then introduce several
power and channel assignment algorithms using this concept and compare their effects
on the system capacity. In Chapter 4, the concept of variable bit allocation is introduced
for the slowly changing indoor environment. The proposed bit allocation algorithms
adjust the power and bit rate assignment according to the slowly varying channels to
maximize the system throughput. We then discuss the impact of channel codes and
limited transmitted power on the system capacity in Chapter 5. Finally, some
concluding remarks are presented along with suggestions for possible future research
in the last chapter.
24
2.5 Summary
In order to design a high capacity wireless system, the problems of the vastly
different operating conditions and limited resources like bandwidth and power need to
be overcome. To combat the difficult propagation conditions, diversity techniques and
powerful channel error correcting codes are needed. Information symbols are
interleaved to mitigate the burstiness of the channel. Appropriate multiple access and
interference suppression schemes need to be devised in order for the system to
accommodate a large number of users under the limited resources. Power control is
essential to guarantee users can achieve reliable communication links and yet minimize
the mutual interference.
The comparisons between different access protocols described in Section 2.3.2
are subject to debate. The merits of each system depend greatly on the system models
and the assumptions used particularly with regard to implementation complexity. Under
the system models proposed in Section 2.2 and the numerous assumptions made
throughout this chapter, slow hopped CDMA systems show the potential to achieve the
highest capacity in wireless communication systems among the common multiple
access protocols described. The following chapters examine the slow hopped CDMA
system and discuss different algorithms that can further improve the system capacity.
23
diagonal elements (i, j) are equal to .
The centralized power control algorithms require solving the set of linear
equations (2.5). A centralized control unit and communications among all users are
required. The algorithms also require the knowledge of all of the link gains Gij, desired
SIR for each user γi, and white noise floor, ni which may be difficult to obtain. Both of
these problems can be overcome by the distributed power control algorithms.
2.4.2 Distributed SIR-Based Power Control Algorithms
Unlike the centralized power control algorithms, the distributed algorithms
[12][25][49] do not require coordination and communication between various users
sharing a channel. Only feedback from a receiver to the intended transmitter is needed
for power adjustment. The distributed algorithms can usually converge to the same
minimum power solution that satisfies (2.5) as the centralized algorithms given the
feasible power vector exists.
One algorithm is of particular interest [12]. It guarantees that all the users
already admitted to the system are able to sustain their respective γi as new arrivals try
to obtain enough SIR to enter the system. If there exists a feasible solution to (2.5), the
new arrival would eventually find the proper transmitted power. If not, the SIR of the
new arrivals would approach asymptotic bounds that are below their desired SIR, while
the users already in the system can still sustain the desired SIR. [82] proves that most
of the distributed power control algorithms converge to the same solution as solving
(2.5) and that the distributed algorithms converge geometrically if the solution exists.
Gij Gii⁄
22
users communicating in the slot. Denote Gij as the link gain from a user in cell j sharing
the same slot to base station i, and ni as the noise power at base station i. Then, the
received signal-to-interference ratio (including white noise), Ri, can be expressed as
(2.3)
Denote the desired SIR for the user in the i-th cell by γi. All feasible power solutions
have to satisfy the following inequality,
(2.4)
for . Dividing Gii for each inequality, we can rewrite the B inequalities in
matrix form,
(2.5)
where and when and for .
, where , and , where . The minimum
power solution that satisfies (2.5) is found by replacing the inequalities by equalities.
If there exists an all-positive power vector for this set of equations, the desired SIR can
be achieved for all users. Otherwise, these users may not all achieve their desired SIR
while sharing the same slot.
If all users desire the same SIR, [83] proves that the maximum achievable SIR
such that these B users can share a channel is equal to the inverse of the largest
eigenvalue of matrix F. The diagonal elements of F are equal to zero and the off-
Ri
PiGii
PjGijj i≠∑ ni+
=
PiGii γi PjGijj i≠∑− γini≥
1 i B≤ ≤
HP N≥
H hij= hij γiGij− Gii⁄= i j≠ hii 1= 1 i j, B≤ ≤
P Pi= 1 i B≤ ≤ N γini Gii⁄= 1 i B≤ ≤
B B×
21
direct digital frequency synthesizer (DDFS), these problems may be overcome.
2.4 Power Control
Since high capacity wireless systems are interference-limited, it is essential to
adjust the power of the users so that enough power is transmitted to ensure signal
integrity while not generating excessive interference for the unintended receivers.
There are usually two types of power control: power-based and signal-to-interference
ratio (SIR)-based. Power-based power control algorithms usually adjust the transmitter
power so that the received power or the transmitted power for each user is the same.
Although these algorithms are easier to implement and may even be optimum for DS-
CDMA [28], signal-to-interference (SIR)-based algorithms have been shown to
maximize channel capacity for wireless systems such as FDMA, TDMA, and slow
hopped CDMA. There are generally two classes of SIR-based power control algorithms
-- centralized and distributed. In this section, we only describe these algorithms for the
reverse link in a cellular system (users transmitting to base stations), although the same
algorithms can also be applied to the forward link (base stations transmitting to the
users) or to the peer-to-peer communication systems where there is no base station
infrastructure. It can be noted that frequency-reuse is a simple form of power control.
It imposes spatial separations among the users so that their transmitted power does not
cause too much interference with the desired signal.
2.4.1 Centralized SIR-Based Power Control Algorithms
The centralized power control algorithms assume that a system has knowledge
of all the link gains among all users in the system [3][83]. For the reverse link, denote
as the transmitted power of a user in cell i, where and B is the number ofPi 1 i B≤ ≤
20
into fast-hopped systems and slow-hopped systems. A fast-hopped system has the
hopping rate greater than the data rate. That is, during an information symbol, the
system transmits over many bands with shorter duration. Fast-hopped systems are more
prevalent in military applications where security is vital. With the fast hopping rate, it
is difficult to track the phases of the signals. Coherent detection is often difficult to
achieve. More signal power, thus more interference, is needed to maintain successful
transmission. A slow-hopped system, on the other hand, has one or more information
symbols per hop or slot. Coherent detection can be performed. It is more suitable for a
high capacity wireless communication system.
An FH-CDMA system has many of the advantages of DS-CDMA. No
frequency reuse is necessary if the sophisticated power control algorithms described in
Section 2.4 are implemented. With interleaving and channel coding, the probability of
blocking and dropping is determined by the average interference statistics. Since the
total bandwidth used is greater than the symbol rate and can possibly be greater than the
coherent bandwidth of the channel, an FH-CDMA system can overcome propagation
impairments by using diversity techniques as in a DS-CDMA system. It is, however,
more difficult to take advantage of the silent period in the speech and the gain over
sectoring each cell is not as great as in a DS-CDMA system. There is, however, no intra-
cell interference as users do not share any channels with the other users in the same cell
in FH-CDMA. Since the majority of interference in DS-CDMA systems comes from
users in the same cell, FH-CDMA systems may obtain higher system capacities.
There are a few difficulties when designing high bit rate, high capacity FH-
CDMA systems. As in TDMA, timing needs to be tracked accurately. Equalization is
also necessary. Furthermore, accurate tracking of the frequency and phase is required
for coherent detection. With recent development of digital integrated circuits like the
19
received power from the base station the user is communicating with, a new link
between the user and the nearby base station is established. As the user moves farther
into the neighboring cell, when the received signal power from the old base station is
below some threshold of the received power strength of the new base station,
communication between the user and the old base station is terminated. This is called
soft hand-off. During the soft hand-off, the user communicates with at least one base
station at all time. Fewer users are dropped compared to the traditional hand-off
procedures. During the soft hand-off process, the user transmits at the lowest power
required to sustain just one reliable link, either to the old base station or the new one.
Interference is thus better controlled.
A user in a DS-CDMA system has to contend not only with inter-cell
interference from users outside of its cell, but it would also have to mitigate the effects
of intra-cell interference from the users within the same cell. However, with the
additional signal processing, a DS-CDMA system like IS-95 has many desirable
features and is capable of achieving capacity many times greater than the analog
cellular systems like AMPS and other second generation digital cellular systems.
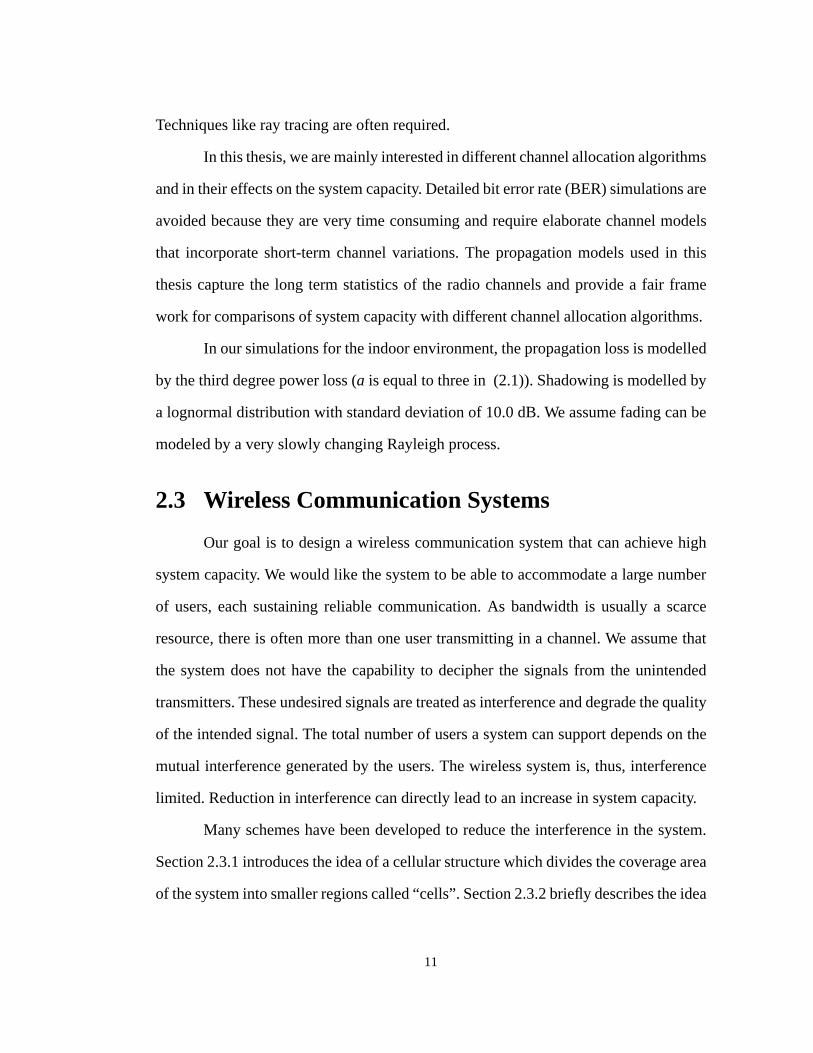
2.3.2.3.2 Frequency Hopped CDMA (FH-CDMA)
An FH-CDMA system is similar to a hybrid combination of FDMA and TDMA.
The spectrum is divided into non-overlapped bands as in an FDMA system. Time is
divided into narrow bins as well. A user transmits at different frequency bands during
different time bins as shown in Figure 2-3. The sequence of the band-bins or slots that
a user uses is called its hopping pattern. Only the intended receiver has the knowledge
of the hopping pattern and can successfully decipher the transmitted signal. As in DS-
CDMA, FH-CDMA uses more spectrum than needed. FH-CDMA systems are divided
18
small group of interferers. The system capacity increases. In addition, unlike FDMA
and TDMA where the system capacity is limited to the number of channels available, a
DS-CDMA system has a soft capacity. The system capacity depends on the interference
statistics of the system. If the users do not transmit at high power, more users can be
accommodated.
A DS-CDMA system can also take advantage of the silent period in the speech
to reduce the mutual interference. It is shown that this can increase the system capacity
by a factor of 1.7 to 2.5. Directional antennae can be used to further reduce the
interference. A cell can be divided into several non-overlapped regions or “sectors.” A
different antenna is assigned to communicate with users in each region. A user would
only have to mitigate the effects of the interference generated by other users within the
same “sector.” A DS-CDMA system with the small chip duration also allows the
receivers to combat multipath fading.
DS-CDMA systems are sensitive to the transmitted power of the users. A user
located further away from the base station needs to transmit at a higher power than a
user closer to the base station to ensure signal integrity. This is called the near-far
problem, which can be solved by power control. Since the users near the cell boundaries
need to transmit at much higher power to maintain reliable communication, they not
only produce the majority of the interference within their own cells, but they also affect
all the nearby cells especially in the reverse-link (users to base stations). It is estimated
that up to 40% of the interference comes from the users in the neighboring cells [28].
A sophisticated and robust hand-off process is needed to reduce the interference
generated by these users. DS-CDMA systems like IS-95 set aside a receiver for each
user specifically for tracking the signal strength of the nearby base stations. If the
received power from one of the nearby base stations is within some threshold of the
17
2.3.2.3 CDMA
Unlike FDMA and TDMA which assign users to distinct frequency or time
slots, CDMA or code division multiple access assign each user a “code.” The code is
shared by the transmitter and the designated receiver. If a receiver does not have the
proper code, the signal appears noise-like. CDMA protocols use spread spectrum
technology where the transmission bandwidth is several orders of magnitude greater
than the information symbol rate. The code is usually a pseudo-noise (PN) sequence
that has low cross correlation. It converts the information sequence into a broadband
noise-like signal. CDMA is not bandwidth efficient in a single user system. However,
in a multi-user system, CDMA can allow many users to share the same bandwidth by
spreading the interference into a larger spectrum so that interference is reduced. This
makes CDMA a good candidate for a multiple access protocol. CDMA systems are
usually classified into two categories: direct sequence CDMA (DS-CDMA) and
frequency hopped CDMA (FH-CDMA).
2.3.2.3.1 Direct Sequence CDMA (DS-CDMA)
In direct sequence CDMA systems, each information symbol is “modulated” or
multiplied by a PN sequence of much smaller duration called chips to generate the
broadband signal [28][71][72][77]. This signal is noise-like to a receiver without the
correct PN sequence. Many users can share the same broad bandwidth as shown in
Figure 2-3. Frequency reuse is no longer necessary. Unlike TDMA and FDMA where
the probability of dropping and blocking depend on a small fraction of users who have
to share the same channels with nearby interferers, Pblock and Pdrop of CDMA systems
are determined by the average interference statistics. That is, users have to contend for
channels with a large number of users whose signals appears noise-like instead of a
16
into shorter non-overlapped time slots as shown in Figure 2-3. A user is assigned a time
slot when service is requested. No other users in the same cell can transmit in the same
band during the call. A frame is made of several time slots. Users cyclically take turns
to communicate their assigned slots in each frame.
TDMA allows many users to share the same frequency band, thus increasing
capacity. Although the FDMA systems can further divide the frequency bins to increase
the system capacity, it is easier to achieve orthogonality in the time domain than in the
frequency domain in implementation. Also, in cellular networks, hand-off can be made
more reliable with the so called mobile assisted hand-off [57]. Users can monitor the
power level from the surrounding cells while waiting for their turn to transmit.
Information regarding signal strength from all nearby cells can be sent back to the
communicating base stations. These base stations have more information in
determining when to hand-off these users to an adjacent cell. More receivers are needed
if a similar FDMA system implements mobile assisted hand-off.
TDMA signals are, however, bursty as information needs to be transmitted
within shorter time slots. Elaborate synchronization is needed so the receivers can keep
track of the transmitter’s timing even during the idle period. The transmission rate is
also higher since the same amount of information is sent in shorter time. Equalization
is needed as TDMA is more susceptible to inter-symbol interference (ISI) [55].
Frequency reuse is still needed and the ratio is still determined by the worst case
statistics as in FDMA. However, TDMA can significantly increase the capacity
compared to the analog frequency modulation (FM) systems with the additional
signalling and hardware. TDMA is currently used in the second generation of cellular
radio in North American (IS-54), Japan (JDC), Europe and other parts of the world
(GSM).
15
again until cells are far enough apart to provide sufficient spatial separation for large
attenuation of interfering signals. The ratio has to be small enough so that even the users
with severe channels can establish and maintain reliable communication links. These
two factors make FDMA unsuitable for high capacity wireless systems. FDMA is,
however, relatively simple compared to the other multiple access protocols. It is used
in the first generation of wireless cellular networks like AMPS and is used for the
backup access scheme for the current cellular systems.
2.3.2.2 TDMA
Instead of dividing the spectrum into non-overlapping frequency bands/
channels as in FDMA, TDMA, or time division multiple access, divides the time line
time
freq
uenc
y
FDMA
freq
uenc
y
time
TDMA
freq
uenc
y
time
FH-CDMA
frequency
DS-CDMA
time
Figure 2-3 An illustration of various common multiple access protocols.
14
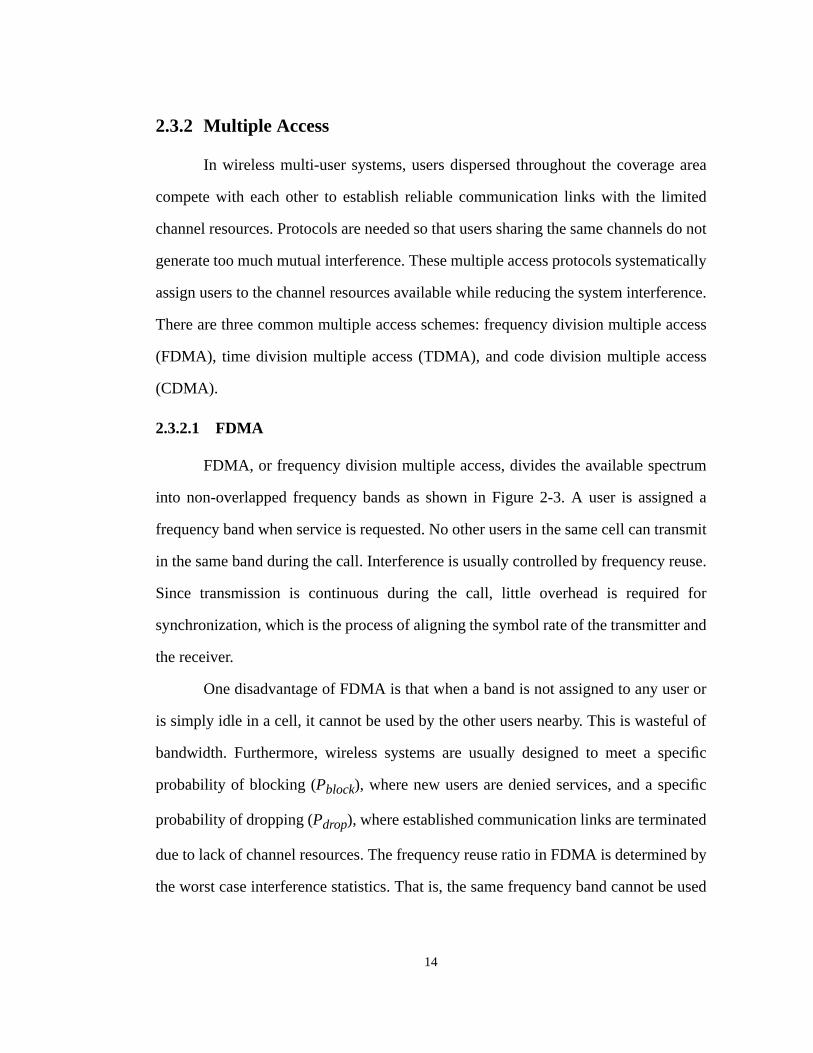
2.3.2 Multiple Access
In wireless multi-user systems, users dispersed throughout the coverage area
compete with each other to establish reliable communication links with the limited
channel resources. Protocols are needed so that users sharing the same channels do not
generate too much mutual interference. These multiple access protocols systematically
assign users to the channel resources available while reducing the system interference.
There are three common multiple access schemes: frequency division multiple access
(FDMA), time division multiple access (TDMA), and code division multiple access
(CDMA).
2.3.2.1 FDMA
FDMA, or frequency division multiple access, divides the available spectrum
into non-overlapped frequency bands as shown in Figure 2-3. A user is assigned a
frequency band when service is requested. No other users in the same cell can transmit
in the same band during the call. Interference is usually controlled by frequency reuse.
Since transmission is continuous during the call, little overhead is required for
synchronization, which is the process of aligning the symbol rate of the transmitter and
the receiver.
One disadvantage of FDMA is that when a band is not assigned to any user or
is simply idle in a cell, it cannot be used by the other users nearby. This is wasteful of
bandwidth. Furthermore, wireless systems are usually designed to meet a specific
probability of blocking (Pblock), where new users are denied services, and a specific
probability of dropping (Pdrop), where established communication links are terminated
due to lack of channel resources. The frequency reuse ratio in FDMA is determined by
the worst case interference statistics. That is, the same frequency band cannot be used
13
to the adjacent base stations is also reduced, a user may suffer from poor signal quality
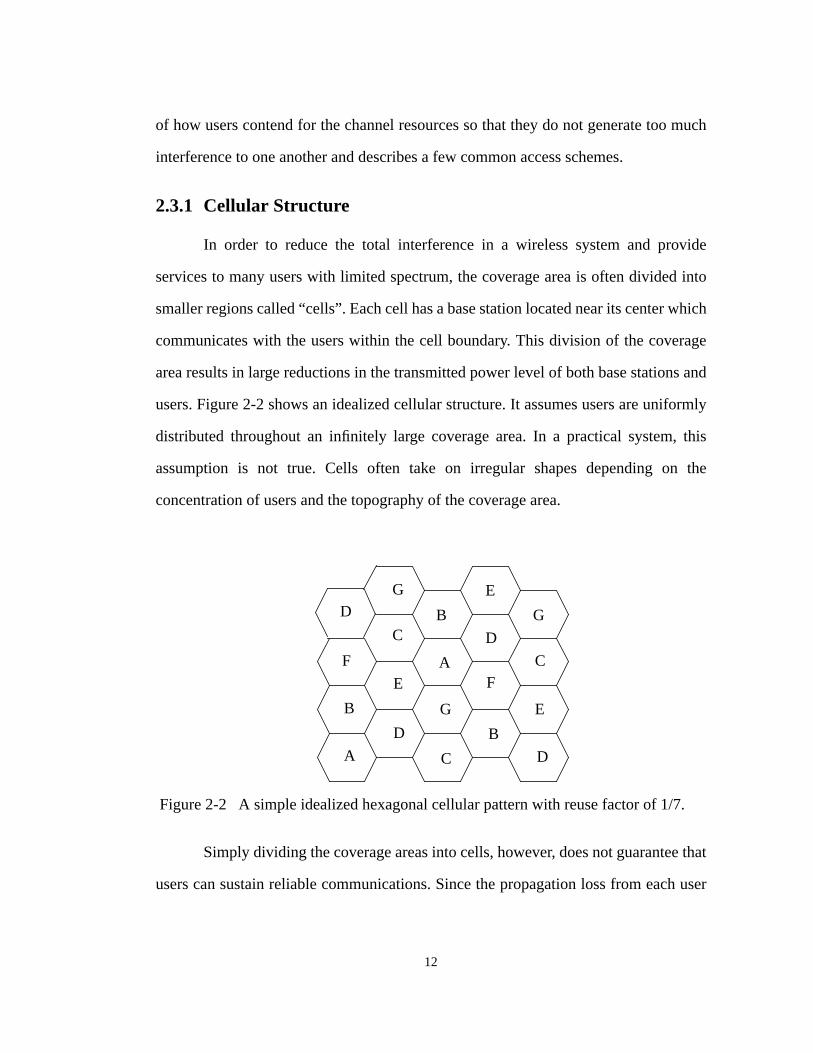
due to other users transmitting at the same channel in the adjacent cells. Frequency
reuse is often needed to solve this problem. Frequency reuse divides the available
spectrum into smaller frequency bands. One band is assigned to each cell. Each of the
adjacent cells is assigned a different band. The same frequency band is not “re-used”
until there is sufficient spatial attenuation to dampen the interference. Figure 2-2 shows
the frequency reuse pattern of 1/7 where each frequency band is surrounded by six cells
each transmitting at a different frequency. The letter at the center of each cell indicates
the frequency band used in the cell. This frequency reuse pattern of 1/7 is used in the
AMPS and IS-54 systems. A frequency reuse pattern of 1/4 is used in the European
GSM system.
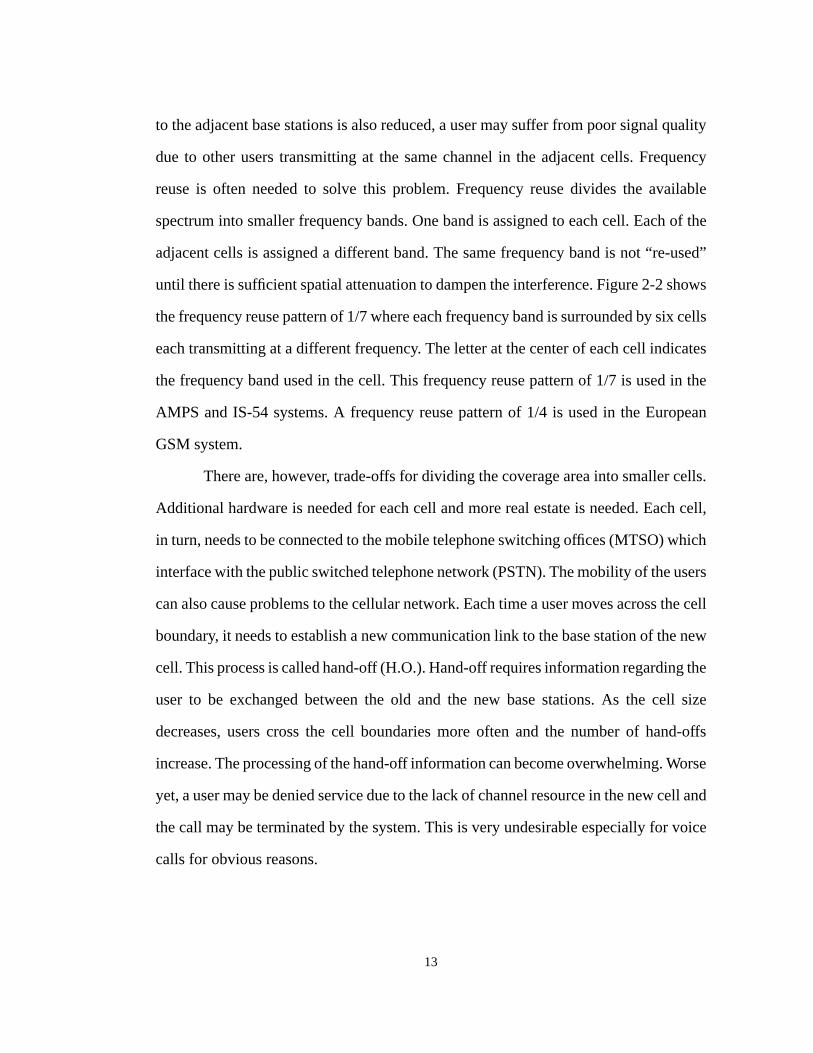
There are, however, trade-offs for dividing the coverage area into smaller cells.
Additional hardware is needed for each cell and more real estate is needed. Each cell,
in turn, needs to be connected to the mobile telephone switching offices (MTSO) which
interface with the public switched telephone network (PSTN). The mobility of the users
can also cause problems to the cellular network. Each time a user moves across the cell
boundary, it needs to establish a new communication link to the base station of the new
cell. This process is called hand-off (H.O.). Hand-off requires information regarding the
user to be exchanged between the old and the new base stations. As the cell size
decreases, users cross the cell boundaries more often and the number of hand-offs
increase. The processing of the hand-off information can become overwhelming. Worse
yet, a user may be denied service due to the lack of channel resource in the new cell and
the call may be terminated by the system. This is very undesirable especially for voice
calls for obvious reasons.
12
of how users contend for the channel resources so that they do not generate too much
interference to one another and describes a few common access schemes.
2.3.1 Cellular Structure
In order to reduce the total interference in a wireless system and provide
services to many users with limited spectrum, the coverage area is often divided into
smaller regions called “cells”. Each cell has a base station located near its center which
communicates with the users within the cell boundary. This division of the coverage
area results in large reductions in the transmitted power level of both base stations and
users. Figure 2-2 shows an idealized cellular structure. It assumes users are uniformly
distributed throughout an infinitely large coverage area. In a practical system, this
assumption is not true. Cells often take on irregular shapes depending on the
concentration of users and the topography of the coverage area.
Simply dividing the coverage areas into cells, however, does not guarantee that
users can sustain reliable communications. Since the propagation loss from each user
Figure 2-2 A simple idealized hexagonal cellular pattern with reuse factor of 1/7.
A
CB
D
E F
G E
C
A
D
E
G
C
B
GD
D
F
B
11
Techniques like ray tracing are often required.
In this thesis, we are mainly interested in different channel allocation algorithms
and in their effects on the system capacity. Detailed bit error rate (BER) simulations are
avoided because they are very time consuming and require elaborate channel models
that incorporate short-term channel variations. The propagation models used in this
thesis capture the long term statistics of the radio channels and provide a fair frame
work for comparisons of system capacity with different channel allocation algorithms.
In our simulations for the indoor environment, the propagation loss is modelled
by the third degree power loss (a is equal to three in (2.1)). Shadowing is modelled by
a lognormal distribution with standard deviation of 10.0 dB. We assume fading can be
modeled by a very slowly changing Rayleigh process.
2.3 Wireless Communication Systems
Our goal is to design a wireless communication system that can achieve high
system capacity. We would like the system to be able to accommodate a large number
of users, each sustaining reliable communication. As bandwidth is usually a scarce
resource, there is often more than one user transmitting in a channel. We assume that
the system does not have the capability to decipher the signals from the unintended
transmitters. These undesired signals are treated as interference and degrade the quality
of the intended signal. The total number of users a system can support depends on the
mutual interference generated by the users. The wireless system is, thus, interference
limited. Reduction in interference can directly lead to an increase in system capacity.
Many schemes have been developed to reduce the interference in the system.
Section 2.3.1 introduces the idea of a cellular structure which divides the coverage area
of the system into smaller regions called “cells”. Section 2.3.2 briefly describes the idea
10
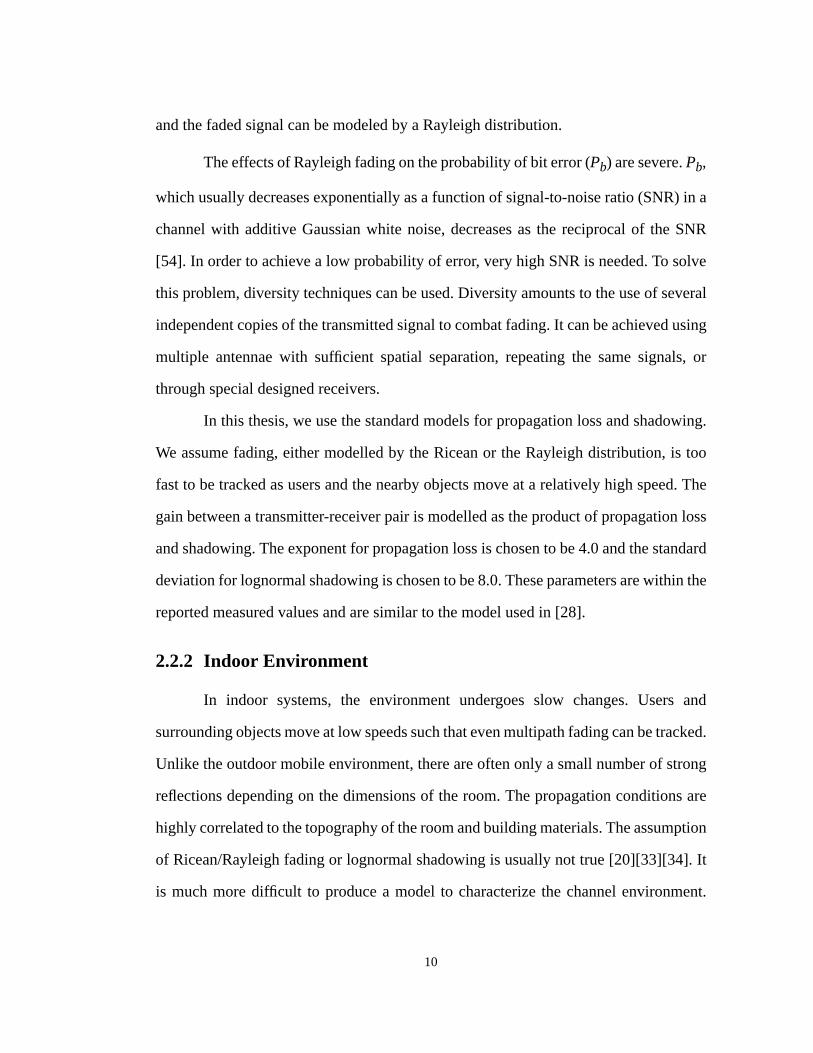
and the faded signal can be modeled by a Rayleigh distribution.
The effects of Rayleigh fading on the probability of bit error (Pb) are severe. Pb,
which usually decreases exponentially as a function of signal-to-noise ratio (SNR) in a
channel with additive Gaussian white noise, decreases as the reciprocal of the SNR
[54]. In order to achieve a low probability of error, very high SNR is needed. To solve
this problem, diversity techniques can be used. Diversity amounts to the use of several
independent copies of the transmitted signal to combat fading. It can be achieved using
multiple antennae with sufficient spatial separation, repeating the same signals, or
through special designed receivers.
In this thesis, we use the standard models for propagation loss and shadowing.
We assume fading, either modelled by the Ricean or the Rayleigh distribution, is too
fast to be tracked as users and the nearby objects move at a relatively high speed. The
gain between a transmitter-receiver pair is modelled as the product of propagation loss
and shadowing. The exponent for propagation loss is chosen to be 4.0 and the standard
deviation for lognormal shadowing is chosen to be 8.0. These parameters are within the
reported measured values and are similar to the model used in [28].
2.2.2 Indoor Environment
In indoor systems, the environment undergoes slow changes. Users and
surrounding objects move at low speeds such that even multipath fading can be tracked.
Unlike the outdoor mobile environment, there are often only a small number of strong
reflections depending on the dimensions of the room. The propagation conditions are
highly correlated to the topography of the room and building materials. The assumption
of Ricean/Rayleigh fading or lognormal shadowing is usually not true [20][33][34]. It
is much more difficult to produce a model to characterize the channel environment.
9
closely related to the normal or Gaussian distribution. It is equal to the Gaussian
distribution when the mean and the standard deviation are in the units of dB. The
standard deviation of the lognormal distribution varies depending on the environment.
It is about 8 dB in a suburban macro-cellular environment for the 900 MHz cellular
band and about 4.5 dB in an urban micro-cellular setting for the 1.7 GHz PCS band
[31]. It can be larger than 12 dB in mountainous terrain.
In outdoor mobile radio, there are often many strong received paths. As a user
moves in the system, signals may be reflected off nearby buildings and moving
vehicles. The signals arrive at the receiver with various delays and amplitudes.
Depending on the phase and amplitude differences of these rays, the resulting signal
may have very large variations as signals add constructively or destructively depending
on the relative phase differences. This is called multipath fading. If the average delay
of these different paths is less than a symbol duration, the fading is called frequency
non-selective. That is, fading is flat across the band. If the average delay is greater than
a symbol length, fading is called frequency selective fading. Frequency selective fading
is difficult to model and wide band measurements are needed for these channels.
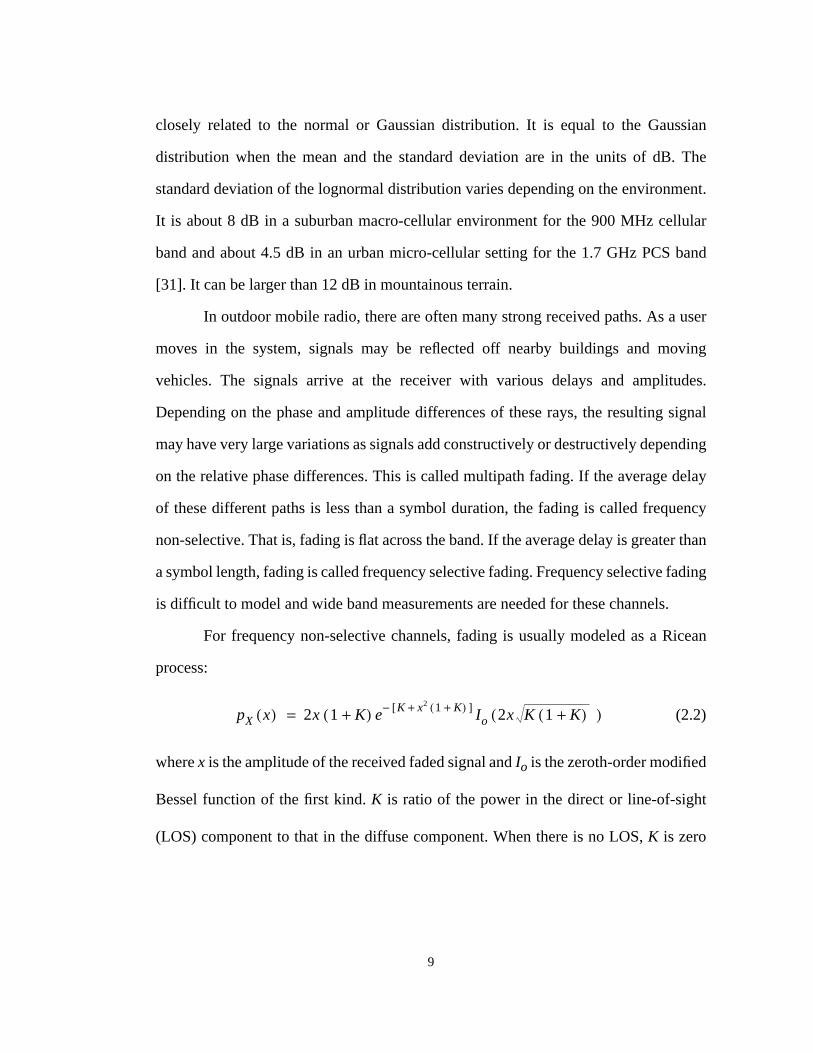
For frequency non-selective channels, fading is usually modeled as a Ricean
process:
(2.2)
where x is the amplitude of the received faded signal and Io is the zeroth-order modified
Bessel function of the first kind. K is ratio of the power in the direct or line-of-sight
(LOS) component to that in the diffuse component. When there is no LOS, K is zero
pX x( ) 2x 1 K+( ) e K x2 1 K+( )+[ ]− Io 2x K 1 K+( )( )=
8
due to signal attenuation, signals may refract or be reflected off different surfaces of
different objects located at a wide range of distances. Power variations due to
obstruction and channeling effects are called shadowing and often change slowly.
Power variations which often change quickly due to reflections from nearby objects and
due to user’s mobility are called fading. In addition, users may move at a high speed
resulting in rapid changes in propagation conditions.
In Section 2.2.1, the outdoor cellular propagation environment is discussed. A
few words about the techniques needed to mitigate the effect of severe channels are
given. The outdoor channel model used throughout this thesis is also presented. In
Section 2.2.2, a brief overview of the indoor propagation environment is presented.
2.2.1 Outdoor Cellular Environment
In the outdoor cellular environment, the mobile users are often far from the base
stations they are communicating with. Loss due to attenuation of power with distance
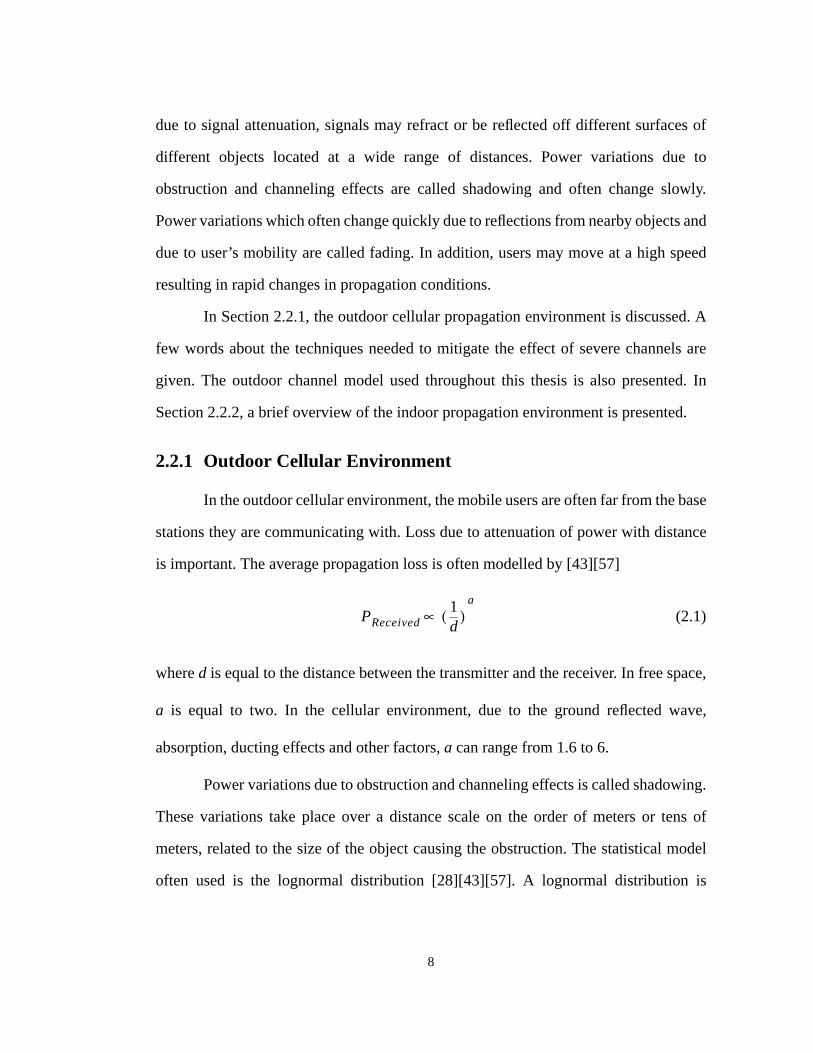
is important. The average propagation loss is often modelled by [43][57]
(2.1)
where d is equal to the distance between the transmitter and the receiver. In free space,
a is equal to two. In the cellular environment, due to the ground reflected wave,
absorption, ducting effects and other factors, a can range from 1.6 to 6.
Power variations due to obstruction and channeling effects is called shadowing.
These variations take place over a distance scale on the order of meters or tens of
meters, related to the size of the object causing the obstruction. The statistical model
often used is the lognormal distribution [28][43][57]. A lognormal distribution is
PReceived1d
( )a
∝
7
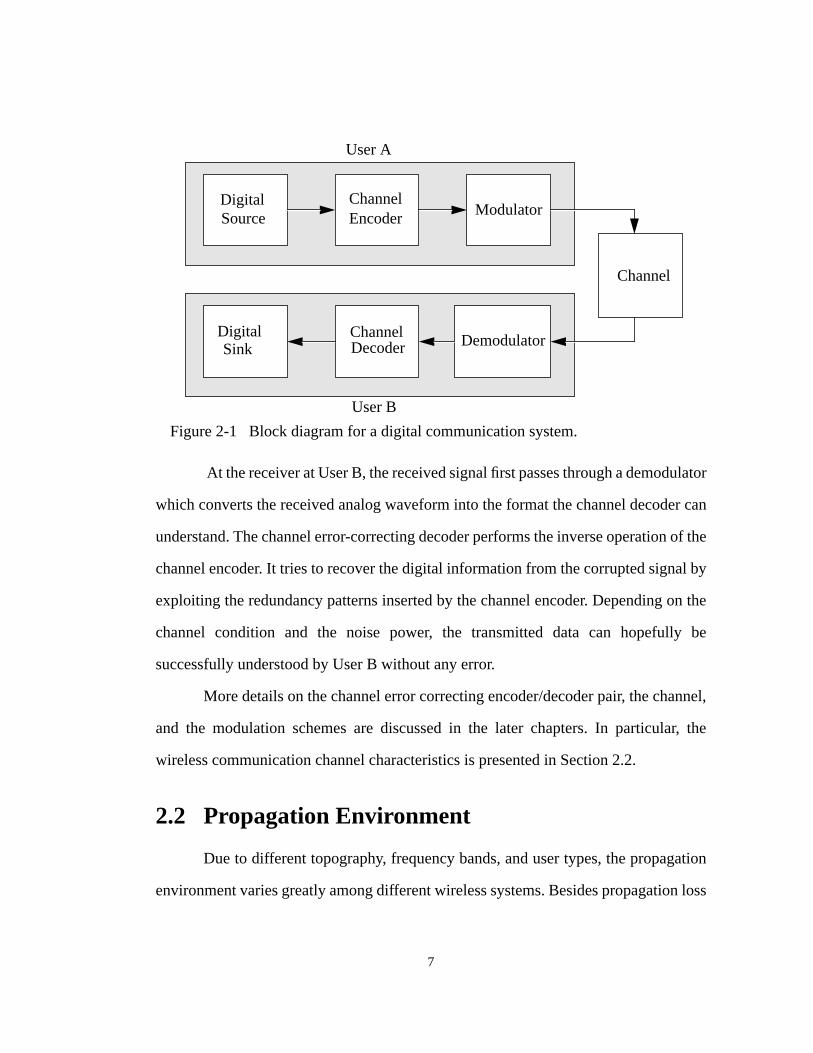
At the receiver at User B, the received signal first passes through a demodulator
which converts the received analog waveform into the format the channel decoder can
understand. The channel error-correcting decoder performs the inverse operation of the
channel encoder. It tries to recover the digital information from the corrupted signal by
exploiting the redundancy patterns inserted by the channel encoder. Depending on the
channel condition and the noise power, the transmitted data can hopefully be
successfully understood by User B without any error.
More details on the channel error correcting encoder/decoder pair, the channel,
and the modulation schemes are discussed in the later chapters. In particular, the
wireless communication channel characteristics is presented in Section 2.2.
2.2 Propagation Environment
Due to different topography, frequency bands, and user types, the propagation
environment varies greatly among different wireless systems. Besides propagation loss
DigitalSource
ChannelEncoder Modulator
Channel
DemodulatorChannelDecoder
DigitalSink
User A
User B
Figure 2-1 Block diagram for a digital communication system.
6
impairments in Section 2.2. The characteristics of the cellular wireless system are
presented in Section 2.3. In the same section, we also discuss the different coordination
schemes commonly used to allow multiple users share the same channels. In Section
2.4, we give a short description of the power control algorithms which are essential in
high capacity wireless communication systems and present the merits of these
algorithms. Finally, we offer some concluding remarks at the end of this chapter.
2.1 Digital Communication Systems
Digital communication systems have many desirable characteristics that make
them suitable for the wireless application. These systems can transmit information
through the channels more efficiently than their analog counter-parts and at the same
time offer better signal quality. Digital communication systems can offer enough
flexibility to accommodate different types of users which may request voice, video, or
data services. In addition, digital communication systems allow the system designers to
control the system parameters more tightly so that more users can communicate in the
same channels.
A simplified digital communication can be presented by the block diagram in
Figure 2-1 [54][70] where User A is sending information to user B. The digital source
at User A generates information to be transmitted. The digital information is then
encoded via an error-correcting encoder. The encoder adds controlled redundancy
symbols to the information. The redundancy protects the information from corruption
due to transmission over a noisy channel. The coded digital information is then fed to
a modulator which maps the digital information to an analog signal waveform suitable
for transmission over the channel. The analog waveform then travels through a noisy
channel that corrupts the signals.
5
Chapter 2
BACKGROUND
A wireless communication system is a multi-user system. As we aim to design
a high capacity wireless system that can accommodate a large number of users, users
have to compete with one another to communicate in the limited spectrum.
Coordination among the users is necessary so that channel usage can be maximized in
a fair matter. Digital communication techniques are needed. These techniques not only
utilize the spectrum more efficiently to allow more users to communicate, but they also
offer enough flexibility to accommodate different combinations of user traffics. The
radio channels that wireless communication system operate in are often severely
impaired by difficult propagation conditions. Special techniques are needed to mitigate
these problems. These and many other factors have to be considered in designing a
system that can support a large number of users such that each one can maintain good
signal quality.
In this chapter, we first describe the fundamentals of digital communication
systems in Section 2.1. We then present a short discussion on the radio channel and its
44
pattern. With no mobility, the fixed assignment system has Erlang capacity of about
0.072 for Pdrop of 0.001 and 0.089 for Pdrop of 0.01. That is less than 50% of the Erlang
capacity for an orthogonal system with M/N=10/23 with users moving at 0.5 m/frame
(or 90 km/hr for 20 ms frames) and is less than 35% of the Erlang capacity of the
orthogonal system with stationary users. The orthogonal system is able to achieve
higher capacity due to more sophisticated power control and interference avoidance and
averaging schemes which give users the flexibility to adapt to the changing
environment.
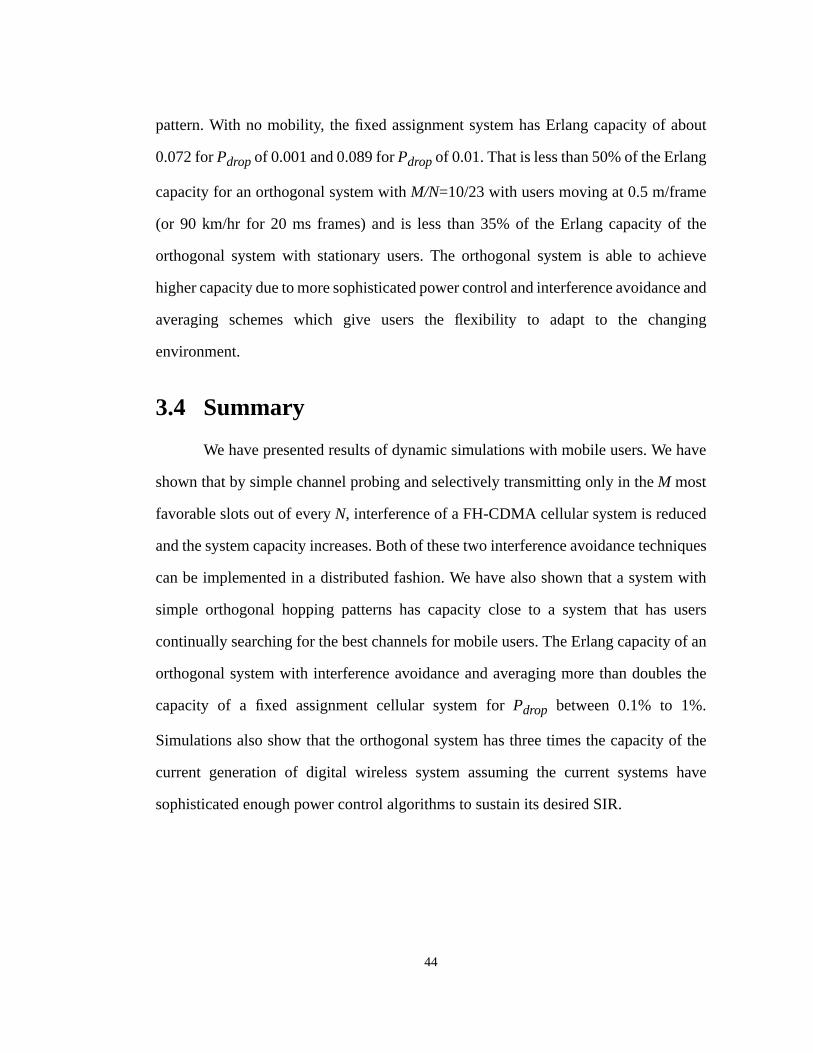
3.4 Summary
We have presented results of dynamic simulations with mobile users. We have
shown that by simple channel probing and selectively transmitting only in the M most
favorable slots out of every N, interference of a FH-CDMA cellular system is reduced
and the system capacity increases. Both of these two interference avoidance techniques
can be implemented in a distributed fashion. We have also shown that a system with
simple orthogonal hopping patterns has capacity close to a system that has users
continually searching for the best channels for mobile users. The Erlang capacity of an
orthogonal system with interference avoidance and averaging more than doubles the
capacity of a fixed assignment cellular system for Pdrop between 0.1% to 1%.
Simulations also show that the orthogonal system has three times the capacity of the
current generation of digital wireless system assuming the current systems have
sophisticated enough power control algorithms to sustain its desired SIR.
43
.
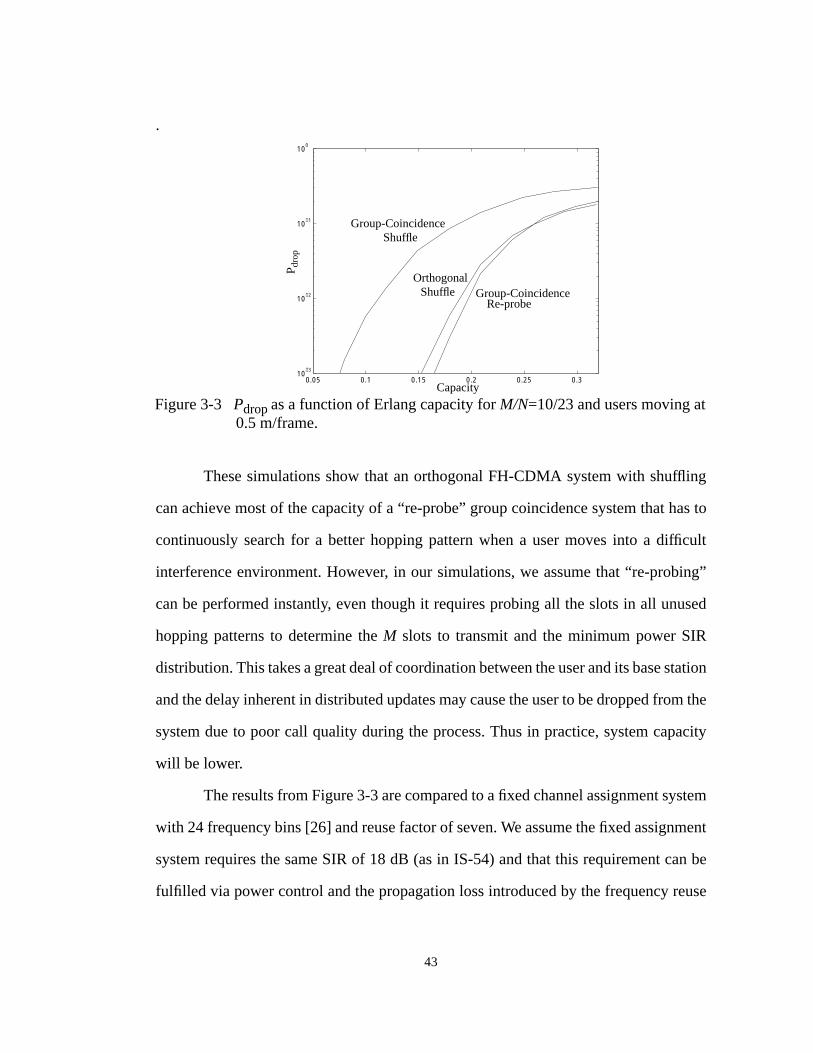
These simulations show that an orthogonal FH-CDMA system with shuffling
can achieve most of the capacity of a “re-probe” group coincidence system that has to
continuously search for a better hopping pattern when a user moves into a difficult
interference environment. However, in our simulations, we assume that “re-probing”
can be performed instantly, even though it requires probing all the slots in all unused
hopping patterns to determine the M slots to transmit and the minimum power SIR
distribution. This takes a great deal of coordination between the user and its base station
and the delay inherent in distributed updates may cause the user to be dropped from the
system due to poor call quality during the process. Thus in practice, system capacity
will be lower.
The results from Figure 3-3 are compared to a fixed channel assignment system
with 24 frequency bins [26] and reuse factor of seven. We assume the fixed assignment
system requires the same SIR of 18 dB (as in IS-54) and that this requirement can be
fulfilled via power control and the propagation loss introduced by the frequency reuse
0.05 0.1 0.15 0.2 0.25 0.310
−3
10−2
10−1
100
Capacity
Group-CoincidenceOrthogonal
ShuffleRe-probe
Group-CoincidenceShuffle
P dro
p
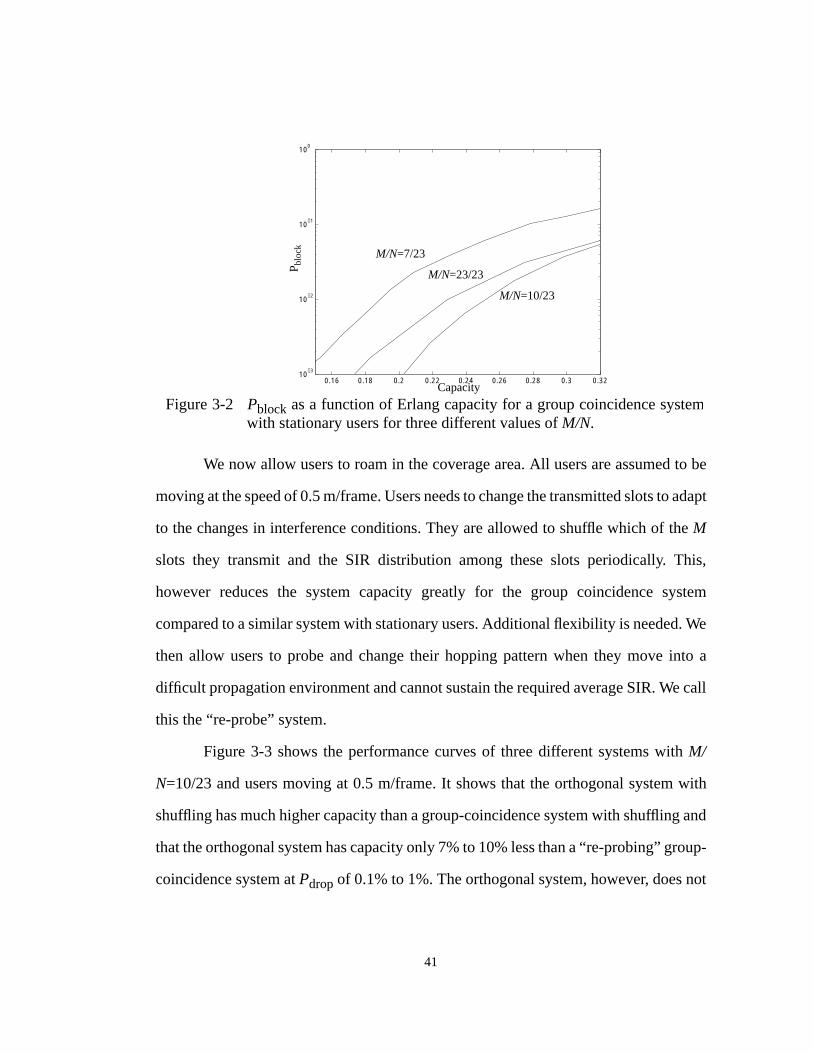
Figure 3-3 Pdrop as a function of Erlang capacity for M/N=10/23 and users moving at0.5 m/frame.
42
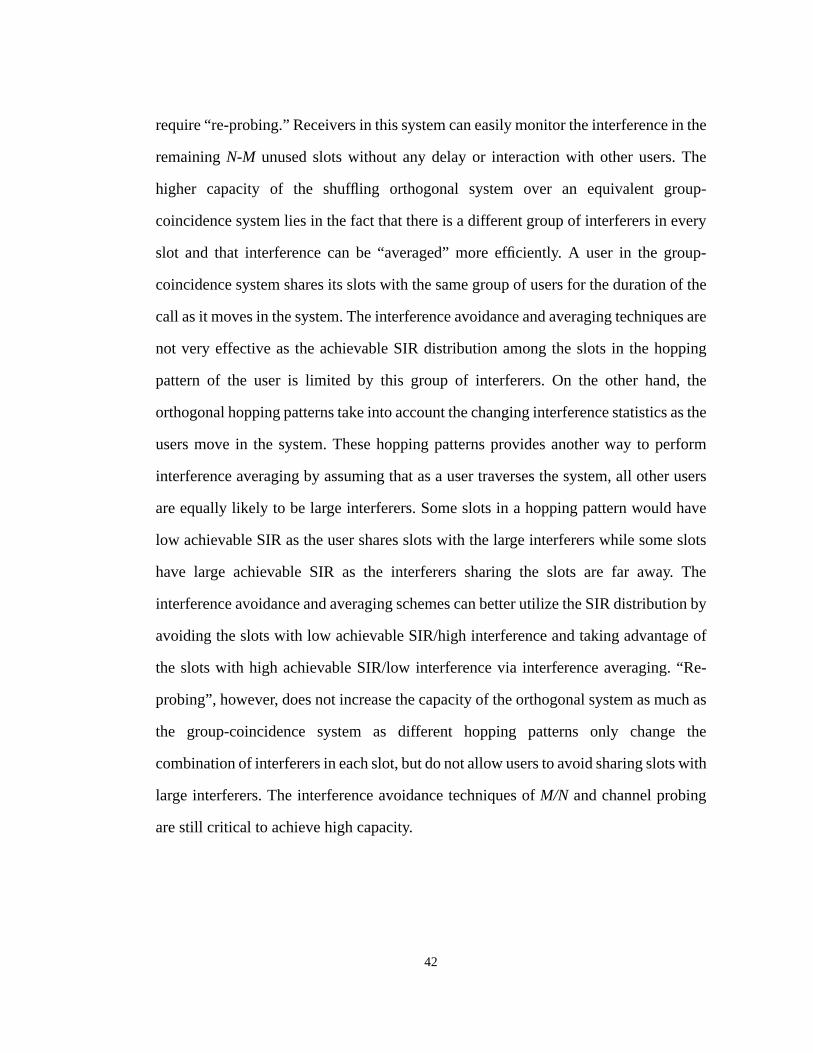
require “re-probing.” Receivers in this system can easily monitor the interference in the
remaining N-M unused slots without any delay or interaction with other users. The
higher capacity of the shuffling orthogonal system over an equivalent group-
coincidence system lies in the fact that there is a different group of interferers in every
slot and that interference can be “averaged” more efficiently. A user in the group-
coincidence system shares its slots with the same group of users for the duration of the
call as it moves in the system. The interference avoidance and averaging techniques are
not very effective as the achievable SIR distribution among the slots in the hopping
pattern of the user is limited by this group of interferers. On the other hand, the
orthogonal hopping patterns take into account the changing interference statistics as the
users move in the system. These hopping patterns provides another way to perform
interference averaging by assuming that as a user traverses the system, all other users
are equally likely to be large interferers. Some slots in a hopping pattern would have
low achievable SIR as the user shares slots with the large interferers while some slots
have large achievable SIR as the interferers sharing the slots are far away. The
interference avoidance and averaging schemes can better utilize the SIR distribution by
avoiding the slots with low achievable SIR/high interference and taking advantage of
the slots with high achievable SIR/low interference via interference averaging. “Re-
probing”, however, does not increase the capacity of the orthogonal system as much as
the group-coincidence system as different hopping patterns only change the
combination of interferers in each slot, but do not allow users to avoid sharing slots with
large interferers. The interference avoidance techniques of M/N and channel probing
are still critical to achieve high capacity.
41
We now allow users to roam in the coverage area. All users are assumed to be
moving at the speed of 0.5 m/frame. Users needs to change the transmitted slots to adapt
to the changes in interference conditions. They are allowed to shuffle which of the M
slots they transmit and the SIR distribution among these slots periodically. This,
however reduces the system capacity greatly for the group coincidence system
compared to a similar system with stationary users. Additional flexibility is needed. We
then allow users to probe and change their hopping pattern when they move into a
difficult propagation environment and cannot sustain the required average SIR. We call
this the “re-probe” system.
Figure 3-3 shows the performance curves of three different systems with M/
N=10/23 and users moving at 0.5 m/frame. It shows that the orthogonal system with
shuffling has much higher capacity than a group-coincidence system with shuffling and
that the orthogonal system has capacity only 7% to 10% less than a “re-probing” group-
coincidence system at Pdrop of 0.1% to 1%. The orthogonal system, however, does not
0.16 0.18 0.2 0.22 0.24 0.26 0.28 0.3 0.3210
−3
10−2
10−1
100
Capacity
P blo
ckM/N=10/23
M/N=23/23
M/N=7/23
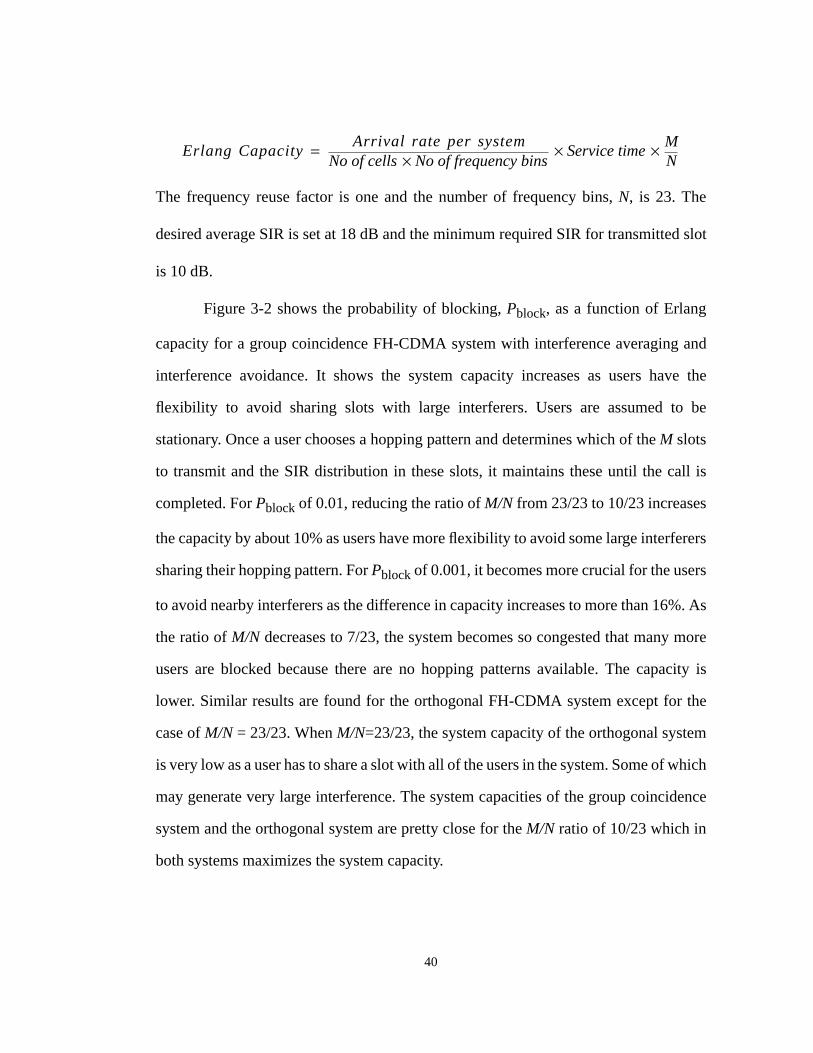
Figure 3-2 Pblock as a function of Erlang capacity for a group coincidence systemwith stationary users for three different values of M/N.
40
The frequency reuse factor is one and the number of frequency bins, N, is 23. The
desired average SIR is set at 18 dB and the minimum required SIR for transmitted slot
is 10 dB.
Figure 3-2 shows the probability of blocking, Pblock, as a function of Erlang
capacity for a group coincidence FH-CDMA system with interference averaging and
interference avoidance. It shows the system capacity increases as users have the
flexibility to avoid sharing slots with large interferers. Users are assumed to be
stationary. Once a user chooses a hopping pattern and determines which of the M slots
to transmit and the SIR distribution in these slots, it maintains these until the call is
completed. For Pblock of 0.01, reducing the ratio of M/N from 23/23 to 10/23 increases
the capacity by about 10% as users have more flexibility to avoid some large interferers
sharing their hopping pattern. For Pblock of 0.001, it becomes more crucial for the users
to avoid nearby interferers as the difference in capacity increases to more than 16%. As
the ratio of M/N decreases to 7/23, the system becomes so congested that many more
users are blocked because there are no hopping patterns available. The capacity is
lower. Similar results are found for the orthogonal FH-CDMA system except for the
case of M/N = 23/23. When M/N=23/23, the system capacity of the orthogonal system
is very low as a user has to share a slot with all of the users in the system. Some of which
may generate very large interference. The system capacities of the group coincidence
system and the orthogonal system are pretty close for the M/N ratio of 10/23 which in
both systems maximizes the system capacity.
Erlang CapacityArrival rate per system
No of cells No of frequency bins× Service timeMN
× ×=
39
distance between adjacent base stations is 8 km. Nineteen cells are simulated for three
concentric layers of cells. Users arrive with a Poisson distribution. The duration of the
calls are exponential and i.i.d. All users are assumed to have the same desired
information throughput, have the same desired SIR, and use the same code. They move
at the same speed with directions that are uniformly distributed between 0 and 2π.
Hand-offs are assumed to be instantaneous. A user is blocked from entering the system
if there is no available hopping pattern or if there is no feasible power vector to satisfy
the average SIR requirement. A user is dropped when it moves into a location with
difficult propagation conditions such that there is no feasible power vector or when it
moves into the coverage area of a new cell and there is no hopping pattern available.
Two different FH-CDMA systems are simulated. The first one has a user
sharing its hopping pattern with the same group of users. We call this the “group-
coincidence” (GC) system. The other system assigns users to orthogonal hopping
patterns such that a user encounters a different set of interferers in every hop. We call
this the orthogonal system. In both systems, a new user probes all the slots in all unused
hopping patterns. It then selects the hopping pattern that requires the least total
transmitted power in the M out of N slots used if it can maintain the desired average SIR
in these M slots. Simulations have shown that with only the average SIR requirement
among the M transmitted slots, the system capacity is much higher with users
concentrating all of their SIR in one or few slots. Since we do not allow variable bit
allocation in the system, a minimum SIR requirement for the transmitted slot is
imposed. We defined the normalized Erlang capacity as the average arrival rate per
channel divided by the average service rate per user. In M/N FH-CDMA systems, the
normalized Erlang capacity can be expressed as
38
by probing. To have a precise estimate, large transmitted power is needed so that the
SIR can be measured more accurately. (Larger transmitted power of the probing user
also induces large interference and provides more accurate interference measurement.)
The probing user, however, creates more interference and other users sharing the slot
need to compensate for the additional interference by transmitting at larger power. One
way to avoid this problem is to use the average values over several power levels at the
expense of longer probing time.
The proposed distributed channel probing algorithm not only predicts whether
a user can achieve the SIR it desires in systems where power is controlled for SIR, but
it also estimates the transmitted power needed. This algorithm can be used in
combination with the M/N scheme to select the M slots that require the least transmitted
power. It can also be used to probe all the slots in the available hopping patterns to allow
users to select the hopping patterns that require the least total transmitted power.
3.3 Simulation Results
The results of computer simulations for the reverse-link of a nineteen-cell FH-
CDMA system with interference averaging and avoidance are presented in this section.
The centralized power control algorithm is used to reduce simulation time. All signals
are assumed to experience fourth power propagation loss as in [28]. Noise power is
assumed to be the same at every receiver. We assume that the shadowing has log-normal
statistics with standard deviation of 8 dB. The coverage area of the cellular system is
divided into 100 m-squared blocks. Shadowing is linearly interpolated in dB among the
four corner points of the same block, and the shadowing values at the corner points are
independently generated random numbers. Base stations are located in the center of
equal size hexagons packed in the honeycomb configuration an the infinite plane. The
37
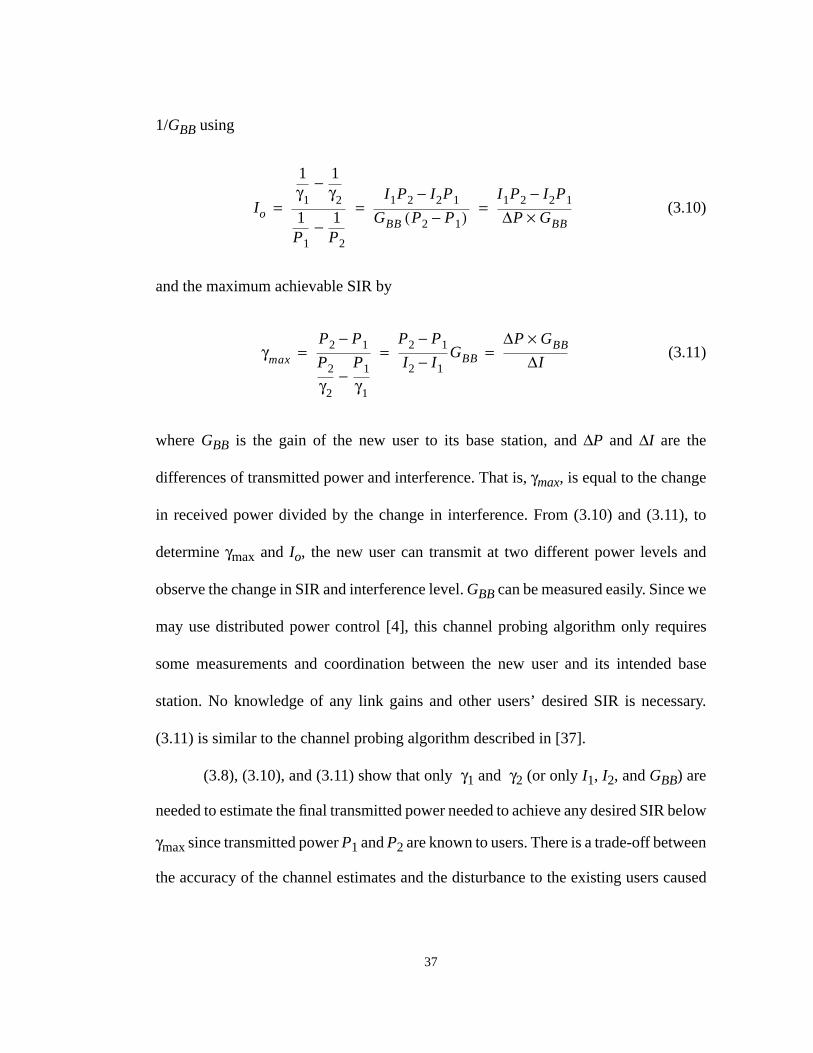
1/GBB using
(3.10)
and the maximum achievable SIR by
(3.11)
where GBB is the gain of the new user to its base station, and ∆P and ∆I are the
differences of transmitted power and interference. That is, γmax, is equal to the change
in received power divided by the change in interference. From (3.10) and (3.11), to
determine γmax and Io, the new user can transmit at two different power levels and
observe the change in SIR and interference level. GBB can be measured easily. Since we
may use distributed power control [4], this channel probing algorithm only requires
some measurements and coordination between the new user and its intended base
station. No knowledge of any link gains and other users’ desired SIR is necessary.
(3.11) is similar to the channel probing algorithm described in [37].
(3.8), (3.10), and (3.11) show that only γ1 and γ2 (or only I1, I2, and GBB) are
needed to estimate the final transmitted power needed to achieve any desired SIR below
γmax since transmitted power P1 and P2 are known to users. There is a trade-off between
the accuracy of the channel estimates and the disturbance to the existing users caused
Io
1γ1
1γ2
−
1P1
1P2
−
I1P2 I2P1−GBB P2 P1−( )
I1P2 I2P1−∆P GBB×= = =
γmax
P2 P1−P2
γ2
P1
γ1−
P2 P1−I2 I1− GBB
∆P GBB×∆I
= = =
36
power to compensate for the additional interference generated by the new user and
maintain its SIR requirement. From (3.8), as the transmitted power of the new user goes
to infinity, γ approaches γmax. If a new user needs to choose among two slots to transmit,
it can use Theorem 3.1 to determine whether the slots can achieve the desirable SIR. If
both slots have γmax greater than the desired value, the new user can then use (3.7) to
determine the transmitted power needed in the slots and use the slot that requires less
power to achieve the desired SIR, generating less interference.
The achievable SIR as a function of transmitted power for a new user may seem
simple. It is only a function of the initial interference and noise floor divided by the link
gain of the user to its base station and the maximum SIR achievable for the user in the
slot. However, γmax and Io are functions of the link gains from any user sharing the slot
to all the base stations communicating in the slot, the desired SIR for the (B-1) existing
users, and the noise floor at all these base stations.
We now show that a new user can estimate both γmax and Io relatively easily and
can thus determine the transmitted power needed without disturbing the users already
in the system. Replacing PB by P, we can rewrite (3.8) in the following form,
Let P1 be some transmitted power of the new user. γ1 and I1 are the SIR and the
interference after all the other users have adjusted their power to maintain their SIR. Let
P2 be a different transmitted power of the new user, and γ2 and I2 are the corresponding
SIR and interference. We can find the initial interference plus the white noise scaled by
1γ
I0
P1
γmax+=
35
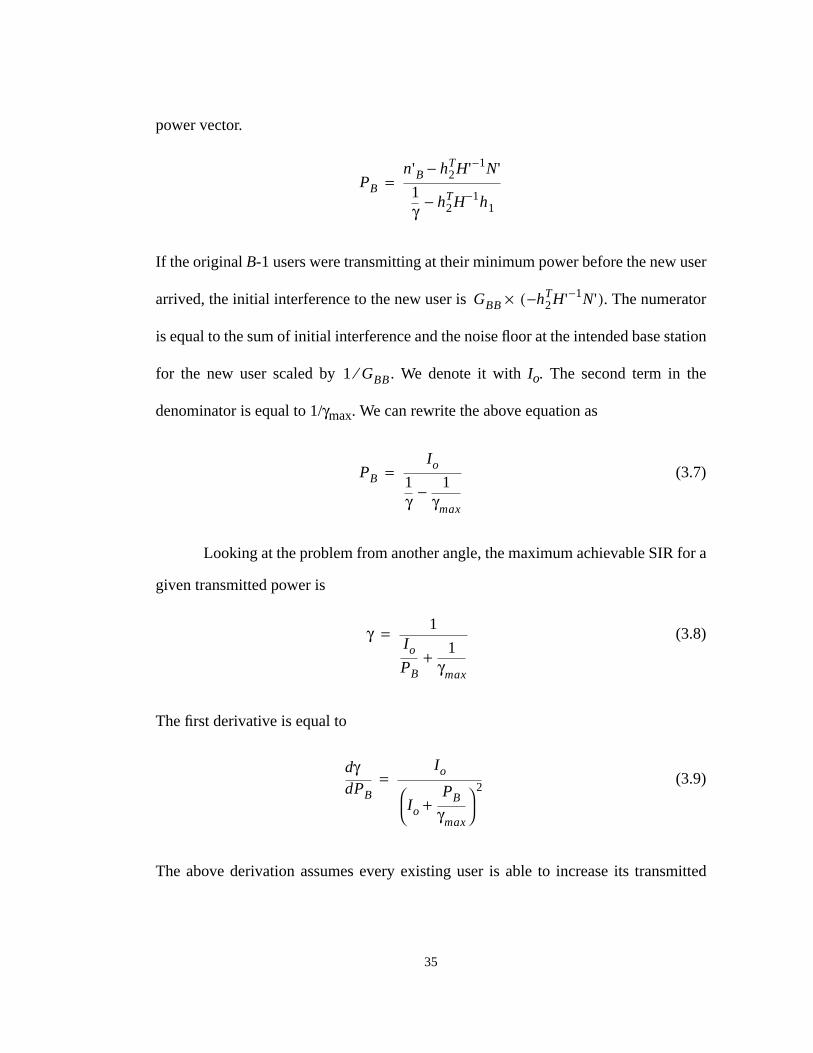
power vector.
If the original B-1 users were transmitting at their minimum power before the new user
arrived, the initial interference to the new user is . The numerator
is equal to the sum of initial interference and the noise floor at the intended base station
for the new user scaled by . We denote it with Io. The second term in the
denominator is equal to 1/γmax. We can rewrite the above equation as
(3.7)
Looking at the problem from another angle, the maximum achievable SIR for a
given transmitted power is
(3.8)
The first derivative is equal to
(3.9)
The above derivation assumes every existing user is able to increase its transmitted
PB
n'B h2TH' 1− N'−
1γ h2
TH 1− h1−=
GBB h− 2TH' 1− N'( )×
1 GBB⁄
PB
Io
1γ
1γmax
−=
γ 1Io
PB
1γmax
+=
PBddγ Io
Io
PB
γmax+
2=
34
sufficiently large such that thermal noise is negligible and the existing users transmit
only enough power to maintain their desired SIR.
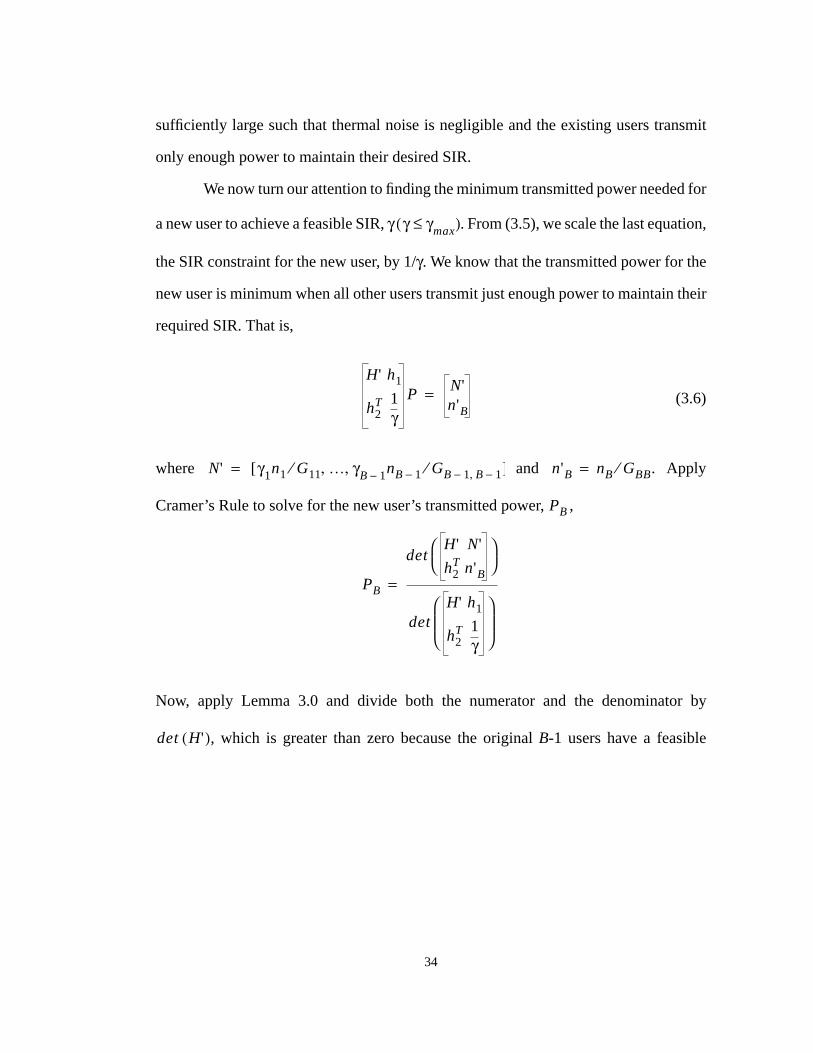
We now turn our attention to finding the minimum transmitted power needed for
a new user to achieve a feasible SIR, γ . From (3.5), we scale the last equation,
the SIR constraint for the new user, by 1/γ. We know that the transmitted power for the
new user is minimum when all other users transmit just enough power to maintain their
required SIR. That is,
(3.6)
where and . Apply
Cramer’s Rule to solve for the new user’s transmitted power, ,
Now, apply Lemma 3.0 and divide both the numerator and the denominator by
, which is greater than zero because the original B-1 users have a feasible
γ γmax≤( )
H' h1
h2T 1
γP
N'n'B
=
N' γ1n1 G11⁄ … γB 1− nB 1− GB 1− B 1−,⁄, ,[ ]= n'B nB GBB⁄=
PB
PB
detH' N'
h2T n'B
detH' h1
h2T 1
γ
=
det H'( )
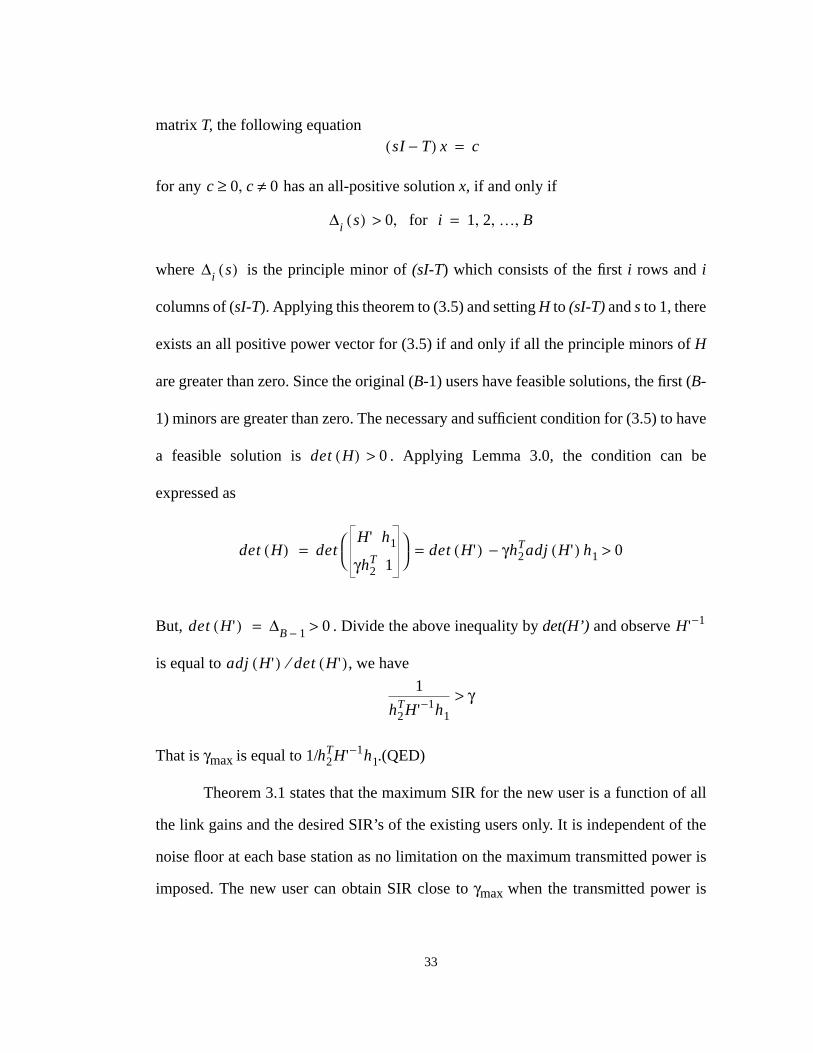
33
matrix T, the following equation
for any has an all-positive solution x, if and only if
where is the principle minor of (sI-T) which consists of the first i rows and i
columns of (sI-T). Applying this theorem to (3.5) and setting H to (sI-T) and s to 1, there
exists an all positive power vector for (3.5) if and only if all the principle minors of H
are greater than zero. Since the original (B-1) users have feasible solutions, the first (B-
1) minors are greater than zero. The necessary and sufficient condition for (3.5) to have
a feasible solution is . Applying Lemma 3.0, the condition can be
expressed as
But, . Divide the above inequality by det(H’) and observe
is equal to , we have
That is γmax is equal to 1/ .(QED)
Theorem 3.1 states that the maximum SIR for the new user is a function of all
the link gains and the desired SIR’s of the existing users only. It is independent of the
noise floor at each base station as no limitation on the maximum transmitted power is
imposed. The new user can obtain SIR close to γmax when the transmitted power is
sI T−( ) x c=
c 0≥ c 0≠,
∆i s( ) 0 for i,> 1 2 … B, , ,=
∆i s( )
det H( ) 0>
det H( ) detH' h1
γh2T 1
det H'( ) γh2Tadj H'( ) h1− 0>==
det H'( ) ∆B 1− 0>= H' 1−
adj H'( ) det H'( )⁄1
h2TH' 1− h1
γ>
h2TH' 1− h1
32
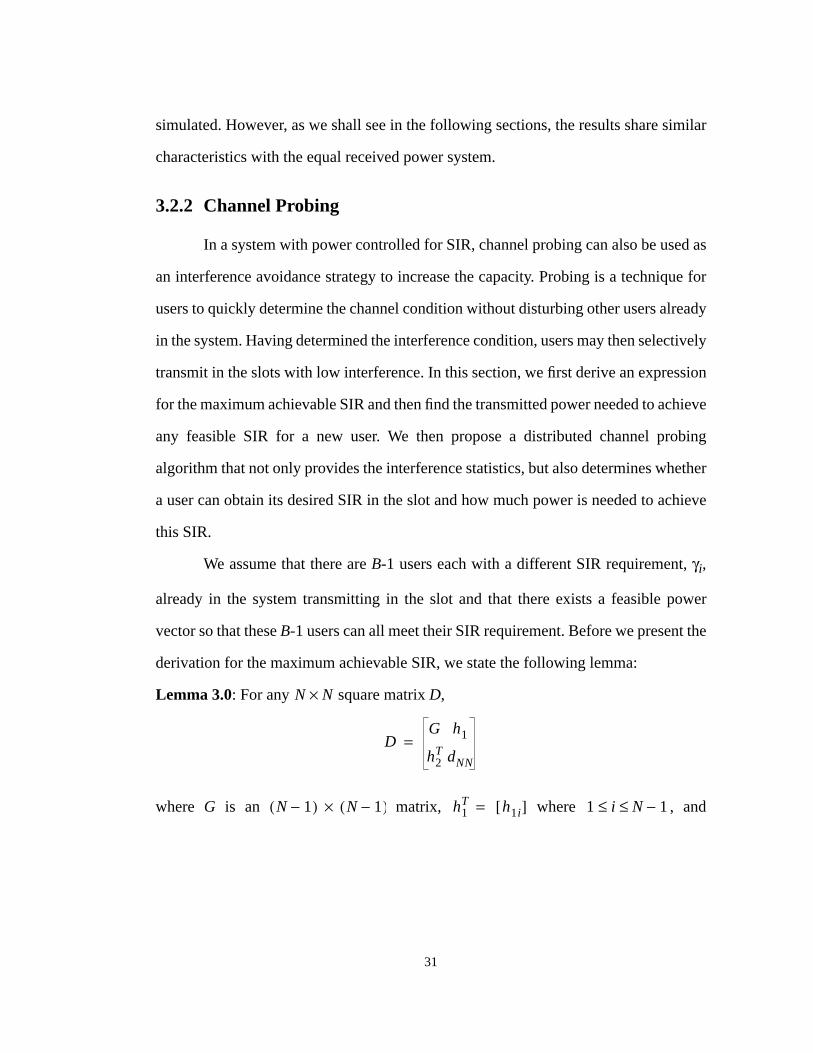
where . The determinant of D is
where adj(G) is the adjoint of G which is defined as the transpose of the cofactor matrix
of G. The cofactor matrix of G is an matrix with the (i, j)-th element
defined as the determinant of G with the i-th row and j-th column removed.
Proof: Appendix A.
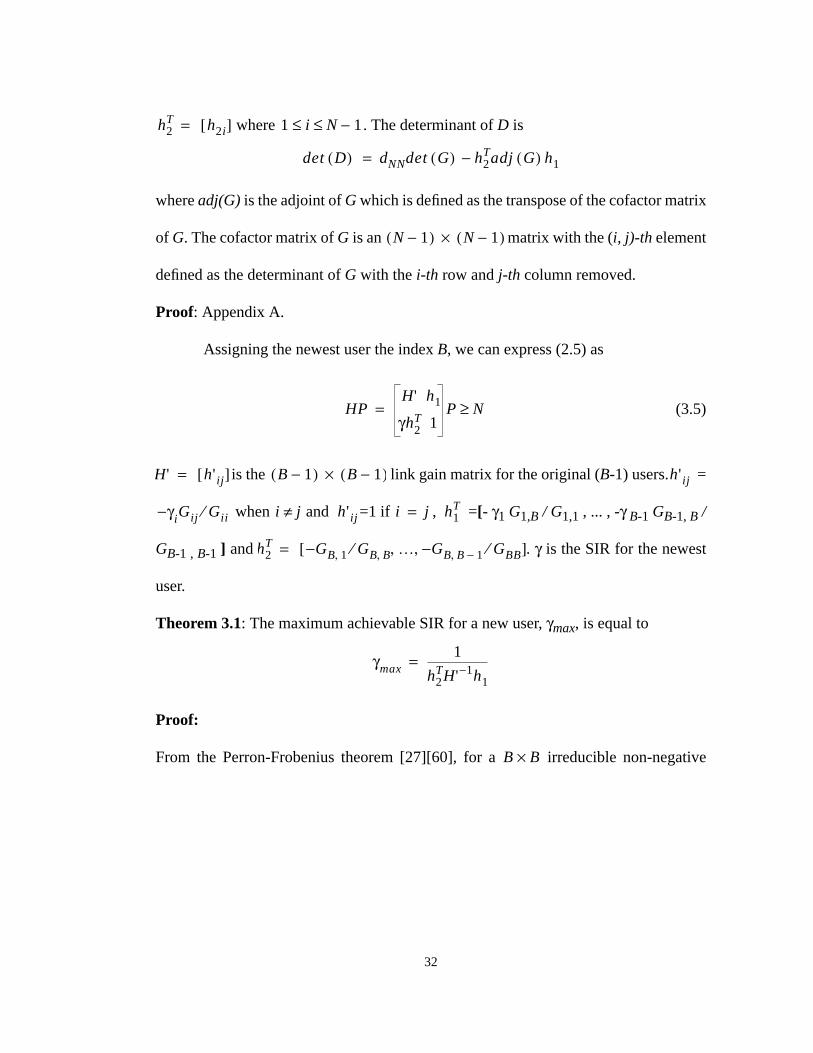
Assigning the newest user the index B, we can express (2.5) as
(3.5)
is the link gain matrix for the original (B-1) users. =
when and =1 if , =[- γ1 G1,B / G1,1 , ... , -γ B-1 GB-1, B /
GB-1 , B-1 ] and . γ is the SIR for the newest
user.
Theorem 3.1: The maximum achievable SIR for a new user, γmax, is equal to
Proof:
From the Perron-Frobenius theorem [27][60], for a irreducible non-negative
h2T h2i[ ]= 1 i N 1−≤ ≤
det D( ) dNNdet G( ) h2Tadj G( ) h1−=
N 1−( ) N 1−( )×
HPH' h1
γh2T 1
P N≥=
H' h' ij[ ]= B 1−( ) B 1−( )× h' ij
γiGij Gii⁄− i j≠ h' ij i j= h1T
h2T GB 1, GB B,⁄− … G− B B 1−, GBB⁄, ,[ ]=
γmax1
h2TH' 1− h1
=
B B×
31
simulated. However, as we shall see in the following sections, the results share similar
characteristics with the equal received power system.
3.2.2 Channel Probing
In a system with power controlled for SIR, channel probing can also be used as
an interference avoidance strategy to increase the capacity. Probing is a technique for
users to quickly determine the channel condition without disturbing other users already
in the system. Having determined the interference condition, users may then selectively
transmit in the slots with low interference. In this section, we first derive an expression
for the maximum achievable SIR and then find the transmitted power needed to achieve
any feasible SIR for a new user. We then propose a distributed channel probing
algorithm that not only provides the interference statistics, but also determines whether
a user can obtain its desired SIR in the slot and how much power is needed to achieve
this SIR.
We assume that there are B-1 users each with a different SIR requirement, γi,
already in the system transmitting in the slot and that there exists a feasible power
vector so that these B-1 users can all meet their SIR requirement. Before we present the
derivation for the maximum achievable SIR, we state the following lemma:
Lemma 3.0: For any square matrix D,
where G is an matrix, where , and
N N×
DG h1
h2T dNN
=
N 1−( ) N 1−( )× h1T h1i[ ]= 1 i N 1−≤ ≤
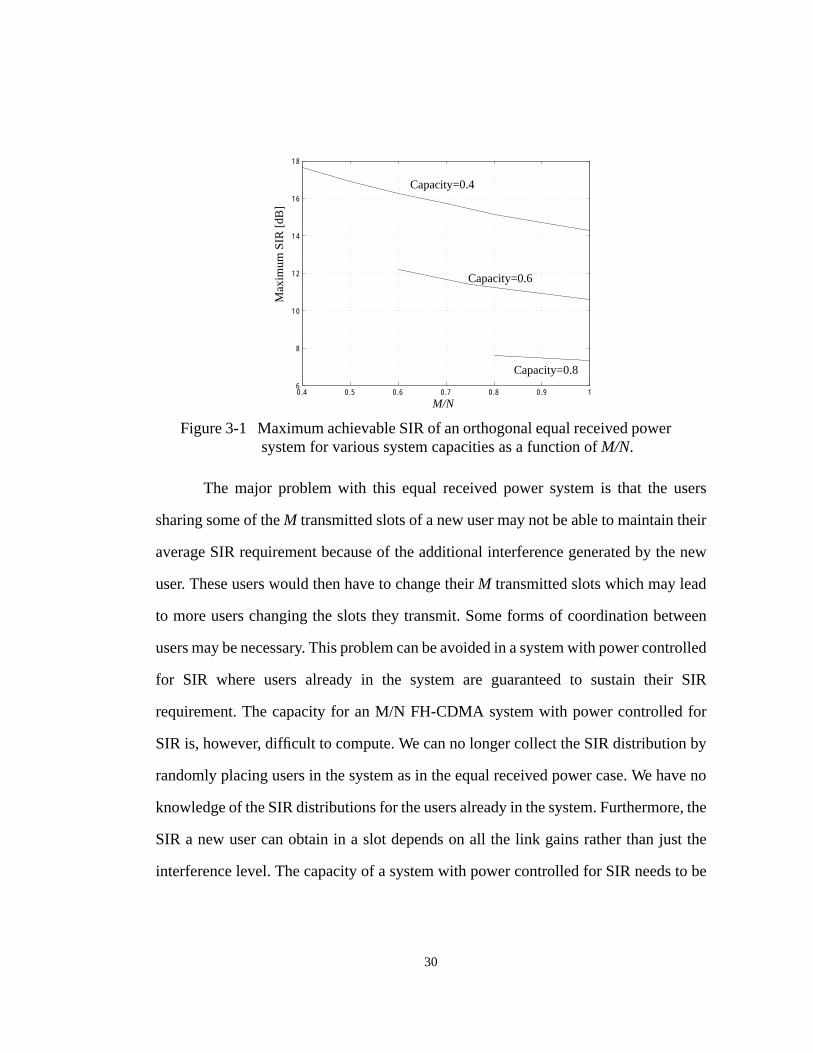
30
The major problem with this equal received power system is that the users
sharing some of the M transmitted slots of a new user may not be able to maintain their
average SIR requirement because of the additional interference generated by the new
user. These users would then have to change their M transmitted slots which may lead
to more users changing the slots they transmit. Some forms of coordination between
users may be necessary. This problem can be avoided in a system with power controlled
for SIR where users already in the system are guaranteed to sustain their SIR
requirement. The capacity for an M/N FH-CDMA system with power controlled for
SIR is, however, difficult to compute. We can no longer collect the SIR distribution by
randomly placing users in the system as in the equal received power case. We have no
knowledge of the SIR distributions for the users already in the system. Furthermore, the
SIR a new user can obtain in a slot depends on all the link gains rather than just the
interference level. The capacity of a system with power controlled for SIR needs to be
0.4 0.5 0.6 0.7 0.8 0.9 16
8
10
12
14
16
18
Max
imum
SIR
[dB
]
M/N
Capacity=0.4
Capacity=0.6
Capacity=0.8
Figure 3-1 Maximum achievable SIR of an orthogonal equal received powersystem for various system capacities as a function of M/N.
29
where is the probability density function of γi and is the SIR that satisfies
(3.4)
From (3.1), system capacity cannot be greater than M/N. The probability density
function of p(γ) is generated via computer simulations for the center cell in a nineteen-
cell cellular system for the reverse link. The standard deviation of lognormal shadowing
is 8 dB and propagation loss is inversely proportional to the fourth power of the distance
between the transmitter and the receiver. Figure 3-1 shows that as the ratio of M/N
decreases, the achievable SIR decreases as users have less choices on which slots to
transmit and cannot avoid large interferers. The achievable SIR is the highest when M/
N is equal to the capacity. When the capacity is 0.8, the system becomes so congested
that choosing M/N does not allow users enough freedom to avoid large interferers.
Simulations also show that the maximum achievable SIR decreases as the capacity
increases. We can find the maximum capacity for a specific required SIR. We have
found that if a system requires every user to have average SIR of 14.6 dB, without
interference avoidance (M/N=1), the capacity is 0.4. With interference avoidance, the
largest possible capacity is 0.55. The flexibility to assign users to the slots with lower
interference gives a 34% capacity gain for this desired average SIR.
p γ( ) γ
MN
p γ( ) dγγ
∞
∫=
28
(3.1)
The obvious drawback for using only M out of every N slots is that the throughput for
every user is lowered. The gain is in the increased number of users that a system can
support.
We can calculate the capacity for a coded FH-CDMA system with equal
received power for every receiver with infinite diversity. Denote the set of SIR’s for N
slots as . Since the set of interferers a user encounters in every slot
is different in an orthogonal system, and the received power is the same, the γi’s are
independent and identically distributed random variables. In a coded M/N FH-CDMA
system, a user is blocked only when
(3.2)
where is the i-th largest SIR in N slots and is the desired average SIR for
some code over the M slots transmitted. As N goes to infinity, the distribution of an
ensemble of N SIR samples is equal to the distribution of γi. Choosing the M best SIR
out of N slots so that a user is not blocked as is equivalent to satisfying the
inequality,
(3.3)
Capacitytotal users in the system
total hopping hopping patterns availableMN
×≡
γ1 γ2 γ3 … γN, , , ,{ }
γmaxiMγavg<
i 1=
M
∑
γmaxiγavg
N ∞→
γ p γ( ) dγγ
∞
∫
p γ( ) dγγ
∞
∫γavg≥
27
to estimate the channel conditions without disturbing the users already in the system.
We have developed a channel probing algorithm that lets users determine whether they
can achieve the desired SIR in a slot and estimate the transmitted power needed to
achieve the desired SIR. It allows users to avoid large interferers by selectively
transmitting in the slots with low interference and using the hopping patterns that
require the least total transmitted power. Both the M/N scheme and the channel probing
algorithm can be performed in a distributed fashion requiring only the cooperation of a
user and the intended receiver.
3.2.1 Interference Avoidance (M/N) for Orthogonal Systems
Even though we are mainly interested in FH-CDMA systems with power
controlled for SIR, we present the capacity analysis for an equal received power FH-
CDMA system with orthogonal hopping patterns to demonstrate the trade-offs of
transmitting only M out of every N slots [78][79][80]. A user with an orthogonal
hopping pattern shares exactly one out of every N slots with every user in a different
cell. That is, a user would encounter a different set of interferers in every hop.
We suppose all users desire the same information throughput. An orthogonal
FH-CDMA system with dynamic channel allocation (DCA) then directs every user to
transmit in M slots with the lowest interference out of N in its hopping pattern. M is
chosen based on the information throughput for each user and/or overall system
capacity. In this paper, we choose M to maximize the capacity of the system. We define
capacity as the fraction of all time-frequency slots used in a system given a specific SIR
or probability of error, Pe, distribution for the users, Pblock and Pdrop. It is a measure of
the global throughput of the cellular systems. In a frequency hopped system where all
users occupy M out of N slots, the capacity is defined as
26
in Section 3.3.
3.1 Interference Averaging
Interference averaging is achieved through channel codes and interleaving. The
capacity of cellular systems is frequently specified for particular values of probability
of blocking (Pblock) and probability of dropping (Pdrop). In a conventional TDMA
system, Pblock and Pdrop are determined by the worst case interferers as users are
blocked or dropped when a small group of users sharing the slots generate intolerably
large interference. In an FH-CDMA system, channel coding and interleaving across the
slots can be used to average out the variations in interference among the transmitted
slots. Pblock and Pdrop, in this system, are determined by the average interference
statistics and the capacity increases. Interference averaging is especially crucial for a
system where a user encounters different groups of interferers in the transmitted slots.
For simplicity, we assume that with coding and interleaving, each user requires the
same average SIR in this chapter.
3.2 Interference Avoidance
The basic idea of interference avoidance is simple. Users in the system avoid
sharing transmitted slots with large interferers nearby and need less power to meet their
SIR requirement on average. Interference is lower and the capacity is increased.
Interference avoidance can be performed by transmitting in M out of every N slots and
by channel probing. If the hopping patterns repeat every N slots, users can observe the
interference levels and only transmit in the M slots with the lowest interference, thus
avoiding sharing slots with large interferers. Channel probing is a technique for users
25
Chapter 3
POWER AND CHANNEL
ASSIGNMENT ALGORITHMS
It is known that the problem of assigning users to a set of channels and
determining the transmitted power so that the maximum number of users can be
admitted into the system is an NP-complete problem. Practical assignment algorithms
need to incorporate channel information to maximize system capacity without resorting
to large signal processing complexity. Since a frequency hopped CDMA (FH-CDMA)
system is interference limited, interference reduction concepts of interference
avoidance and interference averaging can be applied when assigning power and
channels.
In this chapter, we first discuss the concept of interference averaging and
avoidance in Section 3.1 and Section 3.2. We then introduce a few new algorithms and
study their effects on the system capacity. We conclude this chapter with simulation
results of FH-CDMA systems with interference averaging and interference avoidance
69
with large interferers nearby seems to be the best strategy. These bit allocation
algorithms gives the system more flexibility to adapt to the interference statistics. The
system capacity increases.
The optimum throughput for a single channel variable throughput system is also
difficult to find. We introduce a channel resource measure and a centralized algorithm
that can achieve the maximum system throughput in most of the cases. More work is
needed to develop a distributed algorithm. The proposed centralized algorithm can be
modified to dedicate more throughput to the users with more importance. We can weigh
the reduction of the channel resources with the importance of the data or user when we
assign bits. This would allow a channel to serve vastly different types users. Some of
the users which may require constant throughput as in speech, some may desire variable
or bursty throughput as in data, and some may require a minimum throughput with
periodic spurs of data as in video.
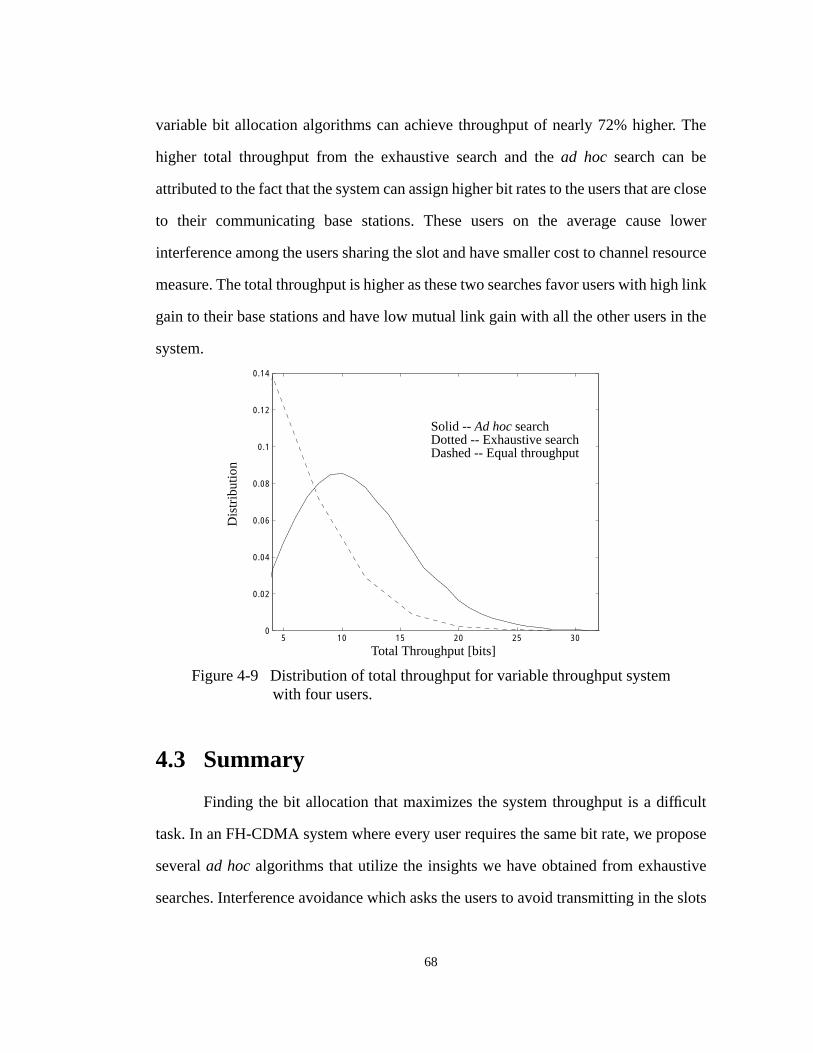
68
variable bit allocation algorithms can achieve throughput of nearly 72% higher. The
higher total throughput from the exhaustive search and the ad hoc search can be
attributed to the fact that the system can assign higher bit rates to the users that are close
to their communicating base stations. These users on the average cause lower
interference among the users sharing the slot and have smaller cost to channel resource
measure. The total throughput is higher as these two searches favor users with high link
gain to their base stations and have low mutual link gain with all the other users in the
system.
4.3 Summary
Finding the bit allocation that maximizes the system throughput is a difficult
task. In an FH-CDMA system where every user requires the same bit rate, we propose
several ad hoc algorithms that utilize the insights we have obtained from exhaustive
searches. Interference avoidance which asks the users to avoid transmitting in the slots
Figure 4-9 Distribution of total throughput for variable throughput systemwith four users.
5 10 15 20 25 300
0.02
0.04
0.06
0.08
0.1
0.12
0.14
Total Throughput [bits]
Dis
trib
utio
n
Solid -- Ad hoc searchDotted -- Exhaustive searchDashed -- Equal throughput
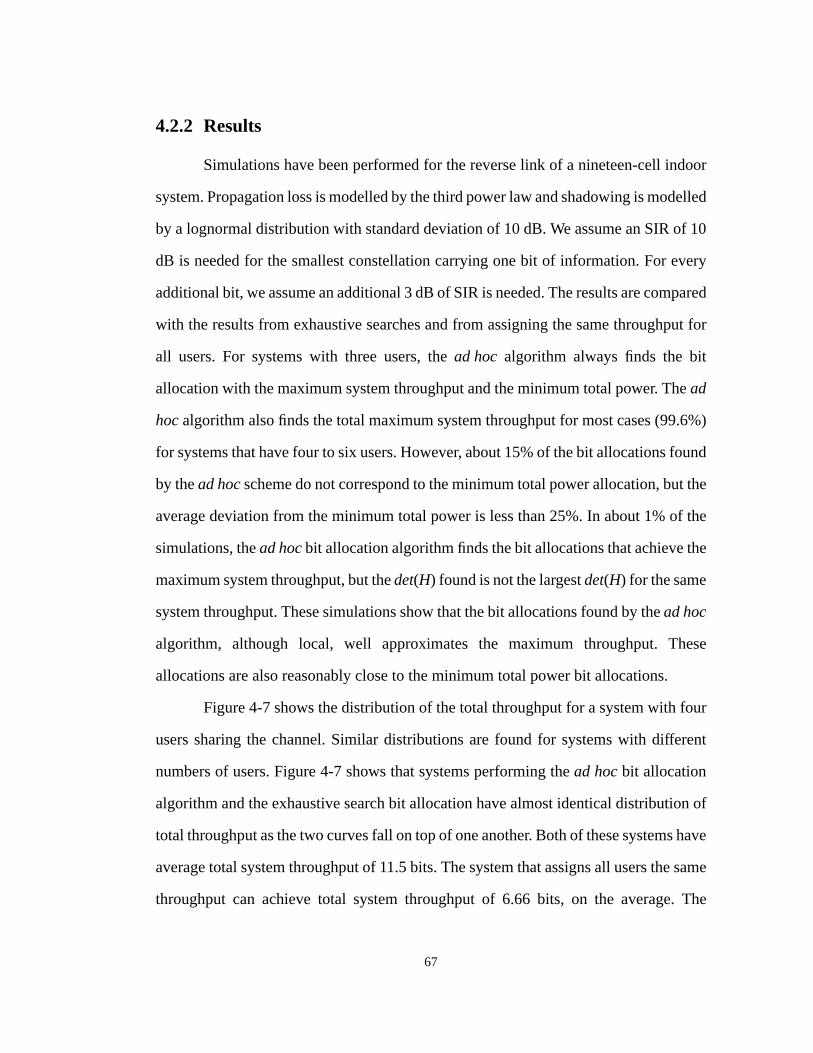
67
4.2.2 Results
Simulations have been performed for the reverse link of a nineteen-cell indoor
system. Propagation loss is modelled by the third power law and shadowing is modelled
by a lognormal distribution with standard deviation of 10 dB. We assume an SIR of 10
dB is needed for the smallest constellation carrying one bit of information. For every
additional bit, we assume an additional 3 dB of SIR is needed. The results are compared
with the results from exhaustive searches and from assigning the same throughput for
all users. For systems with three users, the ad hoc algorithm always finds the bit
allocation with the maximum system throughput and the minimum total power. The ad
hoc algorithm also finds the total maximum system throughput for most cases (99.6%)
for systems that have four to six users. However, about 15% of the bit allocations found
by the ad hoc scheme do not correspond to the minimum total power allocation, but the
average deviation from the minimum total power is less than 25%. In about 1% of the
simulations, the ad hoc bit allocation algorithm finds the bit allocations that achieve the
maximum system throughput, but the det(H) found is not the largest det(H) for the same
system throughput. These simulations show that the bit allocations found by the ad hoc
algorithm, although local, well approximates the maximum throughput. These
allocations are also reasonably close to the minimum total power bit allocations.
Figure 4-7 shows the distribution of the total throughput for a system with four
users sharing the channel. Similar distributions are found for systems with different
numbers of users. Figure 4-7 shows that systems performing the ad hoc bit allocation
algorithm and the exhaustive search bit allocation have almost identical distribution of
total throughput as the two curves fall on top of one another. Both of these systems have
average total system throughput of 11.5 bits. The system that assigns all users the same
throughput can achieve total system throughput of 6.66 bits, on the average. The
66
each user as it tries to increase its throughput. We thus propose an ad hoc bit allocation
algorithm allowing the user that causes the smallest reduction in det(H) to increase its
throughput. The algorithm can be described below:
1. Start with a feasible set of users all capable of sustaining the minimum
required SIR, γmin.
2. Each user takes turns to probe the channel and calculate the cost or reduc-
tion to det(H) for the additional SIR needed for an extra bit, when the SIR
needed is less than γmax.
3. Allocate an extra bit to the users with the minimum cost.
4. Repeat step (2) and (3) until the required SIR needed for an extra bit is
greater than the maximum achievable SIR for all users.
This algorithm does not guarantee that it would find the bit allocation that
achieves the maximum throughput, nor does it guarantee that the final det(H) for the bit
allocation found is the maximum det(H) for the same system throughput. It also does
not guarantee that the bit allocation found is the minimum total power bit allocation.
The algorithm tries to minimize the cost to det(H) for an additional bit at every step so
that the maximum channel resource, det(H), is available for the additional bit
allocation. The solution found is a local maximum at which no more bits can be
assigned. Trying to minimize the det(H) has the additional benefit that the transmitted
power for the bit allocation found would be relatively small on the average as the
solution to (4.8) is scaled by 1/det(H) by Cramer’s Rule. This bit allocation algorithm
requires a centralized control to schedule the users to take turns to probe the channel
and then assign the additional bit to the user with the least cost to the channel resource.
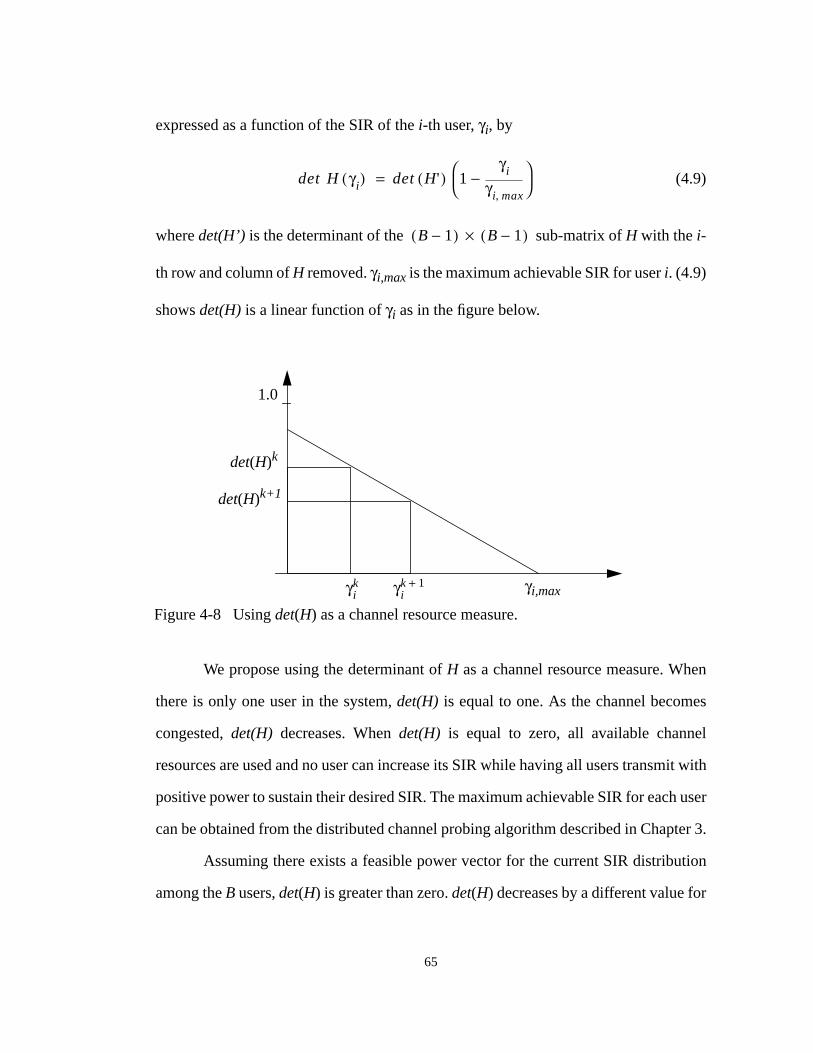
65
expressed as a function of the SIR of the i-th user, γi, by
(4.9)
where det(H’) is the determinant of the sub-matrix of H with the i-
th row and column of H removed. γi,max is the maximum achievable SIR for user i. (4.9)
shows det(H) is a linear function of γi as in the figure below.
We propose using the determinant of H as a channel resource measure. When
there is only one user in the system, det(H) is equal to one. As the channel becomes
congested, det(H) decreases. When det(H) is equal to zero, all available channel
resources are used and no user can increase its SIR while having all users transmit with
positive power to sustain their desired SIR. The maximum achievable SIR for each user
can be obtained from the distributed channel probing algorithm described in Chapter 3.
Assuming there exists a feasible power vector for the current SIR distribution
among the B users, det(H) is greater than zero. det(H) decreases by a different value for
det H γi( ) det H'( ) 1γi
γi max,−
=
B 1−( ) B 1−( )×
1.0
det(H)k
det(H)k+1
γi,max
Figure 4-8 Using det(H) as a channel resource measure.
γik 1+γi
k
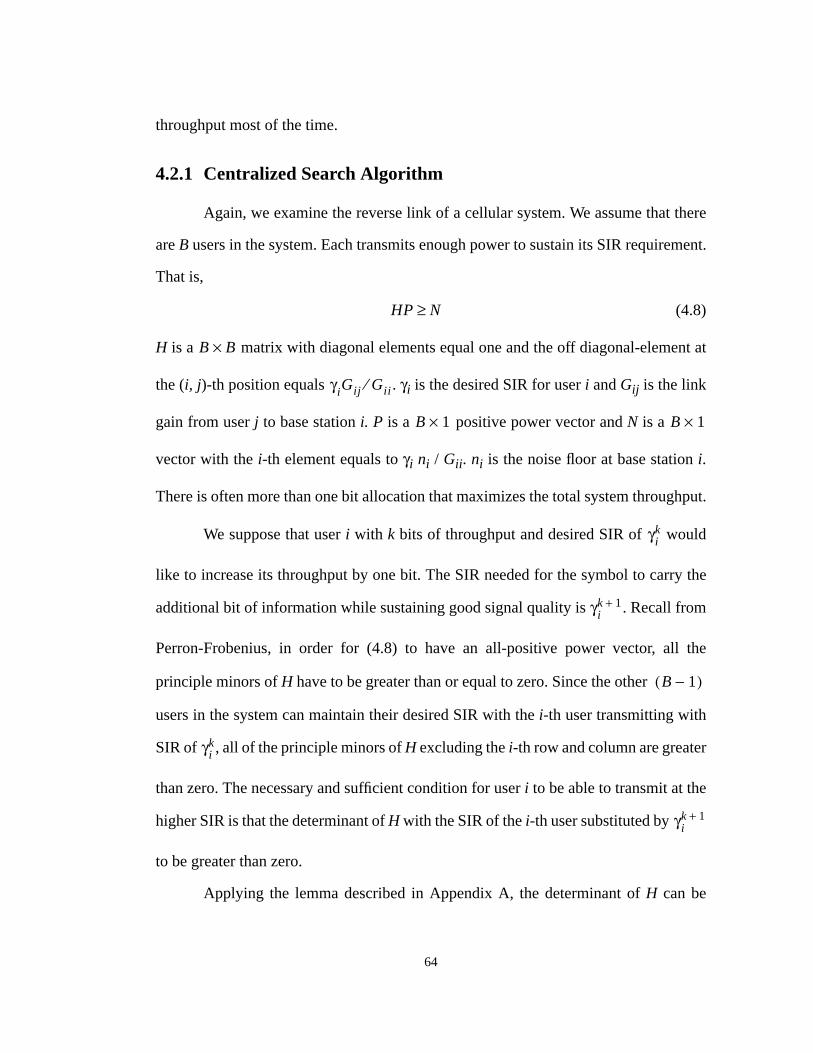
64
throughput most of the time.
4.2.1 Centralized Search Algorithm
Again, we examine the reverse link of a cellular system. We assume that there
are B users in the system. Each transmits enough power to sustain its SIR requirement.
That is,
(4.8)
H is a matrix with diagonal elements equal one and the off diagonal-element at
the (i, j)-th position equals . γi is the desired SIR for user i and Gij is the link
gain from user j to base station i. P is a positive power vector and N is a
vector with the i-th element equals to γi ni / Gii. ni is the noise floor at base station i.
There is often more than one bit allocation that maximizes the total system throughput.
We suppose that user i with k bits of throughput and desired SIR of would
like to increase its throughput by one bit. The SIR needed for the symbol to carry the
additional bit of information while sustaining good signal quality is . Recall from
Perron-Frobenius, in order for (4.8) to have an all-positive power vector, all the
principle minors of H have to be greater than or equal to zero. Since the other
users in the system can maintain their desired SIR with the i-th user transmitting with
SIR of , all of the principle minors of H excluding the i-th row and column are greater
than zero. The necessary and sufficient condition for user i to be able to transmit at the
higher SIR is that the determinant of H with the SIR of the i-th user substituted by
to be greater than zero.
Applying the lemma described in Appendix A, the determinant of H can be
HP N≥
B B×
γiGij Gii⁄
B 1× B 1×
γik
γik 1+
B 1−( )
γik
γik 1+
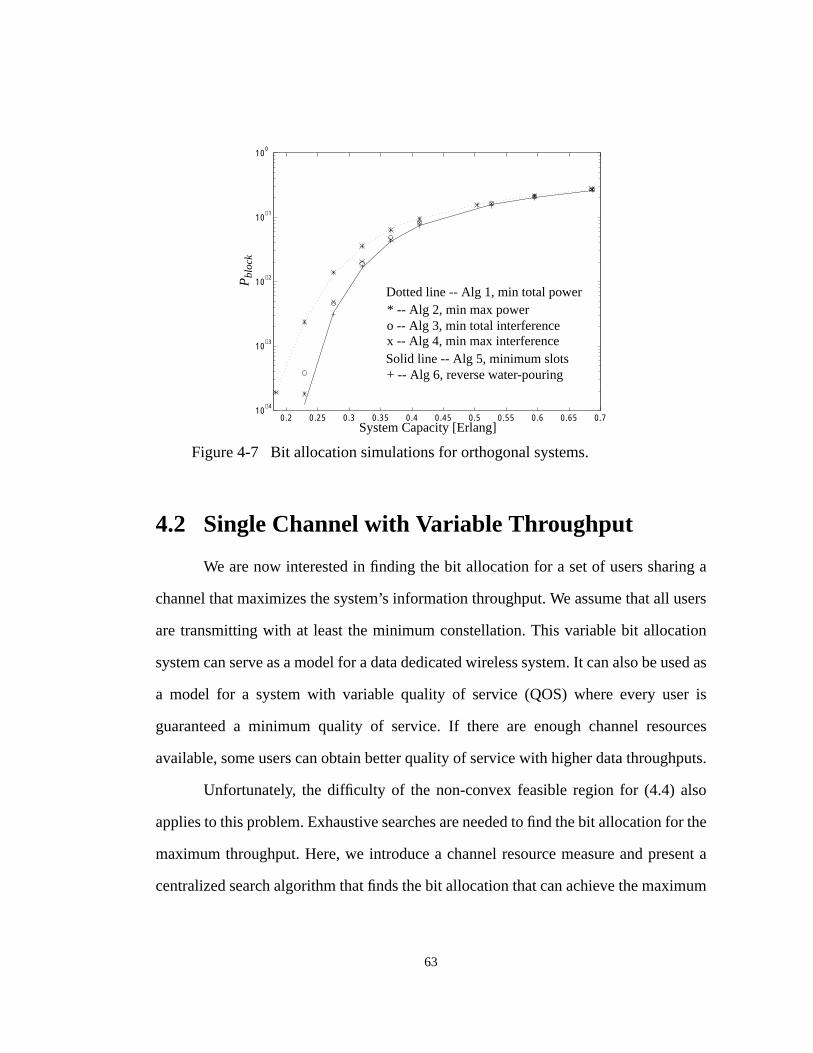
63
4.2 Single Channel with Variable Throughput
We are now interested in finding the bit allocation for a set of users sharing a
channel that maximizes the system’s information throughput. We assume that all users
are transmitting with at least the minimum constellation. This variable bit allocation
system can serve as a model for a data dedicated wireless system. It can also be used as
a model for a system with variable quality of service (QOS) where every user is
guaranteed a minimum quality of service. If there are enough channel resources
available, some users can obtain better quality of service with higher data throughputs.
Unfortunately, the difficulty of the non-convex feasible region for (4.4) also
applies to this problem. Exhaustive searches are needed to find the bit allocation for the
maximum throughput. Here, we introduce a channel resource measure and present a
centralized search algorithm that finds the bit allocation that can achieve the maximum
0.2 0.25 0.3 0.35 0.4 0.45 0.5 0.55 0.6 0.65 0.710
−4
10−3
10−2
10−1
100
System Capacity [Erlang]
Pbl
ock
Figure 4-7 Bit allocation simulations for orthogonal systems.
Dotted line -- Alg 1, min total power* -- Alg 2, min max powero -- Alg 3, min total interferencex -- Alg 4, min max interferenceSolid line -- Alg 5, minimum slots+ -- Alg 6, reverse water-pouring
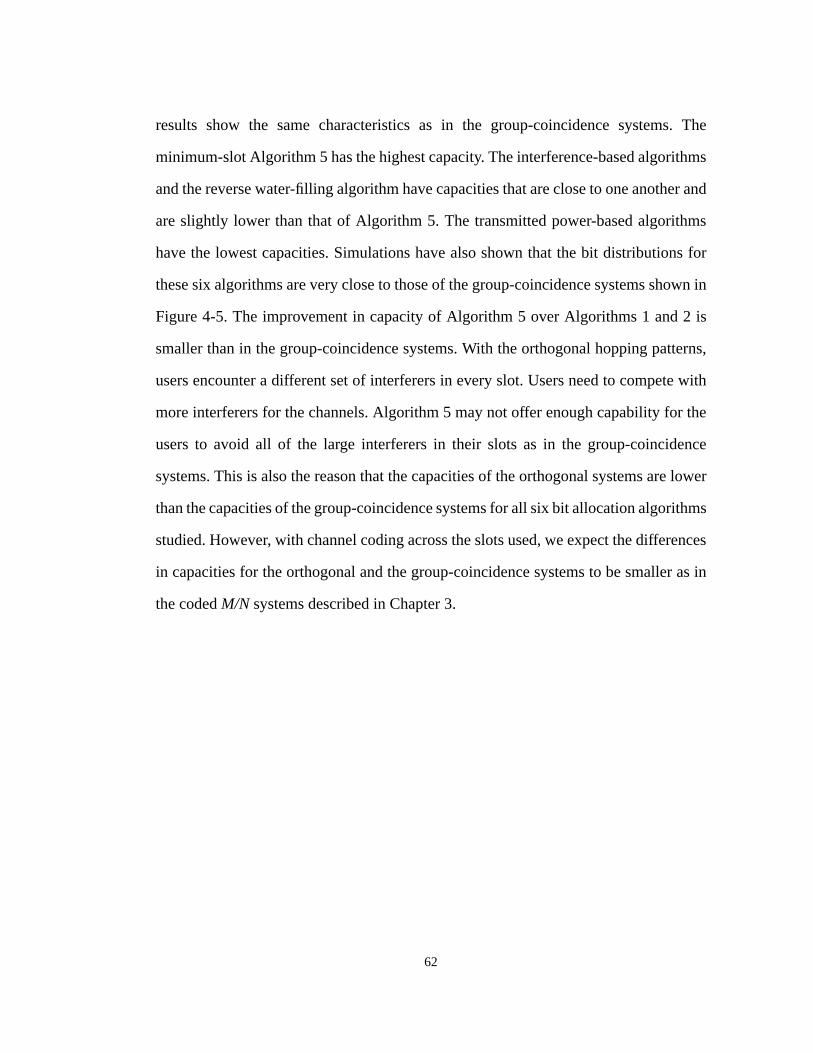
62
results show the same characteristics as in the group-coincidence systems. The
minimum-slot Algorithm 5 has the highest capacity. The interference-based algorithms
and the reverse water-filling algorithm have capacities that are close to one another and
are slightly lower than that of Algorithm 5. The transmitted power-based algorithms
have the lowest capacities. Simulations have also shown that the bit distributions for
these six algorithms are very close to those of the group-coincidence systems shown in
Figure 4-5. The improvement in capacity of Algorithm 5 over Algorithms 1 and 2 is
smaller than in the group-coincidence systems. With the orthogonal hopping patterns,
users encounter a different set of interferers in every slot. Users need to compete with
more interferers for the channels. Algorithm 5 may not offer enough capability for the
users to avoid all of the large interferers in their slots as in the group-coincidence
systems. This is also the reason that the capacities of the orthogonal systems are lower
than the capacities of the group-coincidence systems for all six bit allocation algorithms
studied. However, with channel coding across the slots used, we expect the differences
in capacities for the orthogonal and the group-coincidence systems to be smaller as in
the coded M/N systems described in Chapter 3.
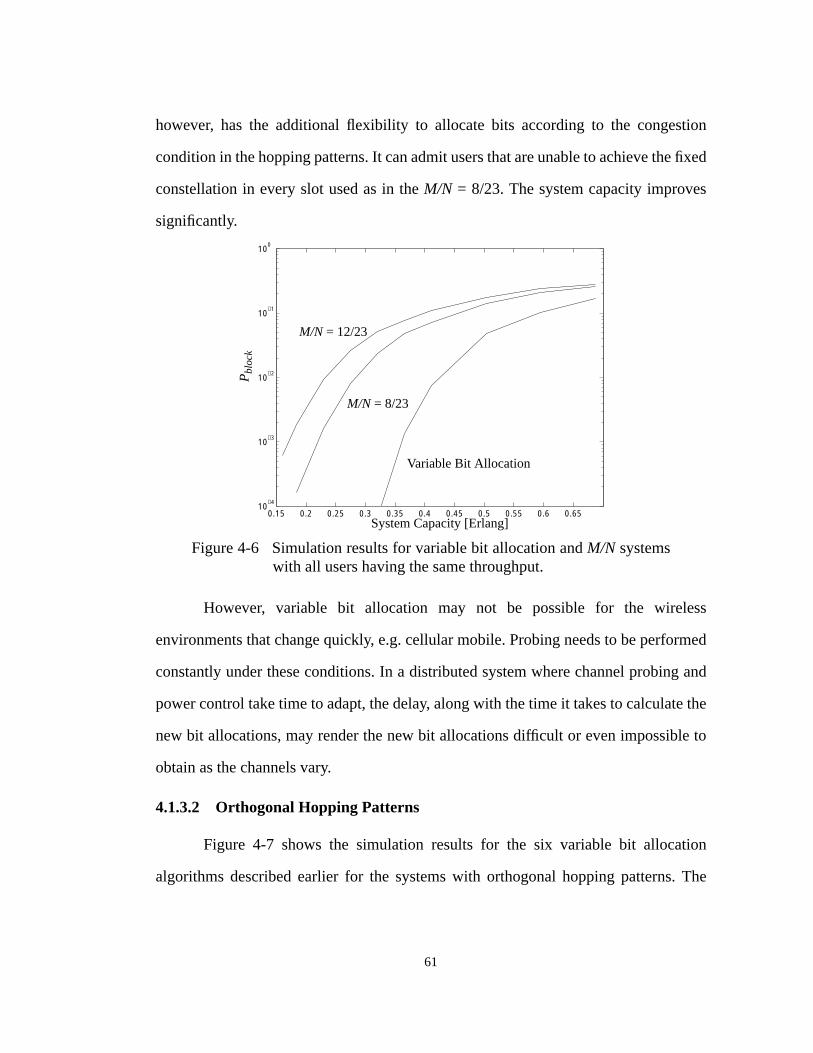
61
however, has the additional flexibility to allocate bits according to the congestion
condition in the hopping patterns. It can admit users that are unable to achieve the fixed
constellation in every slot used as in the M/N = 8/23. The system capacity improves
significantly.
However, variable bit allocation may not be possible for the wireless
environments that change quickly, e.g. cellular mobile. Probing needs to be performed
constantly under these conditions. In a distributed system where channel probing and
power control take time to adapt, the delay, along with the time it takes to calculate the
new bit allocations, may render the new bit allocations difficult or even impossible to
obtain as the channels vary.
4.1.3.2 Orthogonal Hopping Patterns
Figure 4-7 shows the simulation results for the six variable bit allocation
algorithms described earlier for the systems with orthogonal hopping patterns. The
0.15 0.2 0.25 0.3 0.35 0.4 0.45 0.5 0.55 0.6 0.6510
−4
10−3
10−2
10−1
100
System Capacity [Erlang]
Pbl
ock
Figure 4-6 Simulation results for variable bit allocation and M/N systemswith all users having the same throughput.
Variable Bit Allocation
M/N = 8/23
M/N = 12/23
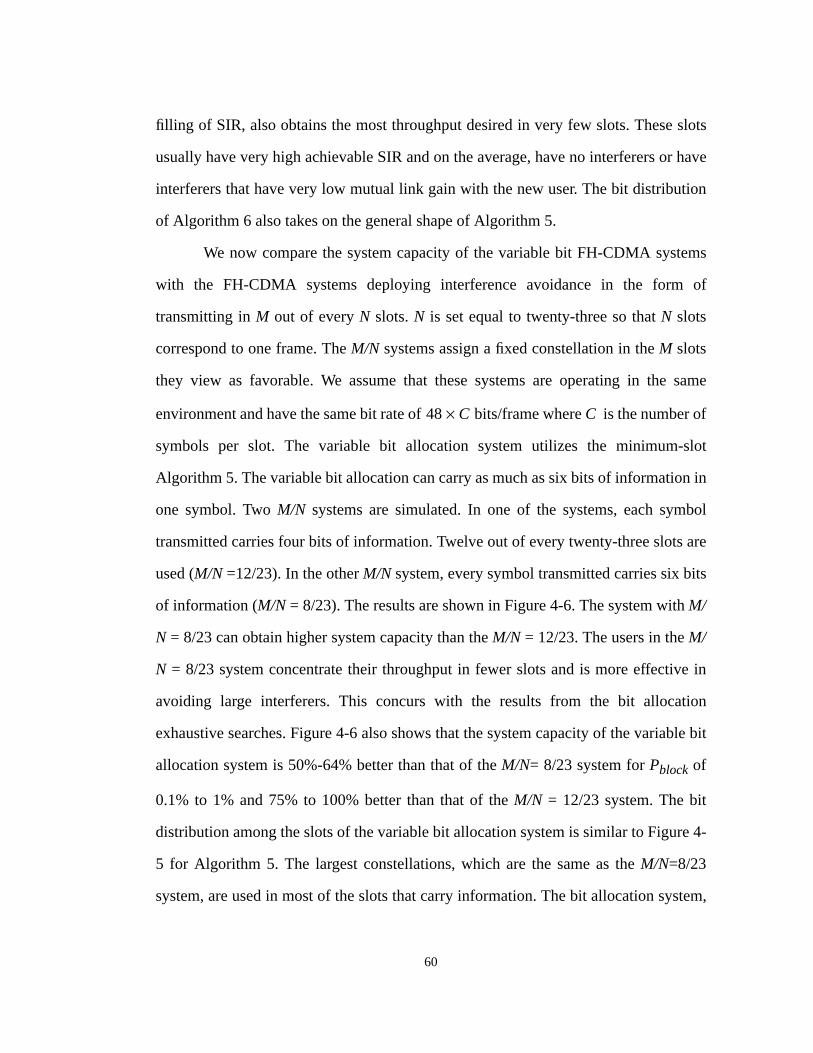
60
filling of SIR, also obtains the most throughput desired in very few slots. These slots
usually have very high achievable SIR and on the average, have no interferers or have
interferers that have very low mutual link gain with the new user. The bit distribution
of Algorithm 6 also takes on the general shape of Algorithm 5.
We now compare the system capacity of the variable bit FH-CDMA systems
with the FH-CDMA systems deploying interference avoidance in the form of
transmitting in M out of every N slots. N is set equal to twenty-three so that N slots
correspond to one frame. The M/N systems assign a fixed constellation in the M slots
they view as favorable. We assume that these systems are operating in the same
environment and have the same bit rate of bits/frame where C is the number of
symbols per slot. The variable bit allocation system utilizes the minimum-slot
Algorithm 5. The variable bit allocation can carry as much as six bits of information in
one symbol. Two M/N systems are simulated. In one of the systems, each symbol
transmitted carries four bits of information. Twelve out of every twenty-three slots are
used (M/N =12/23). In the other M/N system, every symbol transmitted carries six bits
of information (M/N = 8/23). The results are shown in Figure 4-6. The system with M/
N = 8/23 can obtain higher system capacity than the M/N = 12/23. The users in the M/
N = 8/23 system concentrate their throughput in fewer slots and is more effective in
avoiding large interferers. This concurs with the results from the bit allocation
exhaustive searches. Figure 4-6 also shows that the system capacity of the variable bit
allocation system is 50%-64% better than that of the M/N= 8/23 system for Pblock of
0.1% to 1% and 75% to 100% better than that of the M/N = 12/23 system. The bit
distribution among the slots of the variable bit allocation system is similar to Figure 4-
5 for Algorithm 5. The largest constellations, which are the same as the M/N=8/23
system, are used in most of the slots that carry information. The bit allocation system,
48 C×
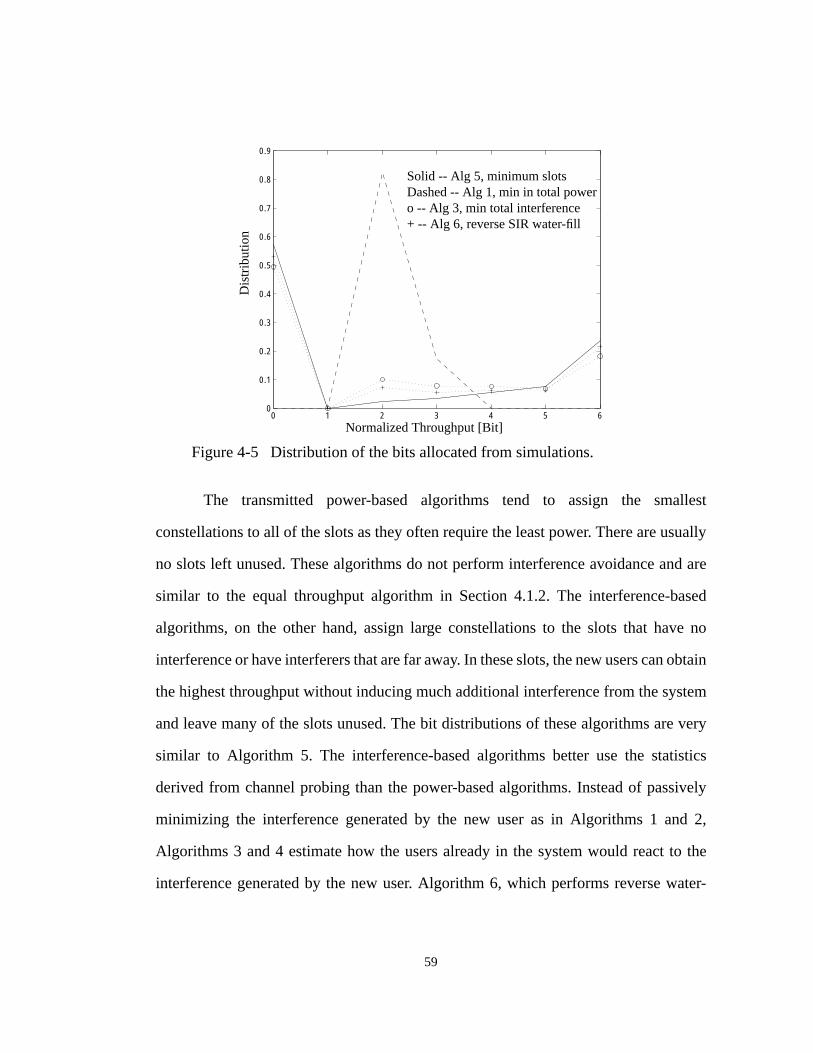
59
The transmitted power-based algorithms tend to assign the smallest
constellations to all of the slots as they often require the least power. There are usually
no slots left unused. These algorithms do not perform interference avoidance and are
similar to the equal throughput algorithm in Section 4.1.2. The interference-based
algorithms, on the other hand, assign large constellations to the slots that have no
interference or have interferers that are far away. In these slots, the new users can obtain
the highest throughput without inducing much additional interference from the system
and leave many of the slots unused. The bit distributions of these algorithms are very
similar to Algorithm 5. The interference-based algorithms better use the statistics
derived from channel probing than the power-based algorithms. Instead of passively
minimizing the interference generated by the new user as in Algorithms 1 and 2,
Algorithms 3 and 4 estimate how the users already in the system would react to the
interference generated by the new user. Algorithm 6, which performs reverse water-
0 1 2 3 4 5 60
0.1
0.2
0.3
0.4
0.5
0.6
0.7
0.8
0.9
Normalized Throughput [Bit]
Dis
trib
utio
n
Figure 4-5 Distribution of the bits allocated from simulations.
Solid -- Alg 5, minimum slotsDashed -- Alg 1, min in total powero -- Alg 3, min total interference+ -- Alg 6, reverse SIR water-fill
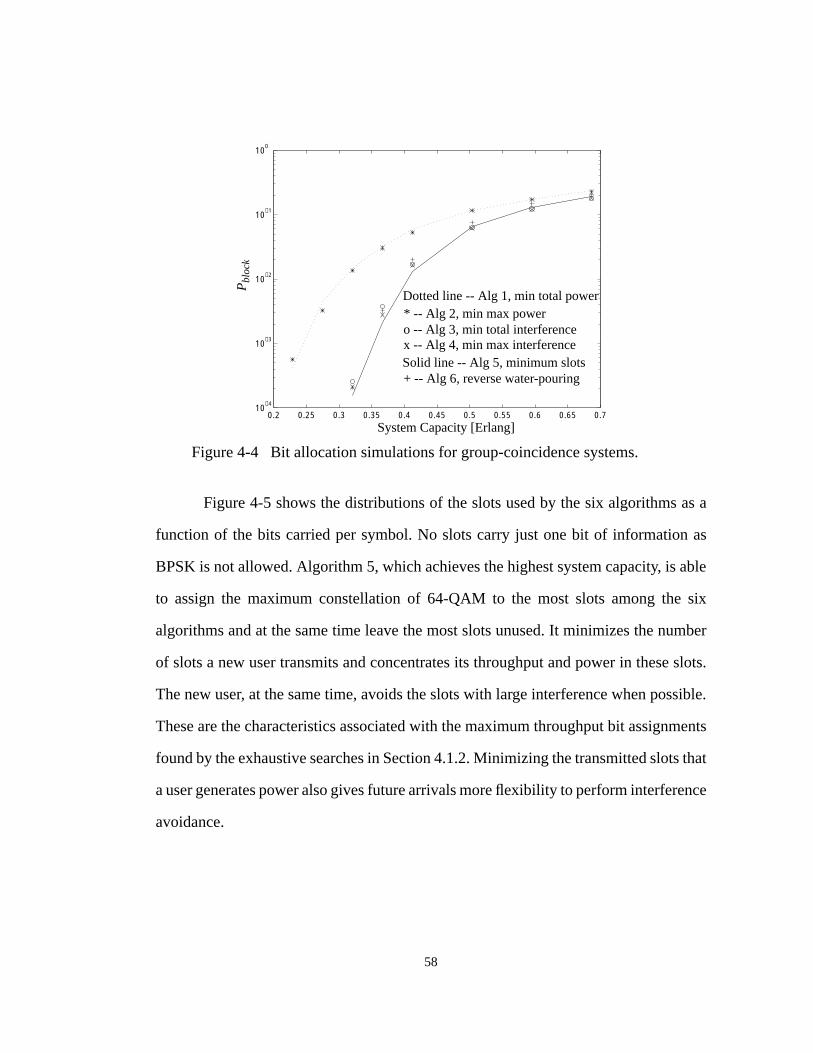
58
Figure 4-5 shows the distributions of the slots used by the six algorithms as a
function of the bits carried per symbol. No slots carry just one bit of information as
BPSK is not allowed. Algorithm 5, which achieves the highest system capacity, is able
to assign the maximum constellation of 64-QAM to the most slots among the six
algorithms and at the same time leave the most slots unused. It minimizes the number
of slots a new user transmits and concentrates its throughput and power in these slots.
The new user, at the same time, avoids the slots with large interference when possible.
These are the characteristics associated with the maximum throughput bit assignments
found by the exhaustive searches in Section 4.1.2. Minimizing the transmitted slots that
a user generates power also gives future arrivals more flexibility to perform interference
avoidance.
0.2 0.25 0.3 0.35 0.4 0.45 0.5 0.55 0.6 0.65 0.710
−4
10−3
10−2
10−1
100
Figure 4-4 Bit allocation simulations for group-coincidence systems.
System Capacity [Erlang]
Pbl
ock
Dotted line -- Alg 1, min total power* -- Alg 2, min max powero -- Alg 3, min total interferencex -- Alg 4, min max interferenceSolid line -- Alg 5, minimum slots+ -- Alg 6, reverse water-pouring
57
coincidence (GC) systems assign a new user to share every slot its hopping pattern with
one group of users. That is, the group of potential interferers is the same is every hop.
The orthogonal systems assign a new user a hopping pattern such that the user
encounters a completely different group of interferers in every hop. In both of these
types of systems, there is no intra-cell interference as the users do not share any slot in
their hopping patterns with the other users in the same cells.
4.1.3.1 Group-Coincidence Systems
Before presenting the simulation results, we define system capacity in units of
Erlangs as the average arrival rate divided by the total number of hopping patterns
available in the system which is equal to the number of base stations multiplied by the
number of hopping patterns available in each cell.
Figure 4-4 is a figure of probability of a new arrival is blocked, Pblock, as a
function of system capacity. It shows that the transmitted power-based Algorithms 1
and 2 have the lowest system capacity. Algorithm 5, which minimizes the number of
slots a new user uses, achieves the highest capacity among the six algorithms. The
interference-based Algorithms 3 and 4 and the reverse water-filling of SIR, Algorithm
6, all have similar system capacities and achieve capacity close to Algorithm 5. The
difference in system capacities for Algorithm 5 and Algorithm 1 for Pblock of 0.1% to
1% is approximately 30% to 45%.
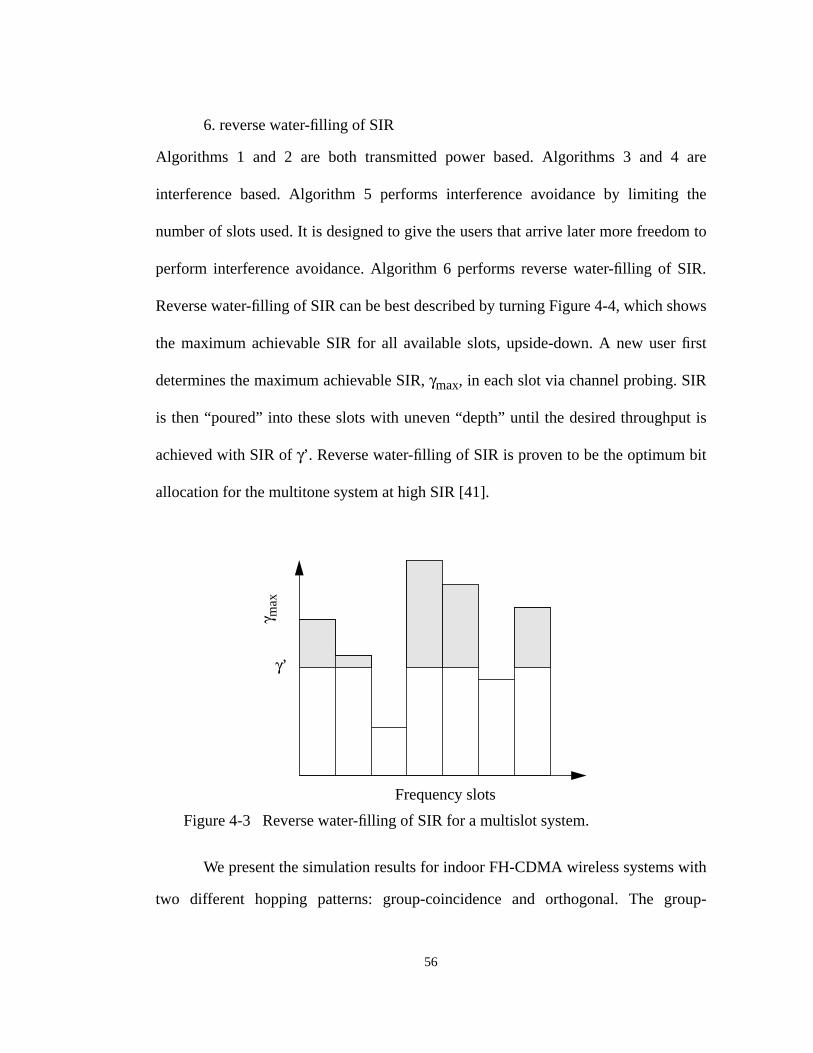
56
6. reverse water-filling of SIR
Algorithms 1 and 2 are both transmitted power based. Algorithms 3 and 4 are
interference based. Algorithm 5 performs interference avoidance by limiting the
number of slots used. It is designed to give the users that arrive later more freedom to
perform interference avoidance. Algorithm 6 performs reverse water-filling of SIR.
Reverse water-filling of SIR can be best described by turning Figure 4-4, which shows
the maximum achievable SIR for all available slots, upside-down. A new user first
determines the maximum achievable SIR, γmax, in each slot via channel probing. SIR
is then “poured” into these slots with uneven “depth” until the desired throughput is
achieved with SIR of γ’. Reverse water-filling of SIR is proven to be the optimum bit
allocation for the multitone system at high SIR [41].
We present the simulation results for indoor FH-CDMA wireless systems with
two different hopping patterns: group-coincidence and orthogonal. The group-
Figure 4-3 Reverse water-filling of SIR for a multislot system.
Frequency slots
γ’
γ max
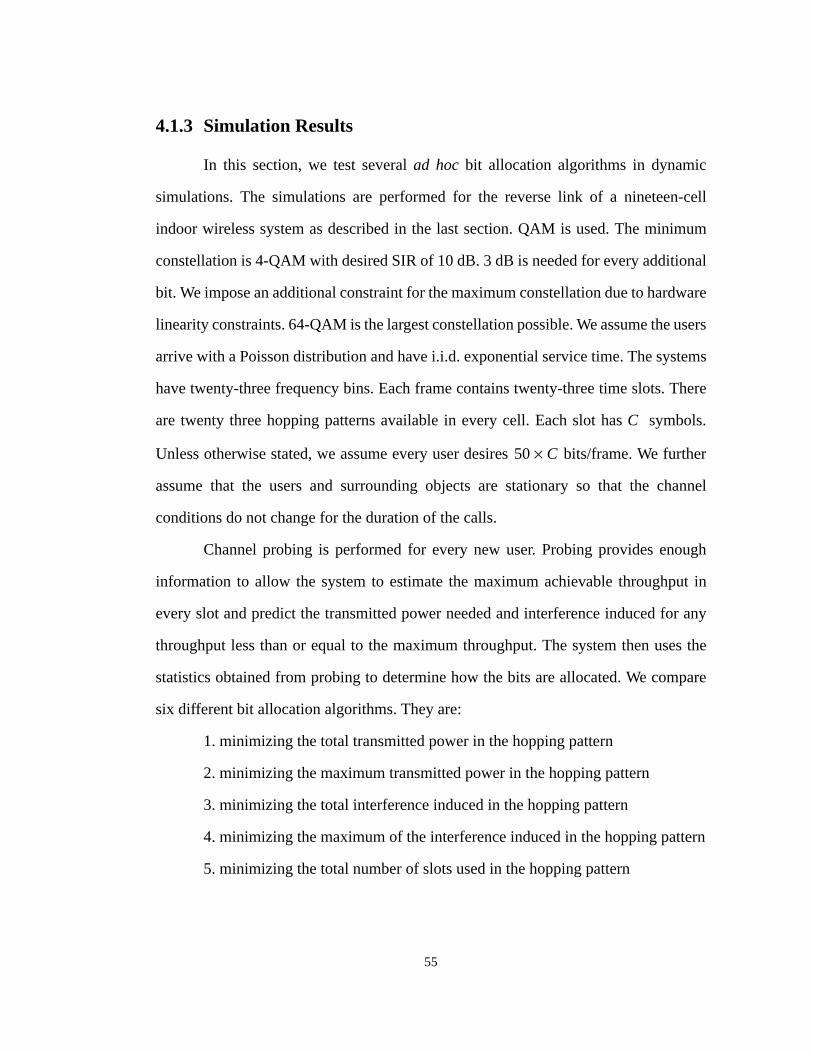
55
4.1.3 Simulation Results
In this section, we test several ad hoc bit allocation algorithms in dynamic
simulations. The simulations are performed for the reverse link of a nineteen-cell
indoor wireless system as described in the last section. QAM is used. The minimum
constellation is 4-QAM with desired SIR of 10 dB. 3 dB is needed for every additional
bit. We impose an additional constraint for the maximum constellation due to hardware
linearity constraints. 64-QAM is the largest constellation possible. We assume the users
arrive with a Poisson distribution and have i.i.d. exponential service time. The systems
have twenty-three frequency bins. Each frame contains twenty-three time slots. There
are twenty three hopping patterns available in every cell. Each slot has C symbols.
Unless otherwise stated, we assume every user desires bits/frame. We further
assume that the users and surrounding objects are stationary so that the channel
conditions do not change for the duration of the calls.
Channel probing is performed for every new user. Probing provides enough
information to allow the system to estimate the maximum achievable throughput in
every slot and predict the transmitted power needed and interference induced for any
throughput less than or equal to the maximum throughput. The system then uses the
statistics obtained from probing to determine how the bits are allocated. We compare
six different bit allocation algorithms. They are:
1. minimizing the total transmitted power in the hopping pattern
2. minimizing the maximum transmitted power in the hopping pattern
3. minimizing the total interference induced in the hopping pattern
4. minimizing the maximum of the interference induced in the hopping pattern
5. minimizing the total number of slots used in the hopping pattern
50 C×
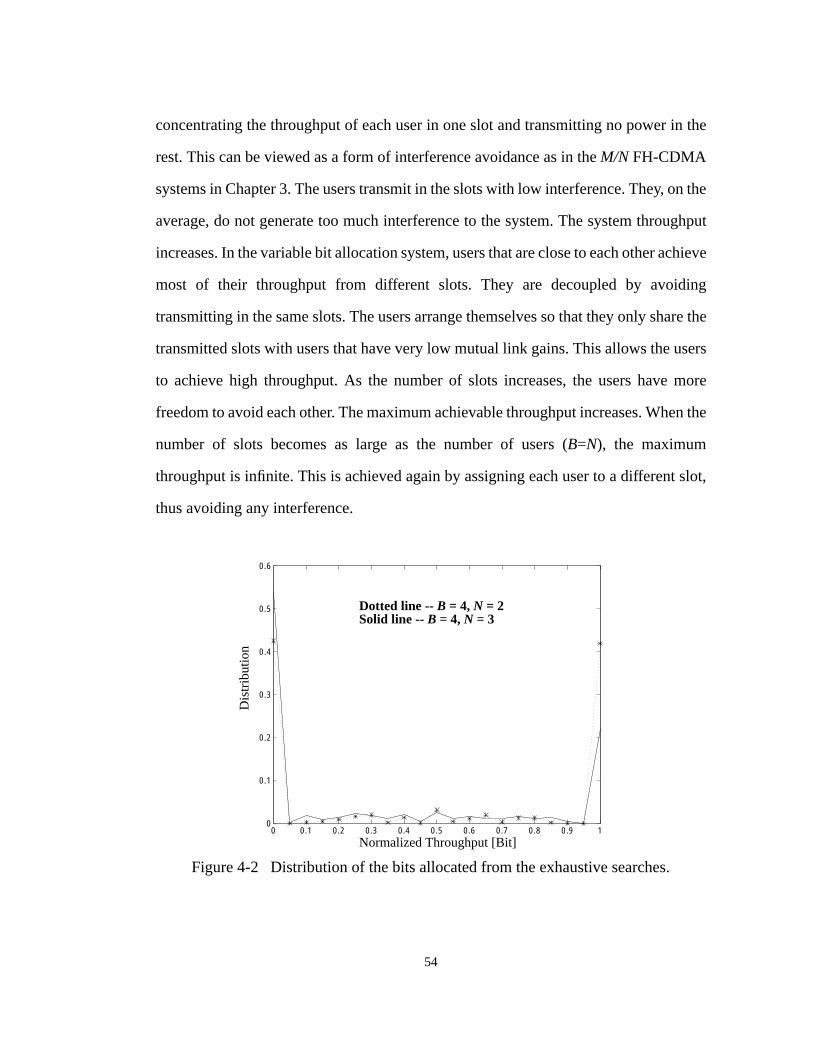
54
concentrating the throughput of each user in one slot and transmitting no power in the
rest. This can be viewed as a form of interference avoidance as in the M/N FH-CDMA
systems in Chapter 3. The users transmit in the slots with low interference. They, on the
average, do not generate too much interference to the system. The system throughput
increases. In the variable bit allocation system, users that are close to each other achieve
most of their throughput from different slots. They are decoupled by avoiding
transmitting in the same slots. The users arrange themselves so that they only share the
transmitted slots with users that have very low mutual link gains. This allows the users
to achieve high throughput. As the number of slots increases, the users have more
freedom to avoid each other. The maximum achievable throughput increases. When the
number of slots becomes as large as the number of users (B=N), the maximum
throughput is infinite. This is achieved again by assigning each user to a different slot,
thus avoiding any interference.
0 0.1 0.2 0.3 0.4 0.5 0.6 0.7 0.8 0.9 10
0.1
0.2
0.3
0.4
0.5
0.6
Normalized Throughput [Bit]
Dis
trib
utio
n
Figure 4-2 Distribution of the bits allocated from the exhaustive searches.
Dotted line -- B = 4, N = 2Solid line -- B = 4, N = 3
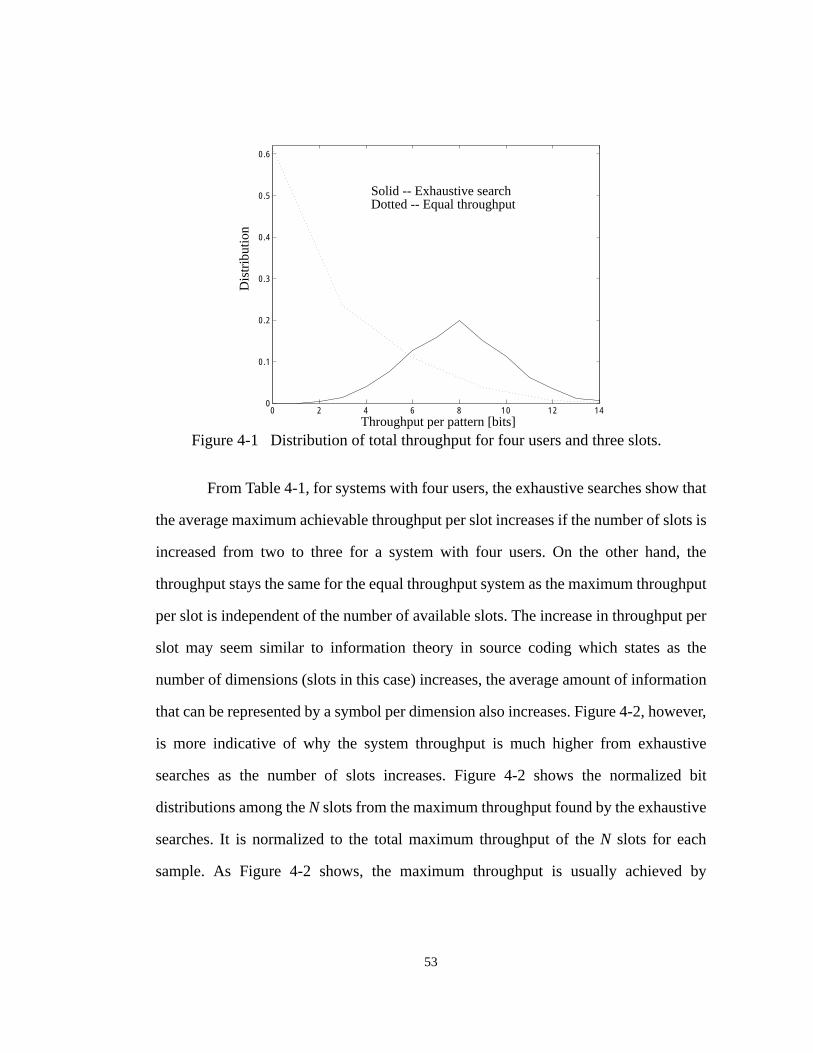
53
From Table 4-1, for systems with four users, the exhaustive searches show that
the average maximum achievable throughput per slot increases if the number of slots is
increased from two to three for a system with four users. On the other hand, the
throughput stays the same for the equal throughput system as the maximum throughput
per slot is independent of the number of available slots. The increase in throughput per
slot may seem similar to information theory in source coding which states as the
number of dimensions (slots in this case) increases, the average amount of information
that can be represented by a symbol per dimension also increases. Figure 4-2, however,
is more indicative of why the system throughput is much higher from exhaustive
searches as the number of slots increases. Figure 4-2 shows the normalized bit
distributions among the N slots from the maximum throughput found by the exhaustive
searches. It is normalized to the total maximum throughput of the N slots for each
sample. As Figure 4-2 shows, the maximum throughput is usually achieved by
0 2 4 6 8 10 12 140
0.1
0.2
0.3
0.4
0.5
0.6
Throughput per pattern [bits]
Dis
trib
utio
n
Figure 4-1 Distribution of total throughput for four users and three slots.
Solid -- Exhaustive searchDotted -- Equal throughput
52
Table 4-1 shows that the equal throughput algorithm does not find the best
allocation possible. As the number of the users increases, the difference in throughputs
between the equal throughput algorithm and the exhaustive searches increases. Figure
4-1 show the distribution maximum achievable bits for a system with four users and
three slots. The equal throughput algorithm is not able to allocate throughput to the
users if the users are close to each other in a large fraction of the simulations. The
distribution decreases rapidly as the maximum achievable throughput increases. The
distribution from the results of exhaustive searches tends to concentrate around the
average maximum throughput and tapers off as the number of bits increases and
decreases at about the same rate. These characteristics are also observed for the systems
with different number of users and slots tabulated in Table 4-1.
B = 4, N=2 0.5833 2.0722 255.3
B = 5, N=2 0.1915 1.4556 660.1
B = 4, N=3 0.5895 2.6314 346.4
Table 4-1: Results of exhaustive searches for the maximum average bit allocation perslot.
Equal Throughput
[bits]
Exhaustive Searches
[bits]
Difference
[%]
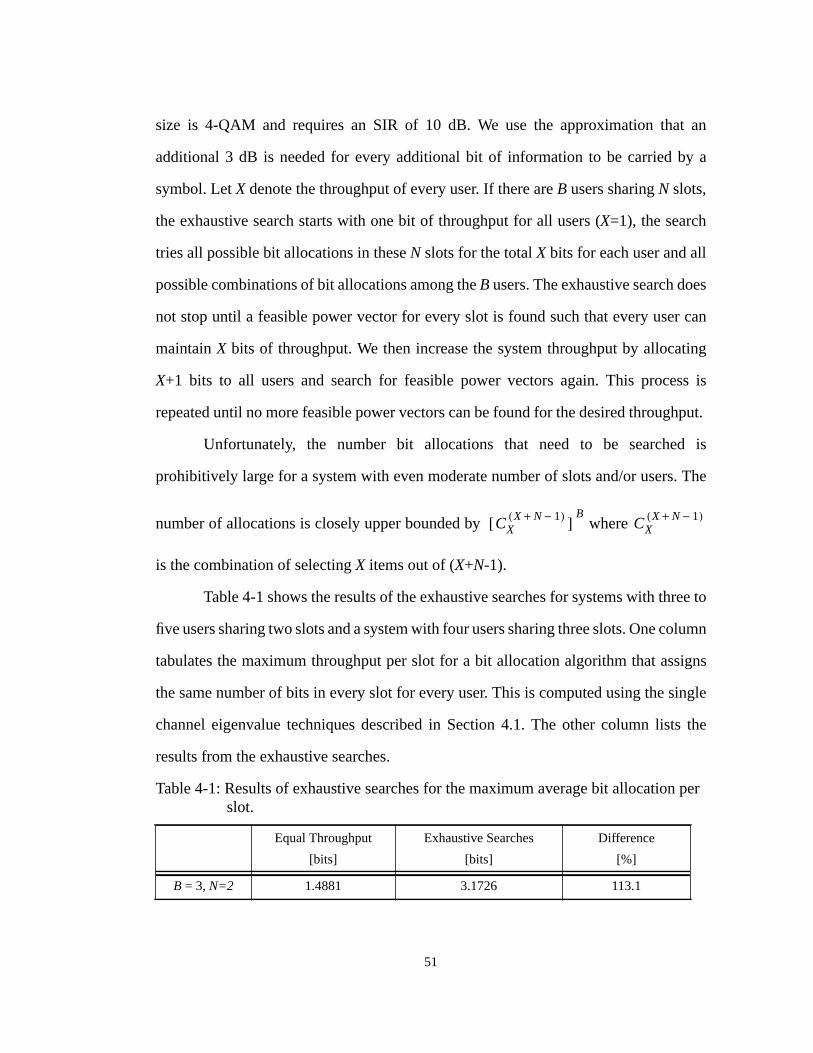
51
size is 4-QAM and requires an SIR of 10 dB. We use the approximation that an
additional 3 dB is needed for every additional bit of information to be carried by a
symbol. Let X denote the throughput of every user. If there are B users sharing N slots,
the exhaustive search starts with one bit of throughput for all users (X=1), the search
tries all possible bit allocations in these N slots for the total X bits for each user and all
possible combinations of bit allocations among the B users. The exhaustive search does
not stop until a feasible power vector for every slot is found such that every user can
maintain X bits of throughput. We then increase the system throughput by allocating
X+1 bits to all users and search for feasible power vectors again. This process is
repeated until no more feasible power vectors can be found for the desired throughput.
Unfortunately, the number bit allocations that need to be searched is
prohibitively large for a system with even moderate number of slots and/or users. The
number of allocations is closely upper bounded by where
is the combination of selecting X items out of (X+N-1).
Table 4-1 shows the results of the exhaustive searches for systems with three to
five users sharing two slots and a system with four users sharing three slots. One column
tabulates the maximum throughput per slot for a bit allocation algorithm that assigns
the same number of bits in every slot for every user. This is computed using the single
channel eigenvalue techniques described in Section 4.1. The other column lists the
results from the exhaustive searches.
Table 4-1: Results of exhaustive searches for the maximum average bit allocation perslot.
Equal Throughput
[bits]
Exhaustive Searches
[bits]
Difference
[%]
B = 3, N=2 1.4881 3.1726 113.1
CXX N 1−+( )[ ]
BCX
X N 1−+( )
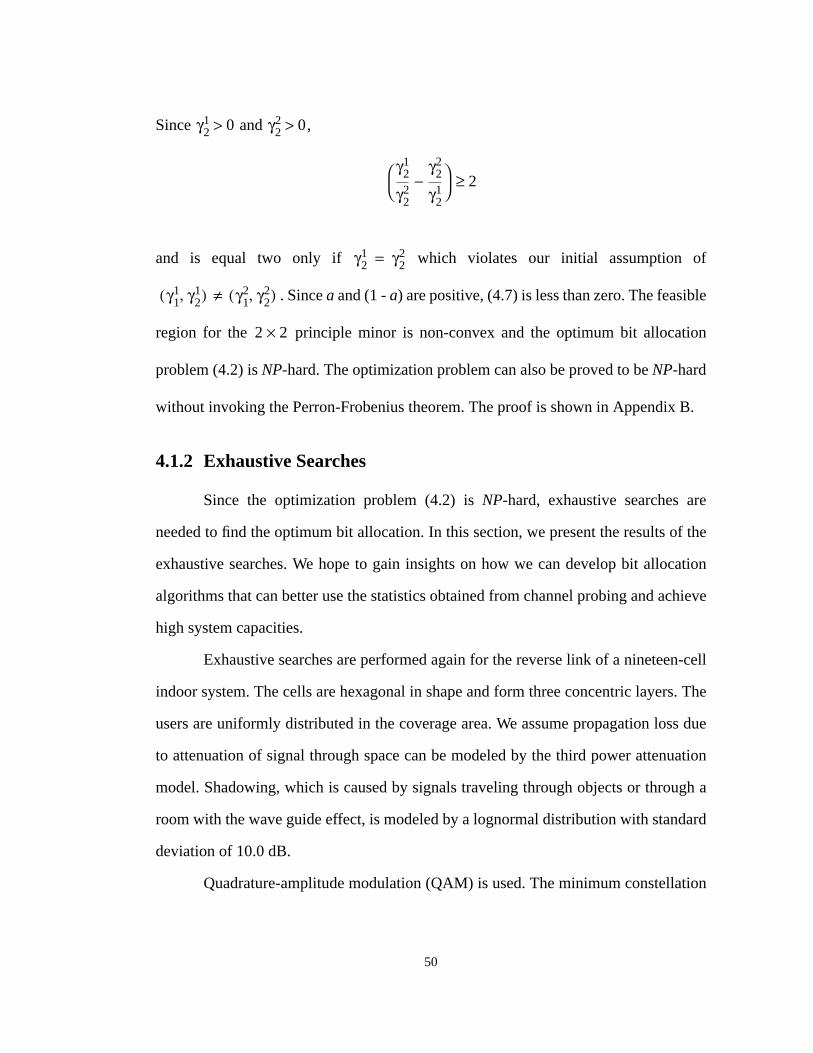
50
Since and ,
and is equal two only if which violates our initial assumption of
. Since a and (1 - a) are positive, (4.7) is less than zero. The feasible
region for the principle minor is non-convex and the optimum bit allocation
problem (4.2) is NP-hard. The optimization problem can also be proved to be NP-hard
without invoking the Perron-Frobenius theorem. The proof is shown in Appendix B.
4.1.2 Exhaustive Searches
Since the optimization problem (4.2) is NP-hard, exhaustive searches are
needed to find the optimum bit allocation. In this section, we present the results of the
exhaustive searches. We hope to gain insights on how we can develop bit allocation
algorithms that can better use the statistics obtained from channel probing and achieve
high system capacities.
Exhaustive searches are performed again for the reverse link of a nineteen-cell
indoor system. The cells are hexagonal in shape and form three concentric layers. The
users are uniformly distributed in the coverage area. We assume propagation loss due
to attenuation of signal through space can be modeled by the third power attenuation
model. Shadowing, which is caused by signals traveling through objects or through a
room with the wave guide effect, is modeled by a lognormal distribution with standard
deviation of 10.0 dB.
Quadrature-amplitude modulation (QAM) is used. The minimum constellation
γ21 0> γ2
2 0>
γ21
γ22
γ22
γ21
− 2≥
γ21 γ2
2=
γ11 γ2
1,( ) γ12 γ2
2,( )≠
2 2×
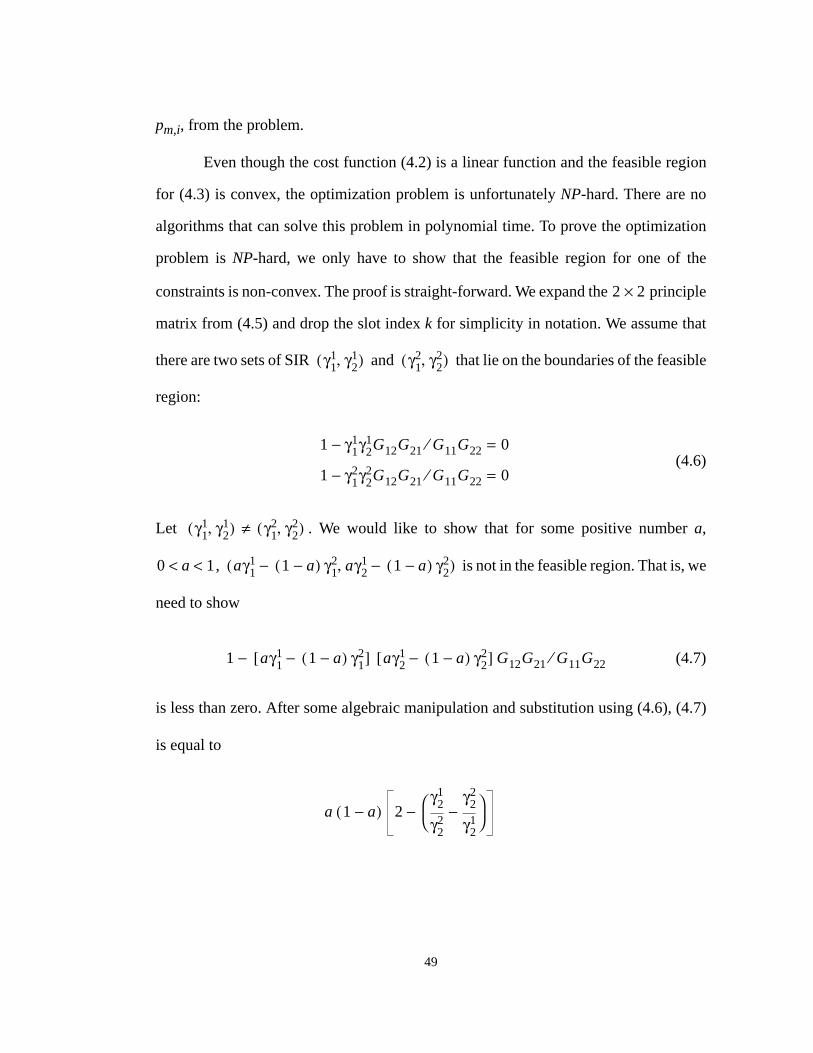
49
pm,i, from the problem.
Even though the cost function (4.2) is a linear function and the feasible region
for (4.3) is convex, the optimization problem is unfortunately NP-hard. There are no
algorithms that can solve this problem in polynomial time. To prove the optimization
problem is NP-hard, we only have to show that the feasible region for one of the
constraints is non-convex. The proof is straight-forward. We expand the principle
matrix from (4.5) and drop the slot index k for simplicity in notation. We assume that
there are two sets of SIR and that lie on the boundaries of the feasible
region:
(4.6)
Let . We would like to show that for some positive number a,
, is not in the feasible region. That is, we
need to show
(4.7)
is less than zero. After some algebraic manipulation and substitution using (4.6), (4.7)
is equal to
2 2×
γ11 γ2
1,( ) γ12 γ2
2,( )
1 γ11γ2
1G12G21 G11G22⁄− 0=
1 γ12γ2
2G12G21 G11G22⁄− 0=
γ11 γ2
1,( ) γ12 γ2
2,( )≠
0 a 1< < aγ11 1 a−( ) γ1
2− aγ21 1 a−( ) γ2
2−,( )
1 aγ11 1 a−( ) γ1
2−[ ] aγ21 1 a−( ) γ2
2−[ ] G12G21 G11G22⁄−
a 1 a−( ) 2γ2
1
γ22
γ22
γ21
− −
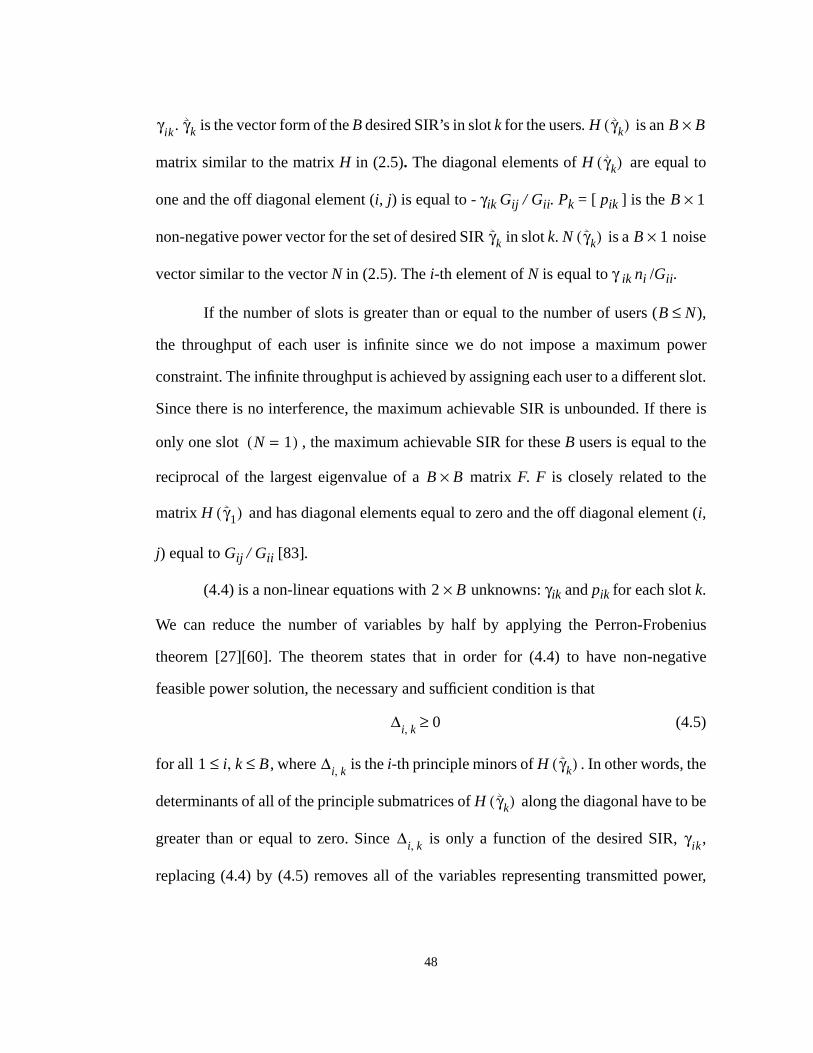
48
. is the vector form of the B desired SIR’s in slot k for the users. is an
matrix similar to the matrix H in (2.5). The diagonal elements of are equal to
one and the off diagonal element (i, j) is equal to - γik Gij / Gii. Pk = [ pik ] is the
non-negative power vector for the set of desired SIR in slot k. is a noise
vector similar to the vector N in (2.5). The i-th element of N is equal to γ ik ni /Gii.
If the number of slots is greater than or equal to the number of users ( ),
the throughput of each user is infinite since we do not impose a maximum power
constraint. The infinite throughput is achieved by assigning each user to a different slot.
Since there is no interference, the maximum achievable SIR is unbounded. If there is
only one slot , the maximum achievable SIR for these B users is equal to the
reciprocal of the largest eigenvalue of a matrix F. F is closely related to the
matrix and has diagonal elements equal to zero and the off diagonal element (i,
j) equal to Gij / Gii [83].
(4.4) is a non-linear equations with unknowns: γik and pik for each slot k.
We can reduce the number of variables by half by applying the Perron-Frobenius
theorem [27][60]. The theorem states that in order for (4.4) to have non-negative
feasible power solution, the necessary and sufficient condition is that
(4.5)
for all , where is the i-th principle minors of . In other words, the
determinants of all of the principle submatrices of along the diagonal have to be
greater than or equal to zero. Since is only a function of the desired SIR, ,
replacing (4.4) by (4.5) removes all of the variables representing transmitted power,
γik γk H γk( ) B B×
H γk( )
B 1×
γk N γk( ) B 1×
B N≤
N 1=( )
B B×
H γ1( )
2 B×
∆i k, 0≥
1 i k, B≤ ≤ ∆i k, H γk( )
H γk( )
∆i k, γik
47
transmit to the users and for a peer-to-peer system where no base station infrastructure
is available. We assume that there are B users and N frequency slots in the wireless
system. In each of the N slots, the desired SIR of user i in slot k, , has to satisfy the
following inequality,
(4.1)
where Pjk is the transmitted power of user j in the k-th frequency slot, is equal to the
noise floor at base station i, and is the link gain from user j to the base station in cell
i. We assume and are independent of the frequency slots used and drop the
superscript k. There are B such inequalities for each of the N slots.
The optimization can be stated in the following compact matrix form:
(4.2)
(4.3)
(4.4)
We try to maximize the total throughput of the system. Xi is the throughput of the i-th
user. The logarithm function with base two is used to upper bound the achievable bit
rate for the desired SIR of [17]. is a vector with the i-th element equals to
γik
PikGiik
PjkGijk
j i≠∑ nik+
γik≥
nik
Gijk
Gijk ni
k
max Xii 1=
B
∑
Xi log 2 1 γik+( )k 1=
B
∑≤
Xi Xj= 1 i j B≤,≤
H γk( ) Pk N γk( )≥
Pk 0 γk 0 1 k N≤ ≤≥≥
γik γk B 1×
46
4.1 Equal Throughput FH-CDMA Systems
At first glance, the FH-CDMA wireless system with variable bit allocation is
similar to the multitone wireline communication system [9][38]. In both of these
systems, the users first probe the channels that are available to them to obtain enough
statistics. They then estimate the maximum achievable signal to interference ratio (SIR)
and the transmitted power needed [37][80]. Using these estimates, the users allocate
bits and power in the slots that have favorable channel conditions. In the multitone
wireline communication system, however, the system has an average power constraint.
That is, there is a limitation on the total transmitted power permitted for each user. In
an FH-CDMA wireless system, there is usually no such limitation, although low
transmitted power is desirable as it generally leads to low interference. A maximum
transmitted power for every slot due to hardware limitations is more often the case.
In Section 4.1.1, we first state the basic idea of the variable bit allocation
problem for a wireless system that requires all users have the same throughput. We
would like to determine the maximum achievable bit rate for a given set of users which
share the same slots. We then show the difficulties in solving this optimization problem.
In Section 4.1.2, we present the results of the exhaustive searches. In Section 4.1.3, we
discuss the results of simulations for several bit allocation algorithms and comment on
their performance.
4.1.1 Basic Idea
We would like to find the maximum throughput that a set of users can all achieve
in the slots they share. In this section, we state this optimization problem for the reverse
link in a cellular system where users transmit information to the base stations. The
problem can be formulated in a similar fashion for the forward link where base stations
45
Chapter 4
BIT ALLOCATION ALGORITHMS
In an indoor wireless FH-CDMA system, the channels vary slowly as users and
interferers move at slow speeds. The system can take advantage of the different
interference statistics in a hopping pattern and assign different throughputs to the slots
to minimize the interference the user causes. Since FH-CDMA systems are interference
limited, reduction in interference can lead directly to higher system capacity.
In Section 4.1, we study the problem of bit allocation in a system where every
user desires the same throughput in an FH-CDMA indoor wireless system. Our goal is
to design bit allocation algorithms that can achieve high capacity by permitting more
users to communicate in the system. In Section 4.2, we briefly describe the problem of
a wireless system with a single channel and variable bit allocation. In this system, we
attempt to maximize the throughput of the channel given a set of users, each of whom
has a minimum throughput requirement. A centralized bit allocation scheme is
presented. We then offer some concluding remarks and suggestions for future research
in Section 4.3.
85
in every slot into the system by averaging out the differences in SIR levels. Simulations
show that with a simple 32-state convolutional code, an M/N outdoor system can
achieve higher capacity than a IS-54 cellular system. For the indoor systems, we have
proposed a simple multilevel pragmatic TCM code that can offer sufficient coding gain
for different constellation sizes with a simple decoder. This TCM code is suitable for a
variable bit allocation system where all bits are equally important.
We have also looked into the effects of the maximum and minimum transmitted
power constraints on the system capacity. Simulations show that in an interference-
limited system, the effects of limited dynamic power range is small if the users can
perform interference avoidance and if the desired SIR is large. The large desired SIR
indirectly promotes interference avoidance since users that are close to one another are
not able to obtain the high SIR in the same slots. The system capacity depends more on
the ability of the users to dynamically arrange their transmitted slots to avoid sharing
channels with users nearby. Our simulations, however, do not take into account of the
additional power range needed for various adaptive algorithms. Full distributed
simulations which are a lot more computationally intensive are required.
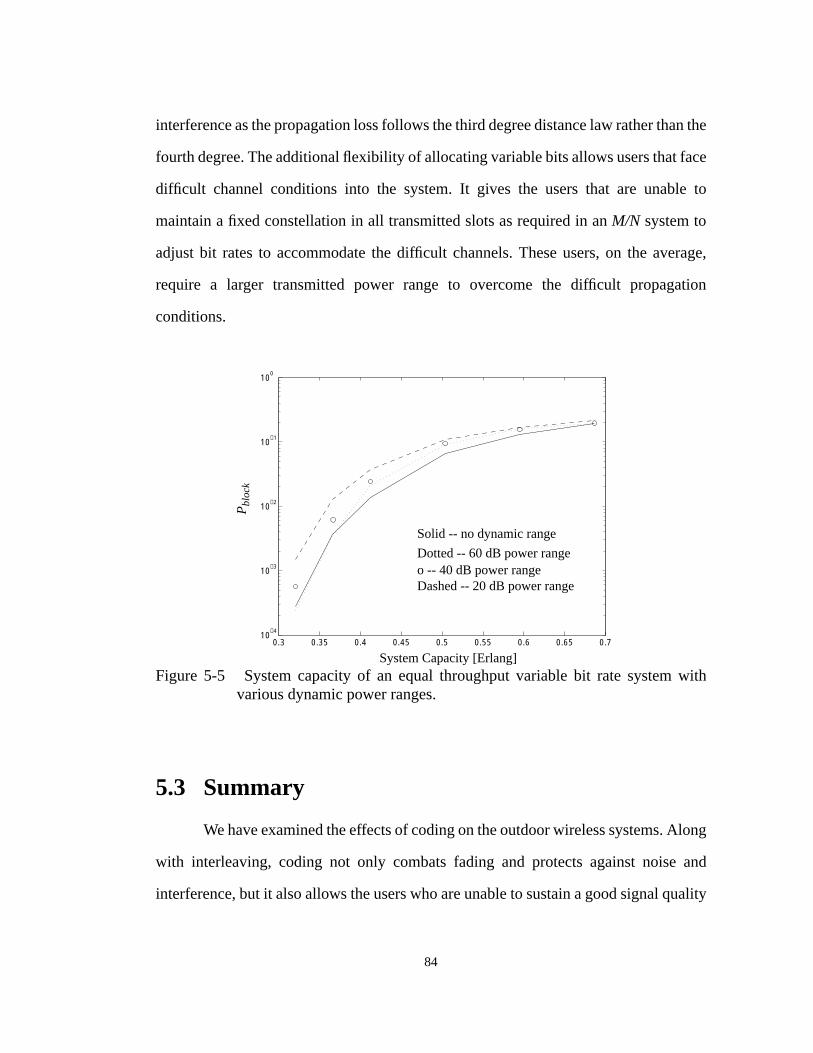
84
interference as the propagation loss follows the third degree distance law rather than the
fourth degree. The additional flexibility of allocating variable bits allows users that face
difficult channel conditions into the system. It gives the users that are unable to
maintain a fixed constellation in all transmitted slots as required in an M/N system to
adjust bit rates to accommodate the difficult channels. These users, on the average,
require a larger transmitted power range to overcome the difficult propagation
conditions.
5.3 Summary
We have examined the effects of coding on the outdoor wireless systems. Along
with interleaving, coding not only combats fading and protects against noise and
interference, but it also allows the users who are unable to sustain a good signal quality
0.3 0.35 0.4 0.45 0.5 0.55 0.6 0.65 0.710
−4
10−3
10−2
10−1
100
Figure 5-5 System capacity of an equal throughput variable bit rate system withvarious dynamic power ranges.
System Capacity [Erlang]
Pbl
ock
Solid -- no dynamic range
Dotted -- 60 dB power rangeo -- 40 dB power rangeDashed -- 20 dB power range
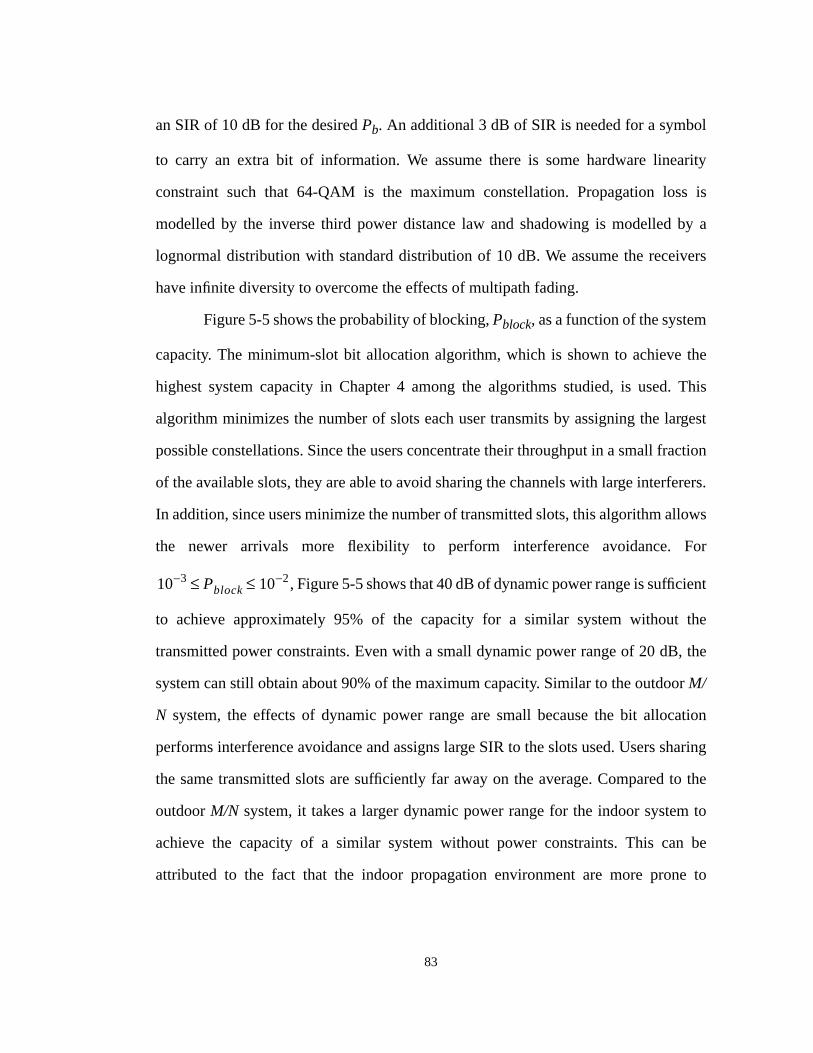
83
an SIR of 10 dB for the desired Pb. An additional 3 dB of SIR is needed for a symbol
to carry an extra bit of information. We assume there is some hardware linearity
constraint such that 64-QAM is the maximum constellation. Propagation loss is
modelled by the inverse third power distance law and shadowing is modelled by a
lognormal distribution with standard distribution of 10 dB. We assume the receivers
have infinite diversity to overcome the effects of multipath fading.
Figure 5-5 shows the probability of blocking, Pblock, as a function of the system
capacity. The minimum-slot bit allocation algorithm, which is shown to achieve the
highest system capacity in Chapter 4 among the algorithms studied, is used. This
algorithm minimizes the number of slots each user transmits by assigning the largest
possible constellations. Since the users concentrate their throughput in a small fraction
of the available slots, they are able to avoid sharing the channels with large interferers.
In addition, since users minimize the number of transmitted slots, this algorithm allows
the newer arrivals more flexibility to perform interference avoidance. For
, Figure 5-5 shows that 40 dB of dynamic power range is sufficient
to achieve approximately 95% of the capacity for a similar system without the
transmitted power constraints. Even with a small dynamic power range of 20 dB, the
system can still obtain about 90% of the maximum capacity. Similar to the outdoor M/
N system, the effects of dynamic power range are small because the bit allocation
performs interference avoidance and assigns large SIR to the slots used. Users sharing
the same transmitted slots are sufficiently far away on the average. Compared to the
outdoor M/N system, it takes a larger dynamic power range for the indoor system to
achieve the capacity of a similar system without power constraints. This can be
attributed to the fact that the indoor propagation environment are more prone to
10 3− Pblock 10 2−≤ ≤
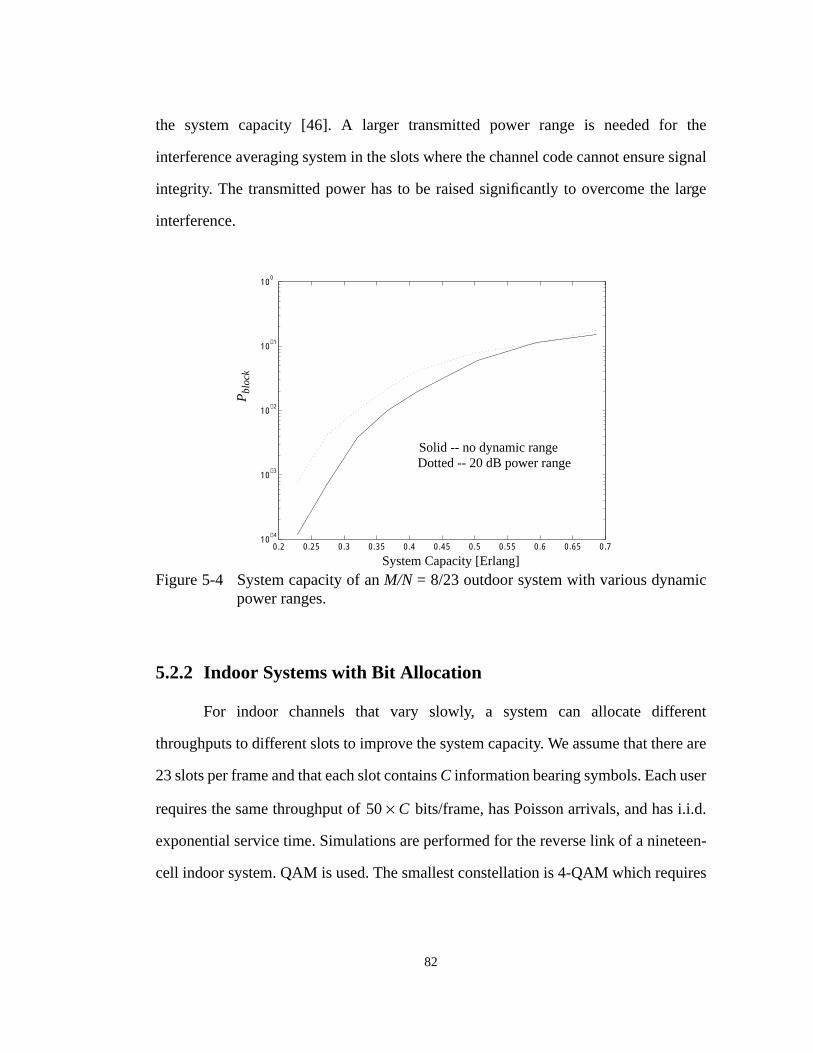
82
the system capacity [46]. A larger transmitted power range is needed for the
interference averaging system in the slots where the channel code cannot ensure signal
integrity. The transmitted power has to be raised significantly to overcome the large
interference.
5.2.2 Indoor Systems with Bit Allocation
For indoor channels that vary slowly, a system can allocate different
throughputs to different slots to improve the system capacity. We assume that there are
23 slots per frame and that each slot contains C information bearing symbols. Each user
requires the same throughput of bits/frame, has Poisson arrivals, and has i.i.d.
exponential service time. Simulations are performed for the reverse link of a nineteen-
cell indoor system. QAM is used. The smallest constellation is 4-QAM which requires
0.2 0.25 0.3 0.35 0.4 0.45 0.5 0.55 0.6 0.65 0.710
−4
10−3
10−2
10−1
100
Pbl
ock
Figure 5-4 System capacity of an M/N = 8/23 outdoor system with various dynamicpower ranges.
System Capacity [Erlang]
Solid -- no dynamic rangeDotted -- 20 dB power range
50 C×
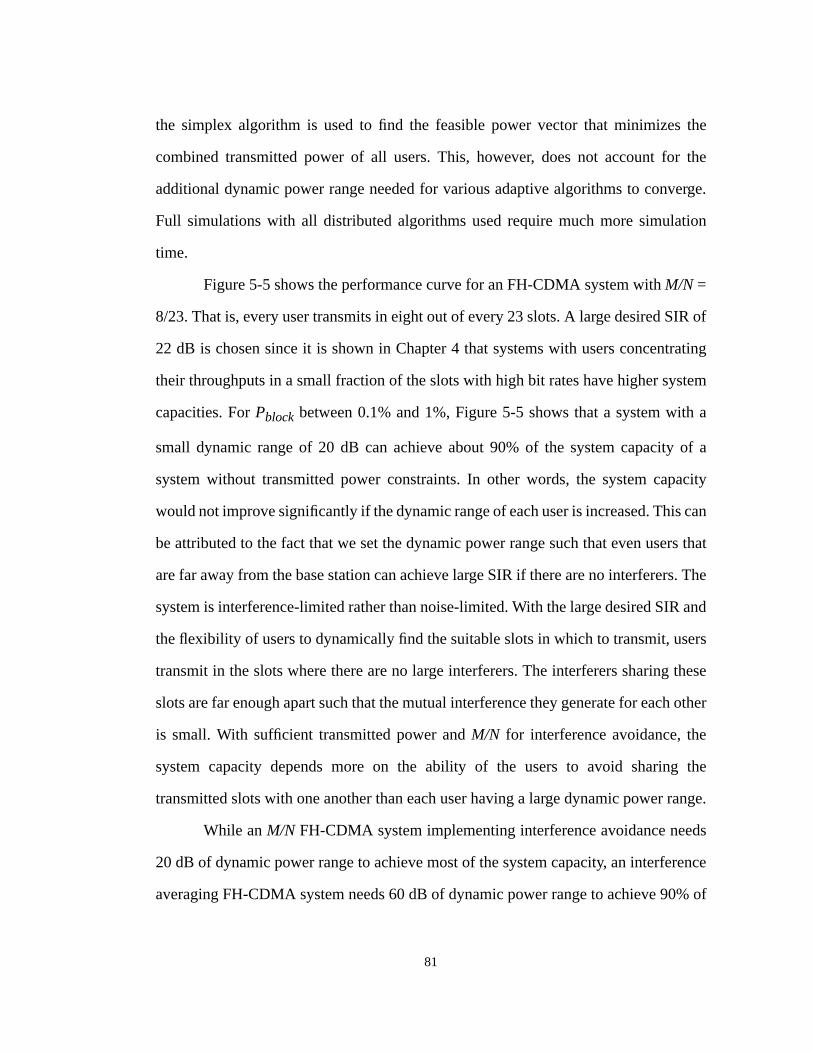
81
the simplex algorithm is used to find the feasible power vector that minimizes the
combined transmitted power of all users. This, however, does not account for the
additional dynamic power range needed for various adaptive algorithms to converge.
Full simulations with all distributed algorithms used require much more simulation
time.
Figure 5-5 shows the performance curve for an FH-CDMA system with M/N =
8/23. That is, every user transmits in eight out of every 23 slots. A large desired SIR of
22 dB is chosen since it is shown in Chapter 4 that systems with users concentrating
their throughputs in a small fraction of the slots with high bit rates have higher system
capacities. For Pblock between 0.1% and 1%, Figure 5-5 shows that a system with a
small dynamic range of 20 dB can achieve about 90% of the system capacity of a
system without transmitted power constraints. In other words, the system capacity
would not improve significantly if the dynamic range of each user is increased. This can
be attributed to the fact that we set the dynamic power range such that even users that
are far away from the base station can achieve large SIR if there are no interferers. The
system is interference-limited rather than noise-limited. With the large desired SIR and
the flexibility of users to dynamically find the suitable slots in which to transmit, users
transmit in the slots where there are no large interferers. The interferers sharing these
slots are far enough apart such that the mutual interference they generate for each other
is small. With sufficient transmitted power and M/N for interference avoidance, the
system capacity depends more on the ability of the users to avoid sharing the
transmitted slots with one another than each user having a large dynamic power range.
While an M/N FH-CDMA system implementing interference avoidance needs
20 dB of dynamic power range to achieve most of the system capacity, an interference
averaging FH-CDMA system needs 60 dB of dynamic power range to achieve 90% of
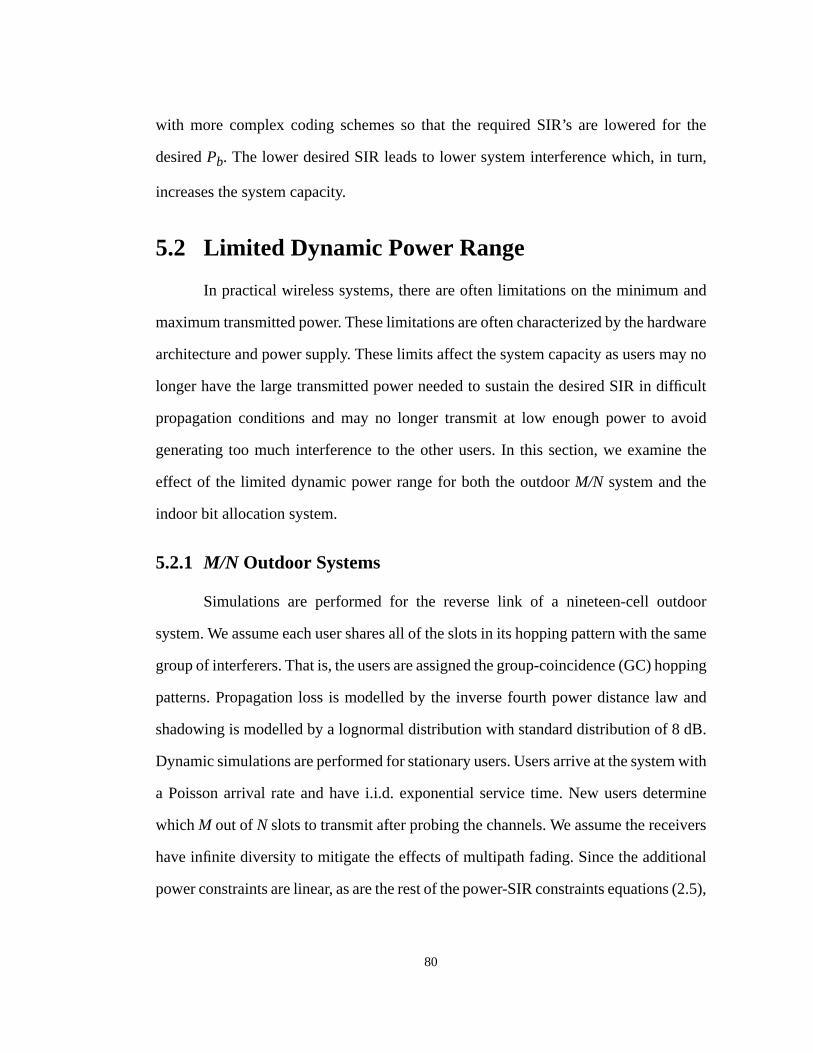
80
with more complex coding schemes so that the required SIR’s are lowered for the
desired Pb. The lower desired SIR leads to lower system interference which, in turn,
increases the system capacity.
5.2 Limited Dynamic Power Range
In practical wireless systems, there are often limitations on the minimum and
maximum transmitted power. These limitations are often characterized by the hardware
architecture and power supply. These limits affect the system capacity as users may no
longer have the large transmitted power needed to sustain the desired SIR in difficult
propagation conditions and may no longer transmit at low enough power to avoid
generating too much interference to the other users. In this section, we examine the
effect of the limited dynamic power range for both the outdoor M/N system and the
indoor bit allocation system.
5.2.1 M/N Outdoor Systems
Simulations are performed for the reverse link of a nineteen-cell outdoor
system. We assume each user shares all of the slots in its hopping pattern with the same
group of interferers. That is, the users are assigned the group-coincidence (GC) hopping
patterns. Propagation loss is modelled by the inverse fourth power distance law and
shadowing is modelled by a lognormal distribution with standard distribution of 8 dB.
Dynamic simulations are performed for stationary users. Users arrive at the system with
a Poisson arrival rate and have i.i.d. exponential service time. New users determine
which M out of N slots to transmit after probing the channels. We assume the receivers
have infinite diversity to mitigate the effects of multipath fading. Since the additional
power constraints are linear, as are the rest of the power-SIR constraints equations (2.5),
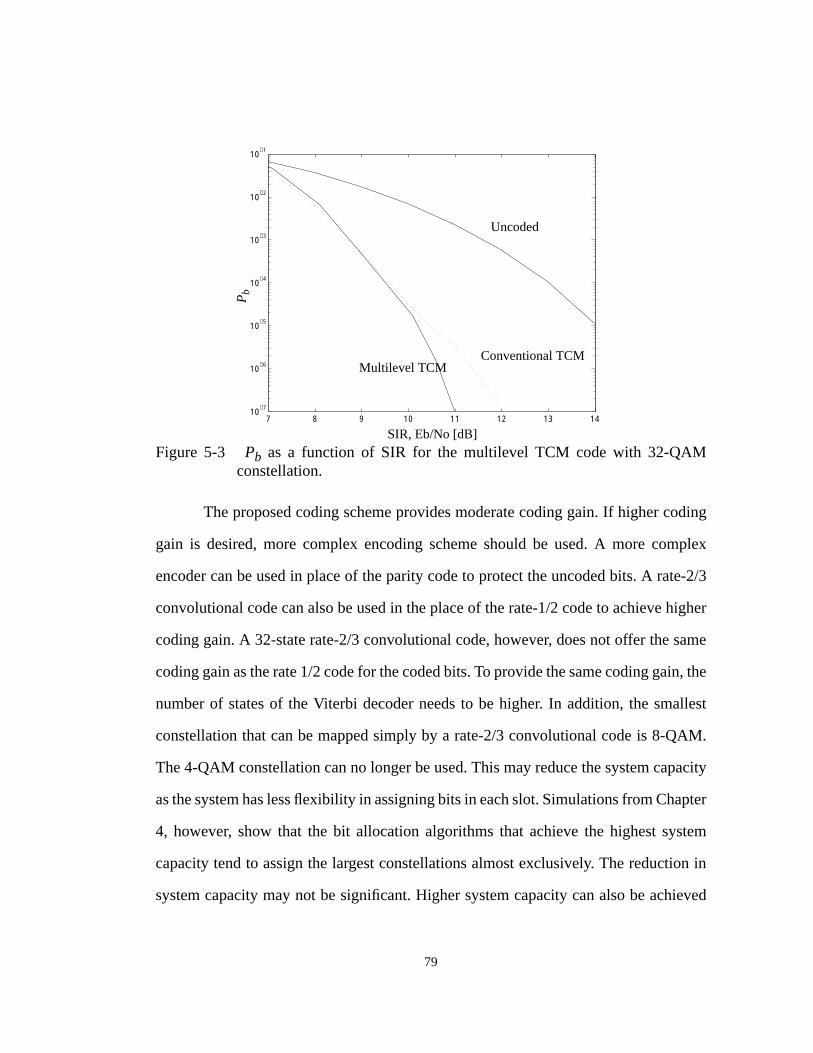
79
The proposed coding scheme provides moderate coding gain. If higher coding
gain is desired, more complex encoding scheme should be used. A more complex
encoder can be used in place of the parity code to protect the uncoded bits. A rate-2/3
convolutional code can also be used in the place of the rate-1/2 code to achieve higher
coding gain. A 32-state rate-2/3 convolutional code, however, does not offer the same
coding gain as the rate 1/2 code for the coded bits. To provide the same coding gain, the
number of states of the Viterbi decoder needs to be higher. In addition, the smallest
constellation that can be mapped simply by a rate-2/3 convolutional code is 8-QAM.
The 4-QAM constellation can no longer be used. This may reduce the system capacity
as the system has less flexibility in assigning bits in each slot. Simulations from Chapter
4, however, show that the bit allocation algorithms that achieve the highest system
capacity tend to assign the largest constellations almost exclusively. The reduction in
system capacity may not be significant. Higher system capacity can also be achieved
7 8 9 10 11 12 13 1410
−7
10−6
10−5
10−4
10−3
10−2
10−1
Figure 5-3 Pb as a function of SIR for the multilevel TCM code with 32-QAMconstellation.
SIR, Eb/No [dB]
Pb
Uncoded
Conventional TCMMultilevel TCM
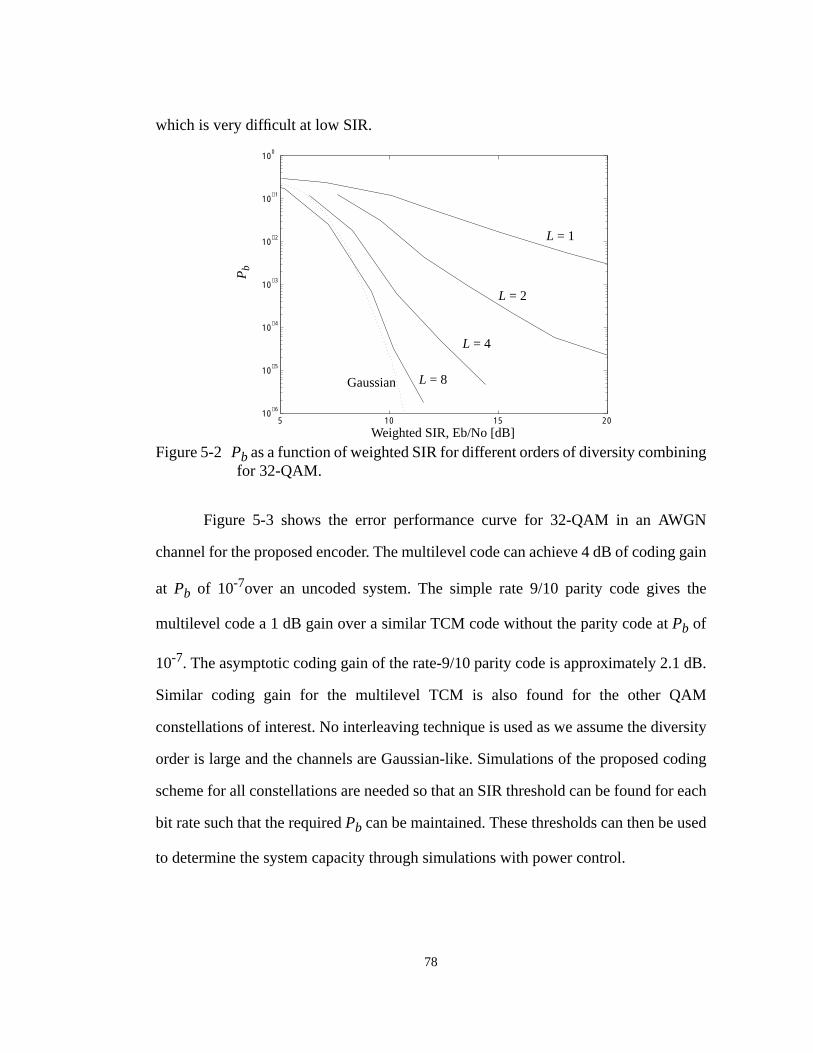
78
which is very difficult at low SIR.
Figure 5-3 shows the error performance curve for 32-QAM in an AWGN
channel for the proposed encoder. The multilevel code can achieve 4 dB of coding gain
at Pb of 10-7over an uncoded system. The simple rate 9/10 parity code gives the
multilevel code a 1 dB gain over a similar TCM code without the parity code at Pb of
10-7. The asymptotic coding gain of the rate-9/10 parity code is approximately 2.1 dB.
Similar coding gain for the multilevel TCM is also found for the other QAM
constellations of interest. No interleaving technique is used as we assume the diversity
order is large and the channels are Gaussian-like. Simulations of the proposed coding
scheme for all constellations are needed so that an SIR threshold can be found for each
bit rate such that the required Pb can be maintained. These thresholds can then be used
to determine the system capacity through simulations with power control.
5 10 15 2010
−6
10−5
10−4
10−3
10−2
10−1
100
Figure 5-2 Pb as a function of weighted SIR for different orders of diversity combiningfor 32-QAM.
Weighted SIR, Eb/No [dB]
Pb
L = 1
L = 8
L = 4
L = 2
Gaussian
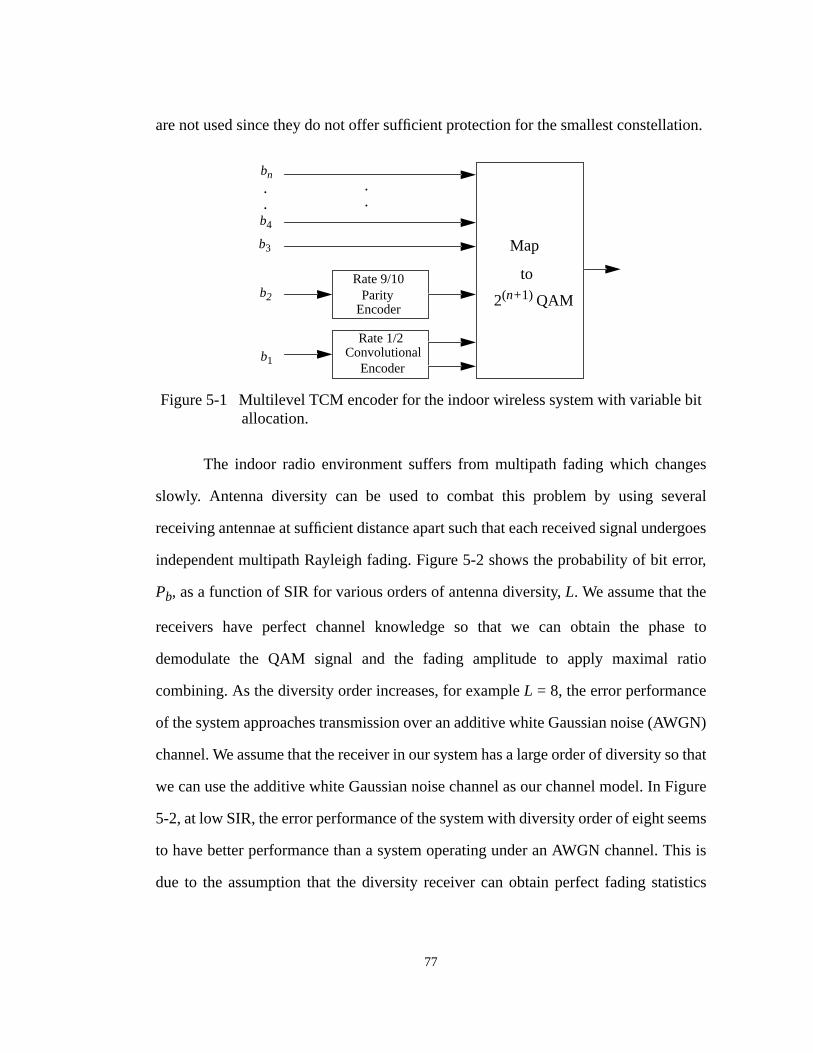
77
are not used since they do not offer sufficient protection for the smallest constellation.
The indoor radio environment suffers from multipath fading which changes
slowly. Antenna diversity can be used to combat this problem by using several
receiving antennae at sufficient distance apart such that each received signal undergoes
independent multipath Rayleigh fading. Figure 5-2 shows the probability of bit error,
Pb, as a function of SIR for various orders of antenna diversity, L. We assume that the
receivers have perfect channel knowledge so that we can obtain the phase to
demodulate the QAM signal and the fading amplitude to apply maximal ratio
combining. As the diversity order increases, for example L = 8, the error performance
of the system approaches transmission over an additive white Gaussian noise (AWGN)
channel. We assume that the receiver in our system has a large order of diversity so that
we can use the additive white Gaussian noise channel as our channel model. In Figure
5-2, at low SIR, the error performance of the system with diversity order of eight seems
to have better performance than a system operating under an AWGN channel. This is
due to the assumption that the diversity receiver can obtain perfect fading statistics
Rate 1/2Convolutional
Encoder
Rate 9/10Parity
Encoder
b1
b2
b3
b4
bn
Figure 5-1 Multilevel TCM encoder for the indoor wireless system with variable bitallocation.
Map
to
2(n+1) QAM
.
...
76
congested. Quadrature amplitude modulation (QAM) is used to accommodate different
bit rates with high bandwidth efficiency. The minimum constellation size is 4-QAM.
The maximum constellation size is 64-QAM. We are interested in finding a coding
scheme that provides sufficient coding gain for all constellations used and yet is simple
enough that it does not require several encoder/decoder pairs for different
constellations. A simple pragmatic trellis coded modulation (TCM) scheme is chosen.
The proposed TCM encoder is shown in Figure 5-1. It is a simple multilevel
TCM encoder [53] based on a 32-state rate-1/2 convolutional code. There are n input
bits to the encoder. One of the input bits is coded by the rate-1/2 convolutional encoder
to form two coded bits. This convolutional code is chosen so that even in difficult
propagation conditions where only the smallest constellation, 4-QAM, can be sent, the
information would have sufficient protection from the channel impairments. If the input
bits to the encoder is greater than one bit, an additional parity encoder is added to
protect the uncoded bits {b2, b3, ... , bn}. The parity code rate is 9/10. It adds a parity
bit after nine input bits of b2. The conventional pragmatic encoders proposed in [73] is
not used because these encoders have lower code rates and do not protect non-square
constellations like 8-QAM and 32-QAM. The punctured TCM codes proposed in [42]
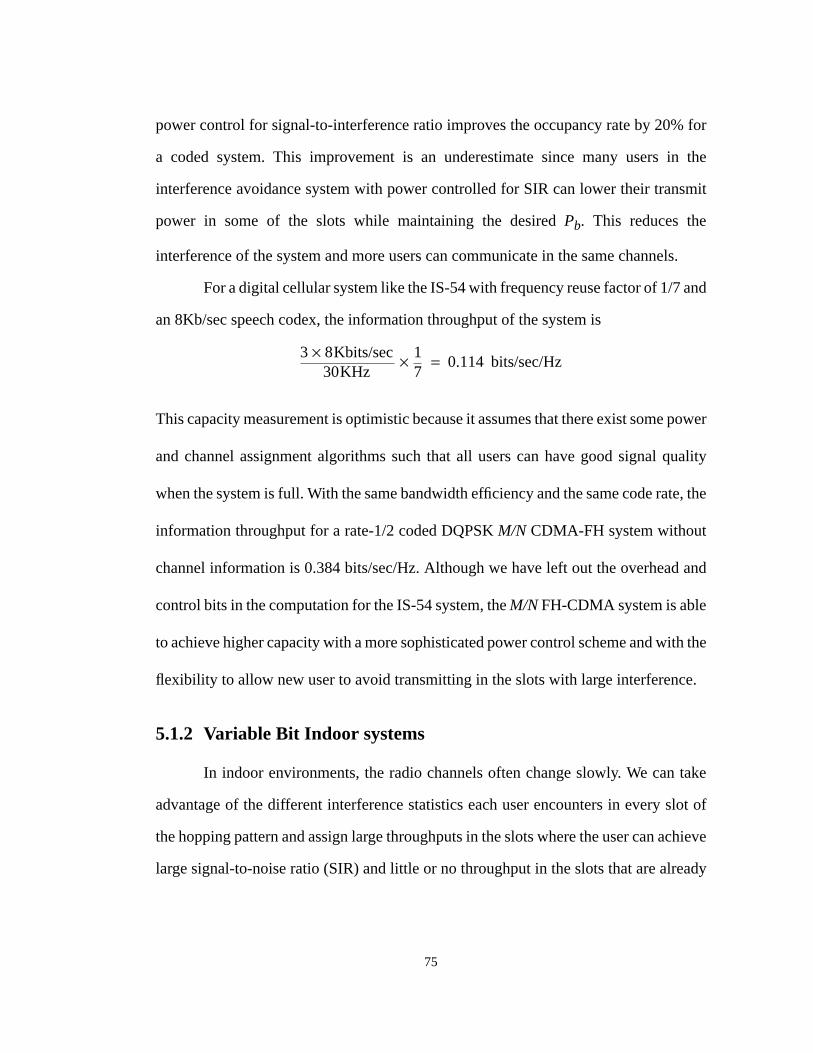
75
power control for signal-to-interference ratio improves the occupancy rate by 20% for
a coded system. This improvement is an underestimate since many users in the
interference avoidance system with power controlled for SIR can lower their transmit
power in some of the slots while maintaining the desired Pb. This reduces the
interference of the system and more users can communicate in the same channels.
For a digital cellular system like the IS-54 with frequency reuse factor of 1/7 and
an 8Kb/sec speech codex, the information throughput of the system is
This capacity measurement is optimistic because it assumes that there exist some power
and channel assignment algorithms such that all users can have good signal quality
when the system is full. With the same bandwidth efficiency and the same code rate, the
information throughput for a rate-1/2 coded DQPSK M/N CDMA-FH system without
channel information is 0.384 bits/sec/Hz. Although we have left out the overhead and
control bits in the computation for the IS-54 system, the M/N FH-CDMA system is able
to achieve higher capacity with a more sophisticated power control scheme and with the
flexibility to allow new user to avoid transmitting in the slots with large interference.
5.1.2 Variable Bit Indoor systems
In indoor environments, the radio channels often change slowly. We can take
advantage of the different interference statistics each user encounters in every slot of
the hopping pattern and assign large throughputs in the slots where the user can achieve
large signal-to-noise ratio (SIR) and little or no throughput in the slots that are already
3 8Kbits/sec×30KHz
17
× 0.114 bits/sec/Hz=
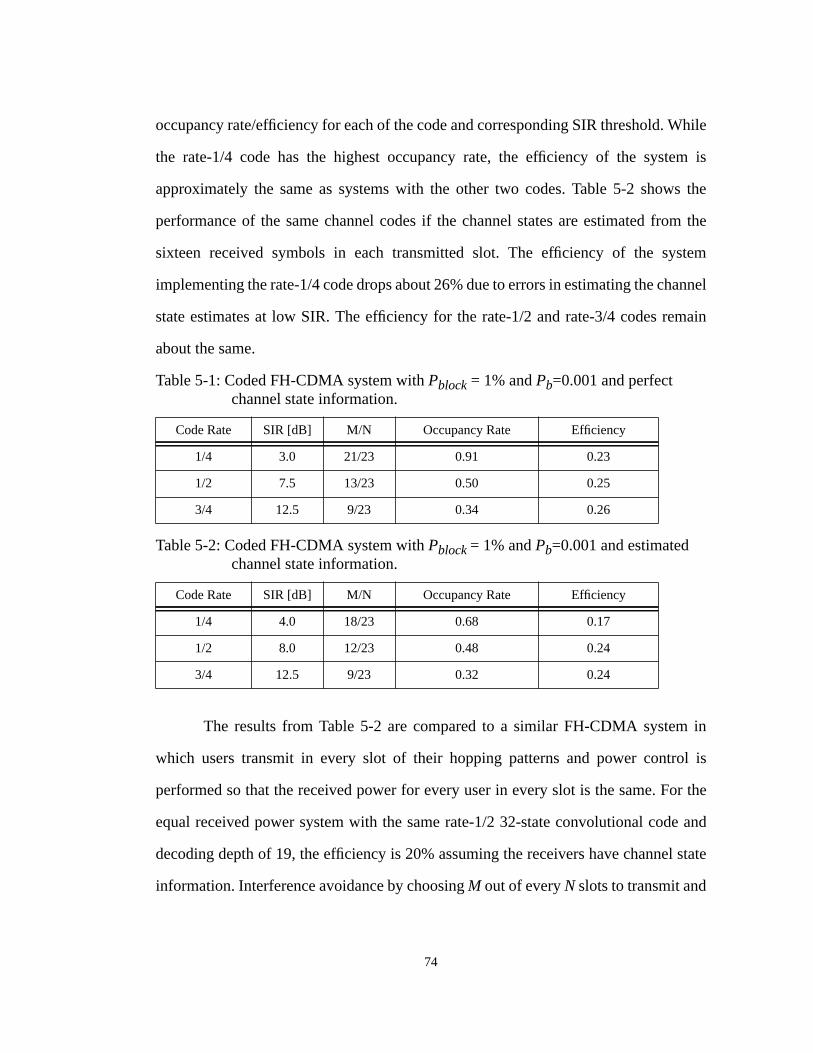
74
occupancy rate/efficiency for each of the code and corresponding SIR threshold. While
the rate-1/4 code has the highest occupancy rate, the efficiency of the system is
approximately the same as systems with the other two codes. Table 5-2 shows the
performance of the same channel codes if the channel states are estimated from the
sixteen received symbols in each transmitted slot. The efficiency of the system
implementing the rate-1/4 code drops about 26% due to errors in estimating the channel
state estimates at low SIR. The efficiency for the rate-1/2 and rate-3/4 codes remain
about the same.
The results from Table 5-2 are compared to a similar FH-CDMA system in
which users transmit in every slot of their hopping patterns and power control is
performed so that the received power for every user in every slot is the same. For the
equal received power system with the same rate-1/2 32-state convolutional code and
decoding depth of 19, the efficiency is 20% assuming the receivers have channel state
information. Interference avoidance by choosing M out of every N slots to transmit and
Table 5-1: Coded FH-CDMA system with Pblock = 1% and Pb=0.001 and perfectchannel state information.
Code Rate SIR [dB] M/N Occupancy Rate Efficiency
1/4 3.0 21/23 0.91 0.23
1/2 7.5 13/23 0.50 0.25
3/4 12.5 9/23 0.34 0.26
Table 5-2: Coded FH-CDMA system with Pblock = 1% and Pb=0.001 and estimatedchannel state information.
Code Rate SIR [dB] M/N Occupancy Rate Efficiency
1/4 4.0 18/23 0.68 0.17
1/2 8.0 12/23 0.48 0.24
3/4 12.5 9/23 0.32 0.24
73
be maximized by choosing the appropriate code rate and the ratio M/N jointly.
It is difficult to predict what kind of SIR distribution a code can overcome in the
M slots used while protecting against Rayleigh fading. To reduce simulation time, an
SIR threshold, γth, is picked for each code. Simulations have been performed to make
sure that the users with this SIR in every slot have Pb at least one magnitude less than
the desired Pb. A new user would try to obtain SIR equal to γth in M out of every N slots
in its hopping pattern. If it cannot achieve γth in M slots, the user then lowers its desired
SIR until a feasible power vector can be found. Error simulation is then performed for
the users who cannot achieve the SIR threshold in M out of every N slots. The
occupancy rate obtained by this simulation is a lower bound for the maximum
occupancy rate/efficiency possible. It is possible to increase the capacity of the system
by lowering the SIR of some slots for the users who can maintain SIR at the SIR
threshold in all slots transmitted.
In our simulations, Pblock is set at 1%. Fading is assumed to be the same in every
slot, but independent from hop to hop. Interleaving across each slot is needed to
decorrelate the symbols to maximize the gain achievable by the channel code. To
provide selection diversity, each user has two receiving antennae, each receiving a copy
of the transmitted signal through an independently fading channel. In Table 5-1, the
efficiencies for three convolutional codes are shown assuming the receivers have
perfect channel state information. All three convolutional codes have 32-states and
have the best distance property for their rate and number of states [45]. The decoding
depth is 19 for all three codes. It is found that these codes do not perform much better
with larger decoding depth. The SIR listed is the SIR threshold, γth, that guarantees Pb
to be below the desired value of 0.001. N is 23 and M is selected to maximize the highest
72
to protect the signals from fading. The interference avoidance technique only allows the
users to transmit in the M favorable slots that the users can achieve good signal quality
on the average. It does not change fast enough to account for fading conditions.
Simulations are performed for the reverse link of a nineteen-cell outdoor
system. Users are assigned orthogonal hopping patterns so that they encounter a
different set of interferers at every slot. We assume that propagation loss follows the
fourth order distance law and that shadowing can be modeled by a lognormal
distribution with standard deviation of 8 dB. Since we are interested in error rate
analysis, static simulations are performed to reduce simulation time. In static
simulations, one user is added at a time until the desired Pblock can no longer be
sustained. These simulations are different from the dynamic simulations performed in
the earlier chapters where the arrivals of users follow a Poisson distribution and the
service time is i.i.d. and exponentially distributed.
In our simulations, we assume the users are communicating in Rayleigh-faded
channels. The effect of fading is mitigated by the channel code with interleaving and
diversity techniques. Besides protecting the signal from fading and noise, the channel
code can also average out the different interference environment each user faces in the
M slots chosen to increase the system capacity. It allows users who are unable to sustain
good SIR in all of the M transmitted slots into the system.
We define occupancy rate as the product of the fraction of the hopping patterns
used and the ratio of M/N. It is a measure of the channel usage or capacity. We also
define an information throughput measure, efficiency, as the number of bits per second
per hertz that can be communicated reliably in the system. In an M/N CDMA-FH
system, efficiency is equal to the product of the code rate and the occupancy rate for a
probability of bit error, Pb, distribution required by the users and a specific Pblock. It can
71
of an M/N system with a simple convolutional code in the outdoor environment. We
then describe a proposed a simple pragmatic trellis coded modulation (TCM) technique
for the variable bit allocation system to simplify the decoder structure. In Section 5.2,
we study the effects of dynamic range limitation and present the simulation results for
both an outdoor M/N system and an indoor variable bit allocation system.
5.1 Channel Coding
Channel coding is an important part of wireless systems. In addition to protect
the signals from fading and noise, it can be used to average out the different interference
levels in the transmitted slots. This section is divided into two parts. We first present
simulation results of an M/N outdoor wireless system with simple convolutional codes.
We then discuss a simple coding scheme that can be used for to reduce the complexity
of the variable bit rate transmitter and receiver.
5.1.1 M/N Outdoor Systems
In the outdoor environment, the channels often changes quickly. We allow each
user the flexibility to transmit in M favorable slots out of every N so that the
users can avoid sharing a channel with large interferers. This interference avoidance
technique has been shown to increase the system capacity in Chapter 3. We assume that
the phase of the received signal does not undergo significant changes between adjacent
symbols. Differential quadrature phase-shift keying (DQPSK), which encodes
information in the form of the change in the phases between two consecutive received
symbols, is chosen as the modulation scheme. We also assume that the users cannot
rearrange which of the M out of every N slots to transmit fast enough to avoid
temporarily deeply faded channels. It is up to the error correcting code and interleaving
M N≤( )
70
Chapter 5
IMPLEMENTATION ISSUES OF FH-
CDMA SYSTEMS
In previous chapters, we examined the effects of dynamically assigning power
and channels by applying the concept of interference avoidance and averaging for FH-
CDMA wireless systems. We assumed that there existed some error correcting codes
that can ensure satisfactory signal quality if the average SIR among the slots used is
above an SIR threshold. We also studied the effects of variable bit allocation in an
indoor environment. In this chapter, we study the effects of practical forward error
correcting codes on interference averaging and system capacity. We also look at the
problem of dynamic power limitation as each user has a fixed minimum and maximum
transmitted power. These constraints on transmitted power can affect the system
capacity as users may not be able to transmit large enough power to sustain the signal-
to-interference ratio (SIR) they desire.
This chapter is divided into two sections. Section 5.1 presents simulation results
88
antenna arrays, channel probing, and distributed power control. Better channel
models are needed to capture the dynamics of the wireless channels as fading may
be correlated between adjacent frequency bins. As the demand for more flexible
wireless system continues to grow, better mixed-traffic models are needed for
wireless systems that support a combination of voice, video, and data. With these
models, the variable bit allocation algorithms can further maximize the channel
throughput according to the traffic statistics. These and many other interesting
problems faced by the system designers of FH-CDMA wireless systems make this
an exciting research field with very high potential rewards.
87
system. Since high capacity wireless systems are interference limited, reduction in
interference directly leads to increased capacity.
We have proposed several techniques for performing interference avoidance
in FH-CDMA wireless systems. A user can probe the slots in the assigned hopping
pattern and avoid large interferers by transmitting only in the M favorable slots out
of every N. Simulations show that this interference avoidance technique along with
randomization of the interferers the users encounter in every hop can significantly
raise the system capacity. If the channels vary slowly as in some indoor channels,
users can adjust the bit rate by transmitting more information in the slots with low
interference and little or no information in the slots that are congested. This
additional flexibility of varying bit rates can further increase the system capacity by
more than 50% over an equivalent M/N system.
In this thesis, we focus our attention on slow-hopped CDMA systems.
While it is arguable which of the multiple access techniques is the most suitable for
wireless communications, all of the algorithms and concepts described in this thesis
can be applied to all wireless systems regardless of the multiple access protocols
used. The general idea of the increased flexibility to allow users to adapt to the
changes in channel conditions and avoid large interferers should still increase the
system capacity the wireless systems with different access protocols. The amount
of improvement, however, is yet to be shown.
There are many other challenging problems that many researchers are
currently examining for FH-CDMA wireless systems besides channel resource
allocation. Synchronization and phase acquisition at every hop are very difficult
problems as channels may undergo drastic changes from hop to hop. There is also
the problem of interactions between different adaptive algorithms like adaptive
86
Chapter 6
CONCLUSION
With limited spectrum and difficult propagation conditions, channel
resource allocation is an important part of designing a high capacity wireless
communication system. The key feature among the channel resource allocation
algorithms proposed in this thesis is the increased flexibility of the wireless system.
With the increased flexibility, the systems can dynamically assign power and
channels to users according to their propagation and interference condition. The
channel resources can be used more efficiently as users adapt to the changes in
channel conditions and try to minimize the system interference.
All of the proposed algorithms can be performed in a distributed fashion. No
communication between any pair of users sharing the same channels is necessary.
Only coordination between each transmitter-receiver pair is needed. The algorithms
implement the concept of interference avoidance via the increased flexibility. Users
selectively transmit in the slots so that they can avoid sharing the channels with
large interferers and do not induce large interference among all of the users in the
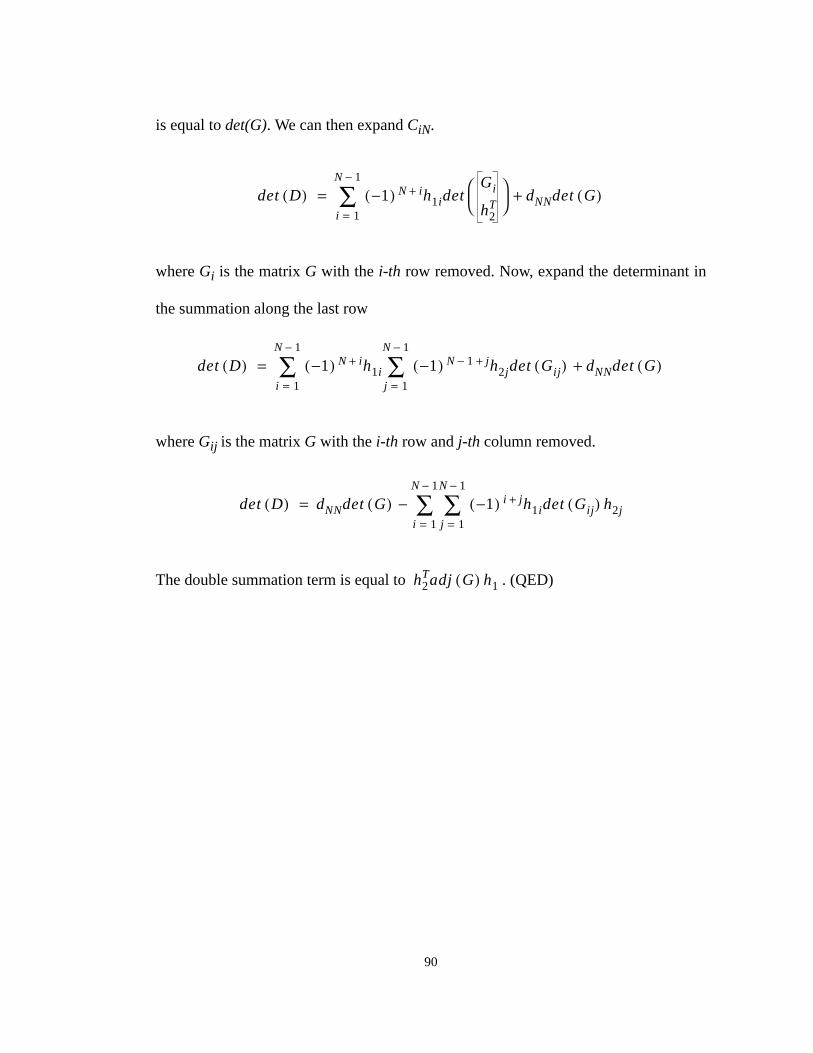
90
is equal to det(G). We can then expand CiN.
where Gi is the matrix G with the i-th row removed. Now, expand the determinant in
the summation along the last row
where Gij is the matrix G with the i-th row and j-th column removed.
The double summation term is equal to . (QED)
det D( ) 1−( ) N i+ h1idetGi
h2T
i 1=
N 1−
∑ dNNdet G( )+=
det D( ) 1−( ) N i+ h1i 1−( ) N 1− j+ h2jdet Gij( )j 1=
N 1−
∑i 1=
N 1−
∑ dNNdet G( )+=
det D( ) dNNdet G( ) 1−( ) i j+ h1idet Gij( ) h2jj 1=
N 1−
∑i 1=
N 1−
∑−=
h2Tadj G( ) h1
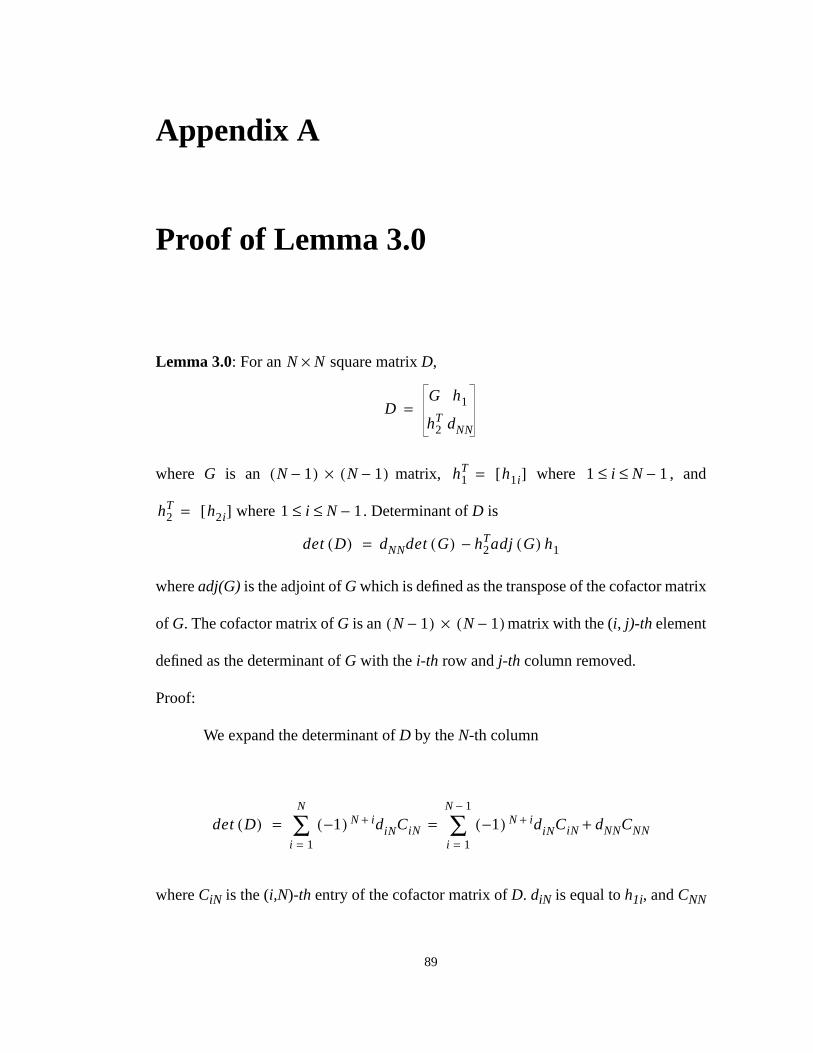
89
Appendix A
Proof of Lemma 3.0
Lemma 3.0: For an square matrix D,
where G is an matrix, where , and
where . Determinant of D is
where adj(G) is the adjoint of G which is defined as the transpose of the cofactor matrix
of G. The cofactor matrix of G is an matrix with the (i, j)-th element
defined as the determinant of G with the i-th row and j-th column removed.
Proof:
We expand the determinant of D by the N-th column
where CiN is the (i,N)-th entry of the cofactor matrix of D. diN is equal to h1i, and CNN
N N×
DG h1
h2T dNN
=
N 1−( ) N 1−( )× h1T h1i[ ]= 1 i N 1−≤ ≤
h2T h2i[ ]= 1 i N 1−≤ ≤
det D( ) dNNdet G( ) h2Tadj G( ) h1−=
N 1−( ) N 1−( )×
det D( ) 1−( ) N i+ diNCiNi 1=
N
∑ 1−( ) N i+ diNCiNi 1=
N 1−
∑ dNNCNN+= =
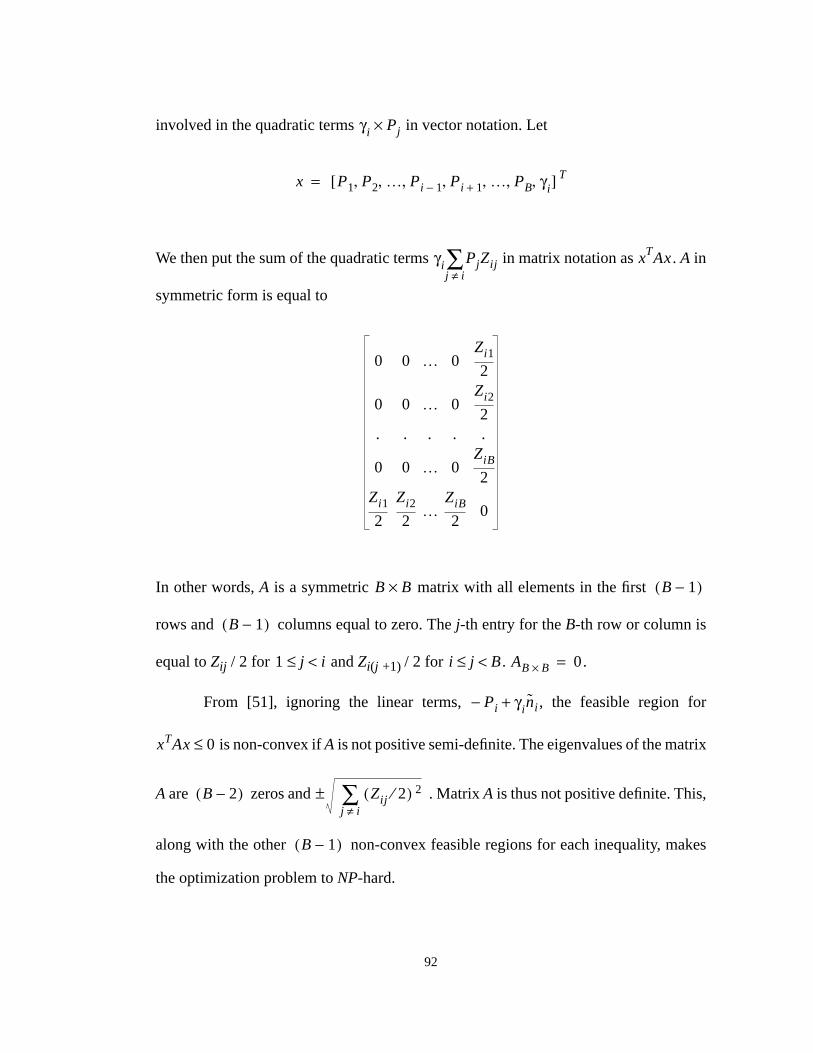
92
involved in the quadratic terms in vector notation. Let
We then put the sum of the quadratic terms in matrix notation as . A in
symmetric form is equal to
In other words, A is a symmetric matrix with all elements in the first
rows and columns equal to zero. The j-th entry for the B-th row or column is
equal to Zij / 2 for and Zi(j +1) / 2 for . .
From [51], ignoring the linear terms, , the feasible region for
is non-convex if A is not positive semi-definite. The eigenvalues of the matrix
A are zeros and . Matrix A is thus not positive definite. This,
along with the other non-convex feasible regions for each inequality, makes
the optimization problem to NP-hard.
γi Pj×
x P1 P2 … Pi 1− Pi 1+ … PB γi, , , , , , ,[ ] T=
γi PjZijj i≠∑ xTAx
0 0 … 0Zi1
2
0 0 … 0Zi2
2. . . . .
0 0 … 0ZiB
2Zi1
2
Zi2
2…
ZiB
20
B B× B 1−( )
B 1−( )
1 j i<≤ i j B<≤ AB B× 0=
Pi− γini+
xTAx 0≤
B 2−( ) Zij 2⁄( ) 2
j i≠∑±
B 1−( )
91
Appendix B
Proof of Bit Allocation Problem is NP-
Hard
Here, we show another way to prove the bit allocation problem is NP-hard. We,
again, assume that there are B users in the system. Each has a different desired SIR, γi,
such that the inequality
holds for .
Multiplying the denominator on both side and dividing both side by Gii, we
have
where Zij is equal to Gij / Gii and is equal to ni / Gii. In the above equation, the
transmitted power, Pj, and desired SIR, γi, are unknowns. The equation is thus a
quadratic equation of the variables Pj, , and γi. We now put the variables
PiGii
PjGijj i≠∑ ni+
γi≥
1 i B≤ ≤
γi PjZijj i≠∑ Pi− γini+ 0≤
ni
1 j B≤ ≤
99
represent information.
Receiver: A device that converts signals used for transmission back to information
signals.
Reverse link: The radio link where a user is transmitting to a base station. Also known
as the up-link.
Signal-to-Interference Ratio (SIR): The ratio of the desired signal power divided by
the total power of the interference and the background noise.
Spread Spectrum (SS): A signaling scheme in which the transmission bandwidth is
much greater than the information rate.
Soft decoding: The decoder uses the unquantized samples output from the demodulator
to recover the information sequence.
Transmitter: A device that converts information signal to electrical or optical signals
for transmission purposes.
Transceiver: A contraction of “transmitter/receiver.” The term is used when a
communication device can both transmit and receive.
Trellis coded modulation (TCM): A digital bandwidth-efficient modulation technique
that incorporates the concept of set partitioning and channel coding.
Up-link: The radio link where a user is transmitting to a base station. Also known as
the reverse link.
White noise: Noise whose frequency spectrum is uniform over a wide frequency band.
Wireless Communications: General term for communication without wires.
98
intervals in time to overcome burst errors.
Offered load: The ratio of the new user arrival rate divided by the system service rate.
It may be normalized to the number of channels are available to the system.
Medium: A substance regarded as the means of signal transmission.
Modulation: The process of varying certain characteristics of a carrier in accordance
with a message signal.
Multilevel trellis coded modulation: A modified trellis coded modulation where the
uncoded bits are coded often with an error correcting code that explore the
geometric properties of the signal constellations.
Multipath: The large set of propagation paths that the transmitted signal takes to the
receiver. The multiple paths could be caused by scattering.
Multipath fading: Fading that results when radio signals reach the receiving antenna
by two or more paths.
Multiple-Access: A sharing scheme that enables dispersed users to simultaneously
access a common channel resource.
Network: An organization of terminals capable of intercommunication.
Outage: A condition wherein a user is deprived of service due to unavailability of the
communication system.
Parity-check code: A simple forward error correcting block code of rate (N,N-1). It
adds a parity bit at the end of (N-1) information bits so that the N-bit block would
have even number of ones. This code can be decoded using a simple two-state
trellis decoder.
Personal Communication Services (PCS): For standard purposes, it is an umbrella
term to describe services and supporting systems that provide users with the
ability to communicate anytime, anywhere, and in any form.
Power control (PC): A technique employed to adjust the transmit power from every
radio link to the minimum level required for reliable transmission.
Quadrature amplitude modulation: A coherent digital modulation technique that
uses the amplitude in both the I-channel and the Q-channel of the signal to
97
Flat fading: Fading resulting in similar attenuation of all frequency components of
signal.
Forward link: The radio link where the base station is transmitting to a user in the
coverage area. Also known as the down-link.
Frame: A set of consecutive time slots in which the position of each slot can be
identified in reference to the frame start time.
Frequency diversity: A transmission technique used to minimize the effects of fading
wherein the same information signal is transmitted and received simultaneously
on two or more independent carrier frequencies.
Frequency hop (FH): A spread spectrum technique in which the available channel
bandwidth is subdivided into a large number of frequency slots. Each user is
assigned a hopping pattern which specifies the sequences of slots a user would
use. Frequency hopped can be categorized into slow frequency hop systems
where there are more than information symbols per hop and fast frequency
systems where one information symbol interval is greater than a hop duration.
In any signaling interval, the transmitted signal occupies one or more of the available
frequency slots.
Frequency reuse: The scheme of assigning different frequencies to adjacent cells so
that users communicating at the same frequency would not be too close to one
another.
Frequency-selective fading: Fading in which not all frequency components of the
received radio signal are attenuated equally.
Hand-off (HO): The process of a user changing the base station it communicates with
as it moves across the cell boundaries. Also known as hand-over.
Integrated services digital network (ISDN): An integrated digital network which can
establish connection for data and telephony services using the same transmission
equipment.
Interference: Undesired signals generated by other users in the communication
channel.
Interleaving: A method of spacing successive symbols of a given codeword at wide
96
Channel coding: Adding controlled redundancy to the information sequence to
improve reliability of data transmitted through a noisy channel.
Coherent detection: Detection using a reference signal that is synchronized in
frequency and phase to the transmitted signal.
Convolutional codes: A type of code in which output sequence consists of a selected set
of linear combinations of the input sequence.
Code division multiple access: A way of sharing a common spectrum in which
signals from different transmitters are distinguished by a code known to the
intended receiver. It is usually divided into two categories: direct sequence (DS)
and frequency hop (FH).
Differential quadrature phase-shift keying (DQPSK): A digital modulation scheme
that uses the phase changes of multiples of ninety degrees or π/2 from the
previous symbol to carry two bits of information.
Dispersion: The spreading, separation, or scatter of a waveform during transmission.
Diversity: The reception of different versions of the same information, each with
independent fading levels.
Down-link: The radio link where the base station is transmitting to a user in the
coverage area. Also known as the forward link.
Dropping: Users already in the system are denied services due to the lack of channel
resources.
Dynamic channel allocation (DCA): The scheme of allocating channel resources to
the user depending on the channel condition and the availability of the channel
resource.
Dynamic channel and power allocation (DPCA): The scheme of assigning channel
and power to the user depending on the channel condition and the availability of
the channel resource.
Erlang: A unit-less measure of the offered load.
Fading: The variation of the intensity or relative phase of any frequency component of
a received signal due to changes in the characteristics of the propagation path with
time.
95
RF Radio frequency
SIR Signal-to-interference ratio
SNR Signal-to-noise ratio
SS spread spectrum
TCM Trellis coded modulation
TDMA Time division multiple access
TIA Telecommunications Industry Association (U. S.)
UCLA University of California, Los Angeles
C.2 Definitions
Baud: The unit of number of bits per symbol.
Bit error rate: The ratio of the number of bits incorrectly received to the total number
of bits transmitted.
BCH Codes: A large class of cyclic block codes that include both binary and nonbinary
alphabets.
Block codes: A type of error correcting code of fixed length N. These N symbols
represents K symbols of information and (N - K) parity or redundancy symbols
where .
Blocking: New users to the system are declined services due to the lack of channel
resources.
Capacity: Maximum number of users a system can support.
Cellular Radio: A system in which a service area is divided into smaller areas called
cells where users in each cell communicate with a base station usually located
near the center of the cell.
Channel: An allocation of the physical (frequency and time) resources of a
transmission medium for communications.
N K≥
94
HO Hand off
Hz Hertz or cycle per second.
IS-54 Interim Standard 54 (TIA/EIA TDMA cellular standard, U. S.)
IS-95 Interim Standard 95 (TIA/EIA CDMA cellular standard, U. S.)
ISDN Integrated Services Digital Network
ISI Inter-symbol interference
ISM Industrial, Scientific, and Medical (bands, devices)
LAN Local area network
LOS Line of sight
MTSO Mobile telephone switching office
Pblock Probability of blocking
Pdrop Probability of dropping
PBX Private branch exchange
PC Power control
PCN Personal Communications Network (Europe)
PCS Personal Communications Services (U. S.)
PN Pseudo-noise
PDC Personal Digital Cellular (Japan)
PSTN Public Switched Telephone Network
QAM Quadrature amplitude modulation
QOS Quality of service
93
Appendix C
Glossary
C.1 List of Acronyms and Abbreviations
AMPS Advanced Mobile Phone Service
AWGN Additive white Gaussian noise
BER Bit error rate
CDMA Code division multiple access
DCA Dynamic channel allocation
DECT Digital European Cordless Telecommunications
DPCA Dynamic power and channel allocation
DQPSK Differential quadrature phase-shift keying
DS Direct sequence
FCC Federal Communications Commission (U. S.)
FDMA Frequency division multiple access
FEC Forward error correction
FH Frequency hop
GSM Groupe Spécial Mobile or Global System for Mobile Communication
100
Bibliography
[1] S. E. Alexander, “Characterising buildings for propagation at 900 MHz,”
Electronics Letters, Vol. 19, No. 20, pp. 860, Sep. 1983.
[2] J. B. Anderson and S. Mohan, Source and Channel Coding: An Algorithmic
Approach, Kluwer Academic Pub., Boston, MA, 1991.
[3] N. Bambos and G. J. Pottie, “Power control based admission policies in
cellular radio networks,” Proc. of IEEE Globecomm, Dec. 6-9, 1992, pp.
863-67, Orlando, FL.
[4] N. Bambos, S. Chen, and G. J. Pottie, “Radio link admission algorithms for
wireless networks with power control,” Proc. of INFOCOM 1995, Apr 95,
Boston, MA.
[5] S. Benedetto, E. Biglieri, V. Castellani, Digital Transmission Theory,
Prentice-Hall, Englewood Cliffs, NJ, 1987.
[6] E. Biglieri, D. Divsalar, P. J. McLane, M. K. Simon, Introduction to Trellis-
Coded Modulation with Applications, Macmillan Pub. Co., New York, NY
1991.
[7] R. E. Blahut, Theory and Practice of Error Control Codes, Addison-Wesley
Pub. Co., Reading, MA, 1984.
101
[8] T. Chebaro, “Statistics of signal to interference plus noise ratio in a
sectorized FH-TDMA system with a single cell frequency reuse pattern,”
Proc. of IEEE Int. Conf. on Comm. 1995, pp. 863-868, May 1995, Seattle,
WA.
[9] J. A. C. Bingham, “Multicarrier modulation for data transmission: an idea
whose time has come,” IEEE Comm., pp. 5-14, May, 1990.
[10] R.E. Blahut, Theory and Practice of Error Control Codes. New York:
Addison-Wesley, 1983.
[11] A. R. Calderbank and N. J. A. Sloane, “New trellis codes based on lattices
and cosets,” IEEE Tran. on Information Theory, Vol. IT-33, No. 2, pp. 177-
195, March 1987.
[12] S. C. Chen, N. Bambos, and G. J. Pottie, “On distributed power control for
radio networks,” Proc. of IEEE Int. Conf. on Comm. 1994., pp. 1281-1285,
Vol. 3., May 1994.
[13] K. W. Cheung, J. HJ. Sau, M. S. Fong and R. D. Murch, “Indoor propagation
prediction utilizing a new empirical model,” Proc. of IEEE Singapore
ICCS-1994, pp. 15-17, Singapore, 1994.
[14] L. J. Cimini, G. J. Foschini, C.-L. I, “Call blocking performance of
distributed algorithms for dynamic channel allocation in microcells,” Proc.
of IEEE Int. Conf. on Comm. 1992, pp. 1327-1332.
[15] L J. Cimini, G. J. Foschini, “Distributed algorithms for dynamic channel
allocation in microcellular systems,” Proc. of IEEE Vehicular Technology
Conf. 1992, pp. 641-644, 1992.
102
[16] G. R. Cooper and R. W. Nettleton, “A spread-spectrum technique for high-
capacity mobile communications,” IEEE Trans. of Vehicular Technology.,
Vol. 27, No. 4, pp. 264-275, Nov. 1978.
[17] T. M. Cover and J. A. Thomas, Elements of Information Theory, John Wiley
and Sons, Inc., New York, NY, 1991.
[18] D. C. Cox, “Wireless network access for personal communications,” IEEE
Communications, pp. 96-115, Dec. 1992.
[19] D. C. Cox, “Universal digital portable radio communications,” IEEE
Comm., Vol. 75, pp. 436-477, April 1987.
[20] L. Dossi, G. Tartara, and F. Tallone, “Statistical analysis of measured
impulse response functions of 2.0 GHz indoor radio channel,” Proc. of IEEE
Int. Conf. on Comm. 1995, pp. 1153-57, June 1995, Seattle, WA.
[21] K. Feher, “MODEMS for emerging digital cellular-mobile radio system,”
IEEE Tran. on Vehicular Technology, Vol. 40, No. 2, May 1991, pp.355-365.
[22] G. D. Forney, “Convolutional code I: algebraic structure,” IEEE Tran. on
Information Theory, pp. 720-738, Nov. 1970.
[23] G. D. Forney, “Maximum-likelihood sequence estimation of digital
sequences in the presence of intersymbol interference,” IEEE Tran. on
Information Theory, Vol. IT-18, No. 3, pp. 363-378, May 1972.
[24] G. D. Forney, “Coset codes -- part I: Introduction and geometrical
classification,” IEEE Tran. on Information Theory, Vol. 34, No. 5, pp. 1123-
51, Sep. 1988.
103
[25] G. J. Foschini and Z. Miljanic. “A simple distributed autonomous power
control algorithm and its convergence,” IEEE Trans. on Vehicular
Technology, Vol. 42, pp. 641-646, 1993.
[26] G. J. Foschini, B. Gopinath, Z. Milijanic, “Channel cost of mobility,” IEEE
Trans. on Vehicular Technology, Vol. 42, pp. 414-24, Nov. 1993.
[27] F. R. Gantmakher, The Theory of Matrices, Chelsea Pub. Co., New York,
1959.
[28] K. S. Gilhousen, I. M. Jacobs, R. Padovani, A. J. Viterbi, L. A. Weaver, Jr.,
and C. E. Wheatley, III, “On the capacity of a cellular CDMA system,”
IEEE Trans. on Vehicular Technology, Vol. 40, pp. 303-312, May 1991.
[29] A. J. Goldsmith, L. J. Greenstein, G. J. Foschini, “Error statistics of real-
time power measurements in cellular channels with multipath and
shadowing,” IEEE Trans. on Vehicular Technology, Vol. 43, No. 3, Aug.
1994, pp. 439-446.
[30] D. J. Goodman, P. S. Henry, and V. K. Prabu, “Frequency-hopped multilevel
FSK for mobile radio,” Bell System Tech. Journal., Vol. 59, pp. 1267-1275,
Sept. 1980.
[31] M. Gundmundson, “Correlation model for shadow fading in mobile radio
systems,” Electronics Letters, Vol. 27, No. 23, pp 2145-56, Nov. 7, 1991.
[32] R. Gusella, “A measurement study of diskless workstation traffic on an
Ethernet,” IEEE Tran. on Comm., Vol. 38, No. 9, pp. 1557-68, Sep. 1990.
[33] H. Hashemi, “The indoor radio propagation channel,” Proceedings of the
IEEE, Vol. 81, No. 7, pp. 943-68, July 1993.
104
[34] H. Hashemi, “Impulse response modeling of indoor radio propagation
channels,” IEEE JSAC, Vol. 11, No. 7, pp 967-78, Sep. 1993.
[35] H. Hashemi, D. Tholl, G. Morrison, “Statistical modeling of the indoor
radio propagation -- part I,” Proc. of IEEE Vehicular Technology Conf., pp.
338-342, VTC 92, May 1992.
[36] H. Hashemi, D. Tholl, G. Morrison, “Statistical modeling of the indoor
radio propagation -- part II,” Proc. of IEEE Vehicular Technology Conf., pp.
839-842, VTC 92, May 1992.
[37] C. J. Hansen, C. C. Wang, and G. J. Pottie, “Distributed dynamic channel
resource allocation in wireless systems,” Proc. of Asilomar Conference on
Signals, Systems, and Computers, Oct. 1994.
[38] D. Hughes-Hartogs, United Stated Patent 4,679,227. Jul. 1987.
[39] H. Imai and S. Hirakawa, “A new multilevel coding method using error-
correcting codes,” IEEE Tran. on Information Theory, Vol. IT-23, No. 3, pp.
371-377, 1977.
[40] G. Janssen and R. Prasad, “Propagation measurements in an indoor radio
environment at 2.4 GHz, 4.75 GHz and 11.5 GHz,” Proc. IEEE Vehicular
Technology Conf., VTC 92, Denver, CO., May 1992, pp. 621-624.
[41] I. Kalet, “The multitone channel,” IEEE Tran. on Comm., Vol. 37, No. 2, pp.
119-124, Feb, 1989.
[42] J. Kim and G. J. Pottie, “On punctured trellis coded modulation”, IEEE
Trans. on Information Theory, Vol. 42, No. 2, pp. 627-636, March 1996.
105
[43] W. C. Y. Lee, Mobile Communications Design Fundamental, Wiley and
Sons, New York, New York, 1993.
[44] J. C. Liberti and T. S. Rappaport, “Statistics of shadowing in indoor radio
channels at 900 and 1900 MHz,” Proc. of IEEE, pp. 1066-70, 1992.
[45] S. Lin and D.J. Costello, Error Control Coding: Fundamentals and
Applications. Englewood Cliffs, NJ: Prentice-Hall, 1983.
[46] V. S. Lin and G. J. Pottie, “Implementation of distributed power and
admission control for a frequency hopped wireless transceiver,” accepted to
IEEE Trans. on Vehicular Technology.
[47] D. G. Luenbeger, Linear and Nonlinear Programming, Addison-Wesley
Pub. Co., Reading, MA, 1989.
[48] J. Kim and G. J. Pottie, “On punctured TCM for QAM signalling”, IEEE
Trans. on Information Theory, Vol. 42, No. 2, pp. 627-636, March 1996.
[49] D. Mitra, “An Asynchronous Distributed Algorithm For Power Control In
Cellular Radio Systems,” Proc. of Fourth Winlab Workshop on Third
Generation Wireless Information Network, October 1993.
[50] C. H. Papadimitriou, K. Steiglitz, Combinatorial Optimization: Algorithms
and Complexity, Prentice-Hall, Englewood Cliffs, NJ, 1982.
[51] P.M. Pardalos and S. A. Vavasis. “Quadratic programming with one
negative eigenvalue is NP-hard,” Journal of Global Optimization, No. 1, pp.
15-23, 1991.
[52] G. J. Pottie and A. R. Calderbank, “Channel coding strategies for cellular
106
radio,” Proc. of IEEE Int. Symposium on Information Theory, San Antonio,
TX, Jan. 1993. (submitted to IEEE Trans. on Vehicular Technology).
[53] G. J. Pottie and D. P. Taylor, “Multilevel codes based on partitioning,” IEEE
Tran. on Information Theory, Vol. 35, No. 1, pp. 87-98, Jan. 1989.
[54] J. G. Proakis, Digital Communications, new york: McGraw-Hill, 1983.
[55] K. Raith, “Capacity of digital cellular TDMA systems,” IIEEE Trans. on
Vehicular Technology, Vol. 40, No. 2, pp. 323-332, May 1991.
[56] T. S. Rappaport, S. Y. Seidel, K. Takamizawa, “Statistical channel impulse
response models for factory and open plan building radio communication
system design,” IEEE Tran. on Comm., Vol. 39, No. 5, pp 794-806, May
1991.
[57] T. S. Rappaport, Wireless Communications: Principles and Practice,
Prentice-Hall PTR, Upper Saddle River, N.J., 1996.
[58] A. A. M. Saleh and R. A. Valenzuela, “A statistical model for indoor
multipath propagation,” IEEE JSAC, Vol. AC-5, No. 2, pp. 128-137, 1987.
[59] S. Y. Seidel and T. S. Rappaport, “900 MHz path loss measurements and
prediction techniques for in-building communication system design,” IEEE
Tran. on Vehicular Technology. pp 613-618, 1991.
[60] E. Senata, Non-Negative Matrices. Wiley and Sons: New York, 1973.
[61] M. K. Simon, J. K. Omura, R. A. Scholtz, and B. K. Levitt, Spread Spectrum
Communications Volume I. Rockville, MD: Computer Science 1985.
[62] M. K. Simon, J. K. Omura, R. A. Scholtz, and B. K. Levitt, Spread Spectrum
107
Communications Volume II. Rockville, MD: Computer Science 1985.
[63] A. F. de Toledo and A. M. D. Turkmani, “Propagation into and within
building at 900, 1900 and 2300 MHz,” Proc. of IEEE Vehicular Technology
Conf. pp. 633-36, VTC 92, May 1992.
[64] G. L. Turin, “Introduction to spread-spectrum antimultipath techniques and
their application to urban digital radio,” Proc. of IEEE, Vol. 68, No. 3, pp.
328-353, Mar. 1980.
[65] G. L. Turin, “The Effects of multipath and fading on the performance of
direct-sequence CDMA systems,” IEEE JSAC, Vol. SAC-2, No. 4, pp. 597-
603. July 1984.
[66] G. Ungerboeck, “Channel coding with multilevel/phase signals,” IEEE
Tran. on Information Theory, Vol. IT-28, No. 1, pp. 55-67, Jan. 1982.
[67] G. Ungerboeck, “Trellis-coded modulation with redundant signal sets. Part
I: introduction,” IEEE Comm., Vol. 25, No. 2, pp. 5-11, Feb. 1987.
[68] G. Ungerboeck, “Trellis-coded modulation with redundant signal sets. Part
II: state of art,” IEEE Comm., Vol. 25, No. 2, pp. 12-21, Feb. 1987.
[69] A. J. Viterbi, “A robust ratio-threshold technique to mitigate tone and
partial-band jamming in coded MFSK systems,” MILCOM 1982, Oct. 18-
20, 1982.
[70] A. J. Viterbi, J. K. Omura, Principles of Digital Communication and
Coding. New York: McGraw-Hill, 1979.
[71] A. J. Viterbi, “When not to spread spectrum - a sequel,” IEEE Comm., Vol.
108
23, pp. 12-17, Apr. 1985.
[72] A. J. Viterbi, “Wireless digital communication: A view based on three
lessons learned,” IEEE Comm., Vol 29, No. 9, pp. 33-36, Sept. 1991.
[73] A. J. Viterbi, J. K. Wolf, E. Zehavi, and R. Padovani, “A Pragmatic approach
to trellis-coded modulation,” IEEE Comm., pp. 11-19, July 1989.
[74] A. J. Viterbi, “The evolution of digital wireless technology from space
exploration to personal communication services,” IEEE Trans. on Vehicular
Technology, Vol. 43, No. 3, pp. 638-644, Aug. 1994.
[75] A. J. Viterbi, “Convolutional codes and their performance in
communication systems,” IEEE Tran. on Comm. Technology, Vol. COM-19,
No. 5, pp. 751-772, Oct. 1971.
[76] A. M. Viterbi and A. J. Viterbi, “Erlang capacity of a power controlled
CDMA system,” IEEE JSAC, Vol. 11, No. 6, pp. 892-900, Aug. 1993.
[77] A. J. Viterbi, A. M. Viterbi, and E. Zehavi, “Performance of power-
controlled wideband terrestrial digital communication,” IEEE Tran. on
Comm., Vol. 41, No. 4, pp. 559-569, Apr. 1993.
[78] C. C. Wang, “Dynamic channel resource allocation in frequency hopped
wireless communication systems,” Proc. of IEEE Information Theory
Symposium, Norway, 1994.
[79] C. C. Wang and G. J. Pottie, “Interference avoidance and power control
strategies for coded frequency hopped cellular systems,” Proc. of IEEE Int.
Conf. on Comm., June 1995, pp. 1737-41. Seattle, WA.
109
[80] C. C. Wang and G. J. Pottie, “Power control strategies for a coded frequency
hopped cellular system,” submitted to IEEE Trans. on Comm.
[81] A.D. Whalen, Detection of Signals in Noise. San Diego: Academic Press,
Inc., 1971.
[82] R. D. Yates and C.-Y. Huang, “Integrated power control and base station
assignment,” IEEE Trans. on Vehicular Technology, Vol. 44, pp. 638-44,
Aug. 1995.
[83] J. Zander, “Performance of optimum transmitter power control in cellular
radio systems,” IEEE Trans. on Vehicular Technology, Vol. 41, No. 1, pp.
57-63, Feb. 1992.


![Joint Bit Allocation and Hybrid Beamforming Optimization for Energy … · 2019-10-04 · arXiv:1910.01479v1 [eess.SP] 1 Oct 2019 1 Joint Bit Allocation and Hybrid Beamforming Optimization](https://img.pdfslide.us/doc/110x75/5f0ffafa7e708231d446d848/joint-bit-allocation-and-hybrid-beamforming-optimization-for-energy-2019-10-04.jpg)