Embed Size (px)
Citation preview
CARNEGIE MELLONDepartment of Electrical and Computer Engineering~
Power Consumption and Latencyas a Function of Path Lossand Routing in Multihop
SS-CDMA Wireless Networks
Matthew Ettus
1997

Power Consumption and Latency as a Function of PathLoss and Routing in Multihop SS-CDMA Wireless Networks
Matthew N. Ettus
Dept. of Electrical and Computer EngineeringCarnegie Mellon University
Pittsburgh, PA ! 5213
Abstract
Wireless networking presents challenges that are different from those of tetherednetworks in several significant ways. High error rates and constantly varying channelsare characteristic of mobile communications. Additionally, new constraints are imposed,including limited energy supplies, and the need for portability.
A system for wireless communication using code division multiple access(CDMA), and spread spectrum (SS) modulation, is presented. CDMA has the advantageof not requiring centralized control. Through the use local coordination only, "collisions"may be completely avoided. By using automatic power control in conjunction withspread spectrum modulation, an energy efficient, as well as spectrum efficient, systemcan be created which is capable of simultaneously providing high bandwidth and lowlatency communications.
The primary focus of this research is to simulate the performance of large-scalespread spectrum networks. A simulator, SSNetSim, is described, which allows thesimulation of signal to noise ratios (SNR), throughput, latency, and power consumption.The simulator takes into account parameters such as number of stations, stationplacement, traffic patterns, routing strategies, and path loss. The results given by thesimulator allow the designer to test the impact of various system parameters. It isintended to speed up the initial design phase of a large-scale SS network.
A new routing method, minimum consumed energy routing, is evaluated. Thisnew method is shown to reduce total network power consumption by about 15%, reducelatency by 75%, and reduce congestion, over standard minimum energy routing. Powerconsumption is also more evenly spread between stations, resulting in longer battery lifefor the network as a whole.
-2-
Table of Contents
List of Figures
1 Introduction
2 Basic Concepts
2.1 System Characteristics
2.2 Evaluation Metrics
2.3 Prior Work
3 SSNetSim
3.1 Architecture
3.2 Models
4 Experimental Results
4.1 Validation
4.2 Propagation Effects
4.3 Latency and Routing
5 Conclusions and Areas for future research
5.1 Summary of Results
5.2 Future Work
5.3 Conclusion
Bibliography
4
5
7
12
22
32
39
-3-
List of Figures
1
2
3
4
5
6
7
8
9
10
Simulator Block Diagram
MTE Routing Diagram
MCE Routing Diagram
R2 and R3 SNR Distribution
Oxygen Absorption SNR Distribution
Path Length Distribution for MTE and MCE Routing
Paths per Station (MTE)
Paths per Station (MCE)
Latency Distribution for MTE and MCE Routing
Power Consumption for MTE and MCE Routing
-4-
1 Introduction
Network connectivity is crucial to moderu computing, and a wireless solution is
necessary to provide mobility. However, the requirements of low power consumption,
high bandwidth, low latency, system scalability, and robust, continuous service are
difficult to achieve simultaneously in a wireless network. Indeed, they are often
conflicting goals, requiring the system designer to make sacrifices in some areas to
achieve acceptable performance in others.
This research is aimed at establishing and investigating the important parameters
in the design of a large-scale wireless computer network based on Spread Spectrum
technology. The use of Spread Spectrum modulation allows the use of code division
multiple access (CDMA), multihop routing, and decentralized control mechanisms,
differentiating this network from most other wireless network systems in common use.
One of the most important factors in mobile computing is power consumption. A
wireless network interface must be able to provide adequate communication while
consuming a minimum of power. This paper introduces the concept of a "Global Power
Pool" which is an aggregate of the energy storage for all of the mobile units in the
network. Since this is a multi-hop network, a transmission by one station consumes
energy not only in the originating station, but also in all those that are called upon to
route the packet to its final destination. Thus, routing strategies designed to minimize
consumed energy must not only take into account the energy expended by the originating
station, but also, that of the entire network as a whole.
Section 2 of this paper covers some of the basic concepts behind multihop CDMA
networks, and communications systems in general. Section 3 covers the operation of the
-5-

simulator, which is used for experimentation, and the models employed. Section 4
presents the results from that experimentation. Section 5 presents conclusions, and areas
for further investigation.
-6-
2 Basic Concepts
2.1 System Characteristics
2.1.1 Multiple Access Mechanisms
Most research on w~lcss networks has concentrated on cellular-based systems.
Such networks necessarily have a significant infrastructure component, and so may not
be optimal in an ad hoc networking environment. Additionally, the dynamics of the
interference and channel capacity are very different from that of peer-to-peer multihop
networks. Studies of peer-to-peer multihop networks have typically not considered
CDMA channel access mechanisms. Many varieties of multiple access protocols have
been investigated, including FDMA, TDMA, CSMA, and ALOHA-like systems. The use
of CDMA allows very simple, local coordination mechanisms. This simplicity
overcomes many of the drawbacks of other multiple access technologies.
Common multiple access systems include frequency division (FDMA) and time-
division (TDMA). FDMA and TDMA are classified as orthogonal multiple access
systems, because different users of the channel may be completely differentiated by a
receiver, without interference. This is done either by tuning to a different frequency
range (FDMA), or by listening only at specified times (TDMA), or a combination
both, as is common with most practical systems.
In CDMA, transmitting stations may send at the same time and on the same
frequency. In order for the receiver to differentiate its signal from the others, a
transmitter must encode its signal with a noise-like (pseudonoise) spreading code. This
increases the bandwidth of the signal by a factor known as the processing gain.
-7-

The receiver correlates the signal it receives (which is composed of all transmitted
signals) with the spreading code used by the desired transmitter. In this process, the
desired signal is despread, back to its original narrow bandwidth, while all interferers and
undesired signals are spread over a wide bandwidth. Then, a conventional narrowband
filter may extract the desired signal. Some of the noise from the unwanted signals,
however, ends up in the same passband as the desired signal, since the codes used for
spreading are not completely orthogonal. Thus, unwanted signals are reduced in power
by a factor equal to the processing gain. This limits the number of users that may share
the channel.
In his revolutionary paper, Shannon [Shan48] proved the famous formula:
[1]
Equation 1 states that the capacity of a channel is proportional to the bandwidth
used, and the logarithm of the signal to noise ratio. In spread spectrum CDMA
communications, the channel is noise limited (i.e. low or negative signal to noise ratio),
with a very wide bandwidth. Since:
limln(1 g--~O
[2]
Using [2], and the proportional relationship between different log bases, and assuming a
fixed bandwidth, equation 1 reduces to
S [3]
-8-
Thus, any decrease in signal to noise ratio leads to a proportional decrease in
channel capacity. This is manifested as a need for increased processing gain. Direct
Sequence Spread Spectrum (DSSS) is one mechanism by which an interference-limited
system may be realized. ~
For example, if 6 dB of final signal to noise ratio is required to successfully
decode a signal, and 20 dB of processing gain is used (i.e. a spreading factor of 100), then
users may be added until the channel signal to noise ratio is as low as -14 dB.2
2.1.2 Decentralized control
One of the major drawbacks of either TDMA or FDMA is the need for the
coordination of slots (frequency or time) to prevent interference. This coordination must
typically be performed on a network-wide basis. The interference rejection properties of
CDMA make this unnecessary. Local coordination is still required to insure that a
station’s own transmitter will not cause collisions with packets destined for it. This
coordination is performed on a localized basis. Stations keep track of the transmit-
receive timing of the intended receiver, and only transmit when the receiver could not.
This mechanism is described in greater detail in [Shep95].
2.1.3 Automatic Power Control
In order to provide for tight control on received signal to noise ratio (SNR),
automatic power control is necessary. This not only minimizes energy spent on
~ See [Rapp96] and lMcDe96] for a more detailed background on spread spectrum modulation and CDMA.2 Wireless Ethernet systems, while they do use spread spectrum modulation, do not use CDMA. Instead,
they use carrier sense multiple access with collision detection, or CSMA/CD, which is a form of TDMA.Only one station may transmit at a time.
-9-
transmissions, since only the minimum power necessary for adequate reception is used,
but also minimizes interference to other stations. Due to the nature of CDMA, reduction
in interference directly corresponds to increases in data rate by reducing the required
processing gain (spreading) necessary.
2.2 Evaluation Metrics
There are many performance metrics involved in wireless data networks that
contribute to the overall quality of service (QoS). QoS is usually defined as some
function of throughput, latency, robustness, and security. All of these, except security,
are considered here. The additional factor of power consumption is proposed as a new
metric of QoS in wireless networks.
Throughput is primarily determined by the available radio channel bandwidth,
which is usually restricted by government regulations. Other determining factors include
the modulation and coding, and in the case of CDMA, the processing gain.
Another important factor is latency, or the time between when a packet enters the
system, and the time when it arrives at its final destination. Latency is determined by the
number of routing hops to a destination, as well as congestion. Bandwidth is also a
factor, as more bandwidth allows for faster transmission through the network.
In mobile networks, power is always of major concern, as most terminals are
operating from batteries, and so have a limited energy supply. In the transmission of
packets, total energy consumption is composed of a number of factors. The most
apparent is the actual transmission energy. Others include digital processing (for
encoding, decoding, routing, and other system functions), baseband and intermediate
- 10-
frequency (IF) processing, and energy dissipated as heat in the power amplifier. The
efficiency of power amplifiers is not 100%, and varies with the actual output power.
Robustness is harder to define. In this work, it is viewed as some measure of the
likelihood of packets reaching their destination. As such, it is a factor that may be traded
off against individual throughput, power, or total system capacity. For example, if better
bit error rates (BER) are required, more processing gain, or stronger error detection and
correction may be used, resulting in lower throughput. Other metrics, such as system
availability, and network behavior under congestion are not considered here.
2.3 Prior Work
The wireless networking system forming the basis for this research was originally
proposed by Timothy Shepard, then at MIT. In his research [Shep95], a simulator,
Prisim, was created. Building upon the concepts in Prisim, a simulator, SSNetSim, has
been developed to aid a system designer in evaluating system performance. SSNetSim,
however, expands greatly on the capabilities ofPrisim. SSNetSim adds the ability to
vary parameters such as station placement, path loss models, power consumption models,
and routing strategies. In addition to reporting SNR and latency values, energy
consumption is also calculated. The capability to report the aforementioned values on a
system-wide average or individual station basis is included. When looking at individual
stations, comparisons based on physical position in the network are ot~en helpful. For
example, it can be seen that both power consumption and SNR are worse for stations near
the middle of the network, and packets passing through the center have a higher latency.
-11-
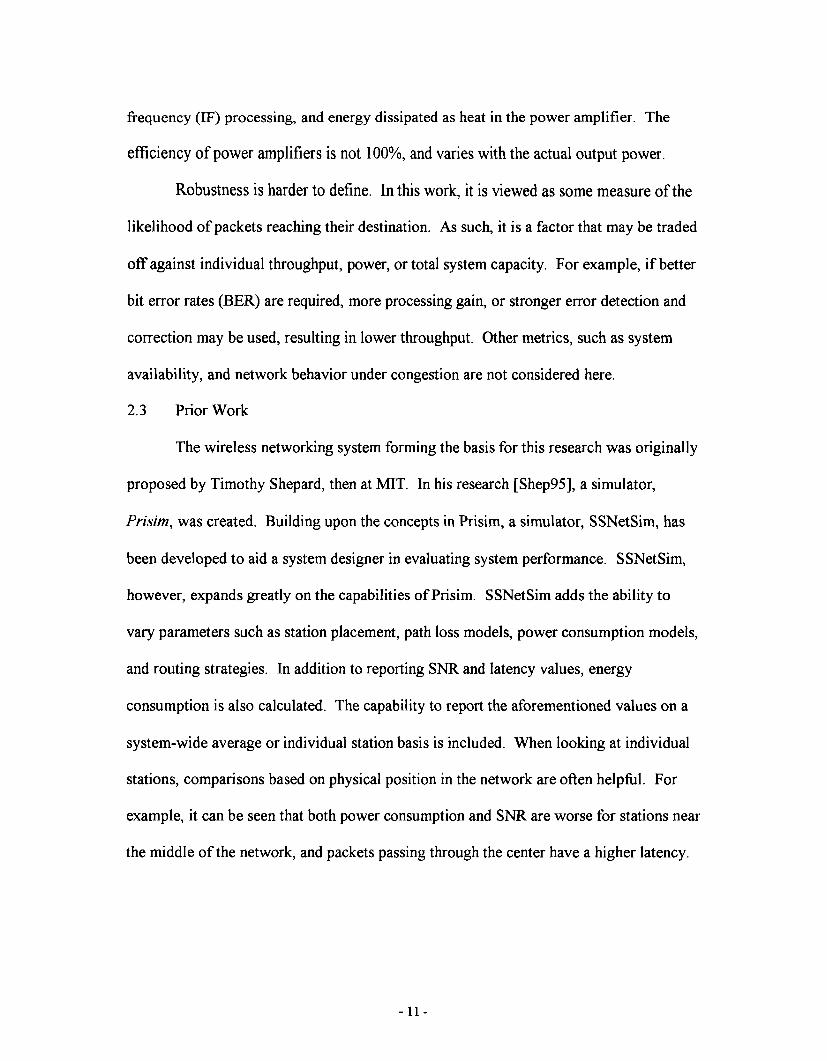
3 SSNetSim
3.1 Architecture
The SSNetSim simulator allows the system designer to model a wireless network
as a whole, taking into account many factors which have not been included in the past,
most notably, path loss and energy consumption models. The goal of the simulator is to
allow a network designer to obtain estimates of the parameters required to make the
system function, such as processing gain, transmitter power, and bandwidth. At the same
time, estimates of system performance under various levels of stress can be obtained in
terms of power consumption (individual and total), latency, and throughput. The
simulator allows the designer to determine the effects that factors such as routing
algorithms would have on the entire system.
StationPlacement
PropagationModeler
Router
TrafficGenerator
-~ Simulator
Figure 1" Simulator Block Diagram
DataAnalysis
- 12-
Figure 1 shows a block diagram of SSNetSim. Each block represents a separate
program, and the arrows represent data transfer between the programs via files. The
station placement program generates randomly placed stations according to the
distribution specified. The propagation modeler takes the station list and computes the
transfer function matrix, based on the specified path-loss model.
The router computes all-pairs shortest paths routing between all stations based on
the specified routing metric. In the case of minimum transmitted energy routing, this
metric is the inverse of the path loss. When minimum consumed energy routing is
selected, the metric is the computed power function, which is in turn a function of path
loss.
The traffic generator creates a list of packets to be transmitted. The model used
can either be nearest neighbors only, all to all, or random. These are further modified by
traffic density factors which determine how often packets are generated.
All of the above files are input to the simulator. SSNetSim proceeds on a time
slot by time slot basis, reporting latencies, SNR, and power consumption as packets
traverse the network. This data is output in text format for later processing.
3.2 Models
3.2.1 Energy consumption
Mobile or portable systems are usually battery powered, and so power
consumption is of primary importance. In communicating with other stations, there are
several power consumption components in addition to the actual transmitted power.
- 13-

Power consumption in all of the electronics (mostly digital) concerned with
encoding and decoding, compression and decompression, formatting, etc. constitutes a
significant drain, especially when extremely low transmitted power is used as in systems
with automatic power control. Also, all baseband and intermediate frequency (IF) signal
processing on the transmit and receive chains is significant.3
Another significant, and often ignored, consumer of power is the inefficiency of
the final power amplifier. In a best case, ideal scenario, the final amplifier may have an
efficiency as high as 70%, but this is not likely. Low cost and small size otten dictate
less than ideal performance. More importantly, maximum efficiency is only possible at
maximum power output.4 As power is reduced, efficiency drops dramatically, down to
near-zero at low power outputs. A Class-AB push-pull linear amplifier was used to
model these effects, as this is a common choice of circuit topology in systems such as
these. The following equations show the actual model used in the simulation.
other models in SSNetSim, it is easily changed.
The total power consumed by a station for a transmission is composed of two
parts. The energy used in the processing of the data necessary prior to transmission,
including compression, encoding, encryption, and all other baseband and intermediate
frequency (IF) processing. The processing energy is modeled as a constant per packet
energy plus a term directly proportional to the length of the packet.
E = k~ + Lk2 [4]
As with all
3 In many cases the power output of the fmal amplifier is significantly less than the power input (making it
more of an attenuator than an amplifier), as in cases where transmitting to a very close recipient.4 More advanced amplifiers which are switched mode may circumvent this to some degree, but are
typically more complicated, and not yet practical at the multi-gigahertz frequencies used in mobilitynetworks. Additionally, these amplifiers are non-linear, and will not work well with modulation systemswhich have envelope variation, without giving back much of their advantages in efficiency. In any case,the simulator may be augmented with any function of efficiency desired.
- 14-
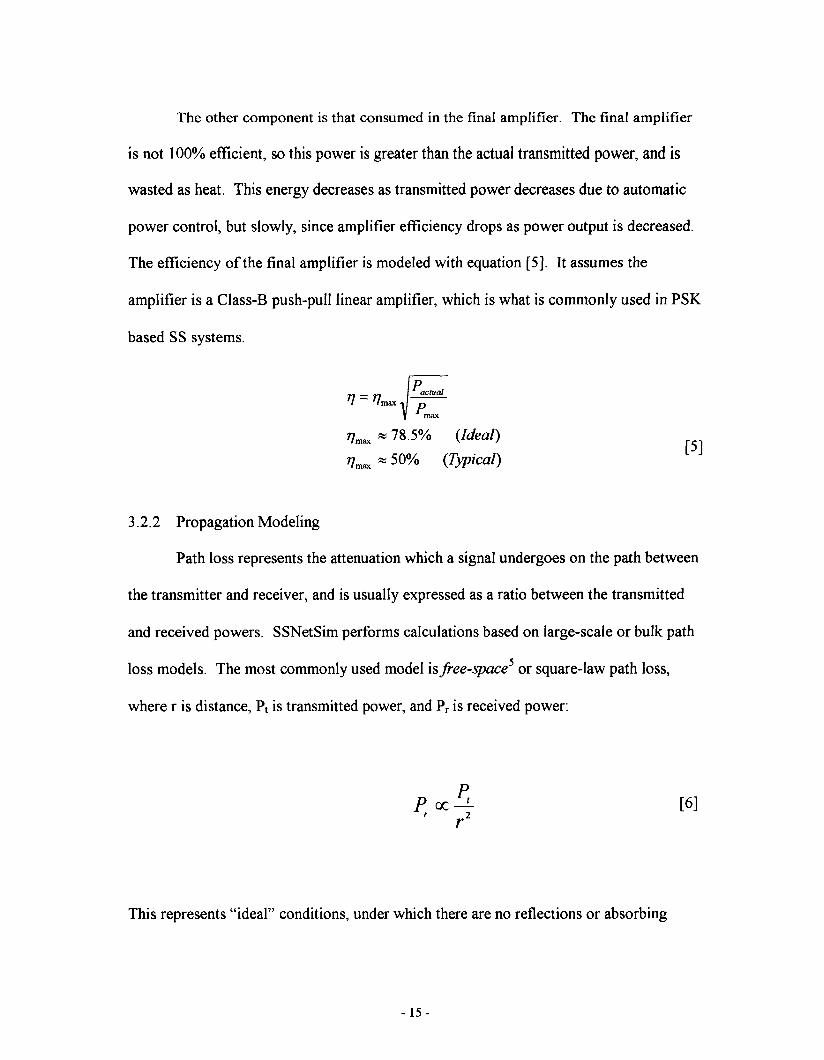
The other component is that consumed in the final amplifier. The final amplifier
is not 100% efficient, so this power is greater than the actual transmitted power, and is
wasted as heat. This energy decreases as transmitted power decreases due to automatic
power control, but slowly, since amplifier efficiency drops as power output is decreased.
The efficiency of the final amplifier is modeled with equation [5]. It assumes the
amplifier is a Class-B push-pull linear amplifier, which is what is commonly used in PSK
based SS systems.
~e~actual
r/,~.~ ~ 78.5% (Ideal)
r/m~ ~ 50% (Typical)[51
3.2.2 Propagation Modeling
Path loss represents the attenuation which a signal undergoes on the path between
the transmitter and receiver, and is usually expressed as a ratio between the transmitted
and received powers. SSNetSim performs calculations based on large-scale or bulk path
loss models. The most commonly used model is free-space~ or square-law path loss,
where r is distance, Pt is transmitted power, and Pr is received power:
/0~ oc e____t [6]/.2
This represents "ideal" conditions, under which there are no reflections or absorbing
- 15-
objects between the transmitter and receiver. While this model is often used, it rarely
reflects actual conditions, especially in urban areas.
In another commonly used path loss model, the received power is proportional to
the transmitted power and inversely proportional to the nth power of the distance between
the transmitter and receiver. N can vary between 1.6 (in-building, line of sight) and 5
higher (urban, shadowed), depending on the environment [Rapp96].
Poc t [7]
As upper microwave (and millimeter wave) frequencies become more popular,
certain frequency-dependent atmospheric effects become relevant. Below approximately
10 GHz, these effects are negligible. Above this point, atmospheric attenuation can vary
greatly, from well under 1 dB/km to as much as 16 dB/km in the Oxygen absorption
bands (i.e. 57 to 63 GHz). Above 100 GHz, absorption may be as high as 50 dB/km.
The appropriate path loss function under these circumstances is:
-- 101° [8]
Where ~z is the attenuation factor in dB/meter. Oxygen absorption models have been
included in SSNetSim
Other propagation models, such as Okumura [Rapp96], Hata [Hata80], and
Longley-Rice [Lon78], etc., were not investigated in this work. However, they could
5 Note that even so-called Line of Sight (LOS) links may not exhibit free-space path loss due to such
phenomena as ground and building reflections (which may be constructive or destructive).
- 16-
very easily be incorporated in SSNetSim, as the appropriate interfaces have already been
added.
3.2.3
routes between stations are chosen.
destination, the higher the latency.
Routing
One of the most important factors in system performance is the method by which
The more hops a packet must take en route to its
Conversely, when there are fewer hops, each must
cover a longer distance, and so the total transmitted power is increased. This results in
additional interference to other stations, necessitating an increase in processing gain and a
reduction in throughput. If throughput decreases, latency increases because each hop
(assuming packet sizes do not change) must take more time.
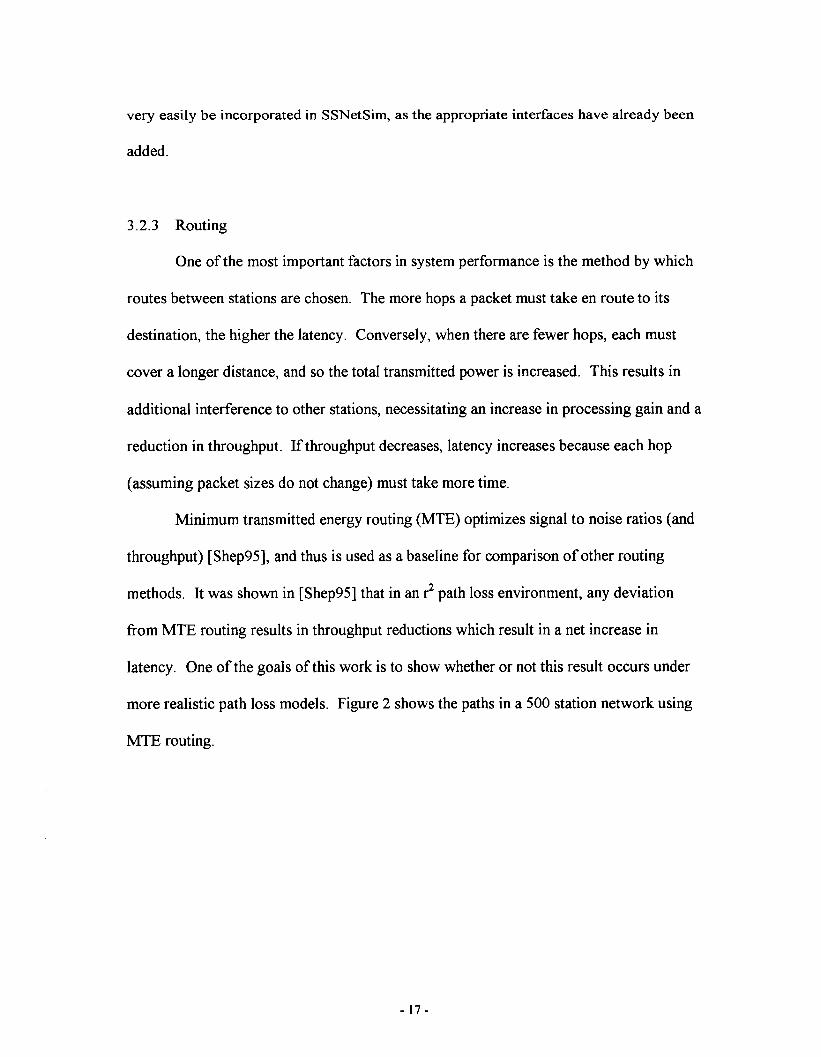
Minimum transmitted energy routing (MTE) optimizes signal to noise ratios (and
throughput) [Shep95], and thus is used as a baseline for comparison of other routing
methods. It was shown in [Shep95] that in an r2 path loss environment, any deviation
from MTE routing results in throughput reductions which result in a net increase in
latency. One of the goals of this work is to show whether or not this result occurs under
more realistic path loss models. Figure 2 shows the paths in a 500 station network using
MTE routing.
- 17-
5000O
~10000
2000O
~oooo ~ ~oo ,~o~oo ~o(~oo
Figure 2: Minimum Transmitted Energy (MTE) Routing (dimensions in meters)
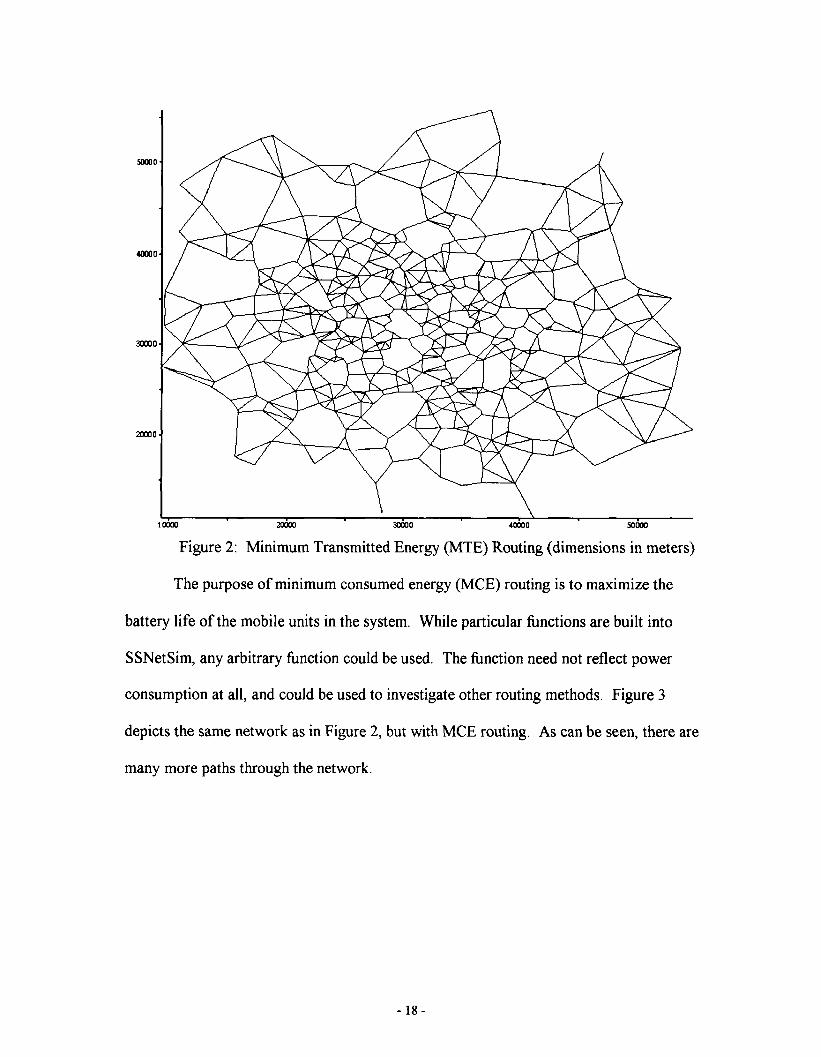
The purpose of minimum consumed energy (MCE) routing is to maximize the
battery life of the mobile units in the system. While particular functions are built into
SSNetSim, any arbitrary function could be used. The function need not reflect power
consumption at all, and could be used to investigate other routing methods. Figure 3
depicts the same network as in Figure 2, but with MCE routing. As can be seen, there are
many more paths through the network.
- 18-
201100
Figure 3: Minimum Consumed Energy (MCE) routing (dimensions in meters)
Each station keeps a routing table with a mapping of the first station to route
packets to for each possible destination. This is computed on a global basis with the All-
pairs Shortest paths algorithm. In an actual network, some means of performing the
routing computation on a distributed base must be used. In addition, a method for
updating the routing tables as the network topology changes due to mobility need to be
developed. These, however, are beyond the scope of this research.
The method of computing the different path costs (weights) used to generate the
routing tables has a great impact on the performance of the system. Various methods
investigated include minimum [transmitted] energy routing, and minimum total
- 19-

[consumed] energy routing. The latter uses a function of transmitter efficiency and of
processing energy to compute a total energy consumed per packet per hop.
Routing tables are computed before the main simulation starts. An all-pairs
shortest paths algorithm is used to find the minimum cost routes between every pair of
stations. The various routing strategies are implemented by using different methods of
computing the path metrics. Minimum transmitted energy routes can be computed by
using the path-loss formulas for the path metrics. Minimum consumed [total] energy
routes can be found by using the energy consumption formulas developed earlier, in
conjunction with the path loss formulas for transmitted power.
Other network topologies may be created by altering the routing metrics. A
cellular network may be created by setting the cost function between stations and their
appropriate cell site to one value, and the cost between stations and other stations infinite.
Fixed stations (for which power consumption may be less of an issue) might have their
power cost function set to zero, thereby encouraging other stations to use it for routing.
3.2.4 Latency
Latency, in this simulation is defined as the time between when a packet is
queued at the originating station until it is completely received at its final destination.
There are many factors which affect latency, including the number of hops a packet must
take en route, as well as congestion at stations along the way.
3.2.5 SNR
- 20 -

The simulator reports the worst raw signal to noise ratio encountered by each
packet on each hop. In order to successfully receive a packet, its despread SNR must be
greater than or equal to a given threshold, which is taken to be 6 dB in this work.6 In
order to provide adequate throughput and avoid many lost packets due to noise, the
system must be designed to ensure that this minimum SNR is met on 99.5%7 of all
packets. Thus, processing gain is chosen such that:
6dB- PG <_ SNR~.~o [9]
From equation [9] it can be seen that an improvement in SNR can directly
translate into an increase in information bandwidth due to the reduced need for
processing gain.
6 The value of 6dB is somewhat arbitrary, and the user of the simulation may choose any number. 6 dB
provides a 10-6 bit error rate (BER) when using BPSK and rote ½ k=9 convolutional coding and Viterbidecoding. More advanced coding methods may require less SNR.7 This number has also been arbitrarily chosen. In order to avoid exponential backoff in TCP, there must be
a very low packet loss rate. Any lost packets are interpreted by TCP as indications of congestion.
-21 -
4 Experimental Results
4.1 Validation
The first validation of SSNetSim was to determine if it could independently
recreate the results of Prisim. As well as giving validation of the results which were
obtained by Prisim, it would also provide a baseline for comparisons for the more
realistic parameters simulated in this research. It has been shown that under comparable
circumstances and parameters, the two simulators give comparable results (within a few
tenths of a dB in most cases). This difference is within reason, when it is considered that
consecutive runs on the same simulator vary by a similar amount,s
The use of pseudo-random patterns for timing the transmissions and receptions of
particular stations was developed by Tim Shepard. In his thesis, they were used to ensure
that a station would never transmit when another might be trying to communicate with it.
Additionally, the timing mechanism was used to make sure a transmitter would not
transmit a high power packet when a nearby station might be listening. In this work, only
the former was used, as it has the greatest effect on the overall results. The second
reduces the number of packets received with very low SNR, but has little overall impact,
as these cases are rare. It is, however, something that would be very useful in a practical
implementation of this system.
mobile networking situation.
Propagation Effects
R3 Path Loss
Standard free-space path loss is unrealistic, and unlikely to be encountered in any
R3 and R4 path loss models are otten more consistent with
o 22 -
reality, causing a station to transmit with a higher power in order to reach the intended
recipient at the desired power level. Conversely, all transmissions from outside of the
immediate area of the receiver are significantly attenuated by the time they reach the
receiver. This results in much less noise being received, with better signal to noise ratios.
This increase in SNR allows the use of less processing gain, and higher throughput.
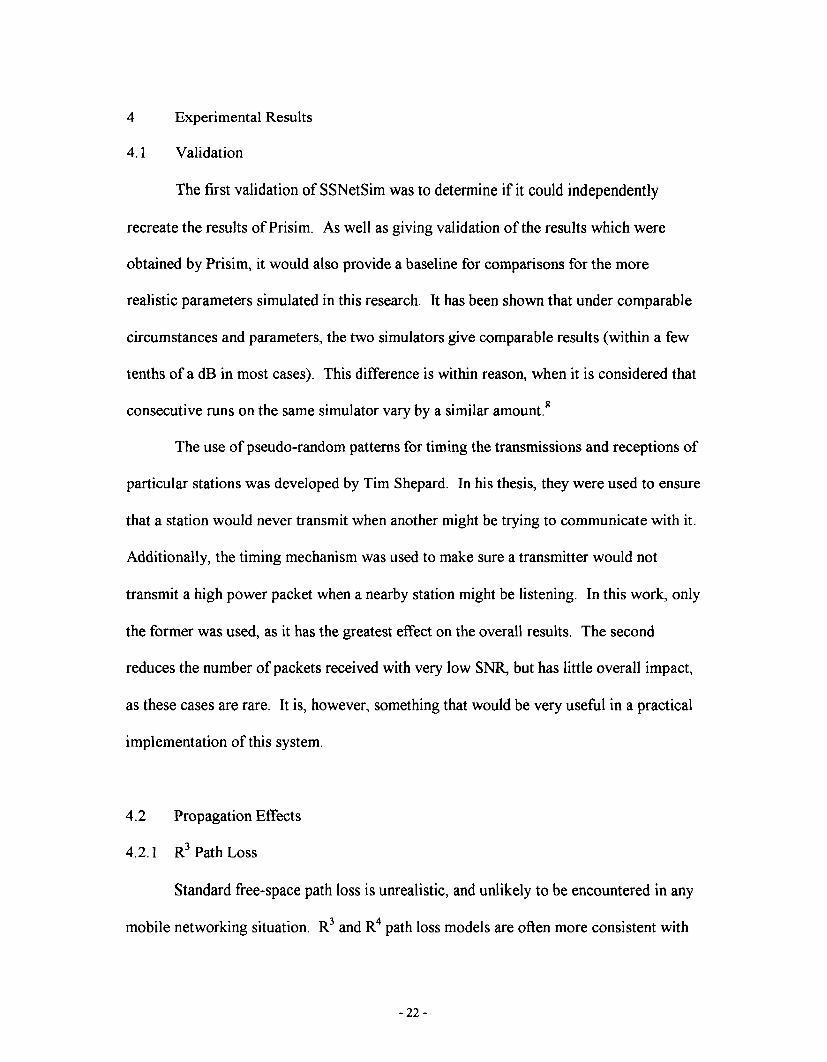
Figure 4 shows the received signal to noise ratio spreads for r2 and r3 path loss
models under worst-case traffic loads.9 All simulations were performed for 500 station
Worst Case SNR Distribution
2500
ooo15oo
1000
500
SNR (dB|
Figure 4: SNR Distribution for r2 and r3
networks with the same geographic distribution, and the same traffic load. As can be
seen from the graphs, the higher exponent path loss results in better SNR ratios. The
Station placement and watfic patterns are generated randomly, and so vary from run to rim.
- 23 -
difference is on the order of 3 dB, or a factor of 2.
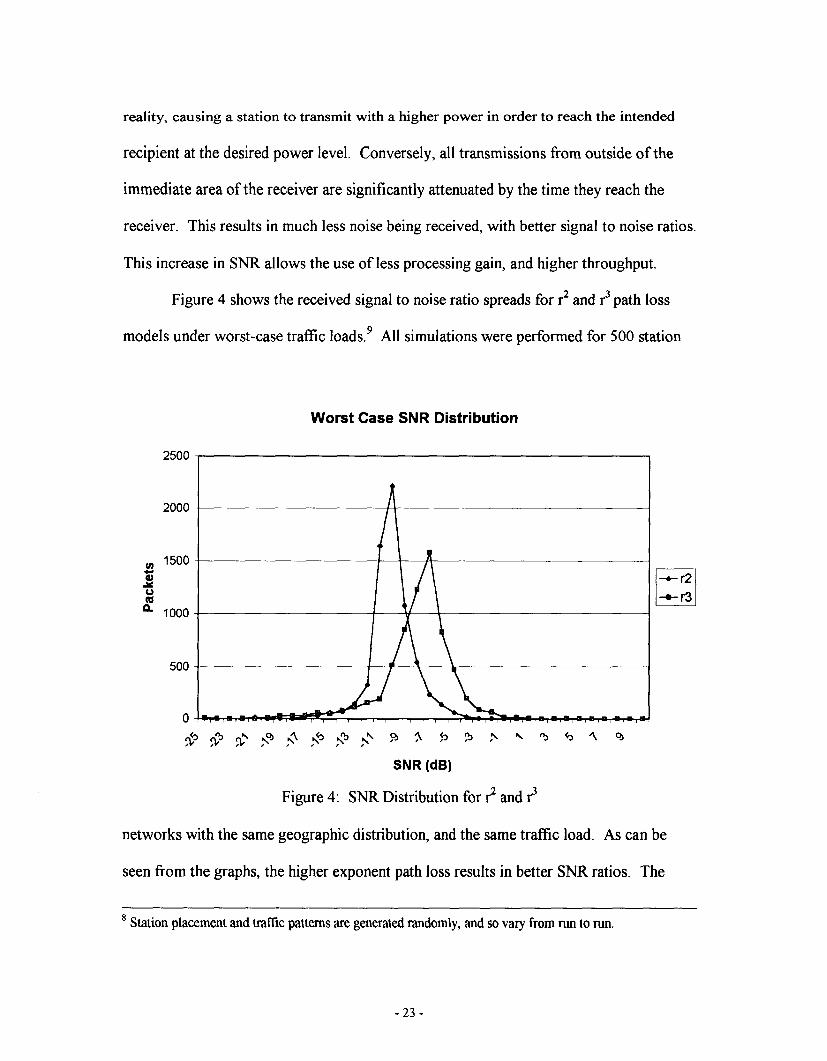
4.2.2 Oxygen Absorption Path Loss
The oxygen absorption bands (one of which exists from 57 to 63 GHz) have some
very interesting properties for wireless communications. Because of the high attenuation
(on the order of 16 dB per kilometer), there is a practical limit to the distance over which
communication is possible. This attenuation can be used to the advantage of the system,
however. By significantly attenuating distant (unwanted) signals, improved signal
noise ratios are possible, giving increased throughput.
A 300 station network covering one square kilometer was simulated using MTE
routing, with and without oxygen absorption. It should be noted that as the distance of
the path increases, the 16 dB/km attenuation of the 60GHz band starts to far outweigh the
normal path loss. This near-linear path loss makes oxygen absorption MTE or MCE
routing useless. 10 This occurs at distances which would be impractical to communicate,
however, due to the need for high power.
As can be seen in Figure 5, the SNR distribution for the oxygen absorption
network compares favorably with the standard ones, even though the maximum
attenuation would only be about 22 dB (across the whole network). On average, the SNR
is improved by about 4 dB, resulting in a 2.5 times improvement in throughput.
9 Worst case tmttic for SNR occurs when each station always has packets queued for each of its nearest
neighbors that it transmits to directly. This results in the maximum number of stations transmitting at anyone time.10 Since the attenuation is linear in dislance, minimum energy becomes a straight line (direct path).
- 24 -

3000
2500
2000
15oo
1000
500
0-2O
4.3
Oxygen Absorption
-15 -10 -5 0 5 10
Figure 5:
Latency and Routing
SNR
SNR Comparison at 60 GHz
Latency is directly affected by routing methods and the size of the network. It is
also indirectly affected by throughput. The first two factors determine the number of
hops that a packet must take en route to its destination, and the last determines how long
each hop will take. Thus, any attempt to minimize latency must consider all three factors.
For example, minimizing the number of hops by transmitting directly, rather than using
the routing system will result in one hop latency, but nearly zero throughput due to the
tremendous amounts of channel noise generated by such a strategy.
Routing is determined entirely by the metric used to determine path costs. For
this work, a minimum consumed energy (MCE) function was used. This is shown
have better latency properties than a minimum transmitted energy (MTE) metric, as used
- 25 -
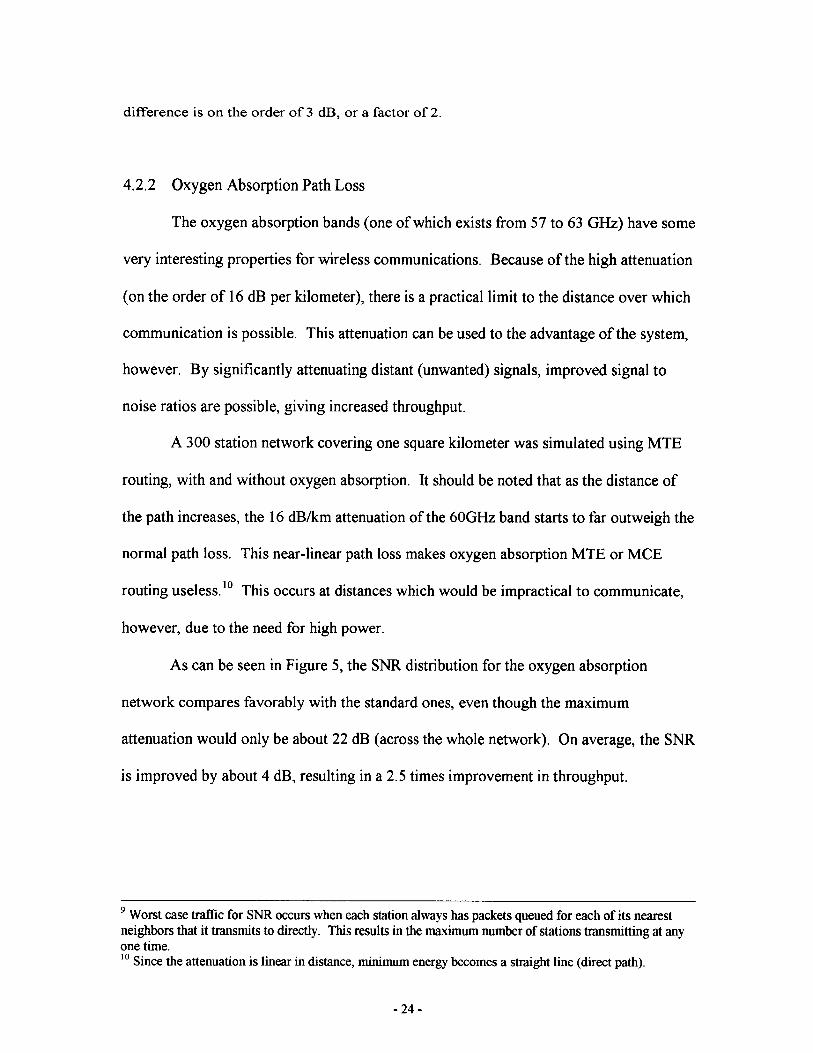
Path Length Distribution
20000
16000
12000
8000
4000
0 10 20 30 40 50 60
Hops
Figure 6: Path Length Distribution
in [Shep95]. The minimum transmitted energy routing method does not produce useful
results under r2 path loss, only for r3 and higher. ~ In r2, all routes become direct.
An r3 environment was simulated, under both MTE and MCE routing in a 500
station network. MCE routing was found to have greatly improved performance in nearly
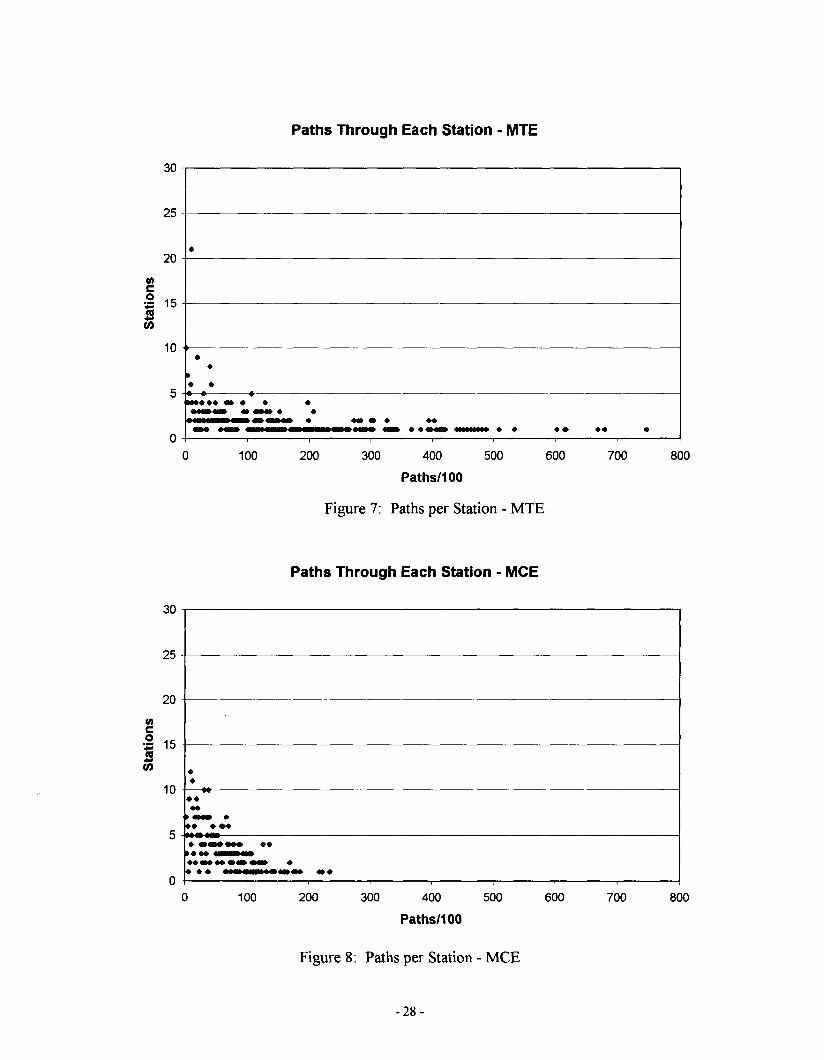
all respects. Number of hops per packet was reduced, in both the average and the worst
cases (see Figure 6). The number of paths that pass through a particular station was also
significantly improved for the worst case stations. More stations share in the traffic load,
alleviating congestion. This can be seen in comparing Figures 7 (MTE) and 8 (MCE).
~ Since the energy consumption model is a function of the square root of the transmitted power, which is inturn a function of the square of distance in r2 path loss, energy consumption becomes linear with distance.Since the shortest distance between any two points is a straight line, minimum consumed energy becomesdirect, zero-hop paths.
- 26 -
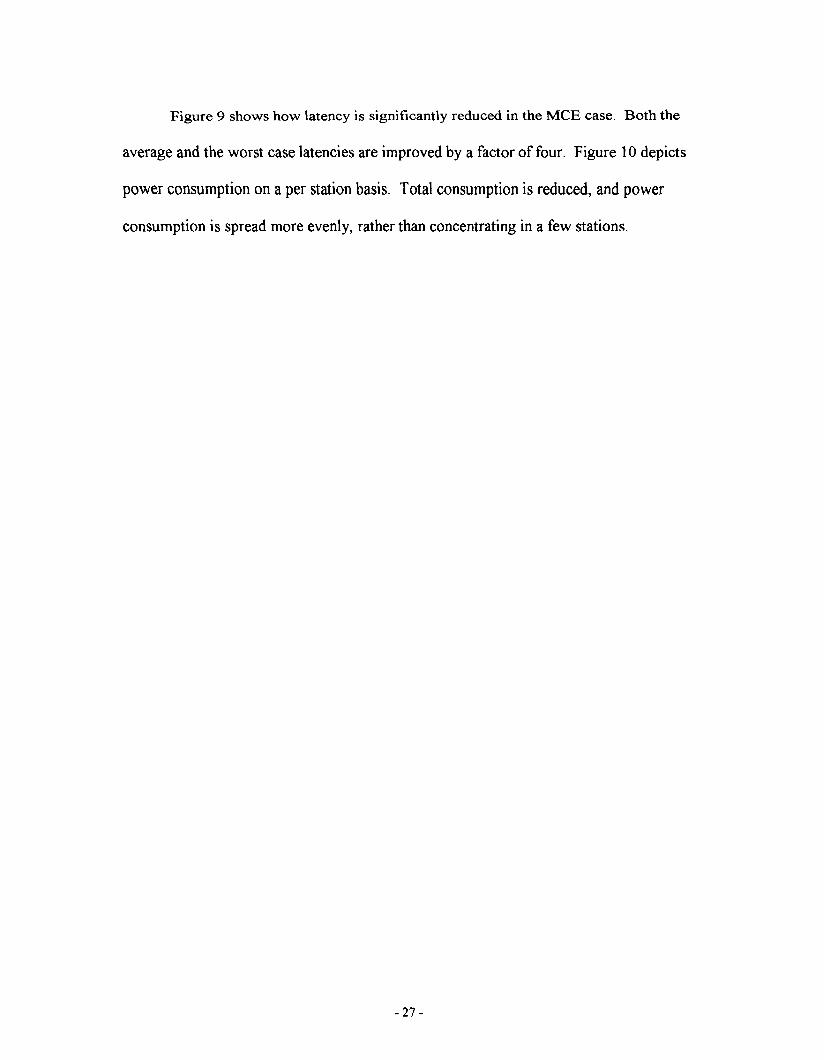
Figure 9 shows how latency is significantly reduced in the MCE case. Both the
average and the worst case latencies are improved by a factor of four. Figure 10 depicts
power consumption on a per station basis. Total consumption is reduced, and power
consumption is spread more evenly, rather than concentrating in a few stations.
- 27 -
30
Paths Through Each Station - MTE
c-
25
2O
15
10
100 200 300 400 500 600 700
Paths/100
Figure 7: Paths per Station - MTE
8OO
Paths Through Each Station - MCE
3o
25
2o
e-
10
100 200 300 400 500 600 700
Paths/100
800
Figure 8: Paths per Station - MCE
- 28 -

1200
1000
8OO
6OO
4OO
2OO
Latency Histogram
2000 4000 6000 8000
Time
Figure 9: Histogram of Packet Latencies
10000
I~MTEMCE
8o
Energy Consumption Distribution
70
=o 40
20
10
70 75 80 85
Energy (dB scale, Arti11¢lal Units)
Figure 10: Energy Consumption per Station
- 29 -
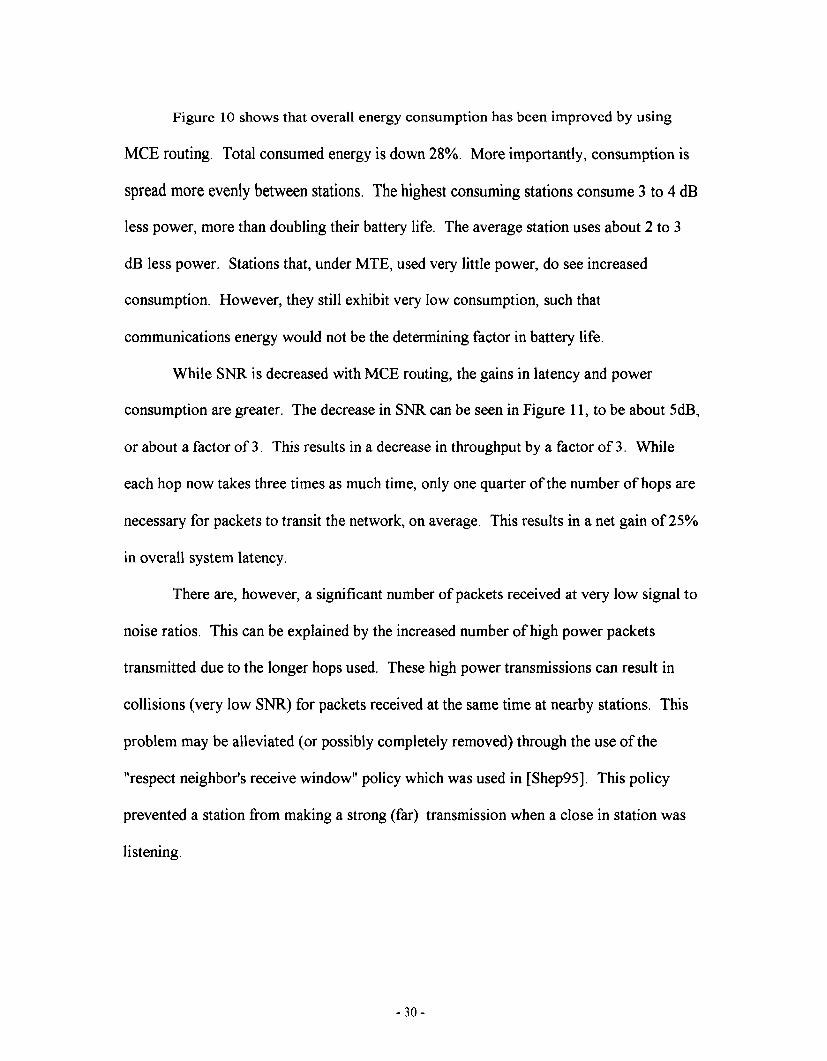
Figure 10 shows that overall energy consumption has been improved by using
MCE routing. Total consumed energy is down 28%. More importantly, consumption is
spread more evenly between stations. The highest consuming stations consume 3 to 4 dB
less power, more than doubling their battery life. The average station uses about 2 to 3
dB less power. Stations that, under MTE, used very little power, do see increased
consumption. However, they still exhibit very low consumption, such that
communications energy would not be the determining factor in battery life.
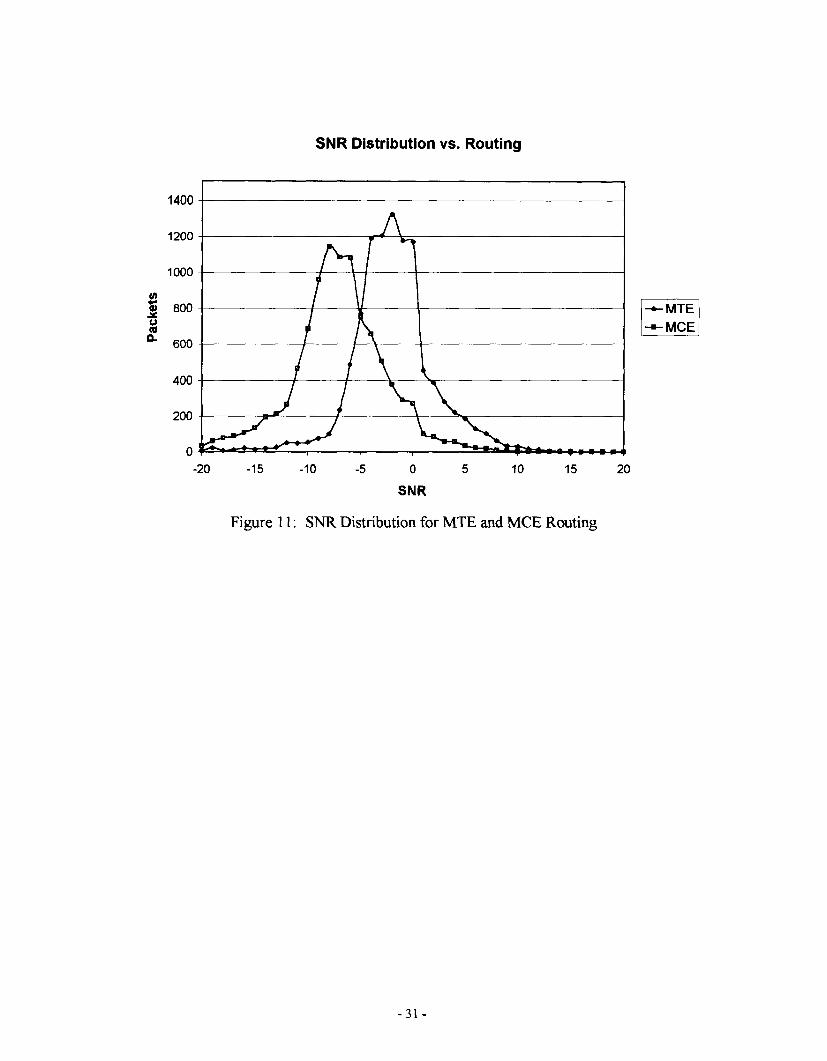
While SNR is decreased with MCE routing, the gains in latency and power
consumption are greater. The decrease in SNR can be seen in Figure 11, to be about 5dB,
or about a factor of 3. This results in a decrease in throughput by a factor of 3. While
each hop now takes three times as much time, only one quarter of the number of hops are
necessary for packets to transit the network, on average. This results in a net gain of 25%
in overall system latency.
There are, however, a significant number of packets received at very low signal to
noise ratios. This can be explained by the increased number of high power packets
transmitted due to the longer hops used. These high power transmissions can result in
collisions (very low SNR) for packets received at the same time at nearby stations. This
problem may be alleviated (or possibly completely removed) through the use of the
"respect neighbor’s receive window" policy which was used in [Shep95]. This policy
prevented a station from making a strong (far) transmission when a close in station was
listening.
30-
SNR Distribution vs. Routing
1400
1200
1000
800
60O
40O
2O0
0
/---MCE/
-2O -15 -10 -5 0 5 10 15 20
SNR
Figure 11’ SNR Distribution for MTE and MCE Routing
-31 -

5 Conclusions and Future Work
5.1 Summary of Results
Significant progress towards determining the relevant performance factors in
CDMA multihop networks has been made. The data presented, and the simulations
performed, show that wireless networks of this type are indeed viable.
Under realistic conditions, such as higher order propagation models, it has been
shown that system capacity is actually better than under free-space path loss. This is due
to the greatly increased attenuation of interference from distant stations. However, this
gain does not come without cost. More transmission power is required so that the
receiver will be able to successfully receive the packet.
The latency problems which are inherent in multihop routing networks may be
somewhat alleviated through the use of alternative routing metrics. By using a minimum
consumed energy (MCE) metric, rather than minimum transmitted energy (MTE), several
benefits are gained. The average length of a path from source to destination is cut
approximately in half, as are the longest paths traversing the network. In the 500 station
network simulated, the average path length decreased from 20 to 10 hops, and the longest
paths decreased from 58 to 30 hops.
Additionally, for the heavily loaded stations, the number of paths passing through
that station is greatly decreased. These paths are more equally shared between the
stations of the network. Under MTE routing, many stations have more than 25,000, and
as many as 75,000 paths passing through them (out of a total of 250,000 paths). MCE
routing is more equally balanced, resulting in no stations carrying more than 25,000
-32-
paths, and all carrying a reduced number of paths. This results in greater sharing of the
traffic load, and thus better sharing of the power resources of each station.
These improvements in the latency properties of the network do not come without
some cost. Since the average hop distance has increased, the average transmitted energy
has increased, and thus signal to noise ratios (SNR) have, in general, decreased. Unlike
the case investigated in [Shep95], which assumed free-space path loss, this loss in
bandwidth is minor in comparison, and is more than offset by the improvement in latency
and congestion properties of the network.
The original aim in the use of MCE instead of MTE routing was to reduce power
consumption, and improve battery life of mobile stations. In the network simulated, total
power consumption was reduced by nearly 20%. This number, however, does not reflect
the true gains that the system realizes. The stations which consume the most energy, due
to their routing of many packets, achieve a consumed power decrease of around 50%. As
in the case of routed packets, the power load is more equally shared among the stations of
the network.
5.2 Future Work
This work, in part, grew out of the "Future Work" section of Timothy Shepard’s
thesis, and so has covered, at least in part, many of the avenues of inquiry suggested
therein. In the course of this research, however, many new variables have been
uncovered, the investigation of which might lead to a better understanding of these
networks.
- 33 -
5.2.1 Directional Antennas
One major area for future inquiry listed in [Shep95] remains unexplored -
directional antennas. By narrowing the field of reception significantly, interference is
reduced. As was shown earlier, interference reduction directly translates to improved
throughput. The use of adaptive antennas has been shown to improve system capacity in
cellular CDMA systems, and an investigation of their use in decentralized multi-hop
CDMA networks might yield similar results.
5.2.2 Time-varying propagation modeling
The propagation models investigated in this work all assume a static channel. As
such, bulk or large-scale path loss is considered. Time varying channel phenomena, such
as fading and multipath, have not been considered other than in their effect on the overall,
time-invariant propagation models used. The use of direct sequence spread spectrum
does mitigate the effects of multipath somewhat, but not completely. Additionally, such
effects as shadowing, interference (possibly malicious), and mobility would have to
considered in any practical system design. The effects on quality of service, especially
robustness, would be of great interest.
5.2.3 Multiple simultaneous reception and/or transmission
In this work, it was assumed that a station could only transmit to one other at a
time, but could receive multiple packets at the same time. Expanding the transmission
capabilities might decrease latency, but SNR ratios would likely become worse, leading
- 34-

to lower throughput. Automatic power control might be significantly more difficult, as
the separate transmissions might each require different power levels.
Receiving multiple packets at the same time requires duplication of much of the
baseband receiver hardware. Appropriate spreading code selection is also necessary, and
is covered in more detail below.
5.2.4 Multiuser detection
Throughput is limited by interference from other stations. If the transmissions
from stronger, but undesired, stations can be decoded, then their contribution to the total
noise may be subtracted from the received signal. This would improve the SNR, and
possibly allow the decoding of signals for which it was previously not possible. This
approach, known as multiuser detection, has been investigated, usually in cellular
(centralized) systems. It requires tremendous computer processing power, which is
function of the number of interfering signals. Multiuser detection may be of limited
value in a decentralized multi-hop system because there are many interfering signals, and
most if not all are weaker than the desired signal, due to the routing system used. Thus,
any gain in SNR would be small.
5.2.5 Spreading Code Allocation
In this work it was assumed that spreading codes were used that allowed all
transmissions to be differentiated. In practice, there is some difficulty in assuring this.
Some common methods of choosing the code to be used are receiver-centric, transmitter-
centric, and transmitter-receiver pairing.
- 35 -
In the transmitter-centric mode, any time a station transmits, it uses the same
code. Each station has a unique code. When receiving, a station must "listen" to all
codes assigned to stations which may be transmitting to it. This is often as many as five
or six, and results in considerable duplication in receiver hardware in order to listen to all
the codes. There is no possibility, however, of two stations transmitting with the same
code at the same time, causing high interference levels.
In receiver-centric mode, each station is assigned a code which it uses to receive.
When a station transmits, it uses the code of the intended recipient. Thus, a receiver only
has to listen to a single code. The problem with this system lies in the fact that two
stations may be transmitting to a third station at the same time, thus causing a collision,
and the loss of one or even all of the packets.
There are many varieties of multicode systems. One which shows promise uses a
receiver-centric system. The transmitter uses the receiver’s code (which the receiver is
"listening to"), and sends a request to communicate. This signals both stations to move
to a second code, which is unique to the pair, for the duration of the communication.
This is, in some ways, connection oriented, or virtual circuit-like, and is no longer pure
CDMA. The problem of multiple stations transmitting the originating packet to the
receiver at the same time is reduced, but not eliminated. A new limitation, that of being
able to communicate with only one other station at a time, is introduced, unless receiver
circuitry is duplicated, as in the transmitter-centric case.
In any system with finite processing gain, there is a finite number of acceptable
spreading codes. As more codes are required, those with poorer self- or cross- correlation
properties must be used, leading to system performance degradation. Some means of
- 36 -
code-reuse based on spatial separation would probably be necessary in a very large scale
system.
5.2.6 Infrastructure
In many wireless networks, there may be no need for connection to a wired
network, such as the internet. Such networks might include workgroups of wearable
computers collaborating in the field. Most applications envisioned, however, require
some mechanism for connection to a wired network. In those cases, some form of wired
infrastructure is employed.
It has been shown that as the multihop networks described previously scale to
larger numbers of nodes, latency becomes a big problem due to the large number of hops
necessary. To mitigate these problems, wired infrastructure, such as base stations could
be deployed. These bases might be interconnected by high-speed wired links, and so
could be used to bypass the long network delays of the wireless network for packets
which have to traverse long distances. These routes would basically be like
"wormholes." They could be simulated in a limited manner by SSNetSim, simply by
setting the cost to route from one to another equal to zero. Packets would then
automatically be routed through the wormholes when it would be advantageous
according to the cost functions used.
5.2.7 Variable Processing Gain
The capability of varying system processing gain, and conversely, throughput, to
match channel conditions would be very advantageous. As seen from the simulation
- 37-
results, system SNR levels vary greatly. Such factors as system load, propagation
models, and even station location within the system result in SNR differences of 10 dB or
more. A system during off-peak times might have almost no interference. In these
situations, it would be advantageous to utilize less processing gain, and realize higher
throughputs. Varying the actual spreading sequences might not fit well within the
hardware constraints of low cost transceivers, but the same effect may be gained from
varying the coding rate of the error correction codes used [Vite79]. Convolutional codes
with puncturing would be ideal for this. The added benefit of increased coding gain with
lower rate codes would also improve reliability under adverse conditions.
5.3 Conclusion
This research has shown that CDMA multihop wireless networks are viable
systems for providing mobile connectivity. Significant progress towards increasing
capacity and decreasing latency and power consumption has been made. More work,
however, is necessary on some of the practical aspects of such systems.
-38 -
Bibliography
[Abra93] Norman Abramson, Ed. Multiple Access Communications: Foundations
for Emerging Technologies. IEEE Press, 1993.
[Cost59] J. P. Costas. Poisson, Shannon, and the Radio Amateur. Proceedings of
the IRE, 47(12):2058-2068, December, 1959.
[Hata80] Hata, Masuharu. Empirical Formulas for Propagation Loss in Land
Mobile Radio Services. IEEE Transaction on Vehicular Technology,
29(3):317-325, August 1980
[Hui84] Joseph Y. N. Hui. Throughput Analysis for Code Division Multiple
Accessing of the Spread Spectrum Channel. 1EEE Journal on Selected
Areas in Communications, 2(4):482-486, July 1984.
[Karn91 ] Phil Karn. Spectral Efficiency Considerations for Packet Radio. ARRL
10th Computer Networking Conference, pages 62-66. ARRL, 1991.
[Lon78] Longley, A.G.
April 1978.
Radio Propagation in Urban Areas. OT Report, p. 78-144,
-39-
[McDe96] Tom McDermott. Wireless Digital Communications: Design and Theory.
Tucson Amateur Packet Radio Corporation, 1996.
[Rapp96] Theodore S. Rappaport. Wireless Communications: Principles and
Practice. Prentice Hall, 1996.
[SW63] Claude E. Shannon and Warren Weaver. The mathematical theory of
communication. University of Illinois Press, 1963.
[Shep95] Timothy Jason Shepard. Decentralized Channel Management in Scalable
Multihop Spread-Spectrum Packet Radio Networks. Technical Report
MIT/LCS/TR-670, Massachusetts Institute of Technology Laboratory for
Computer Science, July 1995. Ph.D. Thesis.
[Purs87] Michael B. Pursley. The Role of Spread Spectrum in Packet Radio
Networks. Proceedings of the IEEE, 75(1): 116-134, January 1987.
[Vite79] Andrew J. Viterbi. Spread Spectrum Communications - Myths and
Realities. 1EEE Communications Magazine, 17(3): 11-18, May 1979.
[Vite91] Andrew J. Viterbi. Wireless Digital Communication; A View Based on
Three Lessons Learned. IEEE Communications Magazine, 29(9):33-36,
September 1991.
- 40 -


![Distributed Network Function Virtualization€¦ · Validate fabric resiliency with WAN latency [0-40ms] Control path latency Big Cloud Fabric out-of-band management network for physical](https://img.pdfslide.us/doc/110x75/5f050d797e708231d41105ae/distributed-network-function-virtualization-validate-fabric-resiliency-with-wan.jpg)