Embed Size (px)
Citation preview
© 2019 Visual BI Solutions, Inc. All rights reserved. www.visualbi.com
Power BI Governance Accelerator
Keys to Success in Planning a Power BI Deployment
www.visualbi.com
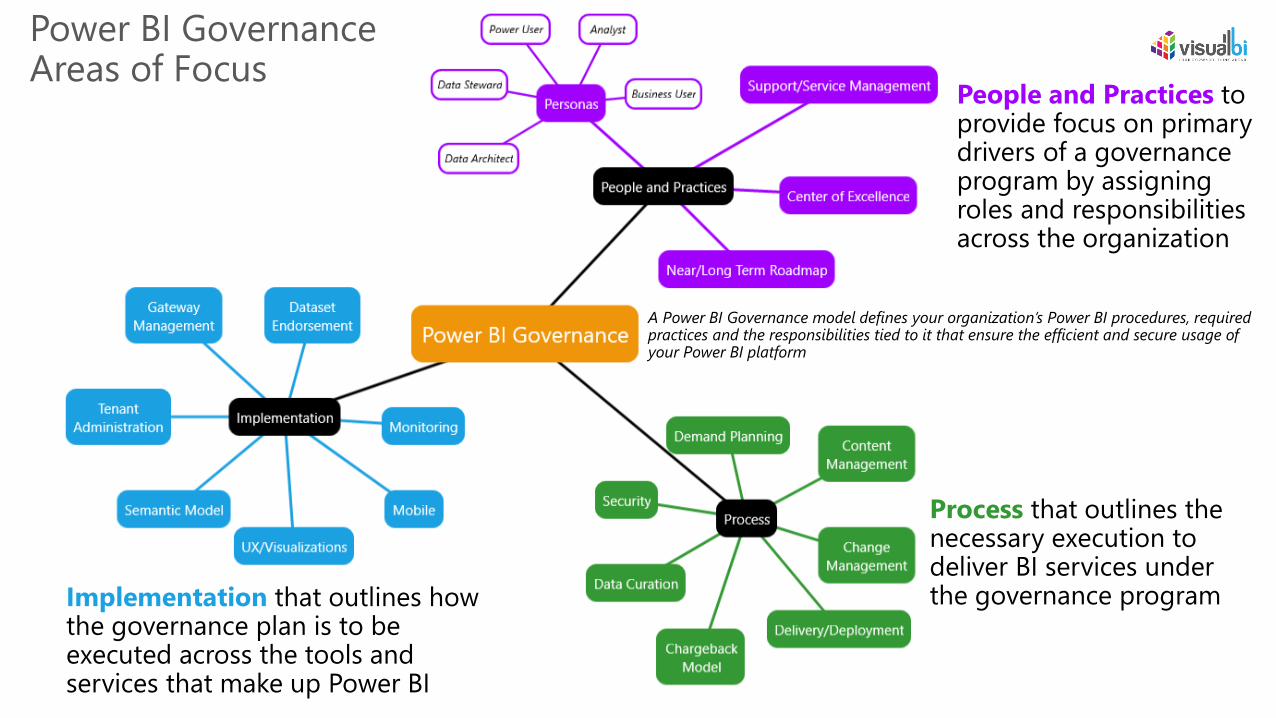
Power BI Governance Areas of Focus
People and Practices to provide focus on primary drivers of a governance program by assigning roles and responsibilities across the organization
Implementation that outlines how the governance plan is to be executed across the tools and services that make up Power BI
Process that outlines the necessary execution to deliver BI services under the governance program
A Power BI Governance model defines your organization’s Power BI procedures, required practices and the responsibilities tied to it that ensure the efficient and secure usage of your Power BI platform
Power BI Governance model Scope and Goals• Vision of Power BI usage and an outline of its Roadmap
• Strategic and operational Governance policies (business + functional)
• Ensure the ability to secure your data + provide confidence to users
• Establishing rules for your organization’s (BI) data usage
• Establishing how compliance data is handled in Power BI
• Reducing risks and lowering the overall cost of ownership of Power BI
• Improving communications between BI teams members
• Permissions model, access management, information security strategy
• Process for provisioning new Power BI reports
• Power BI support and training
© 2019 Visual BI Solutions, Inc. All rights reserved. www.visualbi.com
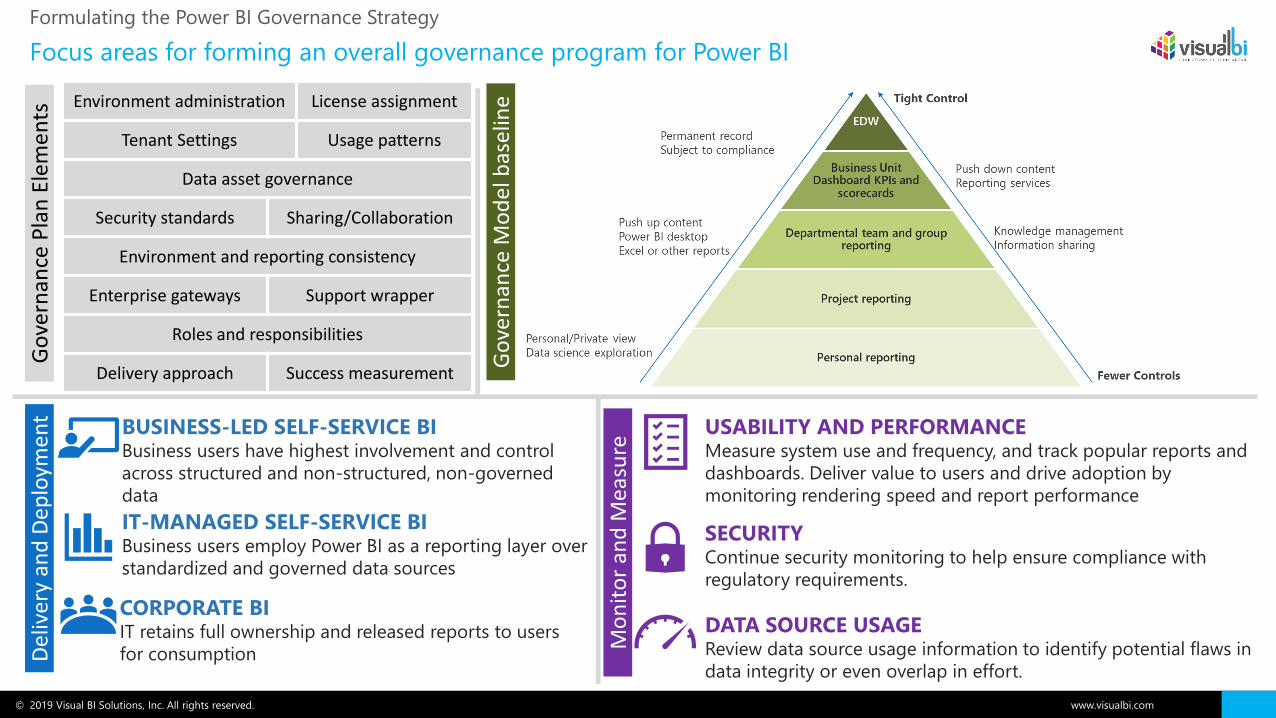
Focus areas for forming an overall governance program for Power BI
Formulating the Power BI Governance Strategy
Environment administration License assignment
Tenant Settings Usage patterns
Data asset governance
Security standards Sharing/Collaboration
Environment and reporting consistency
Enterprise gateways Support wrapper
Roles and responsibilities
Delivery approach Success measurement
BUSINESS-LED SELF-SERVICE BIBusiness users have highest involvement and control
across structured and non-structured, non-governed
data
IT-MANAGED SELF-SERVICE BIBusiness users employ Power BI as a reporting layer over
standardized and governed data sources
CORPORATE BIIT retains full ownership and released reports to users
for consumption
USABILITY AND PERFORMANCEMeasure system use and frequency, and track popular reports and
dashboards. Deliver value to users and drive adoption by
monitoring rendering speed and report performance
SECURITYContinue security monitoring to help ensure compliance with
regulatory requirements.
DATA SOURCE USAGEReview data source usage information to identify potential flaws in
data integrity or even overlap in effort.
Del
iver
y an
d D
eplo
ymen
t
Mo
nit
or
and
Mea
sure
Go
vern
ance
Mo
del
bas
elin
e
Go
vern
ance
Pla
n E
lem
en
ts
© 2019 Visual BI Solutions, Inc. All rights reserved. www.visualbi.com 5
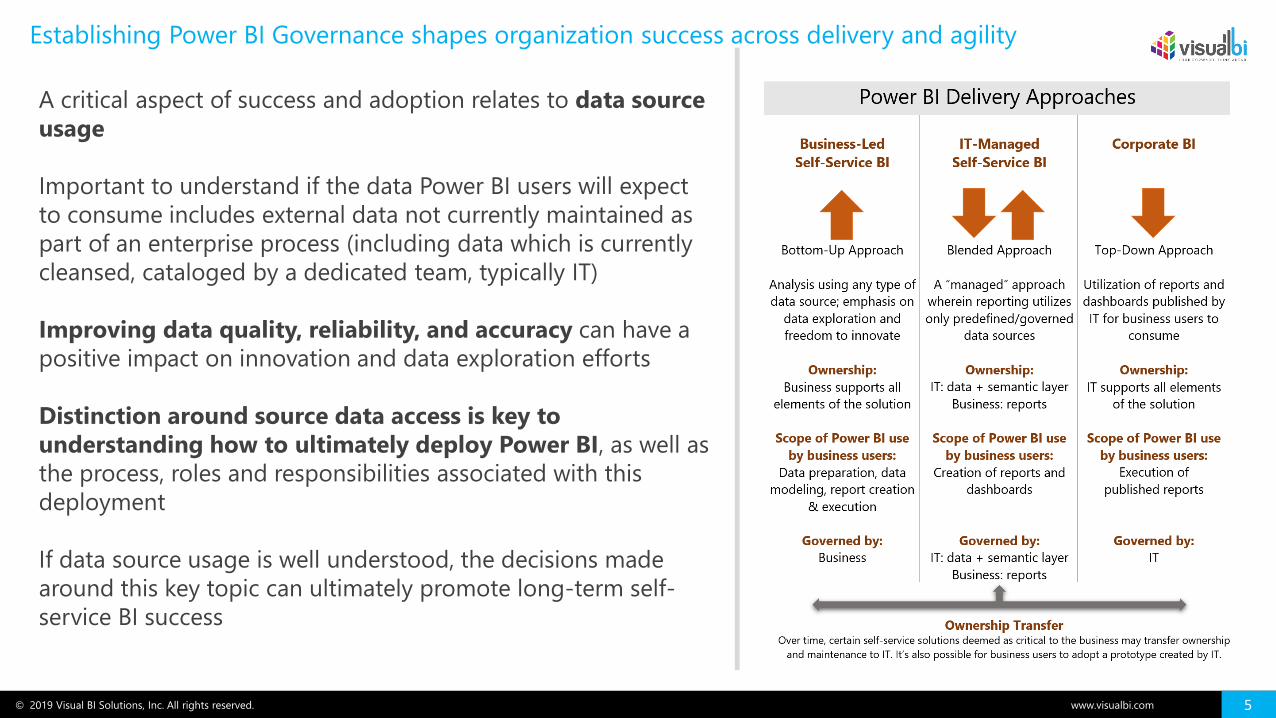
Establishing Power BI Governance shapes organization success across delivery and agility
A critical aspect of success and adoption relates to data source
usage
Important to understand if the data Power BI users will expect
to consume includes external data not currently maintained as
part of an enterprise process (including data which is currently
cleansed, cataloged by a dedicated team, typically IT)
Improving data quality, reliability, and accuracy can have a
positive impact on innovation and data exploration efforts
Distinction around source data access is key to
understanding how to ultimately deploy Power BI, as well as
the process, roles and responsibilities associated with this
deployment
If data source usage is well understood, the decisions made
around this key topic can ultimately promote long-term self-
service BI success
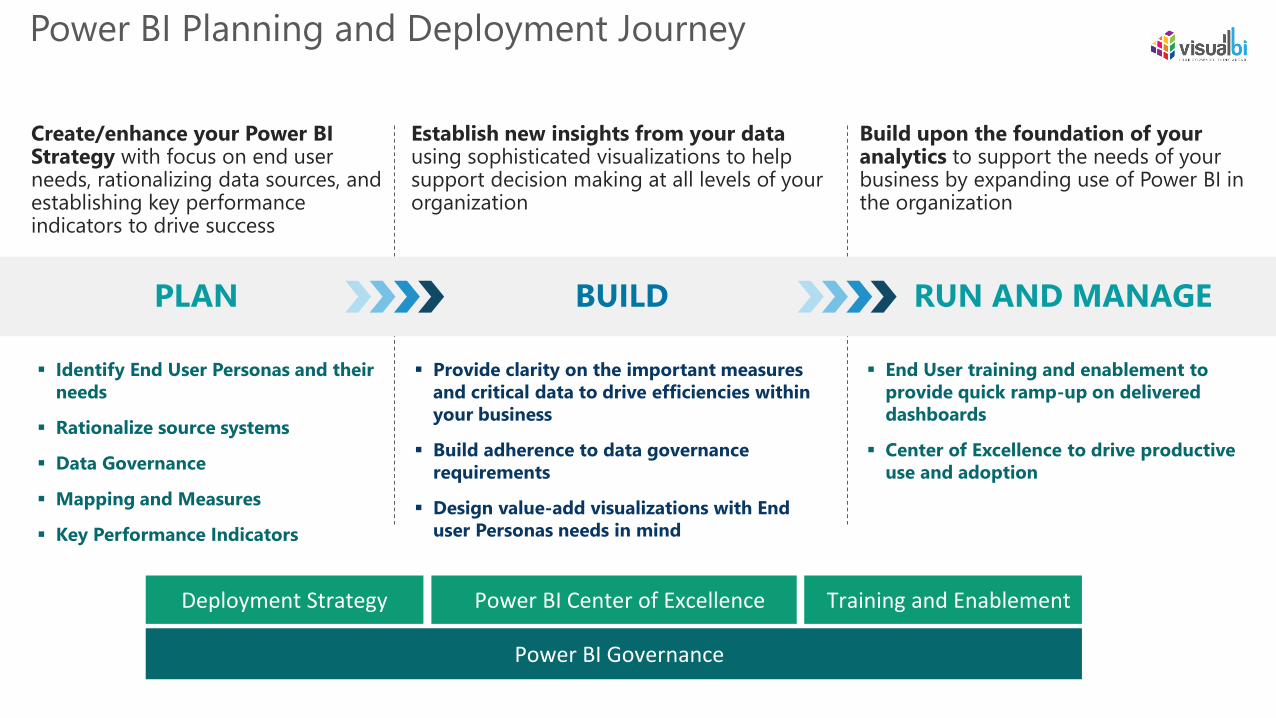
Power BI Planning and Deployment Journey
Deployment Strategy Power BI Center of Excellence Training and Enablement
Power BI Governance
PLAN
Create/enhance your Power BI Strategy with focus on end user needs, rationalizing data sources, and establishing key performance indicators to drive success
BUILD
Establish new insights from your data using sophisticated visualizations to help support decision making at all levels of your organization
RUN AND MANAGE
Build upon the foundation of your analytics to support the needs of your business by expanding use of Power BI in the organization
▪ Identify End User Personas and their
needs
▪ Rationalize source systems
▪ Data Governance
▪ Mapping and Measures
▪ Key Performance Indicators
▪ Provide clarity on the important measures
and critical data to drive efficiencies within
your business
▪ Build adherence to data governance
requirements
▪ Design value-add visualizations with End
user Personas needs in mind
▪ End User training and enablement to
provide quick ramp-up on delivered
dashboards
▪ Center of Excellence to drive productive
use and adoption
© 2019 Visual BI Solutions, Inc. All rights reserved. www.visualbi.com
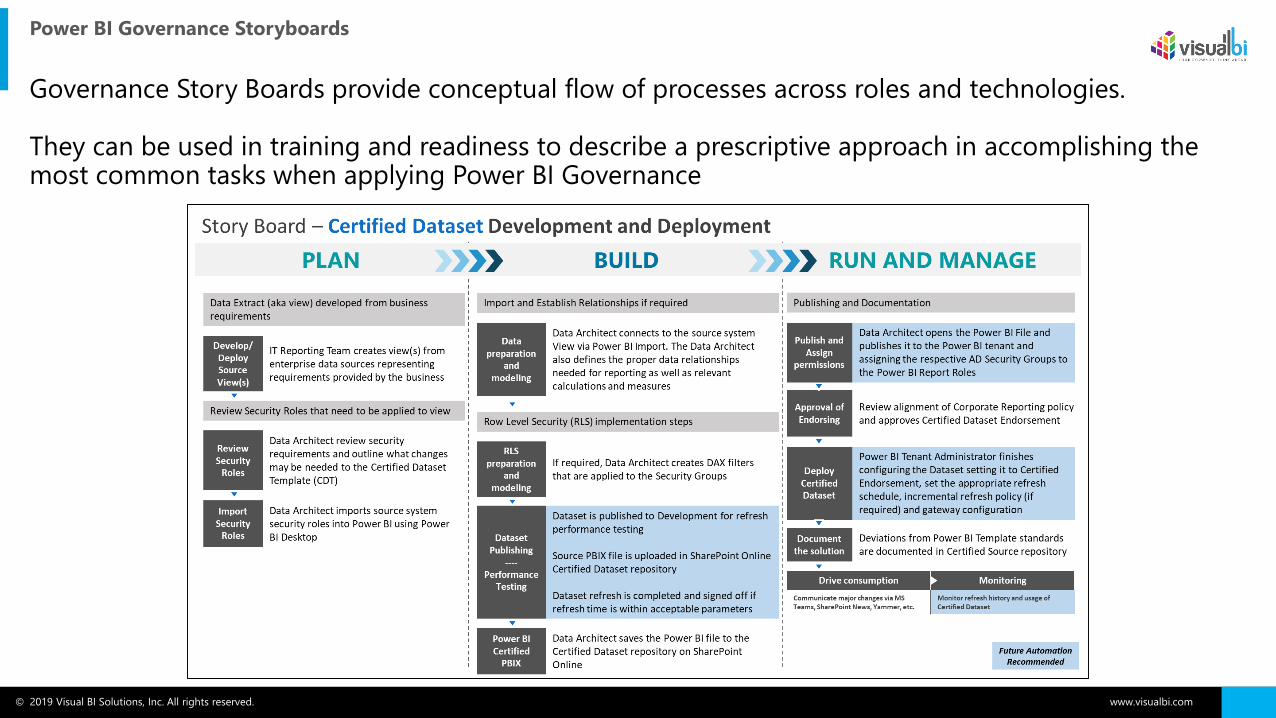
Power BI Governance Storyboards
Governance Story Boards provide conceptual flow of processes across roles and technologies.
They can be used in training and readiness to describe a prescriptive approach in accomplishing the most common tasks when applying Power BI Governance
© 2019 Visual BI Solutions, Inc. All rights reserved. www.visualbi.com
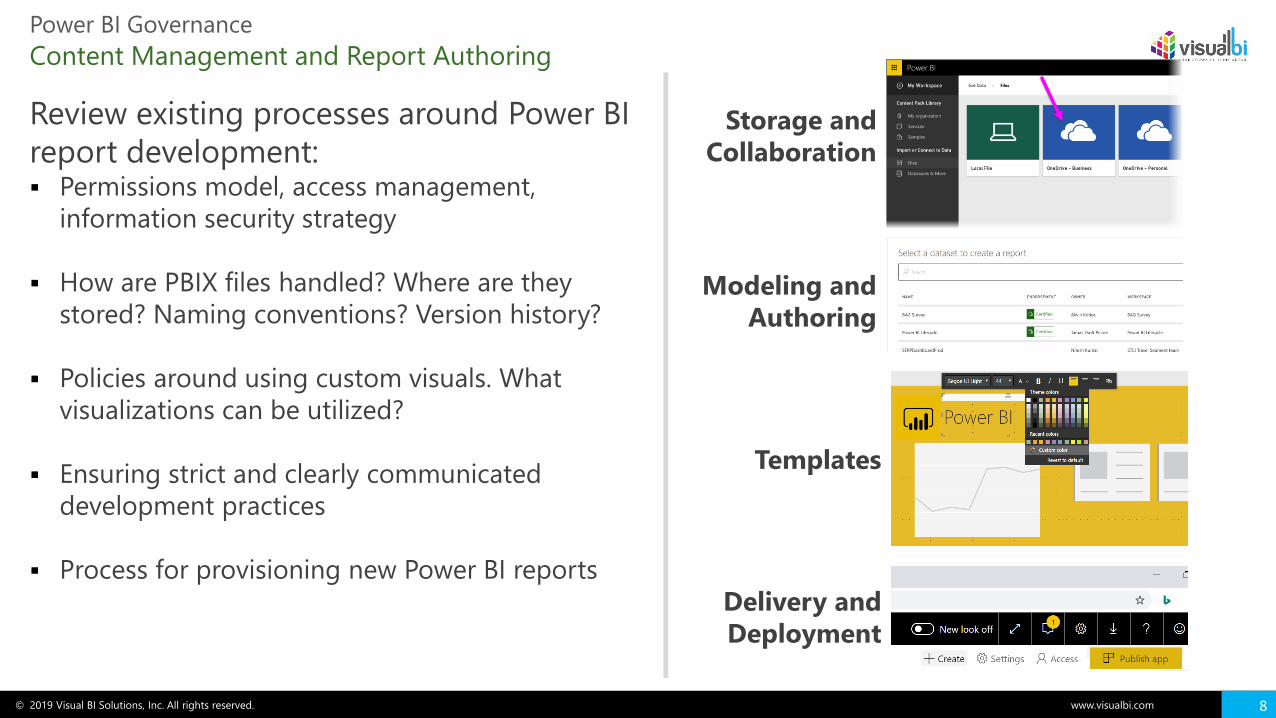
Content Management and Report Authoring
Power BI Governance
Storage and
Collaboration
Modeling and
Authoring
Templates
Review existing processes around Power BI
report development:▪ Permissions model, access management,
information security strategy
▪ How are PBIX files handled? Where are they
stored? Naming conventions? Version history?
▪ Policies around using custom visuals. What
visualizations can be utilized?
▪ Ensuring strict and clearly communicated
development practices
▪ Process for provisioning new Power BI reports
8
Delivery and
Deployment
© 2019 Visual BI Solutions, Inc. All rights reserved. www.visualbi.com
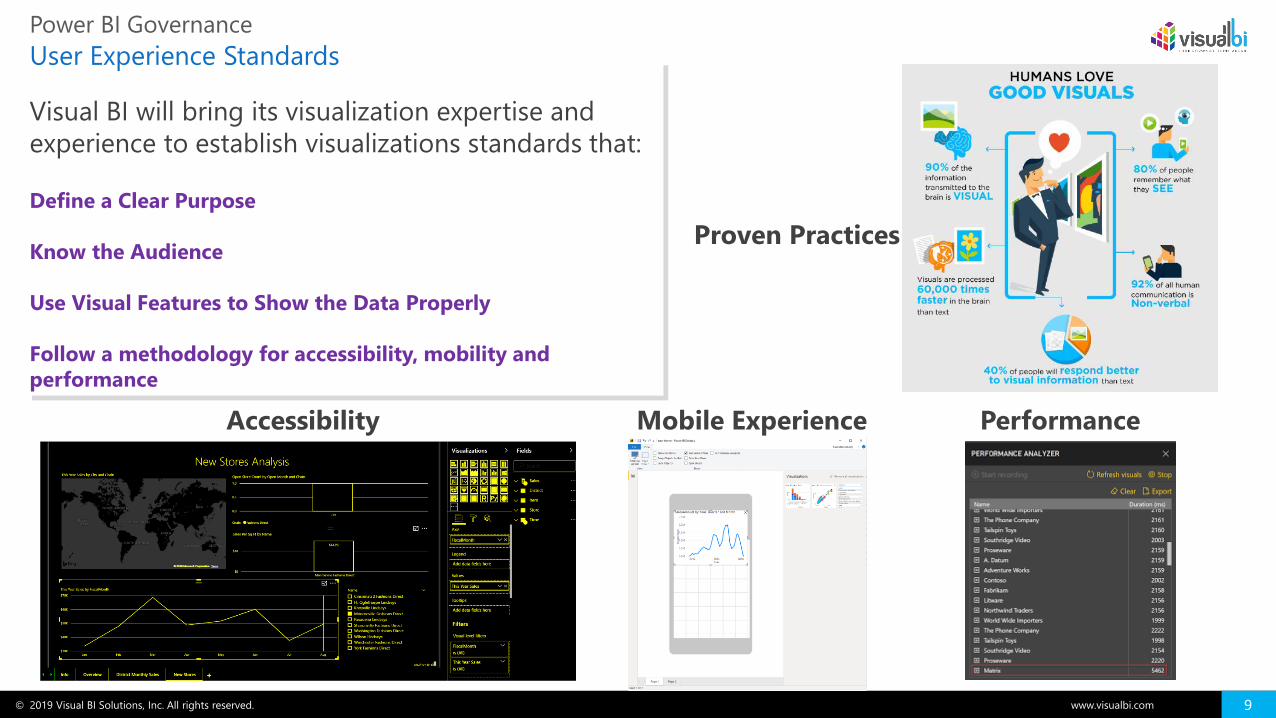
User Experience Standards
Power BI Governance
Proven Practices
PerformanceMobile Experience
9
Visual BI will bring its visualization expertise and
experience to establish visualizations standards that:
Define a Clear Purpose
Know the Audience
Use Visual Features to Show the Data Properly
Follow a methodology for accessibility, mobility and
performance
Accessibility
© 2019 Visual BI Solutions, Inc. All rights reserved. www.visualbi.com
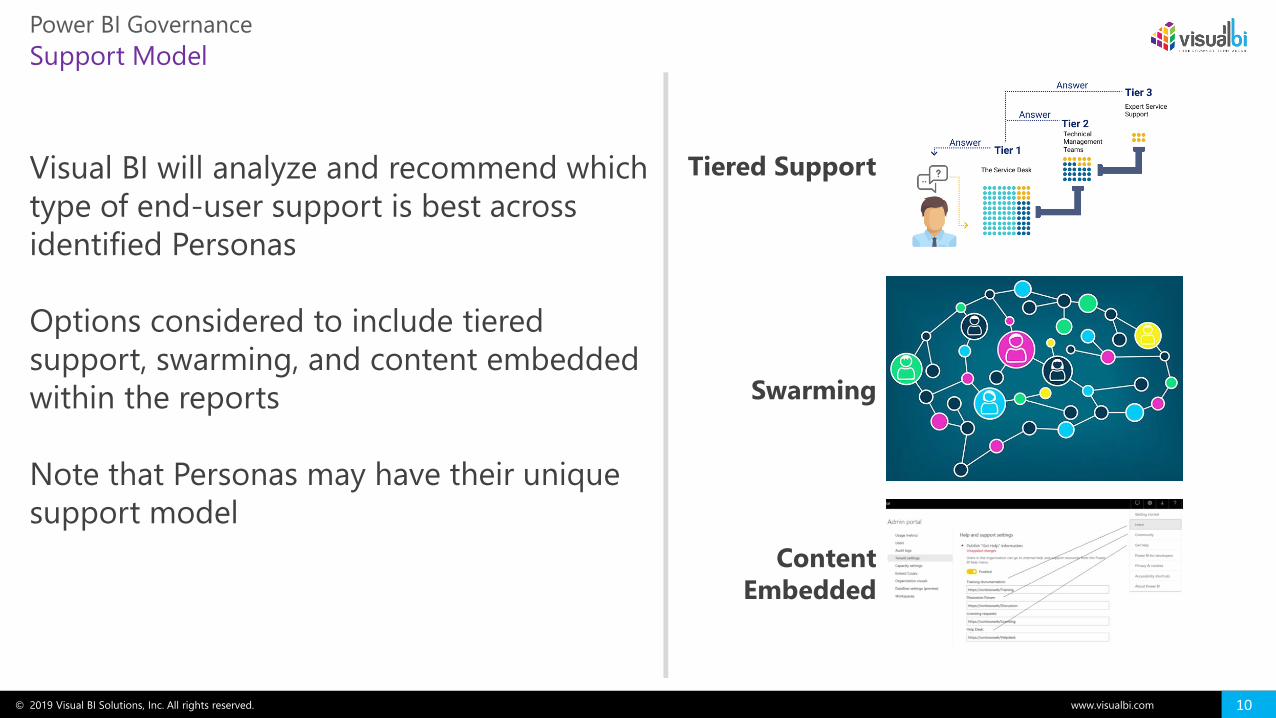
Support Model
Power BI Governance
Tiered Support
Swarming
Content
Embedded
Visual BI will analyze and recommend which
type of end-user support is best across
identified Personas
Options considered to include tiered
support, swarming, and content embedded
within the reports
Note that Personas may have their unique
support model
10
Power BI Training and End User Enablement
© 2019 Visual BI Solutions, Inc. All rights reserved. www.visualbi.com
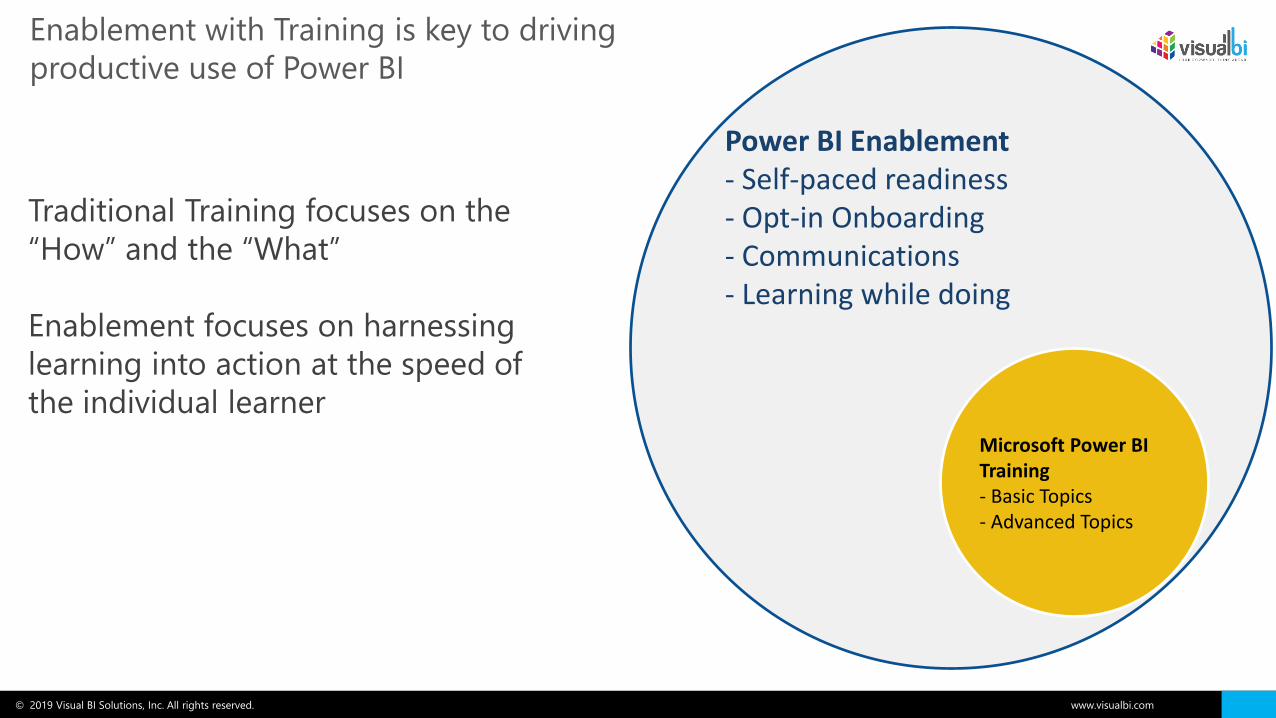
Power BI Enablement- Self-paced readiness- Opt-in Onboarding- Communications- Learning while doing
Enablement with Training is key to driving
productive use of Power BI
Traditional Training focuses on the
“How” and the “What”
Enablement focuses on harnessing
learning into action at the speed of
the individual learner
Microsoft Power BI Training- Basic Topics- Advanced Topics
© 2019 Visual BI Solutions, Inc. All rights reserved. www.visualbi.com 13
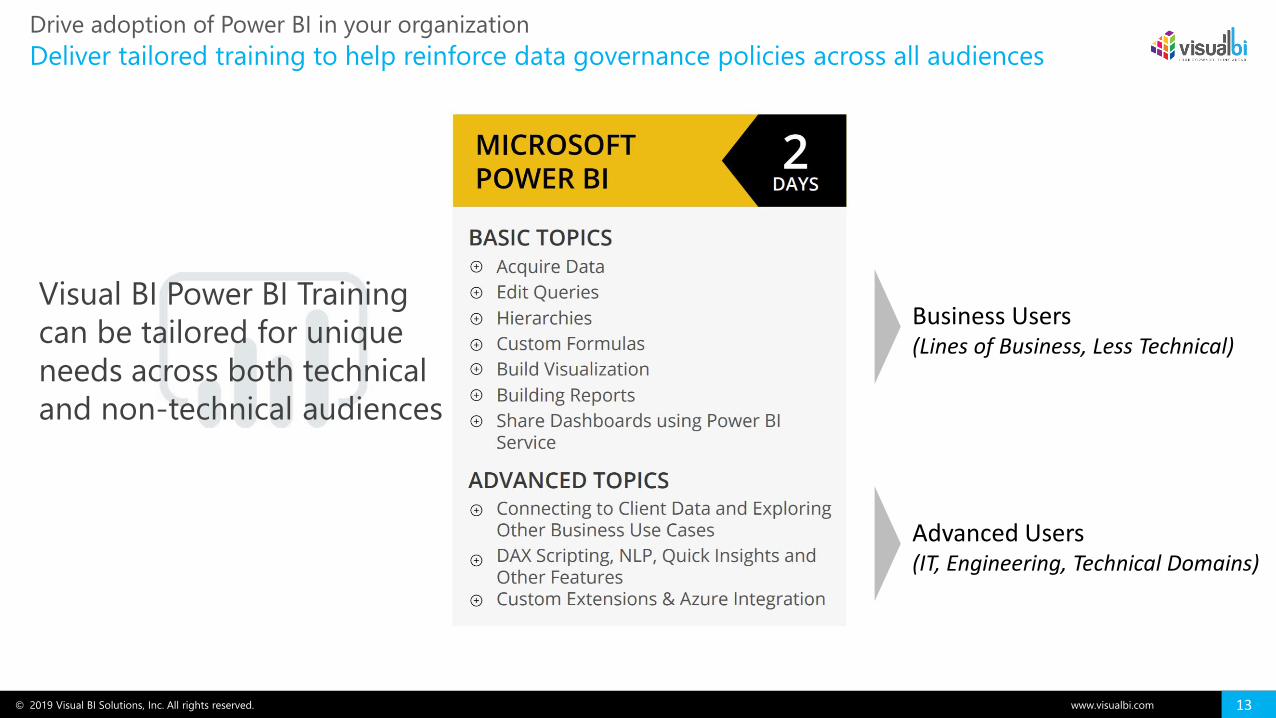
Deliver tailored training to help reinforce data governance policies across all audiences
Drive adoption of Power BI in your organization
Visual BI Power BI Training
can be tailored for unique
needs across both technical
and non-technical audiences
Advanced Users (IT, Engineering, Technical Domains)
Business Users (Lines of Business, Less Technical)
© 2019 Visual BI Solutions, Inc. All rights reserved. www.visualbi.com 14
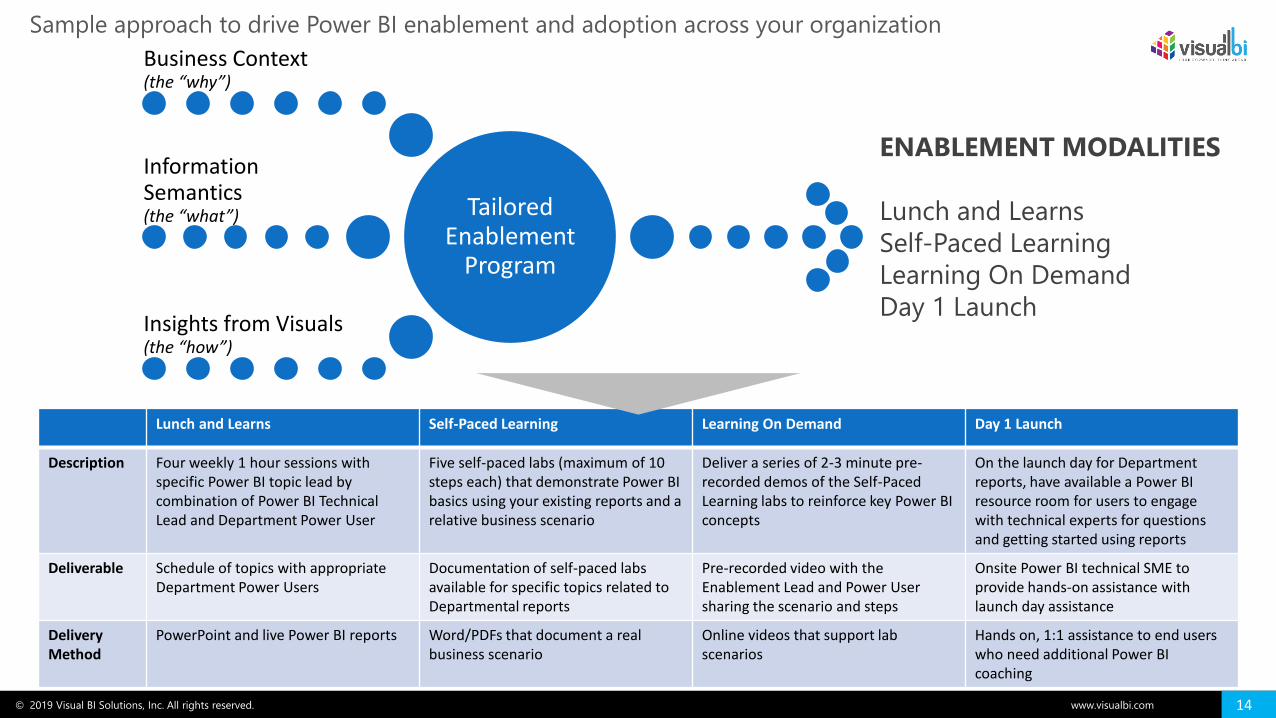
Sample approach to drive Power BI enablement and adoption across your organization
Tailored Enablement
Program
Business Context (the “why”)
Information Semantics (the “what”)
Insights from Visuals (the “how”)
ENABLEMENT MODALITIES
Lunch and Learns
Self-Paced Learning
Learning On Demand
Day 1 Launch
Lunch and Learns Self-Paced Learning Learning On Demand Day 1 Launch
Description Four weekly 1 hour sessions with specific Power BI topic lead by combination of Power BI Technical Lead and Department Power User
Five self-paced labs (maximum of 10 steps each) that demonstrate Power BI basics using your existing reports and a relative business scenario
Deliver a series of 2-3 minute pre-recorded demos of the Self-Paced Learning labs to reinforce key Power BI concepts
On the launch day for Department reports, have available a Power BI resource room for users to engage with technical experts for questions and getting started using reports
Deliverable Schedule of topics with appropriate Department Power Users
Documentation of self-paced labs available for specific topics related to Departmental reports
Pre-recorded video with the Enablement Lead and Power User sharing the scenario and steps
Onsite Power BI technical SME to provide hands-on assistance with launch day assistance
Delivery Method
PowerPoint and live Power BI reports Word/PDFs that document a real business scenario
Online videos that support lab scenarios
Hands on, 1:1 assistance to end users who need additional Power BI coaching
© 2019 Visual BI Solutions, Inc. All rights reserved. www.visualbi.com 15
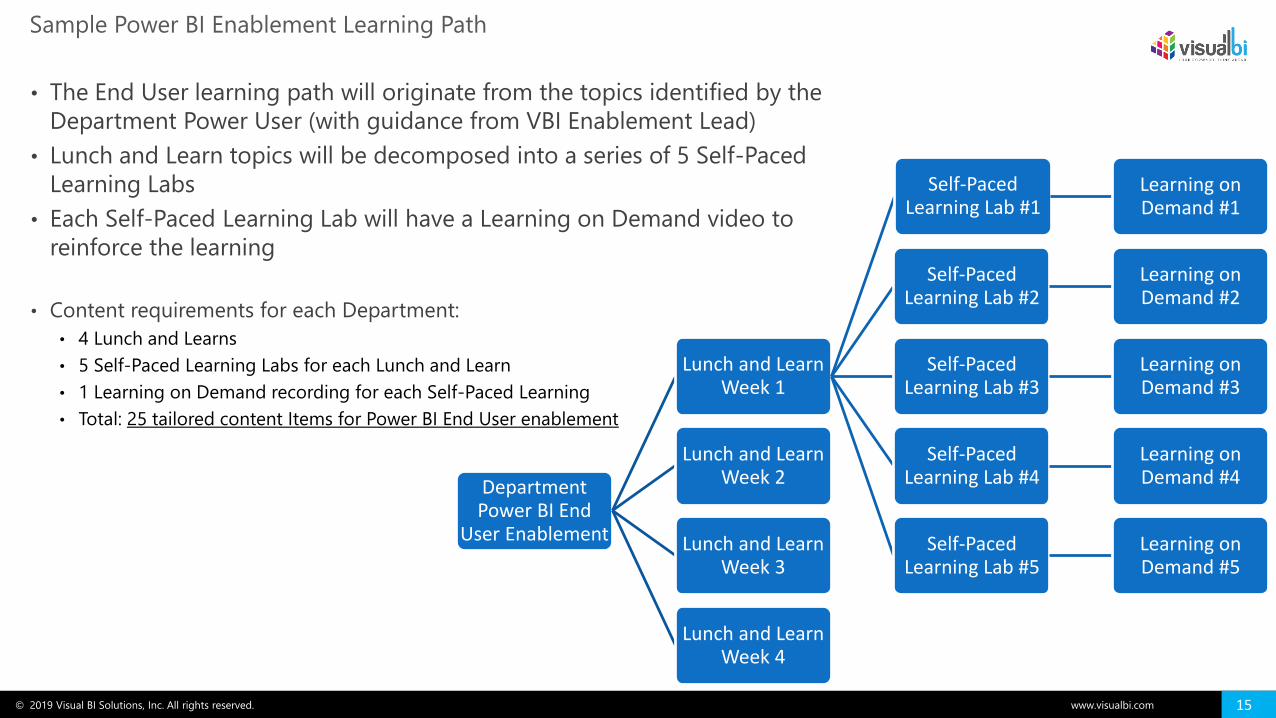
Sample Power BI Enablement Learning Path
Department Power BI End
User Enablement
Lunch and Learn Week 1
Self-Paced Learning Lab #1
Learning on Demand #1
Self-Paced Learning Lab #2
Learning on Demand #2
Self-Paced Learning Lab #3
Learning on Demand #3
Self-Paced Learning Lab #4
Learning on Demand #4
Self-Paced Learning Lab #5
Learning on Demand #5
Lunch and Learn Week 2
Lunch and Learn Week 3
Lunch and Learn Week 4
• The End User learning path will originate from the topics identified by the
Department Power User (with guidance from VBI Enablement Lead)
• Lunch and Learn topics will be decomposed into a series of 5 Self-Paced
Learning Labs
• Each Self-Paced Learning Lab will have a Learning on Demand video to
reinforce the learning
• Content requirements for each Department:
• 4 Lunch and Learns
• 5 Self-Paced Learning Labs for each Lunch and Learn
• 1 Learning on Demand recording for each Self-Paced Learning
• Total: 25 tailored content Items for Power BI End User enablement
© 2019 Visual BI Solutions, Inc. All rights reserved. www.visualbi.com 16
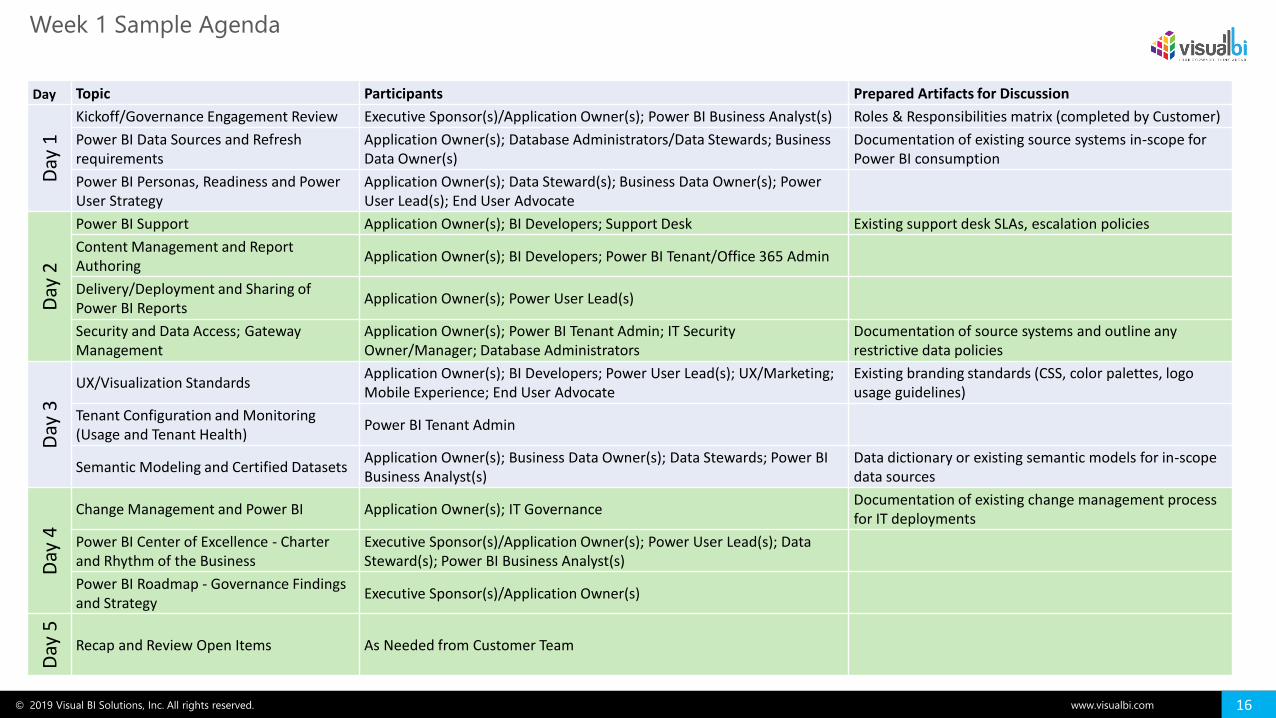
Week 1 Sample Agenda
Day Topic Participants Prepared Artifacts for Discussion
Day
1
Kickoff/Governance Engagement Review Executive Sponsor(s)/Application Owner(s); Power BI Business Analyst(s) Roles & Responsibilities matrix (completed by Customer)
Power BI Data Sources and Refresh requirements
Application Owner(s); Database Administrators/Data Stewards; Business Data Owner(s)
Documentation of existing source systems in-scope for Power BI consumption
Power BI Personas, Readiness and Power User Strategy
Application Owner(s); Data Steward(s); Business Data Owner(s); Power User Lead(s); End User Advocate
Day
2
Power BI Support Application Owner(s); BI Developers; Support Desk Existing support desk SLAs, escalation policies
Content Management and Report Authoring
Application Owner(s); BI Developers; Power BI Tenant/Office 365 Admin
Delivery/Deployment and Sharing of Power BI Reports
Application Owner(s); Power User Lead(s)
Security and Data Access; Gateway Management
Application Owner(s); Power BI Tenant Admin; IT Security Owner/Manager; Database Administrators
Documentation of source systems and outline any restrictive data policies
Day
3
UX/Visualization StandardsApplication Owner(s); BI Developers; Power User Lead(s); UX/Marketing; Mobile Experience; End User Advocate
Existing branding standards (CSS, color palettes, logo usage guidelines)
Tenant Configuration and Monitoring (Usage and Tenant Health)
Power BI Tenant Admin
Semantic Modeling and Certified DatasetsApplication Owner(s); Business Data Owner(s); Data Stewards; Power BI Business Analyst(s)
Data dictionary or existing semantic models for in-scope data sources
Day
4
Change Management and Power BI Application Owner(s); IT GovernanceDocumentation of existing change management process for IT deployments
Power BI Center of Excellence - Charter and Rhythm of the Business
Executive Sponsor(s)/Application Owner(s); Power User Lead(s); Data Steward(s); Power BI Business Analyst(s)
Power BI Roadmap - Governance Findings and Strategy
Executive Sponsor(s)/Application Owner(s)
Day
5
Recap and Review Open Items As Needed from Customer Team
© 2019 Visual BI Solutions, Inc. All rights reserved. www.visualbi.com 17
▪ Governance is a key foundation for planning and
executing a successful Power BI deployment
▪ Determining early the delivery and deployment policies
for Power BI Reporting will help shape the correct
implementation decisions
▪ Training for Power BI is a minimum requirement;
Enablement provides a more sustainable adoption curve
of Power BI within the organization
Summary

© 2019 Visual BI Solutions, Inc. All rights reserved. www.visualbi.com
www.visualbi.com
THANK YOU
gopal
@visua
lbi.comwww.visualbi.com
For more information…[email protected]