Embed Size (px)
Citation preview

1/45
Economic growth Harrod-Domar model Solow model Convergence Poverty traps
Development economicsLecture 2, 3: Traditional growth models and poverty traps, and
the way towards MDGs
Vojtech Bartos
LMU, April 27, 2016

2/45
Economic growth Harrod-Domar model Solow model Convergence Poverty traps
Economic growth
Harrod-Domar model
Solow model
Convergence
Poverty traps

3/45
Economic growth Harrod-Domar model Solow model Convergence Poverty traps
Economic growth
I Rapid economic development started some 150 years ago.I 1820-90: Netherlands a major driver of economic growth:
annual growth of 0.2%I Current rates of about 2% enormous growth rates if one takes
into account the exponential growth. Time to double GDP:I x(1 + r)t = 2xI t = log(2)
log(1+r)I Example: 2% growth → doubling time: 35 years

4/45
Economic growth Harrod-Domar model Solow model Convergence Poverty traps
Economic growth (1870 - 1978)

5/45
Economic growth Harrod-Domar model Solow model Convergence Poverty traps
Economic growth
”I do not see how one can look at figures like thesewithout seeing them as representing possibilities. Is theresome action a government of India could take that wouldlead the Indian economy to grow like Indonesia’s orEgypt’s? If so, what exactly? If not, what is it about the’nature of India’ that makes it so?” — Robert Lucas
I But growth is very unequal and poor countries have to do alot to catch up →
6/45
Economic growth Harrod-Domar model Solow model Convergence Poverty traps
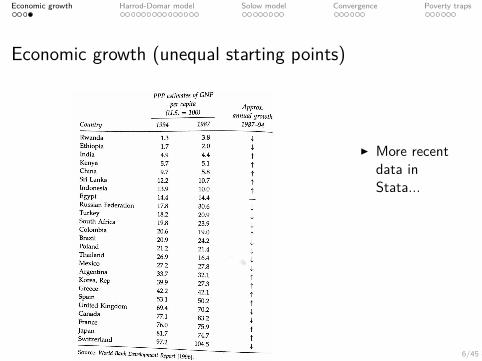
Economic growth (unequal starting points)
I More recentdata inStata...

7/45
Economic growth Harrod-Domar model Solow model Convergence Poverty traps
Economic growth
Harrod-Domar model
Solow model
Convergence
Poverty traps

8/45
Economic growth Harrod-Domar model Solow model Convergence Poverty traps
Harrod-Domar model
I But: What causes growth and how to generate it?I Note: Economic growth is the abstention from current
consumption (i.e. translates into investment in the (richer)future).
I Commodities:I Consumption goodsI Capital goodsI (often these cannot be categorised in a single category)
I Households save (do not spend everything on consumption),savings are invested by firms (to increase capital stocks)

9/45
Economic growth Harrod-Domar model Solow model Convergence Poverty traps
Harrod-Domar model
I Macroeconomic balance: savings = investments:S(t) = I(t)
I Q: Examples?I Q: Does this necessarily hold at every period t?
I Accounting equation: Y (t) = C(t) + S(t), Y (t)... totalGNP (not GDP per capita)
I So Y (t) = C(t) + I(t), as S(t) = I(t)I Investment increases the stock of next period capital goods
K (t + 1). In this period the share of δ depreciates:
K (t + 1) = (1− δ)K (t) + I(t)
10/45
Economic growth Harrod-Domar model Solow model Convergence Poverty traps
Harrod-Domar model
K (t + 1) = (1− δ)K (t) + I(t)
I To examine growth, we define the following:I Savings ratio:
s = S(t)Y (t)
I Capital-output ratio – how much capital is needed to produceone unit of output:
θ = K (t)Y (t)
I From macroeconomic balance we get:
K (t + 1) = (1− δ)K (t) + S(t)

11/45
Economic growth Harrod-Domar model Solow model Convergence Poverty traps
Harrod-Domar model
K (t + 1) = (1− δ)K (t) + S(t)
I We know that S(t) = sY (t) and K (t) = θY (t)I Plug this into the capital stock equation:
θY (t + 1) = (1− δ)θY (t) + sY (t)
I Then divide by θ and by Y (t) to get:
Y (t + 1)Y (t) = Y (t)
Y (t)(1− δ + sθ
)

12/45
Economic growth Harrod-Domar model Solow model Convergence Poverty traps
Harrod-Domar model
Y (t + 1)Y (t) = Y (t)
Y (t)(1− δ + sθ
)
I Subtract Y (t)Y (t) to get:
Y (t + 1)− Y (t)Y (t) = s
θ− δ
I And we get the Harrod-Domar equation (g = Y (t+1)−Y (t)Y (t) ):
sθ
= g + δ
13/45
Economic growth Harrod-Domar model Solow model Convergence Poverty traps
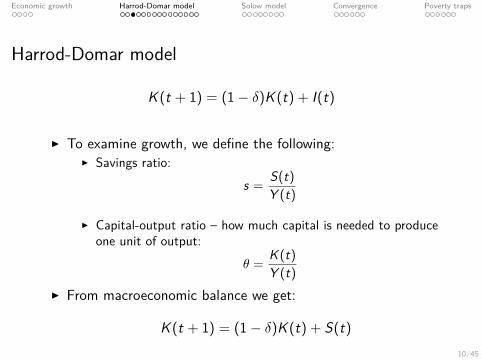
Harrod-Domar model and population growth
14/45
Economic growth Harrod-Domar model Solow model Convergence Poverty traps
Harrod-Domar model and population growth
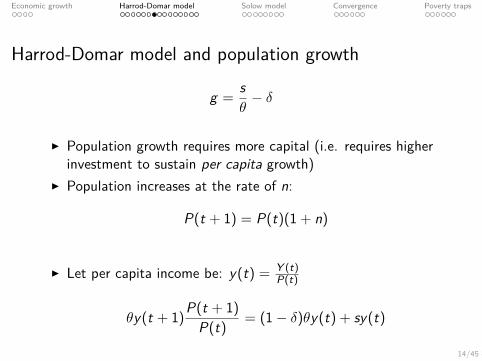
g = sθ− δ
I Population growth requires more capital (i.e. requires higherinvestment to sustain per capita growth)
I Population increases at the rate of n:
P(t + 1) = P(t)(1 + n)
I Let per capita income be: y(t) = Y (t)P(t)
θy(t + 1)P(t + 1)P(t) = (1− δ)θy(t) + sy(t)
15/45
Economic growth Harrod-Domar model Solow model Convergence Poverty traps
Harrod-Domar model and population growth
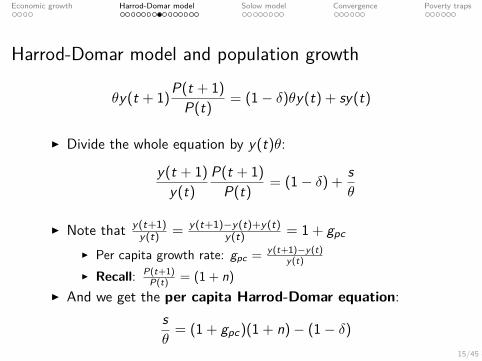
θy(t + 1)P(t + 1)P(t) = (1− δ)θy(t) + sy(t)
I Divide the whole equation by y(t)θ:
y(t + 1)y(t)
P(t + 1)P(t) = (1− δ) + s
θ
I Note that y(t+1)y(t) = y(t+1)−y(t)+y(t)
y(t) = 1 + gpc
I Per capita growth rate: gpc = y(t+1)−y(t)y(t)
I Recall: P(t+1)P(t) = (1 + n)
I And we get the per capita Harrod-Domar equation:sθ
= (1 + gpc)(1 + n)− (1− δ)
16/45
Economic growth Harrod-Domar model Solow model Convergence Poverty traps
Harrod-Domar model and population growth
sθ
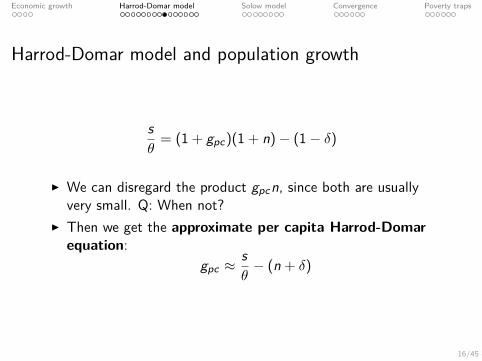
= (1 + gpc)(1 + n)− (1− δ)
I We can disregard the product gpcn, since both are usuallyvery small. Q: When not?
I Then we get the approximate per capita Harrod-Domarequation:
gpc ≈sθ− (n + δ)
17/45
Economic growth Harrod-Domar model Solow model Convergence Poverty traps
Harrod-Domar model and population growth
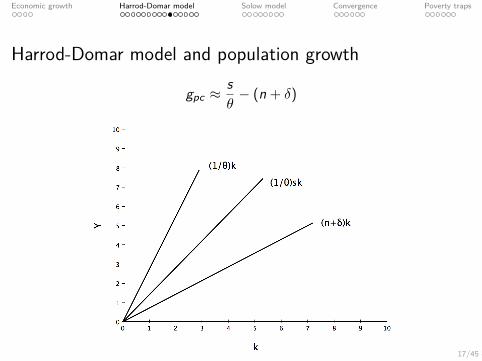
gpc ≈sθ− (n + δ)

18/45
Economic growth Harrod-Domar model Solow model Convergence Poverty traps
Sachs (2004): Harrod-Domar evidence

19/45
Economic growth Harrod-Domar model Solow model Convergence Poverty traps

20/45
Economic growth Harrod-Domar model Solow model Convergence Poverty traps
Beyond Harrod-Domar model
gpc ≈sθ− (n + δ)
I Recipes on how to increase growth?1. Increase the (household) savings rate. How?2. Reduce the capital output ratio (production efficiency). How?3. Reduce the the population growth. How?
I All of the above can be endogenous (savings, populationgrowth, capital-output or technology).
21/45
Economic growth Harrod-Domar model Solow model Convergence Poverty traps
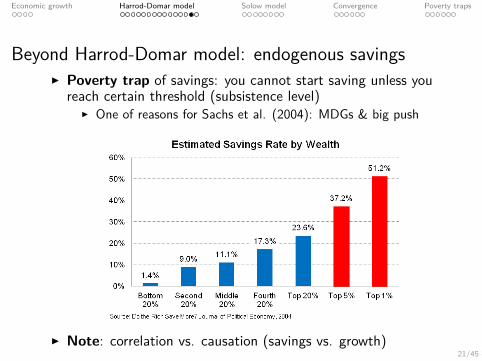
Beyond Harrod-Domar model: endogenous savingsI Poverty trap of savings: you cannot start saving unless you
reach certain threshold (subsistence level)I One of reasons for Sachs et al. (2004): MDGs & big push
I Note: correlation vs. causation (savings vs. growth)

22/45
Economic growth Harrod-Domar model Solow model Convergence Poverty traps
Beyond Harrod-Domar model: endogenous populationI Demographic transition
I Why do poor countries have so different distributions?I Why do poor countries have such high fertility rates?

23/45
Economic growth Harrod-Domar model Solow model Convergence Poverty traps
Economic growth
Harrod-Domar model
Solow model
Convergence
Poverty traps
24/45
Economic growth Harrod-Domar model Solow model Convergence Poverty traps
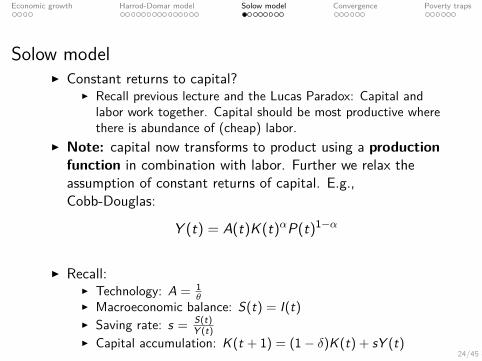
Solow modelI Constant returns to capital?
I Recall previous lecture and the Lucas Paradox: Capital andlabor work together. Capital should be most productive wherethere is abundance of (cheap) labor.
I Note: capital now transforms to product using a productionfunction in combination with labor. Further we relax theassumption of constant returns of capital. E.g.,Cobb-Douglas:
Y (t) = A(t)K (t)αP(t)1−α
I Recall:I Technology: A = 1
θI Macroeconomic balance: S(t) = I(t)I Saving rate: s = S(t)
Y (t)I Capital accumulation: K (t + 1) = (1− δ)K (t) + sY (t)

25/45
Economic growth Harrod-Domar model Solow model Convergence Poverty traps
Solow model
K (t + 1) = (1− δ)K (t) + sY (t)
I Notice: We still assume exogenous s and will assume thatpopulation growth is constant (n). Why?
I Rewrite the capital accumulation in per-capita terms again:
(1 + n)k(t + 1) = (1− δ)k(t) + sy(t)
I Production per capita using Y (t) = A(t)K (t)αP(t)1−α isthen:
y(t) = A(t)k(t)α
26/45
Economic growth Harrod-Domar model Solow model Convergence Poverty traps
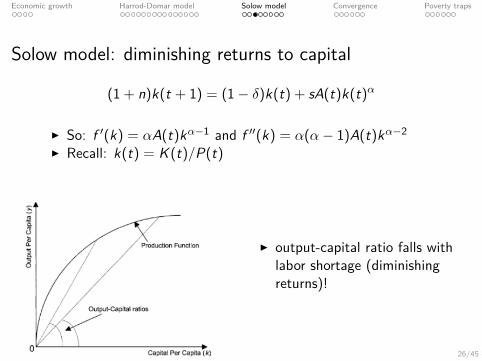
Solow model: diminishing returns to capital
(1 + n)k(t + 1) = (1− δ)k(t) + sA(t)k(t)α
I So: f ′(k) = αA(t)kα−1 and f ′′(k) = α(α− 1)A(t)kα−2
I Recall: k(t) = K (t)/P(t)
I output-capital ratio falls withlabor shortage (diminishingreturns)!

27/45
Economic growth Harrod-Domar model Solow model Convergence Poverty traps
Solow model: dynamics
(1 + n)k(t + 1) = (1− δ)k(t) + sA(t)k(t)α
I Steady state: k∗ where k(t) = k(t + 1)

28/45
Economic growth Harrod-Domar model Solow model Convergence Poverty traps
Solow model: steady state
(1 + n)k(t + 1) = (1− δ)k(t) + sA(t)k(t)α
I Steady state: k∗ where k(t) = k(t + 1)
(1 + n − 1 + δ)k∗ = sA(t)(k∗)α
(k∗)1−α = sA(t)n + δ
k∗ =(sA(t)
n + δ
) 11−α

29/45
Economic growth Harrod-Domar model Solow model Convergence Poverty traps
Mankiw, Romer, and Weil (1992): Solow evidence
I Implicit assumptions:countries in steadystate
I We’ll calculate this inthe seminar, but:estimated values of αas in Y (t) =A(t)K (t)αP(t)1−α toolarge.
I Inputing the realisticvalue of α = 0.3 yieldsR2 of 0.29(intermediate sample)
30/45
Economic growth Harrod-Domar model Solow model Convergence Poverty traps
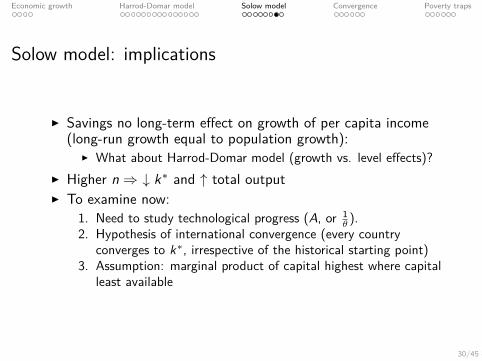
Solow model: implications
I Savings no long-term effect on growth of per capita income(long-run growth equal to population growth):
I What about Harrod-Domar model (growth vs. level effects)?I Higher n⇒ ↓ k∗ and ↑ total outputI To examine now:
1. Need to study technological progress (A, or 1θ ).
2. Hypothesis of international convergence (every countryconverges to k∗, irrespective of the historical starting point)
3. Assumption: marginal product of capital highest where capitalleast available
31/45
Economic growth Harrod-Domar model Solow model Convergence Poverty traps
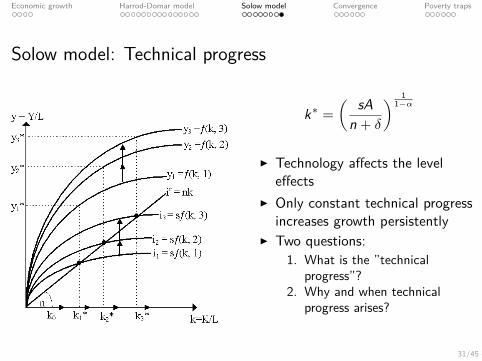
Solow model: Technical progress
k∗ =( sA
n + δ
) 11−α
I Technology affects the leveleffects
I Only constant technical progressincreases growth persistently
I Two questions:1. What is the ”technical
progress”?2. Why and when technical
progress arises?

32/45
Economic growth Harrod-Domar model Solow model Convergence Poverty traps
Economic growth
Harrod-Domar model
Solow model
Convergence
Poverty traps
33/45
Economic growth Harrod-Domar model Solow model Convergence Poverty traps
Solow model: Unconditional convergence
I Do data support the conclusions of the Solow model that inthe long term all countries should converge to the same k∗and that the richest countries should stop growing (unlesspersistent differences in technical progress, savings, andpopulation growth)?
I How to test this empirically?I g = α + βlog(yt0) + εI What would be the Harrod-Domar model prediction?
34/45
Economic growth Harrod-Domar model Solow model Convergence Poverty traps
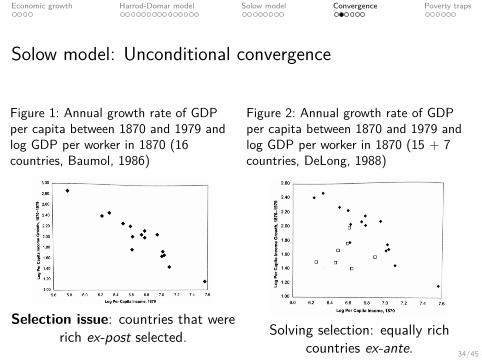
Solow model: Unconditional convergence
Figure 1: Annual growth rate of GDPper capita between 1870 and 1979 andlog GDP per worker in 1870 (16countries, Baumol, 1986)
Selection issue: countries that wererich ex-post selected.
Figure 2: Annual growth rate of GDPper capita between 1870 and 1979 andlog GDP per worker in 1870 (15 + 7countries, DeLong, 1988)
Solving selection: equally richcountries ex-ante.
35/45
Economic growth Harrod-Domar model Solow model Convergence Poverty traps
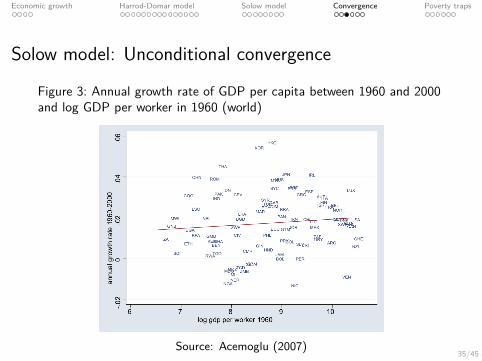
Solow model: Unconditional convergence
Figure 3: Annual growth rate of GDP per capita between 1960 and 2000and log GDP per worker in 1960 (world)
Source: Acemoglu (2007)
36/45
Economic growth Harrod-Domar model Solow model Convergence Poverty traps
Solow model: Unconditional convergence
I So is Harrod-Domar better than Solow?I Hardly, constant returns to capital unrealistic assumption.
I But countries can all have different saving rates, levels oftechnology, or population growth → conditionalconvergence to different k∗

37/45
Economic growth Harrod-Domar model Solow model Convergence Poverty traps
Solow model: Conditional convergence
Figure 4: Convergence in growth rates
Source: Ray (1998)
I AB and A’B’ converge todifferent states due todifferences in s and n, butgiven constant technologylines parallel
I Q: Why constanttechnology assumed?
I Q: What can we sayabout growth of initiallypoorer and richercountries?
38/45
Economic growth Harrod-Domar model Solow model Convergence Poverty traps
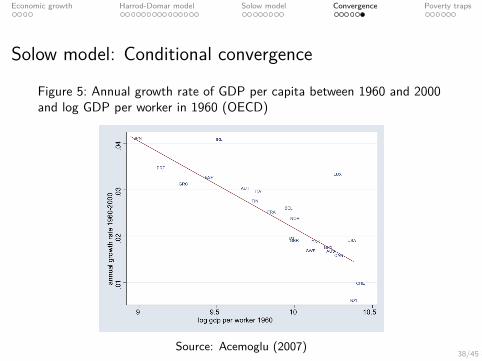
Solow model: Conditional convergence
Figure 5: Annual growth rate of GDP per capita between 1960 and 2000and log GDP per worker in 1960 (OECD)
Source: Acemoglu (2007)

39/45
Economic growth Harrod-Domar model Solow model Convergence Poverty traps
Economic growth
Harrod-Domar model
Solow model
Convergence
Poverty traps

40/45
Economic growth Harrod-Domar model Solow model Convergence Poverty traps
Returns to capital: poverty trap
I Solow model assumptions for convergence:1. Savings rate constant for all levels of income: No!2. Population growth constant for all levels of income: No!3. Highest returns to capital for the poorest – sf (k)?
I What if some threshold level of capital is required forproduction using more efficient technologies. Why?

41/45
Economic growth Harrod-Domar model Solow model Convergence Poverty traps
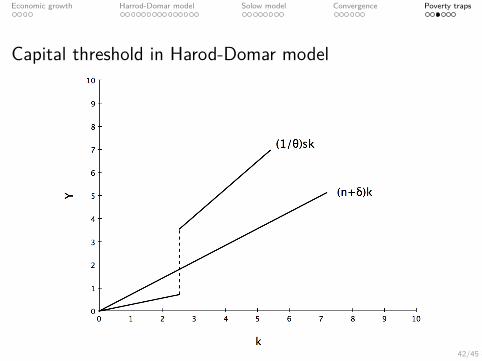
Capital threshold in Harod-Domar model
I Recall Harod-Domar:
gpc ≈sθ− (n + δ)
I What if only for certain levels of capital k > kT : sθ > (n + δ)
I Only then g > 0; negative growth for low capital levels —poverty trap
42/45
Economic growth Harrod-Domar model Solow model Convergence Poverty traps
Capital threshold in Harod-Domar model

43/45
Economic growth Harrod-Domar model Solow model Convergence Poverty traps
McKenzie and Woodruff (2003): Do Entry Costs Providean Empirical Basis for Poverty Traps?
I Use cross-section of Mexican microenterprises.Whymethodologically problematic?
44/45
Economic growth Harrod-Domar model Solow model Convergence Poverty traps
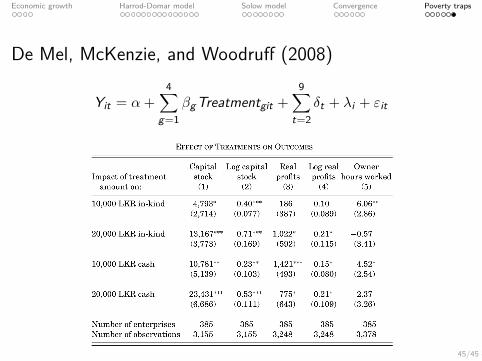
De Mel, McKenzie, and Woodruff (2008): Returns tocapital in microenterprises
I Q: Are returns to capital so low for the poorest?I Experiment with small firms in Sri Lanka (≈ $250
non-housing capital)I Firms divided in three groups (Why?):
1. Received nothing, just observed (control group)2. Received $100 (treatment group)3. Received $200 (cash or in-kind, randomly)
I Profits increased by 6% per month (≈ 60% per year) → highreturns to capital. Trap?
I Returns were higher for men relative to women. That is apuzzle, since most of microenterprises in developing countriesare run by women.
45/45
Economic growth Harrod-Domar model Solow model Convergence Poverty traps
De Mel, McKenzie, and Woodruff (2008)
Yit = α +4∑
g=1βg Treatmentgit +
9∑t=2
δt + λi + εit