Embed Size (px)
Citation preview
International Journal of Geosciences, 2012, 3, 71-80 http://dx.doi.org/10.4236/ijg.2012.31009 Published Online February 2012 (http://www.SciRP.org/journal/ijg)
Potentiality of Secondary Aquifers in Saudi Arabia: Evaluation of Groundwater Quality in Jubaila Limestone
Mohammed Tahir Hussein1, Mazin M. Al Yousif2, Hussein S. Awad1 1SGSRC, Department of Geology, College of Science, King Saud University, Riyadh, Saudi Arabia
2KACST, Riyadh, Saudi Arabia Email: [email protected]
Received September 11, 2011; revised October 16, 2011; accepted November 18, 2011
ABSTRACT
Groundwater scarcity in arid regions may hinder development plans and cause many inconveniences for the population and authorities. Saudi Arabia has limited groundwater resources stored in the sedimentary sequence of the Arabian Shelf. Some of these resources were classified as major aquifers, secondary and minor aquifers, and some were consid-ered as aquicludes. The Jubaila Limestone is one of the secondary aquifers of Saudi Arabia. The main purpose of this paper is to evaluate the groundwater resources of the Jubaila Limestone in Riyadh area, with emphasis on groundwater quality. Groundwater was found to occur in fractures and within solution openings of the Jubaila Limestone at depths which range between 19 and 210 m. The transmissivity value was 1.7 × 10⁻³ to 7.2 × 10⁻³ m2/s; the storage coefficient was of 1.3 × 10⁻⁴. The electrical conductivity for collected water samples ranged between 831 and 7670 µS/cm. The major ionic relationships were Na > Ca > Mg and SO4 > Cl > HCO3. The groundwater evolves from NaCl dominated at the southern end of the study area, into Ca, MgSO4 water in the north. The main chemical process responsible of this variation was found to be dissolution of anhydrite and gypsum. The groundwater was not found suitable for drinking purposes but can be used by livestock and for some agricultural purposes. Keywords: Saudi Arabia; Riyadh; Jubaila Limestone; Groundwater Quality; Dissolution
1. Introduction
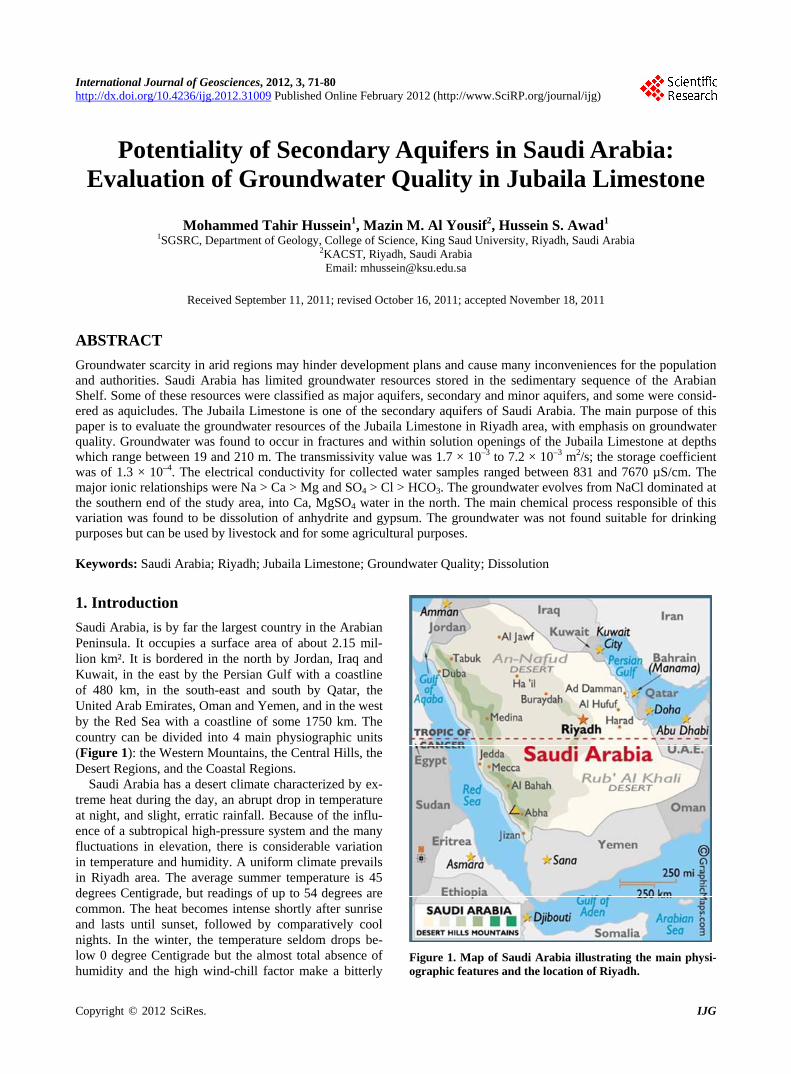
Saudi Arabia, is by far the largest country in the Arabian Peninsula. It occupies a surface area of about 2.15 mil-lion km². It is bordered in the north by Jordan, Iraq and Kuwait, in the east by the Persian Gulf with a coastline of 480 km, in the south-east and south by Qatar, the United Arab Emirates, Oman and Yemen, and in the west by the Red Sea with a coastline of some 1750 km. The country can be divided into 4 main physiographic units (Figure 1): the Western Mountains, the Central Hills, the Desert Regions, and the Coastal Regions.
Saudi Arabia has a desert climate characterized by ex-treme heat during the day, an abrupt drop in temperature at night, and slight, erratic rainfall. Because of the influ-ence of a subtropical high-pressure system and the many fluctuations in elevation, there is considerable variation in temperature and humidity. A uniform climate prevails in Riyadh area. The average summer temperature is 45 degrees Centigrade, but readings of up to 54 degrees are common. The heat becomes intense shortly after sunrise and lasts until sunset, followed by comparatively cool nights. In the winter, the temperature seldom drops be-low 0 degree Centigrade but the almost total absence of humidity and the high wind-chill factor make a bitterly
Figure 1. Map of Saudi Arabia illustrating the main physi-ographic features and the location of Riyadh.
Copyright © 2012 SciRes. IJG
M. T. HUSSEIN ET AL. 72
cold atmosphere. In the spring and autumn, temperatures average 29 degree Centigrade. The entire year’s rainfall may consist of one or two torrential outbursts that flood the wadies and then rapidly disappear into the soil to be trapped above the layers of impervious rock. This is suf-ficient, however, to sustain forage growth. Although the average rainfall is 100 - 150 millimeters per year, the area may not experience rainfall for several years.
Geologically, the Kingdom of Saudi Arabia is divided into the Arabian Shield and the Arabian Shelf. The Shield is composed mainly of crystalline and crystallo-phyllian rocks primarily of Precambrian-Cambrian ages with volcanic lava flows of Tertiary-Quaternary age ex-tending to recent years. Groundwater in the Arabian Shield occurs within the wadi deposits and in restricted area within the basaltic lava flows. The Arabian Shelf is mainly occupied by a sedimentary sequence lying un-comfortably on the basement rocks of the Shield and dipping towards the east and northeast. The sedimentary sequence starts with deposits of Cambrian ages and ends with Quaternary-recent deposits [1]. The sequence had been interrupted by a number of uncomformities during Phanerozoic. Table 1 summarizes the sedimentary se-quence of the Jurassic Formations on the Arabian Shelf [2]. Within the Arabian Shelf groundwater is obtained from a number of aquifers ranging through Cambrian up to the Pliocene formations. The principal aquifers are the Saq, Wajiid, Qassim, Minjur, Dhurma, Wasia and Bayad, Umm er Radhuma, Dammam and Neogene aquifers. The Jubaila Limestone, according to the Water Atlas of Saudi Arabia [3] is classified as one of the secondary aquifers in Riyadh area. A. Al-Bassam, [4] considered the Jubaila Limestone as a moderate aquifer both as regards its quantitative and qualitative properties.
The water scarcity and the limited resources of water within the country make it necessary to look into the po-tentialities of the secondary aquifers and try to character-ize its properties as possible. The main purpose of this study is to evaluate the groundwater quality in Jubaila Limestone, north of Riyadh between latitudes 24˚45' - 24˚55'N and longitudes 46˚20' - 46˚30'E. The evaluation includes groundwater occurrences, movement, ground-water quality variation, chemical processes responsible for these quality variations and the suitability of water for various purposes.
2. Methodology
Based on the above-mentioned concerns, the methods used in this study included both field and laboratorial methods. Field methods included both geological and hydrogeological methods. The geological methods fo-cused on identifying rock types, measurement and ob-servation of geological features in the study area. The hydrogeological methods were concerned with preparing
a well inventory sheet for all wells drilled in the study area. The collected information included well location using a GPS, measurements of static and pumping water levels using water-level sounders, discharge rate meas-urements using both containers and stopwatches, and collection of groundwater samples for analyzing their major, minor and trace elements. The laboratorial meth-ods included the analyses of the collected groundwater samples and the data processing using AquaChem and PHREEQ softwares [5]. The analyses were performed according to APH/AWWA/WPCF [6]. Thirty wells were inventoried, sampled and analyzed for this study.
3. Geology of the Study Area
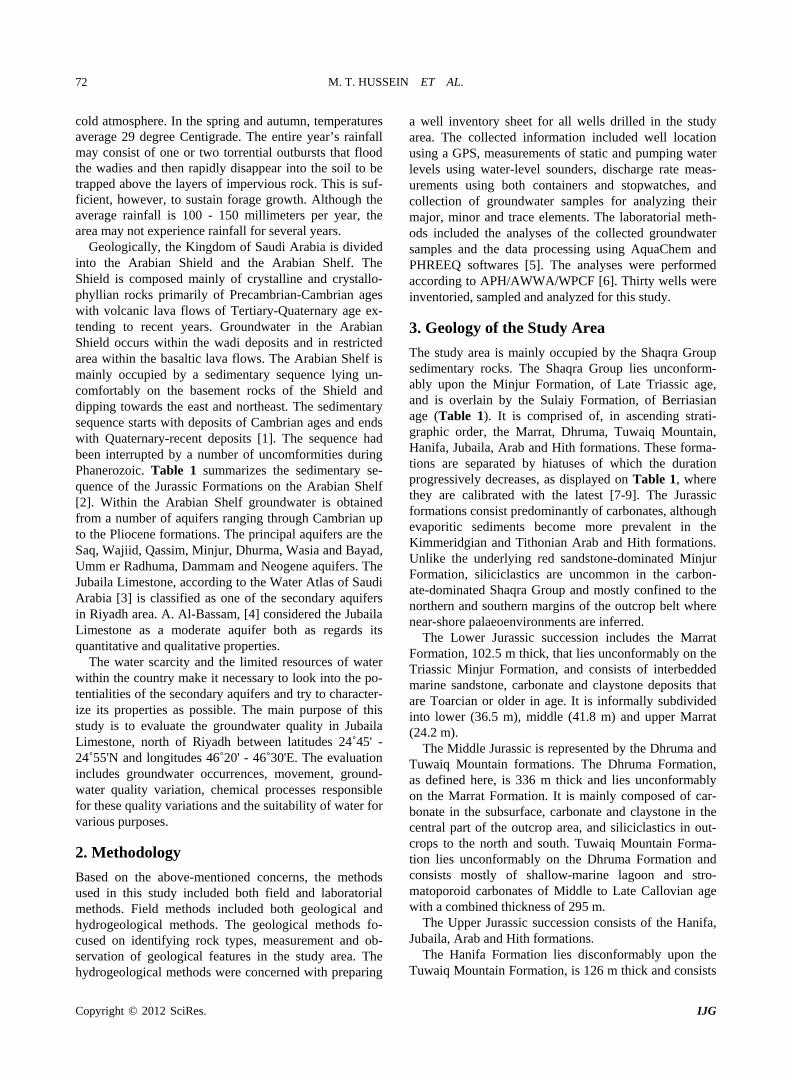
The study area is mainly occupied by the Shaqra Group sedimentary rocks. The Shaqra Group lies unconform-ably upon the Minjur Formation, of Late Triassic age, and is overlain by the Sulaiy Formation, of Berriasian age (Table 1). It is comprised of, in ascending strati-graphic order, the Marrat, Dhruma, Tuwaiq Mountain, Hanifa, Jubaila, Arab and Hith formations. These forma-tions are separated by hiatuses of which the duration progressively decreases, as displayed on Table 1, where they are calibrated with the latest [7-9]. The Jurassic formations consist predominantly of carbonates, although evaporitic sediments become more prevalent in the Kimmeridgian and Tithonian Arab and Hith formations. Unlike the underlying red sandstone-dominated Minjur Formation, siliciclastics are uncommon in the carbon-ate-dominated Shaqra Group and mostly confined to the northern and southern margins of the outcrop belt where near-shore palaeoenvironments are inferred.
The Lower Jurassic succession includes the Marrat Formation, 102.5 m thick, that lies unconformably on the Triassic Minjur Formation, and consists of interbedded marine sandstone, carbonate and claystone deposits that are Toarcian or older in age. It is informally subdivided into lower (36.5 m), middle (41.8 m) and upper Marrat (24.2 m).
The Middle Jurassic is represented by the Dhruma and Tuwaiq Mountain formations. The Dhruma Formation, as defined here, is 336 m thick and lies unconformably on the Marrat Formation. It is mainly composed of car-bonate in the subsurface, carbonate and claystone in the central part of the outcrop area, and siliciclastics in out-crops to the north and south. Tuwaiq Mountain Forma-tion lies unconformably on the Dhruma Formation and consists mostly of shallow-marine lagoon and stro-matoporoid carbonates of Middle to Late Callovian age with a combined thickness of 295 m.
The Upper Jurassic succession consists of the Hanifa, Jubaila, Arab and Hith formations.
The Hanifa Formation lies disconformably upon the Tuwaiq Mountain Formation, is 126 m thick and consists
Copyright © 2012 SciRes. IJG
M. T. HUSSEIN ET AL.
Copyright © 2012 SciRes. IJG
73
Table 1. Jurassic stratigraphic column of Saudi Arabia (after Al Husseini, 2009).
of a lower muddy carbonate unit and an upper stromato- poroid and lagoonal carbonate lithofacies. The Jubaila Limestone lies disconformably upon the Hanifa Forma-tion and consists of moderately deep marine carbonates in the lower part that is overlain by a shallow marine stromatoporoid-associated assemblage. In the outcrop belt, the carbonates pass into sandstones to the south and northwest. The Arab Formation is approximately 54 m thick in outcrop. The Hith Anhydrite, consists mostly of anhydrite but has an upper carbonate unit, as described by Hughes [9]. It is 90 m thick at the outcrop [1].
4. Groundwater in the Study Area
Groundwater occurs in the Hubaila Limestone in zones characterized with secondary porosity created due to
faulting, jointing, solution cavities and fractures. In areas well yields is found to be of high quantities and espe-cially when these solution cavities are connected to wadies in the area [3]. The aquifer properties were esti-mated [1,10-12]. The Transmissivity was estimated dur-ing this study to be in the range between 1.7 × 10⁻³ and 7.2 × 10⁻³ m/s, and the Storage Coefficient was in the order of 1.3 × 10⁻⁴.
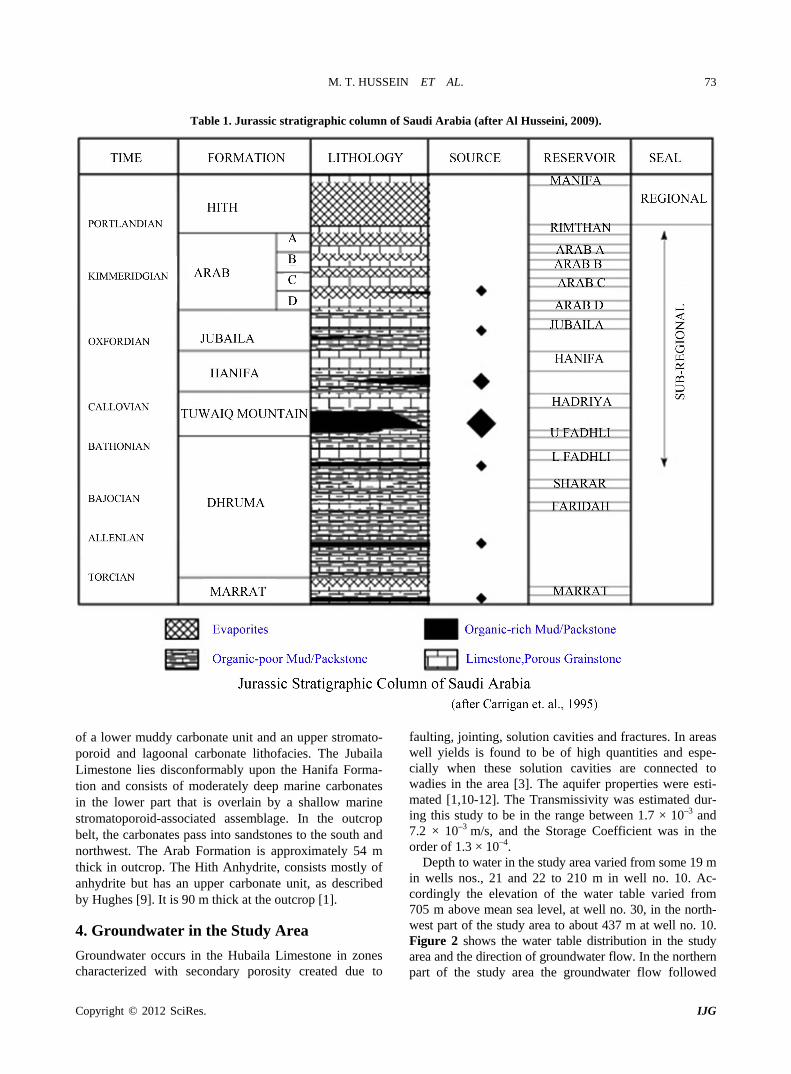
Depth to water in the study area varied from some 19 m in wells nos., 21 and 22 to 210 m in well no. 10. Ac-cordingly the elevation of the water table varied from 705 m above mean sea level, at well no. 30, in the north-west part of the study area to about 437 m at well no. 10. Figure 2 shows the water table distribution in the study area and the direction of groundwater flow. In the northern part of the study area the groundwater flow followed
M. T. HUSSEIN ET AL. 74
Figure 2. The red points are the locations of the inventored wells. that of Wadi Hanifa as shown by the flow lines. At about the center of the study area a cone of depression was no-ticed around well no. 10. At the southern end of the area the direction of groundwater flow was towards the southeast and the south direction. The average hydraulic gradient is about 0.005.
4.1. Groundwater Quality Variation
Groundwater quality in the study area varies greatly in its Electrical Conductivity (EC) from 831 to 7670 mS/cm. This variation is due to interaction between hydraulic
gradient, the nature of the water-bearing rocks and the chemical processes in action. Figure 3 shows the areal distribution of the EC in the study area. The general in-crease in EC is from the south towards the north of the study area where two major anomalies were noticed around the contour 6000 mS/cm and the contour 5000 mS/cm. This corresponds to the general direction of groundwater flow.
The main chemical composition of groundwater in the study area is summarized on Table 2. The pH measured in the field is between 6.01 and 8.30, i.e. it ranges from acidic
Copyright © 2012 SciRes. IJG

M. T. HUSSEIN ET AL. 75
Figure 3. Spatial distribution of electerical conductivity (uS/cm). water to alkaline. The same wide range in the composi-tion was found in all of the major ions, the minor ions and the total hardness of groundwater as shown (Table 2). Table 3 shows the correlation Matrix of the analyzed chemical constituents. The EC was found to be mainly correlated with Hardness, 4
2SO , Ca, Mg and Cl. These ions seem to be the most responsible of the chemical composition and variation in the water quality in Jubaila Limestone. This is understood as the occurrence of groundwater in this aquifer is mainly due to solution openings and fractures within the formation. Harness is strongly correlated with the Ca, . The Ca is, in turn
correlated with the Cl and 4 concentrations, Mg is strongly correlated with , and, Na is strongly re-lated to Cl.
24SO
2SO
24SO
2SO
The ionic relationship, using the units of milliequiva-lent per litre (meq/L), in the Jubaila Limestone is charac-terized with the following:
Na+ > Ca2+ > Mg2+
4 > Cl > 3
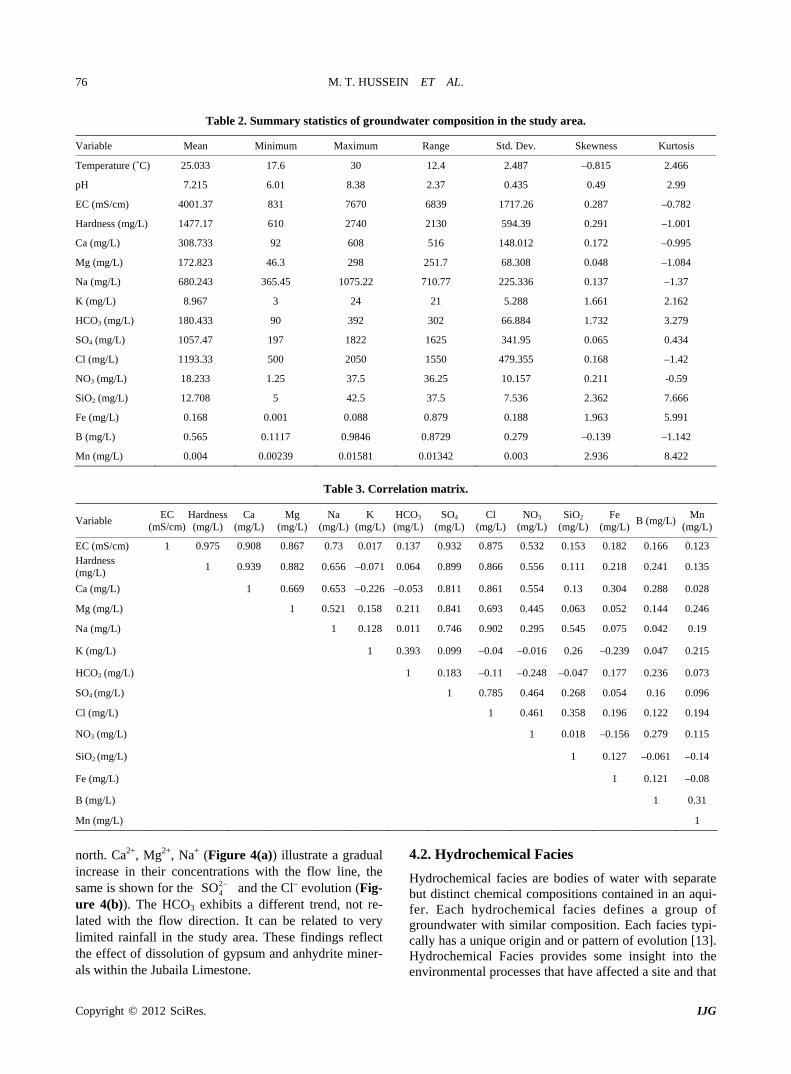
To understand more the chemical variations in the groundwater system within the study area, a hydro-chemical section was constructed. The location of this section is along the flow path from the south towards the
HCO
Copyright © 2012 SciRes. IJG
M. T. HUSSEIN ET AL. 76
Table 2. Summary statistics of groundwater composition in the study area.
Variable Mean Minimum Maximum Range Std. Dev. Skewness Kurtosis
Temperature (˚C) 25.033 17.6 30 12.4 2.487 –0.815 2.466
pH 7.215 6.01 8.38 2.37 0.435 0.49 2.99
EC (mS/cm) 4001.37 831 7670 6839 1717.26 0.287 –0.782
Hardness (mg/L) 1477.17 610 2740 2130 594.39 0.291 –1.001
Ca (mg/L) 308.733 92 608 516 148.012 0.172 –0.995
Mg (mg/L) 172.823 46.3 298 251.7 68.308 0.048 –1.084
Na (mg/L) 680.243 365.45 1075.22 710.77 225.336 0.137 –1.37
K (mg/L) 8.967 3 24 21 5.288 1.661 2.162
HCO3 (mg/L) 180.433 90 392 302 66.884 1.732 3.279
SO4 (mg/L) 1057.47 197 1822 1625 341.95 0.065 0.434
Cl (mg/L) 1193.33 500 2050 1550 479.355 0.168 –1.42
NO3 (mg/L) 18.233 1.25 37.5 36.25 10.157 0.211 -0.59
SiO2 (mg/L) 12.708 5 42.5 37.5 7.536 2.362 7.666
Fe (mg/L) 0.168 0.001 0.088 0.879 0.188 1.963 5.991
B (mg/L) 0.565 0.1117 0.9846 0.8729 0.279 –0.139 –1.142
Mn (mg/L) 0.004 0.00239 0.01581 0.01342 0.003 2.936 8.422
Table 3. Correlation matrix.
Variable EC
(mS/cm) Hardness (mg/L)
Ca (mg/L)
Mg (mg/L)
Na (mg/L)
K (mg/L)
HCO3 (mg/L)
SO4 (mg/L)
Cl (mg/L)
NO3 (mg/L)
SiO2 (mg/L)
Fe (mg/L)
B (mg/L)Mn
(mg/L)
EC (mS/cm) 1 0.975 0.908 0.867 0.73 0.017 0.137 0.932 0.875 0.532 0.153 0.182 0.166 0.123Hardness (mg/L)
1 0.939 0.882 0.656 –0.071 0.064 0.899 0.866 0.556 0.111 0.218 0.241 0.135
Ca (mg/L) 1 0.669 0.653 –0.226 –0.053 0.811 0.861 0.554 0.13 0.304 0.288 0.028
Mg (mg/L) 1 0.521 0.158 0.211 0.841 0.693 0.445 0.063 0.052 0.144 0.246
Na (mg/L) 1 0.128 0.011 0.746 0.902 0.295 0.545 0.075 0.042 0.19
K (mg/L) 1 0.393 0.099 –0.04 –0.016 0.26 –0.239 0.047 0.215
HCO3 (mg/L) 1 0.183 –0.11 –0.248 –0.047 0.177 0.236 0.073
SO4 (mg/L) 1 0.785 0.464 0.268 0.054 0.16 0.096
Cl (mg/L) 1 0.461 0.358 0.196 0.122 0.194
NO3 (mg/L) 1 0.018 –0.156 0.279 0.115
SiO2 (mg/L) 1 0.127 –0.061 –0.14
Fe (mg/L) 1 0.121 –0.08
B (mg/L) 1 0.31
Mn (mg/L) 1
north. Ca2+, Mg2+, Na+ (Figure 4(a)) illustrate a gradual increase in their concentrations with the flow line, the same is shown for the 4 and the Cl– evolution (Fig-ure 4(b)). The HCO3 exhibits a different trend, not re-lated with the flow direction. It can be related to very limited rainfall in the study area. These findings reflect the effect of dissolution of gypsum and anhydrite miner-als within the Jubaila Limestone.
4.2. Hydrochemical Facies
Hydrochemical facies are bodies of water with separate but distinct chemical compositions contained in an aqui-fer. Each hydrochemical facies defines a group of groundwater with similar composition. Each facies typi-cally has a unique origin and or pattern of evolution [13]. Hydrochemical Facies provides some insight into the environmental processes that have affected a site and that
2SO
Copyright © 2012 SciRes. IJG
M. T. HUSSEIN ET AL. 77
(a)
Figure 5. Trilinear diagram.
4.3. Saturation Index
is the logarithm of the quotient
P/K a solution is in equilibrium, under-
sa
r the minerals ca
(b)
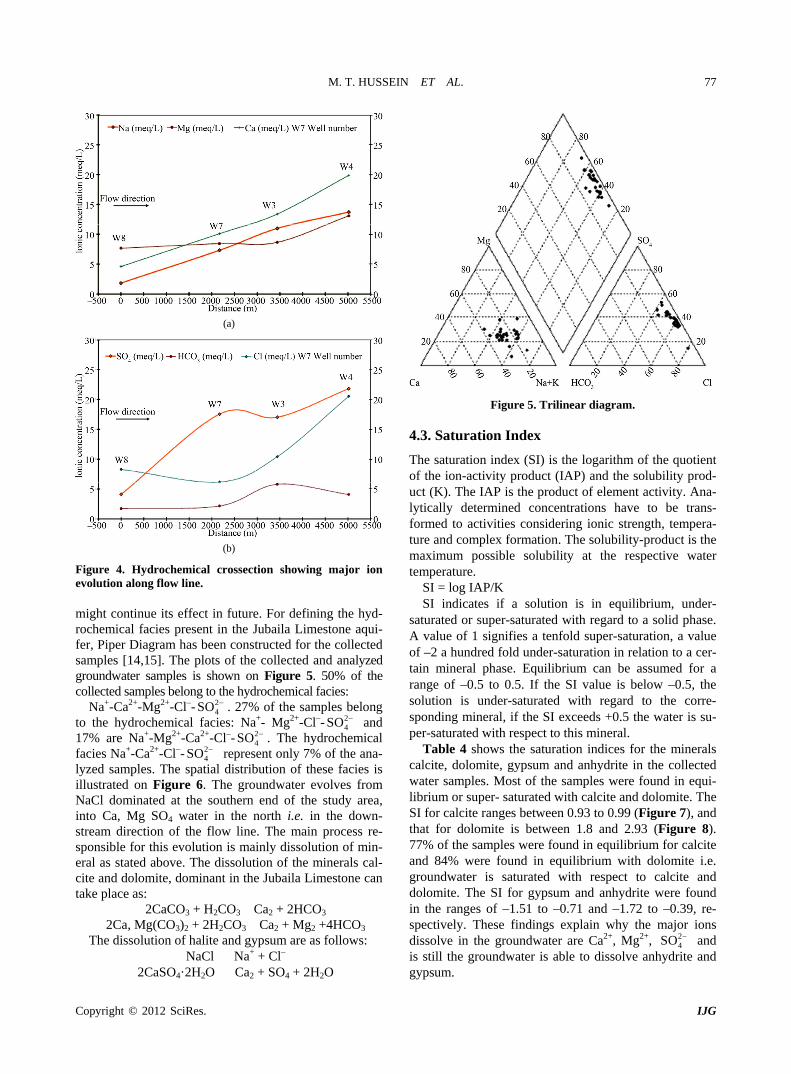
Figure 4. Hydrochemical crossection showing major ion evolution along flow line. might continue its effect in future. For defining the hyd- rochemical facies present in the Jubaila Limestone aqui-fer, Piper Diagram has been constructed for the collected samples [14,15]. The plots of the collected and analyzed groundwater samples is shown on Figure 5. 50% of the collected samples belong to the hydrochemical facies:
Na+-Ca2+-Mg2+-Cl–- 4 . 27% of the samples belong to the hydrochemical facies: Na+- Mg2+-Cl–- 4SO
2SO
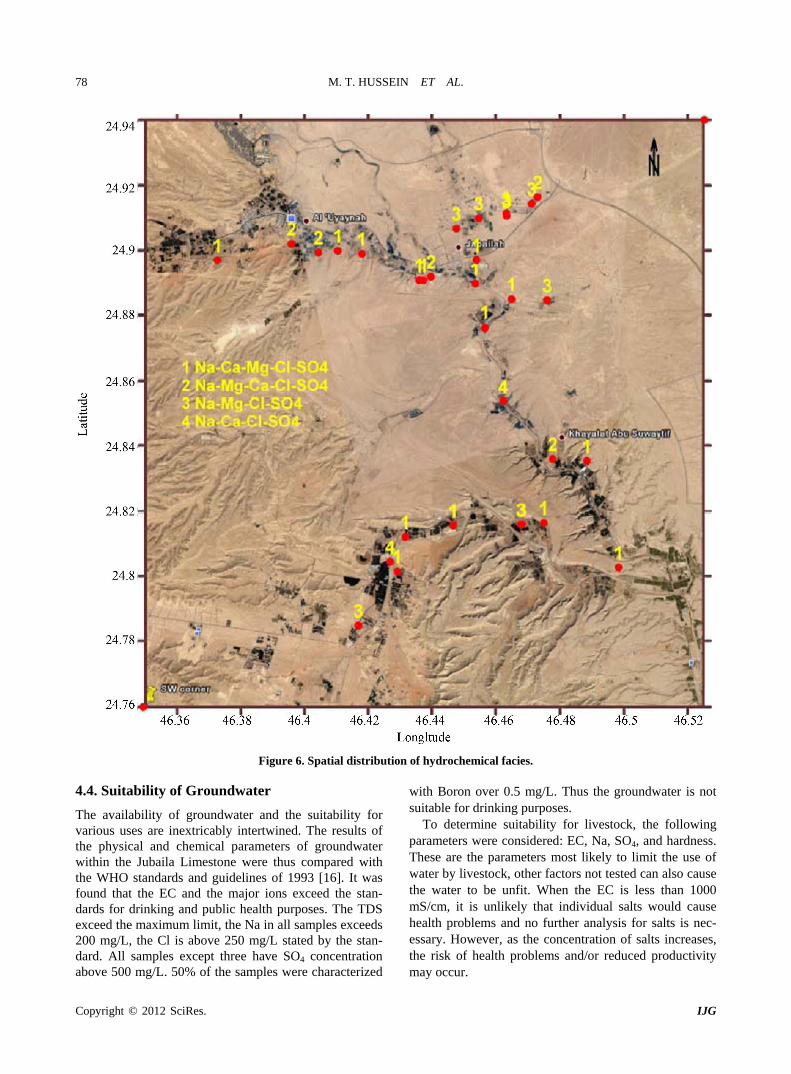
2 and 17% are Na+-Mg2+-Ca2+-Cl–- . The hydrochemical facies Na+-Ca2+-Cl–- 4 represent only 7% of the ana-lyzed samples. The spatial distribution of these facies is illustrated on Figure 6. The groundwater evolves from NaCl dominated at the southern end of the study area, into Ca, Mg SO4 water in the north i.e. in the down-stream direction of the flow line. The main process re-sponsible for this evolution is mainly dissolution of min-eral as stated above. The dissolution of the minerals cal-cite and dolomite, dominant in the Jubaila Limestone can take place as:
24SO
2
2CaSO4·2H2O Ca2 + SO4 + 2H2O
SO
2CaCO3 + H2CO3 Ca2 + 2HCO3 2Ca, Mg(CO3)2 + 2H2CO3 Ca2 + Mg2 +4HCO3
The dissolution of halite and gypsum are as follows: NaCl Na+ + Cl–
The saturation index (SI) of the ion-activity product (IAP) and the solubility prod-uct (K). The IAP is the product of element activity. Ana-lytically determined concentrations have to be trans-formed to activities considering ionic strength, tempera-ture and complex formation. The solubility-product is the maximum possible solubility at the respective water temperature.
SI = log IASI indicates if turated or super-saturated with regard to a solid phase.
A value of 1 signifies a tenfold super-saturation, a value of –2 a hundred fold under-saturation in relation to a cer-tain mineral phase. Equilibrium can be assumed for a range of –0.5 to 0.5. If the SI value is below –0.5, the solution is under-saturated with regard to the corre-sponding mineral, if the SI exceeds +0.5 the water is su-per-saturated with respect to this mineral.
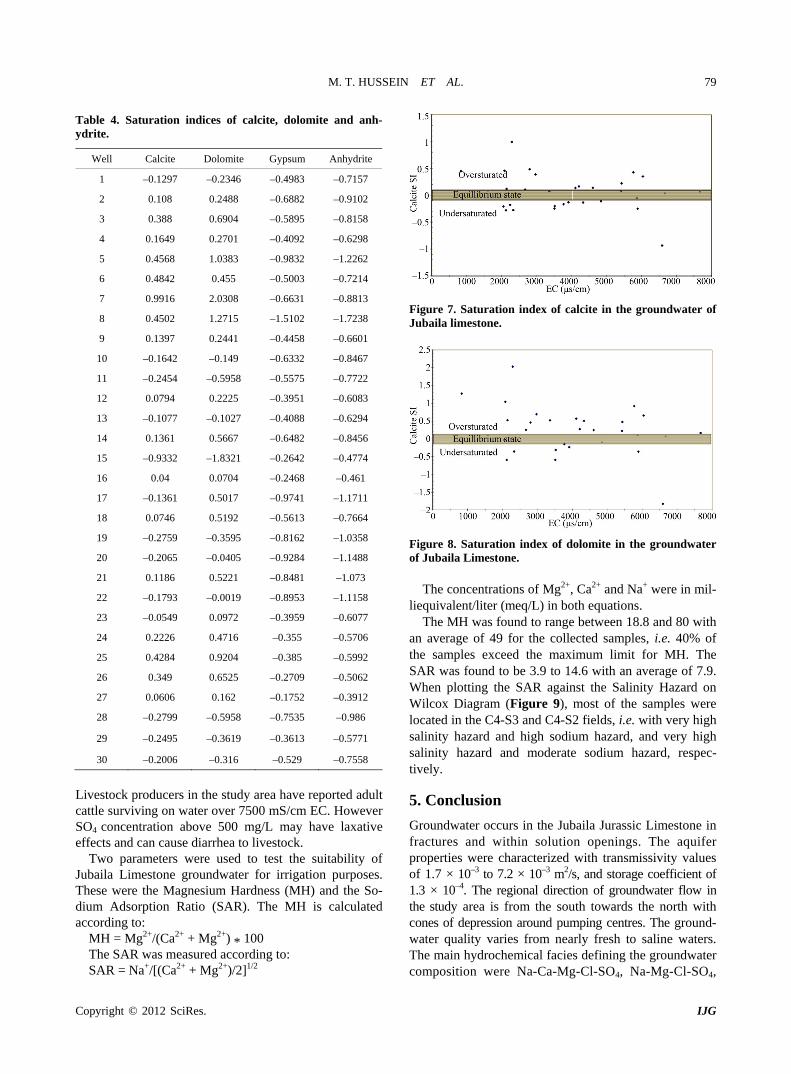
Table 4 shows the saturation indices folcite, dolomite, gypsum and anhydrite in the collected
water samples. Most of the samples were found in equi-librium or super- saturated with calcite and dolomite. The SI for calcite ranges between 0.93 to 0.99 (Figure 7), and that for dolomite is between 1.8 and 2.93 (Figure 8). 77% of the samples were found in equilibrium for calcite and 84% were found in equilibrium with dolomite i.e. groundwater is saturated with respect to calcite and dolomite. The SI for gypsum and anhydrite were found in the ranges of –1.51 to –0.71 and –1.72 to –0.39, re-spectively. These findings explain why the major ions dissolve in the groundwater are Ca2+, Mg2+, 2
4SO and is still the groundwater is able to dissolve anh e and gypsum.
ydrit
Copyright © 2012 SciRes. IJG
M. T. HUSSEIN ET AL.
Copyright © 2012 SciRes. IJG
78
Figure 6. Spatial distribution of hydrochemical facies.
.4. Suitability of Groundwater
the suitability for
with Boron over 0.5 mg/L. Thus the groundwater is not
, Na, SO , and hardness. Th
4
The availability of groundwater andvarious uses are inextricably intertwined. The results of the physical and chemical parameters of groundwater within the Jubaila Limestone were thus compared with the WHO standards and guidelines of 1993 [16]. It was found that the EC and the major ions exceed the stan-dards for drinking and public health purposes. The TDS exceed the maximum limit, the Na in all samples exceeds 200 mg/L, the Cl is above 250 mg/L stated by the stan-dard. All samples except three have SO4 concentration above 500 mg/L. 50% of the samples were characterized
suitable for drinking purposes. To determine suitability for livestock, the following
parameters were considered: EC 4
ese are the parameters most likely to limit the use of water by livestock, other factors not tested can also cause the water to be unfit. When the EC is less than 1000 mS/cm, it is unlikely that individual salts would cause health problems and no further analysis for salts is nec-essary. However, as the concentration of salts increases, the risk of health problems and/or reduced productivity may occur.
M. T. HUSSEIN ET AL. 79
Table 4. Saturation indices of calcite, dolomite and anh- ydrite.
Well Calcite Dolomite Gypsum Anhydrite
1 –0.1297 –0.2346 –0.4983 –0.7157
2 0.108 0.2488 –0.6882 –0.9102
3 0.388 0.6904 –0.5895 –0.8158
4 0.1649 0.2701 –0.4092 –0.6298
5 0.4568 1.0383 –0.9832 –1.2262
6 0.4842 0.455 –0.5003 –0.7214
7 0.9916 2.0308 –0.6631 –0.8813
8 0.4502 1.2715 –1.5102 –1.7238
9 0.1397 0.2441 –0.4458 –0.6601
10 –0.1642 –0.149 –0.6332 –0.8467
11 –0.2454 –0.5958 –0.5575 –0.7722
12 0.0794 0.2225 –0.3951 –0.6083
13 –0.1077 –0.1027 –0.4088 –0.6294
14 0.1361 0.5667 –0.6482 –0.8456
15 –0.9332 –1.8321 –0.2642 –0.4774
16 0.04 0.0704 –0.2468 –0.461
17 –0.1361 0.5017 –0.9741 –1.1711
18
Figure 7. Saturation index of calcite in the groundwater of Jubaila limestone.
0
–
–0.
.0746 0.5192 –0.5613 –0.7664
19 –0.2759 –0.3595 –0.8162 –1.0358
20 –0.2065 –0.0405 –0.9284 –1.1488
21 0.1186 0.5221 –0.8481 –1.073
22 –0.1793 –0.0019 –0.8953 –1.1158
23 –0.0549 0.0972 –0.3959 –0.6077
24 0.2226 0.4716 –0.355 –0.5706
25 0.4284 0.9204 –0.385 –0.5992
26 0.349 0.6525 –0.2709 –0.5062
27 0.0606 0.162 –0.1752 –0.3912
28 0.2799 –0.5958 –0.7535 –0.986
29 2495 –0.3619 –0.3613 –0.5771
30 –0.2006 –0.316 –0.529 –0.7558
Liv k pr in t y are repo t attle surviving on water over 7500 mS/cm EC. However
ion purposes. Th
as measured according to:
estoc oducers he stud a have rted adulcSO4
concentration above 500 mg/L may have laxative effects and can cause diarrhea to livestock.
Two parameters were used to test the suitability of Jubaila Limestone groundwater for irrigat
ese were the Magnesium Hardness (MH) and the So-dium Adsorption Ratio (SAR). The MH is calculated according to:
MH = Mg2+/(Ca2+ + Mg2+) * 100 The SAR wSAR = Na+/[(Ca2+ + Mg2+)/2]1/2
Figure 8. Saturation index of dolomite in the groundwater of Jubaila Limestone.
of Mg , Ca and Na were in mil-equivalent/liter (meq/L) in both equations.
i.e. 40% of th
clusion
rs in the Jubaila Jurassic Limestone in hin solution openings. The aquifer
The concentrations 2+ 2+ +
liThe MH was found to range between 18.8 and 80 with
an average of 49 for the collected samples,e samples exceed the maximum limit for MH. The
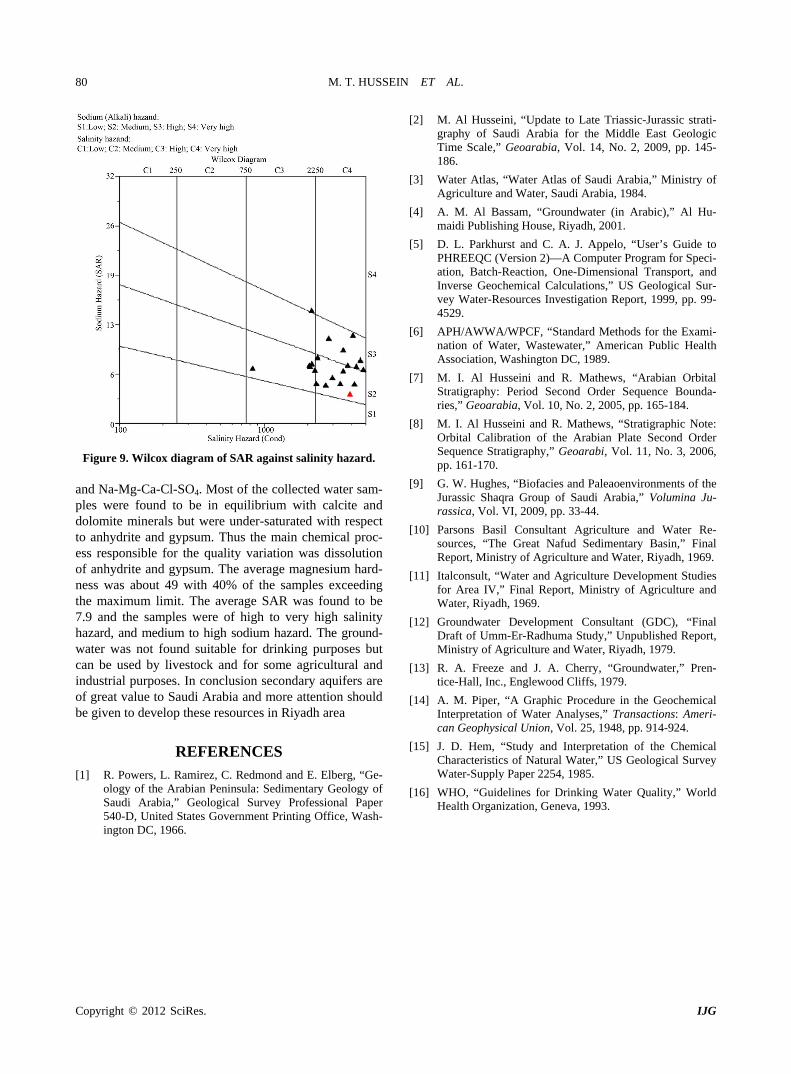
SAR was found to be 3.9 to 14.6 with an average of 7.9. When plotting the SAR against the Salinity Hazard on Wilcox Diagram (Figure 9), most of the samples were located in the C4-S3 and C4-S2 fields, i.e. with very high salinity hazard and high sodium hazard, and very high salinity hazard and moderate sodium hazard, respec-tively.
5. Con
Groundwater occufractures and witproperties were characterized with transmissivity values of 1.7 × 10⁻³ to 7.2 × 10⁻³ m2/s, and storage coefficient of 1.3 × 10⁻⁴. The regional direction of groundwater flow in the study area is from the south towards the north with cones of depression around pumping centres. The ground-water quality varies from nearly fresh to saline waters. The main hydrochemical facies defining the groundwater composition were Na-Ca-Mg-Cl-SO4, Na-Mg-Cl-SO4,
Copyright © 2012 SciRes. IJG
M. T. HUSSEIN ET AL.
Copyright © 2012 SciRes. IJG
80
rie
Figure 9. Wilcox diagram of SAR against salinity haz a
les were found to be in equilibrium with calcite and
[1] R. Powers, L. nd E. Elberg, “Ge-ology of the A entary Geolog
Arabia for the Middle East Geologic
ulture and Water, Saudi Arabia, 1984.
rogram for Speci-
Water, Wastewater,” American Public Health
Sequence Bounda-
rder
ra Group of Saudi Arabia,” Volumina Ju-
mentary Basin,” Final
huma Study,” Unpublished Report,
sactions: Ameri-
rvey
3.
ard. Sequence Stratigraphy,” Geoarabi, Vol. 11, No. 3, 2006, pp. 161-170.
[9] G. W. Hughes, “Biofacies and Paleaoenvironments of the Jurassic Shaq
nd Na-Mg-Ca-Cl-SO4. Most of the collected water sam-pdolomite minerals but were under-saturated with respect to anhydrite and gypsum. Thus the main chemical proc-ess responsible for the quality variation was dissolution of anhydrite and gypsum. The average magnesium hard-ness was about 49 with 40% of the samples exceeding the maximum limit. The average SAR was found to be 7.9 and the samples were of high to very high salinity hazard, and medium to high sodium hazard. The ground-water was not found suitable for drinking purposes but can be used by livestock and for some agricultural and industrial purposes. In conclusion secondary aquifers are of great value to Saudi Arabia and more attention should be given to develop these resources in Riyadh area
REFERENCES Ramirez, C. Redmond arabian Peninsula: Sedim y of
Water-Supply Paper 2254, 1985.
[16] WHO, “Guidelines for Drinking Water Quality,” World Health Organization, Geneva, 199Saudi Arabia,” Geological Survey Professional Paper
540-D, United States Government Printing Office, Wash- ington DC, 1966.
[2] M. Al Husseini, “Update to Late Triassic-Jurassic strati-graphy of Saudi Time Scale,” Geoarabia, Vol. 14, No. 2, 2009, pp. 145- 186.
[3] Water Atlas, “Water Atlas of Saudi Arabia,” Ministry of Agric
[4] A. M. Al Bassam, “Groundwater (in Arabic),” Al Hu-maidi Publishing House, Riyadh, 2001.
[5] D. L. Parkhurst and C. A. J. Appelo, “User’s Guide to PHREEQC (Version 2)—A Computer Pation, Batch-Reaction, One-Dimensional Transport, and Inverse Geochemical Calculations,” US Geological Sur-vey Water-Resources Investigation Report, 1999, pp. 99- 4529.
[6] APH/AWWA/WPCF, “Standard Methods for the Exami-nation ofAssociation, Washington DC, 1989.
[7] M. I. Al Husseini and R. Mathews, “Arabian Orbital Stratigraphy: Period Second Order
s,” Geoarabia, Vol. 10, No. 2, 2005, pp. 165-184.
[8] M. I. Al Husseini and R. Mathews, “Stratigraphic Note: Orbital Calibration of the Arabian Plate Second O
rassica, Vol. VI, 2009, pp. 33-44.
[10] Parsons Basil Consultant Agriculture and Water Re-sources, “The Great Nafud SediReport, Ministry of Agriculture and Water, Riyadh, 1969.
[11] Italconsult, “Water and Agriculture Development Studies for Area IV,” Final Report, Ministry of Agriculture and Water, Riyadh, 1969.
[12] Groundwater Development Consultant (GDC), “Final Draft of Umm-Er-RadMinistry of Agriculture and Water, Riyadh, 1979.
[13] R. A. Freeze and J. A. Cherry, “Groundwater,” Pren-tice-Hall, Inc., Englewood Cliffs, 1979.
[14] A. M. Piper, “A Graphic Procedure in the Geochemical Interpretation of Water Analyses,” Trancan Geophysical Union, Vol. 25, 1948, pp. 914-924.
[15] J. D. Hem, “Study and Interpretation of the Chemical Characteristics of Natural Water,” US Geological Su