Embed Size (px)
Citation preview
Overview Problem Solution Data Classification Results Appendix
Potential Undercoverage and Biasin Name-based Samples of Foreigners
Rainer Schnell1), Tobias Gramlich1), Mark Trappmann2)
1) University of Duisburg-Essen, Duisburg, Germany2) Institute for Employment Research IAB, Nurnberg, Germany
www.methodenzentrum.de and www.iab.de
The 2011 ASA Spring Methodology Conference at Tilburg University
1

Overview Problem Solution Data Classification Results Appendix
Overview
I The problem of screening for small/special populations
I The dictionary based solution: onomastics
I Problems of this approach
I Evaluation of a name based approach
I Data
I Results
2

Overview Problem Solution Data Classification Results Appendix
The problem of screening for members of specialpopulations
I In Germany there is no (exhaustive/available) sampling framein order to sample for foreigners; one solution:
1. Draw an ”ordinary general population sample” and screen atthe telephone/the door for members of the target population:expensive; inefficient; large initial sample needed
2. More efficient and less expensive: use this sampling frame ofthe general population; screen it for members of the targetpopulation before ringing the door/calling them; draw asample only out of the matches.
I What can typically be such a sampling frame? Whatcharacteristics one can use for screening for foreigners?
3

Overview Problem Solution Data Classification Results Appendix
The dictionary approach
I Often, names are part of a sampling frame (telephonedirectories; lists from the registration office: lists of members’names; name plates; ...).
I Based on the name (first/last/combination) decide whetherindividual is a member of the target population.
I Onomastics: research on names; in this context especiallymapping names to their ethnic/linguistic/cultural origin; ornationality.
I Typically, this is done using long lists of known mappingsusing name dictionaries or based on expert judgment.
4
Overview Problem Solution Data Classification Results Appendix
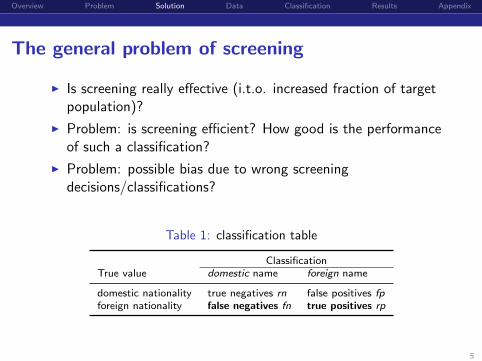
The general problem of screening
I Is screening really effective (i.t.o. increased fraction of targetpopulation)?
I Problem: is screening efficient? How good is the performanceof such a classification?
I Problem: possible bias due to wrong screeningdecisions/classifications?
Table 1: classification table
ClassificationTrue value domestic name foreign name
domestic nationality true negatives rn false positives fpforeign nationality false negatives fn true positives rp
5
Overview Problem Solution Data Classification Results Appendix
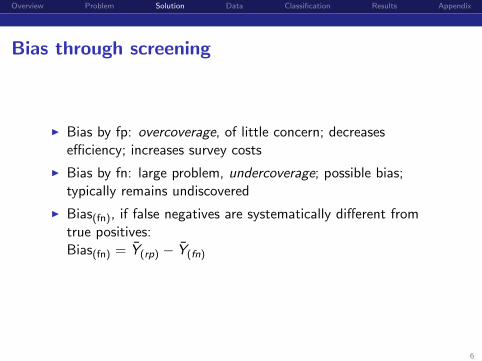
Bias through screening
I Bias by fp: overcoverage, of little concern; decreasesefficiency; increases survey costs
I Bias by fn: large problem, undercoverage; possible bias;typically remains undiscovered
I Bias(fn), if false negatives are systematically different fromtrue positives:Bias(fn) = Y(rp) − Y(fn)
6

Overview Problem Solution Data Classification Results Appendix
Evaluation of onomastic driven samples
I In cooperation with the IAB, Nurnberg: Evaluation ofonomastic based samples
I Data: Respondents to the PASS survey (wave 1 to 3)
I True status known (PASS Scientific Use File): nationality,origin, migrational background
I Covariates to study potential bias due to fn also come fromthe PASS SUF.
7

Overview Problem Solution Data Classification Results Appendix
Respondents to the PASS survey
I PASS survey is conducted yearly since 2006 by the IAB.
I About labour market and social security after labor marketreforms in Germany.
I Household panel with all persons >=16 years within thehousehold being interviewed.
I Target population: households receiving social welfare benefitsand general population households with low economic status.
I Of course, this is no normal or realistic sampling frame, butfor evaluation of potential bias in onomastic screening this isirrelevant.
8

Overview Problem Solution Data Classification Results Appendix
Evaluation using the PASS SUF
I About 21000 names of respondents to 3 waves of the PASSpanel survey.
I Permission to classify names within the IAB (names neverhave left the institute)
I First names and surnames have been classified separatelyusing a naive Bayes’ classifier.
I Names have been classified into the largest groups offoreigners in Germany (Turkey, Italy, Greece, formerYugoslavia, Russia, Poland – partly grouped).
I Evaluation of classification using SUF data from wave 1 and 2.
9

Overview Problem Solution Data Classification Results Appendix
Training data
I Bayes’ classifier was trained using names of all employedpersons.
I List of names is absolutely anonimized:I Separate lists for first and last namesI Above a certain frequencyI Names from 2004I No other characteristics but frequencies by nationality given
first and last names separately.
I In total 112 831 respectively 493 974 different first and lastnames in Germany from these separate lists.
I These lists correspond each to about 30mio persons inGermany.
10

Overview Problem Solution Data Classification Results Appendix
Classification of names
I We use a different method to classify names.
I No dictionary or expert judgment incorporated!
I Automatical classification based on relative frequency of bi- ortrigrams .
I Separate judgment for first and last name.
I Result: probability for each country given the first or lastname.
11
Overview Problem Solution Data Classification Results Appendix
Classification of names
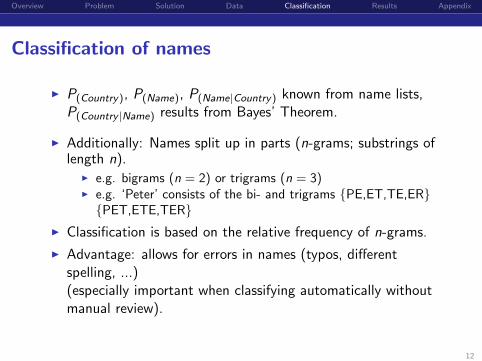
I P(Country), P(Name), P(Name|Country) known from name lists,P(Country |Name) results from Bayes’ Theorem.
I Additionally: Names split up in parts (n-grams; substrings oflength n).
I e.g. bigrams (n = 2) or trigrams (n = 3)I e.g. ‘Peter’ consists of the bi- and trigrams {PE,ET,TE,ER}{PET,ETE,TER}
I Classification is based on the relative frequency of n-grams.
I Advantage: allows for errors in names (typos, differentspelling, ...)(especially important when classifying automatically withoutmanual review).
12

Overview Problem Solution Data Classification Results Appendix
Results
I Is onomastic screening effective?
I Use bi- or trigrams?
I How to combine the separate judgment of first and last name?
I What about the quality criteria of the classification?
I Is there bias due to false negatives?
13

Overview Problem Solution Data Classification Results Appendix
Efficiency
I Does onomastic sampling increase fraction of foreignpopulation compared to SRS?
I Fraction of foreigners is at least doubled respectively fivetimes the fraction compared to SRS(when looking at specific nationalities even higher).
Table 2: Fraction of foreigners...
foreign nationality turkish nationality italian nationalityfraction gain fraction gain fraction gain
... in population 8.6 – 2.7 – 0.4 –
... if first and last name class. foreign 17.7 x2.1 5.9 x2.2 0.8 x2.0
... if first or last name class. foreign 46.6 x5.4 19.8 x7.3 2.5 x6.3
... if first and last name class. in same foreign nat. 52.1 x6.1 25.7 x9.5 2.7 x6.8
14

Overview Problem Solution Data Classification Results Appendix
Bi- or trigrams?
Table 3: True positives using bi- or trigrams
classification ...last name first names
Nationality (true value) bigrams trigrams bigrams trigrams
Germany 0.90 0.84 0.87 0.68Italy 0.69 0.79 0.42 0.51Turkey 0.63 0.75 0.55 0.77Greece 0.57 0.60 0.49 0.47
Yugoslaviaa) 0.48 0.60 0.31 0.52
Polandb) 0.31 0.36 0.23 0.42
Russiac) 0.17 0.14 0.33 0.58
Total 0.87 0.81 0.83 0.67
a) including successor statesb) including eastern European neighboring statesc) including member states of the former Soviet Union
I Trigrams produce higher proportions of true positive classifications of personswith foreign nationality.
I Different proportions of true positives for different nationalities.
15

Overview Problem Solution Data Classification Results Appendix
Combination of names? Classify nationality ororigin?
Table 4: Quality criteria of classifying first and last names
sensitivity specitivity ppv npv error rateClassification foreign nationality
only first name 0.57 0.87 0.21 0.97 0.15only last name 0.68 0.89 0.29 0.98 0.12First or last name 0.85 0.79 0.20 0.99 0.21First and last name 0.40 0.97 0.44 0.96 0.06
foreign originonly first name 0.47 0.87 0.30 0.93 0.17only last name 0.48 0.90 0.35 0.94 0.15First or last name 0.69 0.80 0.20 0.99 0.21First and last name 0.26 0.97 0.51 0.92 0.10
ppv: positive predictive value; npv: negative predictive value
I combination of first and last name classification increases rp-rate (first or lastname classified foreign).
I resp. increases rn-rate (first and last name classified foreign).
I overall error rate is lower when classifying nationality rather than origin.
16

Overview Problem Solution Data Classification Results Appendix
Quality of classification – true positives and falsepositives
Figure 1: True positive and false positive classifications
[RUS]+
[PL]+
[WORLD]
[YU]+
[GR]
[IT]
[TR]
0.0 0.1 0.2 0.3 0.4 0.5 0.6 0.7 0.8 0.9 1.0Prop. of true positive classifications
FN+LN=TS
FN=LN
FN+LN
FN|LN
+:incl. successor/neighboring statesfirst and last names, trigrams
fp: FN+LN class. foreign (TS) (5)
fp: FN=LN class. foreign (6)
fp: FN+LN class. foreign (3)
fp: FN|LN class. foreign (1)
0.0 0.1 0.2 0.3 0.4 0.5 0.6 0.7 0.8 0.9 1.0
0.0 0.1 0.2 0.3 0.4 0.5 0.6 0.7 0.8 0.9 1.0Prop. of false positive classifications
First and last names, trigramsShare of all German names
I Classification works differently for different nationalities (best for Turkishpersons, worst fur Russians)
I Success depends on classification rule (FN OR LN classified foreign vs. FN andLN match specific nationality).
I Depending on rule proportion of false positive classifications increases.
17
Overview Problem Solution Data Classification Results Appendix
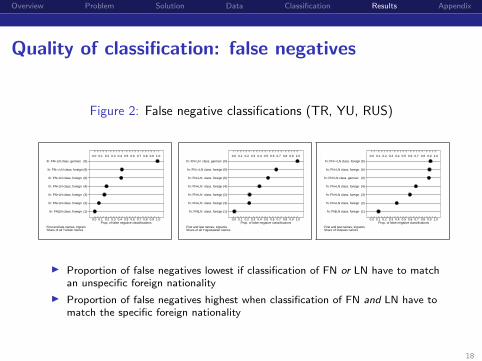
Quality of classification: false negatives
Figure 2: False negative classifications (TR, YU, RUS)
fn: FN|LN class. foreign (1)
fn: FN+LN class. foreign (2)
fn: FN+LN class. foreign (3)
fn: FN+LN class. foreign (4)
fn: FN=LN class. foreign (6)
fn: FN==LN class. foreign (5)
fn: FN+LN class. german (0)
0.0 0.1 0.2 0.3 0.4 0.5 0.6 0.7 0.8 0.9 1.0
0.0 0.1 0.2 0.3 0.4 0.5 0.6 0.7 0.8 0.9 1.0Prop. of false negative classifications
First and last names, trigramShare of all Turkish names
fn: FN|LN class. foreign (1)
fn: FN+LN class. foreign (3)
fn: FN+LN class. foreign (2)
fn: FN+LN class. foreign (4)
fn: FN=LN class. foreign (6)
fn: FN==LN class. foreign (5)
fn: FN+LN class. german (0)
0.0 0.1 0.2 0.3 0.4 0.5 0.6 0.7 0.8 0.9 1.0
0.0 0.1 0.2 0.3 0.4 0.5 0.6 0.7 0.8 0.9 1.0Prop. of false negative classifications
First and last names, trigramsShare of all Yugoslawian names
fn: FN|LN class. foreign (1)
fn: FN+LN class. foreign (2)
fn: FN+LN class. foreign (3)
fn: FN+LN class. foreign (4)
fn: FN+LN class. german (0)
fn: FN=LN class. foreign (6)
fn: FN==LN class. foreign (5)
0.0 0.1 0.2 0.3 0.4 0.5 0.6 0.7 0.8 0.9 1.0
0.0 0.1 0.2 0.3 0.4 0.5 0.6 0.7 0.8 0.9 1.0Prop. of false negative classifications
First and last names, trigramsShare of Russian names
I Proportion of false negatives lowest if classification of FN or LN have to matchan unspecific foreign nationality
I Proportion of false negatives highest when classification of FN and LN have tomatch the specific foreign nationality
18

Overview Problem Solution Data Classification Results Appendix
Efficiency and quality
I Automatic onomastic screening is effective
I Efficiency depends on classification rule
I Quality also depends on classification rule
I Onomastic screening works differently for names fromdifferent countries
19

Overview Problem Solution Data Classification Results Appendix
Bias in demographic variables
Table 5: Bias: sex, age, marital status, and region
Sex Age Marital Status Region% female years % married % single % East
True value (all foreigners) 52.2 37.6 51.5 21.3 14.0fn1: FN & LN class. German +12.2 +5.0 +4.0 +2.5 −5.1fn2: FN | LN class. German +7.8 +1.8 +1.9 −2.0 −0.9
I Higher fraction of females and married persons among false negatives
I False negatives are older and less frequent residing in Eastern Germany
20

Overview Problem Solution Data Classification Results Appendix
Bias in demographic variables
Table 6: Bias: distribution of hh income
mean median p10 p90 ginia)
hh incomeTrue value (all foreigners) 1474 1300 620 2500 0.304fn1: FN & LN class. German +202 1600 652 3500 0.297fn2: FN | LN class. German +88 1300 622 2700 0.289
ind. net income
True value (all foreigners) 1165 1050 350 2000 0.352fn1: FN & LN class. German +533 1400 475 3000 0.343fn2: FN | LN class. German +152 1100 389 2000 0.338
a) all foreigners, respectively without false negatives
I Higher individual and household income among false negatives.
I Concentration of income is overestimated without false negatives.
21

Overview Problem Solution Data Classification Results Appendix
Bias in labor force status
Table 7: Bias: labor force status
employed unemployed maternity leave% % %
all foreignersTrue values (all foreigners) 19.7 42.4 3.3fn1: FN & LN class. German +10.6 −6.4 +5.7fn2: FN | LN class. German +2.4 −2.6 +1.0
female foreigners
True values (female foreigners) 12.8 36.0 6.0fn1: FN & LN class. German +10.0 −6.2 +8.0fn2: FN | LN class. German +3.0 +0.2 +1.1
I Higher proportion of employed persons/on maternity leave among falsenegatives.
I Lower proportion of unemployed persons.
22

Overview Problem Solution Data Classification Results Appendix
Bias in education
Table 8: Bias: education (highest degree)
all foreignerswithout degree Haupts. mittl. Reife Abitur
True values (all foreigners) 17.0 29.3 20.9 23.8fn1: FN & LN class. German −6.1 −13.5 −7.8 +17.8fn2: FN | LN class. German −6.3 −3.4 −4.3 +7.0
female foreigners
True values (all foreigners) 19.1 24.9 23.0 24.2fn1: FN & LN class. German −5.2 −12.6 +1.6 +21.9fn2: FN | LN class. German −7.6 −2.7 +4.3 +7.5
I Lower proportion of lower educational degrees among false negatives
I especially women classified false negative often have higher educational degrees.
23

Overview Problem Solution Data Classification Results Appendix
Bias in religion, subj. indicators
Table 9: Bias: religion, share of Muslims
member of rel. comm. Muslims ”very religious”% % %
True values (all foreigners) 74.1 51.8 15.9fn1: FN & LN class. German −8.5 −42.0 +1.3fn2: FN | LN class. German −6.6 −42.0 −2.7
I Large differences (lower proportions) for false negatives in the membership inreligious communities and especially in the proportion of Muslims
Table 10: Bias: subj. indicators (satisfaction with...)
means of responses on 11-points scalehealth flat living standard life in general social participation
True values (all foreigners) 7.1 6.8 5.9 6.4 6.4fn1: FN & LN class. German −0.1 +0.4 +0.6 +0.3 +0.1fn2: FN | LN class. German +0.0 +0.2 +0.1 +0.2 −0.1
I No/small bias in subjective indicators introduced by false negatives.
24

Overview Problem Solution Data Classification Results Appendix
Bias in language use
Table 11: Bias: language use
language different from German used ...in pers. int. in hh int. mainly in hh mainly in hh with friends
True values (all foreigners) 16.9 17.9 52.4 73.2 44.8fn1: FN & LN class. German −7.5 −8.5 −21.0 −26.8 −17.9fn2: FN | LN class. German +0.1 +0.2 −2.8 −9.9 −1.6
I Large differences in the language use of false negatives within thehousehold/among friends.
I Lower proportions of languages other than German.
25

Overview Problem Solution Data Classification Results Appendix
Summary and conclusion
I Onomastic screening and sampling is effective.
I There is a trade off between efficiency and potential bias
I There is large bias due to false negatives, but not necessarilyon all variables
I Especially variables connected to integration show large biases
I Especially for female foreigners bias due to false negatives islarge
26

Overview Problem Solution Data Classification Results Appendix
Performance of screening
I Several criteria to judge quality of classification:
1. Sensitivity = rp-rate = rprp+fn
2. Specifity = rn-rate = rnrn+fp
3. positive predictive value = rprp+fp
4. negative predictive value = rnrn+fn
I Generally, if rp increases also fp increases; if rn increases alsofn increases.
I Generally, 1-4 are unknown, since true status of classificationis not known (at least rn and fn are typically unknown).
27

Overview Problem Solution Data Classification Results Appendix
Performance of screening
I 1610 persons with foreign nationality; overall performance
I RP(VN|NN) = 93.7%, RP(VN+NN) = 63.4%, RP(VN=NN) = 37.5%
I FN(VN+NN) = 6.3%, FN(VN|NN) = 36.6%
28

Overview Problem Solution Data Classification Results Appendix
Data: nationalities in PASS
Table 12: PASS nationalities, wave 1 and 2
Nationality Persons in %
Germany 19 341 90.7Turkey 632 3.0
Russiaa) 287 1.4
Yugoslaviab) 209 1.0
Polandc) 127 0.6Italy 84 0.4Greece 56 0.3other World 525 2.5
Total 21 327 100.0a) including former members of the former Soviet Unionb) including successor statesc) together with eastern European neighboring countries
29
Overview Problem Solution Data Classification Results Appendix
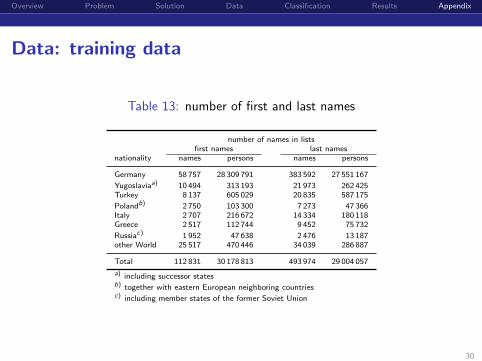
Data: training data
Table 13: number of first and last names
number of names in listsfirst names last names
nationality names persons names persons
Germany 58 757 28 309 791 383 592 27 551 167
Yugoslaviaa) 10 494 313 193 21 973 262 425Turkey 8 137 605 029 20 835 587 175
Polandb) 2 750 103 300 7 273 47 366Italy 2 707 216 672 14 334 180 118Greece 2 517 112 744 9 452 75 732
Russiac) 1 952 47 638 2 476 13 187other World 25 517 470 446 34 039 286 887
Total 112 831 30 178 813 493 974 29 004 057
a) including successor statesb) together with eastern European neighboring countriesc) including member states of the former Soviet Union
30

Overview Problem Solution Data Classification Results Appendix
Classification of names
I P(Country), P(Name), P(Name|Country) known from name lists,P(Country |Name) results from Bayes’ Theorem
I classify a name according to the highest probability for a
country given this name
Table 14: example: ‘Tobias’
Persons PName PCountry PName|Country PCountry|NameNationality ‘Tobias’ Total
A 1000 15000000 0.625 0.980 0.0001 0.0001B 500 150000 0.313 0.015 0.0033 0.0708C 50 30000 0.031 0.003 0.0017 0.0177D 50 20000 0.031 0.002 0.0025 0.0398
31
Overview Problem Solution Data Classification Results Appendix
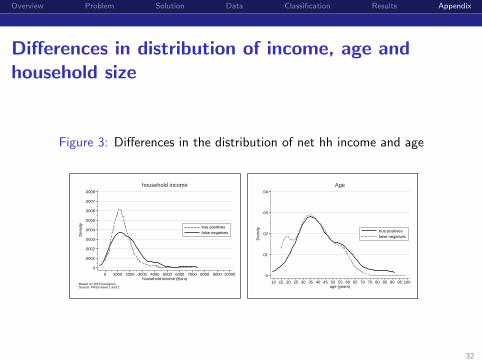
Differences in distribution of income, age andhousehold size
Figure 3: Differences in the distribution of net hh income and age
0
.0001
.0002
.0003
.0004
.0005
.0006
.0007
.0008
Den
sity
0 1000 2000 3000 4000 5000 6000 7000 8000 9000 10000household income (Euro)
true positivesfalse negatives
Based on 1610 foreignersSource: PASS wave 1 and 2
household income
0
.01
.02
.03
.04
Den
sity
10 15 20 25 30 35 40 45 50 55 60 65 70 75 80 85 90 95 100age (years)
true positivesfalse negatives
Age
32

Overview Problem Solution Data Classification Results Appendix
Results: Bias ”index of integration”
I PCA with 14 dependent variables (age, sex, employmentstatus, education, language use, hh size, subj. indicators,health indicators)
I 7 PCs with Eigenvalue>=1, screeplot: 1 PC
I Scores from the 1st PC: Are there differences in this ”index ofintegration”?
I Significant differences between all foreigners and falsenegatives (median test)
Table 15: Bias: index of integration (PC Scores)
Mean scores on...1. PC 2. PC 3. PC
True values (all foreigners) 0.00 −0.01 −0.29fn1: FN & LN class. German +0.33 +0.19 +0.73fn2: FN | LN class. German +0.13 +0.05 +0.29
33