Embed Size (px)
Citation preview

Posted at the Institutional Resources for Unique Collection and Academic Archives at Tokyo Dental College,
Available from http://ir.tdc.ac.jp/
Title
Potential of fluid-attenuated inversion recovery
(FLAIR) in identification of temporomandibular
joint effusion compared with T2-weighted images.
Author(s)
Alternative
Imoto, K; Otonari-Yamamoto, M; Nishikawa, K; Sano,
T; Yamamoto, A
JournalOral surgery, oral medicine, oral pathology, oral
radiology, and endodontics, 112(2): 243-248
URL http://hdl.handle.net/10130/2532
Right
1
Potential of FLAIR in identification of temporomandibular joint effusion in
comparison with T2-weighted images
Kenichi Imoto,DDS, a,b Mika Otonari-Yamamoto, DDS, PhD,b
Keiichi Nishikawa, PhD,b Tsukasa Sano, DDS, PhD,b
Aya Yamamoto, DDS, PhD,b
a Oral Health Science Center HRC7,
Tokyo Dental College
b Department of Oral and Maxillofacial Radiology,
Tokyo Dental College
Address for Correspondence:
Kenichi Imoto, D.D.S.
Department of Oral and Maxillofacial Radiology
Tokyo Dental College
1-2-2, Masago, Mihama-ku, Chiba, 261-8502 Japan
Business Phone: 81-(0)43-270-3961
Home Phone: 81-(0)43-211-0167
Fax: 81-(0)43-270-3963
E-mail: [email protected]

2
Acknowledgements
This research was supported by Oral Health Science Center Grant HRC7 from Tokyo
Dental College, and by a “High-Tech Research Center” Project for Private Universities:
matching fund subsidy from MEXT (Ministry of Education, Culture, Sports, Science
and Technology) of Japan, 2006-2010.
We would like to thank Associate Professor Jeremy Williams, Tokyo Dental College,
for his assistance with the English of this manuscript.
1
Abstract
Objective. The purpose of this study was to determine the potential of fluid attenuated
inversion recovery (FLAIR) sequence images in the identification of joint effusion (JE)
in comparison with T2-weighted images.
Study design. A total of 31 joints (28 patients) with JE were investigated by magnetic
resonance imaging. Regions of interest were placed over JE, cerebrospinal fluid (CSF)
and gray matter (GM) on T2-weighted and FLAIR images and their signal intensities
compared. The signal intensity ratios (SIRs) of JE and CSF were calculated used GM as
the reference point. The Pearson product-moment correlation coefficient was used for
the statistical analysis.
Result. The SIR of JE showed a strong correlation between T2-weighted and FLAIR
images. However, no correlation was observed for CSF. The average suppression ratio
for JE was lower than that for CSF.
Conclusion. MRI using FLAIR sequences revealed that JE was not only water content,
but a fluid accumulation containing elements, such as protein. Further studies are
needed and FLAIR sequences could be useful for the diagnosis of pain and symptoms
of the TMJ.
2
Magnetic resonance imaging (MRI) can be used for visualization of the
temporomandibular joint (TMJ). Earlier studies have used it to investigate disk
morphology and position,1 osseous change in the condyle2 and joint effusion (JE).3,4
High signal intensity from the upper and lower joint spaces on T2-weighted images is
considered to indicate JE.4-8 Joint effusion in the TMJ on MRI was first investigated by
Harms et al.5, followed by a number of subsequent studies aimed at clarifying its
association with TMJ pain and symptoms6 and intra-articular pathosis.7 While some
studies have suggested a correlation between JE and TMJ pain,8-10 others have found no
such correlation.11,12 From a biochemical perspective, it has been suggested that JE is
related to inflammatory changes seen in patients with disorders of the TMJ.13
Furthermore, microscopic investigation revealed that JE may reflect synovitis.14,15
Gynther et al.16 found that the inflammatory changes brought about by synovitis in the
TMJ induced hyperplasia of the synovial cell layer. Segami et al.17 suggested that there
was a strong correlation between hyperplastic synovial tissue and amount of JE.
Inflammation of synovial tissue may result in an increase in its signal intensity to a
level almost equal to that obtained with JE on T2-weighted images. It is possible that JE
indicates inflammation of the synovial membrane tissue itself. Although much research
has been carried out on JE, its detection by MRI remains problematic, and identification
by T2-weighted images alone is difficult. In this study, we investigated the potential of
fluid attenuated inversion recovery (FLAIR) sequence images to demonstrate JE in
comparison with T2-weighted images. Employing T2-weighted images, FLAIR is often
used to suppress cerebrospinal fluid (CSF), allowing differentiation between CSF and
3
brain lesions.18 We hypothesized that the signal intensity of JE would be lower on
FLAIR images, provided that JE comprised mainly fluid, as does CSF. A signal
intensity on FLAIR may be depending on amount of protein in the JE. Our another
hypothesis is that more TMJ pain a patient has, more protein JE has. As a result, a TMJ
with more pain would show increased signal on FLAIR images. Based on this
hypothesis, we compared the signal intensities of JE obtained from T2-weighted and
FLAIR images and investigated the relationship between them retrospectively.
4
Materials and methods
Magnetic resonance images were obtained from patients referred to our department at
Tokyo Dental College Chiba Hospital in 2004, 2005 and 2008. Informed consent was
obtained from all patients and the study protocol was approved by the Ethical Review
Board of our institution (No.139). This study was based on 232 joints of 116 patients.
According to the inclusion and exclusion criteria (Table I), 201 joints were excluded
from this study. A total of 31 joints of 28 patients were studied. A total of 31 joints of 28
patients were studied. There were 4 males and 24 females. The mean age of the patients
was 39.9 years with an age range of 13 to 76 years.
All images were obtained with the 1.5 Tesla MR Imager (Magnetom Symphony,
Siemens, Erlangen, Germany), using a double loop array coil. Using a fast-spin echo
sequence, T2-weighted and FLAIR sagittal images were obtained at the closed-mouth
position (Figure 1). Table II shows the parameters employed for both sets of images .
Echo times (TE) of 122 ms and 168 ms were used for the FLAIR images. During our
study, TE was changed to TE 168 ms to improve attempt the contrast as a result of the
examination of FLAIR images with TE 122 ms images obtained with 2004-05. Images
were obtained with a TE of 122 and 168 ms in 15 and 13 patients, respectively.
Amount of TMJ fluid on the T2-weighted images was determined by the method of
Larheim et al.19 Accordingly, fluid content in the joints was categorized as moderate,
marked, or extensive.
Images were saved as DICOM files. Signal intensity was determined using the public
domain image analysis software ImageJ 1.37j (NIH, USA). Measurements of signal
intensity were performed on both the T2-weighted and FLAIR images by one of the

5
authors. The decision as to which images were suitable for ROI selection for each area
by two sequences was made by a consensus of two oral and maxillofacial radiologists.
The signal intensity of gray matter (GM) was taken as the reference point. Regions of
interest (ROI) were placed over the GM, CSF and JE. The size of the ROI and its
position on the CSF and GM were determined according to the method of Yajima et al.
20 A 6.25 mm2 for TE of 122ms or a 6.86 mm2 for TE of 168 ms as ROI were defined. 20
The maximal area of JE on the T2-weighted images was defined as the ROI for JE
(Figure2). An average area were 3.45 mm2 (ranging from 1.29 – 9.09 mm2 ) for TE of
122ms and 7.15 mm2 (ranging from 1.80 – 18.45 mm2) for TE of 168ms. A 0.25 mm2
for TE of 122ms or a 0.34 mm2 for TE of 168 ms as ROI were defined and placed over
CSF. They were placed closest to the mandibular condyle on a line perpendicular to the
top of the condyle.20
The signal intensity ratio (SIR)s of JE and CSF were calculated as follows: SIR =
the signal intensity of JE or CSF/the signal intensity of GM. In the FLAIR sequence
images, the patients were divided into Group A (TE, 122 ms) and Group B (TE, 168
ms) for the statistical analysis. The Pearson product-moment correlation coefficient was
used to assess the correlation between the SIRs on the T2-weighted and FLAIR images
of both JE and CSF. A probability of less than 0.05 was considered statistically
significant. The suppression ratios of the signal intensities in FLAIR imaging were also
compared according to the following equation: (SIR of T2-weighted imagesSIR of
FLAIR images)/SIR of T2-weighted images × 100 (Figure 3).

6
Results
The SIRs obtained for JE and CSF on T2-weighted and FLAIR images are shown in
Table III. The average SIR of JE was higher than that of CSF on both T2-weighted and
FLAIR images in both Groups A and B.
A strong correlation between T2-weighted images and FLAIR images was obtained
for JE in both groups. The correlation coefficient was 0.81 in Group A and 0.94 in
Group B (Figures 4 and 5). On the other hand, no correlation was found between the
two sets of images for CSF (0.09 in Group A、-0.33 in Group B).
The average suppression ratio for the signal intensity of JE by FLAIR imaging was
36.9% in Group A and 16.3% in Group B. The ratio for CSF was 75.6% in Group A and
71.7% in Group B (Table IV). The signal intensity of CSF was suppressed more
markedly than that of JE.

7
Discussion
Joint effusion is considered to be a pathological collection of joint fluid that can only
be observed on T2-weighted images. Hitherto, the only way to determine the presence
of JE has been by amount of fluid present in the joint. We hypothesized that the FLAIR
technique would provide additional information for clarification of JE.
In this study, a strong correlation was found between T2-weighted images and
FLAIR images in both groups for JE. On the other hand, no such correlation was found
for CSF.
A reduction in signal intensity was observed for JE on FLAIR sequence images.
However, the average suppression ratio for JE was lower than that for CSF. If JE
comprised liquid components similar to those of CSF, the suppression ratio for JE
would not have differed from that for CSF. This indicates that the liquid content of JE
differs somewhat to that of CSF, and that some element in JE induces a shortened T1
relaxation time in MRI.
Joint effusion is believed to represent not only exudation from inflamed tissue, but
also hypertrophic synovium in the joint.21-23 Hypertrophic synovium is a characteristic
of synovitis seen in the patients with internal derangement.16 Synovitis has been
observed arthroscopically and studied to clarify histological changes in disorders of the
TMJ.24,25 Synovial hyperplasia, vasucularity and an increase in inflammatory cells are
all characteristic changes brought about by synovitis.14,15 In an arthroscopic study,
Segami et al.17 investigated whether JE indicated the presence of synovitis by
comparing amounts of JE and degree of synovitis. They found that joints with effusion
had more pronounced synovitis than joints with no effusion, and, moreover, amount of

8
JE increased according to severity of synovitis. It is possible that JE indicates
morphological changes brought about by synovitis such as hyperplastic synovium, as
the signal intensity for such inflammatory synovial tissues would not be suppressed,
unlike that for CSF. However, synovitis was predominantly observed in the posterior
disk attachment in arthroscopic studies.16, 26-28 Joint effusion is usually located in the
anterior recess of the upper joint space. In this study, too, the maximal area of JE was
always observed in the anterior recess of the upper joint space, and this is where the
ROI was placed. To our knowledge, this is the first study to report that hyperplastic
synovium was observed predominantly in the anterior recess of the upper joint space.
These results strongly suggest that JE indicates morphological change in synovial
tissue.
There are several different contents in JE, such as protein or polysaccaride.29 In a
study on the relationship between joint effusion, joint pain and protein levels in joint
lavage fluid obtained from patients with internal derangement or osteoarthritis of the
TMJ, Takahashi et al.7 found that painful joints were more likely to show joint effusion
on MRI and that protein levels in joint lavage fluid recovered from those joints was
higher than that obtained from pain-free joints. In another study on the relationship
between amount of JE and levels of total protein and proinflammatory cytokines in
synovial fluid from patients with internal derangement or osteoarthrosis of the TMJ,
Segami et al.6 found that synovial fluid in TMJs with internal derangement or
osteoarthrosis and JE contained higher concentrations of total protein and
proinflammatory cytokines IL-6 and IL-8 than did synovial fluid in TMJs without JE.
These two earlier studies indicated that JE contains a high level of protein derived
9
from inflammatory synovial tissues. Protein can induce a shortening of T1 relaxation
time.30 This suggests that the average suppression ratio of signal intensity for JE was
lower than that for CSF in this study because higher amounts of proteins were present
in the JE, which would be consistent with the results of these earlier studies.
If JE contains secondary products produced by inflamed synovium, the signal
intensity of joint fluid in asymptomatic TMJs and its suppression ratio on FLAIR
images would differ from those for JE. Further study investigating joint fluid from
volunteers with no TMJ symptoms is needed to clarify this point, however.
Takahashi et al.7 found that mean protein concentration in pain-free joints with JE
was higher than that in pain-free joints without JE, although the difference was not
statistically significant. On the other hand, mean protein concentration in painful,
JE-free joints was significantly higher than that in JE-free joints that were not painful.
Therefore, they suggested that elevated protein levels may be correlated with joint pain
rather than JE. Joint pain, a representative symptom of TMJ disorders, may be
correlated with signal intensity in joint fluid, including JE, on FLAIR images. Further
study is needed to clarify the clinical significance of JE in joint pain, however.
Although the average suppression ratio of signal intensity for JE by FLAIR imaging
with a TE of 122 ms was higher than that with a TE of 168 ms in this study, this may be
considered to be within the margin of error, as the standard deviation of the average
suppression ratio of signal intensity for JE was relatively high (Table IV).
In conclusion, MRI using FLAIR sequences revealed that JE was not only water
content, but a fluid accumulation containing protein elements. However, we do not
know whether this fluid accumulation containing protein elements can be specialized in
10
only JE yet. The further study, which investigates the content of small amount of joint
fluid using FLAIR image is needed. Moreover, the correlation between the suppression
ratio of signal intensity for JE by FLAIR imaging and clinical symptom should be
analyzed. Depending on further studies, FLAIR sequences could be useful for the
diagnosis of pain and symptoms of the TMJ.

11
References
1. Katzberg RW, Schenck J, Roberts D, Tallents RH, Manzione JV, Hart HR, Foster TH,
Wayne WS, Bessette RW. Magnetic resonance imaging of the temporomandibular joint
meniscus. Oral Surg Oral Med Oral Pathol 1985;59:332-5.
2. Kirk WS Jr. A comparative study of axial corrected tomography with magnetic
resonance imagery in 35 joints. Oral Surg Oral Med Oral Pathol 1989;68:646-52.
3. Schellhas KP, Wilkes CH, Omlie MR, Peterson CM, Johnson SD, Keck RJ, Block JC,
Fritts HM, Heithoff KB. The diagnosis of temporomandibular joint disease:
two-compartment arthrography and MR. AJR Am J Roentgenol 1988;151:341-50.
4. Westesson PL, Brooks SL. Temporomandibular joint: relationship between MR
evidence of effusion and the presence of pain and disk displacement. Am J Roentgenol
1992;159:559-63.
5. Harms SE, Wilk RM, Wolford LM, Chiles DG, Milam SB. The temporomandibular
joint: magnetic resonance imaging using surface coils. Radiology 1985;157:133-6.
6. Segami N, Miyamaru M, Nishimura M, Suzuki T, Kaneyama K, Murakami K. Does
joint effusion on T2 magnetic resonance images reflect synovitis? Part 2.Comparison of
concentration levels of proinflammatory cytokines and total protein in synovial fluid of
the temporomandibular joint with internal derangements and osteoarthrosis. Oral Surg
Oral Med Oral Pathol Oral Radiol Endod 2002;94:515-21.
7. Takahashi T, Nagai H, Seki H, Fukuda M. Relationship between joint effusion, joint
pain, and protein levels in joint lavage fluid of patients with internal derangement and
osteoarthritis of the temporomandibular joint. J Oral Maxillofac Surg 1999;57:1187-93.
8. Schellhas KP, Wilkes CH. Temporomandibular joint inflammation: comparison of
12
MR fast scanning with T1- and T2-weighted imaging techniques. Am J Roentgenol
1989;153:93-8.
9. Larheim TA, Westesson PL, Sano T. MR grading of temporomandibular joint fluid:
association with disk displacement categories, condyle marrow abnormalities and pain.
Int J Oral Maxillofac Surg 2001;30:104-12.
10. Yamamoto M, Sano T, Okano T. Magnetic resonance evidence of joint fluid with
temporomandibular joint disorders. J Comput Assist Tomogr 2003;27:694-8.
11. Murakami K, Nishida M, Bessho K, Iizuka T, Tsuda Y, Konishi J. MRI evidence of
high signal intensity and temporomandibular arthralgia and relating pain. Does the high
signal correlate to the pain? Br J Oral Maxillofac Surg 1996;34:220-4.
12. Adame CG, Monje F, Offnoz M, Martin-Granizo R. Effusion in magnetic resonance
imaging of the temporomandibular joint: a study of 123 joints. J Oral Maxillofac Surg
1998;56:314-8.
13. Seki H, Fukuda M, Iino M, Takahashi T, Yoshioka N. Immunohistochemical
localization of cyclooxygenase-1 and -2 in synovial tissues from patients with internal
derangement or osteoarthritis of the temporomandibular joint. Int J Oral Maxillofac
Surg. 2004:33:687-92.
14. Gynther GW, Dijkgraaf LC, Reinbolt FP, Holmlund AB, Liem RS, de Bont LG.:
Synovial inflammation in arthroscopically obtained biopsy specimens from the
temporomandibular joint: A review of the literature and a proposed histologic grading
system. J Oral Maxillofac Surg 1998;56:1281-6.
15. Segami N, Nishimura M, Kaneyama K, Miyamaru M, Sato J, Murakami K. Does
joint effusion on T2 magnetic resonance images reflect synovitis? Comparison of
13
arthroscopic findings in internal derangements of the temporomandibular joint. Oral
Surg Oral Med Oral Pathol Oral Radiol Endod 2001;92:341-5.
16. Gynther GW, Holmlund AB, Reinholt FP. Synovitis in internal derangement of the
temporomandibular joint: correlation between arthroscopic and histologic findings. J
Oral Maxillofac Surg 1994;52:913-8.
17. Segami N, Suzuki T, Sato J, Miyamaru M, Nishimura M, Yoshimura H. Does joint
effusion on T2 magnetic resonance images reflect synovitis? Part 3. Comparison of
histologic findings of arthroscopically obtained synovium in internal derangements of
the temporomandibular joint. Oral Surg Oral Med Oral Pathol Oral Radiol Endod
2003;95:761-6.
18. Coene BD, Hajnal JV, Pennock JM, Bydder GM. MRI of the brain stem using fluid
attenuated inversion recovery pulse sequences. Neuroradiology 1993;35:327-331.
19. Larheim TA, Westesson PL, Sano T. MR grading of temporomandibular
joint fluid: association with disk displacement categories, condyle marrow
abnormalities and pain. Int J Oral Maxillofac Surg 2001;30:104-12.
20. Yajima A, Sano T, Otonari-Yamamoto M, Otonari T, Ohkubo M, Harada T, Wakoh
M. MR evidence of characteristics in symptomatic osteoarthritis of the
temporomandibular joint: increased signal intensity ratio on proton density-weighted
images of bone marrow in the mandibular condyle. Cranio 2007;25:250-6.
21. Smith HJ, Larheim TA, Aspestrand F. Rheumatic and nonrheumatic disease in the
the temporomandibular joint: Gadolinium-enhanced MR imaging. Radiology
1992;185:229-34.
22. Ostergaard M, Stoltenberg M, Lovgreen-NielsenP, Volck B, Jensen CJ, Lorenzen I.
14
Magnetic resonance imaging-determined synovial membrane and joint effusion
volumes in rheumatoid arthritis and osteoarthritis: comparison with the macroscopic
anc microscopic appearance of the synovium. Arthritis Rheum 1997;40:1856-67.
23. Beltran J, Noto AM, Hrman LJ, Mosure JC, Burk JM, Christoforidis AJ. Joint
effusions: MR imaging. Radiology 1986;158:133-7.
24. Merrill RG, Yih WY, Langan MJ. A histologic evaluation of the accuracy of TMJ
diagnostic arthroscopy. Oral Surg Oral Med Oral Pathol Oral Radiol Endod
1990;70:393-8.
25. Holmlund AB, Gynther GW, Reinholt FP. Disk derangement and inflammatory
changes in the posterior disk attachment of the temporomandibular joint: a histologic
study. Oral Surg Oral Med Oral Pathol 1992;73:9-12.
26. Murakami K, Segami N, Okamoto M, Yamamura I, Takahashi K, Tsuboi Y.
Outcome of arthroscopic surgery for internal derangement of the
temporomandibular joint: long-term results covering 10 years. J Craniomaxillofac Surg
2000;28:264-71.
27. Holmlund A, Hellsing G. Arthroscopy of the temporomandibular joint: occurrence
and location of osteoarthrosis and synovitis. in a patient material. Int. Oral Maxillofac.
Surg 1988;17:36-40.
28. Varol A, Basa S, Topsakal A, Akpinar I. Assessment of synovial vascularization by
power Doppler ultrasonography in TMJ internal derangements treated arthroscopically.
Br J Oral Maxillofac Surg 2008;46:625-30.
29. Bouloux GF. Temporomandibular joint pain and synovial fluid analysis: a review of
the literature. J Oral Maxillofac Surg. 2009;67:2497-504.

15
30. Mishra AM, Reddy SJ, Husain M, Behari S, Husain N, Prasad KN, Kumar S, Gupta
RK. Comparison of the magnetization transfer ratio and fluid-attenuated inversion
recovery imaging signal intensity in differentiation of various cystic intracranial mass
lesions and its correlation with biological parameters. J Magn Reson Imaging.
2006;24:52-6.

16
Legends
Figure 1. T2-weighted (a) and FLAIR (b) sagittal MR images of the TMJ. Joint effusion
(arrow) is demonstrated in upper joint space on both images.
Figure 2. Measurement of region of interest (ROI) on sagittal T2-weighted images in
closed-mouth position. ROIs were placed over gray matter (GM) (black arrow) and
cerebrospinal fluid (CSF) (white arrow) close to top of condyle. Joint effusion (JE)
(arrow heads) in this case shows extensive fluid, and ROI for JE was placed over
maximal area in upper joint space.
Figure 3. Schematic drawing of equation for the suppression ratio.
Figure 4. Signal intensity ratio (SIR) for joint effusion (JE) in group A. Strong
correlation observed between T2-weighted and FLAIR images for JE. Correlation
coefficient was 0.81 (P < .001) with Pearson product-moment correlation.
Figure 5. Signal intensity ratio (SIR) for joint effusion (JE) in Group B. A strong
correlation was observed between T2-weighted images and FLAIR images. Correlation
coefficient was 0.94 (P < .001) with Pearson product-moment correlation.
Table I. Inclusion and exclusion criteria.
Table II. MR imaging parameters.
Table III. Average signal intensity ratios from joint effusion (JE) and cerebrospinal
fluid (CSF).
Table IV. Average suppression ratio for signal intensity from joint effusion (JE) and
cerebrospinal fluid (CSF) by FLAIR.

Figure. 1. A Figure 1. B

Figure. 2
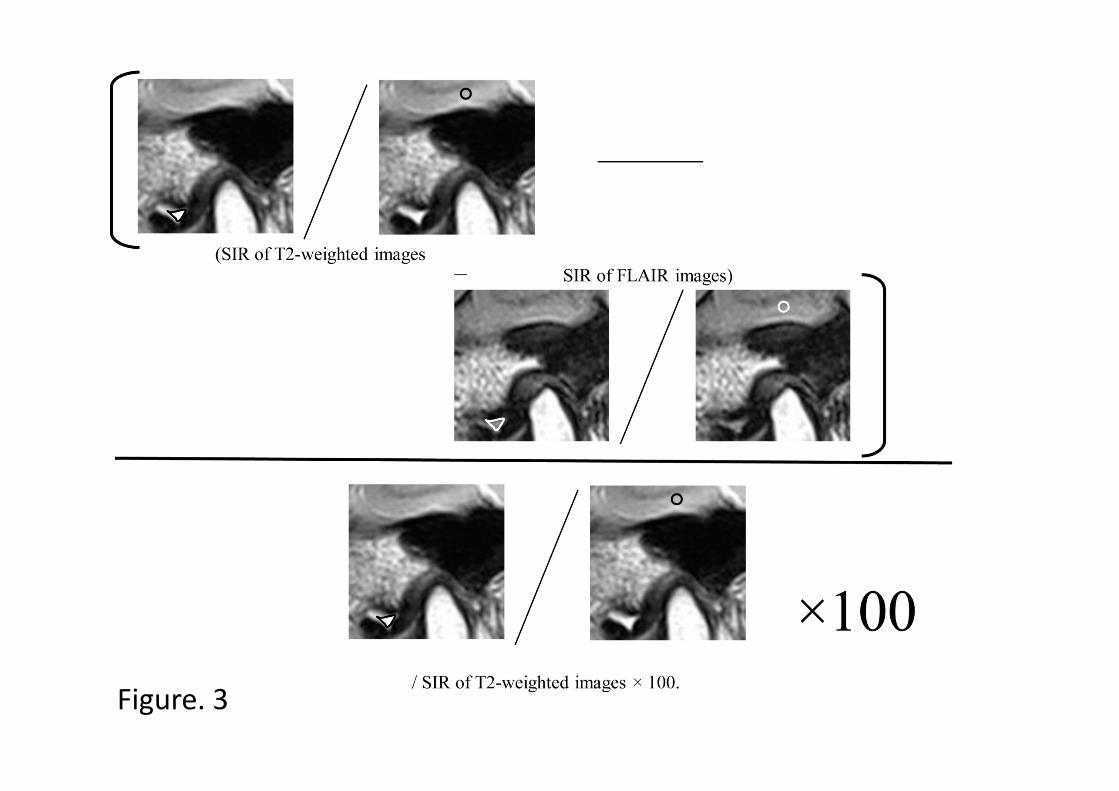
Figure. 3

Figure. 4 Figure. 5

Table I. Inclusion and exclusion criteria
Inclusion Criteria:
Temporomandibular joint with evidence of disk derangement.
Temporomandibular joint with amount of joint fluid categorized as “moderate”,
“marked” or “extensive” by Larheim and the others19.
Exclusion Criteria:
History of trauma or surgery, systematic inflammatory disease, mandibular
growth disturbances, or TMJ tumors.
Temporomandibular joint with amount of joint fluid categorized as “no fluid” or
“minimal” by Larheim and the others19.

Table II. MR imaging parameters.
Index T2-weighted images FLAIR images
TI (ms) 2,500
TR (ms) 3,300 9,000
TE (ms) 85 122 or 168
ETL 5 21
FOV(mm) 150×150 150×150
Section thickness(mm) 3 3
Slice gap(mm) 0.3 0.3
Matrix 256×256 or 512×512 256×256

Table III. Average signal intensity ratios from joint effusion (JE) and cerebrospinal
fluid (CSF).
Mean ± SD (%)
JE CSF
Group A
T2-weighted images
1.71 ± 0.64
1.44 ± 0.23
FLAIR images 1.15 ± 0.86 0.34 ± 0.22
Group B
T2-weighted images
1.81 ± 0.67
1.36 ± 0.33
FLAIR images 1.52 ± 0.61 0.35 ± 0.16

Table IV. Average suppression ratio for signal intensity from joint effusion (JE) and
cerebrospinal fluid (CSF) by FLAIR.
Mean ± SD (%)
Echo Time (ms)
JE 122 36.9 ± 25.3
168 16.3 ± 13.5
CSF 122 75.6 ± 17.1
168 71.7 ± 14.5