Embed Size (px)
Citation preview

310
Chapter 5: Potential Impacts of Well Stimulation on Wildlife and Vegetation
Chapter Five
Potential Impacts of Well Stimulation on Wildlife
and VegetationLaura C. Feinstein1, Scott Phillips2, Jennifer Banbury2, Amro Hamdoun3, Sascha C.T.
Nicklisch3, Brian L. Cypher2
1 California Council on Science and Technology, Sacramento, CA 2 California State University Stanislaus - Endangered Species Recovery Program, Stanislaus, CA
3 University of California, San Diego Scripps Institute of Oceanography, La Jolla, CA
5.1. Abstract
In this chapter, we examine the impact of well stimulation on California’s wildlife and vegetation. Potential impacts to wildlife and vegetation from oil and gas operations using well stimulation considered in this chapter are: (1) habitat loss and fragmentation, (2) introduction of invasive species, (3) releases of harmful fluids to the environment, (4) diversion of water from waterways, (5) noise and light pollution, (6) vehicle collisions, and (7) ingestion of litter by wildlife.
In this chapter we focus on habitat loss and fragmentation, because it was the only impact for which we had sufficient data to quantify impacts, and because our analysis indicates that habitat loss and fragmentation caused by production enabled by hydraulic fracturing is large enough to be of concern for habitat conservation in Kern and Ventura counties.
The degree to which hydrocarbon production and natural habitat come into contact depends on two major factors: (i) the density of oil and gas production infrastructure, and (ii) other human land uses in the area. Areas dominated by near-continuous well pads are largely inhospitable to native wildlife and vegetation. In other places, oil and gas production, including operations that use well stimulation, is interspersed with agricultural and urban development that has already displaced native habitat. In contrast, large portions of some oil fields have little other development and a relatively low density of oil wells. Native species inhabit the areas in and around these oil fields.
In areas where there is natural habitat, new oil and gas development impacts native species via a variety of mechanisms, the most well-understood of which is habitat loss and fragmentation. New wells bring new well pads, new roads, more vehicle traffic, and

311
Chapter 5: Potential Impacts of Well Stimulation on Wildlife and Vegetation
other human activities that alter open land in ways that can make it uninhabitable to most wildlife and vegetation. In California, most hydraulic-fracturing-enabled-development takes place in and around areas that were already producing oil and gas without the application of well stimulation. Well stimulation, in particular hydraulic fracturing, has enabled an increased density of oilfield development and alight increases in the footprint of developed areas. Our analysis of habitat types, vegetation cover, well density and well stimulation activity in California indicates that impacts of well stimulation to wildlife and vegetation are most pronounced in the southwest portion of the San Joaquin Basin and the transverse ranges in the Ventura basin.
Aside from habitat loss and fragmentation, we are unable to quantify the impacts of well stimulation on wildlife and vegetation in California using available data, and we restrict our discussion of them to general description and literature review.
We also discuss the relevant rules and regulations governing impacts to wildlife and vegetation from oil and gas activities. Although regulations exist to evaluate and mitigate site- or project-specific impacts when new oil and gas development is proposed, the agencies of jurisdiction have not routinely evaluated the incremental impacts of individual oil and gas development projects within the larger context of habitat loss and fragmentation at the regional level. We also discuss the most commonly implemented best practices and mitigation measures. We conclude with a discussion of important data gaps, particularly a lack of information to more precisely quantify impacts of well stimulation on population growth rates of species, a poor understanding of the degree to which abandoned oil and gas leases can be restored, and a lack of studies evaluating the efficacy of best practices and mitigation measures.
5.2. Introduction
There are a number of potential ways that well stimulation can affect wildlife and vegetation. In this chapter we discuss potential impacts due to: (1) loss and fragmentation of habitat, (2) introduction of invasive species, (3) contamination of the aquatic environment, (4) diversion of water from waterways, (5) noise and light pollution, (6) vehicle traffic, and (7) ingestion of litter. Most of these impacts are not directly caused by the process of well stimulation, but are common to any form of oil or gas production.
Many of the impacts to wildlife and vegetation require an intermediary such as water use or contamination, light and noise pollution, or increases in traffic that are discussed in other chapters in this volume: water use or contamination in Chapter 2, and noise, light and traffic in Chapter 6. This chapter examines these topics with an eye to their potential effect on wildlife and vegetation. We also explore the following potential impacts that are not discussed elsewhere in Volume II: habitat loss, introduction of invasive species, and ingestion of litter by wildlife. We focus most of our quantitative analysis on the impact of well-stimulation-enabled hydrocarbon production on habitat loss for three reasons. First, of the seven potential impacts listed in Table 5.2.1, habitat loss was the only impact

312
Chapter 5: Potential Impacts of Well Stimulation on Wildlife and Vegetation
with sufficient data available to conduct a statewide quantitative assessment. Second, habitat loss is a well-documented impact of oil and gas development in the terrestrial environment (Weller et al., 2002; Northrup, 2013). Last, habitat loss is generally regarded as the leading cause of biodiversity loss on the planet, followed by invasive species, pollution, and commercial exploitation (Moyle and Leidy, 1992; Wilcove et al., 1998). Closely related to habitat loss is fragmentation. The general principle behind habitat fragmentation is that the configuration as well as the quantity of habitat remaining affects the survival of species. Habitat fragmentation is not discussed in depth here, but is discussed in the San Joaquin Case Study in Volume III.
We note whether impacts are direct or indirect throughout the chapter. Direct impacts are uniquely associated with well stimulation and do not occur when oil and gas are produced without the aid of well stimulation. Examples of direct impacts of well stimulation include a spill of stimulation chemicals, or noise generated by equipment used in hydraulic fracturing. Indirect impacts stem from other aspects of the oil and gas production process apart from well stimulation. Examples of indirect impacts include the construction of a well pad and other infrastructure necessary for oil and gas production (resulting in habitat loss), and disposal of produced water (which can contaminate habitat). If these impacts are incurred by a well that is only economical to produce with the enabling technology of hydraulic fracturing, then they are indirect impacts. In other words, a proportion (but not all) of the indirect impacts to wildlife and vegetation caused by oil and gas production are enabled by hydraulic fracturing, since certain low-permeability reservoirs are not economical to produce without the technology. Matrix acdizing and hydraulic fracturing are not important drivers of increased production in California.
Habitat loss and fragmentation, introduction of invasive species, and litter are indirect impacts of hydraulic fracturing: they are not caused uniquely by hydraulic fracturing, but by expanded development and production allowed by hydraulic fracturing. Contamination of the aquatic environment, diversion of water from waterways, noise and light pollution, and vehicle traffic can be direct or indirect impacts, depending on context – for example, a spill of stimulation chemicals would be directly attributable to well stimulation, whereas a spill of produced water would be an indirect impact. The distinction between direct and indirect impacts is important because it has policy implications. Banning hydraulic fracturing would eliminate direct impacts. It would reduce indirect impacts, but not eliminate them, since indirect impacts are also caused by other forms of oil and gas production. For a more detailed discussion of direct and indirect impacts, please see the Summary Report.
Volume I of the report found that hydraulic fracturing is an important driver of expanded production in the state, whereas acid stimulations are not (Volume I, Chapter 1, Finding 5). Consequently, hydraulic fracturing is the only well-stimulation technology driving expanded hydrocarbon production in the state and thereby causing indirect impacts such as habitat loss and fragmentation. We discuss well stimulation as a whole, including acid stimulations, when addressing direct impacts, such as potential releases of stimulation fluids to the environment.

313
Chapter 5: Potential Impacts of Well Stimulation on Wildlife and Vegetation
5.2.1. Overview of Chapter Contents
This chapter covers five major topics. In Section 5.2, the Introduction, we describe the ecology of Kern and Ventura counties, the two regions where we found major impacts from hydraulic fracturing-enabled production. We also describe land use patterns within the administrative boundaries of oil fields. In Section 5.3, “Assessment of Well Stimulation Impacts to Wildlife and Vegetation,” we describe how well stimulation can impact wildlife and vegetation in California. Each potential impact is defined and relevant literature is reviewed. Whenever possible we discuss studies conducted in California, although most of the available work was not peer reviewed, and the majority focus on one region in the San Joaquin Valley. Because habitat loss and fragmentation is likely to have the greatest impact on wildlife and vegetation, we explore this topic in greater depth by quantifying habitat loss and fragmentation attributable to well-stimulation-enabled hydrocarbon production. We also summarize the potential future impacts to wildlife and vegetation. In Section 5.4, we describe how oil and gas production activities are regulated with respect to their impacts on wildlife and vegetation. In Section 5.5, we discuss measures to mitigate oil field impacts on terrestrial species and their habitats. In Section 5.6 we assess major data gaps and ways to remedy the gaps. In Sections 5.7 and 5.8, we summarize the major findings and conclusions of the chapter.
5.2.2. Regional Focus: Kern and Ventura Counties
In our analysis, we focused on the areas in the state where substantial amounts of well stimulation occurred in the context of undeveloped areas of natural habitat. We evaluated the ecological impacts of hydraulic-fracturing-enabled development with respect to the impact to loss of natural habitat, the rarity of that habitat statewide, and occurences of endangered species and designated critical habitat in the vicinity. Two regions emerged as locations where hydraulic-fracturing-enabled development was heavily impacting natural habitat. The first was southwest Kern County in the vicinity of Elk Hills, North and South Belridge, Buena Vista, and Lost Hills Fields. The second key region was along the southern perimeter of Los Padres National Forest in Ventura County, in the Ojai and Sespe Fields, within the Santa Barbara-Ventura Basin (referred to for brevity as the Ventura Basin). Matrix acidizing is much rarer and tends to be concentrated in southwestern Kern county. As a result, we focus our discussion primarily on Kern County, and secondarily on Ventura County, followed by other counties in the state.
5.2.2.1. Kern County: Ecology, Oil and Gas Development, and Well Stimulation
Kern County lies in the southern portion of the San Joaquin Valley, which was a region once dominated by lakes, wetlands, riparian corridors, valley saltbush scrub, and native grasslands. Most of the natural habitat has been converted to agricultural or urban use since the mid-19th century (Figure 5.2-1). Owing primarily to loss of habitat, there are
314
Chapter 5: Potential Impacts of Well Stimulation on Wildlife and Vegetation
approximately 143 federally-listed species, candidates and species of concern1 with distributions wholly or partially in the San Joaquin Valley (Williams et al., 1998). For comparison, there were 568 state and federally listed and candidate species in California as of 2015 (Biogeographic Data Branch DFW, 2015a; b). The majority (76%) of California’s remaining valley saltbush scrub habitat and its associated endangered species persists in southwestern Kern County. This area also has major petroleum resources. As a result, forty-two percent of California’s remaining valley saltbush scrub habitat is within the boundaries of a Kern County oil field (Appendix 5.D, Table 5.D-1). The relationship is not entirely coincidental. The giant oil fields of the southwestern San Joaquin Valley such as Midway-Sunset, North and South Belridge, Elk Hills, Buena Vista and Lost Hills were discovered between 1894 and 1912 and were controlled by oil development interests before agriculture dominated the region. Within large portions of those oil fields, development is sparse enough that native habitat, principally valley saltbush scrub and non-native grassland, persists. Very little of the original aquatic and wetland habitats of the San Joaquin Valley remain, with more than 90% of open water, wetlands, and riparian habitat converted to farmland and cities (Kelly et al., 2005).
1. “Federally-listed” refers to species listed as endangered or threatened under the Endangered Species Act. “Candidate
species” are organisms for which the U.S. Fish and Wildlife Service has sufficient information on their biological status
and threats to propose them as endangered or threatened under the Endangered Species Act, but for which development
of a proposed listing regulation is precluded by other higher priority listing activities. “Species of concern” are deemed to
be potentially in decline, but are not presently candidates for listing.

315
Chapter 5: Potential Impacts of Well Stimulation on Wildlife and Vegetation
Figure 5.2.1. Maps of the San Joaquin Valley from pre-European settlement to the year 2000.
The majority of natural habitat in the region has been converted to human use, principally
agriculture, over the past century. The bulk of remaining valley saltbush scrub habitat is in
the southwestern San Joaquin, where a combination of hillier terrain and ownership by oil
developers prevented conversion to agriculture. Reprinted with permission from Kelly et al. (2005).

316
Chapter 5: Potential Impacts of Well Stimulation on Wildlife and Vegetation
Kern County has the highest density of hydraulic fracturing and matrix acidizing in the state. More than 85% of hydraulic fracturing in the state occurs in six fields in southwestern Kern County: North and South Belridge, Elk Hills, Lost Hills, Buena Vista, and Midway-Sunset (Volume I Section 3.2.3.2, “Location).” More than 95% of matrix acidizing occurs in three fields in the same region: Elk Hills, Buena Vista, and Railroad Gap (Summary Report).
5.2.2.2. Ventura County: Ecology, Oil and Gas Development, and Well Stimulation
Ventura County is dominated by chaparral and Venturan coastal sage scrub with some dispersed riparian and annual grassland areas. The southern portion of the county has largely been converted to urban and agricultural use, while the northern half overlaps with Los Padres National Forest. Because much of southern California has been so heavily altered by human use, the national forest serves as an important refuge for species extirpated elsewhere in the region. It provides habitat for 468 permanent or transitory species of fish and wildlife, over 100 of which are listed as federally- or state-endangered, threatened, or sensitive2 (CDFW, 2014a; 2014b; USFWS, 2014b). Listed species in the region include the vernal pool fairy shrimp, the Southern willow flycatcher, the California red legged frog, the California condor, southern steelhead, Least Bell’s Vireo, and the Santa Ana sucker. Typical habitat types are buck brush chaparral, chamise chaparral, and Venturan coastal sage scrub (UCSB Biogeography Lab, 1998).
While the total number of wells and hydraulic fracturing is much lower in Ventura than Kern County, a high proportion of the activity was enabled by hydraulic fracturing in eleven oil fields in the Ventura Basin (Volume I, Appendix N). Two fields, the Ojai and the Sespe, fall at least partially within the Los Padres National Forest and abut the Sespe Wilderness, home to the Sespe Condor Sanctuary. The Sespe Oil Field is also adjacent to the Hopper Mountain National Wildlife Refuge.
5.2.2.3. The Ecology of Kern and Ventura County Oil Fields
There is a common misperception that there is little or no natural habitat in areas developed for oil and gas production. In fact, oil and gas production, including operations that use well stimulation, is often interspersed with natural habitat (Fiehler and Cypher, 2011; Spiegel, 1996). As a result, native biota, including listed species, can be found in and around some areas developed for oil and gas, notably in Kern and Ventura Counties (USFWS, 2005; Fiehler and Cypher, 2011). However, other oil fields are dominated by human land uses to the exclusion of natural habitat.
2. Sensitive plants include those plants listed as endangered, threatened or rare (Section 670.2, Title 14, California Code
of Regulations; Section 1900, Fish and Game Code; ESA Section 17.11, Title 50, Code of Federal Regulations) or those
meeting the definitions of rare or endangered provided in Section 15380 of the CEQA Guidelines.

317
Chapter 5: Potential Impacts of Well Stimulation on Wildlife and Vegetation
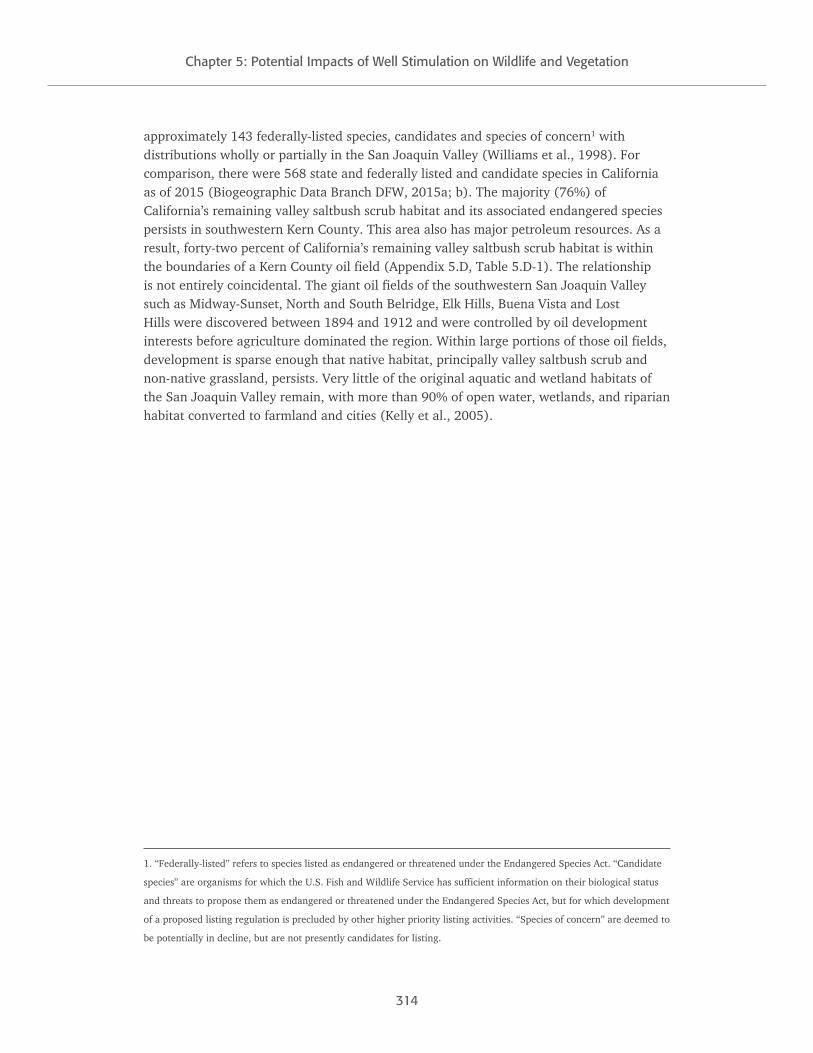
The degree to which natural habitat persists on oil fields depends primarily on two factors: (i) the density of oil and gas production infrastructure, and (ii) other human land uses in the area. Areas dominated by near-continuous well pads, such as large expanses of the North and South Belridge, Lost Hills, and Ventura Oil Fields, are largely inhospitable to native wildlife and vegetation (Fiehler and Cypher, 2011 and Figure 5.2.2a). In other places, oil and gas production is interspersed with agriculture and urban development that by themselves displace the native habitat. Oil fields such as Rose and North Shafter are dominated by agriculture and urban development with scattered oil wells; there is virtually no intact natural habitat remaining in those regions, so oil development in those areas has little impact on wild animals and vegetation (Figure 5.2.2b).
In contrast, large portions of oil fields such as Elk Hills, Lost Hills and Buena Vista in Kern County and Ventura, Ojai and Sespe in Ventura are otherwise unimpacted by human development and have a relatively low density of oil wells (Figure 5.2.2c). Native species can survive on and around these oil fields. For example, outside of the Carrizo Plain Natural Area in San Luis Obispo County, the largest extant populations of the federally endangered/state threatened San Joaquin kit foxes are in the Elk Hills and Buena Vista oil fields in Kern County (USFWS, 2005). Figure 5.2.3 and Figure 5.2.4 depict areas of varying well density and land use in the southern San Joaquin Valley and Ventura County. Areas denoted as having medium or low well density that are not developed for human use are areas where habitat interacts with oil and gas production.
318
Chapter 5: Potential Impacts of Well Stimulation on Wildlife and Vegetation
A B
C
Figure 5.2.2. (a) An area of high well density at Lost Hills field is largely inhospitable to the
native biota. (b) Pump jacks in the North Shafter field are surrounding by a fallow field and an
orchard; there is little or no native habitat. (c) The Elk Hills Oil Field in Kern County has areas
of low well density surrounded by large areas of intact valley saltbush scrub vegetation, habitat
for a number of threatened and endangered native species. While well stimulation takes place in
all three fields, activities in areas surrounded by native habitat are more likely to have ecological
impacts. Photo credits: (a) C. Varadharajan, (b) L. Feinstein, (c) C. Varadharajan, 2014.

319
Chapter 5: Potential Impacts of Well Stimulation on Wildlife and Vegetation
CaliforniaValley
CarrizoPlains
ER
SemitropicER
WindWolves
Preserve
C a r r i z oP l a i n
N M
UnitedStates
Bureau ofReclamation
KernNWR
GiantSequoia
NM
L o s P a d r e sN a t i o n a l
F o r e s t
SequoiaNational
Forest
KingsCanyonNational
Park
Seq uo iaNation al
Park
AllensworthER
LokernER
ArroyoPasajeroWestsideDetention
Basin
LokernPreserve
SemitropicRidge
Preserve
Lopez LakeRegionalPark andNatural
Area
SantaMargarita
LakeRegionalPark andNatural
Area
LakeKaweah
SuccessLake
PixleyNWR
AntAntHil lHi l l
AsphaltoAsphalto
BeerBeerNoseNose
Belr idge,Belr idge,NorthNorth
Belr idge,Belr idge,SouthSouth
BowerbankBowerbank
BuenaBuenaVistaVista
BurrelBur rel
CalCalCanalCanalGasGas
CantuaCantuaCreekCreek(Abd)(Abd)
CoalingaCoalinga
ColesColesLevee,Levee,NorthNorth
ColesColesLevee,Levee,SouthSouth
Cuyama,Cuyama,SouthSouth
Cymr icCymr ic
DeerDeerCreekCreek
DevilsDevilsDenDen
EdisonEdisonElkElk
Hil lsHil ls
Fruit valeFruitvaleGreeleyGreeley
GuijarralGuijarralHil lsHil ls
HelmHelm
HuasnaHuasna
Jacali tosJacali tos
JasminJasmin
KernKernBluffBluff
KernKernFrontFront
KernKernRiverRiver
Kett lemanKett lemanNorth DomeNorth Dome
LosLosLobosLobos
LostLostHil lsHil ls
McKitt ri ckMcKitt ri ck
Midway -Midway -SunsetSunset
MountMountPosoPoso
MountainMountainViewView
PalomaPaloma
Plei toPlei to
PosoPosoCreekCreek
PyramidPyramidHil lsHil ls
RaisinRaisinCityCity
RioRioBravoBravo
RioRioViejoViejo
RoseRose
RoundRoundMountainMountain
SantaSantaMariaMariaValleyValley
SemitropicSemitropic
Shafter,Shafter,NorthNorth
StrandStrand
TejonTejon
TejonTejonHil lsHil lsTejon,Tejon,
NorthNorth
TenTenSectionSection
TricoTricoGasGas
TulareTulareLakeLake
UnionUnionAve.Ave.
WascoWasco
YowlumneYowlumne
Oil and Gas administrative field boundaries
Low (1-15/km2)
Medium (15-77/km2)
High (>77/km2)
0 8 164Miles °
0 10 20 305Kilometers
Land Use/Land CoverDeveloped & Other Human UseAgricultural, Introduced, or Modified
Shrubland & GrasslandSemi-Desert
Forest & WoodlandOpen Water
320
Chapter 5: Potential Impacts of Well Stimulation on Wildlife and Vegetation
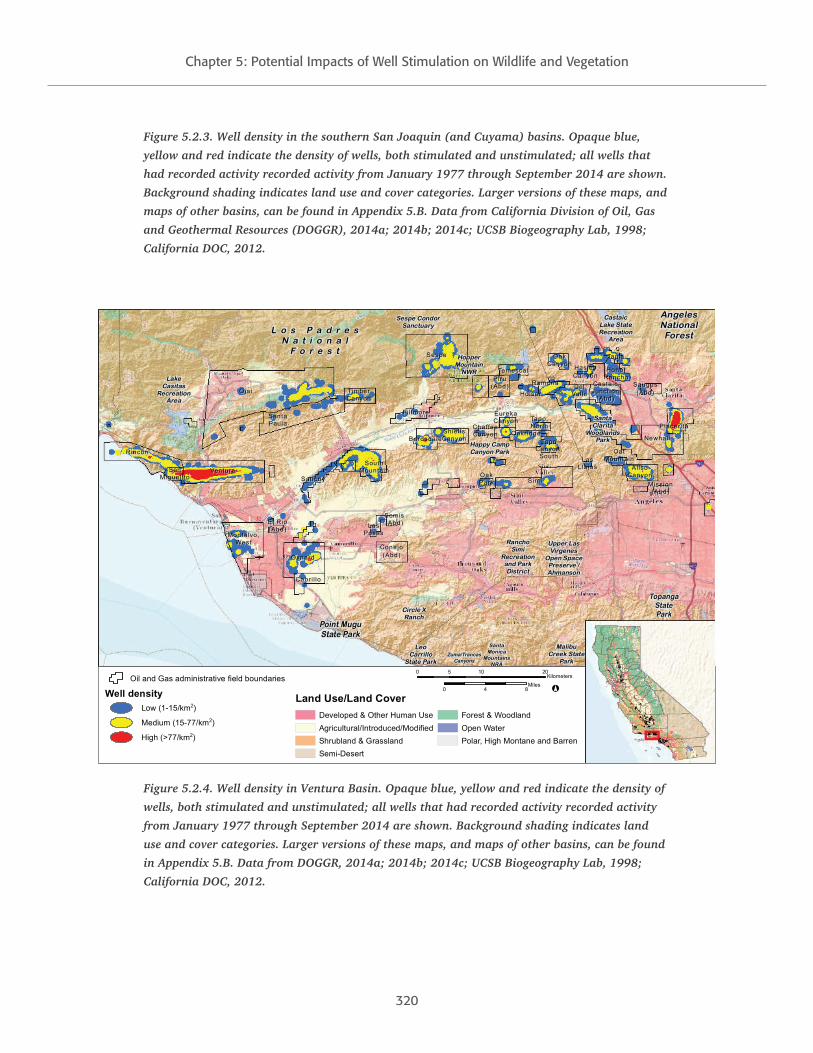
Figure 5.2.3. Well density in the southern San Joaquin (and Cuyama) basins. Opaque blue,
yellow and red indicate the density of wells, both stimulated and unstimulated; all wells that
had recorded activity recorded activity from January 1977 through September 2014 are shown.
Background shading indicates land use and cover categories. Larger versions of these maps, and
maps of other basins, can be found in Appendix 5.B. Data from California Division of Oil, Gas
and Geothermal Resources (DOGGR), 2014a; 2014b; 2014c; UCSB Biogeography Lab, 1998;
California DOC, 2012.
Point MuguState Park
TopangaStatePark
AngelesNational
ForestL o s P a d r e sN a t i o n a l
F o r e s t
LeoCarrillo
State Park
MalibuCreek State
Park
CastaicLake StateRecreation
Area
SantaClarita
WoodlandsPark
RanchoSimi
Recreationand ParkDistrict
Upper LasVirgenes
Open SpacePreserve /Ahmanson
LakeCasitas
RecreationArea
HopperMountain
NWR
Circle XRanch
SantaMonica
MountainsNRA
Zuma/TrancasCanyons
Happy CampCanyon Park
AlisoAlisoCanyonCanyon
BardsdaleBardsdale
Cabri l loCabri l lo
CastaicCastaicJunct ionJunct ion
(Abd)(Abd)
ChaffeeChaffeeCanyonCanyon
ConejoConejo(Abd)(Abd)
DelDelValleValle
El RioEl Rio(Abd)(Abd)
EurekaEurekaCanyonCanyon
Fil lmoreFil lmore
HasleyHasleyCanyonCanyon
HolserHolser
HonorHonorRanchoRancho
LasLasLlajasLlajas
LasLasPosasPosas
MissionMission(Abd)(Abd)
Montalvo,Montalvo,WestWest
NewhallNewhall
OakOakCanyonCanyon
OakOakParkPark
OakridgeOakridge
OatOatMountainMountain
OjaiOjai
OxnardOxnard
PiruPiru(Abd)(Abd)
Placer itaPlacer ita
RamonaRamona
RinconRincon
SanSanMigueli toMigueli to
SantaSantaPaulaPaula
Sat icoySat icoy
SaugusSaugus(Abd)(Abd)
SespeSespe
Shiel lsShiel lsCanyonCanyon
SimiSimi
SomisSomis(Abd)(Abd)
SouthSouthMountainMountain
TapiaTapia
TapoTapoCanyon,Canyon,
SouthSouth
Tapo,Tapo,NorthNorth
TemescalTemescal
TimberTimberCanyonCanyon
VenturaVentura
Sespe CondorSanctuary
Land Use/Land CoverDeveloped & Other Human UseAgricultural/Introduced/ModifiedShrubland & GrasslandSemi-Desert
Forest & WoodlandOpen WaterPolar, High Montane and Barren
0 84Miles
°
0 10 205KilometersOil and Gas administrative field boundaries
Well densityLow (1-15/km2)
Medium (15-77/km2)
High (>77/km2)
Figure 5.2.4. Well density in Ventura Basin. Opaque blue, yellow and red indicate the density of
wells, both stimulated and unstimulated; all wells that had recorded activity recorded activity
from January 1977 through September 2014 are shown. Background shading indicates land
use and cover categories. Larger versions of these maps, and maps of other basins, can be found
in Appendix 5.B. Data from DOGGR, 2014a; 2014b; 2014c; UCSB Biogeography Lab, 1998;
California DOC, 2012.
321
Chapter 5: Potential Impacts of Well Stimulation on Wildlife and Vegetation
5.3. Assessment of Well Stimulation Impacts to Wildlife and Vegetation
In this section we describe the following ways that well stimulation can impact wildlife and vegetation: habitat loss and fragmentation, facilitating invasive species, discharging potentially harmful fluids, use of water, noise and light pollution, traffic, and litter. Because we expect habitat loss and fragmentation to have the greatest effect on wildlife and vegetation, and adequate data was available, we conduct an original quantitative analysis on the topic, in which we identify the areas where well stimulation has had the greatest impact, how much of various habitat types were affected, and describe in detail the special-status species that occur in the vicinity.
5.3.1. Land Disturbance Causes Habitat Loss and Fragmentation
5.3.1.1. Overview and Literature Review of Habitat Loss and Fragmentation
Oil and gas production contribute to habitat loss and fragmentation through the construction of well pads and support infrastructure and related land disturbance, not directly by hydraulic fracturing itself (Jones and Pejchar, 2013). Expanding production of unconventional resources in new areas, often in areas of open habitat relatively unaffected by people, is resulting in habitat loss and fragmentation in areas such as Canada (Council of Canadian Academies, 2014), Wyoming (Thomson et al., 2005), Colorado (Jones and Pejchar, 2013), and Pennsylvania (Johnson et al., 2010). Unlike California, in regions where the only hydrocarbons produced are from source rock, all oil and gas production is indirectly attributable to hydraulic fracturing. For example, Pennsylvania’s Marcellus Shale is only producible with hydraulic fracturing, and it underlies valuable forest and freshwater habitat. In regions outside of California, there are a number of locations where hydraulic fracturing enables production in areas never before developed for oil and gas. When these areas happen to underlie areas of relatively pristine habitat, the oil and gas production enabled by hydraulic fracturing causes habitat loss and fragmentation (Slonecker et al., 2013; Roig-Silva et al., 2013; Johnson et al., 2010).
In California, it is difficult to isolate the impact of hydraulic fracturing on habitat from the impacts of oil and gas production in general. This is because most hydraulic fracturing is occurring on lands that would be used for oil and gas production regardless of hydraulic fracturing. This is because hydraulic fracturing is necessary for production from certain types of low-permeability reservoirs. In many places in California, these low-permeability reservoirs are stacked vertically with reservoirs that do not require hydraulic fracturing. As a result, at the land’s surface, wells that are hydraulically fractured are interspersed with wells that are not, because they are tapping different vertical layers of rock with different geologic properties.
Roughly half of the wells installed in California in the past decade were hydraulically fractured, and about one in fifteen were acidized; 85% of this activity is the North Belridge, South Belridge, Elk Hills and Lost Hills fields. These fields were discovered more

322
Chapter 5: Potential Impacts of Well Stimulation on Wildlife and Vegetation
than a century ago (Volume I, Executive Summary; California Division of Oil, Gas and Geothermal Resources (DOGGR), 1998). We found that hydraulic-fracturing-enabled oil production is occurring within regions with a wide spectrum of existing habitat, including: (1) relatively intact habitat, (2) areas already disturbed by other oil and gas production, and (3) locations dominated by human uses such as agriculture or urban development. We attempted to isolate the impact of hydraulic-fracturing-enabled production on natural habitat by analyzing hydraulic-fracturing-enabled production in the context of the underlying land use.
Over the last century, habitat loss has been the largest documented impact to wildlife and vegetation stemming from oil and gas production activities in California. The extent of the impact was dependent upon the amount and the location of disturbances. Fiehler and Cypher (2011) found that valley saltbush scrub specialists such as San Joaquin antelope squirrels, short-nosed kangaroo rats and San Joaquin kit foxes disappeared from high density oil development, but persisted in areas with less than 70% disturbance. Construction activities that destroyed active den or burrow sites had significant impacts on San Joaquin kit fox populations (O’Farrell and Kato, 1987; Kato and O’Farrell, 1986; O’Farrell et al., 1986). On the other hand, nightly movements (Zoellick et al., 1987), den use patterns (Koopman et al., 1998), and reproductive and survival parameters of the San Joaquin kit fox did not differ between an undeveloped area and an intensely developed area of an oil field (Spiegel and Tom, 1996; Spiegel and Disney, 1996; Cypher et al., 2000).
Smaller species such as blunt-nosed leopard lizards and giant kangaroo rats were minimally impacted by oil and gas production because most of the activities were outside the core habitat areas for both species (O’Farrell and Kato, 1987). In areas where high-quality habitat and activities overlapped, the intensity of development and amount of habitat disturbed determined the carrying capacity3 (Kato and O’Farrell, 1986). It has been documented that abandoned oil and gas fields undergoing revegetation can be recolonized by blunt-nose leopard lizards as long as densities of shrubs and ground cover do not become excessive (O’Farrell and Kato, 1980).
The studies we surveyed for impacts of oil and gas production to habitat loss and fragmentation within California were all conducted at the Elk Hills oil field, therefore it is difficult to assess the generality of the results to the rest of the state. There also were some limitations to the study designs, principally that the non-developed areas used for comparisons were not equivalent in habitat quality when compared to the developed areas, even prior to any activity.
3. The carrying capacity is the number of individuals of a species that an area can support.

323
Chapter 5: Potential Impacts of Well Stimulation on Wildlife and Vegetation
5.3.1.2. Quantitative Analysis Of Hydraulic Fracturing-Enabled Production On Habitat Loss
Our analysis addressed three major questions:
1. How has hydraulic-fracturing-enabled oil production altered well density in California?
2. How are the areas with increased well density distributed across counties, land uses, and habitat types in California?
3. What special-status species occurred in the vicinity of oil fields highly impacted by well stimulation?
5.3.1.2.1. Methods
Here we briefly summarize our methods for the quantitative analysis of the impact of hydraulic fracturing on habitat loss; more information is given in Appendix 5-C, “Detailed Methods for Quantitative Analysis of Hydraulic Fracturing-Enabled Production On Habitat Loss.”
For our analysis, we looked at well density as a proxy for habitat loss. As well density increases, the amount of intact habitat tends to decrease; see Figure 5.3.1. for an illustration of how plant cover is affected by increasing well density. We examined 506 plots at least 10 hectares (ha) in size for well density and bare (unvegetated) ground and found that well density predicted 95% of the variation in presence of bare ground. We concluded that well density is an accurate indicator of habitat loss.4 For this analysis we did not look at how well density correlated with habitat fragmentation; we will look more closely at the issue of fragmentation in the San Joaquin case study in Volume III of this report.
In order to assess the impact of hydraulic-fracturing-enabled oil production on habitat, we set out to quantify the density of hydraulically fractured wells in the state. This was challenging given that reporting of hydraulic fracturing was not required until 2013, so records of the activity are likely incomplete. We used a compilation of well records, voluntary reporting to FracFocus, and recent mandatory reporting to estimate the proportion of hydraulically fractured wells tapping each pool (also called reservoirs). We then generated two alternate scenarios: actual well density, and a “without hydraulic fracturing” well density. Actual well density is the true density of wells in California
4. We performed a linear regression of proportion of bare ground as predicted by well density for 506 plots at least
10 hectares in size. The relationship was highly significant; F(1,504) = 9107, p=<2.48x10⁻⁷, adjusted r2 = 0.95. See
Appendix 5.C for further details.

324
Chapter 5: Potential Impacts of Well Stimulation on Wildlife and Vegetation
as of September 2013. Background well density represents a hypothetical scenario representing the well density of California as of September 2014 if every well that had been hydraulically fractured vanished. The difference between the two is the marginal impact of hydraulic fracturing-enabled production on well density and, by proxy, habitat loss and fragmentation.
An important point to understand about this analysis is that hydraulic fracturing compared to background well density does not represent a change over time. That is, well density was not at the background level at some point in time, then hydraulic fracturing increased the density from that time forward. Hydraulically fractured and unstimulated wells continue to be drilled and produced simultaneously. The main reason why wells that are hydraulically fractured are geographically interspersed with other wells in California is because low-permeability reservoirs that require hydraulic fracturing are often stacked above and below reservoirs that do not require hydraulic fracturing. For example, in the South Belridge field, the Tulare pool is above the Diatomite pool. 91% of well records in the Diatomite report hydraulic fracturing, as compared to only 1% in the Tulare. This creates a patchwork of wells at the surface that are and are not hydraulically fractured. Even if all hydraulically fractured wells disappeared from South Belridge, the well density in much of the field would still be high, and there would be little usable habitat for native organisms.
We split well density into four categories comparable to those used in Fiehler and Cypher (2011): Control – less than one well/km2; Low – 1-15 wells/km2; Medium - 15-77 wells/km2; High - more than 77 wells/km2. We chose to use the same categories because Fiehler and Cypher (2011) conducted the only previous work we could find systematically associating land disturbance from oil and gas activities with the decline of natural communities in California5. We then calculated the number of hectares that either were unchanged or increased in density category because of hydraulic fracturing-enabled production. We refer to areas that did not change categories as “not noticeably impacted,” areas that moved from the control group to a higher category as “newly impacted,” and areas that shifted from the low and medium categories to a higher category as experiencing “increased intensity” of production. We refer to the newly impacted and increased intensity areas collectively as “altered” areas. Table 5.3.1 summarizes how we categorize changes in well density.
5. Our categories differ from Fiehler and Cypher (2011) in two respects. First, Fiehler and Cypher had a gap between
the medium and high categories: the medium category ended at 77 wells/km2 and high began at 150 wells km2; we
reassigned the lower end of the high category as 77 wells/km2 to eliminate the gap. Second, Fiehler and Cypher counted
wells in study areas of around 0.648 km2 in size while we estimated the number of wells/km2 in a moving window of
comparable size.

325
Chapter 5: Potential Impacts of Well Stimulation on Wildlife and Vegetation
Table 5.3.1. Description of well density categories used in this study. We divided the effect
of hydraulic-fracturing-enabled production on well density into three major categories: newly
developed, increased intensity, and not noticeably impacted areas. The three categories are
defined in terms of the types of shifts between density classes. We use blue, yellow, red and gray
consistently to color-code the three categories throughout this chapter. For simplicity, we refer
collectively to areas that were newly developed or increased in intensity as showing an increase in
hydraulic fracturing, with the caveat that our results do not factor in areas that increased in well
density due to hydraulic-fracturing-enabled-production, but not enough to move up a category.
Category Change between density classes
Altered Newly developed Control -> Low, Med, High
Increased intensity Low -> Med, High
Med ->High
Unaltered Either no change in well density, or no noticeable change in well density (that is, not enough to shift the density to a higher class).
Control-> Control Low->Low Med->Med High->High

326
Chapter 5: Potential Impacts of Well Stimulation on Wildlife and Vegetation
A B
C D200Meters
200Meters
200Meters
200Meters
Figure 5.3.1. Aerial photos of each well-density category. The off-white areas are well
pads, roads, and other unvegetated, highly disturbed areas. The gray, blotchy regions are
vegetated areas that represent a natural habitat type. As well density increases, the amount of
unvegetated land increases. (A) Control – less than one well per / km2. (B) Low – 1-15 wells /
km2). (C) Medium - 15-77 wells / km2 (D) High - more than 77 wells / km2.
We classified areas first by land use (developed, agricultural, or natural areas); for natural areas, we looked more closely at broad land cover types, which refer to functional types of vegetation: shrubland and grassland, forest and woodland, open water, and so forth (UCSB Biogeography Lab, 1998). We further subdivided land cover types into natural communities, which subdivides the state into common plant associations such as valley saltbush scrub, non-native grassland, and so forth (Holland 1986). There are more than

327
Chapter 5: Potential Impacts of Well Stimulation on Wildlife and Vegetation
200 natural community categories; as a result, we focused on the four with more than 1,000 hectares of altered area plus two aquatic habitat types, and grouped the remainder under “other natural communities.” Table 5.3.2. gives the categories and classifications we used in our assessment.
Table 5.3.2. Categories of land use, land cover, and natural communities used in this assessment.
Category Classifications Data Source
Land Use 1. Developed and other human use2. Agricultural, introduced, or modified vegetation3. Natural habitat, subdivided by the classifications given in
Land Cover and Habitat Type
California DOC (2012)
Land Cover 1. Shrubland and grassland2. Semi-desert3. Forest and woodland4. Open water5. Polar, high montane, and barren
UCSB Biogeography Lab (1998)
Natural Community*
1. Valley saltbush scrub2. Non-native grassland3. Venturan coastal sage scrub4. Buck brush chaparral5. Water6. Riparian and wetland7. Other natural communities
Holland (1986)
* Some of our “Natural Community” groups are equivalent to the natural communities described in Holland (1986),
while others (water, and riparian and wetland) group a number of Holland natural communities under one header.
5.3.1.2.2. Results and Discussion of Quantitative Analysis of Well Stimulation Impacts to Habitat Loss and Fragmentation
We estimated that 33,000 hectares shifted to a higher well density category with hydraulic-fracturing-enabled oil production; of this, about 21,000 hectares (60%) was natural habitat. About 1% of California’s land is developed for oil and gas production (with a well density greater than 1/km2), compared to 5% for urban development and 14% for agriculture. About 3.5% of the habitat loss due to oil and gas production as a whole is attributable to hydraulic-fracturing-enabled activity.
The impacts of oil and gas production in general, and well stimulation in particular, are concentrated in a few areas of the state. Of the 33,000 hectares statewide that shifted to a higher well density category with hydraulic-fracturing enabled production, about 27,000 hectares (81%) were in Kern and Ventura Counties. About 8% of Kern and 4% of all lands in Ventura Counties are developed for oil and gas production (with a well density greater than 1/km2).

328
Chapter 5: Potential Impacts of Well Stimulation on Wildlife and Vegetation
The main habitat types disturbed by hydraulic fracturing-enabled production are valley saltbush scrub, non-native grassland, Venturan coastal sage scrub, and buck brush chaparral. These habitat types are mainly found in Kern and Ventura Counties. Twenty-four federally and/or state-listed threatened and endangered species have documented occurrences in oil fields where at least 200 hectares have reached a higher well-density class with hydraulic-fracturing-enabled production.
Question 1: How has hydraulic fracturing-enabled production altered well density in California?
Well density has increased in California due to hydraulic-fracturing-enabled production (Table 5.3.3). We estimate that about 33,000 hectares of land in the state have shifted into a higher-density category due to hydraulic-fracturing-enabled production (Table 5.3.3, red, yellow, and blue cells). 15,196 hectares were newly impacted by oil and gas development because of hydraulic-fracturing-enabled development (Table 5.3.3, blue cells). About 18,999 hectares already had wells present, but hydraulic fracturing enabled an increase in density (Table 5.3.3, yellow and red cells).
Table 5.3.3. The effect of hydraulic-fracturing-enabled production on well density in California
oil and gas fields. The table shows the number of hectares in the state in a given category of well
density without hydraulic-fracturing-enabled-production along the rows, and with hydraulic-
fracturing-enabled-production along the columns. For example, 13,075 hectares in California
had a control well density without hydraulically fractured wells, and a low well density with
hydraulically fractured wells. Blue backgrounds indicate the area that was newly impacted by
oil and gas production because of hydraulic-fracturing-enabled production. Yellow and red
backgrounds show areas that were more intensively developed for oil and gas with hydraulic-
fracturing enabled production. Gray backgrounds show the area where well density was not
noticeably affected by hydraulic-fracturing-enabled production. The sum of blue, yellow,
and red cells equals the total area altered by hydraulic-fracturing-enabled production.
Well Density With Hydraulic-Fracturing-Enabled Production (ha)
Control Low Medium High
Background Well Density (ha)
Control 41,958,038 13,075 2,114 7
Low 301,709 11,773 772
Medium 70,044 5,308
High 31,799
The majority of altered area in the San Joaquin Valley occurred around the southern perimeter of the valley in fields dominated by shrubland and grassland such as Elk Hills, Buena Vista, Midway-Sunset, Lost Hills, Mt. Poso and Round Mountain. Figure 5.3.2 (a) and Figure 5.3.3 (a). There are smaller amounts of altered habitat in the central portion of the valley where agriculture is the dominant land use in oil fields such as North Shafter and Rose.

329
Chapter 5: Potential Impacts of Well Stimulation on Wildlife and Vegetation
The inner core of fields such as Lost Hills and North and South Belridge Fields, where production of diatomite pools requires hydraulic fracturing, were considered unaltered (for the purposes of habitat quality) by well stimulation because they were already high-density regardless of hydraulic-fracturing-enabled-development. Lost Hills, North and South Belridge collectively represent 79% of reported hydraulic fracturing in the state (Volume I, Chapter 3, Table 3-1). Because these fields are also the location of intensively developed pools that do not require hydraulic fracturing, much of this area is already largely inhospitable to most native wildlife and vegetation, regardless of the added well density attributable to hydraulic fracturing. Thus, the additional impact of hydraulic fracturing to habitat degradation in these areas is probably minimal.
In Ventura County, the majority of altered area occurred in a string of three fields along the transverse mountain range: the Sespe, Ojai, and Ventura fields. Although the total well densities of the Ojai and Sespe are not very high, nearly all of the development is enabled by hydraulic fracturing. The Ventura field is a bit different as it already had a moderate level of development and hydraulic-fracturing-enabled-development increased the intensity. The portions of the Ojai and Sespe altered by hydraulic-fracturing-enabled-development overlap mostly with natural habitat; in the Ventura Field, the altered areas were mostly in urban and built-up land.
Appendix 5.B, Maps of Well Density in California, shows larger versions of these maps for the major hydrocarbon-producing basins of California.

330
Chapter 5: Potential Impacts of Well Stimulation on Wildlife and Vegetation
CaliforniaValley
CarrizoPlains
ER
SemitropicER
WindWolves
Preserve
C a r r i z oP l a i n
N M
UnitedStates
Bureau ofReclamation
KernNWR
GiantSequoia
NM
L o s P a d r e sN a t i o n a l
F o r e s t
SequoiaNational
Forest
KingsCanyonNational
Park
Seq uo iaNation al
Park
AllensworthER
LokernER
ArroyoPasajeroWestsideDetention
Basin
LokernPreserve
SemitropicRidge
Preserve
Lopez LakeRegionalPark andNatural
Area
SantaMargarita
LakeRegionalPark andNatural
Area
LakeKaweah
SuccessLake
PixleyNWR
AntAntHil lHi l l
AsphaltoAsphalto
BeerBeerNoseNose
Belr idge,Belr idge,NorthNorth
Belr idge,Belr idge,SouthSouth
BowerbankBowerbank
BuenaBuenaVistaVista
BurrelBur rel
CalCalCanalCanalGasGas
CantuaCantuaCreekCreek(Abd)(Abd)
CoalingaCoalinga
ColesColesLevee,Levee,NorthNorth
ColesColesLevee,Levee,SouthSouth
Cuyama,Cuyama,SouthSouth
Cymr icCymr ic
DeerDeerCreekCreek
DevilsDevilsDenDen
EdisonEdisonElkElk
Hil lsHil ls
Fruit valeFruitvaleGreeleyGreeley
GuijarralGuijarralHil lsHil ls
HelmHelm
HuasnaHuasna
Jacali tosJacali tos
JasminJasmin
KernKernBluffBluff
KernKernFrontFront
KernKernRiverRiver
Kett lemanKett lemanNorth DomeNorth Dome
LosLosLobosLobos
LostLostHil lsHil ls
McKitt ri ckMcKitt ri ck
Midway -Midway -SunsetSunset
MountMountPosoPoso
MountainMountainViewView
PalomaPaloma
Plei toPlei to
PosoPosoCreekCreek
PyramidPyramidHil lsHil ls
RaisinRaisinCityCity
RioRioBravoBravo
RioRioViejoViejo
RoseRose
RoundRoundMountainMountain
SantaSantaMariaMariaValleyValley
SemitropicSemitropic
Shafter,Shafter,NorthNorth
StrandStrand
TejonTejon
TejonTejonHil lsHil lsTejon,Tejon,
NorthNorth
TenTenSectionSection
TricoTricoGasGas
TulareTulareLakeLake
UnionUnionAve.Ave.
WascoWasco
YowlumneYowlumne
Oil and Gas administrative field boundaries
Well density class changeNo change
Less than 1/km2 to Low
Less than 1/km2 or Low to Medium
From Low or Medium to High
0 8 164Miles °
0 10 20 305Kilometers
Land Use/Land CoverDeveloped & Other Human UseAgricultural, Introduced, or Modified
Shrubland & GrasslandSemi-Desert
Forest & WoodlandOpen Water
A

331
Chapter 5: Potential Impacts of Well Stimulation on Wildlife and Vegetation
CaliforniaValley
CarrizoPlains
ER
SemitropicER
WindWolves
Preserve
C a r r i z oP l a i n
N M
UnitedStates
Bureau ofReclamation
KernNWR
GiantSequoia
NM
L o s P a d r e sN a t i o n a l
F o r e s t
SequoiaNationalForest
KingsCanyonNational
Park
SequoiaNational
Park
AllensworthER
LokernER
ArroyoPasajeroWestsideDetention
Basin
LokernPreserve
SemitropicRidge
Preserve
Lopez LakeRegionalPark andNatural
Area
SantaMargarita
LakeRegionalPark andNatural
Area
LakeKaweah
SuccessLake
PixleyNWR
AntAntHil lHi l l
AsphaltoAsphalto
BeerBeerNoseNose
Belr idge,Belr idge,NorthNorth
Belr idge,Belr idge,SouthSouth
BowerbankBowerbank
BuenaBuenaVistaVista
BurrelBur rel
CalCalCanalCanalGasGas
CantuaCantuaCreekCreek(Abd)(Abd)
CoalingaCoalinga
ColesColesLevee,Levee,NorthNorth
ColesColesLevee,Levee,SouthSouth
Cuyama,Cuyama,SouthSouth
Cymr icCymr ic
DeerDeerCreekCreek
DevilsDevilsDenDen
EdisonEdisonElkElk
Hil lsHil ls
Fruit valeFruitvaleGreeleyGreeley
GuijarralGuijarralHil lsHil ls
HelmHelm
HuasnaHuasna
Jacali tosJacali tos
JasminJasmin
KernKernBluffBluff
KernKernFrontFront
KernKernRiverRiver
Kett lemanKett lemanNorth DomeNorth Dome
LosLosLobosLobos
LostLostHil lsHil ls
McKitt ri ckMcKitt ri ck
Midway -Midway -SunsetSunset
MountMountPosoPoso
MountainMountainViewView
PalomaPaloma
Plei toPlei to
PosoPosoCreekCreek
PyramidPyramidHil lsHil ls
RaisinRaisinCityCity
RioRioBravoBravo
RioRioViejoViejo
RoseRose
RoundRoundMountainMountain
SantaSantaMariaMariaValleyValley
SemitropicSemitropic
Shafter,Shafter,NorthNorth
StrandStrand
TejonTejon
TejonTejonHil lsHil lsTejon,Tejon,
NorthNorth
TenTenSectionSection
TricoTricoGasGas
TulareTulareLakeLake
UnionUnionAve.Ave.
WascoWasco
YowlumneYowlumne
Low to high well density
Oil and gas administrative field boundaries
VegetationValley Saltbush Scrub
Non-Native Grassland
Wetlands or riparian
Vernal pool complexesHigh density
Medium density
Low density
Disturbed
0 8 164Miles °
0 10 20 305Kilometers
Land Use/Land CoverDeveloped & Other Human Use
Agricultural, Introduced, or Modified
Shrubland & Grassland
Semi-Desert
Forest & Woodland
Open Water
B

332
Chapter 5: Potential Impacts of Well Stimulation on Wildlife and Vegetation
Vernalpool fairyshrimp
Vernalpool fairyshrimp
Vernalpool fairyshrimp
Vernalpool fairyshrimp
Purpleamole
Buena VistaLake ornate
Shrew
California tigerSalamander
Californiatiger
Salamander
Californiared-legged
frog
Californiared-legged
frog
Californiared-legged
frog Californiacondor
Californiacondor
Californiacondor
Californiacondor
CaliforniaValley
CarrizoPlains
ER
SemitropicER
WindWolves
Preserve
C a r r i z oP l a i n
N M
UnitedStates
Bureau ofReclamation
KernNWR
GiantSequoia
NM
L o s Pa d r e sN at i o n a l
Fo re s t
SequoiaNationalForest
KingsCanyonNational
Park
SequoiaNational
Park
AllensworthER
LokernER
ArroyoPasajeroWestsideDetention
Basin
LokernPreserve
SemitropicRidge
Preserve
Lopez LakeRegionalPark andNatural
Area
SantaMargarita
LakeRegionalPark andNatural
Area
LakeKaweah
SuccessLake
PixleyNWR
AntAntHil lHi l l
AsphaltoAsphalto
BeerBeerNoseNose
Belr idge,Belr idge,NorthNorth
Belr idge,Belr idge,SouthSouth
BowerbankBowerbank
BuenaBuenaVistaVista
BurrelBur rel
CalCalCanalCanalGasGas
CantuaCantuaCreekCreek(Abd)(Abd)
CatCatCanyonCanyon
CoalingaCoalinga
ColesColesLevee,Levee,NorthNorth
ColesColesLevee,Levee,SouthSouth
Cuyama,Cuyama,SouthSouth
Cymr icCymr ic
DeerDeerCreekCreek
DevilsDevilsDenDen
EdisonEdisonElkElk
Hil lsHil ls
FruitvaleFruitvaleGreeleyGreeley
GuijarralGuijarralHil lsHil ls
HelmHelm
HuasnaHuasna
Jacali tosJacali tos
JasminJasmin
KernKernBluffBluff
KernKernFrontFront
KernKernRiverRiver
Kett lemanKett lemanNorth DomeNorth Dome
LosLosLobosLobos
LostLostHil lsHil ls
McKitt ri ckMcKitt ri ck
Midway -Midway -SunsetSunset
MountMountPosoPoso
MountainMountainViewView
PalomaPaloma
Plei toPlei to
PosoPosoCreekCreek
PyramidPyramidHil lsHil ls
RaisinRaisinCityCity
RioRioBravoBravo
RioRioViejoViejo
RoseRose
RoundRoundMountainMountain
SantaSantaMariaMariaValleyValley
SemitropicSemitropic
Shafter,Shafter,NorthNorth
StrandStrand
TejonTejon
TejonTejonHil lsHil lsTejon,Tejon,
NorthNorth
TenTenSectionSection
TricoTricoGasGas
TulareTulareLakeLake
UnionUnionAve.Ave.
WascoWasco
YowlumneYowlumne
Low to high well density
Oil and gas administrative field boundaries
Critical habitatBuena Vista Lake ornate Shrew
California condor
California red-legged frog
California tiger Salamander
Other0 8 164
Miles °
0 10 20 305Kilometers
C
333
Chapter 5: Potential Impacts of Well Stimulation on Wildlife and Vegetation
CaliforniaValley
CarrizoPlains
ER
SemitropicER
WindWolves
Preserve
C a r r i z oP l a i n
N M
UnitedStates
Bureau ofReclamation
KernNWR
GiantSequoia
NM
L o s P a d r e sN a t i o n a l
F o r e s t
SequoiaNationalForest
KingsCanyonNational
Park
SequoiaNational
Park
AllensworthER
LokernER
ArroyoPasajeroWestsideDetention
Basin
LokernPreserve
SemitropicRidge
Preserve
Lopez LakeRegionalPark andNatural
Area
SantaMargarita
LakeRegionalPark andNatural
Area
LakeKaweah
SuccessLake
PixleyNWR
AntAntHil lHi l l
AsphaltoAsphalto
BeerBeerNoseNose
Belr idge,Belr idge,NorthNorth
Belr idge,Belr idge,SouthSouth
BowerbankBowerbank
BuenaBuenaVistaVista
BurrelBur rel
CalCalCanalCanalGasGas
CantuaCantuaCreekCreek(Abd)(Abd)
CoalingaCoalinga
ColesColesLevee,Levee,NorthNorth
ColesColesLevee,Levee,SouthSouth
Cuyama,Cuyama,SouthSouth
Cymr icCymr ic
DeerDeerCreekCreek
DevilsDevilsDenDen
EdisonEdisonElkElk
Hil lsHil ls
Fruit valeFruitvaleGreeleyGreeley
GuijarralGuijarralHil lsHil ls
HelmHelm
HuasnaHuasna
Jacali tosJacali tos
JasminJasmin
KernKernBluffBluff
KernKernFrontFront
KernKernRiverRiver
Kett lemanKett lemanNorth DomeNorth Dome
LosLosLobosLobos
LostLostHil lsHil ls
McKitt ri ckMcKitt ri ck
Midway -Midway -SunsetSunset
MountMountPosoPoso
MountainMountainViewView
PalomaPaloma
Plei toPlei to
PosoPosoCreekCreek
PyramidPyramidHil lsHil ls
RaisinRaisinCityCity
RioRioBravoBravo
RioRioViejoViejo
RoseRose
RoundRoundMountainMountain
SantaSantaMariaMariaValleyValley
SemitropicSemitropic
Shafter,Shafter,NorthNorth
StrandStrand
TejonTejon
TejonTejonHil lsHil lsTejon,Tejon,
NorthNorth
TenTenSectionSection
TricoTricoGasGas
TulareTulareLakeLake
UnionUnionAve.Ave.
WascoWasco
YowlumneYowlumne
Low to high well density
Oil and gas administrative field boundaries
Density of rare species records1 - 2 species
3 - 8 species
9 - 34 species
0 8 164Miles °
0 10 20 305Kilometers
D
334
Chapter 5: Potential Impacts of Well Stimulation on Wildlife and Vegetation
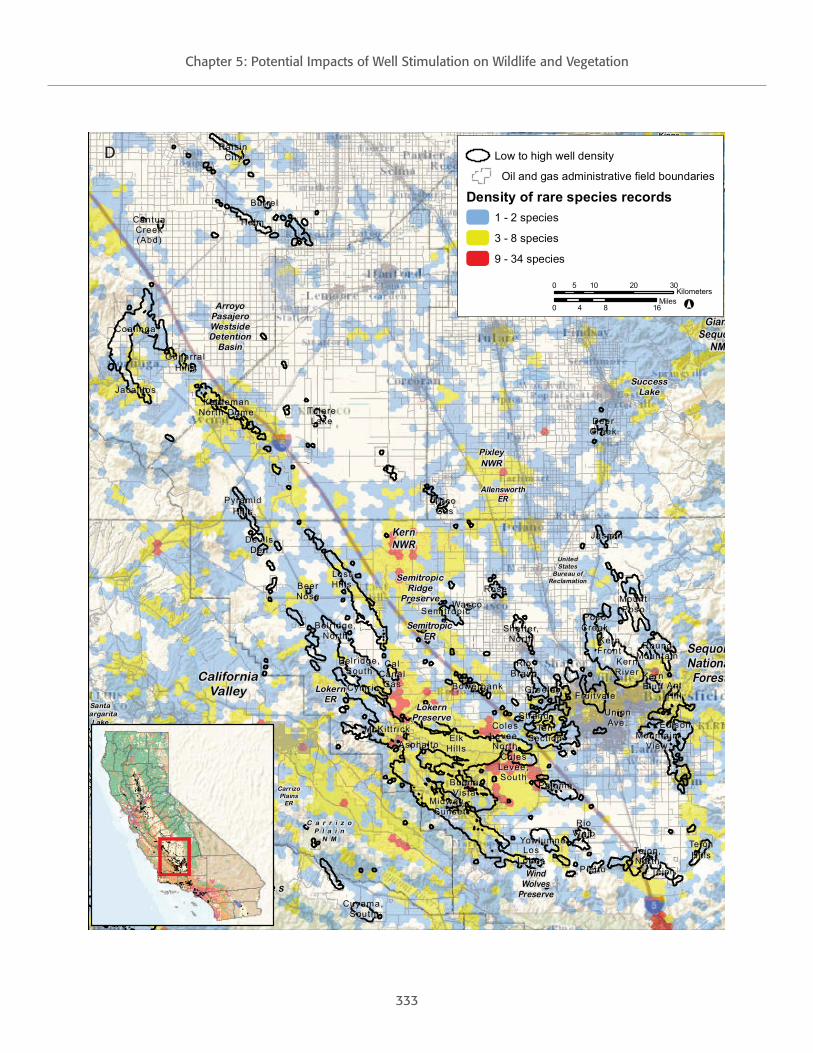
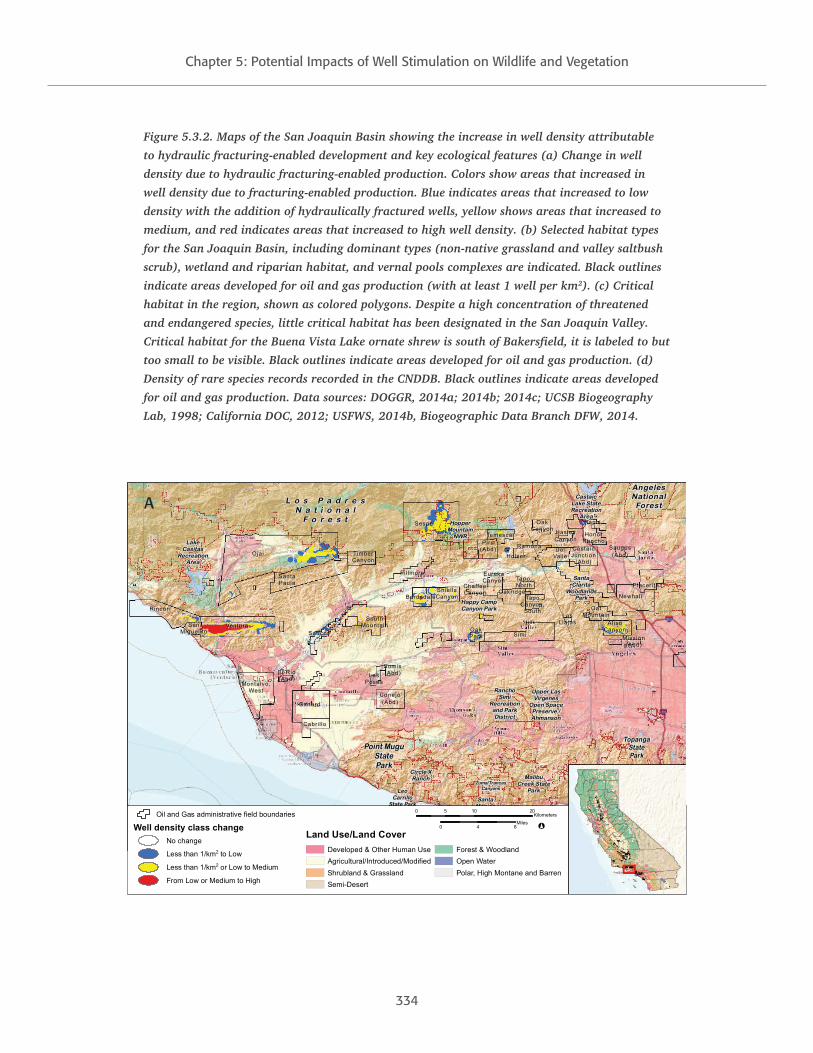
Figure 5.3.2. Maps of the San Joaquin Basin showing the increase in well density attributable
to hydraulic fracturing-enabled development and key ecological features (a) Change in well
density due to hydraulic fracturing-enabled production. Colors show areas that increased in
well density due to fracturing-enabled production. Blue indicates areas that increased to low
density with the addition of hydraulically fractured wells, yellow shows areas that increased to
medium, and red indicates areas that increased to high well density. (b) Selected habitat types
for the San Joaquin Basin, including dominant types (non-native grassland and valley saltbush
scrub), wetland and riparian habitat, and vernal pools complexes are indicated. Black outlines
indicate areas developed for oil and gas production (with at least 1 well per km2). (c) Critical
habitat in the region, shown as colored polygons. Despite a high concentration of threatened
and endangered species, little critical habitat has been designated in the San Joaquin Valley.
Critical habitat for the Buena Vista Lake ornate shrew is south of Bakersfield, it is labeled to but
too small to be visible. Black outlines indicate areas developed for oil and gas production. (d)
Density of rare species records recorded in the CNDDB. Black outlines indicate areas developed
for oil and gas production. Data sources: DOGGR, 2014a; 2014b; 2014c; UCSB Biogeography
Lab, 1998; California DOC, 2012; USFWS, 2014b, Biogeographic Data Branch DFW, 2014.
Point MuguStatePark
TopangaStatePark
AngelesNational
ForestL o s P a d r e s
N a t i o n a lF o r e s t
Ch a nne lIs l a nd s
Nat io na lPa rk
LeoCarrillo
State Park
MalibuCreek State
Park
CastaicLake StateRecreation
Area
SantaClarita
WoodlandsPark
RanchoSimi
Recreationand ParkDistrict
Upper LasVirgenes
Open SpacePreserve /Ahmanson
LakeCasitas
RecreationArea
HopperMountain
NWR
Circle XRanch
SantaMonica
MountainsNRA
Zuma/TrancasCanyons
Happy CampCanyon Park
AlisoAlisoCanyonCanyon
BardsdaleBardsdale
Cabri l loCabri l lo
CastaicCastaicJunct ionJunct ion
(Abd)(Abd)
ChaffeeChaffeeCanyonCanyon
ConejoConejo(Abd)(Abd)
DelDelValleValle
El RioEl Rio(Abd)(Abd)
EurekaEurekaCanyonCanyon
Fil lmoreFil lmore
HasleyHasleyCanyonCanyon
HolserHolser
HonorHonorRanchoRancho
LasLasLlajasLlajas
LasLasPosasPosas
MissionMission(Abd)(Abd)
Montalvo,Montalvo,WestWest
NewhallNewhall
OakOakCanyonCanyon
OakOakParkPark
OakridgeOakridge
OatOatMountainMountain
OjaiOjai
OxnardOxnard
PiruPiru(Abd)(Abd)
Placer itaPlacer ita
PlayaPlayaDel ReyDel Rey
RamonaRamona
RinconRincon
SanSanMigueli toMigueli to
SantaSantaPaulaPaula
Sat icoySat icoy
SaugusSaugus(Abd)(Abd)
Sawtel leSawtel le
SespeSespe
Shiel lsShiel lsCanyonCanyon
SimiSimi
SomisSomis(Abd)(Abd)
SouthSouthMountainMountain
TapiaTapia
TapoTapoCanyon,Canyon,
SouthSouth
Tapo,Tapo,NorthNorth
TemescalTemescal
TimberTimberCanyonCanyon
VenturaVentura
Land Use/Land CoverDeveloped & Other Human UseAgricultural/Introduced/ModifiedShrubland & GrasslandSemi-Desert
Forest & WoodlandOpen WaterPolar, High Montane and Barren
0 84Miles
°
0 10 205KilometersOil and Gas administrative field boundaries
Well density class changeNo change
Less than 1/km2 to Low
Less than 1/km2 or Low to Medium
From Low or Medium to High
A

335
Chapter 5: Potential Impacts of Well Stimulation on Wildlife and Vegetation
Point MuguStatePark
TopangaStatePark
AngelesNational
ForestL o s P a d r e s
N a t i o n a lF o r e s t
Ch a nne lIs l a nd s
Nat io na lPa rk
LeoCarrillo
State Park
MalibuCreek State
Park
CastaicLake StateRecreation
Area
SantaClarita
WoodlandsPark
RanchoSimi
Recreationand ParkDistrict
Upper LasVirgenes
Open SpacePreserve /Ahmanson
LakeCasitas
RecreationArea
HopperMountain
NWR
Circle XRanch
SantaMonica
MountainsNRA
Zuma/TrancasCanyons
Happy CampCanyon Park
AlisoAlisoCanyonCanyon
BardsdaleBardsdale
Cabri l loCabri l lo
CastaicCastaicJunct ionJunct ion
(Abd)(Abd)
ChaffeeChaffeeCanyonCanyon
ConejoConejo(Abd)(Abd)
DelDelValleValle
El RioEl Rio(Abd)(Abd)
EurekaEurekaCanyonCanyon
Fil lmoreFil lmore
HasleyHasleyCanyonCanyon
HolserHolser
HonorHonorRanchoRancho
LasLasLlajasLlajas
LasLasPosasPosas
MissionMission(Abd)(Abd)
Montalvo,Montalvo,WestWest
NewhallNewhall
OakOakCanyonCanyon
OakOakParkPark
OakridgeOakridge
OatOatMountainMountain
OjaiOjai
OxnardOxnard
PiruPiru(Abd)(Abd)
Placer itaPlacer ita
PlayaPlayaDel ReyDel Rey
RamonaRamona
RinconRincon
SanSanMigueli toMigueli to
SantaSantaPaulaPaula
Sat icoySat icoy
SaugusSaugus(Abd)(Abd)
Sawtel leSawtel le
SespeSespe
Shiel lsShiel lsCanyonCanyon
SimiSimi
SomisSomis(Abd)(Abd)
SouthSouthMountainMountain
TapiaTapia
TapoTapoCanyon,Canyon,
SouthSouth
Tapo,Tapo,NorthNorth
TemescalTemescal
TimberTimberCanyonCanyon
VenturaVentura
Land Use/Land CoverDeveloped & Other Human UseAgricultural/Introduced/ModifiedShrubland & GrasslandSemi-Desert
Forest & WoodlandOpen WaterPolar, High Montane and Barren
0 84Miles
°
0 10 205KilometersLow to high well density
Oil and gas administrative field boundaries
VegetationBuck Brush Chaparral
Venturan Coastal Sage Scrub
Wetlands or riparian
B
Westernsnowyplover
Westernsnowyplover
Westernsnowyplover
Southwesternwillow
flycatcher
Southwesternwillow
flycatcher
Californiared-legged
frog
Californiared-legged
frog
Californiared-legged frog
CoastalCalifornia
gnatcatcher
CoastalCalifornia
gnatcatcher
CoastalCalifornia
gnatcatcher
Tidewatergoby
Tidewatergoby
Tidewatergoby
Tidewatergoby
Tidewatergoby
Californiacondor
Californiacondor
Point MuguStatePark
TopangaStatePark
AngelesNational
ForestL o s P a d r e s
N a t i o n a lF o r e s t
Ch a nne lIs l a nd s
Nat io na lPa rk
LeoCarrillo
State Park
MalibuCreek State
Park
CastaicLake StateRecreation
Area
SantaClarita
WoodlandsPark
RanchoSimi
Recreationand ParkDistrict
Upper LasVirgenes
Open SpacePreserve /Ahmanson
LakeCasitas
RecreationArea
HopperMountain
NWR
Circle XRanch
SantaMonica
MountainsNRA
Zuma/TrancasCanyons
Happy CampCanyon Park
AlisoAlisoCanyonCanyon
BardsdaleBardsdale
Cabri l loCabri l lo
CastaicCastaicJunct ionJunct ion
(Abd)(Abd)
ChaffeeChaffeeCanyonCanyon
ConejoConejo(Abd)(Abd)
DelDelValleValle
El RioEl Rio(Abd)(Abd)
EurekaEurekaCanyonCanyon
Fil lmoreFil lmore
HasleyHasleyCanyonCanyon
HolserHolser
HonorHonorRanchoRancho
LasLasLlajasLlajas
LasLasPosasPosas
MissionMission(Abd)(Abd)
Montalvo,Montalvo,WestWest
NewhallNewhall
OakOakCanyonCanyon
OakOakParkPark
OakridgeOakridge
OatOatMountainMountain
OjaiOjai
OxnardOxnard
PiruPiru(Abd)(Abd)
Placer itaPlacer ita
PlayaPlayaDel ReyDel Rey
RamonaRamona
RinconRincon
SanSanMigueli toMigueli to
SantaSantaPaulaPaula
Sat icoySat icoy
SaugusSaugus(Abd)(Abd)
Sawtel leSawtel le
SespeSespe
Shiel lsShiel lsCanyonCanyon
SimiSimi
SomisSomis(Abd)(Abd)
SouthSouthMountainMountain
TapiaTapia
TapoTapoCanyon,Canyon,
SouthSouth
Tapo,Tapo,NorthNorth
TemescalTemescal
TimberTimberCanyonCanyon
VenturaVentura
0 84Miles
°
0 10 205KilometersLow to high well density
Oil and gas administrative field boundaries
Critical habitat (linear)Steelhead
Critical habitat (area)California condorCalifornia red-legged frog
Coastal California gnatcatcherSouthwestern willow flycatcher
Tidewater gobyWestern snowy plover
Other
C
336
Chapter 5: Potential Impacts of Well Stimulation on Wildlife and Vegetation
Point MuguStatePark
TopangaStatePark
AngelesNational
ForestL o s P a d r e s
N a t i o n a lF o r e s t
Ch a nne lIs l a nd s
Nat io na lPa rk
LeoCarrillo
State Park
MalibuCreek State
Park
CastaicLake StateRecreation
Area
SantaClarita
WoodlandsPark
RanchoSimi
Recreationand ParkDistrict
Upper LasVirgenes
Open SpacePreserve /Ahmanson
LakeCasitas
RecreationArea
HopperMountain
NWR
Circle XRanch
SantaMonica
MountainsNRA
Zuma/TrancasCanyons
Happy CampCanyon Park
AlisoAlisoCanyonCanyon
BardsdaleBardsdale
Cabri l loCabri l lo
CastaicCastaicJunct ionJunct ion
(Abd)(Abd)
ChaffeeChaffeeCanyonCanyon
ConejoConejo(Abd)(Abd)
DelDelValleValle
El RioEl Rio(Abd)(Abd)
EurekaEurekaCanyonCanyon
Fil lmoreFil lmore
HasleyHasleyCanyonCanyon
HolserHolser
HonorHonorRanchoRancho
LasLasLlajasLlajas
LasLasPosasPosas
MissionMission(Abd)(Abd)
Montalvo,Montalvo,WestWest
NewhallNewhall
OakOakCanyonCanyon
OakOakParkPark
OakridgeOakridge
OatOatMountainMountain
OjaiOjai
OxnardOxnard
PiruPiru(Abd)(Abd)
Placer itaPlacer ita
PlayaPlayaDel ReyDel Rey
RamonaRamona
RinconRincon
SanSanMigueli toMigueli to
SantaSantaPaulaPaula
Sat icoySat icoy
SaugusSaugus(Abd)(Abd)
Sawtel leSawtel le
SespeSespe
Shiel lsShiel lsCanyonCanyon
SimiSimi
SomisSomis(Abd)(Abd)
SouthSouthMountainMountain
TapiaTapia
TapoTapoCanyon,Canyon,
SouthSouth
Tapo,Tapo,NorthNorth
TemescalTemescal
TimberTimberCanyonCanyon
VenturaVentura
0 84Miles
°
0 10 205KilometersLow to high well density
Oil and gas administrative field boundaries
Density of rare species records1 - 2 species
3 - 8 species
9 - 34 species
D
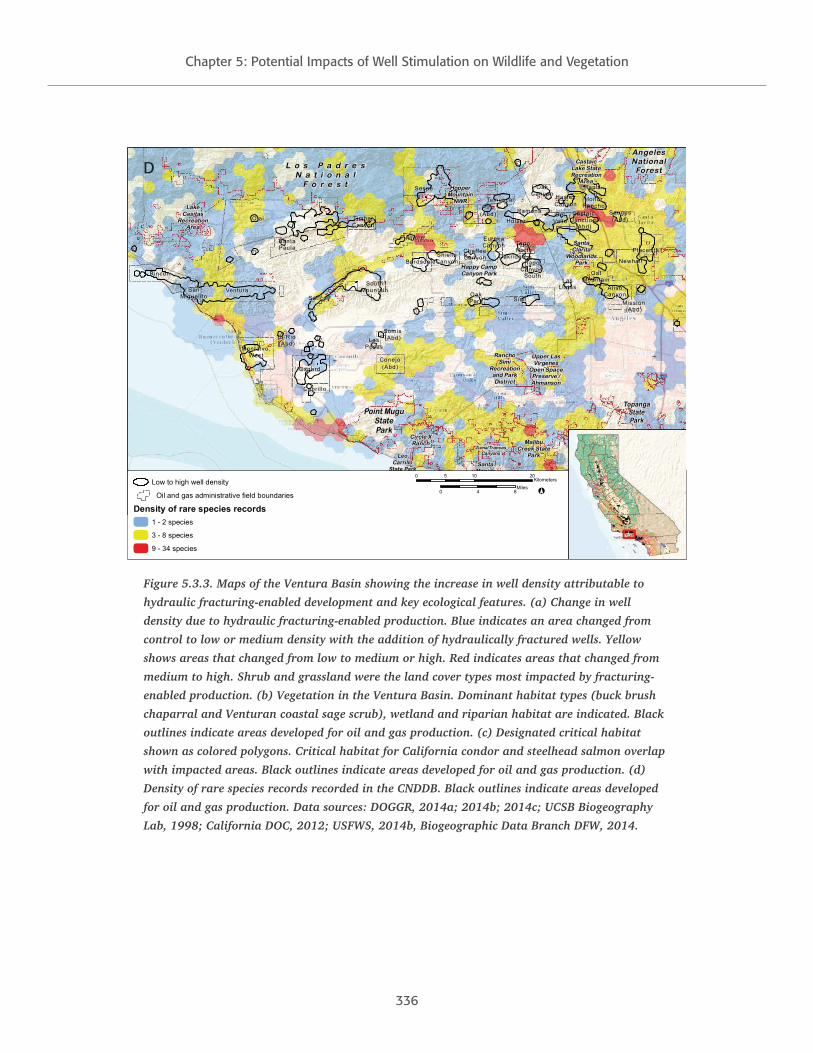
Figure 5.3.3. Maps of the Ventura Basin showing the increase in well density attributable to
hydraulic fracturing-enabled development and key ecological features. (a) Change in well
density due to hydraulic fracturing-enabled production. Blue indicates an area changed from
control to low or medium density with the addition of hydraulically fractured wells. Yellow
shows areas that changed from low to medium or high. Red indicates areas that changed from
medium to high. Shrub and grassland were the land cover types most impacted by fracturing-
enabled production. (b) Vegetation in the Ventura Basin. Dominant habitat types (buck brush
chaparral and Venturan coastal sage scrub), wetland and riparian habitat are indicated. Black
outlines indicate areas developed for oil and gas production. (c) Designated critical habitat
shown as colored polygons. Critical habitat for California condor and steelhead salmon overlap
with impacted areas. Black outlines indicate areas developed for oil and gas production. (d)
Density of rare species records recorded in the CNDDB. Black outlines indicate areas developed
for oil and gas production. Data sources: DOGGR, 2014a; 2014b; 2014c; UCSB Biogeography
Lab, 1998; California DOC, 2012; USFWS, 2014b, Biogeographic Data Branch DFW, 2014.
337
Chapter 5: Potential Impacts of Well Stimulation on Wildlife and Vegetation
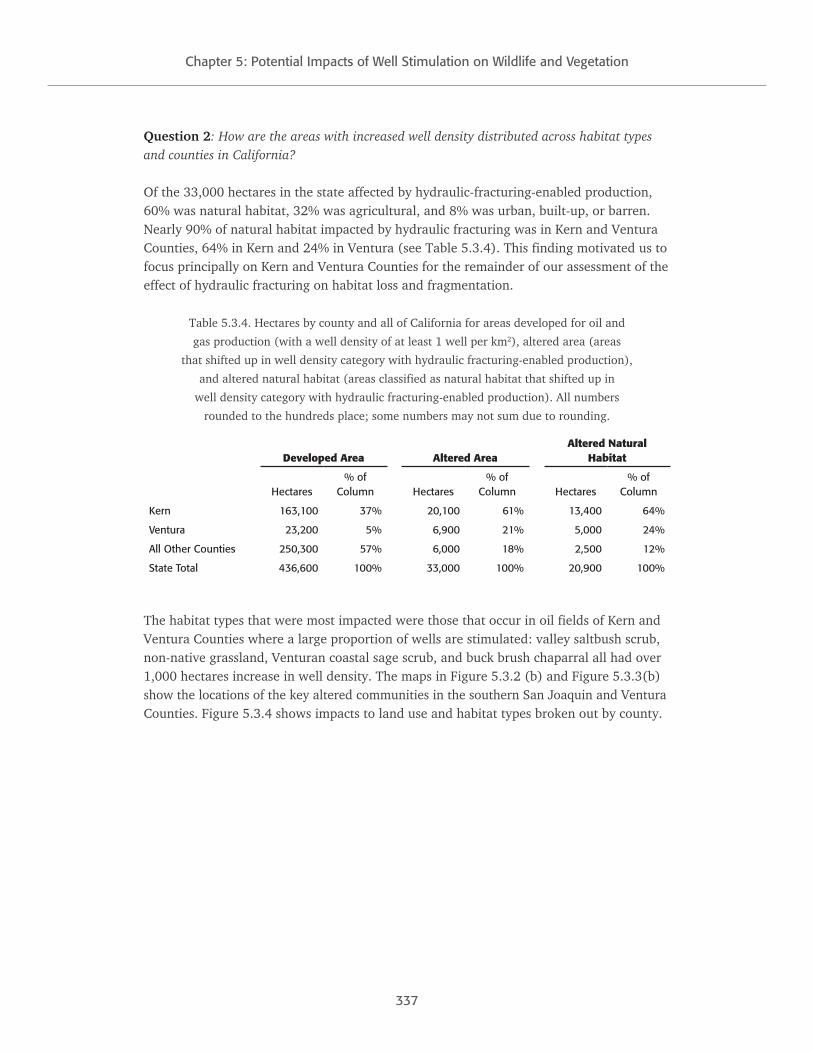
Question 2: How are the areas with increased well density distributed across habitat types and counties in California?
Of the 33,000 hectares in the state affected by hydraulic-fracturing-enabled production, 60% was natural habitat, 32% was agricultural, and 8% was urban, built-up, or barren. Nearly 90% of natural habitat impacted by hydraulic fracturing was in Kern and Ventura Counties, 64% in Kern and 24% in Ventura (see Table 5.3.4). This finding motivated us to focus principally on Kern and Ventura Counties for the remainder of our assessment of the effect of hydraulic fracturing on habitat loss and fragmentation.
Table 5.3.4. Hectares by county and all of California for areas developed for oil and
gas production (with a well density of at least 1 well per km2), altered area (areas
that shifted up in well density category with hydraulic fracturing-enabled production),
and altered natural habitat (areas classified as natural habitat that shifted up in
well density category with hydraulic fracturing-enabled production). All numbers
rounded to the hundreds place; some numbers may not sum due to rounding.
Developed Area Altered AreaAltered Natural
Habitat
Hectares% of
Column Hectares% of
Column Hectares% of
Column
Kern 163,100 37% 20,100 61% 13,400 64%
Ventura 23,200 5% 6,900 21% 5,000 24%
All Other Counties 250,300 57% 6,000 18% 2,500 12%
State Total 436,600 100% 33,000 100% 20,900 100%
The habitat types that were most impacted were those that occur in oil fields of Kern and Ventura Counties where a large proportion of wells are stimulated: valley saltbush scrub, non-native grassland, Venturan coastal sage scrub, and buck brush chaparral all had over 1,000 hectares increase in well density. The maps in Figure 5.3.2 (b) and Figure 5.3.3(b) show the locations of the key altered communities in the southern San Joaquin and Ventura Counties. Figure 5.3.4 shows impacts to land use and habitat types broken out by county.

338
Chapter 5: Potential Impacts of Well Stimulation on Wildlife and Vegetation
0
2000
4000
6000
8000
10000
12000
Valley Saltbush
Scrub
Non-Native Grassland
Venturan Coastal Sage
Scrub
Buck Brush Chaparral
Water Riparian and Wetland
Other Natural Communities
Agricultural Land
Urban or Built-up Land
Natural Communities Human Uses
Alte
red
Are
a (h
a)
Other Counties
Orange
Los Angeles
Ventura
Kern
Figure 5.3.4. Land use and habitat types impacted by hydraulic-fracturing-enabled production
in California. A large amount of the area that increased in well density due to hydraulic
fracturing is agricultural or urban land already highly disturbed by humans and generally
unsuitable as habitat for native wildlife and vegetation. Areas designated as natural
communities are important habitat for wildlife and vegetation. The counties that had the
greatest amount of impacted area are color-coded. The data used to generate this figure are in
Appendix 5.D, Table 5.D.2.
The rate of natural habitat areas newly impacted by hydraulic-fracturing-enabled production is a larger proportion of recent activity (from Oct 1, 2012 – Sep. 30, 2014). Of the 1,400 hectares that were newly developed for oil and gas production during the period from Oct. 1, 2012 to Sep. 30, 2014, about 300 hectares (18%) could be attributed to hydraulic fracturing.
Habitat loss caused by hydraulic-fracturing-enabled-production is highly localized and has disproportionate effects in a few areas and for a few habitat types. For valley saltbush scrub, 6% of its statewide extent was impacted by hydraulic-fracturing-enabled-production, and 2% for Venturan coastal sage scrub (Appendix 5.D, Table 5.D.1). In proportion to the total amount of habitat in the state, the amount of habitat impacted by hydraulic-fracturing-enabled-production is small: on the order of less than one-tenth of one percent.

339
Chapter 5: Potential Impacts of Well Stimulation on Wildlife and Vegetation
The area of altered aquatic habitat was quite small. Statewide, there were about 300 hectares of altered open water habitat and 140 of riparian and wetland habitat. While the impacts to aquatic habitats was small in terms of total area affected by hydraulic-fracturing-enabled-production, even small impacts to aquatic areas merit consideration because they are generally considered high-value habitats and are accorded special protections under the Federal Clean Water and Coastal Zone Management Acts, as well as the State Lake and Streambed Alteration, Porter-Cologne Water Quality Act, and California Coastal Acts. Most of the altered riparian and wetland habitat was in Ventura County, followed by Los Angeles County (Appendix 5.D, Table 5.D.2(a)). For open water, altered areas were concentrated in Orange County, followed by Ventura County. Despite the high intensity of hydraulic fracturing activity in the San Joaquin Valley, there is little impact in terms of increased well density in aquatic habitat because the two do not overlap geographically. Potential impacts to aquatic habitats are discussed further in the chapter in the sections on fluid discharges and water use associated with well stimulation, in Sections 5.3.3 and 5.3.4, below.
Our results should be interpreted with caution, as the resolution of the data on natural communities is coarse relative to the size of a well pad. The natural community data is given on a scale of tens to 400 hectares (from one-tenth to four square kilometers). Well pads for a single well are typically smaller than a tenth of a square kilometer (SHIP, 2014). Therefore, when we find that well density increased in an area of a given habitat type, this may mean that the wells were in the vicinity of these habitat types, but not directly in them.
Question 3: What special-status species occurred in the vicinity of oil fields highly impacted by well stimulation?
Under the Federal and California Endangered Species Acts (ESA and CESA), threatened and endangered species, referred to collectively as “listed” species, are entitled to special legal protections. Species are listed as endangered because they are at risk of extinction; they are listed as threatened because they are likely to become endangered. In Table 5.3.5 we identify threatened and endangered species with occurrences recorded in the California Natural Diversity Database (CNDDB) on or within 2 km of oil and gas fields with at least 200 hectares impacted by hydraulic fracturing.

340
Chapter 5: Potential Impacts of Well Stimulation on Wildlife and Vegetation
Table 5.3.5. Number of occurrences of listed species within 2 km of a field with at least
200 hectares of altered habitat. Table based on detections of rare species submitted to
the California Natural Diversity Database (Biogeographic Data Branch DFW, 2014).
San Joaquin kit fox (Vulpes macrotis mutica) 234
Nelson’s antelope squirrel (Ammospermophilus nelsoni) 189
blunt-nosed leopard lizard (Gambelia sila) 78
giant kangaroo rat (Dipodomys ingens) 68
Kern mallow (Eremalche kernensis) 32
Tipton kangaroo rat (Dipodomys nitratoides nitratoides) 15
least Bell’s vireo (Vireo bellii pusillus) 13
coastal California gnatcatcher (Polioptila californica californica) 11
California jewelflower (Caulanthus californicus) 4
Bakersfield cactus (Opuntia basilaris var. treleasei) 3
California red-legged frog (Rana draytonii) 3
giant garter snake (Thamnophis gigas) 3
San Joaquin woollythreads (Monolopia congdonii) 3
Santa Ana sucker (Catostomus santaanae) 3
southern steelhead - southern Calif. DPS (Oncorhynchus mykiss irideus) 3
Swainson’s hawk (Buteo swainsoni) 3
Buena Vista Lake ornate shrew (Sorex ornatus relictus) 2
California condor (Gymnogyps californianus) 2
Ventura Marsh milk-vetch (Astragalus pycnostachyus var. lanosissimus) 2
California Orcutt grass (Orcuttia californica) 1
slender-horned spineflower (Dodecahema leptoceras) 1
southwestern willow flycatcher (Empidonax traillii extimus) 1
tidewater goby (Eucyclogobius newberryi) 1
unarmored threespine stickleback (Gasterosteus aculeatus williamsoni) 1
Total 676
An important indicator of valuable habitat is whether it has been designated as critical habitat for the recovery of a federally listed species. Critical habitat should be taken as a conservative indicator of valuable habitat; that is, there are likely to be habitats necessary for the survival of endangered species that have not been designated as critical habitat due to the legal and administrative difficulties in finalizing the process. The United States Fish and Wildlife Service (USFWS) has designated critical habitat for only 44% of all listed species in the U.S.
The only designated critical habitat in the southern San Joaquin Valley is for the Buena Vista Lake ornate shrew. Four small patches on the scale of a few square kilometers each are scattered through the southern portion of the valley in the vicinity of Coles Levee North and South, Buttonwillow Gas, Semitropic, and Semitropic Gas fields. Little to no

341
Chapter 5: Potential Impacts of Well Stimulation on Wildlife and Vegetation
well stimulation occurs in these fields; the only reported hydraulic fracturing events in these five fields were two in the Semitropic field in 2012 (Volume I, Appendix M) and four notices of planned jobs at Coles Levee North (DOGGR, 2015).
Critical habitat has been designated for a number of species in Ventura County. Areas where substantial amounts of hydraulic-fracturing-enabled production has taken place in the Ojai and Sespe fields overlap with critical habitat for the California condor (Gymnogyps californianus) and steelhead salmon (Oncorhynchus mykiss irideus) (Figure 5.3.3c).
5.3.2. Human Disturbance Can Facilitate Colonization by Invasive Species
Hydraulic-fracturing-enabled production, like any other oil and gas production, can facilitate the introduction of invasive species, including non-native species (Hobbs and Huenneke, 1992). This occurs because human disturbances such as clearing and levelling land tend to open new niches, and humans and their vehicles can act as vectors for colonizers (Didham et al. 2005). Colonization by invasive species would largely be an indirect impact of well stimulation, given that most of the surface disturbance and vehicle traffic not directly in the service of well stimulation, but there would be some truck traffic that would be directly related to transporting materials and workers to implement a stimulation operation.
Invasive species are defined as non-native organism that reproduce and spread rapidly. They are typically habitat generalists and they frequently displace native species (Rejmánek and Richardson, 1996; Belnap, 2003; Coffin, 2007; Jones et al., 2014). Among plants, these species usually are typical of early successional stages in vegetation communities. Thus, any soil disturbances such as grading, disking, earthmoving, or vegetation clearing result in conditions that favor invasive species (Tyser and Worley, 1992; Gelbard and Belnap, 2003). In oilfields, such activities also can create novel micro-habitats such as borrow areas that collect moisture, berms along roads and around tank settings, and so forth, that provide colonization opportunities for species not native to an area. In the Elk Hills oilfield, the diversity of grasses and forbs (both non-native and native) increased on higher intensity oilfield plots, probably due to the increase in micro-habitats (Fiehler and Cypher, 2011). Also, seeds of species not native to an area are commonly transported in on equipment, vehicles, and boots, further increasing the opportunities for colonization.
Non-native animals also are able to colonize areas disturbed by humans. Rodents such as rats and house mice are common around developments. In western Kern County, Spiegel and Small (1996) found that house mice were extremely abundant in highly developed oilfields, but did not occur in nearby undisturbed habitat. Fiehler and Cypher (2011) found that bird abundance and species richness increased with level of oilfield development. They attributed this to increased contact between areas of intact habitat and human-disturbed areas, increased structural diversity resulting from the presence of facilities such as buildings, facilities, power lines, and pump jacks, and also to increased

342
Chapter 5: Potential Impacts of Well Stimulation on Wildlife and Vegetation
vegetation diversity both from colonization by non-native plants and landscape plantings. They also found that non-native bird species were more abundant in highly developed areas whereas certain sensitive native species were much less abundant. In the San Joaquin Valley, another potential concern is colonization by non-native red foxes. This species has been increasing in this region, particularly in human-altered areas where its natural predator, the coyote, is less abundant (B. Cypher, CSU-Stanislaus, pers. observ.). Red foxes can compete with and even occasionally kill endangered San Joaquin kit foxes (Ralls and White, 1995; Cypher et al., 2001; Clark et al., 2005).
Occasionally, anthropogenic disturbances can benefit native species, including rare or sensitive species. In western Kern County, a federally threatened plant, Hoover’s wooly-star (Eriastrum hooveri) quickly colonized disturbed sites and was commonly found on abandoned roads and well pads (Hinshaw et al., 1998; Holmstead and Anderson, 1998). Also in western Kern County, endangered blunt-nosed leopard lizards (Gambelia sila) commonly used dirt roads for foraging and movements in areas where dense ground cover impeded such activities (Warrick et al., 1998).
5.3.3. Discharges of Wastewater and Stimulation Fluids Can Affect Wildlife and Vegetation
The discussion in this chapter on discharges of fluids summarizes information presented in Chapter 2, with an expanded discussion of the literature relevant to assessing potential impacts to wildlife and vegetation. We review the potential pathways for release of fluids to the environment, the ecotoxicology of well stimulation fluids and wastewater, and consider the potential impacts of fluid releases to terrestrial, freshwater and marine ecosystems. Discharges of fluids can be a direct or indirect impact of well stimulation. The brines and hydrocarbons produced from the formation are part of any oil and gas production and are considered an indirect impact, while the a release to the environment of a stimulation fluid is a direct impact of well stimulation.
5.3.3.1. Potential Pathways for Release of Fluids to the Environment
Discharges of fluids related to well stimulation can occur intentionally through discharges of waste products to the surface, or by accidental spills and leaks. Chapter 2, Figure 2.6.1 shows surface (and near-surface) contaminant release mechanisms of concern in California related to stimulation, production, and wastewater management and disposal activities. The additives for stimulation fluids and proppant are typically transported by truck to a stimulation site (see Chapter 2, 2.4.3, “Evaluation of the Use of Additives in Stimulation Fluids,” for more detail). They are diluted with water and injected into the stimulated well. Some portion of the stimulation fluids returns to the surface, mixed with hydrocarbons, formation water and possibly well clean-out fluids (see Chapter 2 Section 2.5.2, “Description of Wastewaters Generated by Well-Stimulation Operations”).

343
Chapter 5: Potential Impacts of Well Stimulation on Wildlife and Vegetation
The fluid produced from a well that remains after the marketable hydrocarbons are separated out is referred to as wastewater. For the purposes of this report, we are interested in any release of stimulation fluids to the environment as a direct impact of well stimulation. We are also interested in discharge of wastewater from stimulated wells to the environment, whether or not it contains stimulation fluids, as an indirect effect of well-stimulation enabled production.
Stimulation fluids and wastewater can potentially come into contact with wildlife and vegetation in a number of ways. Accidental releases can occur at any stage of the process, from transport of chemicals to the site, at the site during a stimulation operation, through an underground pathway, or once the fluids return to the surface after well completion. Wastewater can also be legally discharged to the terrestrial or freshwater environment under certain conditions to unlined surface pits, used for groundwater discharge, or applied to agricultural land for irrigation. In federal waters, treated wastewater can legally be discharged to the ocean.
5.3.3.1.1. Exposure to Stimulation Fluids and Wastewater in Land and Freshwater Ecosystems
Potential routes of environmental exposure to hydraulic fracturing chemicals include accidental spills and intentional discharges to surface storage ponds. Outside of California, Bamberger and Oswald (2012) documented a number of observations of harm to livestock, domestic animals, and wildlife that correlated with surface spills or intentional surface applications of wastewater from hydraulically fractured wells; however, these case studies were analyzed retrospectively through interviews, veterinary reports and other sources, and did not distinguish hydraulic fracturing flowback from produced water, so they cannot be taken as definitive evidence of direct harm from hydraulic fracturing operations.
Wildlife can suffer negative effects or mortality by drinking from or immersing themselves in wastewater storage or disposal ponds (Ramirez, 2010; Timoney and Ronconi, 2010). In the limited studies available of ecological impacts of oil field activity in California, there are a few documented cases of giant kangaroo rats, blunt-nosed leopard lizards and San Joaquin kit foxes drowning in accidental spills of oil and oil-laden wastewater (Kato and O’Farrell, 1986; O’Farrell and Kato, 1987). Suter et al. (1992) examined the elemental content of fur samples from San Joaquin Kit Foxes inhabiting two oil fields (one active, one inactive), and two control areas. They found that foxes on the developed sites had elevated levels of a number of elements which may be attributable to oil field materials. However, their results must be interpreted with caution because of flaws the authors themselves acknowledge in sampling design and statistical methods.
As described in Chapter 2, Section 2.5, discharge of wastewater to percolation pits, also called evaporation-percolation ponds, is the most commonly reported disposal method for stimulated wells in California. Percolation pits are primarily regulated by the state’s nine

344
Chapter 5: Potential Impacts of Well Stimulation on Wildlife and Vegetation
Regional Water Quality Control Boards. Much of the state’s well stimulation takes place within the jurisdiction of the Central Valley Regional Water Quality Control Board. Within its jurisdiction, wastewater can legally be disposed of in percolation pits with a permit from the regional water board. However, it was recently found that an estimated 36% of sumps have been operating without the necessary permits (Holcomb, 2015). The Central Valley Regional Water Board requires that the fluid in the pits meet certain water quality standards for salinity (measured as electrical conductivity), chlorides, and boron. Oil field wastewater that exceeds the salinity thresholds may be discharged in percolation pits, or to local streams or ponds “if the discharger successfully demonstrates to the Regional Water Board in a public hearing that the proposed discharge will not substantially affect water quality nor cause a violation of water quality objectives.” There is no testing required, or thresholds specified, for other contaminants. However, oil field wastewater typically contains other chemicals such as volatile organic compounds (VOCs), benzene, and naturally occurring radioactive material (NORM) that are of concern for human and environmental health.
Based on information obtained from the Central Valley Regional Water Quality Control Board and the State Water Resources Control Board, there are 950 known evaporation-percolation ponds in eight California counties, listed in Table 5.3.5 (Borkovich 2015a and b, CVRWQCB 2015). In Kern County, there were 484 active pits, 221 inactive, and 138 of unknown status, for a total of 843. There were no sump locations in Ventura County in the datasets we obtained. However, these datasets must be treated with caution as likely representing a minimum, but not necessarily a comprehensive list of percolation pit locations in the state. Chapter 2 discusses the caveats for these datasets.
Table 5.3.5. Reported sump locations in California. Locations were coded by status: active indicates
that the location contained produced water, inactive sumps were empty, and the rest are unknown
status. Data from CVRWQCB 2015 and Borkovich 2015a and 2015b (Appendix Chapter 2, 2.G).
Status
County Active Inactive Unknown Total
Kern 484 221 138 843
Fresno 31 16 47
Tulare 30 30
Santa Barbara 9 4 13
Kings 9 9
San Benito 1 3 1 5
Monterey 1 1 2
San Luis Obispo 1 1
Grand Total 566 245 139 950
345
Chapter 5: Potential Impacts of Well Stimulation on Wildlife and Vegetation
To reduce access to sumps by animals, California regulations require that any pond containing oil or a mixture of oil and water must be covered with a net with no more than a two-inch mesh (California Code of Regulations Title 14 § 1770 on Oilfield Sumps). Ponds not containing oil are not subject to such a requirement. We used the reported locations of percolation pits gathered by the Central Valley Regional Water Quality Control Board to plot the locations of sumps in Google Earth and survey the pits for nets. We randomly selected 200 sumps to survey. Of these, 114 contained fluid at the time the aerial photograph for Google Earth was taken. Twenty-seven of the 114 pits in use (24%) were covered with nets. We could not determine whether unnetted pits had trace oil in the water or whether they all met the legal requirements to be unnetted. Nonetheless, other constituents besides oil could impact the health of organisms that come in contact with the sumps, particularly if the produced water contains traces of stimulation chemicals.
While there are at least 950 known sumps in eight counties, not all of these have necessarily received produced water from stimulated wells. As discussed in detail in section 2.5.3.3 of this volume, “Management of Produced Water,” and 2.6.2.1, “Use of Unlined Pits for Produced Water Disposal,” reports of disposal of wastewater specifically from stimulated wells to unlined pits was limited to Kern County and was associated with the Elk Hills, South Belridge, North Belridge, Lost Hills, and Buena Vista fields. Very few operators are discharging wastewater from stimulated wells to creeks or streams, with two stimulated wells reported to be discharging a total of 2,060 m3 (2 acre-feet) of wastewater into surface water bodies during the first full month following stimulation.
As described in depth in section 2.6.2.9 of this volume, “Spills and Leaks,” there are two databases maintained by the state on spills of oil and produced water, one by DOGGR and one by California Governor’s Office of Emergency Services (OES). The OES database also documents chemical spills on oil fields. Neither dataset provides information, such as an American Petroleum Institute (API) number, that would allow a spill to be associated with a stimulated well. The databases also do not give precise identification nor concentrations of the chemical constituents of spilled substances, giving very general descriptions such as “produced water” or “acid” that do not allow evaluation of the ecological impacts. Between January 2009 and December 2014, a total of 575 produced water spills were reported to OES, or an average of about 99 spills annually. The majority (55%) of these spills occurred in Kern County, followed by Los Angeles (16%), Santa Barbara (13%), Ventura (6%), Orange (3%), Monterey (2%), and San Luis Obispo (1%), and Sutter (1%) counties. Nearly 18% of these spills impacted waterways. Chemical spills were also reported in California oil fields, including spills of chemicals typically used in well stimulation fluids, e.g., hydrochloric, hydrofluoric, and sulfuric acids. Between January 2009 and December 2014, a total of 31 chemical spills were reported to OES. Forty-two percent of these spills were in Kern County, followed by Los Angeles (16%), Sonoma (16%), and Lake (3%) counties. Chemical spills represent about 2% of all reported spills attributed to oil and gas development during that period. 10% of the chemical spills were reported to enter a waterway.

346
Chapter 5: Potential Impacts of Well Stimulation on Wildlife and Vegetation
At present there is insufficient data available to determine the concentration and volume of the chemical constituents in wastewater intentionally and accidentally released to the environment. The impact to the environment will depend on a multitude of unknown factors including the volume and chemical content of the wastewater, how it is treated, where it is released, and transformations in the environment.
5.3.3.1.2. Discharges to the Ocean
Although ocean discharge from platforms in State waters (within 3 nautical miles of the coast) is prohibited, platforms operating in federal waters off California’s coast are legally allowed to discharge treated produced water which may contain flowback containing stimulation chemicals to the ocean. Chapter 2 Section 2.5.3.3.2, “Wastewater from Offshore Oil and Gas Operations,” describes the scope of the discharge and the regulations on its volume, composition, and monitoring. Accidental discharge of fluids to the ocean is also possible, although we are not aware of any data indicating that the rate of accidental spills, such as blowouts, differs for stimulated and unstimulated wells. As such, the main difference between a spill from a stimulated versus unstimulated well would be the potential presence of stimulation fluids. The potential impacts to the marine ecosystem of intentional and accidental discharge will be examined in-depth in the Volume III Offshore Case Study.
5.3.3.2. Ecotoxicology of Well Stimulation Fluids and Wastewater
Adverse impacts on wildlife and vegetation can result from exposure to chemicals in stimulation fluids and wastewater from stimulated wells. The data on the chemical content of these substances is discussed in depth in Vol II Chapter 2 Sections 2.4, “Characterization of Well Stimulation Fluids,” and 2.5.4, “Wastewater Characteristics.” In that chapter, environmental hazards of well stimulation additives and wastewater were evaluated in detail with respect to acute and chronic toxicity, bioaccumulation, and environmental persistence. In this section, we briefly revisit the topic with a focus on potential impacts to wildlife and vegetation if organisms are exposed to these fluids. However, our understanding of the long-term impacts of low-level exposure to these chemicals is limited, because much of the information on toxicity to organisms is collected in the laboratory using relatively high concentrations of individual chemicals. Impacts to organisms from a release of well stimulation and/or wastewater to the environment will depend on the actual concentration of chemicals and the reactions they undergo in the environment. In addition, standard toxicity tests are conducted on a limited suite of organisms that may not reflect the biology of California’s native biota (see Vol II Chapter 2 Section 2.4.4.4, “Characterization by environmental toxicity,” for more detail).
5.3.3.2.1. Stimulation Fluids
Exposure to chemicals used in well stimulation has been shown to adversely affect mammals, fish, invertebrates and algae in acute toxicity tests. Environmental toxicity

347
Chapter 5: Potential Impacts of Well Stimulation on Wildlife and Vegetation
of stimulation fluids is discussed in depth in Volume II Chapter 2 Section 2.4.4.4, “Characterization by Environmental Toxicity” and Section 2.4.7, “Other Environmental Hazards of Well Stimulation Fluid Additives.”
5.3.3.2.2. Inorganics in Wastewater
Wastewater from stimulated wells is made up of a mixture of stimulation fluids, formation fluids, and well clean-out fluids (see Chapter 2 Section 2.5.2, “Description of Wastewaters Generated by Well-Stimulation Operations).” Some inorganic chemicals in underlying rock formations that are brought to the surface through oil and gas production can be hazardous to wildlife and vegetation. Some geologic formations associated with well stimulation activity in California contain relatively high levels of trace elements and radionuclides (Piper et al., 1995; Presser et al., 2004). Inorganics mobilized by well stimulation may pose a risk to California wildlife and vegetation. Selenium enrichment is particularly problematic in the western San Joaquin Valley, including Kern County (Presser and Ohlendorf, 1987). Selenium exposure can cause developmental toxicity in birds and fish at environmentally relevant levels (Presser and Barnes, 1985). Several other trace elements (e.g., Cd, Cu, Ni, V) that are enriched in well stimulation areas are known to cause adverse effects in wildlife and vegetation at environmentally relevant levels (e.g., Eisler 1998; Larison et al., 2000; Rattner et al., 2006; Shahid et al., 2014). Formation water is also typically high in salt content; many plants and aquatic organisms in particular are highly sensitive to salt concentrations (Allen et al., 1975; Pezeshki et al., 1989; Ruso et al., 2007). Among the metals copper, selenium, titanium and vanadium are the most likely to accumulate (Love et al., 2013). Persistence, biodegradation, and bioaccumulation are discussed in more detail in Chapter 2 Section 2.4.7.1, “Environmental Persistence.”
A major gap in knowledge of the ecotoxicology of stimulation fluids and associated wastewater is how the number of toxic and/or persistent compounds already used in well stimulation fluids might alter the toxicity and persistence of the chemical compounds in produced waters. The literature on possible additivity and synergistic interactions of persistent/toxic compounds is scarce and a proper risk assessment of chemical mixtures is currently hampered by the lack of data (Martins et al., 2009; Shen et al., 2006; Stelzer & Chan, 1999; Pellacani et al., 2012).
5.3.3.2.3. Hydrocarbons in Wastewater
Produced water generally contains a number of soluble hydrocarbons, along with metals and other compounds used in well treatment (Benko & Drewes, 2008; Clark & Veil, 2009). In California most information on produced water in the marine environment is from oil production facilities in the Santa Barbara Channel. Most of the toxicity of produced water is attributed to the water-soluble fractions of the hydrocarbons (Garman, et al., 1994). At a well blowout site in Kern County, Kaplan et al. (2009) found evidence that Heermann’s kangaroo rats (Dipodomys heermanni) incorporated into their livers a set of chemicals, polycyclic hydrocarbons, that originated from crude oil.

348
Chapter 5: Potential Impacts of Well Stimulation on Wildlife and Vegetation
5.3.3.3. Summary of Impacts of Discharges of Stimulation Fluids and Wastewater to Wildlife and Vegetation
When handled without accident, wastewater can be either reused or disposed of. One type of reuse involves re-injecting produced water into the formation to enhance oil recovery and counteract subsidence. Occasionally wastewater is used for irrigation or industrial purposes. Alternatively, wastewater may be disposed of in pits or injection wells, referred to as Class II wells in the USEPA’s Underground Injection Control Program. A very small amount is disposed of by discharging it directly into the ocean. No matter how wastewater is reused or disposed of, there is the potential for spills and environmental releases of chemicals used in the well stimulation process. Laws and regulations seek to minimize the occurrence and consequences of environmental releases of inadequately treated fluids, however releases of chemicals to the environment can and do occur. Chapter 2 of this volume analyzed the potential effects of these releases by considering the toxicity of the most commonly used chemicals for well stimulation, and the chemicals used in the greatest mass. The evaluation considered toxicity of relatively high concentrations of the chemical, and therefore represents a worst possible scenario. In practice, the chemicals are often diluted or removed by treatment practices before fluids are released to the environment.
Our understanding of the impacts of discharges of stimulation fluids and wastewater to wildlife and vegetation is hampered by lack of data on multiple levels. Based on ecotoxicology data on stimulation fluids and wastewater, we can state that the discharge of stimulation fluids and wastewater from stimulated wells has the potential to harm wildlife and vegetation, but the actual magnitude of the impacts will depend on the frequency, location, volume, and chemical concentrations of discharges. We lack substantive data on the frequency of releases, the volumes and concentrations of discharges, and the long-term impacts on wildlife and vegetation once the fluids enter the environment. More is known about the potential indirect impacts of inorganics and hydrocarbons in formation waters and production fluids than the direct effect of stimulation fluids. Mammalian wildlife can be more susceptible to adverse effects of inorganics and hydrocarbons due to higher exposure levels than the human population. Increased data collection on potential releases of stimulation fluids and wastewater to the environment and refinement of the ecotoxicological analysis would lead to a better understanding of this risk.
5.3.4. Use of Water Can Harm Freshwater Ecosystems
Water is the main constituent of stimulation fluids, and water use to make stimulation fluids is a direct impact of well stimulation. Well stimulation can also in some situations enable production from reservoirs that also require enhanced oil recovery for effective production (EOR). Common forms EOR such as water flooding, steam flooding, and cyclic steaming require. Use of water for EOR enabled by hydraulic fracturing is an indirect impact of well stimulation. Competition for water with human uses is a major cause in the

349
Chapter 5: Potential Impacts of Well Stimulation on Wildlife and Vegetation
alteration and decline of the state’s aquatic ecosystems (Moyle and Leidy, 1992). Water use for well stimulation is discussed in detail in Chapter 2 Section 2.3, “Water Use for Well Stimulation in California.” Water for well stimulation is a small fraction of freshwater used in the state. Chapter 2 reports that well stimulation in the state uses 850,000 to 1,200,000 m³ (690–980 acre-feet) annually; this is about 0.01% (one ten-thousandth) of California’s annual human water use. Even factoring in EOR enabled by well stimulation, the proportion of water use for both well stimulation and well stimulation – enabled EOR is 0.03% (three ten-thousandths) of annual human water use in the state. However, well stimulation is a highly geographically clustered activity, so it is important to consider water use in a regional context. Chapter 2 looks at water use for well stimulation and EOR enabled by well stimulation within planning areas. There are 56 planning areas in the state, ranging in size from 320 to 7,500 square miles, with an average size of 2,600 square miles. The planning area with the largest proportion of its water used by well stimulation and EOR enabled by well stimulation is the Semitropic Planning Area in the western portion of Kern county. In the Semitropic, .19% of the annual water use, or 2,900,000 m3, is for well stimulation and EOR enabled by well stimulation. Thus, even in the region where most of the well stimulation in the state occurs, it represents a small proportion of total water use.
The statistics on water use for well stimulation on a state-wide and regional scale indicate that well stimulation represents a small percentage of water diverted from large sources. Of the 495 well stimulation completion reports filed with DOGGR between January 1 and December 10, 2014, all but two were for operations in Kern County. Most of the Kern County operations (397, or 83%) used water from the Belridge Water Storage District, which sources water from the State Water Project. The State Water Project delivers about 470 million m3 (2.3 million acre-feet) in average years, which dwarfs the amount of water used for well stimulation; as a result, a very small proportion of the impact to ecosystems by the State Water System can be attributed to withdrawals for well stimulation.
The available data on water use for stimulation does not allow us to do is to determine whether water diversions for well stimulation cause very small-scale, local impacts on surface waterways. The main pathway for water use to impact the health of an ecosystem is if water use is a large proportion of streamflow for a surface waterway, or if groundwater is drawn down locally so that it substantially decreases baseflow to a stream. While water use for well stimulation is of a small enough volume that it is unlikely to have a substantial impact on large bodies of water, it is conceivable that an operator could divert a large proportion of a small waterway or locally draw down groundwater enough to affect small bodies of surface water. In order to understand very local impacts such as these, data on the source of well stimulation water would need to be reported on a finer spatial scale than it is at present. In well stimulation disclosures, operators report the source of water by category such as irrigation districts (68%), produced water (13%), operators’ own wells (13%), a nearby municipal water supplier (4%), or a private landowner (1%). This level of reporting does not allow us to establish if, for example, a proportionately large amount of water is being withdrawn from the groundwater by private wells in one small area, or diverted from a small surface waterway.

350
Chapter 5: Potential Impacts of Well Stimulation on Wildlife and Vegetation
5.3.5. Noise and Light Pollution Can Alter Animal Behavior
Oil and gas operations are sources of anthropogenic noise caused by equipment and night-time lighting. Some noise is generated by the equipment used specifically for well stimulation, chiefly the hydraulic fracturing pumps, and would be considered an indirect impact. Noise is also generated at other stages of process such as site preparation, drilling, and production and would be considered an indirect result of well stimulation. Night-time lighting for production enabled by stimulation would be an indirect impact. Well stimulation operations typically last on the order of hours (King, 2012), so the duration of noise and light directly caused by well stimulation is brief compared to the months to years of noise and light associated with ensuing production.
Noise and artificial night lighting have been shown to effect the communication, foraging, competition, and reproduction of organisms. Sound is an important sensory tool for animals and noise pollution from oil and gas production has been shown to alter their behavior, distribution, and reproductive rates (Blickley et al., 2012a and b; Francis et al., 2012). Noise is generated at all stages of the oil and gas production process, from construction of the well, stimulation, and production, until the well is abandoned. We could find only one reported measurement of noise specifically during hydraulic fracturing in California. Noise levels of 68.9 and 68.4 decibels (dBA) were measured 1.8 m (5 ft) above the ground 33m (100 ft) and 66 m (200 ft) away from a high-volume hydraulic fracturing operation in the Inglewood Field (Cardno ENTRIX, 2012). These levels are substantially lower than those found to disturb wildlife and ecosystem processes in Blickley et al. (2012a and b) and Francis et al. (2012). Observational data collected in the Elk Hills region of western Kern County between 1980 and 2000 suggested that the San Joaquin kit fox and other wildlife appeared to have habituated and acclimated to the regimen of noise, ground vibrations, and human disturbances associated with an active oil field (O’Farrell et al., 1986).
Ecological light pollution is a specific term describing chronically increased illumination and temporary unexpected fluctuations in lighting (Longcore and Rich, 2004). Sources of ecological light pollution include lighted buildings, streetlights, security lights, vehicle lights, flares on off-shore oil platforms, and lights on well pads. Light pollution has been shown to extend diurnal or crepuscular foraging behaviors (Hill, 1990; Schwartz and Henderson, 1991), reduced nocturnal foraging in desert rodents (Kotler, 1984), disorient organisms who hatch at night such as sea turtle hatchlings (Salmon, 2003; Witherington, 1997) and disorient nocturnal animals such as birds (Ogden, 1996) and frogs (Buchanan, 1993) leading to mortality or predation. Many studies have also noted changes of breeding and migration behaviors (Rydell, 1992; Eisenbeis, 2006; Stone et al., 2009; Titulaer et al., 2012; Bergen and Abs, 1997). Ecological light pollution can also disrupt plant by distorting their natural day-night cycle (Montevecchi et al., 2006). It is considered an important force behind the loss of light-sensitive species and the decline of nocturnal pollinators such as moths and bats (Potts et al., 2010) and can change the composition of whole communities (Davies et al., 2012).
351
Chapter 5: Potential Impacts of Well Stimulation on Wildlife and Vegetation
There are no specific studies on the effect of artificial lighting on wildlife on or around well pads, however, some states like Maryland have implemented best management practices for oil and gas development to mitigate any potential effects. These include using only night lighting when necessary, directed all light downward, and using low pressure sodium light sources when possible (Maryland Department of the Environment and Maryland Department of Natural Resources, 2014).
5.3.6. Vehicle Traffic Can Cause Plant and Animal Mortality
Vehicles impact natural habitats by striking and killing animals; vehicles traveling off-road can cause plant mortality and compact the soil. The proppant, and occasionally water, required for well stimulation is transported via trucks; vehicles are also an integral piece of equipment in all other stages of oil and gas production. Road mortality is noted as a major factor affecting the conservation status of two state and federally listed species in California known to occur on the oil fields of the San Joaquin Valley: the San Joaquin kit fox and the blunt-nosed leopard lizard (Williams et al., 1998). Vehicle traffic is inherent in most stages of the oil and gas production process, including, but not limited to stimulation; therefore it is both a direct and indirect impact.
Road mortality on oil fields has specifically been studied in the San Joaquin kit fox. In one study at the Elk Hills Oil Field, the proportion of San Joaquin kit fox deaths due to road accidents was four times greater in developed areas versus in undisturbed areas (O’Farrell et al., 1986). A later study at the same field found vehicle-related mortality rates for endangered San Joaquin kit foxes were approximately double in oil-developed areas versus non-developed areas, although overall rates were considered low (20 of 225 deaths during 1980-1995; (Cypher et al., 2000). Similarly, (Spiegel and Disney, 1996) found that none of 29 foxes found dead during 1989-1993 in the highly developed Midway-Sunset and McKittrick-Cymric oilfields had been killed by vehicles. Restrictions on speed limits and off-road driving that are imposed in many oil fields as a measure to mitigate vehicle strikes may explain the low mortality rates.
5.3.7. Ingestion of Litter Can Cause Condor Mortality
As with many sites of human activity, oil and gas pads can become deposits for litter. While there may be marginally more litter as a result of the process of preparing a site for production taking slightly longer and requiring more staff when stimulation is involved, litter is presumably mainly an indirect impact that is associated with all stages of the hydrocarbon production process, not just well stimulation.
Critical habitat for the California Condor overlaps with the Sespe Oil Field in the Los Padres National Forest, and the Sespe Condor Sanctuary is adjacent to the oil field of the same name. U.S. Forest Service guidelines that well pads be maintained free of debris. Nonetheless, oil operations are nonetheless potential sources of microtrash that can cause mortality in condors (Mee et al., 2007a and b; USFWS, 2005). Microtrash consists of

352
Chapter 5: Potential Impacts of Well Stimulation on Wildlife and Vegetation
any man-made item that is sufficiently small to be ingested by a condor, up to about 4 cm in diameter. Items found in condors have included nuts, bolts, washers, copper wire, plastic, bottle caps, glass, and ammunition cartridges (Mee et al., 2007a and b; Walters et al., 2010). For reasons that are unclear, adults will collect such items and feed them to nestlings (Mee et al., 2007a and b; Rideout et al., 2012). Of 18 nestlings for which cause of death could be determined, 8 (44%) deaths were attributable to microtrash ingestion (USFWS, 2013). The national forest, the U.S. Bureau of Land Management (BLM) (which administers the mineral rights in the forest), and the USFWS all have imposed measures to minimize or eliminate the presence of microtrash (USFWS, 2005).
5.3.8. Potential Future Impacts to Wildlife and Vegetation
In this report we predict that the main focus for hydraulic fracturing in the state will continue to be in and around the areas where it is already used, principally the southwestern San Joaquin Basin (Volume I Chapter 4). The possibility of a sudden development of new areas with hydraulic fracturing-enabled production hinges largely on the possibility of developing Monterey source rock, which is a highly uncertain possibility at this stage. Here we briefly summarize what we know and the data gaps about potential future well stimulation impacts to wildlife and vegetation and refer the readers to the relevant sections of other volumes for more detail.
• Hydraulic fracturing will likely continue to be an important part of oil and gas production in California. In this report we predict that it will continue in and around the fields where it is already routinely used, principally in the San Joaquin Valley (Volume I Chapter 4, Volume II Chapter 5). However, we cannot predict the future location and density of hydraulically fractured wells. As a result we refrain from making detailed forecasts about future habitat loss and fragmentation caused by hydraulic fracturing.
• The degree to which new development will affect habitat loss and fragmentation will depend on whether future development is “infill” (an increased density of already-developed areas) or expansion (growth in undeveloped areas), and the degree to which wells and other infrastructure are clustered or evenly distributed across the landscape. Volume III Chapter 5 examines production as a function of well density in one pool of the Lost Hills oil field and concludes that production increases linearly with well density, suggesting that operators will continue to drill new wells in already-developed areas to increase total yields. The lease with the highest yield in the Cahn pool has a well density of approximately 200 wells per km2; we would predict that, as long as the activity remains profitable, the remainder of this pool will reach similar densities. A study in another San Joaquin oil field found that native species disappeared at well densities of about 100 wells per km2 (Fieler and Cypher, 2011). We do not know if all hydraulically fractured pools show a similar linear relationship between yield and well density, but the study of the Cahn pool suggests a possible way to examine this question on a pool-by-pool basis in future research.

353
Chapter 5: Potential Impacts of Well Stimulation on Wildlife and Vegetation
• We do not know the limit of the surface footprint of pools requiring hydraulic fracturing. Volume III, Chapter 5 examines two pools in detail, the Cahn Pool at Lost Hills field and the Pyramid Hill-Vedder pool in Mount Poso field, and notes that there is a mix of curved and linear borders of wells producing from these pools. The linear borders suggest that development was limited by a legal boundary (such as a lease) and that the geological resource extends further. This suggests that there are untapped resources just beyond the reach of existing wells that can be developed in the future with the application of hydraulic fracturing.
• While we identify potential pathways for impacts of well stimulation to wildlife and vegetation besides habitat loss and fragmentation in this chapter, the available information is insufficient to quantify past or future impacts to populations. For example, while we know that the release of stimulation chemicals is a possible impact, we do not know to what degree it occurs nor whether it causes declines in population sizes. Without adequate information on past and present impacts, we cannot hope to predict the future impacts.
• It is possible that hydraulic fracturing could open large new areas for development if operators learned how to effectively develop Monterey source rock, although these areas would still be in the general vicinity (within 20 kilometers) of existing oil fields in the six largest oil-producing basins in the state (Volume III Chapter 3). At present there is no reliable resource assessment of Monterey source rock. Based on the documented challenges in developing Monterey source rock, economic production of Monterey source rock appears to be a remote possibility at present, and one which would require technological innovations that may change the profile of impacts from oil and gas production (such as greater reliance on clustered, horizontal wells). Because of these many uncertainties, we did not perform a detailed prediction of future well density in the Monterey source rock footprint, although we did examine the biological resources present in the area to consider the environmental context in which the development could occur. The footprint of Monterey source rock is in the San Joaquin, Ventura, Los Angeles, Salinas, Santa Maria, and Cuyama basins. Within the footprint, about 60% of the area is used intensively by people (i.e. for cities, agriculture, or industry), and about 40% is open space (grass and shrublands, forest, and open water). The footprint of potential Monterey source rock underlies the area of the southwestern San Joaquin identified as highly sensitive in this chapter.
5.4. Laws and Regulations Governing Impacts to Wildlife and Vegetation from Oil and Gas Production
While the preceding has outlined the major potential hazards to wildlife and vegetation, the degree to which these hazards actually impact wildlife and vegetation is mitigated to some extent by the numerous federal and state laws governing how human activities such as well stimulation must be carried out to minimize impacts on wildlife and vegetation.

354
Chapter 5: Potential Impacts of Well Stimulation on Wildlife and Vegetation
For example, the National Environmental Policy Act (NEPA), the Federal Endangered Species Act (ESA), the Migratory Bird Treaty Act, the California Endangered Species Act (CESA), California Fully Protected Designations, and the California Environmental Quality Act (CEQA) are directed at protecting the natural environment. In this section, we briefly review regulations applicable in California in order to describe the regulatory system as it pertains to impacts to wildlife and vegetation of oil and gas production and well-stimulation-enabled oil and gas production.
A detailed description of the regulatory setting for biological resources in California is given in the SB4 Draft Environmental Impact Report (Aspen Environmental Group, 2015a and 2015b). However, the pertinent laws do not consistently establish practices that all California oil and gas producers must enact to reduce their impacts on wildlife and vegetation. The relevant laws are brought to bear differently depending on which agencies have jurisdiction over the project and site-specific circumstances. This results in a patchwork of agreements that are not necessarily consistent with one another on a statewide or even regional scale, and that are not compiled in one central repository that is publicly available, but rather exist in the records of a multitude of federal, state, and local agencies, and the private entities who entered into the agreements. For example, Occidental Petroleum and the California Department of Fish and Game6 entered into a memorandum of understanding and take authorization governing activities at Elk Hills oil field (California Department of Fish and Game, 1997). This document does not apply to any of the other fields in the state.
The process by which environmental regulations are applied to minimize impacts to wildlife and vegetation varies depending upon the landowner and the mineral rights owner at a given location. Not uncommonly, a “split estate” situation exists whereby the owner (s) of the land and the owner (s) of the mineral rights beneath that land are different. If the land or mineral rights are federally owned, then the process is more consistent. In these situations, the federal agency that owns the surface and/or mineral estate must authorize any oil and gas development projects and grant permits. These actions necessitate formal review of the proposed project under NEPA. The federal action agency, often with a project description and site-specific information provided by the project proponent, prepares an Environmental Assessment or Environmental Impact Statement under NEPA to analyze the effects of the project. Appropriate terms and conditions are attached to the federal authorization to avoid or mitigate project effects on natural resources.
Ideally, this document describes how the project will comply with all applicable environmental laws. Also, the federal agency is responsible for ensuring that the project proponent complies with all applicable laws and regulations (see Aspen Environmental Group 2015a and b for a list of applicable laws and regulations).
6. Now known as the California Department of Fish and Wildlife.

355
Chapter 5: Potential Impacts of Well Stimulation on Wildlife and Vegetation
If the land and mineral rights are privately owned, then the process depends upon the nature of the proposed project. If the project is to drill a new well, the well must be permitted by DOGGR. Before DOGGR can issue a permit, the project is required to be subjected to review under CEQA. The project proponent prepares an Environmental Impact Report, and this is the document that is subject to review. Ideally, this document describes how the project will comply with all applicable environmental laws. If the project is something other than a new well (e.g., construction of infrastructure such as pipelines, facilities, etc.), then the responsible agency usually is a county or local municipality. The requirements and process are then very variable with some agencies providing little to no requirements or oversight with regards to environmental regulations, and others imposing rigorous requirements and oversight. Even when agency oversight is minimal or non-existent, project proponents still are required to comply with all laws and regulations, but such compliance tends to be variable.
Given the patchwork of regulatory agreements pertaining to oil and gas activities throughout the state and the lack of any centralized collection for such agreements, it is not possible for us to fully evaluate the regulations that the various oil and gas operators may or may not be operating under, nor evaluate the degree to which these agreements are consistent or complementary with one another. We emphasize that the lack of consistency in the application of regulatory requirements is in no way unique to oil and gas operations, but instead is common to all activities evaluated under the acts listed at the beginning of this section. The requirements tend to vary among habitats, species, agency staff conducting the evaluations, and precedents established among offices within agencies. Finally, requirements for a given oil and gas project may vary depending upon whether the project was initiated before or after a given regulatory act was passed and implemented.
5.5. Measures to Mitigate Oil Field Impacts on Terrestrial Species and Their Habitats
The potential hazards to wildlife and vegetation posed by well stimulation and the production it enables can be reduced through application of the appropriate mitigation measures. A variety of measures are frequently required in oil fields in California to avoid or mitigate impacts to terrestrial species and their habitats resulting from oil and gas extraction activities. To our knowledge, no mitigation measures for the protection of terrestrial species and their habitats are specific to well-stimulation activities, but apply to oil and gas production activities that can be enabled by well stimulation such as construction of well pads, roads, facilities, and pipelines; maintenance and operations; and seismic surveys.
The list of measures presented in this section is largely derived from examples in the San Joaquin Valley, where oil field activity is extensive and where sensitive biological resources are abundant (see Introduction, Section 5.2, for synopsis of San Joaquin Valley biological values). Measures implemented in other regions probably are similar with nuances specific to the species and habitats in those regions.

356
Chapter 5: Potential Impacts of Well Stimulation on Wildlife and Vegetation
Below, we list and describe commonly implemented mitigation measures in oil fields. This list was compiled from documents that addressed oil and gas production in large oil fields or over large regions. The primary documents were U.S. BLM, 2010; U.S. DOE, 1991; 2001; US DOI, 2012; USFWS, 2001. The documents used in this compilation addressed large, extensive oil and gas production operations conducted over multiple years. All of the information presented below was distilled from the sources above unless otherwise cited. The measures are grouped into broad categories based on their intended purpose. Here we focus principally on impacts to the terrestrial environment; the alternative and best practices given in Volume II, Chapter 2 focus on strategies for reducing risks to water supply and quantity that can impact the aquatic environment.
5.5.1. Habitat Disturbance Mitigation
5.5.1.1. Compensatory habitat
In an effort to compensate for habitat destruction resulting from oil field activities, project proponents commonly are required to permanently conserve undisturbed habitat elsewhere. Such habitat is referred to as “compensatory habitat.” This requirement can be satisfied by project proponents in various ways including using lands they already own, purchasing lands, and purchasing credits in an approved habitat mitigation bank. For lands owned or purchased, the project proponent can retain and manage the lands, or transfer them to a natural resources agency (e.g., CDFW) or an approved conservation organization (e.g., Center for Natural Lands Management). The lands must be protected in perpetuity and managed appropriately. Agency-approved management plans typically are required for lands retained by project proponents, and endowment funds for management must be provided along with lands transferred to another agency or organization.
This approach to mitigation uses what are generally referred to as “environmental offsets,” and has become a common form of environmental regulation in the United States and Europe. The goal of offsets is to counteract the impact of development to achieve a net neutral or beneficial outcome. For example, beginning in the 1970s, most states adopted a “no net loss” policy for wetlands. Rather than banning all development in wetland areas, developers were given the option of compensating for wetland loss by creating new wetlands elsewhere on an acre-for-acre basis. The mitigation approach is not without its detractors, however; see e.g. McKenney (2005), Race and Fonseca (1996).
For California oil and gas projects, the ratio of compensatory land to altered land is variable. In the San Joaquin Valley, a common ratio is 3:1, meaning three units of compensatory habitat for every one unit of habitat disturbed. For “temporary” habitat disturbances (usually defined as disturbances lasting less than two years), the ratio is 1.1:1. Examples of temporary disturbances include the installation of buried pipelines and equipment staging areas. In such situations, the disturbed area is allowed to revegetate through natural or active habitat restoration, and then is again available for use by species. Other ratios have been required, including 4:1 in cases where protected lands are disturbed (USFWS, 2001). (Many lands in the San Joaquin Valley are “split estates” in

357
Chapter 5: Potential Impacts of Well Stimulation on Wildlife and Vegetation
which one party owns the surface of the land and another party owns the mineral rights underlying the land. In such situations, access to the minerals must be granted. Thus, mineral extraction activities are not uncommon on protected lands.) A ratio of 6:1 was required for any projects that disturbed habitat for federally endangered Kern Mallow (Eremalke kernensis; USFWS, 2001). In the case of an oil field waste-processing facility constructed in highly sensitive habitat used by multiple listed species in Kern County, the required ratio was 19:1 (D. Mitchell, Diane Mitchell Environmental Consulting, personal communication).
Compensatory habitat is typically “in kind;” that is, the habitat must be of equal or higher value than the habitat that was disturbed. Furthermore, listed species present on the disturbed habitat also must be present on the compensatory habitat.
5.5.1.2. Disturbance minimization
Measures commonly are implemented to reduce the amount of habitat disturbed by oil-field activities. Some of the measures are implemented in the planning phase of a project (e.g., planning to drill multiple wells from a single pad). Other measures constitute best management practices implemented during the construction or operations phases.
• Use existing roads to the extent possible.
• Use previously disturbed areas to the extent possible.
• Try to aggregate facilities to the extent possible.
• Drill multiple wells from a single pad by using directional and horizontal drilling.
• Route pipelines along existing roads whenever possible.
• Elevate pipelines to minimize surface disturbance and allow animals to freely move under the pipeline.
• If off-road travel is necessary and permitted (e.g., seismic surveys), use all-terrain vehicles (ATVs) instead of full-sized vehicles when possible for cross-country travel, as ATVs are smaller and lighter and therefore cause less damage when driven across habitat.
In some situations, the total habitat disturbance permitted in a given area is restricted. Lands administered by the U.S. BLM in the southern San Joaquin Valley have been categorized based on the suitability of the lands for listed species. In “Red Zones,” which are within identified reserve areas, surface disturbance from oil and gas extraction activities may not exceed 10%. In “Green Zones,” which are identified as dispersal corridors between reserve areas, surface disturbance cannot exceed 25% (USFWS, 2001). This policy takes into account cumulative impacts from all projects on BLM land in the region.

358
Chapter 5: Potential Impacts of Well Stimulation on Wildlife and Vegetation
5.5.1.3. Habitat degradation mitigation
Measures commonly are implemented to reduce habitat degradation. These measures are different from disturbance minimization measures in that they are intended to avoid or mitigate transient or accidental impacts that can degrade habitat quality.
• Prohibit off-road travel. Vehicles are restricted to use of existing roads.
• Contain and remediate fluid spills. Various types of fluids are used or produced in oil fields. Many of these fluids are highly toxic, but even clean water in inappropriate situations can cause flooding of burrows, drowning of individuals, and soil erosion. Control strategies can include building berms around facilities that hold fluids. If spills do occur in habitat, then clean up, removal of contaminated soils, and restoration may be required.
• Prevent and suppress fires. Fires can significantly degrade habitat quality, particularly in regions like the San Joaquin Valley where vegetation communities are not fire-adapted. Thus, oil field operators may implement a variety of measures to prevent fires, including use of spark arrestors on equipment, prohibiting open flames, restricting smoking at field sites, equipping all vehicles with fire extinguishers, and staging fire suppression equipment at field work sites.
• Prohibiting or restricting public access. Access to oil fields by the general public may be prohibited or at least limited. Access by the public can potentially result in environmental impacts, such as off-road vehicle use, shooting of animals, trampling of sensitive plant populations, wild fires, and trash dumping.
5.5.2. Avoidance of Direct Take
Measures commonly are implemented in oil fields to avoid the “taking” of listed species. According to the ESA and CESA, “taking” can include direct mortality, injury, harassment, or other actions that may adversely affect individuals of a listed species. This list was compiled from documents that addressed oil and gas production in large oil fields or over large regions. The primary documents were U.S. BLM, 2010; U.S. DOE, 1991; 2001; US DOI, 2012; USFWS, 2001.
• Conduct surveys to determine whether listed or sensitive species are present on or near sites where habitat will be impacted or where activities potentially put individuals at risk.

359
Chapter 5: Potential Impacts of Well Stimulation on Wildlife and Vegetation
• Avoid to the extent practicable any sensitive habitat areas or biological features important to listed or sensitive species. Sensitive habitat areas can include vernal pools, riparian areas, wetlands, and rare plant locations. Important biological features can include dens, burrows, and roosting sites. Avoidance commonly is achieved through the establishment of exclusion zones that are closed to entry by humans and vehicles.
• Exclude, remove, or relocate individuals that cannot be avoided. If individuals or features cannot be avoided, then measures are usually required to remove them to avoid injury or death of individuals.
• Use signage to protect sensitive areas. Permanent signage sometimes is used to indicate sensitive habitat areas or important biological features and exclude entry by humans.
• Use fencing to exclude animal entry into dangerous areas. Fencing is sometimes used around project sites to exclude entry by rare animals. Typically, this strategy is applied to relatively small sites (e.g., well pads) that can be effectively fenced and that are not so extensive (e.g., long, linear projects) that the fencing would severely inhibit animal movements through the area. Occasionally, more extensive (e.g., long, linear projects) are fenced in segments so as to permit animal movements through an area. Examples of species commonly excluded with fencing include blunt-nosed leopard lizards (Gambelia sila), kangaroo rats (Dipodomys spp.), and California tiger salamanders (Ambystoma californiense).
• Install fencing and netting around and over sumps to exclude entry by animals. Sumps are commonly constructed to contain fluids produced in oil fields, in particular produced water that is pumped from wells along with oil and gas. Such water can include a variety of chemicals potentially harmful to animals. Animals can be attracted to sumps filled with produced water mistaking them for a source of drinking water or wetland habitat. Fencing and netting is placed around and over these sumps to prevent animals from accessing the water in which they could drown, or if ingested or absorbed, could cause injury or death.
• Cap all pipes to prevent entry by animals. Pipes are used in abundance in oil fields for drilling wells, constructing pipelines, and other purposes. Animals occasionally seek shelter in pipes, and then can be harmed or killed if they become entrapped in the pipe or the pipe is moved. Capping the ends of pipes prevents use by animals.
• Prevent animal entrapment in open trenches and pits. Trenches and pits are commonly dug in oil fields for a variety of purposes. Strategies to prevent animal entrapment include (1) covering them when work is not being performed, (2) monitoring, usually at the beginning and end of the work day, and removal of any animals, (3) reducing side slopes to 45 degrees or less, and (4) building ramps to allow any trapped animals to escape.

360
Chapter 5: Potential Impacts of Well Stimulation on Wildlife and Vegetation
• Limit vehicle speeds. To reduce the potential for animals to be struck by vehicles, speed limits are commonly imposed in oil fields. In areas with listed or sensitive species, limits are typically no more than 25 mph and sometimes as low as 5 mph. Lower speed limits may be required at night when animals are active.
• Remove all trash and food that might attract animals to work sites. Typically at the end of the work day, all trash and food is removed from the site so as not to attract animals.
• Prohibit dogs or other pets. Domestic animals, particularly dogs, potentially could pursue, capture, and kill wildlife species. Even just the presence of dogs potentially could alter wildlife behavior in a detrimental manner. Domestic animals also could carry and introduce diseases into local wildlife populations.
• Prohibit firearms. This restriction is imposed to prevent the shooting of wildlife.
• Restrict pesticide use. Use of pesticides (e.g., rodenticides, insecticides, herbicides, etc.) may be prohibited or strictly regulated to avoid poisoning of wildlife and plants.
• Mitigation measures for rare plants. In areas where rare plant populations are known to occur, mitigation measures specifically for plants may be required. These measures include (1) complete avoidance of oil field activities, where possible, (2) limiting activities in plant populations to the period between seed set and germination, (3) collecting seeds and redistributing them in nearby undisturbed areas, (4) collecting and storing top soil, and then redistributing it in disturbed areas or back on the original site if the disturbance is temporary, and (5) prohibiting the use of herbicides in or near plant populations.
• Use of biological monitors. Biological monitors may be required to be present when work is being conducted. This is a common requirement in areas where listed species are known to be present. Biological monitors must be qualified biologists (i.e., trained to recognize species of interest and knowledgeable of applicable laws and regulations as well as appropriate responses to the appearance of species on work sites or non-compliance by workers). Monitors ensure that exclusion zones are avoided by workers, monitor activity by sensitive animals, monitor worker compliance, participate in worker education and awareness programs, and prepare compliance reports. Monitors commonly have the authority to halt work in situations such as (1) the appearance of a listed species on site, (2) death or injury of a listed species, or (3) non-compliance by workers.

361
Chapter 5: Potential Impacts of Well Stimulation on Wildlife and Vegetation
5.5.3. Environmental Restoration
Restoration involves environmental remediation and recovery of ecological functions on sites where habitat has been disturbed. DOGGR provides some guidance and requirements (California Code of Regulations Title 14 § 1776 on Well Site and Lease Restoration). In essence, upon abandonment, wells must be plugged and all structures and materials on the surface must be removed. Any toxic or hazardous materials must be cleaned up. Any excavations must be filled and compacted, and any unstable slopes must be mitigated. Finally, the site should be “returned to as near a natural state as practicable.”
Otherwise, requirements for restoration are inconsistent and range widely from none to extensive. On U.S. BLM lands in the southern San Joaquin Valley, intensive restoration is required and detailed protocols and procedures are provided to project proponents (USFWS, 2001). In other instances, project proponents are asked to prepare a restoration plan and submit it for agency approval (Padre Associates, 2014). The purpose of restoration efforts is to try to reestablish sufficient ecological function on previously disturbed lands such that they can again be used by local native species. Restoration usually is conducted whenever a disturbed area (e.g., road, well pad, facility site, pipeline) is no longer needed for oil and gas production activities.
Elements of restoration could include the following:
• Removal of all anthropogenic materials.
• Removal of any contaminated soil.
• Ripping/disking the site to reduce soil compaction.
• Earthwork to restore natural contours of a site.
• Seeding with native plants (seed mixes vary immensely but usually include one or more shrub species).
• Application of sterile straw or other cover material to inhibit erosion.
• Monitoring restoration success. A typical performance measure is to restore vegetative cover on a disturbed site such that it is equal to at least 70% of the cover on nearby undisturbed sites.

362
Chapter 5: Potential Impacts of Well Stimulation on Wildlife and Vegetation
5.5.4. Employee Training
A common requirement for oil and gas production operations is to provide environmental training for employees. Such training generally is required of any individual that works on a given project, even if employee responsibilities do not include field work. Employee education and awareness programs commonly include information on:
• How to recognize listed and sensitive species.
• How to recognize sensitive habitats.
• Mandatory mitigation measures and their implementation.
• Applicable laws and regulations, and consequences that could result from non-compliance.
5.5.5. Regional Species-Specific Measures
Most of the measures described above are relatively general and therefore widely applied. In addition to these general measures, there may be measures required that are specific to local listed or sensitive species. Appendix 5.A gives specific measures that have been required in oil fields occurring within the range of California condors (Gymnogyps californianus), Arroyo toads (Bufo californicus), red-legged frogs (Rana aurora draytonii), and fairy shrimp (Castle Peak Resources, 2011; USFWS, 2009; 2005).
5.5.6. Efficacy of Mitigation Measures
As detailed above, numerous measures have been implemented in oil fields to mitigate impacts to terrestrial species and their habitats from oil and gas production activities. However, rarely has the efficacy of any of the measures been assessed. In general, most of the measures have not been subject to systematic studies quantifying the contribution of the measures to the conservation of biological resources. However, a small number of assessments have been conducted, and these are summarized below.
5.5.6.1. Use of Barriers to Exclude Blunt-Nosed Leopard Lizards
Germano et al. (1993) evaluated the use of barriers to exclude endangered blunt-nosed leopard lizards from a 2-km pipeline trench and associated right-of-way. Prior to erecting barriers, lizards were getting trapped in the trench and were observed along the right-of-way used by construction vehicles. They used strips of aluminum flashing and plastic erosion cloth, and both materials effectively excluded lizards from the construction area, although the flashing was cheaper and less likely to collapse.
363
Chapter 5: Potential Impacts of Well Stimulation on Wildlife and Vegetation
5.5.6.2. Use of Topsoil Salvage to Conserve Hoover’s Wooly-Star
Hinshaw et al. (1998) investigated the salvage of topsoil to establish threatened Hoover’s wooly-star (Eriastrum hooveri) on disturbed sites. Topsoil laden with Hoover’s wooly-star seeds was collected from within population areas and redistributed on disturbed sites in areas with and without the species. Within populations, reestablishment rates were similar between plot that received topsoil and control plots. In areas where the species was not present, Hoover’s wooly-star was successfully established in low densities.
5.5.6.3. Habitat Restoration for San Joaquin Valley Listed Species
Hinshaw et al. (2000) assessed sites on Naval Petroleum Reserve No. 1 (Elk Hills Oil Field) on which habitat reclamation had been conducted. Reclamation methods had included site preparation and seeding with annual plants and shrubs. They examined 996 sites five years and 10 years post-reclamation. After five years, 47.2% of the sites met the success criterion of vegetative cover equal to or exceeding 70% of the cover on reference or adjacent undisturbed sites. After 10 years, 77.4% of the sites met the criterion. However, they cited unpublished data from a study in which a subset of the sites had been compared to sites on which no reclamation was conducted but instead were allowed to revegetate naturally. Revegetation occurred at least as rapidly on non-reclaimed sites as on reclaimed sites. Furthermore, reclaimed sites commonly had shrub densities exceeding those on reference sites, and these dense shrubs provided optimal cover for predators of endangered San Joaquin kit foxes, possibly to the detriment of the kit fox. Reclamation costs averaged $11,827 per successfully revegetated hectare. The authors concluded that at least in the southern San Joaquin Valley, habitat restoration could be achieved by simply preventing additional disturbance of sites and allowing them to revegetate naturally, and any conservation funding might be better spent on acquiring additional undisturbed habitat versus reclaiming disturbed habitat.
5.6. Assessment of Data Quality and Data Gaps
• For all the potential impacts of well stimulation to wildlife and vegetation identified in, there are major data gaps in understanding the actual extent of the impacts. Of all the impacts, the most data were available to quantify habitat loss caused by hydraulic-fracturing-enabled-production; even here we were hampered by the lack of comprehensive historical data on the frequency and location of hydraulic fracturing. For all other impacts the data gaps were even larger. For introduction of invasive species, releases of harmful fluids to the environment, water use, litter, noise, light and traffic, there are insufficient data on how well stimulation alters the environment and if and how wildlife and vegetation in California are actually affected.

364
Chapter 5: Potential Impacts of Well Stimulation on Wildlife and Vegetation
• While we have data that allows us to make a reasonable estimate of habitat loss caused by hydraulic fracturing enabled production, we have very little information on other important pathways of impacts of well stimulation to wildlife and vegetation such as the kinds and quantities of hydraulic fracturing chemicals that enter the environment; the degree to which local streams could be impacted by water withdrawals for stimulation; the noise caused by well stimulation; litter, traffic, noise and light generated at well stimulation sites.
• While we know that an increasing density of wells causes loss and fragmentation of habitat, we have a very limited understanding of how this in turn affects the local organisms that inhabit the area. How does the increasing density of oil wells affect local population sizes, behavior, habitat selection, and migratory patterns of organisms? What are the mechanisms of any impacts to wildlife and vegetation – loss of habitat, water use, water contamination, noise, light, traffic, litter, or other causes?
• Most of the literature on ecological impacts of oil and gas production in California was conducted in order to comply with regulatory requirements and thus tends to focus on threatened and endangered species protected under the United States and California Endangered Species Acts. There has been relatively little work on species that are not listed as endangered or threatened, or on more general ecosystem properties such as biodiversity.
• To date, there has been little evaluation of the effectiveness of mitigation measures. Rigorous evaluation of the various, commonly prescribed mitigation measures would allow regulators to identify and require only those methods with proven value. The contribution of mitigation measures to overall conservation efforts is unknown. Even assuming that all mitigation measures are effective in achieving their intended purpose (e.g., avoiding take, preventing additional habitat disturbance, restoring habitat), there has been no assessment of whether such measures contribute significantly to the conservation of species.
• Habitat restoration of abandoned oil and gas well sites can be an important tool for conservation, but the very limited studies available in the San Joaquin Valley found that neither passive revegetation nor active restoration efforts restored sites to their pre-disturbance value for native species. More experimentation in this arena would tell us if restoration is possible, and if so, what approaches are effective.

365
Chapter 5: Potential Impacts of Well Stimulation on Wildlife and Vegetation
• Cumulative effects analyses, which look at the additive impacts of multiple projects over regional scales and time scales of years or longer, are inadequate. Environmental impact reviews are conducted for most oil and gas production activities and these reviews typically include a cumulative effects analysis, but most are conducted on a project-specific or site-specific basis with little consideration of the larger regional landscape. No comprehensive analysis has been conducted on cumulative environmental effects. Such analyses are critical, particularly in regions like the San Joaquin Valley where profound habitat loss from a variety of sources including oil and gas production may have already precluded the recovery of some listed species.
5.7. Findings
• While some portions of oil and gas fields are dedicated nearly exclusively to hydrocarbon production, in other areas oil and gas production is interspersed with human development, agriculture, and natural habitat.
• There are a number of places in the state where valuable natural habitat is interspersed or adjacent to well-stimulation-enabled production. In those areas where hydraulic fracturing-enabled production occurs in a landscape of natural habitat, the additional production causes habitat loss and fragmentation. The counties with the greatest amount of habitat loss and fragmentation attributable to well-stimulation enabled production were (with hectares of altered habitat in parenthesis): Kern (13,400), and Ventura (5,000).
• Compared to the total area of natural habitat in the state, the amount altered by hydraulic-fracturing-enabled-production is modest, less than one-tenth of a percent of the total area of natural habitat. However, the effects are highly localized and have disproportionate effects in a few areas and for a few habitat types. For valley saltbush scrub, 6% of its statewide extent was impacted by hydraulic-fracturing-enabled-production, and 2% for Venturan coastal sage scrub.
• The natural communities most disturbed by well-stimulation-enabled production were valley saltbush scrub and non-native grassland (mainly in Kern County), and Venturan coastal sage scrub and buck brush chaparral (largely in Ventura County).
• We found recorded instances of 24 listed species on or within 2 km of oil fields with at least 200 hectares altered by hydraulic-fracturing enabled production. Threatened and endangered species occurring in the vicinity of areas highly altered by hydraulic-fracturing-enabled-production are the San Joaquin Valley upland species such as the San Joaquin kit fox, Nelson’s antelope squirrel, blunt-nosed leopard lizard, and the giant kangaroo rat, and the California Condor in the Ventura Basin.

366
Chapter 5: Potential Impacts of Well Stimulation on Wildlife and Vegetation
• Little data are available to assess the potential impacts of well stimulation on wildlife and vegetation by pathways other than habitat conversion. Factors such as introduction of invasive species, pollution from fluid discharges, water use, noise and light pollution, and vehicle traffic are known to affect wildlife and vegetation, but the extent to which well stimulation affects wildlife and vegetation by those pathways is unknown.
5.8. Conclusions
• With respect to habitat loss and fragmentation, the impact of stimulated wells is not inherently different from that of unstimulated wells. The construction of wells and their support infrastructure disturbs habitat regardless of whether a well is stimulated. Other potential impacts to wildlife and vegetation, such as pollution, could differ between stimulated and unstimulated wells, but we have insufficient data to quantify the effects.
• During the period of 1977 – September 2014, hydraulic fracturing enabled a modest proportion (about 3.5%) of the production that impacts natural habitat in California because most of it occurred in areas that are already highly altered by human activities such as other forms of oil and gas production, agriculture, or urbanization. In turn, oil and gas production as a whole has a much smaller footprint in the state than cities and cultivated land.
• Hydraulic fracturing is becoming an increasingly important driver for enabling oil and gas production in the state. During the period of October 2012 – September 2014, 20% of the land area that was newly developed for oil and gas production could be attributed to hydraulic fracturing.
• Hydraulic-fracturing-enabled activity can be locally important in certain regions, chiefly the southwestern San Joaquin Valley, where frequently stimulated fields overlap with high-quality habitat for rare species, and in Ventura County, where regularly stimulated fields overlap with critical habitat for the California condor and steelhead salmon.

367
Chapter 5: Potential Impacts of Well Stimulation on Wildlife and Vegetation
5.9. References
Allen, J.C., Abel Jr., J.H. & Takemoto, D.J., 1975. Effect of osmotic stress on serum corticoid and plasma glucose levels in the duck (Anas platyrynchos). General and comparative endocrinology, 26(2), pp.209–216.
Aspen Environmental Group, 2015a. Biological Resources: Coastal and Marine Environment. Draft Environmental Impact Report: Analysis of Oil and Gas Well Stimulation Treatments in California, State Clearinghouse No. 2013112046. Available at: http://www.conservation.ca.gov/dog/SB4DEIR/Pages/SB4_DEIR_TOC.aspx.
Aspen Environmental Group, 2015b. Biological Resources: Terrestrial Environment. Draft Environmental Impact Report: Analysis of Oil and Gas Well Stimulation Treatments in California, State Clearinghouse No. 2013112046. Available at: http://www.conservation.ca.gov/dog/SB4DEIR/Pages/SB4_DEIR_TOC.aspx.
Bamberger, M. & Oswald, R.E., 2012. Impacts of gas drilling on human and animal health. New Solutions, 22(1), pp.51–77. Available at: files/89/0017__Bamberger et al_2012_NewSolutions_ImactsOfGasDrillingOnHumanAndAnimalHealth.pdf.
Belnap, J., 2003. Roads as Conduits for Exotic Plant Invasions in a Semiarid Landscape. Society for Conservation Biology, 17(2), pp.420–432.
Benko, K.L. & Drewes, J.E., 2008. Produced Water in the Western United States: Geographical Distribution, Occurrence, and Composition. Environmental Engineering Science, 25(2), pp.239–246. Available at: http://www.liebertonline.com/doi/abs/10.1089/ees.2007.0026.
Bergen, F. & Abs, M., 1997. Etho-ecological study of the singing activity of the blue tit (Parus caeruleus), great tit (Parus major) and chaffinch (Fringilla coelebs). Journal fur Ornithologie, 138(4), pp.451–468.
Biogeographic Data Branch DFW (Department of Fish and Wildlife), 2014. California Natural Diversity Database. Available at: http://www.dfg.ca.gov/biogeodata/cnddb/.
Biogeographic Data Branch DFW (Department of Fish and Wildlife), 2015a. Endangered and Threatened Animals List. Available at: http://www.dfg.ca.gov/biogeodata/cnddb/plants_and_animals.asp.
Biogeographic Data Branch DFW (Department of Fish and Wildlife), 2015b. Endangered, Threatened and Rare Plants List. Available at: http://www.dfg.ca.gov/biogeodata/cnddb/plants_and_animals.asp.
Blickley, J.L., Word, K.R., et al., 2012a. Experimental chronic noise is related to elevated fecal corticosteroid metabolites in lekking male greater Sage-Grouse (Centrocercus urophasianus). PloS one, 7(11), p.e50462. Available at: http://www.pubmedcentral.nih.gov/articlerender.fcgi?artid=3502302&tool=pmcentrez&rendertype=abstract [Accessed October 30, 2014].
Blickley, J.L., Blackwood, D. and Patricelli, G.L., 2012b. Experimental evidence for the effects of chronic anthropogenic noise on abundance of Greater Sage-Grouse at leks. Conservation biology : the journal of the Society for Conservation Biology, 26(3), pp.461–71. Available at: http://www.ncbi.nlm.nih.gov/pubmed/22594595 [Accessed November 10, 2014].
Borkovich 2015a and 2015b personal communication – add! XXX. Note that Chapter 2 now has an appendix with this data.
Buchanan, J.B., 1993. Evidence of benthic pelagic coupling at a station off the Northumberland coast. Journal of Experimental Marine Biology and Ecology, 172(1), pp.1–10.
California DOC (Department of Conservation), 2012. Farmland Monitoring and Mapping Program, 2010 and 2012, Available at: http://www.conservation.ca.gov/dlrp/fmmp.
California Department of Fish and Game, 1997. California Endangered Species Act Memorandum of Understanding and Take Authorization By and Between Occidental of Elk Hills, Inc. and The California Department of Fish and Game Regarding Naval Petroleum Reserve - 1 (Elk Hills).
Cardno ENTRIX, 2012. Hydraulic Fracturing Study, PXP Inglewood Oil Field, Los Angeles, CA. Available at: http://www.scribd.com/doc/109624423/Hydraulic-Fracturing-Study-Inglewood-Field10102012.

368
Chapter 5: Potential Impacts of Well Stimulation on Wildlife and Vegetation
Castle Peak Resources, 2011. Hopper Canyon Well #12-2, application for permit to drill, Bakersfield, California.
CDFW (California Department of Fish and Wildlife), 2014a. State and federally listed endangered and threatened animals of California. Available at: https://www.dfg.ca.gov/biogeodata/cnddb/pdfs/TEAnimals.pdf [Accessed March 22, 2015].
CDFW (California Department of Fish and Wildlife), 2014b. State and federally listed endangered and threatened plants of California. Available at: https://www.dfg.ca.gov/biogeodata/cnddb/pdfs/TEPlants.pdf [Accessed March 22, 2015].
Clark, C.E. & Veil, J.A., 2009. Produced Water Volumes and Management Practices in the United States, Washington, D. C.
Clark, H.O. et al., 2005. Competitive interactions between endangered kit foxes and nonnative red foxes. Western North American Naturalist, 65, pp.153–163.
Coffin, A.W., 2007. From roadkill to road ecology: A review of the ecological effects of roads. Journal of Transport Geography, 15(5), pp.396–406. Available at: http://linkinghub.elsevier.com/retrieve/pii/S0966692306001177 [Accessed January 26, 2014].
Council of Canadian Academies, 2014. Environmental Impacts of Shale Gas Extraction in Canada, Ottawa, Canada.
CVRWQCB (Central Valley Regional Water Quality Control Board), 2015. Oil Fields - Disposal Ponds. Available at: http://www.swrcb.ca.gov/centralvalley/water_issues/oil_fields/information/disposal_ponds/index.shtml [Accessed May 11, 2015].
Cypher, B.L. et al., 2001. Interspecific interactions among wild canids: implications for the conservation of endangered San Joaquin kit foxes. Endangered Species UPDATE, 18(4), pp.171–174.
Cypher, B.L. et al., 2012. Kangaroo Rat Population Response to Seismic Surveys for Hydrocarbon Reserves, California State University, Stanislaus Endangered Species Recovery Program. Available at: http://esrp.csustan.edu/publications/pdf/cypher_etal_2012_krats_seismic_surveys_esrp.pdf.
Cypher, B.L. et al., 2000. Population Dynamics of San Joaquin Kit Foxes at the Naval Petroleum Reserves in California. Wildlife Monographs, 145, pp.1–43.
Davies, R.J. et al., 2012. Hydraulic fractures: How far can they go? Marine and Petroleum Geology, 37(1), pp.1–6. Available at: http://linkinghub.elsevier.com/retrieve/pii/S0264817212000852 [Accessed January 27, 2014].
Didham, R. K., Tylianakis, J. M., Hutchison, M. A., Ewers, R. M., & Gemmell, N. J., 2005. “Are invasive species the drivers of ecological change?” Trends in Ecology & Evolution, 20.9. pp. 470-474.
DOGGR (Division of Oil, Gas and Geothermal Resources), 1998. California Oil & Gas Fields Volume 1 - Central California. Available at: http://www.conservation.ca.gov/dog/pubs_stats/Pages/technical_reports.aspx [Accessed March 11, 2015].
DOGGR (Division of Oil Gas and Geothermal Resources), 2014a. “All Wells” Shapefile: Geographic Dataset Representing All Oil, Gas, and Geothermal Wells in California Regulated by the Division of Oil, Gas and Geothermal Resources. Available at: http://www.conservation.ca.gov/dog/maps/Pages/GISMapping2.aspx.
DOGGR (Division of Oil Gas and Geothermal Resources), 2014b. Field Boundaries GIS Shapefile, Sacramento, CA. Available at: http://www.conservation.ca.gov/dog/maps/Pages/GISMapping2.aspx.
DOGGR (Division of Oil Gas and Geothermal Resources), 2014c. Monthly Production and Injection Databases. Available at: http://www.conservation.ca.gov/dog/prod_injection_db/Pages/Index.aspx [Accessed January 12, 2014].
DOGGR (Division of Oil Gas and Geothermal Resources), 2015. Interim Well Stimulation Treatment Notices Index. Available at: http://maps.conservation.ca.gov/doggr/iwst_index.html [Accessed March 11, 2015].
Eisenbeis, G., 2006. Ecological consequences of artificial night lighting.
Eisler, R., 1998. Copper hazards to fish, wildlife, and invertebrates: A synoptic review., DTIC Document.

369
Chapter 5: Potential Impacts of Well Stimulation on Wildlife and Vegetation
Fiehler, C.M. & Cypher, B.L., 2011. Ecosystem Analysis of Oilfields in Western Kern County, California: Prepared for the U.S. Bureau of Land Management, by the California State University, Stanislaus Endangered Species Recovery Program.
Francis, C.D. et al., 2012. Noise pollution alters ecological services: enhanced pollination and disrupted seed dispersal. Proceedings of the Royal Society B, 279(1739), pp.2727–35. Available at: http://www.pubmedcentral.nih.gov/articlerender.fcgi?artid=3367785&tool=pmcentrez&rendertype=abstract.
Garman, G. D., Pillai, M. C., & Cherr, G.N., 1994. Inhibition of cellular events during early algal gametophyte development: effects of select metals and an aqueous petroleum waste. Aquatic Toxicology, 28(1-2), pp.127–144.
Gelbard, J. & Belnap, J., 2003. Roads as conduits for exotic plant invasions in a semiarid landscape. Conservation biology, 17(2), pp.420–432.
Germano, D.J., Cypher, E.A. & McCormick, R., 1993. Use of a barrier to exclude blunt-nosed leopard lizards from a construction zone. Transactions of the Western Section of the Wildlife Society, (29), pp.16–19.
Gohlke, J.M. et al., 2011. A review of seafood safety after the Deepwater Horizon blowout. Environmental health perspectives, 119(8), p.1062.
Hansen, M.C. et al., 2014. Monitoring Conterminous United States (CONUS) Land Cover Change with Web-Enabled Landsat Data (WELD). Remote Sensing of Environment, (140), pp.466–484.
Hill, D., 1990. The impact of noise and artificial light on waterfowl behaviour: a review and synthesis of the available literature., Norfold, United Kingdom.
Hinshaw, J.M. et al., 1998. Effects of simulated oil field disturbance and topsoil salvage on Eriastrum hooveri (Polemoniaceae). Madroño, 45, pp.290–294.
Hinshaw, J.M., Cypher, B.L. & Holmstead, G.L., 2000. Efficacy of habitat reclamation for endangered species at Naval Petroleum Reserve No. 1. Transactions of the Western Section of the Wildlife Society, 35, pp.63–70.
Hobbs, R.J. & Huenneke, L.F., 1992. Disturbance, diversity and invasion : Implications for Conservation. Conservation Biology, 6(3), pp.324–337.
Holland, R., 1986. Preliminary descriptions of the terrestrial natural communities of California, Sacramento, CA: Unpublished document, California Department of Fish and Game, Natural Heritage Division.
Holcomb, Ronald. (2015). Letter to Pamela Creedon, Clay L. Rogers, and Doug Patteson. Subject: Oil Field Produced Water Pond Status Report #3. Accessed on May 12, 2015 at http://www.swrcb.ca.gov/centralvalley/water_issues/oil_fields/information/disposal_ponds/pond_status_rpt3_2015_0404.pdf.
Holmstead, G.L. & Anderson, D.C., 1998. Reestablishment of Eriastrum hooveri (Polemoniaceae) following oil field disturbance activities. Madroño, 45, pp.295–300.
Incardona, J.P. et al., 2014. Deepwater Horizon crude oil impacts the developing hearts of large predatory pelagic fish. Proceedings of the National Academy of Sciences, 111(15), pp.E1510–E1518.
Johnson, N. et al., 2010. Pennsylvania Energy Impacts Assessment Report 1: Marcellus Shale Natural Gas and Wind. Harrisburg, PA, US: The Nature Conservancy-Pennsylvania Chapter.
Jones, I.L. et al., 2014. Quantifying habitat impacts of natural gas infrastructure to facilitate biodiversity offsetting. Ecology and Evolution, 4(1), pp.79–90. Available at: http://www.pubmedcentral.nih.gov/articlerender.fcgi?artid=3894890&tool=pmcentrez&rendertype=abstract [Accessed January 30, 2014].
Jones, N.F. & Pejchar, L., 2013. Comparing the ecological impacts of wind and oil & gas development: a landscape scale assessment. PLOS one, 8(11), p.e81391. Available at: http://www.pubmedcentral.nih.gov/articlerender.fcgi?artid=3842249&tool=pmcentrez&rendertype=abstract [Accessed February 4, 2014].
Kaplan, I., Lu, S. T., Lee, R. P., & Warrick, G., 1996. Polycyclic hydrocarbon biomarkers confirm selective incorporation of petroleum in soil and kangaroo rat liver samples near an oil well blowout site in the western San Joaquin Valley, California. Environmental toxicology and chemistry, 15(5), 696-707.

370
Chapter 5: Potential Impacts of Well Stimulation on Wildlife and Vegetation
Kato, T.T. & O’Farrell, T.P., 1986. Biological Assessment of the Effects of Petroleum Production at Maximum Efficient Rate, Naval Petroleum Reserve #1 (Elk Hills), Kern County, California, on the Endangered Blunt-nosed Leopard Lizard, Gambelia silus,
Kelly, P.A., Phillips, S. & Williams, D.F., 2005. Documenting ecological change in time and space: the San Joaquin Valley of California. In Mammalian diversification: from chromosomes to phylogeography. University of California, Berkeley, pp. 57–78.
King, G.E., 2012. Hydraulic Fracturing 101: What Every Representative, Environmentalist, Regulator, Reporter, Investor, University Researcher, Neighbor and Engineer Should Know About Estimating Frac Risk and Improving Frac Performance in Unconventional Gas and Oil. In SPE 152596, SPE Hydraulic Fracturing Technology Conference. Woodlands, TX: Society of Petroleum Engineers, pp. 1–80. Available at: http://fracfocus.org/sites/default/files/publications/hydraulic_fracturing_101.pdf.
Koopman, M.E., Scrivner, J.H. & Kato, T.T., 1998. PATTERNS OF DEN USE BY SAN JOAQUIN. The Journal of Wildlife Management, 62(1), pp.373–379.
Kotler, B.P., 1984. Risk of predation and the structure of desert rodent communities. Ecology, 65(3), pp.689–701.
Larison, J.R. et al., 2000. Cadmium toxicity among wildlife in the Colorado Rocky Mountains. Nature, 406(6792), pp.181–183.
Longcore, T. & Rich, C., 2004. Ecological light pollution. Frontiers in Ecology and the Environment, 2(4), pp.191–198.
Love, M.S. et al., 2013. Whole-body concentrations of elements in three fish species from offshore oil platforms and natural areas in the Southern California Bight, USA. Bulletin of Marine Science, 89(3), pp.717–734.
Martins, R.D.P. et al., 2009. Synergistic neurotoxicity induced by methylmercury and quercetin in mice. Food and chemical toxicology : an international journal published for the British Industrial Biological Research Association, 47(3), pp.645–649. Available at: http://www.pubmedcentral.nih.gov/articlerender.fcgi?artid=2992966&tool=pmcentrez&rendertype=abstract.
Maryland Department of the Environment & Maryland Department of Natural Resources, 2014. MARCELLUS SHALE SAFE DRILLING INITIATIVE STUDY Part II - Interim Final Best Practices,
Mason, R.P., Reinfelder, J.R. & Morel, F.M.M., 1996. Uptake, toxicity, and trophic transfer of mercury in a coastal diatom. Environmental Science & Technology, 30(6), pp.1835–1845.
McKenney, Bruce. 2005. “Environmental Offset Policies, Principles, and Methods: A Review of Selected Legislative Frameworks.” Biodiversity Neutral Initiative: 85.
Mee, A., Rideout, B. a., et al., 2007a. Junk ingestion and nestling mortality in a reintroduced population of California Condors Gymnogyps californianus. Bird Conservation International, 17(02), p.119. Available at: http://www.journals.cambridge.org/abstract_S095927090700069X [Accessed November 14, 2014].
Mee, A., Snyder, N.F.R. & Hall, L.S., 2007b. California Condors in the 21st Century—Conservation Problems and Solutions. California Condors in the 21st Century, pp.243–279.
Montevecchi, W.A., Rich, C. & Longcore, T., 2006. Influences of artificial light on marine birds. Ecological consequences of artificial night lighting, pp.94–113.
Moyle, P. & Leidy, R., 1992. Loss of Biodiversity in Aquatic Ecosystems: Evidence from Fish Faunas. In P. Fiedler & S. Jain, eds. Conservation Biology SE - 6. Springer US, pp. 127–169. Available at: http://dx.doi.org/10.1007/978-1-4684-6426-9_6.
Northrup, J.M., 2013. Characterising the impacts of emerging energy development on wildlife, with an eye towards mitigation APPENDIX S2: QUANTIFYING ENERGY POTENTIAL BY ECOREGIONS. Ecology Letters.
O’Farrell, T.P. et al., 1986. Biological Assessment of the Effects of Petroleum Producation at Maximum Efficient Rate, Naval Petroleum Reserve #1 (Elk Hills). Kern County, California, on the Endangered San Joaquin Kit Fox, Vulpes macrotis mutica,

371
Chapter 5: Potential Impacts of Well Stimulation on Wildlife and Vegetation
O’Farrell, T.P. & Kato, T.T., 1987. Biological Assessment of the Effects of Petroleum Activities, Naval Petroleum Reserves in California, on the Endangered Giant Kangaroo Rat, Dipodomys ingens,
O’Farrell, T.P. & Kato, T.T., 1980. Relationship between abundance of Blunt-nosed leopard lizards, Crotaphytus silus, and intensity of petroleum field development in Kern County, California 1980,
Ogden, L.J.E., 1996. Collision Course : The hazards of lighted structures and windows to migrating birds,
Padre Associates, 2014. Vegetation Restoration Plan - former Naval Petroleum Reserve No. 1 Closure Project,
Pellacani, C. et al., 2012. Short Communication Synergistic Interactions Between PBDEs and PCBs in Human Neuroblastoma Cells *. Environmental toxicology, 29(4), pp.418–427. Available at: file:///C:/Users/Schmops/AppData/Local/Mendeley Ltd./Mendeley Desktop/Downloaded/Pellacani et al., - 2012 - Short Communication Synergistic Interactions Between PBDEs and PCBs in Human Neuroblastoma Cells.pdf.
Pezeshki, S.R. et al., 1989. Effects of waterlogging and salinity interaction on Nyssa aquatica seedlings. Forest Ecology and Management, 27(1), pp.41–51.
Piper, D.Z., Isaacs, C.M. & Havach, G.A., 1995. Geochemistry of minor elements in the Monterey Formation, California.
Potts, S.G. et al., 2010. Global pollinator declines: trends, impacts and drivers. Trends in ecology & evolution, 25(6), pp.345–353.
Presser, T.S. et al., 2004. The Phosphoria Formation: A model for forecasting global selenium sources to the environment. Handbook of Exploration and Environmental Geochemistry, 8, pp.299–319.
Presser, T.S. & Ohlendorf, H.M., 1987. Biogeochemical cycling of selenium in the San Joaquin Valley, California, USA. Environmental Management, 11(6), pp.805–821.Presser, T.S. & Barnes, I., 1985. Dissolved constituents including selenium in waters in the vicinity of Kesterson National Wildlife Refuge and the West Grassland, Fresno and Merced Counties, California, U.S. Geological Survey Menlo Park, California, USA.
Race, M. S, and M. S Fonseca. 1996. “Fixing compensatory mitigation: what will it take?” Ecological Applications 6 (1): 94–101.
Ralls, K. & White, P.J., 1995. Predation on San Joaquin kit foxes by larger canids. Journal of Mammalogy, 76(3), pp.723–729.
Ramirez, P., 2010. Bird mortality in oil field wastewater disposal facilities. Environmental Management, 46(5), pp.820–6. Available at: http://www.ncbi.nlm.nih.gov/pubmed/20844874 [Accessed January 31, 2014].
Rattner, B.A. et al., 2006. Toxicity and hazard of vanadium to mallard ducks (Anas platyrhynchos) and Canada geese (Branta canadensis). Journal of Toxicology and Environmental Health, Part A, 69(4), pp.331–351.
R Core Team, 2013. R: A Language and Environment for Statistical Computing, Vienna, Austria: R Foundation for Statistical Computing. Available at: http://www.r-project.org/.
Rejmánek, M. & Richardson, D.M., 1996. What attributes make some plant species more invasive ? Ecology, 77(6), pp.1655–1661.
Rideout, B.A. et al., 2012. Patterns of mortality in free ranging California Condors (Gymnogyps californianus). Journal of Wildlife Diseases, 48(1), pp.95–112.
Roig-Silva, C.M. et al., 2013. Landscape Consequences of Natural Gas Extraction in Beaver and Butler Counties, Pennsylvania, 2004-2010, United States Geological Survey.
Ruso, Y. et al., 2007. Spatial and temporal changes in infaunal communities inhabiting soft-bottoms affected by brine discharge. Marine Environmental Research, 64(4), pp.492–503.
Rydell, J., 1992. Exploration of insects around streetlamps by bats in Sweden. Functional Ecology, 6(6), pp.744–750.
Salmon, M., 2003. Artificial night lighting and sea turtles. Biologist, 50(4), pp.163–168.
Schwartz, A. & Henderson, R.W., 1991. Amphibians and reptiles of the West Indies: descriptions, distributions, and natural history.
372
Chapter 5: Potential Impacts of Well Stimulation on Wildlife and Vegetation
Shahid, M. et al., 2014. Heavy-metal-induced reactive oxygen species: phytotoxicity and physicochemical changes in plants. In Reviews of Environmental Contamination and Toxicology Volume 232. Springer, pp. 1–44.
Shen, G., Lu, Y. & Hong, J., 2006. Combined effect of heavy metals and polycyclic aromatic hydrocarbons on urease activity in soil. Ecotoxicology and environmental safety, 63(3), pp.474–480. Available at: http://www.ncbi.nlm.nih.gov/pubmed/16406598.
SHIP (Shale Gas Information Platform), 2014. The Basics – Operations. Available at: http://www.shale-gas-information-platform.org/categories/operations/the-basics.html [Accessed July 1, 2015].
Slonecker, E.T. et al., 2013. Landscape Consequences of Natural Gas Extraction in Allegheny and Susquehanna Counties, Pennsylvania, 2004–2010, Reston, Virginia. Available at: http://pubs.usgs.gov/of/2013/1025.
Spiegel, L.K., 1996. Studies of San Joaquin Kit Fox in Undeveloped and Oil-Developed Areas: An Overview. In fornia Energy Commission, Staff Report P700-96-003. pp. 1–14.
Spiegel, L.K. & Disney, M., 1996. Mortality sources and survival rates of San Joaquin kit fox in oil-developed and undeveloped lands of southwestern Kern County, California,
Spiegel, L.K. & Small, M., 1996. Estimation of relative abundance of San Joaquin kit foxes between an undeveloped site and an oil-developed site in Kern County, California,
Spiegel, L.K. & Tom, J., 1996. Reproduction of San Joaquin kit fox in undeveloped and oil-developed habitats of Kern County, California,
Stelzer, A. & Chan, H.M., 1999. The relative estrogenic activity of technical toxaphene mixture and two individual congeners. Toxicology, 138(2), pp.69–80. Available at: http://linkinghub.elsevier.com/retrieve/pii/S0300483X99000931.
Stone, E.L., Jones, G. & Harris, S., 2009. Street lighting disturbs commuting bats. Current biology, 19(13), pp.1123–1127. Available at: http://www.ncbi.nlm.nih.gov/pubmed/19540116 [Accessed July 25, 2014].
Suter, G.W. et al., 1992. Results of analyses of fur samples from the San Joaquin kit fox and associated soil and water samples from the Naval Petroleum Reserve No. 1, Tupman, California, Oak Ridge National Lab., TN (United States); EG and G Energy Measurements, Inc., Tupman, CA (United States).
Thomson, J. et al., 2005. Wildlife at a Crossroads: Energy Development in Western Wyoming, Washington, D.C. Available at: http://wilderness.org/sites/default/files/wildlife-at-crossroads-report.pdf [Accessed November 21, 2014].
Timoney, K.P. & Ronconi, R.A., 2010. Annual bird mortality in the bitumen tailings ponds in Northeastern Alberta, Canada. The Wilson Journal of Ornithology, 122(3), pp.569–576.
Titulaer, M. et al., 2012. Activity patterns during food provisioning are affected by artificial light in free living great tits (Parus major). PloS one, 7(5), p.e37377. Available at: http://www.pubmedcentral.nih.gov/articlerender.fcgi?artid=3356403&tool=pmcentrez&rendertype=abstract [Accessed December 20, 2014].
Tomlin, C.D., 1994. Map algebra: one perspective. Landscape and Urban Planning, 30(1), pp.3–12.
Tyser, R.W. & Worley, C.A., 1992. Alien flora in grasslands adjacent to road and trail corridors in Glacier National Park, Montana (U.S.A.). Conservation Biology, 6(2), pp.253–262.
UCSB (University of California, Santa Barbara) Biogeography Lab, 1998. California Gap Analysis Vegetation Layer (Statewide) 1:100,000-1:250,000, Santa Barbara, CA. Available at: http://legacy.biogeog.ucsb.edu/projects/gap/gap_home.html.
U.S. BLM (Bureau of Land Management), 2010. Carrizo Plain National Monument Approved Resource Management Plan and Record of Decision - Attachment 4: Minerals Standard Operating Procedures/Best Management Practices/Implementation Guidelines and Conditions of Approval.
U.S. DOE (Department of Energy), 1991. Biological Assessment of the Effects of Petroleum Production at Maximum Efficient Rate, Naval Petroleum Reserve No. 1 (Elk Hills), Kern County, California, on Threatened and Endangered Species.

373
Chapter 5: Potential Impacts of Well Stimulation on Wildlife and Vegetation
U.S. DOE (Department of Energy), 2001. Biological Assessment of the Effects of Continued Petroleum Production on Threatened and Endangered Species on Naval Petroleum Reserve No. 2, Kern County, California.
USDOI (U.S. Department of the Interior and Bureau of Land Management), 2012. Bakersfield Proposed Resource Management Plan and Final Environmental Impact Statement, Volume I.
USFWS (United States Fish and Wildlife Service), 2001. Revised Formal Consultation on the Oil and Gas Programmatic Biological Opinion in Kings and Kern Counties, California.
USFWS (United States Fish and Wildlife Service), 2005. Biological Opinion on the Proposal to Lease Oil and Gas Resources within the Boundaries of the Los Padres National Forest, California, Ventura (1-8-04-F-32), Available at: http://www.lpfw.org/archive/docs/Oil/FEISdocs/FEIS_F_FWSconsultation.pdf.
USFWS (United States Fish and Wildlife Service), 2009. Biological opinion for the proposed leasing of two drilling sites on well pads in the Sespe Oil Field, Ventura County, California.
USFWS (United States Fish and Wildlife Service), 2013. California Condor (Gymnogyps californianus) 5-year review: summary and evaluation.
USFWS (United States Fish and Wildlife Service), 2014a. Sacramento Fish and Wildlife Office - Species Lists.
USFWS (United States Fish and Wildlife Service), 2014b. Critical Habitat for Threatened and Endangered Species, Environmental Conservation Online System, Available at: https://ecos.fws.gov/crithab/ Acc.
Walters, J.R. et al., 2010. Status of the California Condor (Gymnogyps californianus) and Efforts to Achieve Its Recovery. The Auk, 127(4), pp.969–1001. Available at: http://www.bioone.org/doi/abs/10.1525/auk.2010.127.4.969 [Accessed December 20, 2014].
Warrick, G.D., T.K. Kato, and B.R. Rose, 1998. Microhabitat use and home range characteristics of blunt-nosed leopard lizards. Journal of Herpetology, 32(2): 183-191.
Weller, C. et al., 2002. Fragmenting Our Lands: The Ecological Footprint from Oil and Gas Development, Seattle, Washington: The Wilderness Society. Available at: http://wilderness.org/sites/default/files/fragmenting-our-lands_0.pdf.
Wilcove, D.S. et al., 1998. Quantifying Threats to Imperiled Species in the United States. BioScience, 48(8), pp.607–615 CR – Copyright © 1998 Oxford Univers. Available at: http://www.jstor.org/stable/1313420.
Williams, D.F. et al., 1998. Recovery Plan for Upland Species of the San Joaquin Valley, California, Portland, Oregon. Available at: http://esrp.csustan.edu/publications/recoveryplan.php.
Witherington, B.E., 1997. The problem of photopollution for sea turtles and other nocturnal animals. In Behavioral approaches to conservation in the wild. pp. 303–328.
Zoellick, B.W. et al., 1987. Reproduction of the San Joaquin kit fox on Naval Petroleum Reserve No. 1, Elk Hills, California: 1980-1985, EG and G Energy Measurements, Inc., Goleta, CA (USA). Santa Barbara Operations.