Embed Size (px)
Citation preview
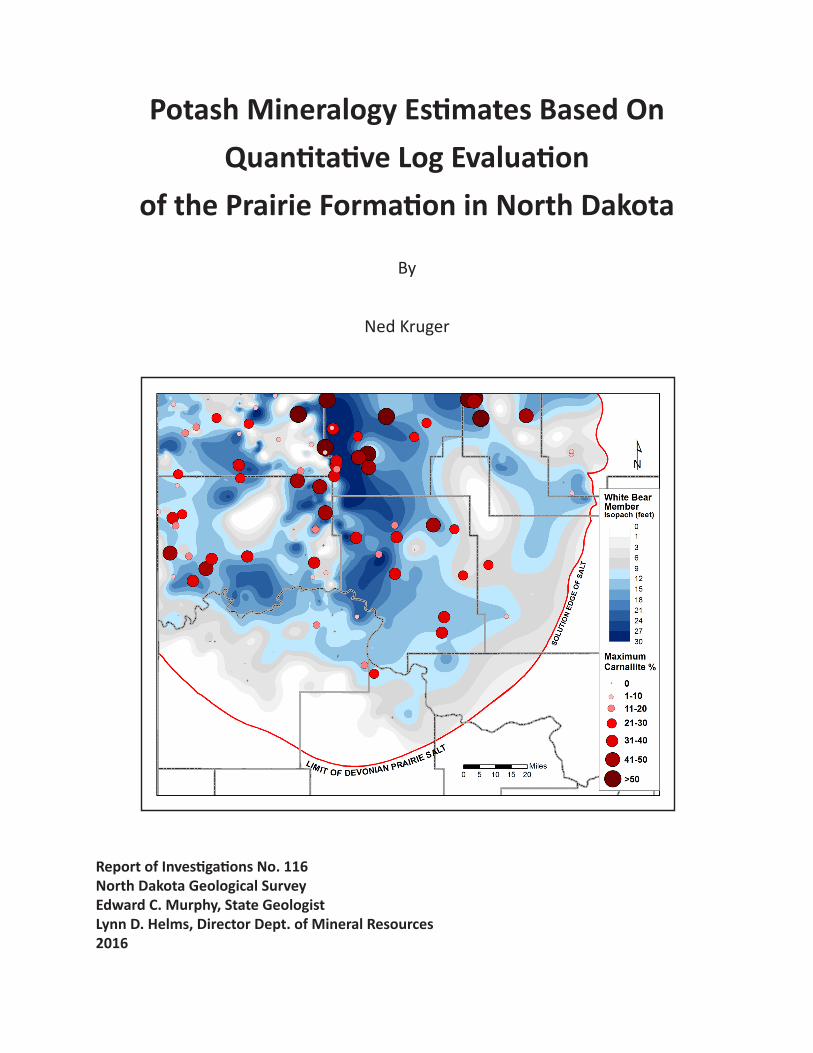
Potash Mineralogy Estimates Based OnQuantitative Log Evaluation
of the Prairie Formation in North Dakota
By
Ned Kruger
Report of Investigations No. 116North Dakota Geological SurveyEdward C. Murphy, State GeologistLynn D. Helms, Director Dept. of Mineral Resources2016
Table of Contents
Abstract . . . . . . . . . . . . . . . . . . . . . . . . . . . . . . . . . . . . . . . . . . . . . . . . . . . . . . . . . . . . . . . . . . . . . . . . . . . . 1
Introduction . . . . . . . . . . . . . . . . . . . . . . . . . . . . . . . . . . . . . . . . . . . . . . . . . . . . . . . . . . . . . . . . . . . . . . . . . . . 1
Well Log Characteristics . . . . . . . . . . . . . . . . . . . . . . . . . . . . . . . . . . . . . . . . . . . . . . . . . . . . . . . . . . . . . . . . . 2 Gamma Ray Log. . . . . . . . . . . . . . . . . . . . . . . . . . . . . . . . . . . . . . . . . . . . . . . . . . . . . . . . . . . . . . . . . . . . 2 Other Logs . . . . . . . . . . . . . . . . . . . . . . . . . . . . . . . . . . . . . . . . . . . . . . . . . . . . . . . . . . . . . . . . . . . . . . . . 3
Quantitative Log Evaluation . . . . . . . . . . . . . . . . . . . . . . . . . . . . . . . . . . . . . . . . . . . . . . . . . . . . . . . . . . . . . . 4
Previous Study. . . . . . . . . . . . . . . . . . . . . . . . . . . . . . . . . . . . . . . . . . . . . . . . . . . . . . . . . . . . . . . . . . . . . . . . . 5
Investigation Methods . . . . . . . . . . . . . . . . . . . . . . . . . . . . . . . . . . . . . . . . . . . . . . . . . . . . . . . . . . . . . . . . . . 5 Map Production. . . . . . . . . . . . . . . . . . . . . . . . . . . . . . . . . . . . . . . . . . . . . . . . . . . . . . . . . . . . . . . . . . . . 7
Discussion . . . . . . . . . . . . . . . . . . . . . . . . . . . . . . . . . . . . . . . . . . . . . . . . . . . . . . . . . . . . . . . . . . . . . . . . . . . 21
References . . . . . . . . . . . . . . . . . . . . . . . . . . . . . . . . . . . . . . . . . . . . . . . . . . . . . . . . . . . . . . . . . . . . . . . . . . . 22
i
List of Tables1. Published end-member log response values for common evaporite minerals . . . . . . . . . . . . . . . . 22. End-member log response coefficients utilized to produce the mineral estimate figures . . . . . . . . . . . . . . . . . . . . . . . . . . . . . . . . . . . . . . . . . . . . . . . . . . . . . . . . . . . . . . . . . . . 6
List of Figures1. Potassium Oxide (K2O) comparison . . . . . . . . . . . . . . . . . . . . . . . . . . . . . . . . . . . . . . . . . . . . . . . . . . . 32a. Sylvite comparison . . . . . . . . . . . . . . . . . . . . . . . . . . . . . . . . . . . . . . . . . . . . . . . . . . . . . . . . . . . . . . . . . 62b. Carnallite comparison . . . . . . . . . . . . . . . . . . . . . . . . . . . . . . . . . . . . . . . . . . . . . . . . . . . . . . . . . . . . . . 63. County map of North Dakota identifying the area of study . . . . . . . . . . . . . . . . . . . . . . . . . . . . . . . . 74a. Esterhazy Member: maximum sylvite concentrations . . . . . . . . . . . . . . . . . . . . . . . . . . . . . . . . . . . . 84b. Esterhazy-sylvite histogram . . . . . . . . . . . . . . . . . . . . . . . . . . . . . . . . . . . . . . . . . . . . . . . . . . . . . . . . . 85a. Esterhazy Member: maximum carnallite concentrations . . . . . . . . . . . . . . . . . . . . . . . . . . . . . . . . . 95b. Esterhazy-carnallite histogram . . . . . . . . . . . . . . . . . . . . . . . . . . . . . . . . . . . . . . . . . . . . . . . . . . . . . . . 96a. White Bear Member maximum sylvite concentrations. . . . . . . . . . . . . . . . . . . . . . . . . . . . . . . . . . . 106b. White Bear sylvite histogram . . . . . . . . . . . . . . . . . . . . . . . . . . . . . . . . . . . . . . . . . . . . . . . . . . . . . . . 107a. White Bear Member maximum carnallite concentrations . . . . . . . . . . . . . . . . . . . . . . . . . . . . . . . . 117b. White Bear carnallite histogram . . . . . . . . . . . . . . . . . . . . . . . . . . . . . . . . . . . . . . . . . . . . . . . . . . . . . 118a. Belle Plaine Member maximum sylvite concentrations . . . . . . . . . . . . . . . . . . . . . . . . . . . . . . . . . . 128b. Belle Plaine sylvite histogram . . . . . . . . . . . . . . . . . . . . . . . . . . . . . . . . . . . . . . . . . . . . . . . . . . . . . . . 129a. Belle Plaine Member maximum carnallite concentrations . . . . . . . . . . . . . . . . . . . . . . . . . . . . . . . 139b. Belle Plaine carnallite histogram . . . . . . . . . . . . . . . . . . . . . . . . . . . . . . . . . . . . . . . . . . . . . . . . . . . . . 1310a. Patience Lake Member maximum sylvite concentrations . . . . . . . . . . . . . . . . . . . . . . . . . . . . . . . . . 14 10b. Patience Lake histogram . . . . . . . . . . . . . . . . . . . . . . . . . . . . . . . . . . . . . . . . . . . . . . . . . . . . . . . . . . . 1411a. Patience Lake Member maximum carnallite concentrations . . . . . . . . . . . . . . . . . . . . . . . . . . . . . . 1511b. Patience Lake carnallite histogram . . . . . . . . . . . . . . . . . . . . . . . . . . . . . . . . . . . . . . . . . . . . . . . . . . . 1512a. Mountrail Member maximum sylvite concentrations . . . . . . . . . . . . . . . . . . . . . . . . . . . . . . . . . . . . 1612b. Mountrail sylvite histogram . . . . . . . . . . . . . . . . . . . . . . . . . . . . . . . . . . . . . . . . . . . . . . . . . . . . . . . . . 1613a. Mountrail Member maximum carnallite concentrations . . . . . . . . . . . . . . . . . . . . . . . . . . . . . . . . . 1713b. Mountrail carnallite histogram . . . . . . . . . . . . . . . . . . . . . . . . . . . . . . . . . . . . . . . . . . . . . . . . . . . . . . 1714a. White Lake Member maximum sylvite concentrations . . . . . . . . . . . . . . . . . . . . . . . . . . . . . . . . . . . 1814b. White Lake sylvite histogram. . . . . . . . . . . . . . . . . . . . . . . . . . . . . . . . . . . . . . . . . . . . . . . . . . . . . . . . 1815a. White Lake Member maximum carnallite concentrations . . . . . . . . . . . . . . . . . . . . . . . . . . . . . . . . 1915b. White Lake carnallite histogram . . . . . . . . . . . . . . . . . . . . . . . . . . . . . . . . . . . . . . . . . . . . . . . . . . . . . 1916. Histogram compilation . . . . . . . . . . . . . . . . . . . . . . . . . . . . . . . . . . . . . . . . . . . . . . . . . . . . . . . . . . . . 20
ii
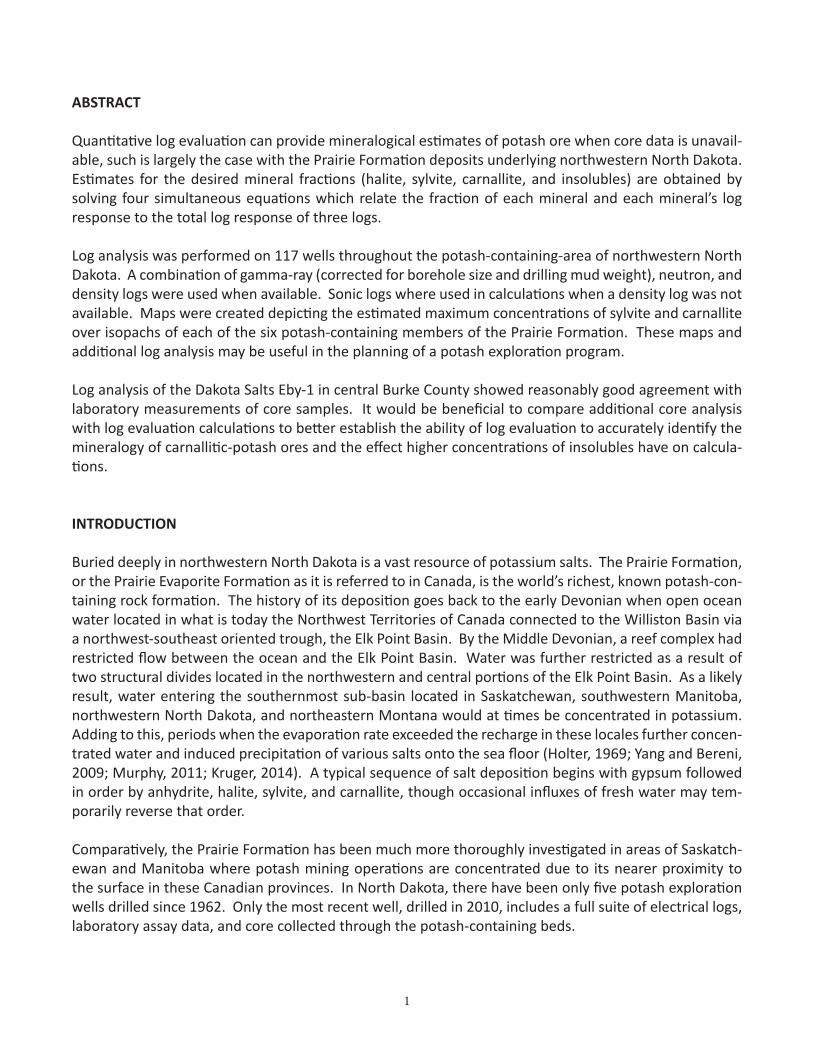
ABSTRACT
Quantitative log evaluation can provide mineralogical estimates of potash ore when core data is unavail-able, such is largely the case with the Prairie Formation deposits underlying northwestern North Dakota. Estimates for the desired mineral fractions (halite, sylvite, carnallite, and insolubles) are obtained by solving four simultaneous equations which relate the fraction of each mineral and each mineral’s log response to the total log response of three logs.
Log analysis was performed on 117 wells throughout the potash-containing-area of northwestern North Dakota. A combination of gamma-ray (corrected for borehole size and drilling mud weight), neutron, and density logs were used when available. Sonic logs where used in calculations when a density log was not available. Maps were created depicting the estimated maximum concentrations of sylvite and carnallite over isopachs of each of the six potash-containing members of the Prairie Formation. These maps and additional log analysis may be useful in the planning of a potash exploration program.
Log analysis of the Dakota Salts Eby-1 in central Burke County showed reasonably good agreement with laboratory measurements of core samples. It would be beneficial to compare additional core analysis with log evaluation calculations to better establish the ability of log evaluation to accurately identify the mineralogy of carnallitic-potash ores and the effect higher concentrations of insolubles have on calcula-tions.
INTRODUCTION
Buried deeply in northwestern North Dakota is a vast resource of potassium salts. The Prairie Formation, or the Prairie Evaporite Formation as it is referred to in Canada, is the world’s richest, known potash-con-taining rock formation. The history of its deposition goes back to the early Devonian when open ocean water located in what is today the Northwest Territories of Canada connected to the Williston Basin via a northwest-southeast oriented trough, the Elk Point Basin. By the Middle Devonian, a reef complex had restricted flow between the ocean and the Elk Point Basin. Water was further restricted as a result of two structural divides located in the northwestern and central portions of the Elk Point Basin. As a likely result, water entering the southernmost sub-basin located in Saskatchewan, southwestern Manitoba, northwestern North Dakota, and northeastern Montana would at times be concentrated in potassium. Adding to this, periods when the evaporation rate exceeded the recharge in these locales further concen-trated water and induced precipitation of various salts onto the sea floor (Holter, 1969; Yang and Bereni, 2009; Murphy, 2011; Kruger, 2014). A typical sequence of salt deposition begins with gypsum followed in order by anhydrite, halite, sylvite, and carnallite, though occasional influxes of fresh water may tem-porarily reverse that order. Comparatively, the Prairie Formation has been much more thoroughly investigated in areas of Saskatch-ewan and Manitoba where potash mining operations are concentrated due to its nearer proximity to the surface in these Canadian provinces. In North Dakota, there have been only five potash exploration wells drilled since 1962. Only the most recent well, drilled in 2010, includes a full suite of electrical logs, laboratory assay data, and core collected through the potash-containing beds.
1
Potash ore in Saskatchewan is composed of a mixture of halite, sylvite, carnallite, and insoluble mate-rial which includes clay minerals, dolomite, and anhydrite (Holter, 1969, Yang et al, 2009, Yang and Chi, 2013). Carnallite concentrations are typically low in the regions of active potash mining, but increase towards the southeast, particularly in the White Bear Member as it thickens toward the border with North Dakota (Worsley and Fuzesy, 1979). Potash deposits in North Dakota are assumed to be chemically similar to those in Canada, an assumption supported by core analysis reports from the Dakota Salts Eby-1 and Kalium Chemical Ltd Ewing #3-3 potash exploration wells (Kruger, 2014) located in north-central and eastern Burke County, respectively.
The limited amount of core with chemical analyses available from potash-containing beds of the Prairie Formation prohibits the ability to produce widespread mineralogical characterization reports or resourc-es estimates for potash in North Dakota. However, suites of electrical well-log data from oil and gas exploration wells which penetrate the Prairie Formation, for which there is widespread availability in the Williston Basin, can be utilized to produce estimates for concentrations of sylvite and carnallite and may be useful in the planning of a potash exploration program.
WELL LOG CHARACTERISTS
Based upon the physical properties they measure, electrical well logs can be utilized to estimate the min-eralogical composition of the rock matrices they pass through. These include gamma-ray logs and the group of logs referred to as “porosity logs” – which included the neutron, density, and sonic logs.
Gamma-ray log
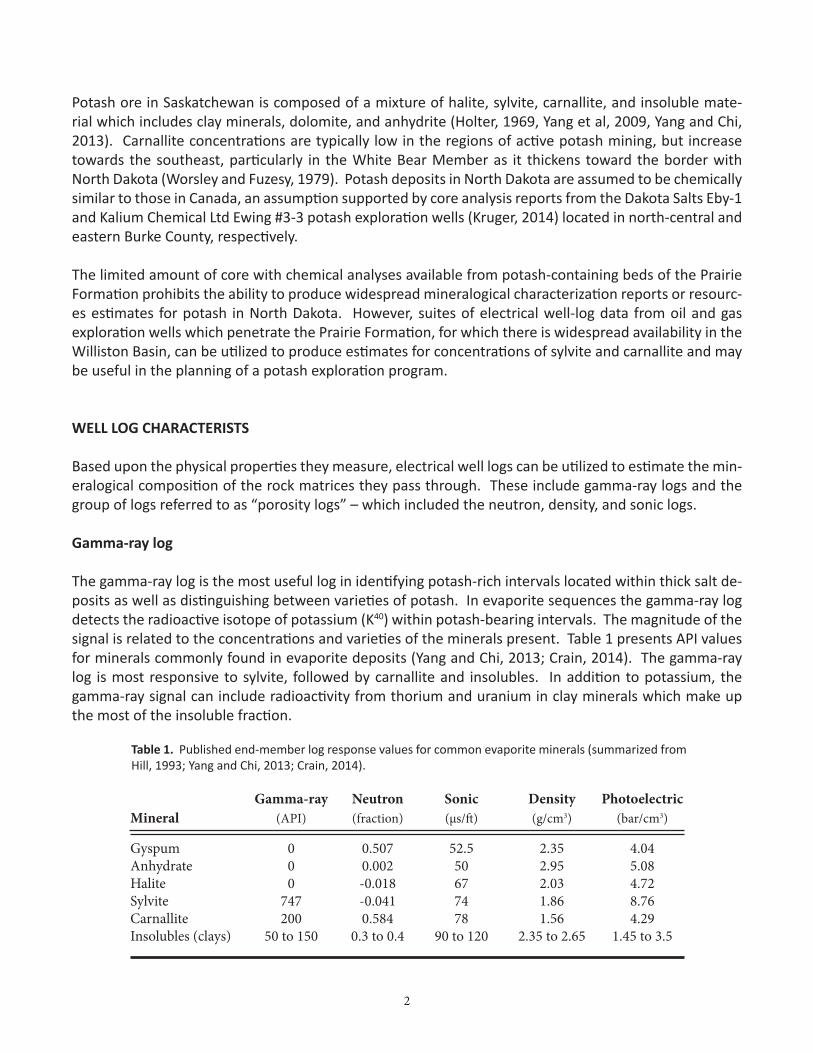
The gamma-ray log is the most useful log in identifying potash-rich intervals located within thick salt de-posits as well as distinguishing between varieties of potash. In evaporite sequences the gamma-ray log detects the radioactive isotope of potassium (K40) within potash-bearing intervals. The magnitude of the signal is related to the concentrations and varieties of the minerals present. Table 1 presents API values for minerals commonly found in evaporite deposits (Yang and Chi, 2013; Crain, 2014). The gamma-ray log is most responsive to sylvite, followed by carnallite and insolubles. In addition to potassium, the gamma-ray signal can include radioactivity from thorium and uranium in clay minerals which make up the most of the insoluble fraction.
Gamma-ray Neutron Sonic Density Photoelectric Mineral (API) (fraction) (μs/ft) (g/cm3) (bar/cm3)
Gyspum 0 0.507 52.5 2.35 4.04Anhydrate 0 0.002 50 2.95 5.08Halite 0 -0.018 67 2.03 4.72Sylvite 747 -0.041 74 1.86 8.76Carnallite 200 0.584 78 1.56 4.29Insolubles (clays) 50 to 150 0.3 to 0.4 90 to 120 2.35 to 2.65 1.45 to 3.5
Table 1. Published end-member log response values for common evaporite minerals (summarized from Hill, 1993; Yang and Chi, 2013; Crain, 2014).
2
When working with gamma-ray logs, the effects of borehole size and drilling mud weight must also be considered. Equations to correct for these effects were published by Crain and Anderson (1966) and are presented below as found in Crain (2014):
GRh = GR x [1.0 + 0.05 x (HS – 6.0)] = [320 x (HS – 6.0)] / (GR + 100.0) (1)
GRc = GRh x [1.0 + 0.10 x (WM – 7.2)] (2)
where:
GR = gamma-ray log reading (API)GRc = GR corrected for hole size and mud weight (API)GRh - GR corrected for hole size (API)HS - hole sizeWM - mud weight (lb/gal)
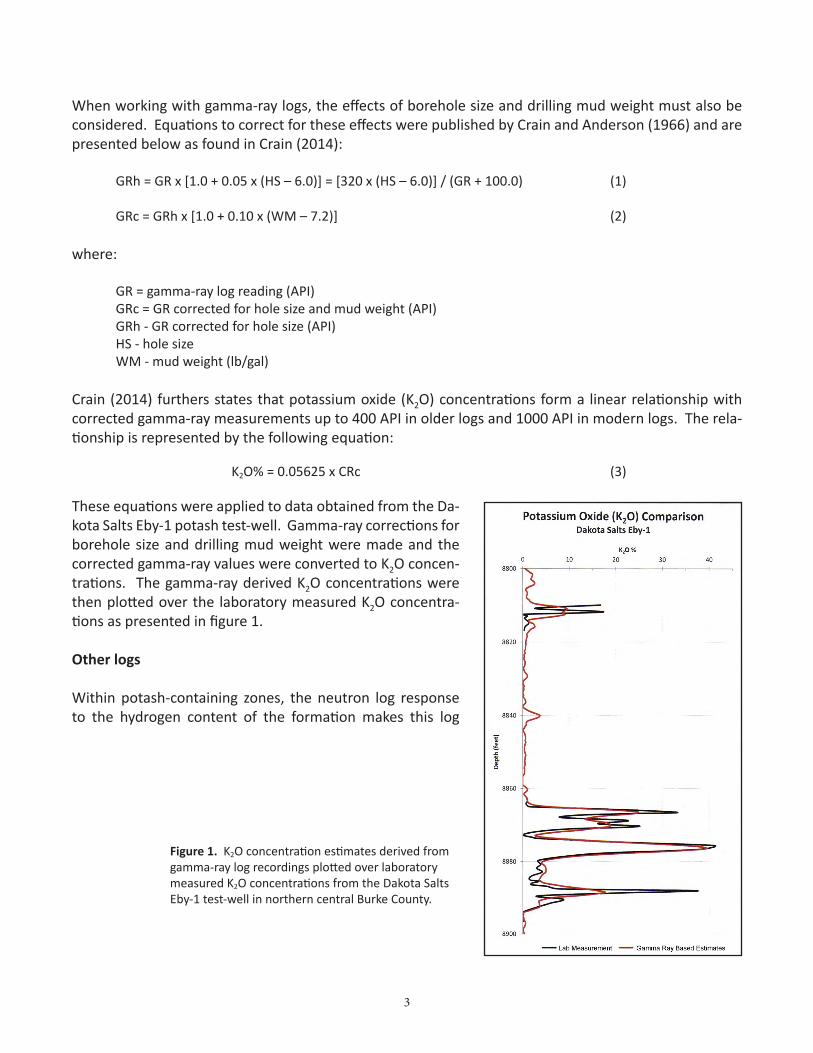
Crain (2014) furthers states that potassium oxide (K2O) concentrations form a linear relationship with corrected gamma-ray measurements up to 400 API in older logs and 1000 API in modern logs. The rela-tionship is represented by the following equation:
K2O% = 0.05625 x CRc (3)
These equations were applied to data obtained from the Da-kota Salts Eby-1 potash test-well. Gamma-ray corrections for borehole size and drilling mud weight were made and the corrected gamma-ray values were converted to K2O concen-trations. The gamma-ray derived K2O concentrations were then plotted over the laboratory measured K2O concentra-tions as presented in figure 1.
Other logs
Within potash-containing zones, the neutron log response to the hydrogen content of the formation makes this log
Figure 1. K2O concentration estimates derived from gamma-ray log recordings plotted over laboratory measured K2O concentrations from the Dakota Salts Eby-1 test-well in northern central Burke County.
3
well-suited to identify areas with concentrations of carnallite. Due to the water of hydration associated with carnallite (KClMgCl2∙6H20), its neutron log response (see Table 1) is high relative to that of sylvite or halite. Water is also present within the crystalline structure of clay minerals, however the neutron log response is about half that of carnallite. Neutron log response to clay minerals should be accounted for when the portion of insoluble material in a measured zone exceeds 5% (Crain and Anderson, 1966).
The density log can also be used to identify minerals in evaporite deposits and is particularly useful for distinguishing carnallite from clay minerals when a corresponding neutron log measures elevated hydro-gen concentrations. The presence of carnallite will deflect the density curve left of the dominate halite signal, while clay minerals will deflect the curve toward the right. It should be noted that density log errors can occur in high-grade potash ores resulting in potash mineral end-member apparent densities much lower than published values (Hill, 1993). It is important to recognize this occurrence when select-ing data for log analysis. Sonic logs measure the time required for a sound wave to penetrate 1 foot (or alternatively 1 meter) of rock formation. As is evident in Table 1, there is a distinctive gap between the sonic log response of car-nallite and that for insoluble material, however sonic logs are susceptible to cycle skipping errors. This occurs when a signal pulse is recorded in the nearest of the dual receivers, but is too weak to be recorded in the far receiver. When a subsequent signal pulse is triggered by the far receiver, it over-measures the pulse cycle causing overly large or erratic data recordings. Certain conditions promote cycle skipping, including borehole washouts such as those which can occur in carnallitic zones due to the high solubility of carnallite. In areas where this is an issue a sonic tool with long spacing can provide more accurate measurements (Schlumberger, 1989).
QUANTITATIVE LOG EVALUTION
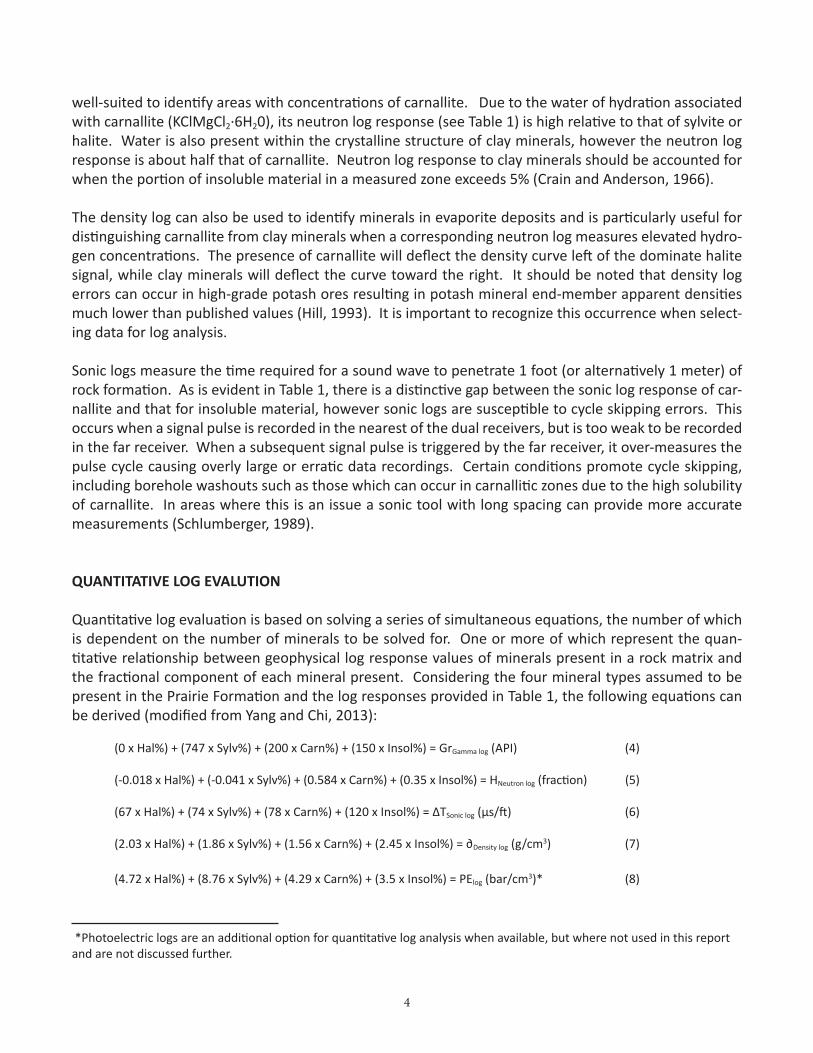
Quantitative log evaluation is based on solving a series of simultaneous equations, the number of which is dependent on the number of minerals to be solved for. One or more of which represent the quan-titative relationship between geophysical log response values of minerals present in a rock matrix and the fractional component of each mineral present. Considering the four mineral types assumed to be present in the Prairie Formation and the log responses provided in Table 1, the following equations can be derived (modified from Yang and Chi, 2013):
(0 x Hal%) + (747 x Sylv%) + (200 x Carn%) + (150 x Insol%) = GrGamma log (API) (4)
(-0.018 x Hal%) + (-0.041 x Sylv%) + (0.584 x Carn%) + (0.35 x Insol%) = HNeutron log (fraction) (5)
(67 x Hal%) + (74 x Sylv%) + (78 x Carn%) + (120 x Insol%) = ∆TSonic log (μs/ft) (6)
(2.03 x Hal%) + (1.86 x Sylv%) + (1.56 x Carn%) + (2.45 x Insol%) = ∂Density log (g/cm3) (7)
(4.72 x Hal%) + (8.76 x Sylv%) + (4.29 x Carn%) + (3.5 x Insol%) = PElog (bar/cm3)* (8)
*Photoelectric logs are an additional option for quantitative log analysis when available, but where not used in this report and are not discussed further.
4
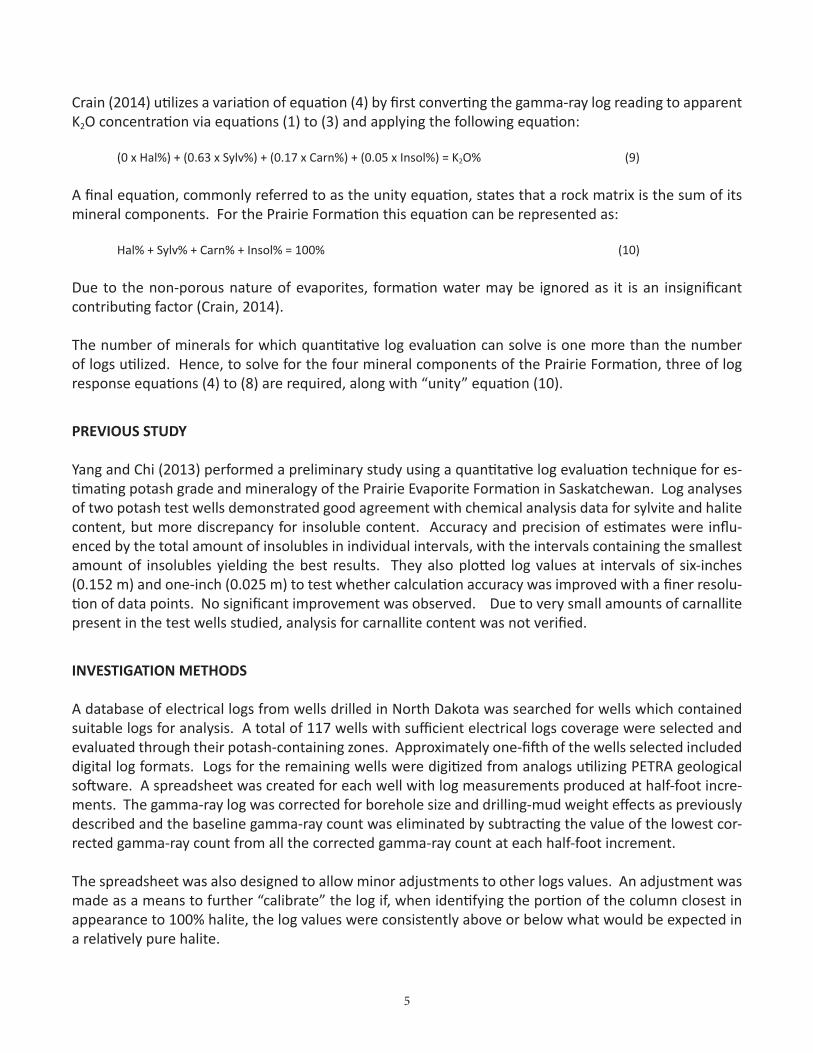
Crain (2014) utilizes a variation of equation (4) by first converting the gamma-ray log reading to apparent K2O concentration via equations (1) to (3) and applying the following equation:
(0 x Hal%) + (0.63 x Sylv%) + (0.17 x Carn%) + (0.05 x Insol%) = K2O% (9)
A final equation, commonly referred to as the unity equation, states that a rock matrix is the sum of its mineral components. For the Prairie Formation this equation can be represented as:
Hal% + Sylv% + Carn% + Insol% = 100% (10)
Due to the non-porous nature of evaporites, formation water may be ignored as it is an insignificant contributing factor (Crain, 2014).
The number of minerals for which quantitative log evaluation can solve is one more than the number of logs utilized. Hence, to solve for the four mineral components of the Prairie Formation, three of log response equations (4) to (8) are required, along with “unity” equation (10).
PREVIOUS STUDY
Yang and Chi (2013) performed a preliminary study using a quantitative log evaluation technique for es-timating potash grade and mineralogy of the Prairie Evaporite Formation in Saskatchewan. Log analyses of two potash test wells demonstrated good agreement with chemical analysis data for sylvite and halite content, but more discrepancy for insoluble content. Accuracy and precision of estimates were influ-enced by the total amount of insolubles in individual intervals, with the intervals containing the smallest amount of insolubles yielding the best results. They also plotted log values at intervals of six-inches (0.152 m) and one-inch (0.025 m) to test whether calculation accuracy was improved with a finer resolu-tion of data points. No significant improvement was observed. Due to very small amounts of carnallite present in the test wells studied, analysis for carnallite content was not verified.
INVESTIGATION METHODS
A database of electrical logs from wells drilled in North Dakota was searched for wells which contained suitable logs for analysis. A total of 117 wells with sufficient electrical logs coverage were selected and evaluated through their potash-containing zones. Approximately one-fifth of the wells selected included digital log formats. Logs for the remaining wells were digitized from analogs utilizing PETRA geological software. A spreadsheet was created for each well with log measurements produced at half-foot incre-ments. The gamma-ray log was corrected for borehole size and drilling-mud weight effects as previously described and the baseline gamma-ray count was eliminated by subtracting the value of the lowest cor-rected gamma-ray count from all the corrected gamma-ray count at each half-foot increment.
The spreadsheet was also designed to allow minor adjustments to other logs values. An adjustment was made as a means to further “calibrate” the log if, when identifying the portion of the column closest in appearance to 100% halite, the log values were consistently above or below what would be expected in a relatively pure halite.
5
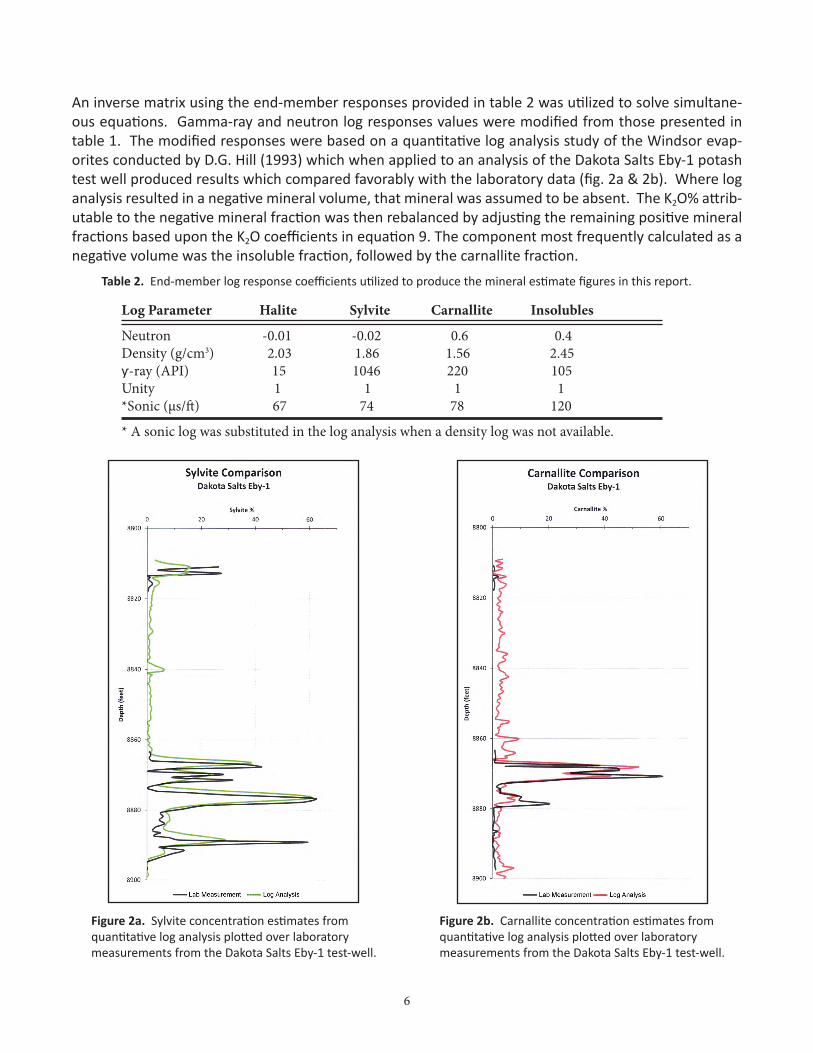
An inverse matrix using the end-member responses provided in table 2 was utilized to solve simultane-ous equations. Gamma-ray and neutron log responses values were modified from those presented in table 1. The modified responses were based on a quantitative log analysis study of the Windsor evap-orites conducted by D.G. Hill (1993) which when applied to an analysis of the Dakota Salts Eby-1 potash test well produced results which compared favorably with the laboratory data (fig. 2a & 2b). Where log analysis resulted in a negative mineral volume, that mineral was assumed to be absent. The K2O% attrib-utable to the negative mineral fraction was then rebalanced by adjusting the remaining positive mineral fractions based upon the K2O coefficients in equation 9. The component most frequently calculated as a negative volume was the insoluble fraction, followed by the carnallite fraction.
Figure 2a. Sylvite concentration estimates from quantitative log analysis plotted over laboratory measurements from the Dakota Salts Eby-1 test-well.
Figure 2b. Carnallite concentration estimates from quantitative log analysis plotted over laboratory measurements from the Dakota Salts Eby-1 test-well.
Table 2. End-member log response coefficients utilized to produce the mineral estimate figures in this report.
Log Parameter Halite Sylvite Carnallite Insolubles
Neutron -0.01 -0.02 0.6 0.4Density (g/cm3) 2.03 1.86 1.56 2.45ƴ-ray (API) 15 1046 220 105Unity 1 1 1 1*Sonic (μs/ft) 67 74 78 120
* A sonic log was substituted in the log analysis when a density log was not available.
6
Map production
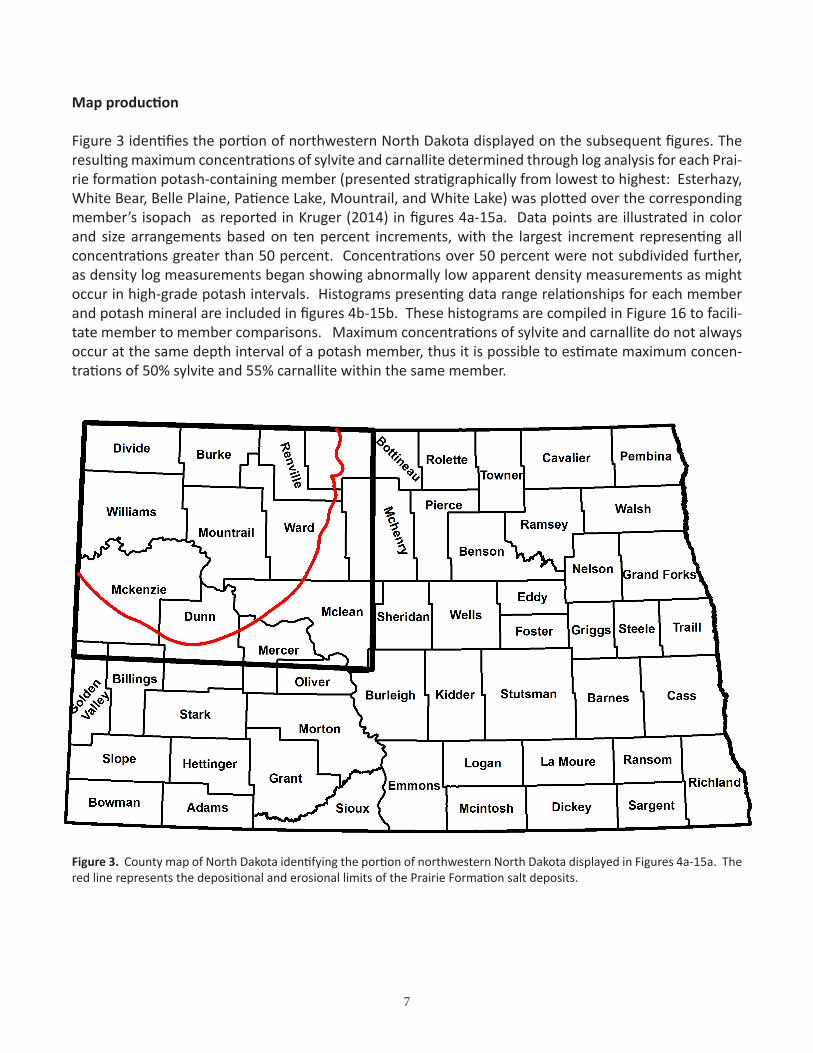
Figure 3 identifies the portion of northwestern North Dakota displayed on the subsequent figures. The resulting maximum concentrations of sylvite and carnallite determined through log analysis for each Prai-rie formation potash-containing member (presented stratigraphically from lowest to highest: Esterhazy, White Bear, Belle Plaine, Patience Lake, Mountrail, and White Lake) was plotted over the corresponding member’s isopach as reported in Kruger (2014) in figures 4a-15a. Data points are illustrated in color and size arrangements based on ten percent increments, with the largest increment representing all concentrations greater than 50 percent. Concentrations over 50 percent were not subdivided further, as density log measurements began showing abnormally low apparent density measurements as might occur in high-grade potash intervals. Histograms presenting data range relationships for each member and potash mineral are included in figures 4b-15b. These histograms are compiled in Figure 16 to facili-tate member to member comparisons. Maximum concentrations of sylvite and carnallite do not always occur at the same depth interval of a potash member, thus it is possible to estimate maximum concen-trations of 50% sylvite and 55% carnallite within the same member.
Figure 3. County map of North Dakota identifying the portion of northwestern North Dakota displayed in Figures 4a-15a. The red line represents the depositional and erosional limits of the Prairie Formation salt deposits.
7
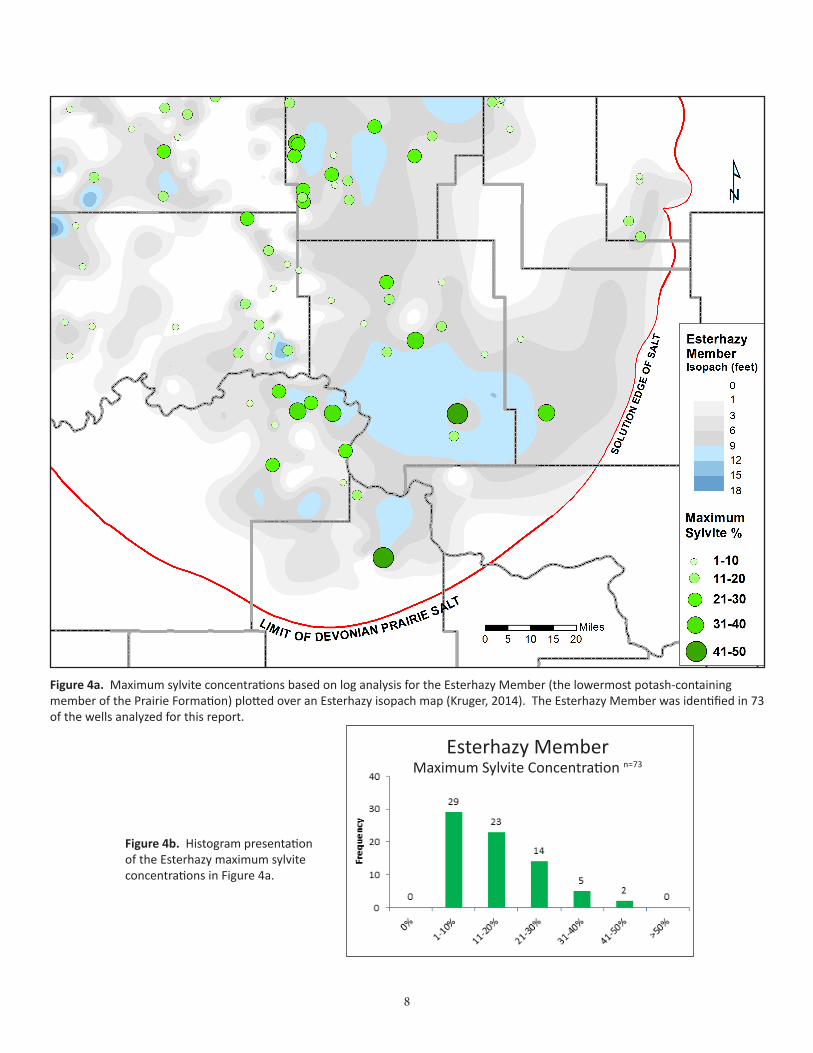
Figure 4b. Histogram presentation of the Esterhazy maximum sylvite concentrations in Figure 4a.
Figure 4a. Maximum sylvite concentrations based on log analysis for the Esterhazy Member (the lowermost potash-containing member of the Prairie Formation) plotted over an Esterhazy isopach map (Kruger, 2014). The Esterhazy Member was identified in 73 of the wells analyzed for this report.
Esterhazy MemberMaximum Sylvite Concentration n=73
8
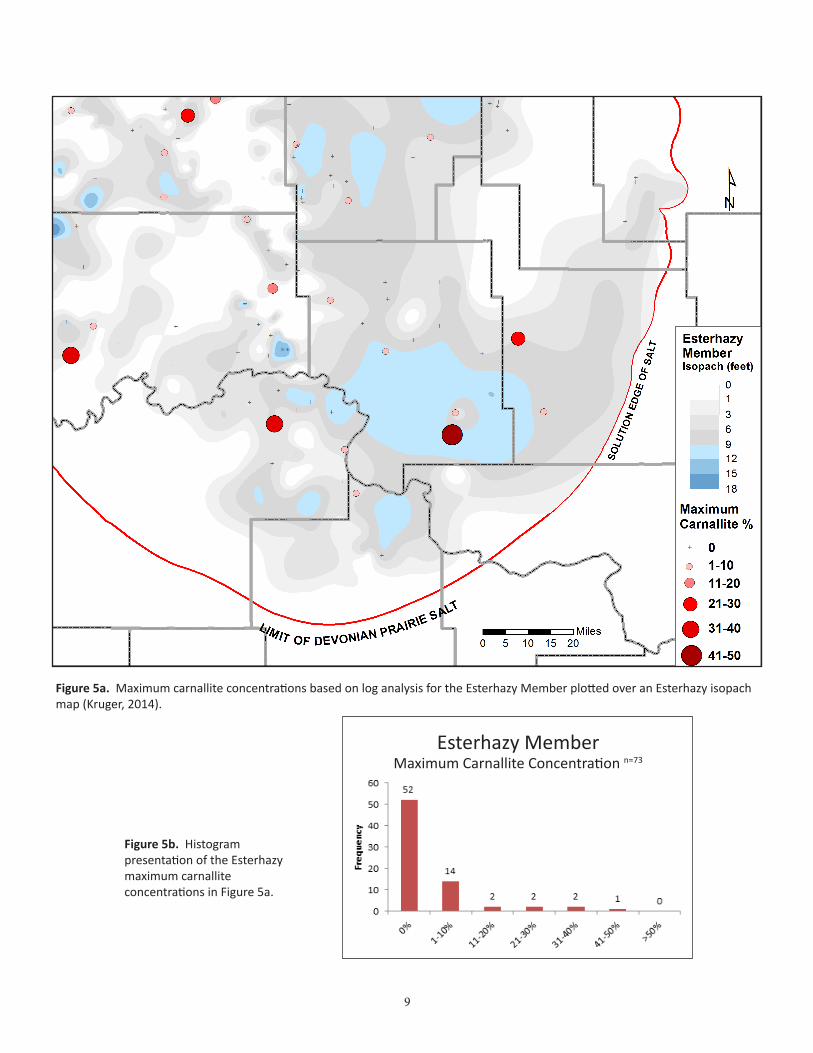
Figure 5a. Maximum carnallite concentrations based on log analysis for the Esterhazy Member plotted over an Esterhazy isopach map (Kruger, 2014).
Figure 5b. Histogram presentation of the Esterhazy maximum carnallite concentrations in Figure 5a.
Esterhazy MemberMaximum Carnallite Concentration n=73
9
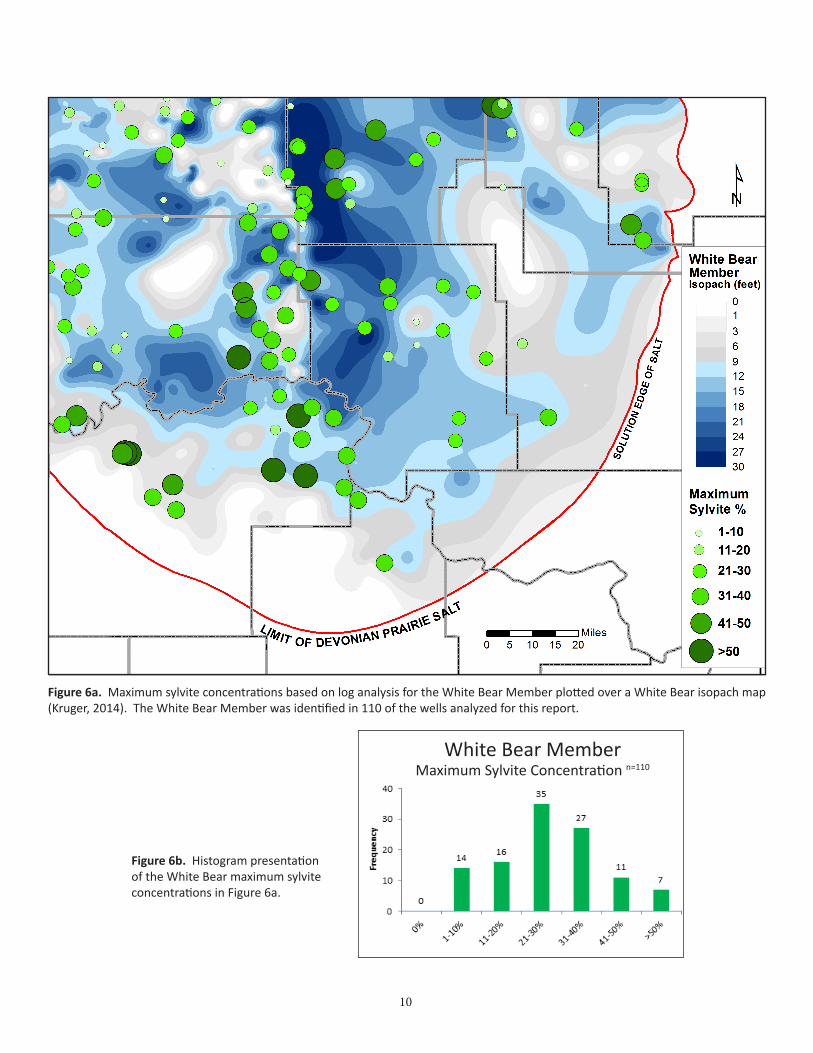
Figure 6a. Maximum sylvite concentrations based on log analysis for the White Bear Member plotted over a White Bear isopach map (Kruger, 2014). The White Bear Member was identified in 110 of the wells analyzed for this report.
Figure 6b. Histogram presentation of the White Bear maximum sylvite concentrations in Figure 6a.
White Bear MemberMaximum Sylvite Concentration n=110
10
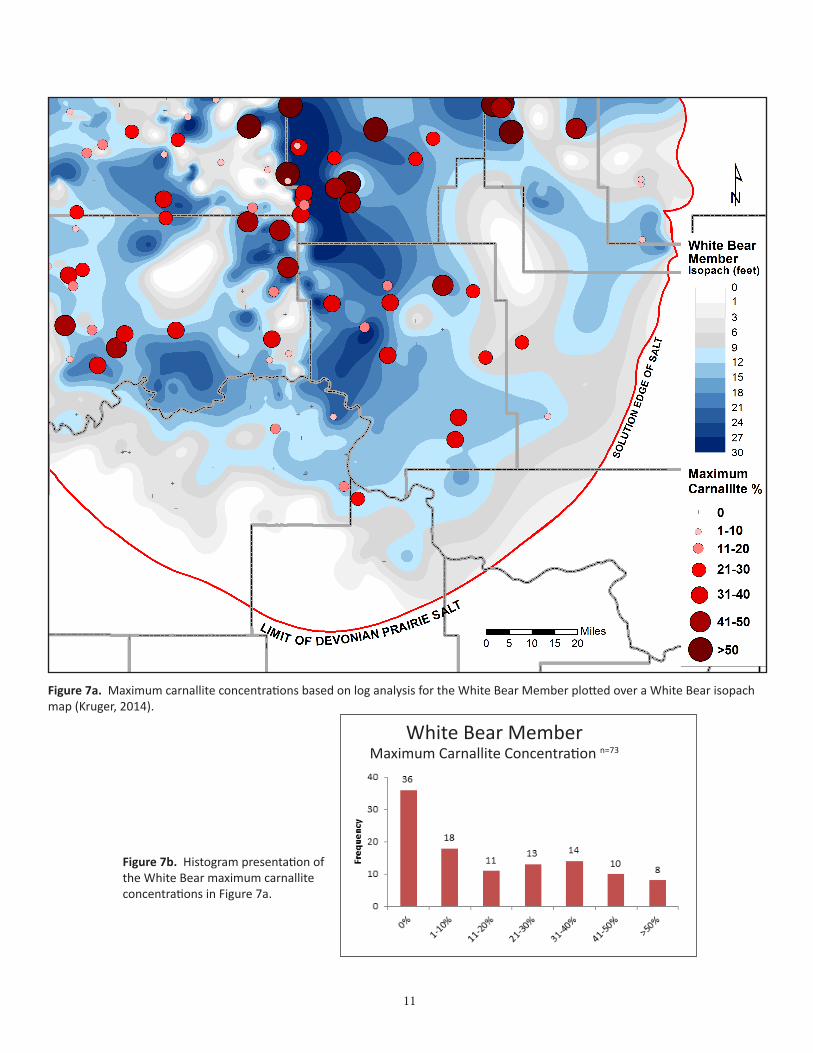
Figure 7a. Maximum carnallite concentrations based on log analysis for the White Bear Member plotted over a White Bear isopach map (Kruger, 2014).
Figure 7b. Histogram presentation of the White Bear maximum carnallite concentrations in Figure 7a.
White Bear MemberMaximum Carnallite Concentration n=73
11
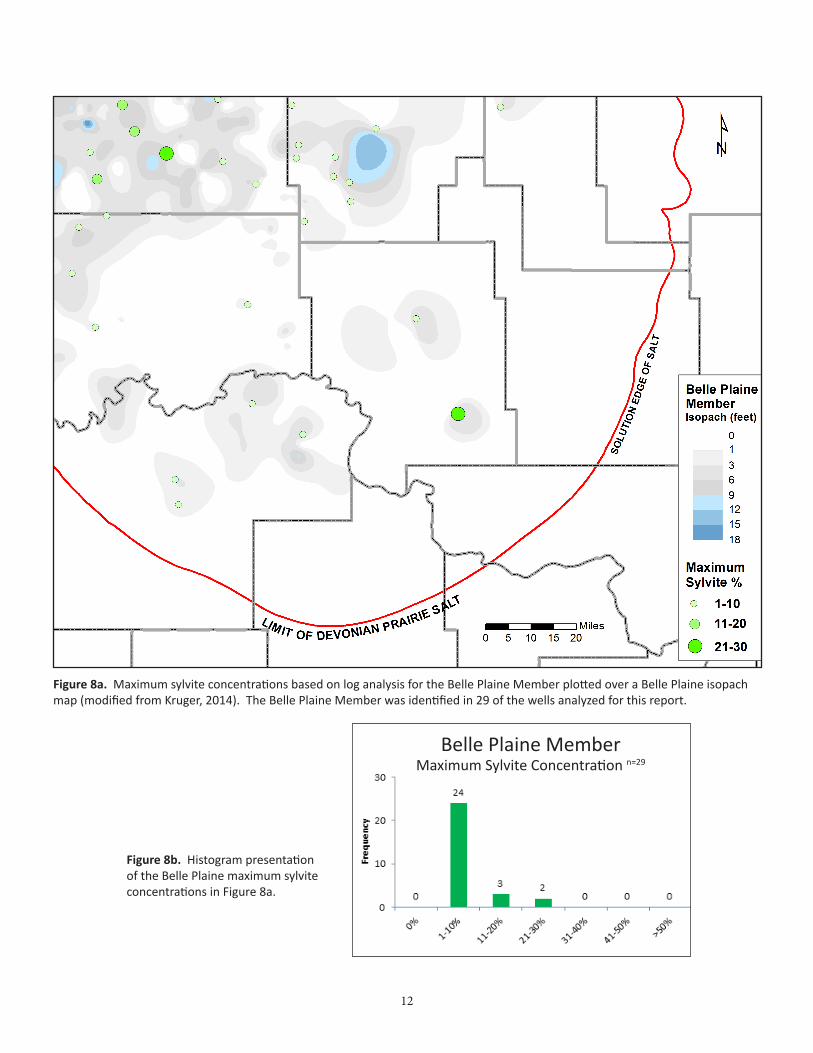
Figure 8a. Maximum sylvite concentrations based on log analysis for the Belle Plaine Member plotted over a Belle Plaine isopach map (modified from Kruger, 2014). The Belle Plaine Member was identified in 29 of the wells analyzed for this report.
Figure 8b. Histogram presentation of the Belle Plaine maximum sylvite concentrations in Figure 8a.
Belle Plaine MemberMaximum Sylvite Concentration n=29
12
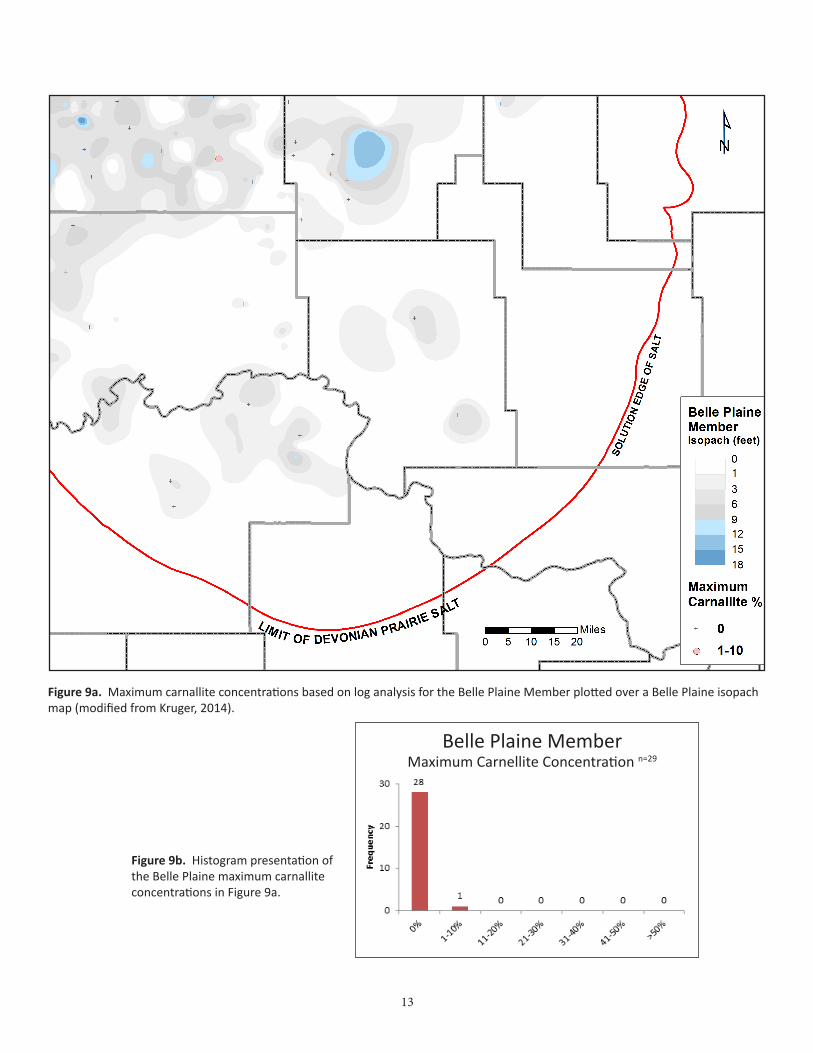
Figure 9a. Maximum carnallite concentrations based on log analysis for the Belle Plaine Member plotted over a Belle Plaine isopach map (modified from Kruger, 2014).
Figure 9b. Histogram presentation of the Belle Plaine maximum carnallite concentrations in Figure 9a.
Belle Plaine MemberMaximum Carnellite Concentration n=29
13
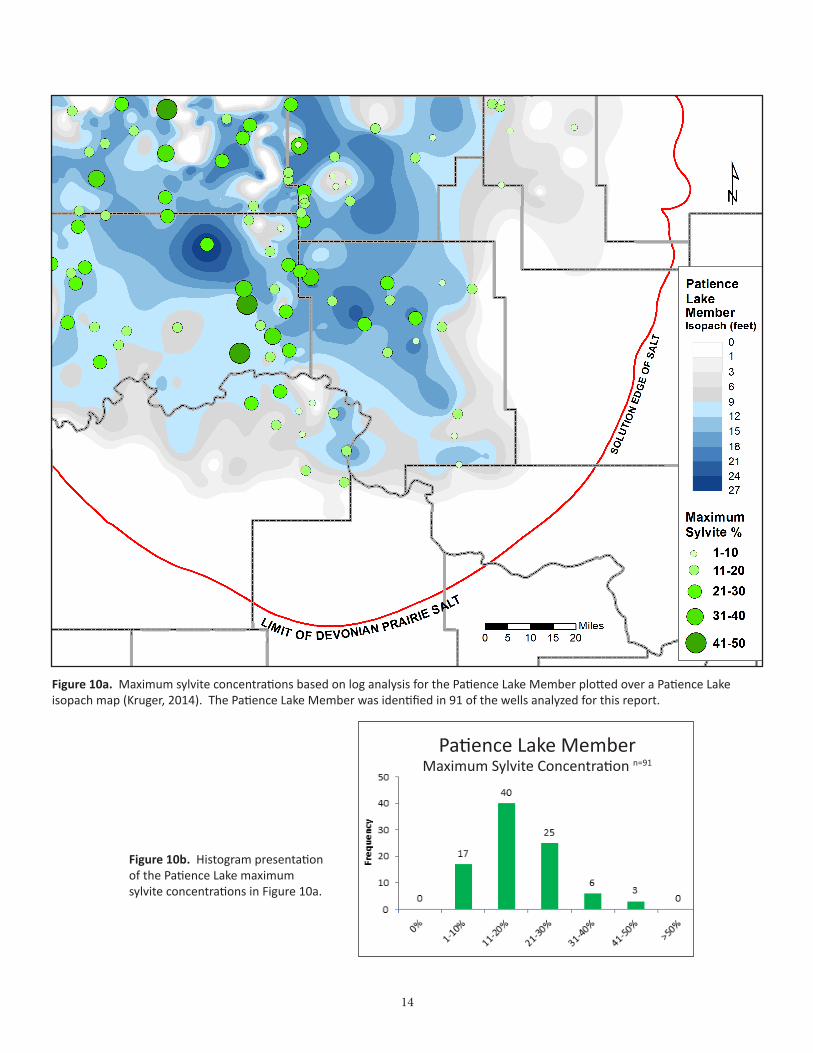
Figure 10a. Maximum sylvite concentrations based on log analysis for the Patience Lake Member plotted over a Patience Lake isopach map (Kruger, 2014). The Patience Lake Member was identified in 91 of the wells analyzed for this report.
Figure 10b. Histogram presentation of the Patience Lake maximum sylvite concentrations in Figure 10a.
Patience Lake MemberMaximum Sylvite Concentration n=91
14
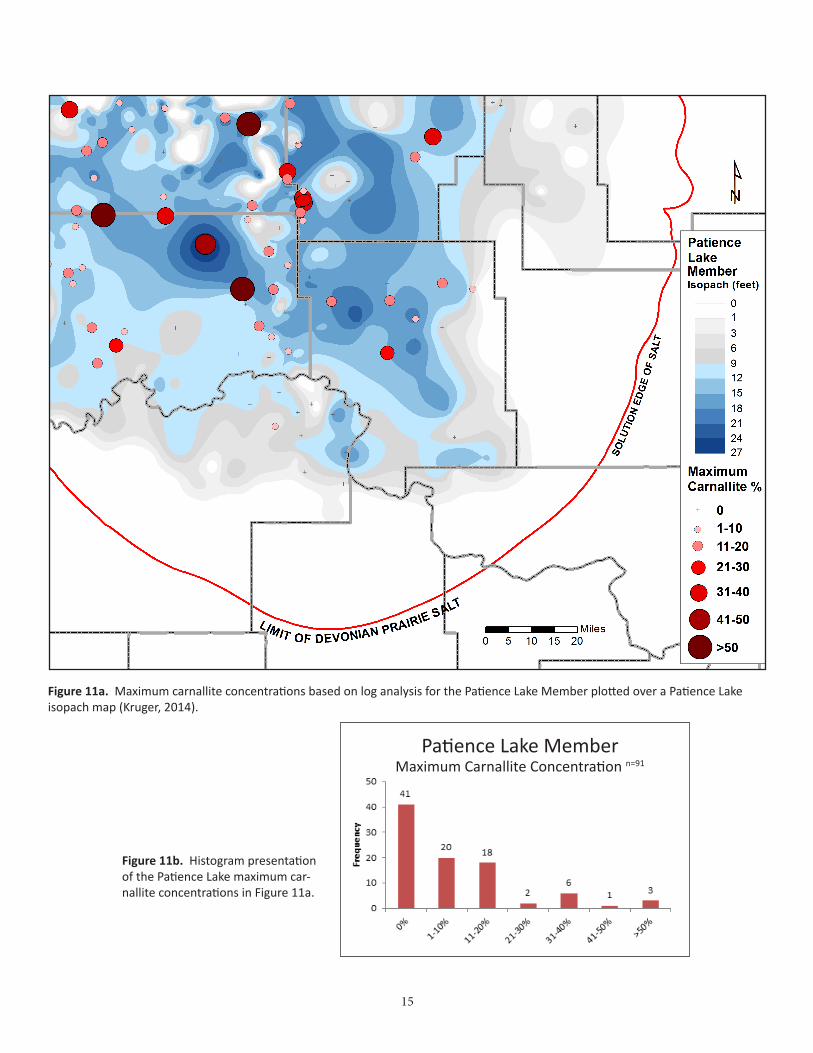
Figure 11a. Maximum carnallite concentrations based on log analysis for the Patience Lake Member plotted over a Patience Lake isopach map (Kruger, 2014).
Figure 11b. Histogram presentation of the Patience Lake maximum car-nallite concentrations in Figure 11a.
Patience Lake MemberMaximum Carnallite Concentration n=91
15
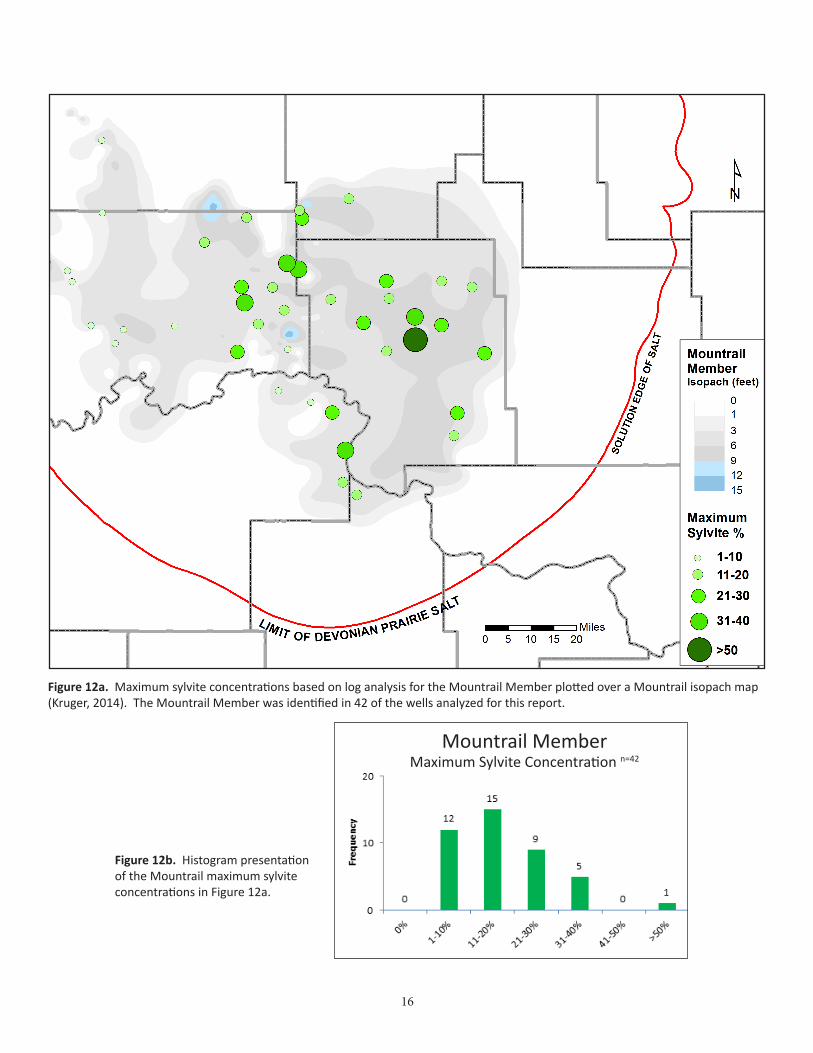
Figure 12a. Maximum sylvite concentrations based on log analysis for the Mountrail Member plotted over a Mountrail isopach map (Kruger, 2014). The Mountrail Member was identified in 42 of the wells analyzed for this report.
Figure 12b. Histogram presentation of the Mountrail maximum sylvite concentrations in Figure 12a.
Mountrail MemberMaximum Sylvite Concentration n=42
16
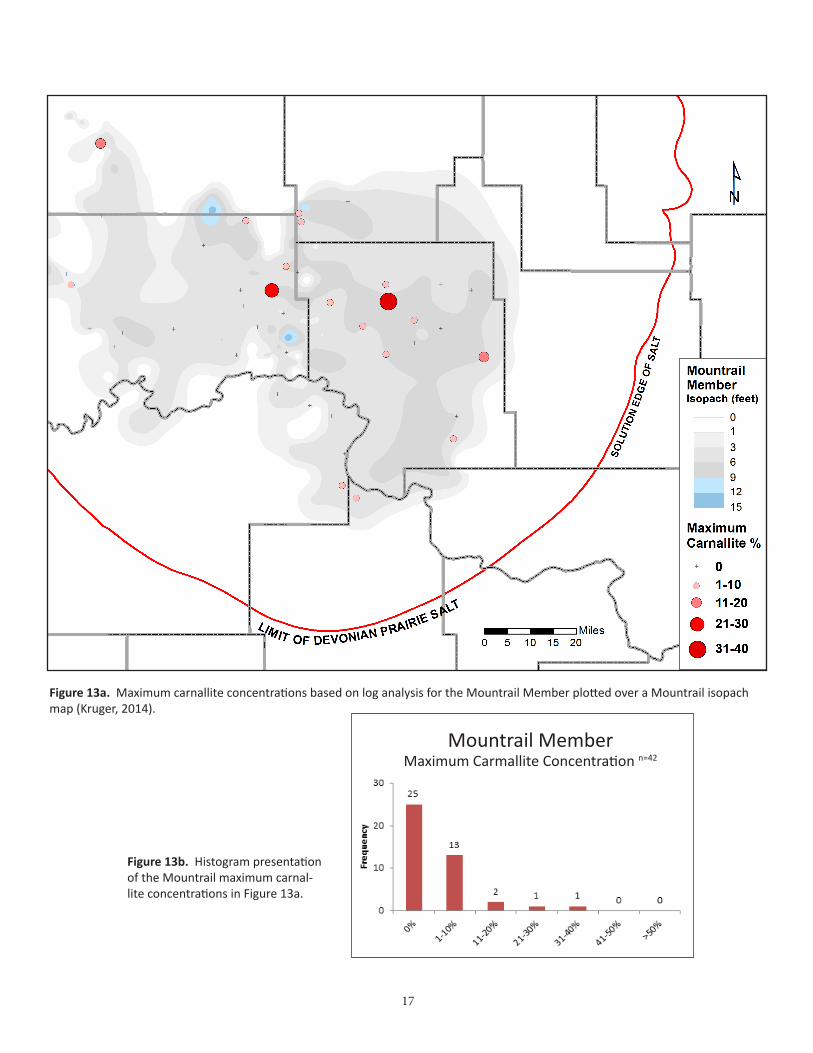
Figure 13a. Maximum carnallite concentrations based on log analysis for the Mountrail Member plotted over a Mountrail isopach map (Kruger, 2014).
Figure 13b. Histogram presentation of the Mountrail maximum carnal-lite concentrations in Figure 13a.
Mountrail MemberMaximum Carmallite Concentration n=42
17
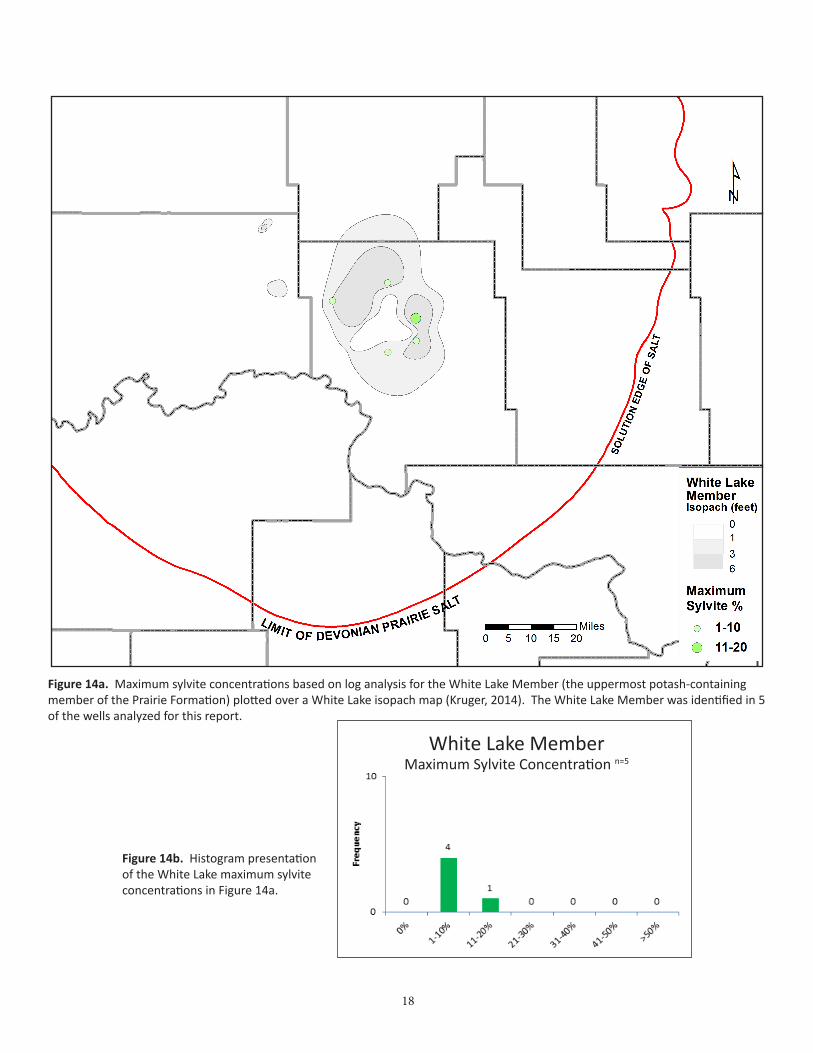
Figure 14a. Maximum sylvite concentrations based on log analysis for the White Lake Member (the uppermost potash-containing member of the Prairie Formation) plotted over a White Lake isopach map (Kruger, 2014). The White Lake Member was identified in 5 of the wells analyzed for this report.
Figure 14b. Histogram presentation of the White Lake maximum sylvite concentrations in Figure 14a.
White Lake MemberMaximum Sylvite Concentration n=5
18
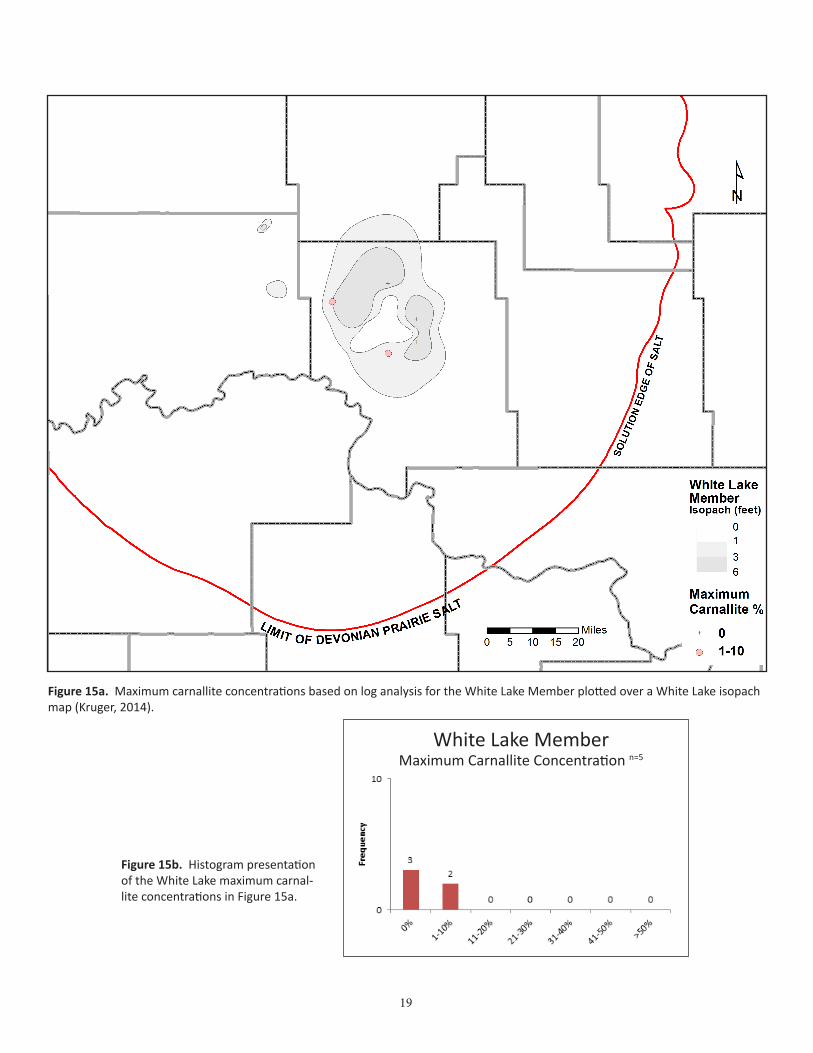
Figure 15a. Maximum carnallite concentrations based on log analysis for the White Lake Member plotted over a White Lake isopach map (Kruger, 2014).
Figure 15b. Histogram presentation of the White Lake maximum carnal-lite concentrations in Figure 15a.
White Lake MemberMaximum Carnallite Concentration n=5
19
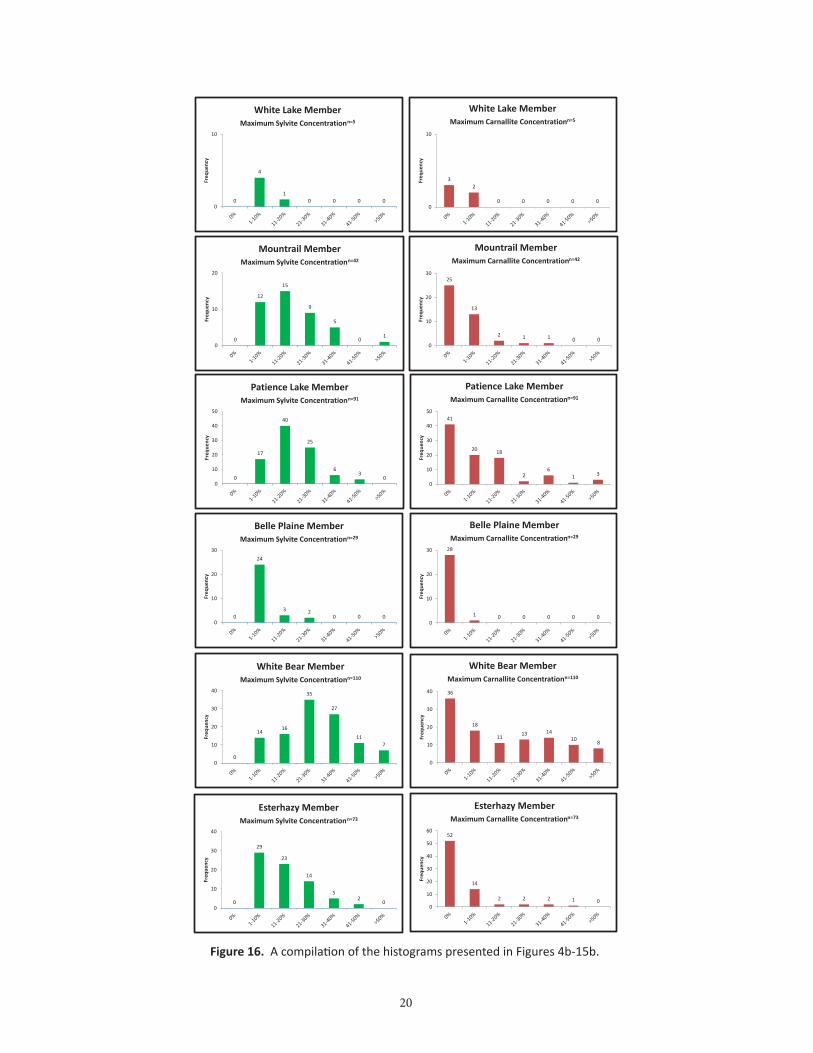
Figure 16. A compilation of the histograms presented in Figures 4b-15b.
0
4
1 0 0 0 0
0
10
Freq
uenc
y
White Lake Member Maximum Sylvite Concentrationn=5
3 2
0 0 0 0 0 0
10
Freq
uenc
y
White Lake Member Maximum Carnallite Concentrationn=5
0
12
15
9
5
0 1
0
10
20
Freq
uenc
y
Mountrail Member Maximum Sylvite Concentrationn=42
25
13
2 1 1 0 0 0
10
20
30
Freq
uenc
y
Mountrail Member Maximum Carnallite Concentrationn=42
0
17
40
25
6 3
0 0
10
20
30
40
50
Freq
uenc
y
Patience Lake Member Maximum Sylvite Concentrationn=91
41
20 18
2 6
1 3
0
10
20
30
40
50
Freq
uenc
y
Patience Lake Member Maximum Carnallite Concentrationn=91
0
24
3 2 0 0 0
0
10
20
30
Freq
uenc
y
Belle Plaine Member Maximum Sylvite Concentrationn=29
28
1 0 0 0 0 0 0
10
20
30
Freq
uenc
y
Belle Plaine Member Maximum Carnallite Concentrationn=29
0
14 16
35
27
11 7
0
10
20
30
40
Freq
uenc
y
White Bear Member Maximum Sylvite Concentrationn=110
36
18
11 13 14 10 8
0
10
20
30
40
Freq
uenc
y
White Bear Member Maximum Carnallite Concentrationn=110
0
29
23
14
5 2
0 0
10
20
30
40
Freq
uenc
y
Esterhazy Member Maximum Sylvite Concentrationn=73
52
14
2 2 2 1 0 0
10
20
30
40
50
60
Freq
uenc
y
Esterhazy Member Maximum Carnallite Concentrationn=73
20
DISCUSSION
While quantitative log evaluation may be a useful tool in the development of a potash-testing program, there are limitations to the process in addition to those previously mentioned which should be under-stood. The follow are brief discussions of some of other issues that affect log evaluation methods and should be considered when interpreting results.
Logging tools measurements generally will record the radiation of a two- to three-foot-thick section of the rock column the tool is passing through. When a potash-containing bed is thin, this results in a log measurement of the radiation of the thin bed as well as the beds above or below it, causing log evalua-tion estimates to deviate from the core samples. For this reason, thin bed corrections are suggested for beds less than three feet thick (Nelson, 2007; Yang & Chi, 2013; Crain, 2014).
Logs used in quantitative evaluation calculations can be influenced by diminished counts resulting from excessive logging speed or attenuation in cases when the logging tools are run through casing or cement.
Log evaluation calculations may be affected by offsets in the depths in which different tools record their data. Similarly, log evaluation calculations should be evaluated against drilling and core logs to deter-mine if there is misalignment in the depth recordings from the various sources.
Choosing a log response for the insoluble fraction of the ore carries a degree of uncertainty. Typical log responses for insoluble materials are generally given in a range of values as the precise mineralogy of the insoluble fraction can vary both by depth within an individual well boring, and by extent across multiple well borings (i.e. a layer of insoluble material which include uranium and thorium will produce a higher gamma-ray signal than a layer without uranium and thorium). A variety of log responses can be tested within the qualitative analysis calculation spreadsheet, however this process can be tedious, often pro-ducing results that better “fit” one potash layer, to the detriment of another.
21
ReferencesCrain, E. R., 2014, Crain’s petrophysical handbook; URL<http://spec2000.net/17-specpotash.
htm>, accessed 14 January 2014.
Crain, E.R., and Anderson, W.B., 1966, Quantitative log evaluation of the Prairie Evaporite forma-tion in Saskatchewan: Journal of Canadian Petroleum Technology, vol. 5, p. 145-152.
Hill, D. G., 1993, Multiple log potash assay: Journal of Applied Geophysics, v. 30, p. 281-295.
Holter, M.E., 1969, The Middle Devonian Prairie Evaporite of Saskatchewan: Saskatchewan De-partment of Mineral Resources, Rep. 123, 134 p.
Kruger, N.W., 2014, The Potash Members of the Prairie Formation in North Dakota: North Dakota Geological Survey, Report of Investigation no. 113, 39 p.
Murphy, E.C., 2011, Potash In North Dakota, Geo News, v. 38, no. 1, p. 1-4.
Nelson, P.H., 2007, Evaluation of potash grade with gamma-ray logs: U.S. Geological Survey, Open File Report 2007-1292, 14 p.
Schlumberger, 1989, Log Interpretation Principles/Applications: Texas, Schlumberger, 227 p.
Worsley, N., and Fuzesy, A., 1979, The Potash-bearing Members of the Devonian Prairie Evaporite of Southeastern Saskatchewan, South of the Mining Area: Economic Geology, vol. 74, p. 377-388.
Yang, C., and Berenyi, J., 2009, The stratigraphic framework of the potash-rich members of the middle Devonian upper Prairie Evaporite Formation, Saskatchewan: Saskatchewan Geologi-cal Survey, Summary of Investigations 2009, vol. 1, 28 p.
Yang, C., and Chi, G., 2013, Quantitative evaluation of potash grade and mineralogy based on geophysical well-log analysis: preliminary study of the Prairie Evaporite in Saskatchewan: Sas-katchewan Geological Survey, Summary of Investigations 2013, vol. 1, 10 p.
22