Embed Size (px)
Citation preview

http://www.diva-portal.org
Postprint
This is the accepted version of a paper published in Journal of Physical Activity and Health.This paper has been peer-reviewed but does not include the final publisher proof-correctionsor journal pagination.
Citation for the original published paper (version of record):
Ekblom Bak, E., Ekblom, Ö., Andersson, G., Wallin, P., Ekblom, B. (2018)Physical Education and Leisure-Time Physical Activity in Youth Are Both Important forAdulthood Activity, Physical Performance, and Health.Journal of Physical Activity and Health, 15(9): 661-670https://doi.org/10.1123/jpah.2017-0083
Access to the published version may require subscription.
N.B. When citing this work, cite the original published paper.
Permanent link to this version:http://urn.kb.se/resolve?urn=urn:nbn:se:gih:diva-5253
Youth PA and adulthood PA, VO2max and health
1
Title page
Full title: Physical education and leisure time physical activity in youth are both important for
adulthood activity, physical performance and health.
Running headline: Youth PA and adulthood PA, VO2max and health
Manuscript type: Original Research
Keywords: Physical education, tracking, VO2max, retrospective, epidemiology
Abstract word count: 200
Date of manuscript submission: 2018-01-11
Youth PA and adulthood PA, VO2max and health
2
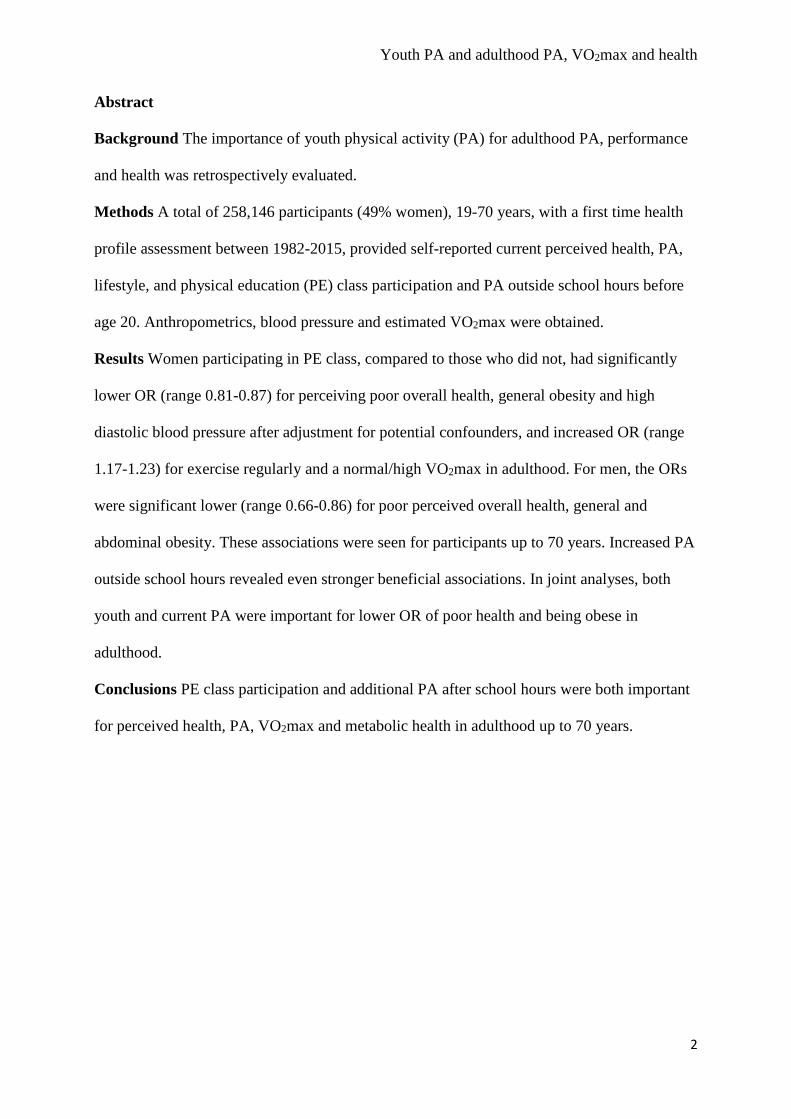
Abstract
Background The importance of youth physical activity (PA) for adulthood PA, performance
and health was retrospectively evaluated.
Methods A total of 258,146 participants (49% women), 19-70 years, with a first time health
profile assessment between 1982-2015, provided self-reported current perceived health, PA,
lifestyle, and physical education (PE) class participation and PA outside school hours before
age 20. Anthropometrics, blood pressure and estimated VO2max were obtained.
Results Women participating in PE class, compared to those who did not, had significantly
lower OR (range 0.81-0.87) for perceiving poor overall health, general obesity and high
diastolic blood pressure after adjustment for potential confounders, and increased OR (range
1.17-1.23) for exercise regularly and a normal/high VO2max in adulthood. For men, the ORs
were significant lower (range 0.66-0.86) for poor perceived overall health, general and
abdominal obesity. These associations were seen for participants up to 70 years. Increased PA
outside school hours revealed even stronger beneficial associations. In joint analyses, both
youth and current PA were important for lower OR of poor health and being obese in
adulthood.
Conclusions PE class participation and additional PA after school hours were both important
for perceived health, PA, VO2max and metabolic health in adulthood up to 70 years.
Youth PA and adulthood PA, VO2max and health
3
Introduction
Despite the well-established knowledge that physical activity (PA) is important for health and
longevity, the majority of the adult population does not meet current national guidelines.1,2
Even if current PA level is known to have the greatest effect on health and physical
performance in general,3,4 childhood and adolescence PA might also have important
beneficial effects in different domains, for example bone density.5 With the alarming reports
of increasing childhood/adolescent obesity and declining fitness levels,6,7 studies on the
immediate effects on health and disease in youth, as well as tracking into adulthood and
effects on lifestyle, activity habits and health later in life, are highly relevant. Previous
tracking studies report in general low to moderate correlation between childhood and adult PA
and fitness, with some equivocal results between different domains of youth PA.8-11 This
might be due to methodological issues as well as small sample sizes. Follow-ups are mainly
performed over the early parts of the adult life-span, up to 26-39 years,9,10,12,13 with limited
long-term follow-ups from childhood to late adulthood. Also, little is known about the effects
of youth PA and cardiovascular risk later in life.14 Moreover, although physical education
(PE) class at least once a week has been and is provided to all Swedish children/adolescents
from first grade (7 years) until leaving high school at the age of 16 years, there is a paucity of
research that specifically studies the importance of school based PE class participation.
Health Profile Assessment (HPA) is an interdisciplinary method combining medicine,
physiology and behavioral science to promote health. This method has been used in
occupational health services in Sweden for almost 40 years, with several thousand participants
carrying out a HPA every year in different places around Sweden. It is comprised of a person-
centred dialogue, and includes self-reported lifestyle and perceived health, previous and
current PA habits, metabolic and physiological measurements. All data are subsequently
registered and stored in a database. The combination of the large amount of HPA performed

Youth PA and adulthood PA, VO2max and health
4
each year and the long-term usage of well-established and standardized methods in
occupational health promotion generates a unique database, which enables analyses of youth
PA habits in relation to adulthood PA habits, performance and health in the Swedish working
population. The large amount of data also enables sex and age stratified analyses.
The primary aim of this study was to retrospectively analyze the importance of PA
before 20 years of age, specified as participation in PE class or not, together with additional
PA outside school hours, on adult PA level, VO2max, and perceived and metabolic health
later in life in a large sample of Swedish men and women of a broad age span.
Methods
From October 1982 until September 2015, a total of 363,746 men and women, aged 19 to 70
years, performed a first-time HPA, which were registered and stored in the database. Health
Profile Institute (Stockholm, Sweden) is the institute that is responsible for the database,
standardization of methods used and education of the HPA coaches since the start of the
administration of HPAs in the late 1970s. In October 2015, a withdrawal of participants from
the database was made and available for the present analyses. The protocols used were
approved by the institutional review boards of the institutions involved in this study and all
participants provided informed consent prior to data collection. The study was approved by
the ethics board at Karolinska University, Dnr 2015/1864-31/2 and adhered to the Declaration
of Helsinki.
Health Profile Assessment
The HPA method comprises three components which have been scientifically evaluated;15,16
current perceived health, self-assessment of life style habits and some medical and
physiological measurements. Participation is optional and free of charge for the individual,

Youth PA and adulthood PA, VO2max and health
5
and is offered to all employees working for a company or organisation connected to
occupational or other health service. The participant answers an extensive questionnaire
including current lifestyle, PA habits, and perceived overall stress and health. During a
following dialogue with a HPA coach, the participant provides information regarding age,
marital status, occupation and PA level prior to the age of 20 years, the latter including
participation or not in PE class and additional PA outside school hours. Subsequently, weight,
height, waist circumference and blood pressure (BP) are obtained. Finally, the participant
performs a submaximal exercise test on a cycle ergometer for estimation of maximal oxygen
consumption (VO2max). All data are recorded in the Health Profile Institute database.
Physical activity habits
PA level prior to the age of 20 years was self- reported by selecting one of the following five
given alternatives through the statement; Prior to the age of 20, I… Did not participate in
physical education (PE) class, Participate only in PE class, Participate in PE class + 1-2
times/week of PA outside school hours, Participate in PE class + 3-5 times/week of PA
outside school hours or Participate in PE class + At least 6 times/week of PA outside school
hours. Current exercise and commuting habits were self-reported through the statement; I
exercise for the purpose of maintaining/improving my physical fitness, health and well-
being...with the alternatives Never, Sometimes, 1-2 times/week, 3-5 times/week or At least 6
times/week. For current commuting, the statement I walk or cycle to and/or from work... was
used with the alternatives Less than 5 min/day, 5-9 min/day, 10-19 min/day, 20-29 min/day or
At least 30 min/day.
Perceived health and covariates

Youth PA and adulthood PA, VO2max and health
6
Perceived overall health and overall stress, as well as diet, smoking and alcohol habits were
obtained from the questionnaire responses. Perceived overall health was assessed using the
statement I perceive my physical and mental health as… with the alternatives Very poor,
Poor, Neither good or bad, Good or Very good. Perceived overall stress was assessed using
the statement I perceive stress in my life, both personally and at work… with the alternatives
Very often, Often, Sometimes, Rarely or Never. Diet habits were obtained using the statement
I consider my diet, regarding both meal frequency and nutritional content to be... with the
alternatives Very poor, Poor, Neither good nor bad, Good or Very good. Smoking habits were
obtained using the statement I smoke... with the alternatives At least 20 cig/day, 11-19
cig/day, 1-10 cig/day, Occasionally or Never. The statement regarding alcohol use was since
year 1982 I drink alcohol… with the alternatives Very often, Often, Sometimes, Rarely or
Never, but was changed in 2011 to I consider my alcohol habits, from a health perspective, to
be... with the alternatives Very poor, Poor, Neither good nor bad, Good or Very good.
Although the alcohol use statement and alternatives have been changed throughout the years,
the variable is kept in the analyses as a proxy for alcohol use as the answer alternatives in
both occasions are on a five-point ordinal scale and the variable is only used as a covariate in
the analyses with small variation between the different subgroups of the main exposure PA
prior to the age of 20 years, see Table 1a and b.
In the dialogue, marital status was reported as either Living together, Living together
with children, Living alone or Living alone with children. Occupation was reported according
to the Swedish Standard Classification of Occupations 1996 (SSYK96) until June 2014 and
according to the SSYK 2012 after that. SSYK is a system for classifying and aggregating data
about occupations in administrative registers or statistical surveys. Occupations reported
according to both SSYK96 or SSYK 2012 can be further grouped into four broad skill levels
defined by level of education for the particular occupation; Level 1 covers elementary

Youth PA and adulthood PA, VO2max and health
7
education at primary school level, meaning no or a low formal education requirements, Level
2 covers education programs at upper secondary and tertiary level of no more than 2 years in
length, Level 3 covers practical or vocational tertiary education programs of 2-3 years in
length, and Level 4 covers theoretical or research-oriented tertiary education programs and
third-cycle programs of at least 3 years, normally 4 years or longer in length.
Measured health and performance
Body mass was obtained with a calibrated scale in light-weight clothing to the nearest 0.5 kg.
Body height was measured to the nearest 0.5 cm using a stadiometer. Body mass index (BMI)
was computed as body mass divided by body height in meters squared (kg·m-2). Waist
circumference was measured with a tape measure to the nearest 0.5 cm at the midpoint
between the top of the iliac crest and the lower margin of the last palpable rib in the mid
axillary line after normal exhalation. Systolic and diastolic BP (mmHg) was measured
manually in the right arm using the standard auscultatory method after 20 minutes of seated
resting. Maximal oxygen uptake (VO2max), expressed as ml oxygen·min-1·kg-1, was estimated
from heart rate response after 6 minutes submaximal exercise on a cycle ergometer according
to Åstrand and Rhyming.17
Statistical analysis
Continuous data displayed non-normality according to the Kolmogorov-Smirnov test, and was
summarized as medians with quartile 1 and quartile 3 in Table 1. Significant differences
between the levels of PA prior to age of 20 years for the continuous data were tested for by
Kruskal-Wallis ANOVA with pairwise comparison (adjusting for multiple comparisons). The
nominal and ordinal data obtained during the dialogue and through questionnaire responses
was further dichotomized according to the definition in Table 1. Significant differences
Youth PA and adulthood PA, VO2max and health
8
between the levels of PA prior to age of 20 years for the proportions was tested by comparing
proportions with the 99% confidence interval (CI) to compensate for multiple testing. In
Table 2 and 3, logistic regression models were used to assess the odds ratio (OR) and 95% CI
associated with higher levels of PA prior to the age of 20 years for the dichotomized variables
of overall health, current exercise habits and intake of heart medicine (as a proxy of
underlying disease). VO2max, BMI, waist circumference, systolic and diastolic BP were all
dichotomized according to conventional cut-offs points for increased health risks (VO2max <
32 ml·min-1·kg-1 in women and < 35 in men; BMI ≥ 30 kg·m-2; waist circumference ≥ 88 cm
in women and ≥ 102 cm in men; systolic BP ≥ 140 mmHg; diastolic BP ≥ 90 mmHg).
Nagelkerk R2 was reported as regression model fit diagnostics. All analyses were performed
using IBM SPSS (version 21.0, SPSS Inc., Chicago IL) and Confidence Interval Analysis
(version 2.2.0).
Results
A total of 258,146 participants (49% women) provided data on PA prior to the age of 20 years
and the other covariates were included in the analyses. A small number of the participants
(1%) had performed the HPA before 1994, with a subsequent annual participation rate of
≥2000 HPAs. For men and women in the database not included in the analyses, the majority
(83%) was due to missing data for occupation. However, comparisons of important variables
between participants with missing data vs. those included in the analyses showed significant
(p<0.001), however, small variations (except for sex); men (59% vs. 51%), age (43.0 vs. 43.3
years), BMI (25.8 vs. 25.7), systolic BP (126.3 vs. 126.1 mmHg), diastolic BP (78.0 vs. 77.7
mmHg), VO2max (36.9 vs. 36.3 ml·min-1·kg-1), self-reported very poor/poor overall health
(6.4% vs. 5.9%), very poor/poor alcohol habits (4.9% vs. 4.6%), regular exercise (64.3% vs.
64.9%), very poor/poor diet habits (6.4% vs. 8.0%) and daily smokers (11.1% vs. 11.4%).
Youth PA and adulthood PA, VO2max and health
9
Thus, the analysed data can be regarded as representative for the whole HPI database
population.
Characteristics of the study population are presented in Table 1a and b. Internal missing
data is seen for VO2max (103,553 women, 81.9%, and 107,040 men, 81.3%, provided data on
VO2max), mainly due to participants with medication affecting heart rate response, and waist
circumference (18,747 women, 14.8%, and 29,005 men, 22.0%, provided data on waist
circumference), as it was an optional part of the HPA.
Importance of youth PA on adulthood PA, performance and health
Women who participated in PE class (but with no additional PA outside school) had
significantly lower OR (range 0.66 to 0.84) for perceiving very poor/poor overall health,
being generally and abdominal obese and having a high diastolic BP after adjusting for age
and performed year of the health assessment. Also, they had increased OR for being current
regular exercisers (OR=1.27) and having a normal or high VO2max (OR=1.26) compared to
those who did not attend school PE class. These associations remained significant after
adjusting for lifestyle related covariates, albeit with a somewhat lower magnitude of ORs
(range 0.74 to 0.87 and 1.17 to 1.23, respectively). With more frequent participation in PA
outside school hours (1-2 times/week, 3-5 times/week and ≥6 times/week), even stronger
beneficial associations were seen for the above mentioned outcome variables, and additionally
for systolic BP and the odds of not taking heart medicine.
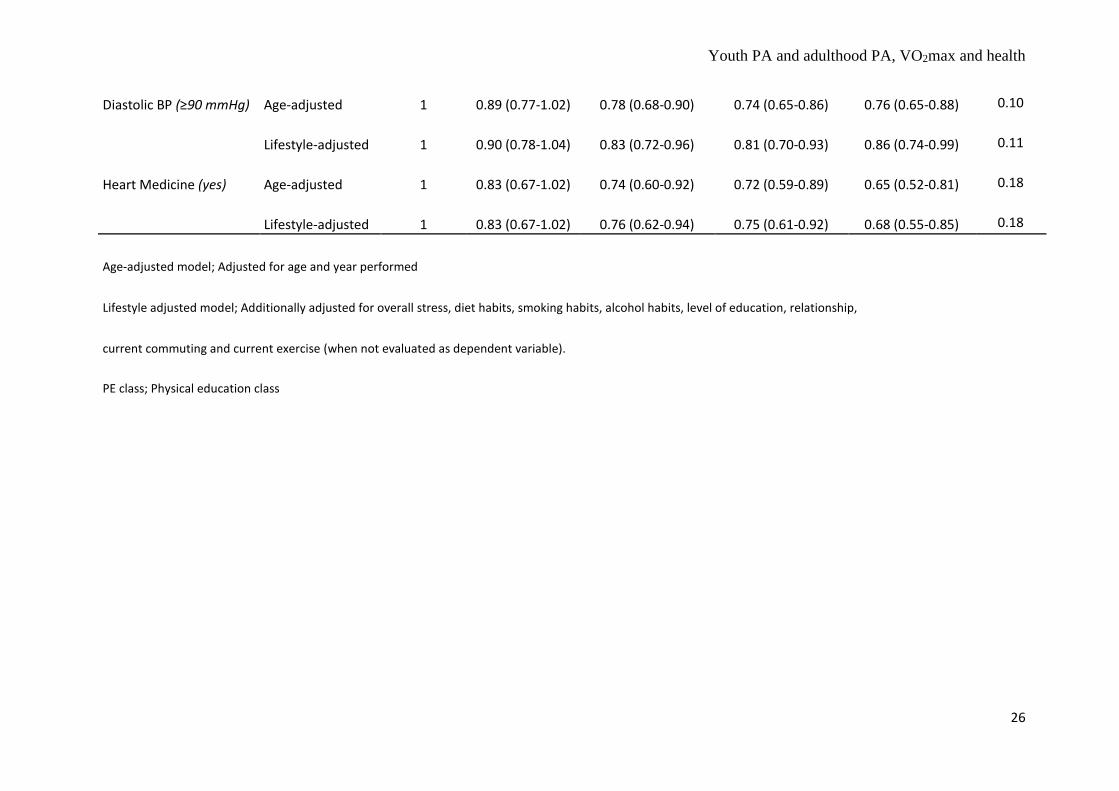
Men participating in PE class had a significant lower OR (range 0.64 to 0.85) for
perceiving their overall health to be very poor/poor and being both generally and abdominal
obese compared to those who did not participate in PE class (Table 2b). Moreover, a more
beneficial profile was seen for all the outcome variables for those with additional PA outside
school hours, compared to those not participating in PE class (OR range for additional PA 1-2
Youth PA and adulthood PA, VO2max and health
10
times/week 0.55 to 0.83 for perceived and metabolic health variables, and 1.47 to 1.54 for
current exercise and normal/high VO2max). All odds ratios, except for waist circumference,
remained significant after adjusting for relevant lifestyle covariates.
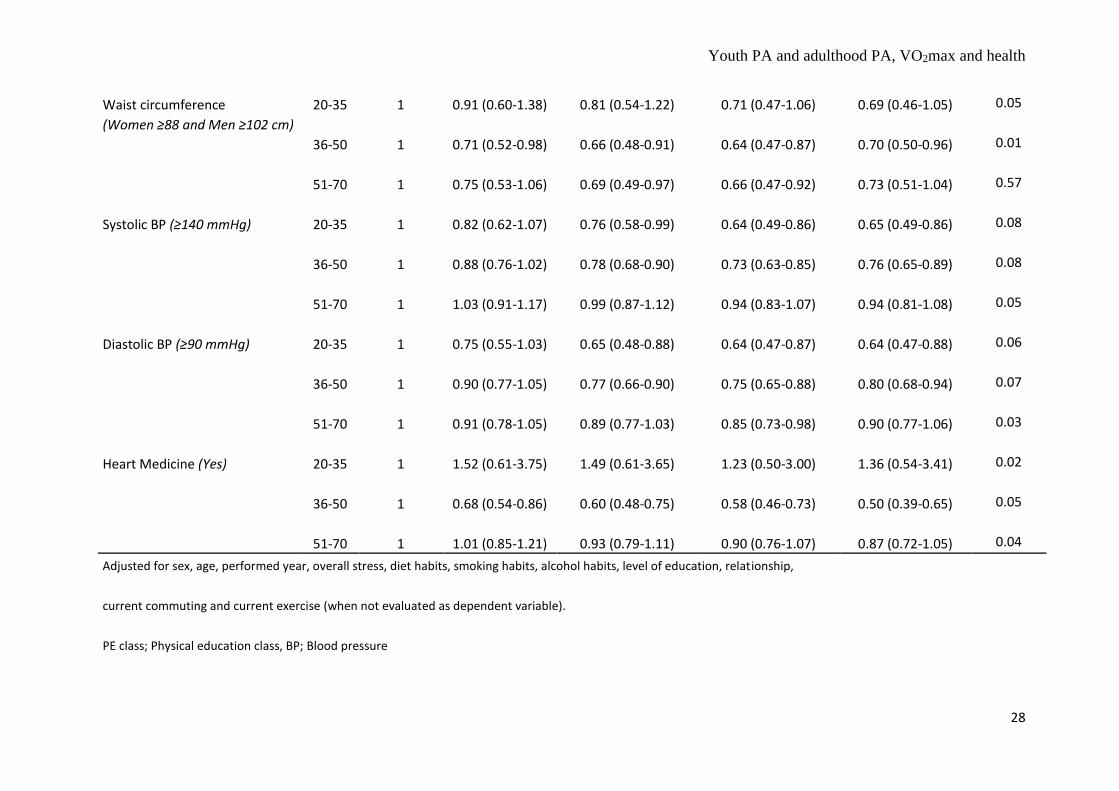
In table 3, the variations with increasing age of the participants, and hence age since youth
PA, were analysed for the importance of PA prior to the age of 20 years in three adulthood
age-subgroups; 20-35, 36-50 and 51-70 years. Participation in PE class compared to not
attending PE class was significantly important in all stages of adulthood up to 70 years for not
perceiving very poor/poor overall health (range 0.73 to 0.80). Similar beneficial associations
were seen for the odds of being a currently regular exerciser and not being obese in later
adulthood, and for having a normal/high VO2max in early adulthood. Participants reporting
additional PA outside school hours were during all stages of adulthood more likely to exercise
regularly (OR range 1.28 to 1.58), having a normal/high VO2max (OR range 1.35 to 1.58) and
not to be obese (OR range 0.73 to 0.77). Similar beneficial associations, although not always
significant, were seen for high waist circumference, systolic and diastolic BP. For intake of
heart medicine, beneficial associations were seen in middle- and older stages of adulthood
among those participating in PE class compared to those who did not.
Joint associations of youth and adulthood PA on adulthood perceived health and obesity
Compared to the reference group, those reporting not being regular exercisers in adulthood
had significantly higher OR for perceiving their overall health as very poor/poor as well as
being obese regardless youth PA level (PE class + PA ≥ 1 times/week, PE class only or No PE
class) (Figure 1a and b). However, those reporting only participating in PE class or no PE
class prior to the age of 20 years had higher risk of perceiving their overall health as very
poor/poor and being obese, regardless exercising or not in adulthood. Participants reporting
Youth PA and adulthood PA, VO2max and health
11
no PE class and not being currently regularly active experienced the highest risk (OR=2.6 for
very poor/poor perceived overall health and OR=1.98 for being obese).
Discussion
The present results show that participation in school-based PE class, compared to not
participating, was associated with more beneficial perceived health, a more active life, higher
VO2max and a better metabolic health in adulthood in a sample of over 250.000 working
Swedish men and women. Additional PA outside school hours is associated with even
stronger beneficial associations in both men and women for all studied outcome variables.
These associations are maintained even after adjusting for important confounders. Further, in
analyses of the impact of age (up to 70 years) and hence time since leaving school, the
associations were similar, with some variations between stages of adulthood. To our
knowledge, no previous study has included a population based sample of this size to
retrospectively evaluate the associations between PE class participation and PA levels in
childhood/adolescence to adulthood PA level, VO2max and health up to 70 years of age.
The beneficial associations found for those participating in at minimum PE class
compared to those not participating in PE class is highly important. In women, PE class
participation was associated with better current perceived health, regular exercise habits,
higher VO2max, lower levels of overall and abdominal obesity and lower diastolic BP. In
men, similar associations were seen for perceived health and overall and abdominal obesity.
Although the goal and content of the education plan for the PE class has been reformed and
revised throughout the years, one of the most common aims of PE in many countries
(including Sweden) is to promote a life-long physically active life style.18 Also, skill
development and habits in childhood is of great importance for higher exercise habits in adult
life.19 Hence, the present results indicating that PE class participation alone increase the
Youth PA and adulthood PA, VO2max and health
12
possibility to be active in adulthood is especially important for those individuals who are not
engaged in additional PA outside of school hours, as school PE classes are thought to present
a diversity of activities for the child/adolescent to try and perform.
PE class participation (in women) and, in a dose response manner, increasing PA
outside school hours increases significantly the odds of exercise regularly as well as having a
higher VO2max later in life for both men and women. This is an important finding, and in line
with previous research. Cleland et al. reported significant associations with total weekly PA at
follow up (mean age 26 to 36 years) in boys aged 9-12 years and girls aged 13-15 years at
baseline,9 however they reported school compulsory PE (min/week) in the same population
showed no relationships.10 In a retrospective study, Kraut et al. report that those participating
in organized school sports had a more than three-fold increased odds of being weekly
regularly active after 40 years of age.20 Hirvensalo et al. reported a more than two-fold
increased odds for being regularly weekly active on at least moderate intensity at 70 year of
age, if reporting participation in competitive sport prior to 20 years of age.21 In general,
tracking of PA from adolescence to older adulthood is in general reported to be low to
medium with more non-significant associations (indicating poorer stability) in women
compared to men.22 This might be due to a low number of participants in some studies,
shorter follow up period, or both.
The finding of 30% lower OR for poor/very poor perceived overall health among men
and women reporting at minimum PE class participation, compared to non-participants, is
highly interesting. Poor perceived health, assessed through a simple question as the present
study, has in large population-based samples been identified as a single, strong predictor of
all-cause mortality.23,24 Importantly, the present associations remained even after adjustments
for other factors associated with poor health such as low level of education, bad diet habits
and smoking, and is strong and evident in all stages of adulthood (table 3). Interestingly, the
Youth PA and adulthood PA, VO2max and health
13
further reduced risk of poor overall health with additional PA outside school hours in the fully
adjusted analyses is small. This may point out that non-participants in school PE classes
belong to a risk group for adult impaired health and other outcomes, but it might also indicate
that even low levels of PA engagement prior to the age of 20 years is important for future
overall health.
We found strong associations with lower overall and abdominal obesity in both men and
women in those with only PE class participation and increasingly with additional PA hours
outside school. A similar association was seen for diastolic BP in women. For both systolic
BP and heart medicine intake, significant associations were present in those reporting at least
one hour of PA outside school. Previous research on the effects of youth PA on CVD risk in
adulthood is limited. Rangul et al. presented data from the HUNT study, which aimed at
investigate differences in PA patterns between adolescence (13-19 year old boys and girls) to
young adulthood (23-31 years) on cardio-metabolic risk factors.14 They found that those who
maintained their PA from adolescence to adulthood had a significantly lower CVD risk and
better mental health, compared to those who remained inactive. This may be comparable to
the results in Figure 1a and b in the present study. Those who did not attend PE class and did
not exercise regularly in adulthood, had a two-fold increased OR for overall obesity and 2.6-
fold increased OR for poor health compared to those who had maintained an active lifestyle
from adolescence to adulthood. Importantly, participants in the present study who adopted an
active life style from adolescence to adulthood had a significantly lower OR for both for poor
perceived health and overall obesity (Figure 1a and b). This is evident in those with no PE
class as well as only PE class during adolescence, and indicates the importance of present
activity levels for metabolic health and well-being. On the contrary, participants who adopted
an inactive lifestyle (participating in only PE class or PE class plus additional PA hours
outside school during adolescence, but with no regular exercise in adulthood) had
Youth PA and adulthood PA, VO2max and health
14
significantly lower OR for both for poor perceived health and overall obesity compared to
those being inactive maintainers from adolescence to adulthood. This illustrates the possible
importance of PA habits in early life, although not continuing being active, which evidently
influences health and well-being through other pathways.
It should be noted that it is not possible to draw any definite conclusions regarding
causality in these associations between youth PA and different adult outcomes, since many
transitions and life-changing events occur during the course of life. Moreover, we lack
information regarding the reasons for not participating in PE class for the participants.
Although being a compulsory subject in the Swedish school system since the 19th century,
there are students that choose to not participate. In a study of 1000 high school students in
southern Sweden, one out of four did not attend at least one third of PE class opportunities.25
Few students had medical reasons for not participating, with psychological (PE class
perceived as boring/meaningless, bad self-confidence, less satisfied with own athletic ability,
physical appearance and health) and social (peer pressure to not participate, bullying) being
more frequently reported. Also, the PE class having a competitive approach where students
need to perform well and achieve sporting results, together with being directed at and
including mainly interested students,26,27 may serve as unmotivating factors for students
equivocal to the subject and increase the risk of dropping out. Swedish junior high school and
high school students identified as frequent drop-outs from PE class were found to smoke and
drink alcohol more often, skip other compulsory classes, have a higher BMI, enjoy school less
and have less interest in school work, compared to other students attending PE class on
regular basis.28 Girls dropping out from PE class were also more often bullied. Only fourteen
percent reported some physical or psychological hinder that could have influenced
participation. External risk factors for PE class drop-out were mandatory showering after PE
class, grades depending on physical performance, far off located sports facilities and PE class
Youth PA and adulthood PA, VO2max and health
15
taking place in the early morning or at lunch time. Girls more often than boys have been
reported to experience unease and discomfort for PE class,26 which may influence
participation. In the present study more women than men reported not participating in PE
class. However, it is important to emphasize that those participants reporting not attending
school PE classes, regardless reason, must be considered as belonging to a risk group for adult
physical inactivity, low VO2max and poor perceived overall health as well as measured
impaired metabolic health later in life.
Strength and limitations
A strength of this study is the large number of men and women studied with standardized
methods. Another strength is also the duration during which current data were obtained
making variations in perceived health and other factors not depending on variations in
changes in the society. A novelty is the long positive tracking effects of
childhood/adolescence PA on adult health up to 70 years, hence providing a possibility to
study the associations at different stages of adulthood. A limitation is that we have no
information on why participants did not participate in PE class. Also, there is no information
regarding level and amount of PA in school PE class, but modern research regarding non-
intentional physical exercise have shown that even walking and other low-intensity non-sport
activities have positive effects on health and longevity.29 Health problems in youth may
influence adult VO2max and PA. Moreover, we do not have any information regarding
intensity and amount of PA outside school hours, or information if PE was taught by PE
specialists, at what dosage and at which level of education. Another limitation could be that
retrospective information on PE class participation and PA outside school hours may suffer
from recall bias. However, PE class participation might be a more definite decision which
may be easier to recall than hours per week of PA. However, any uncertainty of additional PA

Youth PA and adulthood PA, VO2max and health
16
hours outside school should be equal in all PA classes. Although the data collection was not
initially intended for research purposes, the standardization of procedures and quality control
is well suited for such analyses.
Conclusions
PE class participation, compared to not participating, was associated with more beneficial
perceived health, a more active life, higher VO2max and a better metabolic health in
adulthood in a sample of over 250.000 working Swedish men and women. Additional PA
outside school hours induced even stronger associations. When analysing the impact of age up
to 70 years, and hence time since leaving school, the associations were similar, with some
small variations between stages of adulthood. Joint analyses revealed that both youth PA and
current PA were important for reducing the probability of having poor health and being
obesity in adulthood. For those not participating in leisure time PA, PE class may provide an
important opportunity to engage in and try a diversity of activities which may promote a life-
long active and healthy life style. Though, it also seems essential to encourage previously
inactive individuals to engage in PA, as adulthood PA level regardless youth PA, decreased
probability of poor health and obesity.
Acknowledgement
The authors gratefully acknowledge the Health Profile Coaches from all over Sweden. A
special thanks to the members of staff at Health Profile Institute.
Funding Sources
None

Youth PA and adulthood PA, VO2max and health
17
References
1. Ekblom-Bak E, Olsson G, Ekblom O, Ekblom B, Bergstrom G, Borjesson M. The Daily Movement Pattern and Fulfilment of Physical Activity Recommendations in Swedish Middle-Aged Adults: The SCAPIS Pilot Study. PLoS One. 2015;10(5):e0126336.
2. Hagstromer M, Troiano RP, Sjostrom M, Berrigan D. Levels and patterns of objectively assessed physical activity--a comparison between Sweden and the United States. Am J Epidemiol. 2010;171(10):1055-1064.
3. Paffenbarger RS, Jr., Wing AL, Hyde RT. Physical activity as an index of heart attack risk in college alumni. Am J Epidemiol. 1978;108(3):161-175.
4. Byberg L, Melhus H, Gedeborg R, et al. Total mortality after changes in leisure time physical activity in 50 year old men: 35 year follow-up of population based cohort. BMJ. 2009;338:b688.
5. Karlsson MK, Nordqvist A, Karlsson C. Physical activity increases bone mass during growth. Food Nutr Res. 2008;52.
6. Kosti RI, Panagiotakos DB. The epidemic of obesity in children and adolescents in the world. Cent Eur J Public Health. 2006;14(4):151-159.
7. Ekblom O, Oddsson K, Ekblom B. Health-related fitness in Swedish adolescents between 1987 and 2001. Acta Paediatr. 2004;93(5):681-686.
8. Tammelin T, Nayha S, Hills AP, Jarvelin MR. Adolescent participation in sports and adult physical activity. Am J Prev Med. 2003;24(1):22-28.
9. Cleland V, Dwyer T, Venn A. Which domains of childhood physical activity predict physical activity in adulthood? A 20-year prospective tracking study. Br J Sports Med. 2012;46(8):595-602.
10. Cleland V, Dwyer T, Blizzard L, Venn A. The provision of compulsory school physical activity: associations with physical activity, fitness and overweight in childhood and twenty years later. Int J Behav Nutr Phys Act. 2008;5:14.
11. Huotari PR, Mikkelsson L, Kujala UM, Aakso LL, Nupponen H. Physical activity and fitness in adolescence as predictors of self-estimated fitness in adulthood. J Sports Med Phys Fitness. 2013;53(2):177-184.
12. Telama R, Yang X, Leskinen E, et al. Tracking of physical activity from early childhood through youth into adulthood. Med Sci Sports Exerc. 2014;46(5):955-962.
13. Jose KA, Blizzard L, Dwyer T, McKercher C, Venn AJ. Childhood and adolescent predictors of leisure time physical activity during the transition from adolescence to adulthood: a population based cohort study. Int J Behav Nutr Phys Act. 2011;8:54.
14. Rangul V, Bauman A, Holmen TL, Midthjell K. Is physical activity maintenance from adolescence to young adulthood associated with reduced CVD risk factors, improved mental health and satisfaction with life: the HUNT Study, Norway. Int J Behav Nutr Phys Act. 2012;9:144.
15. Andersson G. The importance of exercise for sick leave and percieved health.: Department of Preventive and Social Medicine, Linköping University; 1987.
16. Lilliecreutz Huitema E, Andersson G, Samuelsson K. Lifestyle changes with help from Health Profile Assessment in combination with support in individual interventions for persons with acquired brain injury – A pilot study. Eur J Physiother. 2014;16:151-158.
17. Astrand I. Aerobic work capacity in men and women with special reference to age. Acta Physiol Scand Suppl. 1960;49(169):1-92.
18. Phüse U, Gerber M. International Comparison of Physical Education: Concepts, Problems, Prospects. Meyer and Meyer Sport, Oxford.; 2005.
19. Kuh DJ, Cooper C. Physical activity at 36 years: patterns and childhood predictors in a longitudinal study. J Epidemiol Community Health. 1992;46(2):114-119.
20. Kraut A, Melamed S, Gofer D, Froom P, Study C. Effect of school age sports on leisure time physical activity in adults: The CORDIS Study. Med Sci Sports Exerc. 2003;35(12):2038-2042.

Youth PA and adulthood PA, VO2max and health
18
21. Hirvensalo M, Lintunen T, Rantanen T. The continuity of physical activity--a retrospective and prospective study among older people. Scand J Med Sci Sports. 2000;10(1):37-41.
22. Telama R. Tracking of physical activity from childhood to adulthood: a review. Obes Facts. 2009;2(3):187-195.
23. Ganna A, Ingelsson E. 5 year mortality predictors in 498,103 UK Biobank participants: a prospective population-based study. Lancet. 2015;386(9993):533-540.
24. DeSalvo KB, Bloser N, Reynolds K, He J, Muntner P. Mortality prediction with a single general self-rated health question. A meta-analysis. J Gen Intern Med. 2006;21(3):267-275.
25. Larsson L. Idrott och hälsa är ingenting för mig [Physical education and health is nothing for me] [Master], Swedish School of Sport and Health Sciences, Stockholm, Sweden; 2003.
26. Redelius K. Bäst eller pest? Ämnet idrott och hälsa bland elever i grundskolans senare år [Best or pest? The subject of physical education and sport among pupils in the later years of compulsory school]. In: Larsson H, Redelius K, eds. Mellan nytta och nöje. Bilder av ämnet idrott och hälsa [Between use and pleasure. Images of the subject physical education]: Swedish School of Sport and Health Sciences, Stockholm, Sweden; 2004.
27. Sandahl B. Ett ämne för alla? - Normer och praktik i grundskolans idrottsundervisning 1962-2002 [A subject for everyone?: norms and practice of compulsory physical education in Swedish schools 1962-2002] [PhD], Swedish School of Sport and Health Sciences, Stockholm, Sweden; 2005.
28. Bråkenhielm G. Ingen gympa för mig! – en undersökning av skälen till att elever inte deltar i ämnet idrott och hälsa [No physical education for me! - a study on the reasons to not participate in physical education]. Svensk Idrottsforskning. 2008;2.
29. Ekblom-Bak E, Ekblom B, Vikstrom M, de Faire U, Hellenius ML. The importance of non-exercise physical activity for cardiovascular health and longevity. Br J Sports Med. 2014;48(3):233-238.

Youth PA and adulthood PA, VO2max and health
19
Table 1a Characteristics of women in the study population (n=126,438).
No PE Class Only PE Class PE Class+PA 1-2 t/w PE Class+PA 3-5 t/w PE Class+PA ≥6t/w
n=1793 n=32449 n=51680 n=34134 n=6382
Age (years) 47 (37-54)a,b,c,d 49 (40-56)b,c,d 45 (36-54)c,d 40 (33-49)d 39 (31-47)
Relationship (Live together) 72%a,b,c,d 77% 77% 77% 76%
Level of education (Level 4) 22%b,c,d 22%b,c,d 29%c,d 32%d 38%
Overall health (Very poor/Poor) 11%a,b,c,d 8%b,c,d 6% 6% 6%
Overall stress (Very often/Often) 23%a,b,c,d 19% 19% 19% 18%
Diet habits (Very poor/Poor) 9%a,b,c,d 6%b,c,d 5% 5% 4%
Smoking habits (≥1 cig/day) 19%a,b,c,d 15%b,c,d 13%c,d 12%d 10%
Alcohol habits (Very poor/Poor)# 4% 3% 3% 3% 3%
Current exercise (≥1 time/week) 58%a,b,c,d 63%b,c,d 71%c,d 74%d 78%
Current commuting (≥10 min/day) 30% 29%b,d 31% 30%d 32%
VO2max (ml·min-1·kg-1) 32 (26-38)b,c,d 32 (27-38)b,c,d 34 (29-41)c,d 37 (31-44)d 39 (32-47)
BMI (kg·m-2) 25.1 (22.5-28.7)a,b,c,d 24.8 (22.4-27.9)b,c,d 24.2 (22.0-27.2)c,d 23.9 (21.7-26.7)d 23.6 (21.5-26.4)

Youth PA and adulthood PA, VO2max and health
20
Waist circumference (cm) 88.0 (79.0-99.3)b,c,d 86.0 (78.5-95.0)b,c,d 84.0 (77.0-92.0)c,d 82.0 (76.0-91.0) 81.0 (75.0-91.0)
Systolic BP (mmHg) 123 (112-135)b,c,d 125 (115-136)b,c,d 120 (110-132)c,d 120 (110-130)d 120 (110-129)
Diastolic BP (mmHg) 79 (70-85)b,c,d 80 (70-85)b,c,d 76 (70-82)c,d 75 (70-80)d 75 (70-80)
Taking heart medicine (Yes) 8% b,c,d 8% b,c,d 6% c,d 4% 4%
Data is presented as median (Q1-Q3) or %
aSignificant difference vs. Only PE class
bSignificant difference vs. PE class + PA 1-2 t/w
cSignificant difference vs. PE class + PA 3-5 t/w
dSignificant difference vs. PE class + PA ≥ 6 t/w
#The question was changed in 2011, see method section
PE class; Physical education class, BP; Blood pressure
Youth PA and adulthood PA, VO2max and health
21
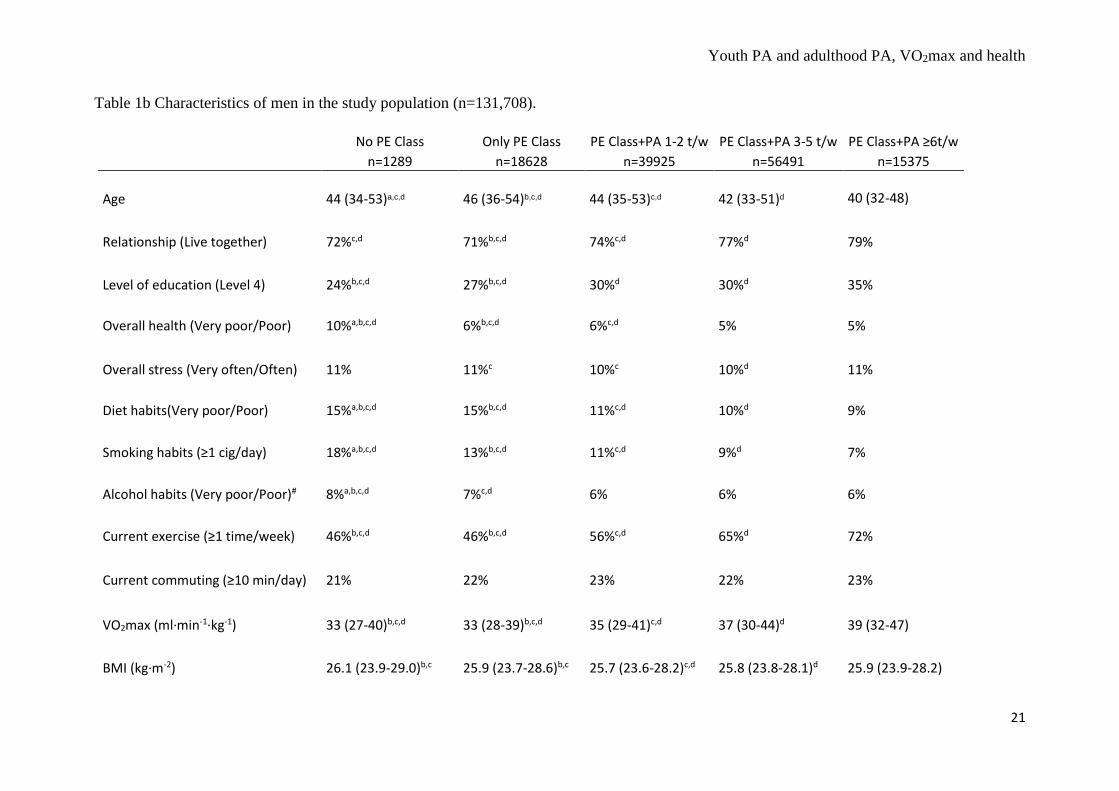
Table 1b Characteristics of men in the study population (n=131,708).
No PE Class Only PE Class PE Class+PA 1-2 t/w PE Class+PA 3-5 t/w PE Class+PA ≥6t/w
n=1289 n=18628 n=39925 n=56491 n=15375
Age 44 (34-53)a,c,d 46 (36-54)b,c,d 44 (35-53)c,d 42 (33-51)d 40 (32-48)
Relationship (Live together) 72%c,d 71%b,c,d 74%c,d 77%d 79%
Level of education (Level 4) 24%b,c,d 27%b,c,d 30%d 30%d 35%
Overall health (Very poor/Poor) 10%a,b,c,d 6%b,c,d 6%c,d 5% 5%
Overall stress (Very often/Often) 11% 11%c 10%c 10%d 11%
Diet habits(Very poor/Poor) 15%a,b,c,d 15%b,c,d 11%c,d 10%d 9%
Smoking habits (≥1 cig/day) 18%a,b,c,d 13%b,c,d 11%c,d 9%d 7%
Alcohol habits (Very poor/Poor)# 8%a,b,c,d 7%c,d 6% 6% 6%
Current exercise (≥1 time/week) 46%b,c,d 46%b,c,d 56%c,d 65%d 72%
Current commuting (≥10 min/day) 21% 22% 23% 22% 23%
VO2max (ml·min-1·kg-1) 33 (27-40)b,c,d 33 (28-39)b,c,d 35 (29-41)c,d 37 (30-44)d 39 (32-47)
BMI (kg·m-2) 26.1 (23.9-29.0)b,c 25.9 (23.7-28.6)b,c 25.7 (23.6-28.2)c,d 25.8 (23.8-28.1)d 25.9 (23.9-28.2)
Youth PA and adulthood PA, VO2max and health
22
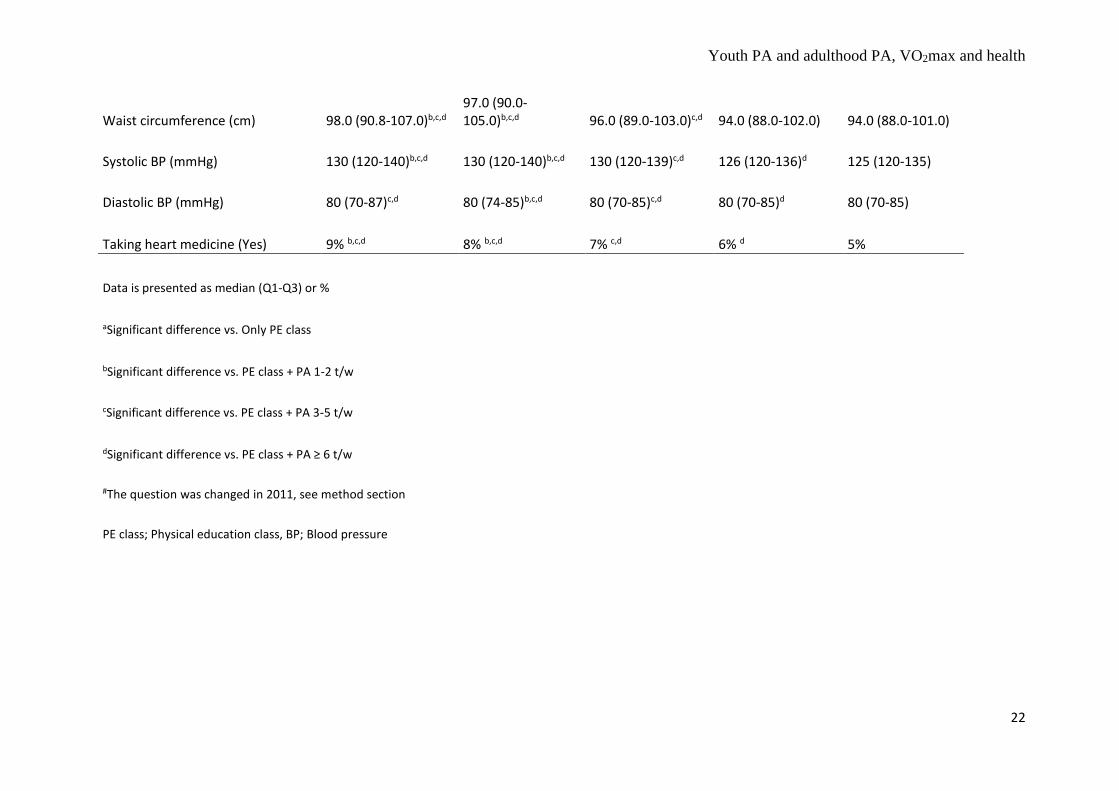
Waist circumference (cm) 98.0 (90.8-107.0)b,c,d 97.0 (90.0-105.0)b,c,d 96.0 (89.0-103.0)c,d 94.0 (88.0-102.0) 94.0 (88.0-101.0)
Systolic BP (mmHg) 130 (120-140)b,c,d 130 (120-140)b,c,d 130 (120-139)c,d 126 (120-136)d 125 (120-135)
Diastolic BP (mmHg) 80 (70-87)c,d 80 (74-85)b,c,d 80 (70-85)c,d 80 (70-85)d 80 (70-85)
Taking heart medicine (Yes) 9% b,c,d 8% b,c,d 7% c,d 6% d 5%
Data is presented as median (Q1-Q3) or %
aSignificant difference vs. Only PE class
bSignificant difference vs. PE class + PA 1-2 t/w
cSignificant difference vs. PE class + PA 3-5 t/w
dSignificant difference vs. PE class + PA ≥ 6 t/w
#The question was changed in 2011, see method section
PE class; Physical education class, BP; Blood pressure

Youth PA and adulthood PA, VO2max and health
23
Table 2a Odds ratio (95% CI) for different levels of physical activity prior to the age of 20 years of age in relation to dichotomized variables of
perceived health, exercise habits, VO2max and metabolic health in women.
No PE Class Only PE Class PE Class + PA 1-2 t/w PE Class + PA 3-5 t/w PE Class + PA ≥6t/w R2
Overall health Age-adjusted 1 0.68 (0.58-0.79) 0.57 (0.49-0.66) 0.53 (0.45-0.62) 0.53 (0.44-0.63) 0.002
(Very poor/Poor)
Lifestyle-adjusted 1 0.84 (0.71-0.99) 0.81 (0.68-0.96) 0.81 (0.69-0.97) 0.89 (0.73-1.09) 0.19
Current exercise Age-adjusted 1 1.27 (1.16-1.40) 1.82 (1.65-2.00) 2.21 (2.00-2.43) 2.71 (2.42-3.02) 0.02
(≥1 time/w)
Lifestyle-adjusted 1 1.17 (1.06-1.30) 1.58 (1.42-1.74) 1.87 (1.69-2.07) 2.21 (1.97-2.49) 0.11
Normal/High VO2max Age-adjusted 1 1.26 (1.12-1.41) 1.72 (1.53-1.94) 2.13 (1.89-2.40) 2.52 (2.20-2.88) 0.19
(≥32 ml·kg-1·min-1)
Lifestyle-adjusted 1 1.23 (1.09-1.39) 1.50 (1.33-1.70) 1.78 (1.58-2.01) 1.98 (1.83-2.27) 0.26
BMI (≥30) Age-adjusted 1 0.74 (0.65-0.83) 0.60 (0.53-0.67) 0.55 (0.49-0.62) 0.48 (0.41-0.55) 0.02
Lifestyle-adjusted 1 0.81 (0.71-0.91) 0.76 (0.67-0.86) 0.74 (0.65-0.85) 0.70 (0.60-0.81) 0.10
Waist circumference Age-adjusted 1 0.66 (0.50-0.87) 0.51 (0.39-0.67) 0.48 (0.37-0.63) 0.46 (0.35-0.61) 0.08
(≥88 cm)
Lifestyle-adjusted 1 0.74 (0.55-0.98) 0.64 (0.48-0.85) 0.65 (0.49-0.86) 0.67 (0.50-0.96) 0.18
Systolic BP (≥140 mmHg) Age-adjusted 1 0.93 (0.82-1.06) 0.83 (0.73-0.94) 0.75 (0.66-0.85) 0.71 (0.61-0.83) 0.21
Lifestyle-adjusted 1 0.95 (0.83-1.08) 0.89 (0.79-1.01) 0.83 (0.73-0.94) 0.82 (0.70-0.95) 0.22

Youth PA and adulthood PA, VO2max and health
24
Diastolic BP (≥90 mmHg) Age-adjusted 1 0.84 (0.74-0.97) 0.74 (0.65-0.85) 0.68 (0.59-0.79) 0.67 (0.57-0.79) 0.09
Lifestyle-adjusted 1 0.87 (0.76-0.99) 0.80 (0.70-0.92) 0.76 (0.66-0.87) 0.77 (0.65-0.91) 0.10
Heart Medicine (yes) Age-adjusted 1 0.94 (0.78-1.13) 0.81 (0.67-0.97) 0.71 (0.59-0.86) 0.66 (0.52-0.82) 0.14
Lifestyle-adjusted 1 0.96 (0.80-1.15) 0.87 (0.73-1.15) 0.79 (0.66-0.96) 0.76 (0.60-0.95) 0.15
Age-adjusted model; Adjusted for age and year performed
Lifestyle adjusted model; Additionally adjusted for overall stress, diet habits, smoking habits, alcohol habits, level of education, relationship,
current commuting and current exercise (when not evaluated as dependent variable).
PE class; Physical education class
Youth PA and adulthood PA, VO2max and health
25
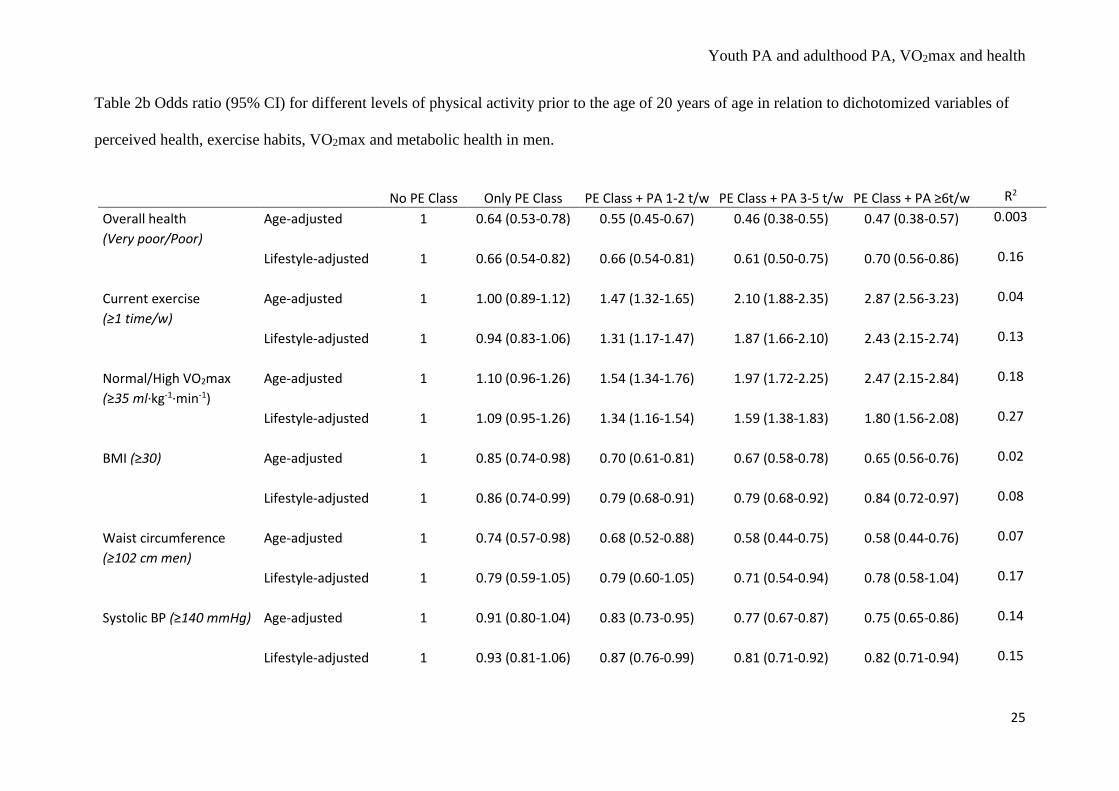
Table 2b Odds ratio (95% CI) for different levels of physical activity prior to the age of 20 years of age in relation to dichotomized variables of
perceived health, exercise habits, VO2max and metabolic health in men.
No PE Class Only PE Class PE Class + PA 1-2 t/w PE Class + PA 3-5 t/w PE Class + PA ≥6t/w R2
Overall health Age-adjusted 1 0.64 (0.53-0.78) 0.55 (0.45-0.67) 0.46 (0.38-0.55) 0.47 (0.38-0.57) 0.003
(Very poor/Poor)
Lifestyle-adjusted 1 0.66 (0.54-0.82) 0.66 (0.54-0.81) 0.61 (0.50-0.75) 0.70 (0.56-0.86) 0.16
Current exercise Age-adjusted 1 1.00 (0.89-1.12) 1.47 (1.32-1.65) 2.10 (1.88-2.35) 2.87 (2.56-3.23) 0.04
(≥1 time/w)
Lifestyle-adjusted 1 0.94 (0.83-1.06) 1.31 (1.17-1.47) 1.87 (1.66-2.10) 2.43 (2.15-2.74) 0.13
Normal/High VO2max Age-adjusted 1 1.10 (0.96-1.26) 1.54 (1.34-1.76) 1.97 (1.72-2.25) 2.47 (2.15-2.84) 0.18
(≥35 ml·kg-1·min-1)
Lifestyle-adjusted 1 1.09 (0.95-1.26) 1.34 (1.16-1.54) 1.59 (1.38-1.83) 1.80 (1.56-2.08) 0.27
BMI (≥30) Age-adjusted 1 0.85 (0.74-0.98) 0.70 (0.61-0.81) 0.67 (0.58-0.78) 0.65 (0.56-0.76) 0.02
Lifestyle-adjusted 1 0.86 (0.74-0.99) 0.79 (0.68-0.91) 0.79 (0.68-0.92) 0.84 (0.72-0.97) 0.08
Waist circumference Age-adjusted 1 0.74 (0.57-0.98) 0.68 (0.52-0.88) 0.58 (0.44-0.75) 0.58 (0.44-0.76) 0.07
(≥102 cm men)
Lifestyle-adjusted 1 0.79 (0.59-1.05) 0.79 (0.60-1.05) 0.71 (0.54-0.94) 0.78 (0.58-1.04) 0.17
Systolic BP (≥140 mmHg) Age-adjusted 1 0.91 (0.80-1.04) 0.83 (0.73-0.95) 0.77 (0.67-0.87) 0.75 (0.65-0.86) 0.14
Lifestyle-adjusted 1 0.93 (0.81-1.06) 0.87 (0.76-0.99) 0.81 (0.71-0.92) 0.82 (0.71-0.94) 0.15
Youth PA and adulthood PA, VO2max and health
26
Diastolic BP (≥90 mmHg) Age-adjusted 1 0.89 (0.77-1.02) 0.78 (0.68-0.90) 0.74 (0.65-0.86) 0.76 (0.65-0.88) 0.10
Lifestyle-adjusted 1 0.90 (0.78-1.04) 0.83 (0.72-0.96) 0.81 (0.70-0.93) 0.86 (0.74-0.99) 0.11
Heart Medicine (yes) Age-adjusted 1 0.83 (0.67-1.02) 0.74 (0.60-0.92) 0.72 (0.59-0.89) 0.65 (0.52-0.81) 0.18
Lifestyle-adjusted 1 0.83 (0.67-1.02) 0.76 (0.62-0.94) 0.75 (0.61-0.92) 0.68 (0.55-0.85) 0.18
Age-adjusted model; Adjusted for age and year performed
Lifestyle adjusted model; Additionally adjusted for overall stress, diet habits, smoking habits, alcohol habits, level of education, relationship,
current commuting and current exercise (when not evaluated as dependent variable).
PE class; Physical education class

Youth PA and adulthood PA, VO2max and health
27
Table 3 Odds ratio (95% CI) for different levels of physical activity prior to the age of 20 years of age in relation to dichotomized variables of
perceived health, exercise habits, VO2max and metabolic health in different age-groups.
Age No PE Class Only PE Class PE Class + PA 1-2 t/w PE Class + PA 3-5 t/w PE Class + PA ≥6t/w R2
Overall health 20-35 1 0.75 (0.57-0.99) 0.73 (0.56-0.96) 0.70 (0.54-0.92) 0.70 (0.52-0.93) 0.21
(Very poor/Poor)
36-50 1 0.80 (0.65-0.98) 0.79 (0.65-0.97) 0.77 (0.63-0.94) 0.96 (0.77-1.19) 0.19
51-70 1 0.73 (0.58-0.92) 0.70 (0.56-0.87) 0.68 (0.54-0.86) 0.70 (0.54-0.91) 0.14
Current exercise 20-35 1 0.86 (0.74-1.01) 1.28 (1.10-1.49) 1.92 (1.65-2.24) 2.74 (2.33-3.22) 0.14
(≥1 time/w)
36-50 1 1.11 (0.99-1.25) 1.49 (1.32-1.67) 1.90 (1.69-2.14) 2.38 (2.10-2.71) 0.13
51-70 1 1.17 (1.03-1.33) 1.58 (1.39-1.80) 1.93 (1.70-2.20) 2.17 (1.88-2.51) 0.12
VO2max 20-35 1 1.26 (1.05-1.52) 1.58 (1.32-1.89) 2.05 (1.71-2.45) 2.32 (1.92-2.80) 0.15
(Women >32 and
Men >35 ml·kg-1·min-1) 36-50 1 1.09 (0.95-1.25) 1.35 (1.18-1.54) 1.60 (1.40-1.83) 1.83 (1.58-2.10) 0.16
51-70 1 1.13 (0.95-1.34) 1.37 (1.15-1.63) 1.52 (1.28-1.81) 1.64 (1.36-1.97) 0.12
BMI (≥30) 20-35 1 0.87 (0.71-1.07) 0.73 (0.59-0.89) 0.64 (0.52-0.78) 0.59 (0.47-0.73) 0.11
36-50 1 0.86 (0.74-1.00) 0.78 (0.68-0.91) 0.79 (0.68-0.92) 0.83 (0.71-0.97) 0.17
51-70 1 0.79 (0.68-0.93) 0.77 (0.66-0.90) 0.80 (0.68-0.94) 0.87 (0.73-1.04) 0.19
Youth PA and adulthood PA, VO2max and health
28
Waist circumference 20-35 1 0.91 (0.60-1.38) 0.81 (0.54-1.22) 0.71 (0.47-1.06) 0.69 (0.46-1.05) 0.05
(Women ≥88 and Men ≥102 cm)
36-50 1 0.71 (0.52-0.98) 0.66 (0.48-0.91) 0.64 (0.47-0.87) 0.70 (0.50-0.96) 0.01
51-70 1 0.75 (0.53-1.06) 0.69 (0.49-0.97) 0.66 (0.47-0.92) 0.73 (0.51-1.04) 0.57
Systolic BP (≥140 mmHg) 20-35 1 0.82 (0.62-1.07) 0.76 (0.58-0.99) 0.64 (0.49-0.86) 0.65 (0.49-0.86) 0.08
36-50 1 0.88 (0.76-1.02) 0.78 (0.68-0.90) 0.73 (0.63-0.85) 0.76 (0.65-0.89) 0.08
51-70 1 1.03 (0.91-1.17) 0.99 (0.87-1.12) 0.94 (0.83-1.07) 0.94 (0.81-1.08) 0.05
Diastolic BP (≥90 mmHg) 20-35 1 0.75 (0.55-1.03) 0.65 (0.48-0.88) 0.64 (0.47-0.87) 0.64 (0.47-0.88) 0.06
36-50 1 0.90 (0.77-1.05) 0.77 (0.66-0.90) 0.75 (0.65-0.88) 0.80 (0.68-0.94) 0.07
51-70 1 0.91 (0.78-1.05) 0.89 (0.77-1.03) 0.85 (0.73-0.98) 0.90 (0.77-1.06) 0.03
Heart Medicine (Yes) 20-35 1 1.52 (0.61-3.75) 1.49 (0.61-3.65) 1.23 (0.50-3.00) 1.36 (0.54-3.41) 0.02
36-50 1 0.68 (0.54-0.86) 0.60 (0.48-0.75) 0.58 (0.46-0.73) 0.50 (0.39-0.65) 0.05
51-70 1 1.01 (0.85-1.21) 0.93 (0.79-1.11) 0.90 (0.76-1.07) 0.87 (0.72-1.05) 0.04
Adjusted for sex, age, performed year, overall stress, diet habits, smoking habits, alcohol habits, level of education, relationship,
current commuting and current exercise (when not evaluated as dependent variable).
PE class; Physical education class, BP; Blood pressure