Embed Size (px)
Citation preview

Poste Vita GROUP
Consolidated Financial Statements Management Report

2
INDEX
GROUP STRUCTURE
MANAGEMENT REPORT
Corporate Bodies of the Parent Company ………………………………………………………………4
Introduction………………………………………………………………………………………………….5
Reclassified Financial Statements and Key Management Indicators………………………………...6
Economic and Market Environment………………………………………………………………………9
Management trend summary……………………………………………………………………………..17
Industrial activity…………………………………………………………………………………………...20
Asset and Financial Management…………………………………………………………………….....26
Poste Vita Group’s organization……………………………………………........................................32
Risk Governance and Management System…………………………………………………………...38
Relationships with the Holding Company and with other Poste Italiane Group companies……….53
Other information…………………………………………………………………………………………..54
Significant Events occurred after Year-End……………………………………………………………..59
Outlook………………………………………………………………………………………………………60
CONSOLIDATED FINANCIAL STATEMENTS
Balance Sheet………………………………………………………………………………………………61
Income Statement………………………………………………………………………………………….63
Statement of Comprehensive Income…………………………………………………………………...64
Statement of Changes in Equity………………………………………………………………………….65
Statement of Cash Flows………………………………………………………………………………… 66
NOTES TO THE CONSOLIDATED FINANCIAL STATEMENT
Transition to International Financial Reporting Standards - Part A…………………………………..69
Basis of preparation and accounting standards - Part B……………………………………………….74
Notes to the Consolidated Balance Sheet - Part C…………………………………………………....100
Notes to the Consolidated Income Statement - Part D……………………………………………….116
Other information – Part E……………………………………………………………………………….124
Notes on transactions with Related Parties – Part F………………………………………………….126
REPORT OF THE INDEPENDENT AUDITORS………………………………………………………128
STATEMENT OF THE MANAGER IN CHARGE OF FINANCIAL REPORTING…………………131
APPENDIXES TO THE FINANCIAL STATEMENTS………………………………………………..133

GROUP STRUCTURE
The Insurance Group’s current structure is briefly described below as well as its scope of
consolidation.
The Parent Company Poste Vita almost exclusively operates in the Life insurance sector, and only
marginally in the Non-Life sector.
The scope of consolidation exclusively includes its subsidiary Poste Assicura S.p.A, an insurance
company founded in 2010 that operates in Non-Life insurance excluding the auto sector, 100%
owned by the Parent Company. This shareholding is totally consolidated.
The Parent Company also holds a minority interest in Europa Gestioni Immobiliari S.p.A., a
company operating in the real estate sector that manages and exploits Poste Italiane’s non-
operating assets. This shareholding is not fully consolidated and is valued with the equity method.
3

CORPORATE BODIES OF THE PARENT COMPANY BOARD OF DIRECTORS(1)
Chairman Roberto Colombo CEO Maria Bianca Farina Director Antonio Nervi Director Paolo Martella Director Pasquale Marchese Director Claudio Picucci Director Michele Scarpelli
BOARD OF AUDITORS(1)
Chairman Gianfranco Vignola
Statutory Auditor Francesco Caldiero Statutory Auditor Maurizio De Matteo Alternate Auditor Libero Candreva Alternate Auditor Mauro De Angelis
INDIPENDENT AUDITORS PricewaterhouseCoopers S.p.A.
1. The Board of Directors and the Board of Auditors were appointed on the Shareholder’s Meeting of May 20, 2011 and will remain
in office for three years, until the approval of the 2013 Financial Statements. The Chief Executive Officer was approved by the
Board of Directors in the Meeting of May 23, 2011.
4
INTRODUCTION
As part of the transaction aimed at the issuance of a subordinated loan expected by the first half
of 2014, the Poste Vita Group that includes the Parent Company Poste Vita S.p.A. and the
subsidiary Poste Assicura S.p.A. presents for the first time its consolidated financial statements for
the year ended as of December 31, 2013, drafted according to the IAS/IFRS international
standards issued by the International Accounting Standards Board (IASB). Such standards were
approved by the EU and are also based on the provisions of the Isvap Regulations (now IVASS)
no. 7 dated July 13, 2007 and subsequent modifications and integrations thereto. The Poste Vita
Group did not present any consolidated financial statements in the previous years, benefitting from
an exemption according to article 21, paragraph 1, of the above-mentioned ISVAP Regulations
(now IVASS) no. 7.
In order to provide exhaustive information according to the IAS/IFRS standards, comparative data
is presented for 2012, as well as the transition chart to the International accounting standards as
reported in the specific section of the Notes to the Financial Statements.
5

RECLASSIFIED FINANCIAL STATEMENTS AND KEY MANAGEMENT INDICATORS
The Reclassified Financial Statements and Key Management Indicators are reported here below:
(data in million Euros)
ASSETS 31/12/2013 31/12/2012
Investments 69,852.2 58,307.4 11,544.7 19.8%
Investments in subsidiaries, associated companies and joint ventures197.0 198.7 1.6 - -0.8%
Loans and receivables 11.5 102.1 90.7 - -88.8%
Available for sale financial assets 59,159.9 47,924.9 11,235.0 23.4%
Financial assets at fair value through profit or loss 10,483.8 10,081.7 402.1 4.0%
Amounts ceded to reinsurers from technical provisions 40.3 27.9 12.4 44.3%
tangible and intangible assets 13.5 7.3 6.2 85.4%
Receivables and other assets 2,097.6 1,846.6 251.0 13.6%
TOTAL ASSETS 72,003.6 60,189.2 11,814.4 19.6%
(data in million Euros)
LIABILITIES 31/12/2013 31/12/2012
Shareholders' equity 2,763.5 2,108.4 655.1 31.1%
Insurance provisions 68,005.2 56,770.9 11,234.3 19.8%
Provisions 10.1 8.6 1.4 16.7%
Payables and other liabilities 1,224.9 1,301.3 76.4 - -5.9%
TOTAL LIABILITIES 72,003.6 60,189.2 11,814.4 19.6%
Change
Change
RECLASSIFIED INCOME STATEMENT 31/12/2013 31/12/2012
Net premiums earned 13,200.2 10,535.6 2,664.6 25.3%
Gross earned premiums 13,234.4 10,561.9 2,672.5 25.3%
Earned premiums ceded (34.2) (26.3) (7.9) 30.1%
Fee and commission income 0.0 0.2 (0.2) -100.0%
Net financial income from assets related to traditional
products 2,195.1 1,796.3 398.8 22.2%
Net financial income from assets related to index and
unit linked products717.2 1,360.3 (643.1) -47.3%
Net change in insurance provisions (15,275.3) (12,996.5) (2,278.9) 17.5%
Claims paid (5,178.5) (5,548.5) 370.0 -6.7%
Change in insurance provisions (10,116.8) (7,459.6) (2,657.2) 35.6%
Reinsurers' share 20.0 11.6 8.4 72.7%
Investment management expenses (26.5) (21.5) (5.0) 23.4%
Acquisition and administration costs (369.9) (276.5) (93.4) 33.8%
Net commissions and other acquisition costs (329.8) (238.8) (91.0) 38.1%
Operating expenses (40.2) (37.7) (2.5) 6.5%
Other net revenues/costs (17.0) (18.7) 1.6 -8.8%
EBITDA 423.8 379.3 44.4 11.7%
Net financial income related to available assets 101.3 93.4 7.9 8.4%
Interest expenses on subordinated debts (18.5) (22.8) 4.4 -19.1%
EARNINGS BEFORE TAXES 506.6 449.9 56.7 12.6%
Income taxes (250.5) (176.4) (74.1) 42.0%
EARNINGS AFTER TAXES 256.1 273.5 (17.4) -6.4%
(data in million Euros)
Change
6

7

Dear Sirs,
The results obtained in 2013 were excellent, with a total gross earned premium exceeding €13.2
billion (+25.3% compared to 2012), despite a national and international macroeconomic context
characterized by ongoing uncertainty that consequently affected consumers’ expectations and
families’ saving capacity.
This confirmed the validity and effectiveness of the business model adopted by the Group that
aimed at increasingly enhancing its social role as an insurance market operator. Despite this
period of uncertainty regarding public protection and welfare and the family as a central figure for
providing social services, the Group has become a promoter in offering investment, saving and
protection services for maintaining and managing citizens’ welfare.
In 2013, the Life business continued its development, particularly regarding pensions allowing the
Group to consolidate its growth trend of the last three years and placing the Poste Vita pension
fund at the top of the ranking according to the total number of subscribers (over 630 thousand)
among all pension funds present in Italy.
Excellent results were also obtained in the Non-Life business, with commercial activities aimed at
developing a balanced collection among product lines (Property, Personal and Business) mainly to
cover the customers’ principal needs, also considering the current macro-economic situation.
Satisfactory results were achieved in financial management, while always maintaining a low-risk
profile for investments; at year-end, latent capital gains in portfolio amounted to nearly 3 billion
Euros. The segregated management of Posta Valore Più obtained a 4.19% gross return, while
Posta Previdenza Valore ended with 5.21%. Results obtained in managing the available assets
were positive and benefitted from the capital gains realized from the sale of government bonds.
The organizational structure underwent constant upgrading to allow reaching the growth and
innovation levels obtained and promoting an ongoing and diversified development of the
Company’s business and value.
Based on the above, the Consolidated Financial Statements submitted include gross profits equal
to € 506.6 m, an increase of € 56.8 m compared to 2012. However, it should be noted that
calculations for net profits for the period, equal to € 256.1 m (€ 273.4 m in 2012) were negatively
affected by the new tax measures introduced in November, that established an 8.5% IRES
surcharge for 2013, with additional tax expenses equal to nearly € 50m.
With reference to the Group’s solvency, in July and December, two capital increase transactions
were finalized for the Parent Company Poste Vita, both subscribed by the Holding Poste Italiane,
for a total of € 350m. The solvency ratio on a consolidated basis stood at 122%. Moreover, the
following paragraph “Significant Events occurred after Year-End” should be referred to regarding
the expected transaction for the issuance of a subordinated loan.
8

ECONOMIC AND MARKET ENVIRONMENT
The International Economy
In 2013, the global economy was characterized by limited growth, slightly lower than in 2012. The
most significant slowdown was registered in emerging countries, while industrial economies were
once again characterized by very different growth modalities. Among the major OECD countries,
the US continued their expansion, even though at a lower rate compared to 2012. Japan
maintained stable growth levels, while Europe continued to register a downturn that started
showing improvement only in the last months of the year, despite a significant decrease in its debt
crisis. Based on the most recent IMF’s estimates, global growth at the end of 2013 should settle at
approximately 2.9% (compared to 3.2% in 2012), again driven by emerging countries (4.5%), while
the major OECD countries should follow a more balanced trend: US +1.6%, Europe -0.4%, Japan
+2.0% (IMF Source, World Economic Outlook, October 2013).
The year just ended was once again characterized by significant activity on the part of central
banks, due to the implementation of various direct and indirect monetary policy measures within a
scenario of overall inflation slowdown, mainly in advanced economies.
On the other hand, the absence of inflationary risks was determined by a weak demand,
particularly in Europe, where price trends registered a marked deceleration mostly in the last two
quarters of 2013, and especially in periphery countries, mainly due to low rate of consumer
spending and more generally to a consistent appreciation of Euros against principal global
currencies and to raw material price trends.
In the US, mainly due to a series of restrictive tax measures, the economic expansion rate
decreased compared to 2012 (1.7% vs. 2.8%), while business confidence indexes and the real
estate sector continued to recover. This situation was aided by the slow yet constant improvement
of the labor market, which in 2013 registered a gradual increase in the number of jobs (standing at
nearly 200 thousand units per month, reducing the unemployment rate at the end of 2013 to 7%
(compared to 8% at the beginning of the year). Within this scenario, the inflation trend remained
below the 2% target set by the Fed, due to the moderate increase of salaries and unit labor costs.
The US economy’s general improvement in the last months of the year led the Federal Reserve to
announce its exit from Quantitative Easing, while maintaining an accommodative policy. In 2013,
Democrats and Republicans clashed on the approval of the federal budget and overrunning the
debt limit. Difficulties in reaching an agreement on rising the public debt limit led to the temporary
closure of the federal public sector in the first weeks of October, with the risk of having potentially
negative impacts on the growth trend. The agreement on increasing the public debt limit was
reached in mid-October, determining immediately resuming federal activities; the effects of the
suspension of activities were not significant.
In Japan, growth in 2013 stood at nearly 2% (stable compared to 2012), supported by the positive
effects of Abe’s economic policy, as demonstrated by the significant recovery of the Tankan index,
which stood back at the highest levels of the last 5 years.
In China, in 2013, growth stood, on average, at higher levels than in other emerging Asian
countries, essentially stable compared to 2012 (7.6%). The increase in exports and consumption
allowed offsetting the investment slowdown, particularly private investments. As planned by the
authorities, the increase in the domestic demand is favoring a balance in accounts with foreign
9

countries: the current account surplus decreased from over 10% to 3%. Inflation also gradually
decreased, standing between 2 and 3%, while the unemployment rate stood below 4%.
The Eurozone continued to have a weak economic growth (-0.4%) in most member countries,
despite the considerable reduction of negative effects related to the debt crisis. 2013 marked the
end of the recession that begun in 2011, also thanks to small recovery signs in periphery countries
as of the second quarter, later confirmed during the third quarter. GDP results technically
interrupted the recession both in Spain and Italy (despite closing 2013 respectively with -1.3% and
-1.8%). At year-end, Ireland (+0.6% at the end of 2013) officially exited the International bailout
program; encouraging signs came from Portugal (-1.8%). Despite a temporary weak phase in the
first months of the year, Germany (+0,5%) showed a step up in its economy, confirmed by leading
economic indicators, and a good performance despite a strengthened Euro. In the UK, 2013 was
characterized by a sharp economic recovery (1.4%). Growth was a surprise in all main sectors
(residential investments, consumption, exports and corporate investments), despite the fact that
budget and public debt levels continued to be worrying and the labor market did not significantly
improve. The unemployment rate decreased slowly and went back below 7.5% only at the end of
2013. Elements of Eurozone growth were negatively impacted by public spending, though less
than in 2012, and affected by restrictive tax policies implemented in all major countries; private
expenditures were affected by a decrease in consumer purchasing power deriving from both a
decrease in labor income and employment (that continued to drop until the third quarter of 2013).
Foreign demand was the only element that did not drop last year. Within this scenario, inflation
continued to decrease, particularly in the last two quarters and mainly in periphery countries,
standing below 1% at the end of 2013, well below ECB targets. Fears of a deflationary trend
caused ECB to act directly on the reference rate, (decreasing it from 0.75% to 0.5% in May and
from 0.5% to 0.25% in November), thus increasing chances of further action by the ECB with
nontraditional monetary instruments. These include long-term refinancing operations to banks
(LTRO) to support conditions for the supply and demand of credit for businesses and families, with
10

the objective of improving the transmission of monetary policy and lowering the level of bank
fragmentation.
In Italy, 2013 ended with a -1,9% negative economic growth, thus marking a second consecutive
year of recession, lesser compared to 2012 (when the GDP decreased by -2,5%). Supported by
exports and by stock replenishment, the GDP interrupted its drop only in the third quarter of 2013.
In December, business confidence indexes were on the rise, standing at the same levels of early
2011, projecting an improvement in industrial activities also for early 2014, even if strongly affected
by a weak domestic demand due to the fragile labor market, by disposable income trends and by a
credit crunch. Within this scenario, the trend growth of consumer prices1 decreased from 2.4% in
January to 0.7% in December, affected by both a drop in energy prices and a by weak domestic
demand.
1 Measured according to FOI (National consumer price index for blue- and white collar worker households).
11

Financial Market Trend
In 2013, the Eurozone bond market was characterized by a narrowing of the spread of peripheral
versus core government bonds with any maturities, as a combined effect of the overall decrease of
peripheral bond returns and of the increase of the German bond returns. The downward trend of
peripheral countries’ returns is attributed mostly to purchases made by domestic investors, but
also to an increasing interest by non-domestic investors, looking for higher returns in the European
Monetary Union’s reduced break up risk scenario. After an early stage where the spread of
periphery countries increased (the BTP-Bund spread on 10-year maturities reached its peak in
March 2013 at 350 basis points, in a context of increasing returns), in spring, the ECB’s decision to
implement additional monetary easing measures favored a reversal in the spread’s trend. In May,
the 25 basis point reduction in the reference rate (from 75 to 50 basis points) coincided with the
minimum annual returns both for 10-year BTPs (3.76%) and for 10-year Bunds (1.16%).
12

Following macroeconomic data improvement in the US, the Federal Reserve announced a
possible reduction in the purchase of government bonds as of the year’s last quarter (tapering):
this resulted in a sale phase of US government bonds and a subsequent increase in returns in the
EU, both for bonds issued in core countries and in peripheral countries. Afterwards, the Federal
Reserve eased the timeframe for the beginning of tapering, emphasizing that removal of
expansion stimuli will take place gradually, thereby reassuring investors on the long-term keeping
of zero interest rates. Despite this, US government bond returns only showed a partial variation,
maintaining the overall upward trend accentuated by the announcement, during the December
meeting, that tapering would start as of January 2014. The increase in US government bond
returns, combined with an improvement in EU macroeconomic data, led to a rate rise in German
government bonds, where, during the year, the ‘flight to quality’ effect characterizing the 2011-
2012 period was progressively reduced. During 2013, market uncertainty decreased significantly
both for core and for peripheral bonds, also due to a lower impact of potential crisis outbreak
compared to the recent past. In particular, the need for a bailout plan for Cyprus and Slovenia at
the beginning of the year, uncertainty on the outcome of Italy’s political elections, negotiations to
grant another bailout installment to Greece and, lastly, Portugal’s potential political crisis last July,
led to rises in returns that were however limited in amount and duration. At the same time the ECB
committed to keep the cost of money low for a lengthy period of time (‘forward guidance’), thus
leading to an additional cut in the reference rate in November (from 50 to 25 basis points), aimed
at stopping the downturn trend of inflation determined by the continuing consumption drop and
severe tax measures (particularly in Europe’s peripheral countries). The yield on ten-year bund,
from 1.3% in January 2013, reached their all time low of 1.17% in June coinciding with the
consolidation process slowdown at European level. The year ended at 1.9%, with a 60 bps
increase.
10-year btp returns decreased from 4.5% in January 2013 to 4.1% at the end of December, while
2-year btp returns from 2% at the beginning of the year to 1.3% at year-end. The return curve
flattened during the year, due to a strong demand from domestic and foreign investors linked to a
decrease in credit risk perception due to ECB’s actions and to an improvement in the fundamental
elements. The btp – bund spread on 10 year maturities consequently decreased from 318 bps at
the beginning of 2013 to 219 bps at year-end.
13

In 2013, the stock markets positive trend that had started in 2012 continued, and some listings,
i.e. US and Germany, reached new historical peaks, (Dow Jones above 16,000 points, S&P500
above 1,800 and Dax above 9,600 points). Reasons for the market increase were mainly linked to
expansionary monetary policies carried out by the main central banks who injected high cash
amounts into the system, and to a progressive improvement of the macro scenario in some major
global economies.
Despite easing tensions in Europe regarding the sovereign debt of peripheral and some core
countries, the European listings’ performance was positive, yet lower than those registered in the
US and Japan, due to the weak macroeconomic context. An exception to this was the German
stock market reaching its historical peak above 9,600 points. This result was due to a relatively
more solid economic recovery and by Angela Merkel’s reelection as government head in April’s
political elections.
Japan’s brilliant stock market trend, that reached 16,175 points, its best performance since
November 2007, is mainly attributable to the extraordinary expansionary monetary policy
measures announce by Japan’s Central Bank (BoJ) in April (a new significant asset purchase
program), to the implementation of a new Abe government reform plan aimed at relaunching the
economy and to a weak yen which favored exports. In China, the economy slowdown continued,
with growth standing at 7.6% in 2013, lower that the 7.7% rate of 2012, but higher than the
expected 7.5% rate. Even if China continued to have high growth rates, it was almost half what it
was in 2009 (14.2%), decreasing for the third consecutive year. Among the reasons for the
reduction are an increase in labor costs, environmental problems, a weak global demand and an
excessive production capacity in certain sectors.
With regard to currencies, in particular the Euro, in 2013, a different trend was registered in the
first half compared to the second half of the year. In the first six months, the Euro was relatively
weak and, after reaching its peak above 1.37 at the beginning of the year, it started a decline in the
following months. However, the trend was not uniform and the Euro rose again to nearly
1.28/1.30. The second part of the year was characterized by a gradual appreciation of the
European currency supported by positive macro European data (even though it was not
unidirectional) during the summer, leading to a return of foreign investors; subsequently, the
currency was supported by the introduction of the ECB’s forward guidance (with favorable
monetary conditions maintained as well as low rates) and by the increasing possibility of the US
beginning tapering.
In 2014, global expansion is expected to continue, even though at a moderate pace. Emerging
countries, particularly China, should undergo a structural economic reform process in order to
achieve a more balanced development. However, such process could cause an additional growth
slowdown, at least temporarily. Despite the above, having the Eurozone definitely overcome
recession, the US situation improvement with Japan consolidating its economic cycle should favor
a recovery in the global trade, thus subsequently providing positive inputs to emerging economies.
In this scenario, inflationary pressures should continue to be limited, since the system’s abundant
liquidity does not seem to threaten a price overheating. This holds truth, in particular, for the
Eurozone where, even though the situation is improving, the context is still weak, requiring
favorable action by the ECB, perhaps including additional expansionary monetary policy
measures, both traditional and nontraditional. Priority is given to recovering the credit market which
would allow better monetary policy implementation, and lower the level of bank fragmentation. In
14

this scenario, ECB efforts in defining and carrying out a Comprehensive Assessment of bank
budgets in the Eurozone were fundamental. This assessment started in November 2013 and will
be completed by November 2014.
Insurance Market Trend
Total premiums collected in 2013 in Life and Non-Life classes amounted to € 119 billion, rising by
13% compared to the previous year and significantly recovering the 2011 reduction.
Life Classes
In the difficult macroeconomic context that affected Italy once again in 2013, the insurance market
registered a decidedly positive trend. A forecast based on early available data, shows that total
turnover of companies operating in Italy (Italian, extra EU and EU) should be equal to nearly € 85
billion, +18.1% compared to 2012. If this figure is confirmed, it would represent the highest Life
Class turnover ever, after the record-breaking € 91 billion collection in 2010, as well as a trend
reversal compared to the decrease registered in both 2011 and 2012 ( an average of -11% in the
period).
This result can essentially be attributed to approximately € 74 billion in new collection (+31%) and
to nearly € 12 billion of premiums related to subsequent yearly installments (+2%) issued in 2013,
but referring to contracts written in previous years. The new collection’s important growth is mainly
attributable, for 16% of its total amount, to € 12 billion (+38%) of premiums issued by EU
companies operating in Italy under the LPS- Freedom to Provide Services system, essentially
belonging to Italian banking and insurance groups but not subject to the same regulatory systems
as Italian companies, particularly with regard to distribution.
In addition to the EU companies, the large growth result of the new collection was significantly
favored by the “postal” channel (that increased its market share from 14.6% in 2012 to 15,5% in
2013) as well as by the “Insurance banking” channel that represented nearly 44% of the total Life
collection. A positive growth – even if lower compared to the market average – was obtained by
the “agent” channel (+6.8%) with an incidence on the total collection dropping to nearly 23.6%
compared to 27% in 2012. On the other hand, collection in the “promoter” channel also dropped
(by nearly -15% ) after the significant growth registered in 2012.
Regarding the new collection’s structure, Class I increased by 36%, accounting for nearly two
thirds of the total new premiums. Class III increased at a slower pace compared to the average
increase (+22%) and slightly reduced its share to one third of the total amount. A little less than
80% of this Class’ collection, equal to nearly € 19.5 billion in absolute value, was attributable to
products such as “Unit-linked” policies, mainly sold by the bank channel (+57%, € 5.3 billion in
absolute value). The collection of the so-called “Protected Unit-Linked policies” soared, reaching €
4.2 billion in absolute value, of which 3.2 sold by companies operating under the LPS- Freedom to
Provide Services system. “Index Linked” policies collection was irrelevant and essentially these
policies are no longer distributed in Italy.
Total policies sold in 2013 were equal to nearly 3.3 million contracts (+9% compared to 2012).
Pure risk policies continued to decrease, by -2.2%, which added to -13% registered in 2012,
accounting for 17% of the total. Supplementary pension plans also showed a decline and for the
first time in years, the collection of new individual pension plans dropped by nearly two percentage
15

points, standing at 356,000 in absolute value. Contract collection in Class IV, relative to critical
illness insurance policies, was absolutely insignificant, with slightly more than 30,000 contracts
sold throughout the year, less than 1% of the total.
Based on the type of offers, the single premium collection accounted for slightly more than 50% of
new contracts and for nearly 95% of the new premiums group, with a significant increase in the
average premium that rose to € 42k against € 26k in 2012. The other 50% of contracts had
recurrent premiums for lower amounts which however allowed operators to automatically rely on a
high number of new premiums in future years.
General data analysis shows a few conflicting aspects. The figure growth seems to be structurally
solid, with a more defined trend not depending on “technical rallies”. The Class mix is once again
more balanced compared to the past, as well as the mix between annual premium and single
premium policies. Less positive aspects were found regarding the market of the most typical
insurance policies with an immediate social importance that registered a decline. This is formed by
risk protection insurance against risks linked to ageing – pensions and non self-sufficiency – on
which an inadequate activity was carried out by both the bank channel, with a few important
exceptions, and by the financial promoter channel. Good results were instead obtained in this
segment by traditional channels. However, their contribution was nonetheless limited in absolute
value compared to the size of the social need expressed by the demand. On the whole, the Life
market seemed to have found its own balance and growth. In 2013, however, this market did not
show its ability to effectively play the role of “third pillar” that the new welfare system expected, on
the basis of which the most economically relevant issues were expected to be fully integrated
between the public and the private sector, being our country undeniably heading in the latter’s
direction.
Non-Life Classes
Non-Life classes ended 2013 with a collection reduction. Data pertaining to Italian and extra EU
companies indicated collection volumes of nearly € 33.7 billion, showing a nominal value
reduction of 4.9% compared to 2012.
In 2013, premium collection for classes not linked to the auto business reached € 15 billion,
essentially in line compared to 2012. With reference to the main aggregates, collection relative to
Personal Accident Insurance (Injury and Illness) was essentially stable as was Property Insurance
(Fire and other damages); classes that were mostly linked to the economic situation (Auto, more
Commercial) registered a significant reduction, while the general Third Party Liability insurance
rose also thanks to insurance obligations introduced in various professional categories. Legal
Protection and Counseling classes also rose, confirming a multi-year positive trend attributable to
the increasing diffusion of this coverage in various areas. With reference to distribution trends, the
main 2013 element was the increase in the amount dealt with by banks and post offices, which
rose to over 6% after the contraction registered in 2012, as a result of the sharp production
slowdown linked to the disbursement of mortgages and loans.
Forecasts for 2014 do not generally expect a collection increase in the Non-Life sector. Price
reductions continue to condition the development of Third Party Liability insurance, also affected
by various regulatory measures aimed at reducing the Automobile Third Party Liability insurance
(such as the possibility of installing a car black box upon signing the contract; the possibility of
including a clause prohibiting the transfer of damage rights to third parties without the insurer’s
consent, etc); moreover, the significant stagnation expected for the car market will not represent
16

an expansionary driver for the element linked to auto body repair insurance. The Non-Life, Non-
Auto sector foresees a moderately positive trend, equal to 1.5% in nominal terms, dropping to
below 1% for Italian and extra EU companies. Positive expectations mainly concern home
insurance characterized by an increasing spread of risk perception, while business insurance
should still be affected by the continuously complex economic situation. Within this context,
distribution through banks and post offices is expected to increase further.
MANAGEMENT TREND SUMMARY
Group activity is divided into two business areas: Life and Non-Life. The Group’s main activity is
carried out by the Parent Company Poste Vita in the “Life” sector, while “Non-Life” activity is
carried out by the subsidiary Poste Assicura and, marginally, also by Poste Vita.
(data in million Euros)
RECLASSIFIED INCOME STATEMENT
Non-life insurance Life insurance Total Non-life insuranceLife insurance Total
Net premiums earned 38.7 13,161.5 13,200.2 28.1 10,507.6 10,535.6
Gross earned premiums 61.8 13,172.6 13,234.4 45.3 10,516.7 10,561.9
Earned premiums ceded (23.1) (11.1) (34.2) (17.2) (9.1) (26.3)
Fee and commission income 0.0 0.2 0.2
Net financial income from assets related to traditional products 3.2 2,191.9 2,195.1 2.9 1,793.4 1,796.3
Net financial income from assets related to index and unit linked
products717.2 717.2 1,360.3 1,360.3
Net change in insurance provisions (14.7) (15,260.6) (15,275.3) (9.1) (12,987.4) (12,996.5)
Claims paid (12.5) (5,166.0) (5,178.5) (8.9) (5,539.6) (5,548.5)
Change in insurance provisions (9.9) (10,106.9) (10,116.8) (6.7) (7,452.9) (7,459.6)
Reinsurers' share 7.7 12.3 20.0 6.6 5.0 11.6
Investment management expenses (0.3) (26.2) (26.5) (0.2) (21.4) (21.6)
Acquisition and administration costs (12.4) (357.5) (369.9) (12.4) (264.1) (276.5)
Net commissions and other acquisition costs (4.7) (325.0) (329.8) (6.0) (232.8) (238.8)
Operating expenses (7.6) (32.5) (40.2) (6.5) (31.2) (37.7)
Other net revenues/costs (2.1) (14.9) (17.1) (0.9) (17.8) (18.6)
EBITDA 12.4 411.3 423.7 8.4 370.8 379.3
Net financial income from available assets 101.3 101.3 93.4 93.4
Interest expenses on subordinated debts (18.5) (18.5) (22.8) (22.8)
EARNINGS BEFORE TAXES 12.4 494.2 506.6 8.4 441.4 449.9
Income taxes (5.1) (245.4) (250.5) (2.6) (173.9) (176.4)
EARNINGS AFTER TAXES 7.3 248.8 256.1 5.9 267.6 273.4
2013 2012
17

Life Business
Data in mill ion Euros
RECLASSIFIED INCOME STATEMENT
31/12/2013 31/12/2012
Net premiums earned 13,161.5 10,507.6 2,654.0 25%
Gross earned premiums 13,172.6 10,516.7 2,656.0 25%
Earned premiums ceded (11.1) (9.1) (2.0) 22%
Fee and commission income 0.2 (0.2) -100%
Net financial income from assets related to traditional products 2,191.9 1,793.4 398.5 22%
Net financial income from assets related to index and unit linked
products717.2 1,360.3 (643.1) -47%
Net change in insurance provisions (15,260.6) (12,987.4) (2,273.2) 18%
Claims paid (5,166.0) (5,539.6) 373.6 -7%
Change in insurance provisions (10,106.9) (7,452.9) (2,654.0) 36%
Reinsurers' share 12.3 5.0 7.3 146%
Investment management expenses (26.2) (21.4) (4.8) 27%
Acquisition and administration costs (357.5) (264.1) (93.5) 34%
Net commissions and other acquisition costs (325.0) (232.8) (92.2) 42%
Operating expenses (32.5) (31.2) (1.3) 6%
Other net revenues/costs (14.9) (17.8) 2.8 -17%
EBITDA 411.3 370.8 40.5 11%
life insurance
Change
With reference to the production and portfolio trend, as indicated earlier, in 2013, earned
premiums, net of the reinsurance share, reached € 13,162m at year-end, rising by 25.3%
compared to € 10,508m in 2012.
Net financial income relative to assets related to traditional products amounted to € 2,192m, on the
rise compared to € 1,793m in 2012 thanks to the increase in the amounts traded. Coverage for
index and unit linked products showed positive financial results in 2013 for nearly € 717m, almost
entirely reflected in the corresponding technical provision variation.
The change in the insurance provision, equal to € 10,107m (€ 7,453m in 2012), mainly refers to
the increase in insurance liabilities linked to the aforesaid commercial trends and to the
corresponding revaluation based on the positive financial results obtained.
Settlements for insurance services to customers in the period were equal to nearly € 5.2 billion and
included policy expirations for nearly € 2.2 billion. With regard to surrenders, data indicates a total
of nearly € 2.4 billion, in line with 2012 data. The impact of surrenders, with respect to the initial
reserves, is around 4.3%, down from 4.9% in 2012 and much lower than the market average.
The intermediary Poste Italiane received commissions for distribution and collection activity equal
to nearly € 339m (€ 244m as of December 31, 2012), with an accrual of € 325m (€ 233m as of
December 31, 2012). Total operating costs amounted to € 33m, a 6% increase compared to € 31m
in 2012, due to both the strengthening of the workforce and to costs incurred during the year
relative to major IT projects aimed at a functional/infrastructural upgrade of the most important
business supporting systems.
18

Non-Life Business
Data in mill ion Euros
RECLASSIFIED INCOME STATEMENT
31/12/2013 31/12/2012
Net premiums earned 38.7 28.1 10.6 38%
Gross earned premiums 61.8 45.3 16.6 37%
Earned premiums ceded (23.1) (17.2) (5.9) 35%
Fee and commission income 0.0
Net financial income from assets related to traditional products 3.2 2.9 0.3 11%
Net financial income from assets related to index and unit linked
products0.0
Net change in insurance provisions (14.7) (9.1) (5.7) 71%
Claims paid (12.5) (8.9) (3.6) 44%
Change in insurance provisions (9.9) (6.7) (3.2) 47%
Reinsurers' share 7.7 6.6 1.1 17%
Investment management expenses (0.3) (0.2) (0.1) 44%
Acquisition and administration costs (12.4) (12.4) 0.1 11%
Net commissions and other acquisition costs (4.7) (6.0) 1.2 -22%
Operating expenses (7.6) (6.5) (1.2) 23%
Other net revenues/costs (2.1) (0.9) (1.3) 146%
EBITDA 12.4 8.4 3.9 30%
Non-life insurance
Change
Annual portfolio premiums for Non-Life Business referred to policies sold in 2013 amounted to
nearly € 42.5 m. Moreover, considering the characteristics of Poste Assicura S.p.A.’s portfolio,
which provide that 92% of the premium payments related to the “Protezione beni & patrimonio”
(Goods and Property protection) Line and “Persona” (Personal) Line be paid in monthly
installments, premiums issued in 2013 amounted to € 71.4 m. In terms of accrual accounting, due
also to the premium variation (calculated pro rata temporis based on each product’s contract
duration as a portion of premiums issued, detracting acquisition expenses) this means that
premiums issued in 2013 amounted to nearly € 61.8 m (€ 38.7 m net of reinsurance).
During the year, charges for claims were equal to € 22.4 m. This figure refers to the provisions for
outstanding claims during the year (including provisions for claims incurred but not reported), equal
to € 9.9 m, and to claims paid including settlement charges, amounting to nearly € 12.5 m during
the year. Considering the reinsurance portion, equal to € 7.7 m, the variation in technical
provisions amounted to € 14.7 m at year-end.
The intermediary Poste Italiane received commissions for distribution and fund collection activities
for nearly € 15m (€ 11m as of December 31, 2012), that, net of reinsurance commissions and the
variation in deferred acquisition costs registered in the period, amounted to a total of € 4.7 m (€ 6m
as of December 31, 2013)
Operating costs were equal to € 7.6 m (€ 6.5 m as of December 31, 2012) and referred to the
development of the Group’s organizational structure. Moreover, implementation activities of the
current IT system continued.
19

INDUSTRIAL ACTIVITY
Business trends
With reference to the production and portfolio trend, as indicated earlier, in 2013, earned
premiums, net of the reinsurance share, reached € 13,200.2 m at year-end, rising by 25.3%
compared to € 10,535.6 m in 2012. Premium details, according to Life and Non-Life sectors, are
included here below:
31/12/2013 31/12/2012
Class I 13,029.8 9,392.3 3,637.5 38.7%
Class III 79.2 1,097.8 (1,018.6) (92.8%)
Class IV 0.8 0.1 0.7 1340%
Class V 62.9 26.5 36.4 137.0%
“Life” gross premiums 13,172.6 10,516.7 2,656.0 25.3%
Life premiums ceded to reinsurers (11.1) (9.1) (2.0) 21.8%
“Life” total net earned premiums 13,161.5 10,507.5 2,654.0 25.3%
“Non-life” gross premiums 71.4 51.2 20.1 39.3%
Earned premiums ceded (23.6) (17.5) (6.0) 34.4%
Change in provision for unearned premiums (9.6) (6.0) (3.6) 59.6%
Change in the reinsurers' provision for unearned premiums 0.4 0.3 0.1 30.5%
“Non-life” total net earned premiums 38.7 28.1 10.6 37.9%
Total net earned premiums 13,200.2 10,535.6 2,664.6 25.3%
(data in million Euros)
Change
Life Business
As previously mentioned, considering the economic context in which the Group has been
operating, Life insurance commercial results were excellent, with a total production of € 13,173 m
(+25.3% compared to 2012) which allowed the Group to consolidate the growth trend of the last
three years. Considering also that Italian market production stood at nearly € 85 billion, in terms of
market share on total premiums, the market share rose from 14.6% in 2012 to the 15.5%
expected at the end of 2013.
The composition of gross “Life” premiums was as follows:
“Life” gross premiums composition 31/12/2013 31/12/2012
Periodical premiums 814.8 559.6 255.2 45.6%
- of which first annuity 305.3 162.7 142.6 87.6%
- of which subsequent annuities 509.5 396.9 112.6 28.4%
Single premiums 12,357.8 9,957.1 2,400.7 24.1%
Total 13,172.6 10,516.7 2,655.9 25.3%
(data in million Euros)
Change
20
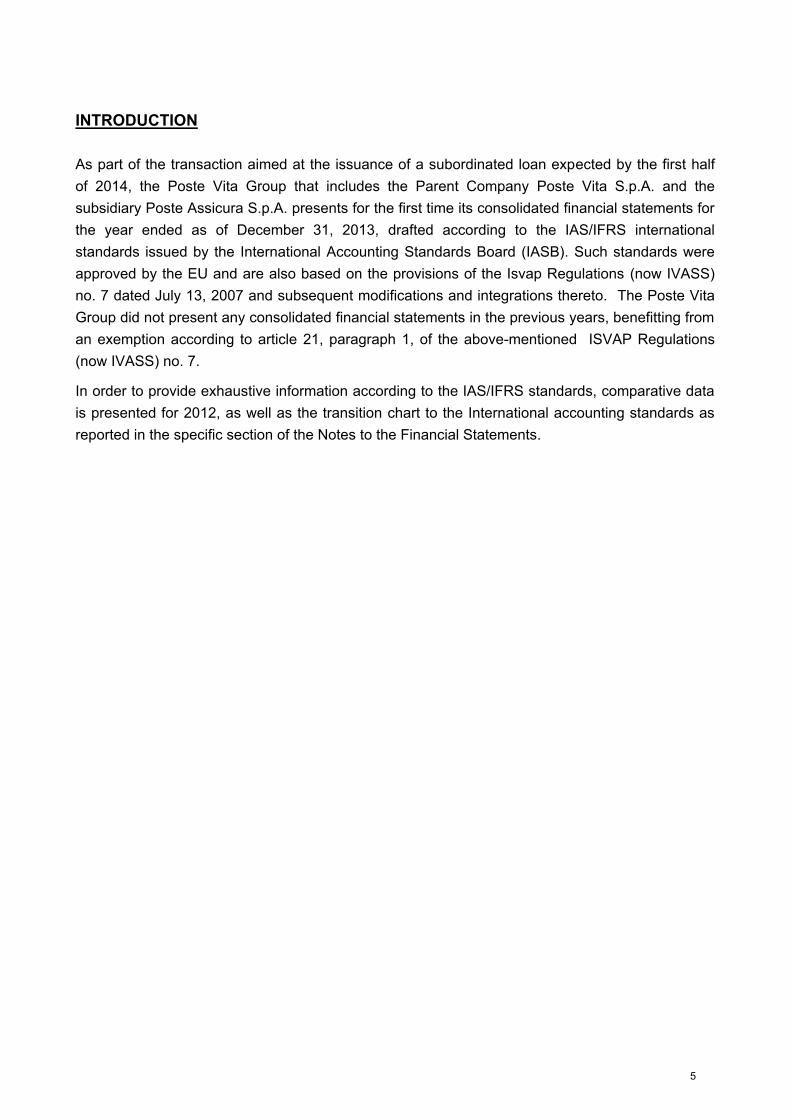
The following table includes new production details, for a total of € 12,662m, increasing by 24.5%
compared to € 10,168m in 2012.
New production 31/12/2013 31/12/2012
Class I 12,519.1 9,043.4 3,475.8 38.4%
Class III 79.2 1,097.8 (1,018.6) (92.8%)
Class IV 0.7 0.1 0.6 n.s.
Class V 62.9 26.5 36.4 137.0%
Total 12,661.9 10,167.8 2,494.1 24.5%
(data in million Euros)
Change
Thanks to a constant focus on products, to a strengthening of the distribution network and a
growing level of customer loyalty, commercial activity during the year was almost exclusively
directed to the marketing of investment and saving products belonging to Class I (traditional
products under segregated accounts) with limited contributions from the sale of Class III products.
Moreover, the Group also consolidated its total leadership in the pension market, with a total of
Postaprevidenza Valore policies sold exceeding 630,000 units (over 122,000 in 2013 alone), thus
placing the Poste Vita pension fund at first place in the overall ranking of total subscriptions among
all pension funds in Italy.
Positive results were also achieved from the sale of pure risk policies (Term Life Insurance) sold
as “stand alone” (not included in insurance policies bundled with financial products), with over
39,000 new policies sold during the year and nearly 122,000 new product policies sold, still pure
risk, but bundled with financial obligations from Mortgages and Loans granted through the Poste
Italiane network.
Lastly, during 2013, the Group supported commercial initiatives aimed at the marketing of the
Long Term Care (“LTC”) product with recurring premiums, for protection against the risk of non
self-sufficiency (through the provision of an annuity).
As of December 31, 2013, nearly € 5.3 m contracts were in portfolio, with a total increase of
12.2% compared to 2012 (equal to € 4.7 m).
Contracts movements
Amounts
as of 01-01-
2013
New
contractsLiquidations
Amounts as
of 31-12-
2013
Traditional 2,882,034 705,298 (258,071) 3,329,261
Capitalization 488 22 (10) 500
FIP 511,433 122,083 (3,177) 630,339
Index linked 902,320 491 (106,987) 795,824
Unit linked 102,400 7,260 (5,580) 104,080
TCM e LTC 121,092 42,889 (23,186) 140,795
Group 217,368 120,559 (24,475) 313,452
Total 4,737,135 998,602 (421,486) 5,314,251
21

Non-Life Business
In 2013, nearly 323 thousand new Non-Life contracts were sold, with a 30% increase compared to
the previous year and an approximate daily average of 1,060 contracts sold. As of December 31,
2013, gross written premiums were equal to nearly € 71.4 m (+39% compared to the same period
in the previous year).
2013 Inc% 2012 Inc% Change Change %
Personal Accident 28.8 40% 21.8 43% 7.0 32%
Health 6.1 9% 5.6 11% 0.5 9%
Any other damage to property 4.4 6% 4.0 8% 0.4 11%
Fire and natural perils 6.0 8% 4.0 8% 2.0 51%
Other Liabilities 10.0 14% 7.0 14% 3.0 43%
Financial loss of various nature 11.9 17% 6.1 12% 5.8 94%
Legal expenses 1.6 2% 1.2 2% 0.4 36%
Travel Assistance 2.5 4% 1.5 3% 1.0 64%
Total 71.4 100% 51.2 100% 20.1 39%
Payments and changes in the insurance provisions
Claims paid during the year amounted to a total of € 5,178.5 m compared to € 5,548.5 m in 2012,
divided as follows:
Non-life insurance 31/12/2013 31/12/2012
Claims paid 10.9 7.6 3.4 44.4%
Claims expenses 1.6 1.4 0.2 18.0%
Total paid 12.5 8.9 3.6 40.4%
Claims paid 5,157.6 5,532.5 (374.9) -6.8%
of which:
Surrenders 2,356.1 2,472.1 (115.9) -4.7%Maturities 2,145.1 2,476.2 (331.0) -13.4%
Claims 656.4 584.2 72.1 12.3%
Claims expenses 8.4 7.1 1.3 18.6%
Total paid 5,166.0 5,539.6 (373.6) -6.7%
Total 5,178.5 5,548.5 (370.0) -6.7%
(data in million Euros)
Change
Life insurance
Regarding Life business, the figure amounted to € 5,166 m as of December 31, 2013, compared to
€ 5,539.6 m in 2012.
Surrender costs amounted to nearly € 2,356.1 m, in line with the 2012 figure (€ 2,472.1 m);
incidence on initial reserves was equal to nearly 4.3%, compared to 5.3% in the previous year
lower, than market levels.
22

The change in the insurance provisions, equal to € 10,116.8 m (€ 7,459.6 m in 2012), mainly
referred to a corresponding increase in liabilities due to the above-mentioned commercial trends.
31/12/2013 31/12/2012
Non-life insurance provisions 9.9 6.7 3.1 46.8%
Mathematical provisions Class I and V 10,545.8 7,346.7 3,199.1 44%
Mathematical provisions Class III (449.9) 156.8 (606.7) -387%
Provisions for outstanding claims 24.9 (137.6) 162.5 -118%
DPL provision (1.4) 92.6 162.5 -118%
Other insurance provisions (12.6) (5.6) (6.9) 123%
Total Life insurance provisions 10,106.9 7,452.9 2,654.0 35.6%
Total 10,116.8 7,459.6 2,657.2 35.6%
(data in million Euros)
Change
Changes in the “Life” insurance provisions, equal to € 10,106.9 m, included changes in the
mathematical provisions relative to Classes I and V for € 10,545.8 m, changes in the insurance
provisions for Class III products for € -449.9 m, changes in the provisions for amounts to be paid
for € 24.9 m, changes in the provisions for Deferred Profit Liability (DPL) for € -1.4 m and changes
in the other isnurance provisions for € -12.6 m.
Considering that production in the year was absolutely limited, the change in the insurance
provisions made for Class III products should be attributed to cash outflow for surrenders and
policy expirations, only partially offset by revaluation following the positive trend of financial
markets.
With reference to reinsurance ceded, charges for claims in the period, that included a change in
the insurance provisions, were equal to € 20m compared to €11.6 m registered in the previous
period, € 12.3 m of which for Life management (€ 5m as of December 31, 2012), as indicated
below:
Non-life insurance 31/12/2013 31/12/2012
Claims paid 4.9 3.4 1.4 42.2%
Claims expenses 0.2 0.3 (0.1) -25.5%
Total paid 5.1 3.7 1.4 37.3%
Change in the insurance provisions 2.6 2.9 (0.3) -9.5%
Non-life total 7.7 6.6 1.1 16.7%
Claims payments 2.8 1.7 1.1 66.6%
Claims expenses 0.0 - 0.0 n.s
Total paid 2.8 1.7 1.1 66.9%
Change in the insurance provisions 9.5 3.3 6.2 187.3%
Life total 12.3 5.0 7.3 146.3%
Total claims paid and change in the insurance provisions 20.0 11.6 8.4 72.6%
Change
Life insurance
(data in million Euros)
23

Distribution
For its product placement, the Poste Vita Insurance Group used the Post Offices of the Holding
Poste Italiane S.p.A., a Company with only one partner - Patrimonio BancoPosta, duly registered
under letter D in the single register of insurance intermediaries as per ISVAP Regulation no. 5 of
October 16, 2006 whose validity was extended until March 2019, with tacit renewal at expiration.
Poste Italiane S.p.A.’s sales network is formed by over 13,000 Post Offices throughout the national
territory. Insurance contracts are signed in the Post Offices by qualified and properly trained
personnel.
Training activity for personnel in charge of product sales continued according to regulation
guidelines. Professional training programs throughout 2013 focused both on new products and on
technical-insurance and pension modules. The latter were created to develop the expertise of
personnel acting as intermediaries, not only in terms of specific skills in relation to the products
offered, but also of general welfare issues and of defining customer needs. Each training initiative
was designed, approved and carried out by the Poste Vita Insurance Group’s competent Business
Department according to Poste Italiane S.p.A.’s training references (in some instances with the
support of external training companies, specialized in the insurance sector).
From an organizational point of view, the territorial monitoring structure within the Poste Vita
Groups was strengthened during 2013. This structure is formed by Area Supervisors who focus
on specific Territorial Areas belonging to Poste Italiane’s network. Area Supervisors carry out a
support and field-training role focused on insurance expertise as well as technical and commercial
know-how.
Moreover, the Company also strengthened its service model for customer support based on a
multi-channel criteria and through an improved website which includes customer services, an area
reserved for the company’s portfolio customers and an upgraded call center that can be reached
through a toll free phone number. The multi-channel service model was developed also to support
the distribution network, in synergy with and integrating the central role carried out by Post Office
personnel.
Reinsurance policy
Life insurance
With reference to Life insurance, reinsurance policies adopted in the past years remained
essentially unaltered in 2013 and therefore the effects of ongoing agreements continued. In
particular, the Parent Company Poste Vita’s reinsurance policy with regard to Life business is
based on risk sharing (“cessioni in quota”) for products that include life insurance coverage or are
linked to the loss of self-sufficiency (LTC); facultative reinsurance (“cessioni in facoltativo”) was
also included for life insurance coverage and for permanent disability by illness (IPM) for Medio
Credito Centrale managers.
The economic effects of these reinsurance policies are described in the Notes.
Non-Life insurance
In 2013, the subsidiary Poste Assicura’s administrative body approved a new reinsurance policy
for the three-year 2013-2015 period that aims at:
24

Optimizing the technical result of the insurance management and the cost of capital, by
complying with the solvency requirements established by Solvency II;
Providing coverage of any irregular trends in the loss ratio, typical of growing portfolios, as well
as any significant events (so-called large losses);
Optimizing the end to end operating management of reinsurance agreements.
In summary, the main changes compared to the previous insurance cession strategy were the
following:
Reinsurance by class – For home, condominium, business and accident products, the 2013
reinsurance policy included cessions implemented through a “bouquet”2 agreement according
to Classes and with commercial premiums, rather than with pure premiums as it had been up
to last year. Only some particular products (i.e.: in the Credit Protection field and the
Postaprotezione SiCura product) continued to include reinsurance cession per product and per
pure premiums.
Retention strategy – According to difference scenario analyses relative to capital consumption
and the effects of reinsurance, it was decided to gradually reduce the stakes sold. This
resulted in a greater risk retention held by the Company. Particularly for the accident class,
share reinsurance integrated with excess coverage for claims was replaced exclusively by
excess reinsurance. This approach was also favored by the possibility of obtaining significant
and reliable figures on the trend characterized by an important growth and by a positive
technical trend. For this purpose, as resolved by the Company’s Board of Directors, an
agreement was reached during the year for withdrawing the portfolio ceded to Catlin Syndicate
2003 at Lloyd’s. The effects of this transaction, described in the Notes to the Financial
Statements, were included in the technical account for the year.
The economic benefits described in the reinsurance policy review will take place in future years,
but are already present in the 2013 financial statement. The total effects on the income statement
for the current year are illustrated in the Notes.
2 In the field of proportional reinsurance, it refers to a reinsurer’s participation in contracts covering more Classes, even different from
one another.
25

ASSET AND FINANCIAL MANAGEMENT
Financial investments
Investment strategies and guidelines are defined by the Boards of Directors through "framework
resolutions", which identify both the essential characteristics, in qualitative and quantitative terms,
of durable and non-durable investment sectors and the strategies for derivative transactions. The
investment process also includes a governance system with corporate bodies (Investment
Committee and Risk Committee).
The Group’s financial investments are mainly those aimed at covering contractual obligations to
policyholders which concern traditional re-valuable life insurance policies whose insured benefit is
prorated to the returns from the management of financial assets enrolled in funds within Poste
Vita’s total assets (so-called Segregated Accounts). The Company guarantees a minimum rate of
return ranging from 0% and 1.5%.on these products payable upon policy maturity.
Investment policies adopted in 2013 showed that the Group maintained an investment
management strategy aimed at combining the need to relate investments to the structure of
obligations to policyholders while preserving a portfolio that ensured return continuity in line with
main competitors. Also according to market trends, investment choices were based on utmost
caution, with a portfolio principally invested in Eurozone government bonds and in “corporate”
bonds with good standing. More specifically, purchases essentially concerned Italian government
bonds, also inflation-indexed ones. Particular attention was also given to the selection and
diversification of the portfolio into non-governmental bonds. To diversify risk according to sector,
and better exploit the earning opportunities offered by the positive economic growth and corporate
receivables trends, the extent of financial, banking and industrial issuers was increased. Moreover,
in order to obtain geographical diversification, there was an increase in the incidence of European
(mainly French, German and Spanish), and US issuers. The drop in Italian government returns
characterizing 2013, offered the opportunity of achieving capital gains on long-term securities. In
December, as foreseen by management strategy, guaranteed ‘Available for Sale’ capital funds
were sold, in the exclusive interest of policyholders. The aim of this transaction was to increase
and level off the future return of segregated accounts. The transfer of these investments generated
losses from disposal for € 11.9 m compared to unrealized losses equal to nearly € 76m in 2012 on
these funds.
Despite commercial and market trends, financial investments as of December 31, 2013 amounted
to a total of € 69,852.2 m, rising by 19.8% compared to € 58,307.4 m in 2012.
Financial investments 31/12/2013 31/12/2012
Investments in subsidiaries, associated companies and joint ventures 197.0 198.7 (1.6) (0.8%)
Loans and receivables 11.5 102.1 (90.7) (88.8%)
A vailable for sale financial assets 59,159.9 47,924.9 11,235.0 23.4%
Financial assets at fair value through profit or loss 10,483.8 10,081.7 402.1 4.0%
Total financial investments 69,852.2 58,307.4 11,544.7 19.8%
Change
Shareholdings referred to the investment in the affiliated company EGI, valued with the equity
method. The Company, owned for 45% by Poste Vita S.p.A and for 55% by Poste Italiane S.p.A,
26

operates in the real estate sector by managing and exploiting non-operating assets that the Parent
Company transferred in 2001. 2013 data show the Company’s equity equal to € 437.8 m with a
negative net result for € 3.7 m, determined by provisions for risks and charges equaling € 5.8 m,
that the Company allocated following a Judgment of the Court of First Instance issued on March 6,
2014 by Rome’s Civil Court. On the basis of this judgment, the Company was sentenced to pay an
indemnity with charges corresponding to that amount. Without this exceptional event, EGI’s EBIT
would have been positive for € 1.4 m, higher than the objective set with the Parent Company.
Loans and receivables mainly referred to the balance of Poste Italiane’s current account and to
provisions for subscriptions linked to capital calls on mutual funds of which the corresponding
stakes had not yet been issued.
Available for Sale financial assets (AFS) mainly referred to securities attributed to segregated
accounts (nearly € 54.1 billion) and also to securities for covering products with contracts linked to
specific assets (nearly € 2.7 billion); the share that refers to the available assets was equal to
nearly € 2.4 billion. The nearly € 11.2 billion growth compared to 2012 is attributed to the positive
commercial results and to returns obtained in the period, together with a fair value increase as a
consequence of the financial markets’ positive trends. As of December 31, securities classified as
AFS showed net capital gains from assessments for nearly € 2,913m, compared to nearly €
1,733m at the end of 2012. Of these, € 2,688m were attributed to policyholders through the
shadow accounting mechanism, as established by the IFRS 4, and referred to financial
instruments included in segregated accounts. The remaining € 225m (€141m in 2012), referred to
net capital gains on AFS securities, which are part of the Company’s “available assets”, and were
therefore attributed to a specific net equity reserve (equal to €148m) net of the relative tax effect.
Financial Assets at Fair Value Through Profit or Loss (FVTPL) amounted to nearly € 10.5 billion (€
10.1 billion as of December 31, 2012) and mainly referred (€ 9.3 billion compared to € 9.7 billion at
the end of 2012) to financial instruments to cover “Unit and Index linked” policies. Of these, nearly
€ 6.1 billion referred to financial instruments to cover Index Linked-type policies for which Poste
Vita directly guaranteed customer capital refund as well as a minimum rate of return. Structured
securities were also present for € 3.2 billion, used to cover "Index Linked"-type policies and for
parts of investments funds used to cover "Unit Linked”-type policies for which Poste Vita did not
offer any guarantee on the capital nor a minimum rate of return. Financial risks for these
investments are totally borne by customers.
Financial Assets at Fair Value Through Profit or Loss also included issuer’s early redemption
bonds and new CMS-type issuances (Constant Maturity Swap) included in the Company’s
segregated accounts for a total of € 1.2 billion. Financial markets’ positive trends recorded capital
gains from assessments for nearly € 10.6 m entirely attributable to policyholders through the
shadow accounting mechanism.
The Group’s security portfolio, in its entirety, was invested mainly in Government bonds (78.6% of
the total) and in corporate bonds (17.8% of the total); the portfolio’s remaining part included UCITS
stakes (Undertakings for the collective investment in transferable securities), shares and warrants.
With regard to derivative transactions, at December 31, 2013 the only derivatives were formed by
Warrants to cover the indexed part of a few Index Linked policies.
The following table includes financial investment distribution according to budget category:
27

Available for sale financial assets 31/12/2013 31/12/2012
Equities 5.3 4.5 0.8 16.8%
Bonds 57,617.7 45,752.2 11,865.5 25.9%
Of which: government bonds 48,853.2 38,759.0 10,094.2 26.0%
corporate 8,764.5 6,993.2 1,771.3 25.3%
Investment Fund units 1,536.9 2,168.2 (631.3) (29.1%)
Total 59,159.9 47,924.9 11,235.0 23.4%
(data in million Euros)
Change
Financial assets at fair value through profit or loss 31/12/2013 31/12/2012
Bonds 6,560.7 6,152.6 408.2 6.6%
Of which: government bonds 5,888.9 5,794.0 94.9 1.6%
corporate 671.8 358.5 313.3 87.4%
Structured bonds 2,983.3 3,102.4 (119.1) (3.8%)
Other financial investments 729.8 708.7 21.2 3.0%
Derivatives 210.0 118.1 91.8 77.7%
Total 10,483.8 10,081.7 402.1 4.0%
(data in million Euros)
Change
Portfolio composition according to issuing country was in line with 2012 and was characterized by
a strong prevalence of Italian government bonds.
Country issuer FVTPL AFS
Australia - 205,8
Austria 17,3 26,0
Belgium 31,0 74,3
Denmark 40,7 37,1
Finland - 33,3
France 263,0 2.089,2
Germany 34,4 398,4
Japan - 9,5
Hong Kong/China - 86,3
Ireland 251,0 183,1
Italy 7.328,8 50.950,4
Luxembourg 382,0 100,8
Malta 239,4 -
Mexico - 30,2
Norway - 37,9
New Zealand - 19,8
Netherlands 224,6 1.403,0
United Kingdom 906,7 752,3
Czech Republic - 5,5
Supranational - 48,2
Spain 56,3 826,8
United States of America 121,1 1.603,7
Sweden 18,6 179,4
Switzerland 566,8 61,0
total 10.481,8 59.161,9
(data in million Euros)
Distribution according to portfolio duration classes is included as of December 31, 2013:
28

(data in million Euros)
Duration AFS FVTPL
up to 1 4.844,2 1.871,4
from 1 to 3 10.627,9 1.180,5
from 3 to 5 8.129,1 5.995,4
from 5 to 7 14.333,9 277,5
from 7 to 10 9.643,6 173,6
from 10 to 15 7.989,9 45,9
from 15 to 20 2.004,2
from 20 to 30 45,9
Total 57.618,6 9.544,3
Net proceeds from financial instruments obtained in 2013 amounted to a total of € 3,004m,
decreasing by nearly € 232m compared to 2012, mainly due to less favorable financial market
conditions compared to those registered at the end of the previous year. A limited part of the net
charges, equal to a total of nearly € 10.6 m (€ 8.8 m in 2012) referred to interest accrued on the
subordinated loan subscribed with Poste Italiane, to interests on bank and post office current
accounts and to the subsidiary EGI’s loss of accrual based accounting registered during the year.
Details on financial proceeds and expenses are included here below:
Interest/Income
Other
income and
expenses
Net
realized
gains
Net
unrealize
d losses
Total income
and expenses
2013
Total income
and expenses
2012
From available for sale financial assets 2,080.9 30.5 148.2 - 2,259.5 1,770.7 488.9 27.6%
From financial assets at fair value through profit or loss 308.2 (0.1) 15.9 420.5 744.5 1,465.2 (720.6) -49.2%
From cash and cash equivalents 9.54 - - - 9.5 14.2 (4.7) -32.9%
From other financial liabilities (18.5) - - - (18.5) (22.8) 4.4 -19.1%
From interests in associated companies - - - (1.6) (1.6) (0.2) (1.4) 635.7%
Total 2,380.2 30.3 164.1 418.9 2,993.5 3,227.0 (233.5) -7.2%
(data in million Euros)
Change
Returns from the Company Poste Vita’s segregated accounts, in the specific periods under
examination (from January 1, 2013 to December 31, 2013), were as follows:
Segregated funds Gross result Average invested capital
Poste Valore Più 4,19% 45.730,2
Posta Pensione 5,21% 1.769,9
(data in million Euros)
Investment activity continued to be monitored also through the use of advanced risk analysis
methods (of a statistical type), carried out with the help of an internal financial-actuarial model. In
the hypothesis of a “central scenario” (based on current commercial and financial situations) as
well as of stress scenarios and of different commercial developments, these methods aimed at
assessing compatibility of risk assessments – implemented with reference to both the guaranteed
minimum rate of return established by contract, and to possible consequences on the budget - as
well as their sustainability, attributable to the assets and returns that were expected each time.
The guaranteed minimum rate of return established by contract ranged from 1.0% and 1.5% on
non consolidated events, therefore it included a very low risk possibility, taking into account
returns obtained to date from segregated and future accounts.
29

Insurance Provisions
As a result of the aforementioned business trends, in accordance with the laws and regulations on
this matter and on the basis of appropriate actuarial assumptions, insurance provisions analytically
calculated for each contract totaled € 68,005m. Based on favorable commercial trends, they
showed a growth of nearly 19.8% compared to € 56,771m in 2012, divided as follows:
Technical provisions 31/12/2013 31/12/2012
Non-l i fe classes :
Provisions for unearned premiums 31.8 25.5 6.3 24.8%
Provisions for outstanding claims 26.1 16.4 9.7 59.5%
Other insurance provisions 4.8 1.4 3.4 233.0%
Total non-life classes 62.7 43.3 19.4 44.9%
Li fe classes : - -
Mathematical provisions 55,723.8 45,175.8 10,548.0 23.3%
Provisions for policies where the investment risk is
borne by the policyholders9,190.2 9,640.1 (449.9)
-4.7%
Provisions for outstanding claims 229.3 204.4 24.9 12.2%
DPL provision 2,723.6 1,619.3 1,104.4 68.2%
Other insurance provisions 75.5 88.1 12.6 - -14.3%
Total life lines 67,942.5 56,727.6 11,214.8 19.8%
Total 68,005.2 56,770.9 11,234.3 19.8%
(data in million Euros)
Change
In particular, provisions for “Life” classes totaled € 67,942.5 m with a 20% increase compared to
the end of 2012 (€ 56,727.6 m). These provisions were accrued in order to meet all Company’s
obligations and included the mathematical provisions, (€ 55,723.8 m), insurance provisions to
meet Linked products (€ 9,190.2 m), provisions for amounts payable (€ 229.3 m), provisions for
deferred liabilities to policyholders -accrued based on the shadow accounting criteria (DPL) for €
2,723.6 m - and other different insurance provisions (€ 75.5 m). The latter included provisions for
future charges (art. 31 ISVAP Regulations No. 21/2008) for € 72.2 m and provisions for unearned
premiums for supplementary insurance equal to € 3.3 m.
With reference to the shadow accounting method, Class-I products whose revaluation were linked
to the returns of segregated accounts, the financial component of technical provisions was
determined on the basis of actual proceeds and expenses, as established by national accounting
standards. Therefore, capital gains/losses were not considered, generating a time mismatching
between the liabilities assessment and their relative covering assets, included in IAS 39, that were
accounted for at fair value.
This event was monitored, as in previous years, through “shadow accounting”, an accounting tool
introduced by the IFRS 4 to uniformly specify related assets and liabilities; in particular, latent
capital losses and gains identified in financial instruments forming Segregated Accounts were
written among liabilities in technical provisions and were limited to policyholders’ share prorated to
the percentage of retrocession established by contract in Segregated Accounts. This assessment
took into account the impact on the minimum rate of return levels currently applied in contracts.
Criteria used for shadow accounting are illustrated in the Notes.
Contracts classified as “insurance contracts” and those classified as “financial instruments with a
discretionary participation feature”, for which the same accounting and evaluation criteria are used
30

as in Italian balance sheets, were subjected to a LAT - Liability Adequacy Test established by
comma 15 of IFRS4. The test was conducted by taking into account the current value of future
cash flows, obtained by projecting the expected cash flows generated by the existing portfolio as of
year-end, based on adequate hypotheses, over expiration causes (death, termination, surrender,
reduction) and expense trends.
Insurance provisions for Non-Life business totaled € 62.7 m at year-end (€ 43.3 m at 31 December
2012) net of reinsurance ceded, and were formed by: provisions for unearned premiums for € 31.8
m , provisions for outstanding claims for € 26.1 m and other provisions for € 4,8 m. “Other
technical provisions” also included provisions for increasing age for € 0,4 m, as well as provisions
written after assessing the consistency of provisions for unearned premiums for € 4.4 m, as
described in the Notes.
Provisions for incurred but not reported claims (IBNR) totaled € 4.8 m.
The trends of Provisions for unearned premiums and for outstanding claims reflected the growth of
collection trends.
Shareholders’ equity and solvency margin
The Group’s equity as of December 31, 2013 amounted to € 2,763.5 m with a variation of € 655.1
m compared to the beginning of the year, exclusively referring to: i) the share capital increase
undertaken by the Holding Poste Italiane and paid, respectively, in July for € 200m and in
December for € 150m, ii) result of the period and iii) the variation in retained earnings for available
for sale financial assets. For the latter, € 0.5 m were transferred to the income statement during the
year.
As of December 31, 2013, subordinated loans entered into by Poste Vita with the Holding Poste
Italiane amounted to € 540m, (of which € 400m with indefinite maturity), were repaid at market
conditions and governed according to the provisions of article 45, chapter IV, title III of Legislative
Decree No. 209 of September 7, 2005 and subsequent modifications. These are fully available for
the calculation of elements covering the consolidated solvency margin.
The elements forming the solvency margin, calculated with the consolidated method, amounted
to € 3,102m compared to a required solvency margin equal to € 2,545m; consequently, the
solvency ratio at the end of 2013 was equal to 1.22.
31

POSTE VITA GROUP ORGANIZATION
Corporate Governance
This paragraph also describes the “Report on corporate management” established by art. 123 Bis
of Legislative Decree 58/1998 (Consolidated Text on Finance) only for information required under
paragraph 2, letter b. The Governance Model adopted by the Parent Company Poste Vita is
“traditional”, i.e. characterized by the traditional dichotomy between the Board of Directors and
Board of Statutory Auditors.
The Board of Directors meets periodically to review and decide management, results, and
proposals regarding the operational structure, strategic relevance transactions and any other
obligation under current industry legislation. This body therefore represents the central element to
define the Group’s strategic objectives and addresses the policies needed to achieve them. The
Board of Directors is responsible for governing corporate risks and approves the strategic plans
and policies to be pursued. It promotes the culture of control and ensures its distribution to the
various company levels.
The Chairman’s powers are conferred by Company Bylaws and by the Board of Directors’ Meeting
of May 23, 2011. In the same session the Board of Directors awarded to the Chief Executive
Officer the powers of Company management, with the exception for the powers reserved to
themselves by the Board of Directors.
The Board of Auditors is made up of 3 standing members appointed by the Shareholders’ Meeting.
Pursuant to art. 2403 of the Civil Code, the Board of Auditors monitors compliance with the law and
the Bylaws, with the principles of proper administration and, in particular, with the adequacy of the
organizational, administrative and accounting structure adopted by the Company and its actual
operation.
The Group also has a system of conduct and technical rules that ensures consistent corporate
governance through the coordinated management of the decision-making process regarding
aspects, issues and activities of interest and/or of strategic importance or that could generate
significant financial risks.
The governance system is further enhanced by a series of Company Committees chaired by the
CEO, aimed at addressing and controlling corporate policies on issues of strategic value. In
particular, the following committees were established: (i) an Insurance Product Committee, which
analyzes, ex ante, the proposals regarding insurance product offers with related technical and
financial characteristics and verifies, ex post, technical and profit performance and the limits of
risk taking for product portfolios, (ii) a Project Committee, that is responsible for ensuring the
master plan monitoring for the Insurance Group’s strategic projects, of assessing its progress, of
analyzing possible criticalities and of re-orienting the action undertaken by the departments in
charge, in order to reach the final goals; (iii) a Risk Management Committee, responsible for
ensuring the coordinated management of crisis situations linked to the company’s IT assets and
guaranteeing business continuity upon occurrence of unexpected, exceptional events. The
Committee operates in consistence with the objectives set for issues of interest to the Holding
Poste Italiane, (iv) an Investment Committee, that is responsible for supporting the investment
policy, the strategic and tactical asset allocation policy and its monitoring over time and a (v) Risk
Committee, with the responsibility of supporting the Company in establishing the risk measurement
32

criteria and system, as well as of identifying risk limits, based on the defined risk appetite and on
limits approved by the Board.
Lastly, to increase compliance with the more advanced governance models, the Company Bylaws
required a Manager in charge of preparing accounting records. The Board of Directors, at the May
10, 2011 meeting, confirmed the Head of Administration and Control as the Manager in charge.
Internal Control System
In the Poste Vita Group, risk management is part of a wider internal control system that is divided
into three levels:
Line, or first level, controls, carried out during operational processes managed by individual
operating units (this also includes hierarchical controls and controls "embedded" in the
procedures); the system of proxies and of power of attorneys; the operating structures
therefore represent a "first line of defense" and have the responsibility of effectively and
efficiently managing the risks that fall within their area of competence.
Risk management controls (second level), carried out by the Risk Management Department
which is separate and independent from other operating units and identifies the various types
of risk, contributes to establishing methods for evaluation/measurement and verifies that the
operating units comply with the assigned limits; it also identifies and recommends, where
necessary, risk corrective and/or mitigation action, checking consistency between business
operations and risk objectives established by the competent corporate bodies.
Controls on the risk of non-compliance with rules (second level), carried out by the Compliance
Department, which is separate and independent from operating units and has the responsibility
of preventing the risk of incurring in legal or administrative sanctions, financial losses or
reputational damage arising from non-compliance with the relevant regulations. In this context,
the Compliance Department is responsible for assessing the adequacy of internal processes to
prevent the risk of non-compliance.
Third Level Controls, assigned to the Internal Auditing, Ethics and Internal Control Models
Department, which is separate and independent from operating units, that, based on the
analysis of risk areas affecting Company business, plans annual audits to verify the
effectiveness and efficiency of the Internal Control System with respect to assets/business
processes.
The internal control system also consists of a set of rules, procedures and organizational units
designed to prevent or minimize the impact of unexpected events and to enable the achievement
of strategic and operational objectives (effectiveness and efficiency of operations and protection of
corporate assets), compliance with laws and regulations, and accurate and transparent internal
information. It is a widespread system within the Company and is subject to progressive upgrade.
Within this context, the Internal Auditing, Ethics and Internal Control Models Department assists
the organization to achieve its business and governance goals, helps executives and management
fulfill their duties with regard to the internal control and risk management systems, to promote the
ongoing improvement of Company corporate governance mechanisms and control processes. In
particular, the Department’s duty is to provide assurance – by virtue of its organizational
independence and lack of operational responsibilities – on the adequacy and overall operation of
the Company’s general internal control system, adopted by the Company pursuant to Law No.
33

262/05. For this reason, this department prepares an annual Audit Plan based on risk analysis, for
a progressive coverage of key business processes.
A Risk Management Department was also established to develop risk measurement methods and
propose action plans to mitigate the financial, technical and process risks sustained by the
Company. Risk Management is also responsible for developing a risk measurement system and a
system to measure regulatory capital according to specifications under definition at EU level
(Solvency II). Risk Management also supports the Board in assessing, through stress tests, the
consistency between the risks undertaken by the firm, the risk appetite defined by the Board of
Directors and the actual and potential regulatory capital allocations. The Compliance Department
guarantees organizational and procedural adequacy to prevent the Risk of Non-Compliance to
regulations as per the Compliance Policy approved by the Board of Directors on November 26,
2008.
Regarding control organization, a proposal to centralize control functions under the Parent
Company Poste Vita was submitted to IVASS, pursuant to art. 36 of ISVAP Regulations No. 20
dated March 26, 2008.
With reference to the area regulated by Legislative Decree No. 231/01, Poste Vita has adopted an
Organizational Model aimed at preventing the various types of crimes mentioned in the law. The
Vigilance Body, in charge of supervising application and compliance to the Model, is made up of 3
members appointed by the Board of Directors, of which two, including the President, external to the
Company – and one internal member who is the current head of the Audit Department.
During the year, in light of the changed business, organizational and procedural situations and of
legislation introduced for new types of predicate offenses for administrative liability pursuant to
Legislative Decree 231/01, the Board of Directors resolved to update the Organizational Model in
its meeting on November 21, 2013.
The adoption of Organizational Model 231 and of the conduct rules contained therein is integrated
with "Poste Italiane Group’s Code of Ethics" and with "Poste Italiane Group’s Code of Conduct for
Suppliers and Partners" adopted by the companies, in accordance with similar Codes currently in
use by the Holding Company Poste Italiane.
34

Organizational structure and personnel
The Insurance Group’s goal during the year was to strengthen its organizational structure, to face
its constant growth in terms of size and business. The number of direct employees as of December
31, 2013 was equal to 317, compared to 279 as of December 31, 2012.
Personnel Organization Chart 2013 2012 Change
Managers 32 31 1
Officers 113 90 23
Employees 161 149 13
Fixed-term contracts 11 9 2
Direct employees 317 279 38
The increase in personnel mentioned above, accomplished despite a particularly negative
economic and financial situation, emphasized the Group’s intention to support its growing business
and various projects launched during the year, and to develop technical-specialist and managerial
staff in order to improve processes and their relative internal control system. New company
employees were recruited not only from the insurance market, but also through collaboration
agreements with leading Rome universities ("La Sapienza", "Tor Vergata" and "Roma Tre"),
through which talented graduates were offered internships or apprenticeships.
The companies’ organizational structure was continuously strengthened, focusing on personnel
advancement and skill improvement. Personnel development was one of the Group’s strategic
priorities, resulting in significant training investments during the year. In particular, in 2013, over
600 days of specialist technical training were devoted to personnel.
Moreover, during the year, several projects were started, aimed at ensuring the development of
conduct and managerial skills for various company personnel segments (staff, officers, managers).
During the year, a training project was also implemented aimed at developing skills to carry out
work in dynamic, integrated environments with significant interfunctional aspects.
Commitment and investment in training projects, aimed at enhancing conduct and managerial
skills, were made to enable the employee’s personal and professional growth, consistent with the
company’s needs for excellence operational. During the year, the implementation of an annual
staff performance evaluation system continued, focusing on skills and objective achievement.
Compliance with privacy regulations
As a result of the repeal of letter g), Art. 34, of Legislative Decree No. 196/2003 ("Keeping of an
updated security policy document"), included in the “Simplification Decree”, the obligation of
drawing up a Security Policy Document (DPS), updated each year by March 31, containing all
company privacy management information, was removed from the Privacy Code.
Despite the repeal of the DPS, the Company has continued to keep a security summary document
describing the policies implemented by the Holder of Privacy Procedures in the handling of
personal information.
In particular, the Document provides the organization and privacy policies to be adopted, keeps
updates on stored data, clarifies responsibilities within the company structure pertaining to the
35

handling of personal data, data risk analysis, and relevant security measures to ensure data
integrity, availability and verification. It also covers data restoration and outsourced processing
security.
Research and Development
During the year, the Company did not incur in research and development expenditures except
those related to new product definition. These costs were fully recorded in the year’s accounts.
Disputes
Nearly 240 disputes against Poste Vita were filed as of December 31, 2013, mainly relating to
“dormant policies" and insurance benefit settlements. Moreover, 6 proceedings are still pending in
the employment court, filed by employees of subcontracting firms who claimed payments for work
carried out and not yet paid. The possible outcome of these disputes was taken into account in
determining the statement of assets and liabilities and income for the period.
Nearly 75 proceedings were filed against Poste Vita mostly regarding alleged offences of illegal
conduct, generally referred to the provision of false insurance documents, misappropriation of
funds or taking advantage of a disabled person, for which third parties or Poste Italiane’s personnel
were accused.
Disputes against the Subsidiary Poste Assicura as of December 31, 2013 were nearly 120 and
mainly referred to objections raised against insurance benefit settlements. The possible outcome of
these disputes was taken into account in calculating the provisions for outstanding claims.
Nearly 14 proceedings were filed against Poste Assicura mostly regarding alleged offences of
illegal conduct, generally referred to the provision of false insurance documents, misappropriation
of funds or taking advantage of a disabled person, for which third parties or Poste Italiane’s
personnel were accused.
Tax Proceedings
Appeals submitted to the Provincial Tax Commission of Rome for the dispute on the 2004, 2005
and 2006 fiscal years for alleged VAT violation are still pending. The violation, notified to the
Parent Company Poste Vita by the Italian “Agenzia delle Entrate” (Internal Revenue Service)
concerns the alleged failure to pay taxes on paid invoices. While considering the Agenzia’s
requests ungrounded, the Company took into account the likely outcome of the appeals when
determining provisions for risks and charges.
Other Information
In complying with art. 28.2 of ISVAP Regulations No. 20/2008, the Group’s insurance companies
forwarded to the Supervisory Authority the documentation regarding the 2012 financial statement,
together with the annual report on the internal control and risk management systems, which
included the initiatives implemented during the year, internal audits carried out, inefficiencies
found and consequent corrective measures adopted. Documents regarding the company’s
organization chart and the proxy system were attached to the report. According to the above-
mentioned Regulations, the Companies’ Boards of Directors approved the 2013 activity plans
36

prepared by the Internal audit, Risk management and Compliance Departments, as well as the
latter’s annual report.
In the February 2013 meeting, the Group’s Board of Directors resolved on the guidelines for
transactions between Group Companies and intragroup counterparts and on expected 2013
operations, as per Regulation No. 25/2008 .
Based on ISVAP Regulation No. 39/2011, the Group’s Boards of Directors defined the
remuneration policies for corporate bodies and relevant personnel to obtain necessary approval in
Ordinary Meetings. For this purpose, a document was drafted, together with the Internal control
and Human resources Departments, which included each company’s policy on this subject, that
was later approved, following individual assessments, in their respective April 2013 Board
Meetings.
37

RISK GOVERNANCE AND MANAGEMENT SYSTEM
Risk Governance
The risk management process involves, with different roles and responsibilities, Group Companies’
Boards of Directors, Top Management, Operating Units and Control Departments.
The Board of Directors has ample powers of ordinary and extraordinary management and may
perform all actions it deems necessary and useful to achieve the Company’s purpose, with the
exception of those expressly reserved by law to the Shareholders' Meeting. This Body therefore
defines the Companies’ strategic objectives and the policies needed to achieve them.
The Board of Directors also has final responsibility on the internal control system and defines
strategies and policies for significant risk taking, assessment and management, also identifying risk
tolerance levels and determining performance goals consistent with capital asset levels.
In this regard, the Board of Directors is regularly informed on risks, also through periodic reports by
the Control Departments.
The Top Management’s role within the internal control system is to ensure an effective
management of operations and related risks by implementing Risk Management strategies and
policies established by the Board of Directors.
The Top Management implements the necessary measures to ensure the establishment and
preservation of an efficient and effective internal control system, maintaining the functionality and
overall adequacy of the Risk Management System. The Top Management handles the information
flow to the Board of Directors to ensure full awareness and manageability of business risks. It also
ensures the timely control and constant monitoring of risk exposures, including respecting the level
of risk tolerance and operational limits.
The Risk Management Department provides specialist support to the Board of Directors and to the
Top Management for defining and implementing the risk management system, by monitoring its
overall resilience over time and ensuring a complete view of the Group’s business risks; the Risk
Management Department checks the consistency between risk assessment qualitative and
quantitative models with Group operations.
The Risk Management Department also supports the different operating units for assessing the
impact on risk profiles regarding: strategic business decisions, particular operations, products and
prices; it monitors risk exposure and compliance with tolerance levels. The individual operating
units are responsible for operational risk management relating to their business, adopting to this
end the necessary methodologies, tools and skills.
Lastly, together with other control structures, the Risk Management Department contributes to
spreading and strengthening the risk and control culture across Group personnel, in order to create
an awareness of the role attributed to each individual business entity within the internal control
system.
The Compliance Department is responsible for assessing that corporate organization and
procedures are adequate to prevent the risk of incurring in judicial or administrative sanctions,
property losses or reputational damages as a consequence of breaches of laws, rules or provisions
38

by supervisory Authorities or of self-regulations. This Department also supports the Board of
Directors and Top Management regarding risks of non-compliance with rules. The Compliance
Department also includes the Anti-Money Laundering Division which is responsible for monitoring,
preventing and opposing money-laundering activities and terrorism financing.
The Internal Audit Department is in charge of monitoring and assessing the effectiveness and
efficiency of the Risk Management process.
The Risk Management Process
The Risk Management process allows the constant identification, evaluation and management of
all risks and is divided into the following phases:
identification: the risks which the Company is exposed to are identified and classified and
principles and methods for their quantitative or qualitative assessment are established;
measurement/assessment: the risks which the Company is exposed to and their potential
impact on capital are adequately measured and/or assessed;
control: risk exposures, risk profile and compliance with set limits are monitored and controlled;
mitigation: measures, also organizational, implemented by the Company to mitigate different
types of risks are assessed; in this context, possible corrective actions are identified and
implemented to keep the risk profile within set limits;
reporting: information on risk profile and on relative exposures to both the Company’s internal
units and bodies and to Control Authorities and external stakeholders is defined and drafted.
The identification activity led to pinpointing risks considered significant; these risks were classified
into categories according to the "First Pillar" of Solvency II, duly improved to take into account risks
not covered by the "First Pillar" itself. In particular, the following risk classes were identified:
Market Risks
Technical Risks
Liquidity Risks
Counterparty Risks
Operational Risks
Other Risks
Risks were monitored on an ongoing basis by the Risk Management Department and by the
individual competent departments; for this purpose, risk trend reports were sent to the Board of
Directors, to Top Management and to the relevant operating units. In particular, for quantifiable
risks, the reports adopted risk exposure measurement methods, also for the highest potential loss,
and conducted perspective analyses on particularly unfavorable situations (stress tests).
39

Market Risks
Financial instruments held by the Group mainly related to investments designed to cover
contractual obligations to policyholders relative to traditional re-valuable life insurance policies, to
pension-type policies and to index- and unit-linked products. Further investments in financial
instruments related to covering provisions for pure risk policies, for Non-Life policies and for the
uses of the Group’s available assets.
The Company’s exposure situation to financial risks is reported here below, based on the risk the
Company incurred, as follows:
Full financial risk: the risk is totally borne by the Company
Shared financial risk: the risk is borne by the Company for the part of minimum guaranteed
interest;
No financial risk: the risk is totally borne by policyholders.
Traditional Life and Pension Insurance policies refer to products containing a revaluation clause of
policyholders service prorated to returns from the management of financial assets written
separately in independent accounting funds within the Company’s total assets (PostavalorePiù and
PostaPensione segregated accounts). The Group guarantees a minimum rate of return on these
products payable upon policy maturity. It follows that the impact of financial risks on investments
can be fully or partly offset by insurance liabilities. In particular, this offsetting is generally relative
to the level and structure of the guaranteed minimum rate of return and to the mechanisms relating
to policyholders’ income interest from segregated accounts. The sustainability of these minimum
returns is assessed by the Company through periodic analyses, conducted with the aid of an
internal financial-actuarial model of Asset Liability Management (hereinafter also “ALM”). For each
segregated account, the ALM simulates the change in value of financial assets and the expected
returns of insurance liabilities both in the case of a “central scenario" (based on current financial
and actuarial assumptions) and in stress scenarios (for economic and financial variables,
surrenders and new production).
40

Index- and unit-linked products, so-called Class III products, refer to policies whose premiums are
invested in structured financial instruments (index linked policies issued prior to the introduction of
ISVAP Regulation No. 32 of June 11, 2009), in Italian Government bonds and in equity warrants
(index linked policies issued after the introduction of ISVAP Regulation No. 32), as well as in (unit
linked) mutual funds.
For index-linked products issued prior to the introduction of ISVAP Regulation No. 32 and for unit-
linked policies, the Company does not offer capital guarantees or minimum rates of return,
therefore financial risks are totally borne by policyholders (the policies’ return is totally indexed to
covering assets). For index-linked policies issued after the introduction of the above-mentioned
Regulation, the Company will take on the insolvency risk of the issuer of the covering assets (the
return on the policies is therefore only partly related to the aforementioned covering assets:
policyholders are protected against the issuer’s insolvency risk).
Within this context, investment strategies and guidelines are defined through specific resolutions
by the Board of Directors. The investment process also provides for a governance system
strengthened by corporate bodies (Investment Committee and Risk Committee), with a consulting
and proactive role towards the Top Management.
The following sub-categories are included in Market Risks:
- Price Risk
- Currency Risk
- Interest Rate Risk
- Credit Risk
Price Risk
This refers to the risk of fluctuations in the price of portfolio equities or of derivative contracts
having as underlying equities, stock market indexes or equity derivatives as well as mutual funds.
This risk is usually divided into a so-called idiosyncratic risk component, linked to specific issuer
conditions, and a systemic risk component that reflects changes in general market conditions. The
amount of portfolio equity securities is greatly reduced. A VaR (Risk Metrics) analysis is conducted
to carry out a Price Risk evaluation.
41
The following is a summary of the analyses performed on market value variability linked to price
trends:
Market risk – Price Data in million Euros
Exposure to
risk
+ Vol - Vol + Vol - Vol + Vol - Vol + Vol - Vol
2012 effects
Available for sale f inancial assets 1,066 77 (77) 77 (77) - - - -
Shareholdings 5 2 (2) 2 (2) - -
Other investments 1,061 75 (75) 75 (75) - -
Financial instruments at fair value through profit or loss3,811 193 (193) 193 (193) 0 (0) - -
Shareholdings - - - - - - -
Structured bonds 3,102 166 (166) 166 (166) 0 (0)
Other Unit investments 709 27 (27) 27 (27) 0 (0)
Derivative f inancial instruments 118 26 (26) 26 (26) - - - -
Fair Value vs profit or loss 118 26 (26) 26 (26) - -
Variability as of December 31, 2012 4,995 296 (296) 296 (296) 0 (0) - -
2013 effects
Available for sale f inancial assets 1,542 73 (73) 73 (73) - - - -
Shareholdings 5 1 (1) 1 (1) - - - -
Other investments 1,537 72 (72) 72 (72) - - - -
Financial instruments at fair value through profit or loss3,211 123 (123) 123 (123) 0 (0) - -
Shareholdings - - - - - - - - -
Structured bonds 2,481 104 (104) 104 (104) 0 (0) - -
Other Unit investments 730 18 (18) 18 (18) 0 (0) - -
Derivative f inancial instruments 210 42 (42) 42 (42) - - - -
Fair Value vs profit or loss 210 42 (42) 42 (42) - - - -
Variability as of December 31, 2013 4,963 238 (238) 238 (238) 0 (0) - -
Analysis reference dateDelta equivalent
Effect on policyholders
liabilitiesResult before taxes
Shareholders' equity
reserves gross of taxes
Currency Risk
This refers to the risk that the value of a financial instrument will fluctuate according to exchange
rate changes of currencies different from the one in the financial statement. For this purpose, the
currency risk in the company’s portfolio was linked to some positions in mutual and property funds
to cover Posta ValorePiù’ provisions, that were expressed in Euros, but included investments in
securities in a currency different from the Euro. The overall exposure to currency risk as of
December 31, 2013 was insignificant.
Interest Rate Risk
Represents the risk that a change in the current level of the forward rates will cause a variation in
the value of situations subject to changes in interest rates. Within the interest rate risk, relevant
ALM analyses are implemented at least quarterly, covering a four year period, with a model that,
based on certain scenario hypotheses (rising/falling interest rates), allows simulations in the
performance of the assets and liabilities in terms of stock, returns and other asset and liability
42

components. The analyses calculate Management Capital Gains/Losses, write-backs/adjustments
of financial statements and returns, at least in the following situations:
Rise/Fall of Rates in the 99,5th percentile and 95th percentile;
Rise of Rates in the 95th percentile and widening of credit spreads;
Fall of Rates in the 95th percentile, reduction in new business and increase in the frequency
of surrenders.
With regard to the rising interest rate scenarios, the analysis focused on the Capital Gains/Losses
and write-backs/adjustments trends in the first 12 months of simulation. In assessing the analysis
results, particularly referred to the effects on company's assets, Company’s "management actions”
were held in due consideration in order to preserve its asset adequacy. The falling rate analysis
focused on the returns trend over a four year projection. From this analysis, as well as from ALM
calculations made in accordance to ISVAP Regulation No. 21, the risk level was considered
satisfactorily sustainable, also in consideration of the minimum guarantees acknowledged by the
Company.
The table below shows a summary of the analyses carried out on market value variability linked to
the interest rate risk:
Interest rate risk
Notional Fair value +100bps -100bps +100bps -100bps +100bps -100bps +100bps -100bps
2012 effects
Available for sale financial assets 44,675.1 46,859.2 (2,268.2) 2,597.4 (2,113.5) 2,441.7 - - (154.7) 155.8
Fixed income securities 44,675.1 46,859.2 (2,268.2) 2,597.4 (2,113.5) 2,441.7 - - (154.7) 155.8
Financial instruments at fair value through
profit or loss 7,129.0 6,152.6 (275.7) 274.9 (275.7) 274.9 - - - -
Fixed income securities 7,129.0 6,152.6 (275.7) 274.9 (275.7) 274.9 - - - -
Variability as of December 31, 2012 51,804.1 53,011.7 (2,543.9) 2,872.3 (2,389.2) 2,716.6 - - (154.7) 155.8
2013 effects
Available for sale financial assets 57,905.8 57,617.7 (3,480.9) 3,378.3 (3,367.3) 3,271.0 - - (113.6) 107.3
Fixed income securities 57,905.8 57,617.7 (3,480.9) 3,378.3 (3,367.3) 3,271.0 - - (113.6) 107.3
Financial assets at fair value through profit
or loss 7,106.2 6,560.7 (253.2) 254.0 (253.2) 254.0 - - - -
Fixed income securities 7,106,167.0 6,560,745.0 (253,202.0) 253,999.0 (253,202.0) 253,999.0 - - - -
Variability as of December 31, 2013 65,011.9 64,178.4 (3,734.1) 3,632.3 (3,620.5) 3,525.0 - - (113.6) 107.3
(Data in million Euros)
Analysis reference dateExposure to risk Delta equivalent
Effect on
policyholders'
liabilities
Result before taxes
Shareholders'
equity reserves
gross of taxes
Credit Risk
This risk is related to issuer’s creditworthiness, in particular it is the risk related to the possibility
that the security issuer will be unable to fulfill contractual obligations as a result of an aggravation
of its financial solidity. Here the impacts associated with the variation of spreads in government
bonds were highlighted. Credit risk assessment was carried out according to the abovementioned
ALM projections and particularly in a situation of credit spread shock. This scenario highlighted
43

sustainable impacts for the Company both in financial report terms and in terms of management
return. The credit risk was also analyzed by monitoring both the average portfolio rating (at
December 2012 equal to BBB) and changes in rating distribution according to classes. The table
below shows the distribution of credit worthiness of the securities portfolio according to classes:
Credit risk Data in million Euros
Loans and receivables - - 11 11 - - 1 1
Loans - - 0 0 - - - -
Receivables - - 11 11 - - 1 1
Available for sale financial assets 1,656 55,693 269 57,618 1,704 43,901 147 45,752
PosteVita Class I debt securities 1,646 53,393 269 55,308 1,632 39,242 147 41,020
PosteVita Class III debt securities - - - - - - - -
PosteVita Patr. Libero debt securities 10 2,214 - 2,224 72 4,591 0 4,664
Other securities and deposits - 86 - 86 - 68 - 68
- - -
Financial assets at fair value through profit or
loss58 9,452 33 9,544 385 8,814 55 9,255
PosteVita Class I debt securities 58 1,083 33 1,174 - 303 55 359
PosteVita Class III debt securities - 8,367 8,367 384 8,505 - 8,890
PosteVita Patr. Libero debt securities - 3 - 3 1 6 - 7
Other securities and deposits - - - - - - - -
Derivative financial instruments - 210 - 210 - 118 - 118
Fair Value vs. Profit or loss - 210 - 210 - 118 - 118
Total 1,714 65,355 314 67,383 2,089 52,834 203 55,126
Balance as of 31.12.13 Balance as of 31.12.12
Descriptionfrom Aaa
To Aa3
from A1
To Baa3
from Ba1
To Not ratedTotal
from Aaa
To Aa3
from A1
To Baa3
from Ba1
To Not ratedTotal
Sensitivity to the credit spread was calculated by applying a +/- 100 bps shift to risk factors
affecting the different types of portfolio securities.
A Value at Risk (VaR)-type of measurement was used to obtain a Country risk assessment that
took into account market conditions and sensitivity indicators, especially for spread values and
considering the high market instability. This indicator represents the maximum potential loss, linked
to spread variation, with a particular probability level (confidence interval) over a particular holding
period. In the analyses carried out, a 99% confidence interval and a 1 day holding period was
considered. The analyses were conducted on risk factors such as governmental and corporate
spreads (divided in Investment Grade and High Yield products).
44

Below are the results of the sensitivity analyses performed on Company’s portfolio securities.
Data in million Euros
Notional Fair value
2012 effects
Available for sale financial assets 44,675.1 46,859.2 1,138,572.0
Government 38,098.4 39,893.8 1,131.7
Corporate Investment Grade 6,423.2 6,818.5 14.6
Corporate High Yield 153.5 146.9 0.7
Financial assets at fair value through profit or loss 7,129.0 6,152.6 122,774.0
Government 6,777.0 5,794.0 121.9
Corporate Investment Grade 296.8 303.5 1.7
Corporate High Yield 55.2 55.1 0.2
Variability as of December 31, 2012 51,804.1 53,011.7 1,261,346.0
2013 effects
Available for sale financial assets 57,905.8 57,617.7 842,335.0
Government 49,586.1 48,853.2 840.7
Corporate Investment Grade 8,002.2 8,437.3 11.7
Corporate High Yield 317.4 327.2 0.9
Financial assets at fair value through profit or loss 7,606.2 7,062.7 60,744.0
Government 6,952.6 6,390.9 60.6
Corporate Investment Grade 622.8 638.7 0.8
Corporate High Yield 30.8 33.1 0.1
Variability as of December 31, 2013 65,511.9 64,680.4 903,079.0
Analysis reference dateExposure to risk
SpreadVaR
Technical Risks
This risks mainly occur in “Life” liabilities which account for over 99% of the Group’s insurance
liabilities. These risks include mortality, longevity and surrenders.
Considering the characteristics of the products offered, the mortality risk was moderately significant
for the Group. These risks were significant only in Term Life Insurance for which a comparison was
periodically carried out between actual deaths and those expected based on demographic
assumptions adopted for the pricing: the first ones were always significantly lower that the second
ones. Moreover, the mortality risk was mitigated by using reinsurance coverage and, in taking on
the risk, by applying definite limits both on the capital and the age of policyholders.
The longevity risk was also moderately significant. For most Life insurance products, the
conversion option was in fact never requested by policyholders. Pension products specifically still
represented a marginal part of insurance liabilities (nearly 4%). Moreover, for these products, the
Groups reserved the right to change the demographic assumptions and the composition according
to gender used for calculating coefficients for return conversion, upon the occurrence of specific
conditions.
Almost all portfolio products did not include surrender penalties. The surrender risk could have
significant impacts for the Company in the case of a mass surrender, but, considering the historical
45
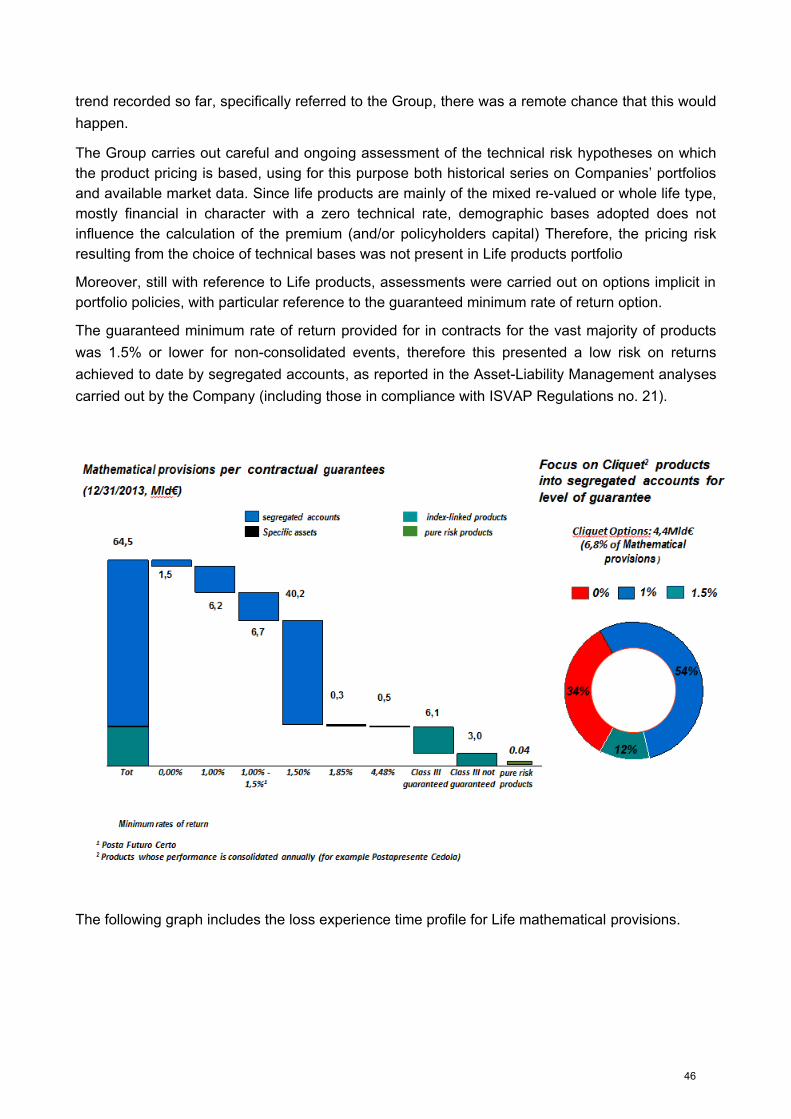
trend recorded so far, specifically referred to the Group, there was a remote chance that this would
happen.
The Group carries out careful and ongoing assessment of the technical risk hypotheses on which
the product pricing is based, using for this purpose both historical series on Companies’ portfolios
and available market data. Since life products are mainly of the mixed re-valued or whole life type,
mostly financial in character with a zero technical rate, demographic bases adopted does not
influence the calculation of the premium (and/or policyholders capital) Therefore, the pricing risk
resulting from the choice of technical bases was not present in Life products portfolio
Moreover, still with reference to Life products, assessments were carried out on options implicit in
portfolio policies, with particular reference to the guaranteed minimum rate of return option.
The guaranteed minimum rate of return provided for in contracts for the vast majority of products
was 1.5% or lower for non-consolidated events, therefore this presented a low risk on returns
achieved to date by segregated accounts, as reported in the Asset-Liability Management analyses
carried out by the Company (including those in compliance with ISVAP Regulations no. 21).
The following graph includes the loss experience time profile for Life mathematical provisions.
46

Here below is the time line of mathematical provisions according to the contract expiration which
the provisions referred to.
Based on the above trends, 72% of the provisions being examined experienced losses within 10
years and there was no particular concentration of expiration dates. Long-term guarantee
incidence was moderate and mainly refereed to pension-type products.
Risks linked to the Non-Life portfolio were technical and stemmed from business underwriting
policies (underwriting risk) and by reserving policies relating to the acquired portfolio (reserving
risks).
With reference to the technical and economic trend, historical data showed that the Group’s Non-
Life products were particularly well placed also with reference to market trends.
47
For monitoring reserving risks, the Group implemented an automated reserve calculation process
based on prudential methods and assumptions, as well as on the best market practices.
Within the Life business, particularly important was the use of reinsurance as a risk mitigation tool.
In particular, the goals of the reinsurance strategy were:
Risk division and underwriting capacity;
Portfolio balance and strengthening of the economic and financial solidity.
With reference to technical risks, in order to ascertain that proceeds, made of premiums cashed in,
are sufficient to cover expenses, made of commissions, claims and costs, the Group carried out
specific analyses, also using stress tests on claim frequency and amounts. Stress test results did
not show any criticality.
Liquidity Risks
These are risks of not being able to obtain funds at market conditions to meet obligations relating
to liabilities. Liquidity risks mainly occur when the Group is not able to sell a financial asset quickly
at a value close to fair value, i.e. without incurring in significant capital losses.
For analyzing the liquidity risk profile, Poste Vita S.p.A. carried out ALM analyses aimed at
effectively managing assets with respect to obligations undertaken to policyholders. Poste Vita
S.p.A. also drafted perspective analyses on the effects of shocks occurring in financial markets
(asset trends) and in policyholders' behavior (liability trends). As of December 31, 2013, Class I
showed liabilities with an average maturity of nearly 10.44 years compared to an 8.25 year
average duration of covering assets (as of December 31, 2012 respectively 9.88 and 7.57 years).
The scope of the analysis also concerned PostavalorePiù’s segregated accounts, accounting for
96% of the Company's Class I operations (in terms of book value of investment management).
Projections analyzed management’s incoming flows (coupons, expirations, new production) and
outgoing flows (surrenders, expirations, deaths, coupons) in order to evaluate the net balance
amount. Analysis results always showed largely positive balances thanks above all to the amount
of flows from new production.
It should be noted that the Company had a high level of available resources to cope with flows
from liability maturities. This is also supported by past evidence when the Company maintained a
largely positive net balance of flows in situations of growing proceeds and of surrender levels not
showing any particular variability and not connected with specific market trends.
48

49

Moreover, the Group’s asset portfolio is formed for the most part by securities with a high
marketability level, as shown by the following graph in which assets covering Class III policies are
not included.
Counterparty Risk (default)
Default risks are connected with counterparties’ insolvency (reinsurers, banks, insured parties,
insurance intermediaries, derivatives).
Exposure towards policyholders and the insurance intermediary (Patrimonio Bancoposta, allocated
property of Poste Italiane, the insurance Group’s majority shareholder) is insignificant. Exposure
towards banks only refers to liquidity at primary national banks.
As for reinsurance counterparties, the Group defined policies for managing and controlling this risk
in terms of guidelines and limits for counterparties.
Exposure was therefore focused on reinsurers with a primary credit standing.
Exposure in derivatives was totally insignificant and did not generate any counterparty risk since
the Group’s portfolio instruments (warrants for covering some index linked Life bonds) were
covered by the counterparty’s default risk through collateralization.
Operational Risks
Although included in the "quantifiable risks" and in order to be identified and evaluated, Operational
Risks require a specific process that includes the various types of risks forming them.
In particular, the need for a specific process stems from their nature of being risks highly linked to
the activities carried out within the Company, that are varied, as well as from the fact that the
50

capital requirement determined with the standard method is not able to understand such specific
quality.
According to the definition adopted by the Insurance Group, Operational Risks are risks of
incurring in losses due to the inefficiencies of people, processes and systems or to external events
such as fraud or service provider activities. Risks of non-compliance with rules are also included
within operational risks.
The evaluation of operational risk exposure is carried out through the Risk Self Assessment
process, aiming at providing a self assessment regarding the following aspects:
events that may occur in the future, meaning potential events and not only those identified from
past experience;
how often such events will occur; this aspect is necessary to determine the potentiality of risks
that didn’t occur in the past;
the actual financial impact of potential loss events when these occur;
control mechanism effectiveness.
This evaluation system is carried out by means of questionnaires to detect the level of risk
exposure per operational segments, through a combination of opinions expressed in terms of
potential economic impact and incident frequency.
The evaluation of organizational mechanisms (as seen in the previous paragraph) is carried out
per Operational Unit and type of operational risk that the unit is potentially exposed to, and not per
single event. The evaluation carried out by the Process Owner is then used to obtain a risk value
mitigated by the control mechanism.
The analysis is conducted on: operational structures, risk causes, risks. Results that can be
obtained through the self-assessment process are:
for each analysis element, determining the maximum potential loss associated with the risk,
both gross and net of control mechanisms;
identifying areas that are most exposed to operational risks;
determining a corrective action plan.
The overall risk level appears to be low and mitigated by satisfactory control mechanisms.
Other Risks
This category includes strategic risks and reputational risks.
Strategic Risks
Is the current or prospective risk of a decline in earnings or capital arising from changes in the
operating environment, from incorrect business decisions, inadequate decision implementation or
lack of reaction to changes in the competitive and market environment.
This risk is characterized by a satisfactory control level: risk management is inherent in strategic
planning processes and, consistently with them, includes a three year timeframe with annual
update. Within this context, hypotheses adopted in plan drafting are subject to periodic assessment
and, if necessary, adapted to new market conditions.
51

The next paragraph should also be referred to, "Solvency II – Company developments in the Risk
Measurement System".
Reputational Risks
Is the current or prospective risk of a decline in earnings or capital arising from a negative
perception of the company image by customers, counterparties, shareholders, employees,
investors or Supervisory Authorities.
The activities of the Company, belonging to the Poste Italiane Group, are normally susceptible to
reputational risk elements, also considering the type of customers (mainly mass market). For this
reason, in addition to a reputational risk mapping through dedicated "Executive Workshops", Poste
Vita carried out a detailed risk monitoring and control activity on all its insurance products.
Any anomalies and/or increases in the risk of negative product performance are brought to the
attention of the Risk Committee and the Board of Directors.
In particular, with regard to Class III investments, for covering "index linked" and "unit linked"
products issued before the abovementioned ISVAP Regulation No. 32, the Company offered no
minimum rate of return or capital guarantee: therefore, for these products, risk control aimed at
preventing risks of a reputational and legal nature (risk of negative economic consequences due to
changes in customers’ opinion or fiduciary relationship or of damage arising from legal claims by
customers or Authorities). Analysis and management of reputational risks for Class III products is
therefore carried out through market/credit risk identification, assessment and management for
individual products.
52

RELATIONSHIPS WITH THE HOLDING AND OTHER POSTE ITALIANE GROUP COMPANIES
The Company is wholly owned by Poste Italiane S.p.A, which provides management and
coordination activities to the Group.
Transactions with Poste Italiane S.p.A. (who holds all the shares), were governed by written
contracts, adjusted to market conditions mainly concerning:
the placement and distribution of insurance products at post offices and related activities;
post office current accounts;
partial secondment of personnel used by the Company;
support in business organization, personnel selection and management;
pick-up, packaging and shipping service for ordinary mail; and
call center services.
A service contract relating for information technology is currently being finalized with Poste Italiane
S.p.A.
Furthermore, as at 31 December 2013 subordinated loan notes totaling €540m issued by the
Company were underwritten by Poste Italiane S.p.A., and remunerated at market conditions, thus
reflecting the creditworthiness of the insurance Company.
In addition to the relationship with the Company, the Group companies also maintained operational
relations with other Poste Italiane Group companies, particularly for:
managing the Company’s available assets and of part of the Segregated Accounts’ portfolio
investments (Bancoposta SGR Funds);
printing, enveloping and mail delivery through information systems; management of
incoming mail, dematerialization and filing of printed documentation (Postel);
services related to network connections with the Italian post office counters (Postecom);
mobile telephone services (Poste Mobile);
advice on obligations pertaining to occupational health and safety (Poste Tutela);
Term Life Insurance Policies (Postel and BdM-MCC)
Policies for Non-Life classes (PdM-MCC – Postel), General Third Party Liability (Postel)
and Fire – Loans (BdM – MMC).
These relationships were also governed at market conditions.
53

OTHER INFORMATION
Information relative to own shares and/or to those of the Holding owned, purchased or
transferred in the period
The Company does not own nor did it purchase or transfer its own or the Holding’s shares.
Transactions with related parties
In addition to other companies included in the Poste Italiane Group, whose relationships have
already been described in the previous paragraph, according to the provisions of IAS 24 (par. 9)
related parties are the MEF - Ministry of Economics and Finances, Cassa Depositi e Prestiti SpA,
bodies controlled by MEF, and Company Managers with strategic responsibilities. The
Government and public bodies different from the MEF and from the bodies controlled by the
Ministry are not considered Related Parties; furthermore, relationships deriving from financial
assets and liabilities represented by financial instruments are not considered Related Party
transactions
Given the above, it should be noted that, in 2013, the only major transaction implemented by the
Company with related parties external to the Poste Italiane Group referred to an office rental
contract entered into at market conditions with the company EUR S.p.A. (90% owned by MEF).
No related party transactions were carried out by Directors and Managers having strategic
responsibilities within the Company.
Transfer of the “Non-Life” portfolio from Poste Vita to Poste Assicura
Based on the attempt to upgrade and improve activities and achieve adequate synergy within the
insurance group, a transaction is being finalized for the transfer, upon payment, of the “Non-Life”
portfolio of Poste Vita’s retail customers to the subsidiary Poste Assicura.
Authorization for creating an open pension fund
In order to increase the current offer for insurance products and services and in line with the
current development of supplementary pension plans, in the first half of the year, the Company
requested and obtained the authorization to create an open pension fund named “POSTEVITA
FPA – FONDO PENSIONE APERTO”. The authorization was issued with provision COVIP dated
July 17, 2013. Activity is expected to begin during the first half of 2014.
Claims
During 2013, the Parent Poste Vita received 1,532 new claims, while in 2012 there were 2,448.
The incidence of claims on the number of existing contracts as of December 31, 2013 was equal to
0.03% (0.06% in 2012). The average time for processing a claim during the year was equal to
nearly 18 days (27 days in 2012).
Regarding the PIP product (individual pension plan), during 2013, the Company received 546
claims, decreased compared to 566 in 2012. The percentage incidence of claims on the number of
54

existing contracts as of December 31, 2013 was equal to 0.01%, in line with 2012. The average
processing time was equal to nearly 18 days (30 days in 2012).
During 2013, the Subsidiary Poste Assicura received 598 new claims, while there were 525 in
2012. The incidence of claims on the number of existing contracts as of December 31, 2013 was
equal to 0.07%. The average time for processing claims over the year was equal to nearly 23
days.
Regulatory developments
The main regulatory developments occurred during 2013 that affected the Italian insurance market
are described here below:
IVASS published its Provision No. 7 dated July 16, 2013 on “home insurance”, implementing
article 22, par. 8, of Legislative Decree No. 179 dated October 18, 2012 regarding “Additional
urgent measures for the Country’s development”. As of September 1, 2013, consumers
entering into an insurance policy contract, will be able to request the activation, within their
insurance company’s website, of a reserved area where they can enter under protected mode.
In this area, consumers can verify in real time their insurance position, current coverage and
the relative premium expirations, learn about the surrender value of their Life policy or about
the value of their benefits for insurance products with a financial content, verify and download
the statement of risk status for their automobile third party liability insurance and receive
periodical notices from the insurer. The provision indicated the contents of areas reserved to
customers as well as enter modes, also specifying principles of correctness and transparency
and leaving each company free to make other services available to customers. Home
insurance aimed at simplifying and expediting relations with the insurance company, which
thus became more immediate and transparent.
On June 17, 2013, IVASS published its national report on the results of the Long Term
Guarantee Assessment (LTGA), the impact study conducted in Europe to contribute to the total
definition of Solvency II, the future vigilance system on the insurance sector. The nationwide
report illustrated results for the Italian market and integrated the European report published last
June 14 by the EIOPA, the European Authority of the insurance sector. National results
highlighted the need for the current Solvency II to be modified to avoid that short-term market
volatility apply an inadequate impact on the solvency assessment of insurance companies,
mainly in relation to the long-term business. The efficacy of tested measures was however
unsatisfactory. EIOPA therefore stressed the need to make some changes to measures,
suggesting to replace one of them (the Counter-Cyclical Premium) with a new instrument, the
Volatility Balancer. Based on IVASS’ assessments of the Italian market, the Volatility Balancer,
as initially designed and measured by EIOPA, did not seem to be effective.
On July 22, 2013, Banca d’Italia, Consob, Ivass and Covip issued –relative to their
competence- communications regarding: the proper operation of the risk management system,
obligations pertaining to correctness and the transparency of investment and pension funds
and obligation on the appropriateness of procedures aimed at assessing investments by
insurance companies, to reduce the over-reliance on opinions expressed by agencies for
security rating (UCITS), alternative investment funds and pension funds. The recipients of
these Notices will have to adopt adequate internal creditworthiness assessment processes
allowing them to not exclusively nor automatically rely on the opinions issued by rating
agencies. With reference to collective investments and to pension funds, these obligations will
55
have to be included in the management assignment or in additional clauses concerning
relations with customers. In line with the various regulations on this issue, Authorities will verify
compliance with the above-mentioned obligations, monitoring the appropriateness of the
internal creditworthiness assessment processes and of risk management systems.
Last August 31, Law Decree No. 102, better known as the “Action Decree bis” was published
on the Gazzetta Ufficiale No. 204, becoming effective on the same day. The novelties of the
final text included reforming art. 15 letter F) of Presidential Decree No. 916 dated 1986, with
the ceiling of Life policies that can be detracted for tax purposes reduced by half, from
1,291.14 Euros to 630 for the tax period as of December 31, 2013, and to 230 Euros as of
December 31, 2014. These new limits for tax deduction also included premiums paid for Life
insurance contracts and for accident policies entered into or extended for the 2000 tax period.
To date, the decree has not yet been converted into a law.
Art. 2, par. 2, of Legislative Decree 133/2013 included, only for 2013, an increase in the IRES
tax rate from 27.50% to 36% for banks, insurances and other financial companies, with the
introduction of an additional 8.5% tax.
Art. 11, par. 20, of Legislative Decree No. 76 dated June 28, 2013 established, only for the tax
period ending at December 31, 2013, an increase in advance payments of the IRES tax equal
to 101% of 2012 taxes. Following the issue of Legislative Decree No. 133 dated November 30,
2013, (Law Decree on “Urgent provisions regarding the IMU tax, the sale of public property
and the Bank of Italy”, published on the Gazzetta Ufficiale No. 281 dated November 30, 2013),
legislation established that the loss of proceeds stemming from the removal of the second
installment of the 2013 IMU tax on the principal home had to be offset by an increase in the
advanced payments of IRES and IRAP taxes by companies operating in the financial and
insurance sector. Art. 2 of Legislative Decree 133/2013, in fact, introduced in art. 11 of
Legislative Decree 76/2013 a new par. 20-bis, that established-for financial and credit
institutes, the Bank of Italy and insurance companies- an additional 128.5% increase in
advanced payments only for the 2013 tax period. Moreover, with another Decree by the
Ministry of Economics, dated November 30, 2013, a general 1.5% increase was established for
IRES and IRAP advanced payments by capital-based companies for 2013 and 2014.
Therefore, based on the joint provisions of Legislative Decree 133/2013 and of Ministerial
Decree dated November 30, 2013, the amount of the IRES tax advance payments by bodies
operating in the financial and insurance sectors for 2013 was increased by 130%.
IVASS issued Provision No. 14 dated January 28, 2014 that modified and integrated
Regulation No. 7 dated July 13, 2007, regarding charts for the financial statements of
insurance and reinsurance companies that are subject to the adoption of International
accounting criteria included in Title viii (Financial statements and accounting records), chapter i
(General provisions on financial statements), chapter i (Financial statements), chapter iii
(Consolidated financial statements) and chapter v (Auditing) of Legislative Decree No. 209
dated September 7, 2005 – Code of private insurances.
56

The “Solvency II” Regulations
The European project for reforming prudential supervision on insurance activities, known as
Solvency II, will have a significant impact on the Insurance Group Poste Vita’s governance and
control system.
The goal of the important changes and innovations introduced by the Solvency II Directive
(2009/138/EC) was to not only change the quantitative criteria for calculating the Solvency margin,
but also and above all to review the set of rules aiming at supervising stability in insurance and
reinsurance companies.
On last November 13, 2013, the European Parliament, the European Council and the European
Commission reached an agreement on the Omnibus II Directive that will amend the Solvency II
Framework Directive.
In particular, Omnibus II includes some fundamental elements for acknowledging the principles
identified by the Solvency Framework Directive within the context that characterizes the European
insurance market after the financial crisis.
Moreover, the Omnibus II proposal also includes provisions aimed at identifying the dates in each
Member State for acknowledging and applying for the first time the Solvency II Directive,
established, respectively, on March 31, 2015 and January 1, 2016.
The 2014 financial year will require insurance companies to immediately implement various
provisions of the Solvency II regulations. In the last months of 2013, EIOPA in fact published the
final Guidelines for the preparatory stage to the introduction of Solvency II (so called Interim
Measures). These Guidelines are being acknowledged in the national regulatory framework
through changes in Regulations and letters to the market by IVASS provide for an early and
gradual application of the provisions in 2014-2015, relative to some Solvency II’s key aspects such
as:
governance of the risk management system;
ORSA process, i.e. actual and perspective risk assessment;
supervisory reporting.
During 2013, the Insurance Group implemented activities to adapt to the new Solvency II
requirements, in accordance with internal plans. In 2014, the commitment to adopt Solvency II
regulations will be additionally strengthened to guarantee acceptance of the Interim Measures
according to the timeframe indicated by the Vigilance Authority, with reference to the above-
mentioned areas.
Social and Cultural Initiatives
During 2013, Poste Vita continued to support specific social and cultural initiatives promoted by the
following associations:
The Association Ali di Scorta (Spare Wings), a non-profit organization for the fight
against cancer in children: organization of the Christmas concert at the Basilica of Saints John
and Paul at the Celio.
Ambienta Foundation: Project “Tondo come il Mondo" (Round as the World), allowing 50,000
children to learn to respect the environment and adopt sustainable lifestyles, thanks to the
distribution of a kit specially designed for this purpose in the third, fourth and fifth year of
elementary schools.
57

The “Fryderyk Chopin” Cultural Association: the organization of the International Piano
Competition "Rome 2013", one of the most prestigious initiatives of the capital’s music
program, a real international showcase for young piano talents. The competition involves
young Italian and foreign talents from 30 countries and is organized in Rome under the artistic
direction of Marcella Crudeli, founder and president of the Association
Accademia Nazionale di Santa Cecilia, the oldest musical institution in the world, now one of
the main artistic European venues with a symphonic orchestra and chorus among the most
well-known internationally.
The Minerva Award: the first Italian award solely addressed to women, established in 1983. It
created an all female "knowledge holding" across its various categories (management, civil and
human rights, entrepreneurship, science, arts, etc.)
Susan G. Komen Italia, an International nonprofit organization in Italy that has been fighting
against breast cancer as of 2000: they organize the Race for the Cure event, a charity
marathon which Poste Vita supported with its own team who participated in the race initiative
(marathon and walk) in Rome at Circo Massimo, in May.
Orchestra Sinfonica dell'Europa Unita (OSEU): organization of a concert/event in
collaboration with the Presidency of the Council of Ministers, the Lazio Region and La
Sapienza University. Proceeds were devolved to Mali for rebuilding an ancient library that had
been destroyed by Islam extremists. The concert was presented by Rai Uno Mattina.
Film Festival Senza Frontiere, held in Spoleto last July, as part of the 56th edition of the
Festival dei Due Mondi. This year’s theme was tolerance. The source of inspiration was a
sentence by Dalai Lama “In the practice of tolerance, one's enemy is the best teacher”. The
event took place under the patronage of UNESCO, Presidency of the Council of Ministers,
Ministry for Cultural Heritage and Activities, Ministry of Foreign Affairs, Municipality of Spoleto,
Umbria Region, University of Bologna – DAMS, University of Perugia, University for Foreign
Students of Perugia, Agiscuola.
Moreover, Poste Vita is a supporting member of Valore D - Donne al Vertice per l'Azienda di
Domani (W Value - Women at the Head of Tomorrow’s World), the first association of large
companies created in Italy to support women leadership in companies.
58

SIGNIFICANT EVENTS OCCURED AFTER YEAR-END
In order to support the commercial developments expected for the next three years, while
maintaining a solvency ratio of 120% until the introduction of the new Solvency II Regulations,
Poste Vita’s Board of Directors resolved the issuance of a subordinated loan for the notional total
amount of €750m, to be placed in the professional investor market.
On 19 February 2014 official changes to Poste Vita and Poste Assicura’s distribution agreements
with Poste Italiane S.p.A. were made and signed, and will be effective until March 2019, with the
possibility of a tacit renewal for another five years (unless terminated). On 2 April 2014, IVASS
began an inspection of the Company, which is still underway.
59

OUTLOOK
Despite a still difficult national and international social and economic context and an increasingly
aggressive competition, the Company’s management in 2014 will continue to be based on the
following strategic and industrial priorities:
Consolidating and strengthening the Group’s placement within the Life market with a particular
focus on the supplementary pension segment and new welfare needs.
Developing the Non-Life business with the goal of placing the subsidiary Poste Assicura in an
important position within its reference market.
The 2014 management will be based on implementing important initiative also in the distribution
and financial sectors to achieve an additional profitable business development. In 2013, the
Company established a supplementary health assistance fund that represented a collective offer
solution, mainly addressing companies interested in providing their employees with a type of
health protection solution.
New important projects were also launched that will involve the company during the year, among
which work to adapt to the “Solvency II” regulations that will become operational with the first
provisions as of 2015.
Moreover, within May, the above-mentioned subordinated loan for € 750m is expected to be
issued, to be placed in the institutional investor market.
Rome, March 25, 2014
The Board of Directors
60

BALANCE SHEET- ASSETS
data in thousand Euros
31/12/2013 31/12/2012 31/12/2011
1 INTANGIBLE ASSETS 10,513 4,853 2,080
1.1 Goodwill - - -
1.2 Other intangible assets 10,513 4,853 2,080
2 TANGIBLE ASSETS 2,954 2,412 1,113
2.1 Land and buildings - - -
2.2 Other tangible assets 2,954 2,412 1,113
3 AMOUNTS CEDED TO REINSURERS FROM TECHNICAL PROVISIONS 40,340 27,949 17,917
4 INVESTMENTS 69,852,153 58,307,422 45,753,173
4.1 Land and buildings (investment properties) - - -
4.2 Investments in subsidiaries, associated companies and joint ventures 197,019 198,666 198,899
4.3 Held to maturity investments - - -
4.4 Loans and receivables 11,458 102,146 208,543
4.5 Available for sale financial assets 59,159,855 47,924,881 35,634,933
4.6 Financial assets at fair value through profit or loss 10,483,821 10,081,729 9,710,799
5 OTHER RECEIVABLES 73,003 40,873 35,174
5.1 Receivables arising out of direct insurance operations 10,225 7,522 31,480
5.2 Receivables arising out of reinsurance operations 11,022 6,445 3,153
5.3 Other receivables 51,755 26,907 541
6 OTHER ASSETS 1,219,779 780,440 646,547
6.1 Non-current assets or disposal groups as classified as held for sale - - -
6.2 Deferred acquisition costs 44,505 30,704 19,078
6.3 Deferred tax assets 9,754 8,415 57,914
6.4 Tax receivables 1,164,433 740,329 568,889
6.5 Other assets 1,086 992 667
7 CASH AND CASH EQUIVALENTS 804,856 1,025,293 556,624
TOTAL ASSETS 72,003,597 60,189,243 47,012,627
61

SHAREHOLDERS' EQUITY AND LIABILITIES
data in thousand Euros
31/12/2013 31/12/2012 31/12/2011
1 SHAREHOLDERS' EQUITY 2,763,515 2,108,439 1,643,469
1.1 shareholders' equity attributable to the group 2,763,515 2,108,439 1,643,469
1.1.1 Share capital 1,216,608 866,608 866,608
1.1.2 Other equity instruments - - -
1.1.3 Capital reserves - - -
1.1.4 Revenue reserves and other reserves 1,142,652 869,280 698,434
1.1.5 (Own shares) - - -
1.1.6 Reserve for currency translation differences - - -
1.1.7 Reserve for unrealized gains or losses on available for sale financial assets 148,130 99,211 (92,502)
1.1.8 Reserve for other unrealized gains and losses through equity 5 (32) 84
1.1.9 Result of the period 256,120 273,372 170,846
1.2 Shareholders' equity attributable to minority interests - - -
1.2.1 Share capital and reserves - - -
1.2.2 Reserve for unrealized gains and losses - - -
1.2.3 Result of the period - - -
2 PROVISIONS 10,050 8,609 20,300
3 INSURANCE PROVISIONS 68,005,153 56,770,888 44,260,929
4 FINANCIAL LIABILITIES 544,179 544,294 613,789
4.1 Financial liabilities at fair value through profit or loss - - 67,878
4.2 Other financial liabilities 544,179 544,294 545,911
5 PAYABLES 144,084 125,348 102,298
5.1 Payables arising out of direct insurance operations 94,044 68,076 60,545
5.2 Payables arising out of reinsurance operations 12,856 10,914 10,028
5.3 Other payables 37,184 46,358 31,725
6 OTHER LIABILITIES 536,616 631,665 371,842
6.1 Liabilities directly associated with non - current assets and disposal groups classified as held for sale - - -
6.2 Deferred tax liabilities 108,897 74,910 159,816
6.3 Current tax liabilities 422,849 553,195 210,013
6.4 Other liabilities 4,870 3,560 2,013
TOTAL SHAREHOLDERS' EQUITY AND LIABILITIES 72,003,597 60,189,243 47,012,627
62

INCOME STATEMENT
data in thousand Euros
31/12/2013 31/12/2012 31/12/2011
1.1 Net premiums earned 13,200,235 10,535,625 9,524,903
1.1.1 Gross earned premiums 13,234,450 10,561,925 9,544,202
1.1.2 Earned premiums ceded (34,215) (26,301) (19,300)
1.2 Fee and commission income - 187 3,150
1.3Net Income from financial instruments at fair value through profit or
loss 744,535 1,465,183 (416,636)
1.4 Income from subsidiaries, associated companies and joint ventures - - 42,288
1.5Income from other financial instruments and land and buildings
(investment properties) 2,299,056 1,898,260 1,414,684
1.5.1 Interest income 2,090,411 1,739,213 1,348,222
1.5.2 Other income 30,496 30,255 17,624
1.5.3 Realized gains 178,149 128,792 48,838
1.5.4 Unrealized gains - - -
1.6 Other income 851 2,760 16,141
1 TOTAL INCOME 16,244,678 13,902,015 10,584,531
2.1 Net Insurance benefits and claims (15,275,329) (12,996,478) (9,894,396)
2.1.1 Claims paid and change in insurance provisions (15,295,296) (13,008,039) (9,903,381)
2.1.2 Reinsurers' share 19,967 11,562 8,985
2.2 Fee and commission expenses - (126) (2,280)
2.3Expenses from subsidiaries, associated companies and joint
ventures(1,648) (224) 0
2.4Expenses from other financial instruments and land and buildings
(investment properties)(48,432) (136,206) (79,132)
2.4.1 Interest expense (18,455) (22,826) (26,280)
2.4.2 Other expenses - - -
2.4.3 Realized losses (29,976) (113,380) (52,852)
2.4.4 Unrealized losses - - 0
2.5 Acquisition and administration costs (381,723) (286,757) (305,425)
2.5.1 Commissions and other acquisition costs (315,060) (227,574) (254,169)
2.5.2 Investment management expenses (26,509) (21,489) (18,734)
2.5.3 Other administration costs (40,154) (37,695) (32,521)
2.6 Other expenses (30,943) (32,427) (22,541)
2 TOTAL COSTS AND EXPENSES (15,738,075) (13,452,218) (10,303,773)
EARNINGS BEFORE TAXES 506,603 449,797 280,758
3 Income taxes (250,483) (176,425) (109,912)
EARNINGS AFTER TAXES 256,120 273,372 170,846
4 RESULT OF DISCONTINUED OPERATIONS - - -
CONSOLIDATED RESULT OF THE PERIOD 256,120 273,372 170,846
Result fo the period attributable to the group 256,120 273,372 170,846
Result fo the period attributable to minority interests - - -
63

COMPREHENSIVE INCOME STATEMENT
2013 2012
CONSOLIDATED RESULT OF THE PERIOD 256,120 273,372
Other income components net of taxes without reclassification in the income statement - -
Change in Shareholders' equity of subsidiaries - -
Change in reserve for revaluation model on intangible assets - -
Change in reserve for revaluation model on tangible assets - -
Income and expenses from on - current assets and disposal groups classified as held for sale - -
Profit and actuarial losses and adjustments arising from defined benefit plans 36 - 107
Other components - -
Other income components net of taxes with reclassification in the income statement - -
Reserve due to net exchange differences - -
Profit or losses from available for sale financial assets 48,919 191,713
Profit or losses from financial flow hedging instruments - -
Profit or losses from net investment hedging instruments in foreign operations - -
Change in Shareholders' equity of subsidiaries 1 - 9
Income and expenses from on - current assets and disposal groups classified as held for sale - -
Other components - -
TOTAL COMPONENTS OF OTHER COMPREHENSIVE INCOME 48,956 191,598
TOTAL CONSOLIDATED COMPREHENSIVE INCOME STATEMENT 305,076 464,970
attributable to the group 305,076 464,970
attributable to minority interests - -
in thousand Euros
05 Comprehensive Income Statement 64

STATEMENT OF CHANGES IN SHAREHOLDERS' EQUITY
Amounts as of 31-
12-2011Changes in amount Allocation
Transfer to profit and
loss accountOther transfer
Amounts
as of 31-12-12
Changes in
amountAllocation
Transfer to profit and
loss accountOther transfer
Amounts
as of 31-12-13
866,608 - - - - 866,608 - 350,000 - - 1,216,608
Other equity instruments - - - - - - - - - - -
Capital reserves - - - - - - - - - - -
Revenue reserves and other reserves 698,434 - 170,846 - - 869,280 - 273,372 - - 1,142,652
Own shares) - - - - - - - - - - -
Result of the period 170,846 - 102,526 - - 273,372 - 17,252 - - - 256,120
Components of other comprehensive income 92,419 - - 185,695 5,903 - 99,179 - 48,422 533 - 148,135
Shareholders' equity attributable to the group 1,643,469 - 459,067 5,903 - 2,108,439 - 654,542 533 - 2,763,515
Share capital and reserves attributable to minority interests - - - - - - - - - - -
Result of the period - - - - - - - - - - -
Components of other comprehensive income - - - - - - - - - - -
Shareholders' equity attributable to minority interests - - - - - - - - - - -
1,643,469 - 459,067 5,903 - 2,108,439 - 654,542 533 - 2,763,515 Total
in thousand Euros
Shareholders' equity
attributable to the group
Share capital
Shareholders' equity
attributable to minority
interests
06 - Statement of changes in sharohelders' equity65

STATEMENT OF CASH FLOW (indirect method)
2013 2012
Result of the period before taxes 506,603 449,797
Changes in non-monetary items 10,796,317 11,423,471
Change in the provisions for unearned premiums for non-life segment 9,230 5,647
Change in the provisions for outstanding claims and other technical provisions for non-life segment 7,266 3,816
Change in the mathematical provisions and other insurance provisions for life segment 11,205,377 12,490,465
Change in deferred acquisition costs -13,801 -11,627
Change in provisions 1,441 -11,691
Other non-monetary proceeds and expenses from financial instruments, property investments and
shareholdings-418,882 -1,057,410
Other changes 5,685 4,272
Change in receivables and payables from operating activities -222,243 219,821
Change in receivables and payables arising out of direct insurance and reinsurance operations 22,140 27,572
Change in other receivables and payables -244,383 192,248
Income taxes paid -311,997 -67,008
Net cash flows from monetary items related to investing or financing activity -402,092 -438,809
Financial liabilities from financial contracts issued by insurance companies - -
Payables to banks and customers - -
Loans and receivables from banks or customers - -
Other financial instruments at fair value through profit or loss -402,092 -438,809
TOTAL NET CASH FLOWS FROM OPERATING ACTIVITIES 10,366,588 11,587,273
Net cash flows from land and buildings (investment properties) - -
Net cash flows from investments in subsidiaries, associated companies and joint ventures 1,647 233
Net cash flows from loans and receivables 90,688 106,397
Net cash flows from held to maturity investments - -
Net cash flows from available for sale financial assets -10,816,091 -11,232,538
Net cash flows from tangible and intangible assets -10,553 -7,324
Net cash flows from other investing activities - -
TOTAL NET CASH FLOWS FROM INVESTING ACTIVITIES -10,734,309 -11,133,233
Net cash flows from equity instruments attributable to the group 147,399 16,246
Net cash flows from own shares - -
Distribution of dividends attributable to the group - -
Net cash flows from share capital and reserves attributable to minority interests - -
Net cash flows from subordinated liabilities and other similar liabilities -114 -1,617
Net cash flows from other financial liabilities 0 0
TOTAL NET CASH FLOWS FROM FINANCING ACTIVITY 147,284 14,629
Effect of exchange rate changes on cash and cash equivalents - -
CASH AND CASH EQUIVALENTS AT THE BEGINNING OF THE PERIOD 1,025,293 556,624
CHANGES IN CASH AND CASH EQUIVALENTS -220,437 468,669
CASH AND CASH EQUIVALENTS AT THE END OF THE PERIOD 804,856 1,025,293
in thousand Euros
07 Statement of Cash Flow
66

POSTE VITA GROUP
CONSOLIDATED
FINANCIAL STATEMENTS

INTRODUCTION
As part of the planned transaction to issue subordinated loan notes during the first half
of 2014, Poste Vita S.p.A. (the “Company” and together with its subsidiary Poste
Assicura S.p.A. the “Poste Vita Group” or the “Group”) has prepared, for the first time,
consolidated financial statements for the year ended 31 December 2013 in accordance
with the IAS/IFRS international standards issued by the International Accounting
Standards Board (IASB). Such standards were approved by the EU and are also based
on the provisions of Isvap Regulations (now IVASS) No. 7 dated 13 July 2007 and
subsequent amendments. The Poste Vita Group did not prepare consolidated financial
statements in previous years having exercised the exemption provided by article 21,
paragraph 1, of the above-mentioned Isvap Regulations (now IVASS) No. 7.
IFRS refers to all International Financial Reporting Standards, all International
Accounting Standards (IAS) and all interpretations of the International Financial
Reporting Interpretations Committee (IFRIC), previously known as the Standing
Interpretations Committee (SIC), adopted by the European Union and part of EU
Regulations issued until 25 March 2014, the date on which the annual financial
statements were approved by Poste Vita S.p.A.’s Board of Directors.
The Statement of Financial Position, Income Statement, Statement of Comprehensive
Income, Statement of Changes in Equity, Statement of Cash Flows (prepared under
the indirect method) and notes thereto (together the “Consolidated Financial
Statements”) have been prepared in line with the models defined by the Supervisory
Authority in Regulation No. 7 of 13 July 2007, and subsequent amendments, and
according to the instructions included in the Regulations.
The Consolidated Financial Statements were prepared on a going concern basis and
the accounting standards described in this document reflect the full operations of the
Poste Vita Group. There are no current doubts over the Group’ s capacity to continue
to operate as a going concern.
The Consolidated Financial Statements have been prepared in Euros. All values in the
financial statements and the notes thereto are expressed in thousand Euros (€’k),
unless otherwise indicated.
68

PART A – TRANSITION TO INTERNATIONAL FINANCIAL REPORTING STANDARDS
The application of international reporting standards had a significant impact on the
calculation of assets and liabilities in comparison to the local accounting standards
adopted in the preparation of the financial statements of the individual entities included
in the scope of consolidation.
The criteria for recognition, measurement and derecognition under IAS/ IFRS in the
preparation of the first consolidated financial statements are detailed later in this
section.
IFRS 1 “First-time adoption of International Financial Reporting Standards" amended
by EU Regulation No. 1255/2012 and by EU Regulation No. 183/2013, is the
accounting standard relating to the first time application of IAS / IFRS and establishes
methods to be adopted for the transition to the new accounting standards. The
standard is intended to ensure that the first financial statements prepared in
accordance with IAS / IFRS:
are transparent for users and comparable over all periods presented;
provide a suitable starting point for accounting under IAS / IFRS.
IFRS 1 defines an entity's first financial statement as "the first annual financial
statements in which the entity adopts IFRSs, by an explicit and unreserved statement
in those financial statements of compliance with IFRSs". Financial statements prepared
in accordance with IFRS are the first annual financial statements prepared by a
company in accordance with IFRS if, for example, the company has drafted a financial
report consistent with IFRS for consolidation purposes only, without preparing complete
financial statements according to the IAS 1 definition "Presentation of Financial
Statements" or did not present financial statements for previous periods.
IFRS 1 requires that in preparing the opening statement of financial position, a
company:
considers all elements included in IAS/IFRS as assets or liabilities, and applies
the relative criteria for their measurement;
does not consider as assets or liabilities items that are not included per
IAS/IFRS even if they were recorded in line with previously applied accounting
principles;
reclassifies items that were recognized as assets, liabilities or net assets
according to previous accounting principles, according to the recognition
requirements of IAS / IFRS;
account for any adjustments arising from the first application of IAS/IFRS to the
shareholders’ equity reserve.
69

When first adopting international accounting standards, the financial statements should
be prepared as if IAS/IFRS had always been applied unless stated otherwise by IFRS
1. Consideration of the related costs and benefits should be made before undertaking
the retrospective application of IAS/ IFRS as the cost for producing information should
not be greater than the benefits derived from it by its users.
IFRS 1 stipulates certain obligatory exemptions from applying IFRS retrospectively.
The following are the obligatory exemptions relative to the Poste Vita Group:
estimates must be consistent with those made according to previous GAAP;
cancellation of assets made according to previous GAAP as a result of
securitization operations that must be maintained;
hedging transactions that cannot be retroactive at the transition date;
other balance sheet items such as "minority interests" and application of "IFRS 9",
which is still pending approval.
As previously stated, these Consolidated Financial Statements are the first
consolidated financial statements of the Poste Vita Group. In accordance with
applicable legislation, Poste Vita S.p.A. was not required to prepare consolidated
information. Consequently, reconciliations to previous consolidated financial
statements are not presented.
As per IFRS/IAS requirements, reconciliations are presented at 1 January 2012 (date
of the so-called “First Time Adoption of FRS” per IFRS 1) and 31 December 2012. The
reconciliations illustrate the main differences arising from the initial application of IAS /
IFRS, between consolidated result of the period and shareholder’s equity presented in
the company’s local accounting standard financial statements and consolidated result
for the period and shareholder’s equity presented in the Consolidated Financial
Statements, prepared in accordance with IFRS. The statement of financial position and
income statement for 2011 are also presented, in addition to the reconciliation between
shareholder’s equity and consolidated result for the period.
Below is a description of the adjustments made on the transition to IFRS, to
shareholders' equity at 1 January 2012 (transition date) and the reconciliation of
consolidated result for the year ended 31 December 2012 and shareholders’ equity at
31 December 2012:
Data in thousand Euros
Shareholders' Equity
at 1 January, 2012
Result of the
period
Changes in
equity
Shareholders' Equity
at 31 December, 2012notes
Local Gaap consolidated Shareholders' equity 1,428,257 530,853 0 1,959,109
Adjustments to financial instruments 313,056 (258,024) 0 55,032 a
Adjustments to shareholdings (4,362) (528) (14) (4,904) b
Adjustments to deferred acquisition costs (31) 31 0 0 c
Adjustments to severance pay 85 0 (101) (17) d
Other minor adjustments (1,033) 1,040 0 7
Total transition adjustments - First Time Adoption 307,715 (257,481) (115) 50,119
Unrealized gains/losses on financial assets available for sale (92,502) 0 191,713 99,211 a
IAS-IFRS consolidated shareholders' equity 1,643,469 273,372 191,598 2,108,439
70

Explanatory Notes to the Shareholders’ Equity reconciliation at 1 January 2012 and 31
December 2012 and to the consolidated result for the year ended 31 December 2012.
a. This item represents the fair value adjustment of financial assets upon
application of IFRS. According to local accounting standards, financial assets
are measured at cost, and, in the case of non-current financial assets, adjusted
to take into account any impairment losses. In the case of financial assets
included in current assets, they are recorded at the lower of cost and market
value. The effects of this adjustment refer to financial assets classified as "
Available for sale financial assets" and in the category "Financial assets and
liabilities at fair value through profit or loss (FVTPL)”.
b. This item primarily relates to the difference between the acquisition cost of
investments and the corresponding portion of shareholders' equity.
c. This item reflects the different recognition of contracts which are not within the
scope of IFRS 4.
d. This item relates to the measurement of existing liabilities arising from the
severance pay benefits that are payable to employees upon termination of
employment.
71

Below are the financial statements for the periods from 2011 to 2013:
Data in thousand Euros
31/12/2013 31/12/2012 31/12/2011
1 INTANGIBLE ASSETS 10,513 4,853 2,080
1.1 Goodwill - - -
1.2 Other intangible assets 10,513 4,853 2,080
2 TANGIBLE ASSETS 2,954 2,412 1,113
2.1 Land and buildings - - -
2.2 Other tangible assets 2,954 2,412 1,113
3 AMOUNTS CEDED TO REINSURERS FROM TECHNICAL PROVISIONS 40,340 27,949 17,917
4 INVESTMENTS 69,852,153 58,307,422 45,753,173
4.1 Land and buildings (investment properties) - - -
4.2 Investments in subsidiaries, associated companies and joint ventures 197,019 198,666 198,899
4.3 Held to maturity investments - - -
4.4 Loans and receivables 11,458 102,146 208,543
4.5 Available for sale financial assets 59,159,855 47,924,881 35,634,933
4.6 Financial assets at fair value through profit or loss 10,483,821 10,081,729 9,710,799
5 OTHER RECEIVABLES 73,003 40,873 35,174
5.1 Receivables arising out of direct insurance operations 10,225 7,522 31,480
5.2 Receivables arising out of reinsurance operations 11,022 6,445 3,153
5.3 Other receivables 51,755 26,907 541
6 OTHER ASSETS 1,219,779 780,440 646,547
6.1 Non-current assets or disposal groups as classified as held for sale - - -
6.2 Deferred acquisition costs 44,505 30,704 19,078
6.3 Deferred tax assets 9,754 8,415 57,914
6.4 Tax receivables 1,164,433 740,329 568,889
6.5 Other assets 1,086 992 667
7 CASH AND CASH EQUIVALENTS 804,856 1,025,293 556,624
TOTAL ASSETS 72,003,597 60,189,243 47,012,627
BALANCE SHEET- ASSETS
Data in thousand Euros
31/12/2013 31/12/2012 31/12/2011
1 SHAREHOLDERS' EQUITY 2,763,515 2,108,439 1,643,469
1.1 shareholders' equity attributable to the group 2,763,515 2,108,439 1,643,469
1.1.1 Share capital 1,216,608 866,608 866,608
1.1.2 Other equity instruments - - -
1.1.3 Capital reserves - - -
1.1.4 Revenue reserves and other reserves 1,142,652 869,280 698,434
1.1.5 (Own shares) - - -
1.1.6 Reserve for currency translation differences - - -
1.1.7 Reserve for unrealized gains or losses on available for sale financial assets 148,130 99,211 (92,502)
1.1.8 Reserve for other unrealized gains and losses through equity 5 (32) 84
1.1.9 Result of the period 256,120 273,372 170,846
1.2 Shareholders' equity attributable to minority interests - - -
1.2.1 Share capital and reserves - - -
1.2.2 Reserve for unrealized gains and losses - - -
1.2.3 Result of the period - - -
2 PROVISIONS 10,050 8,609 20,300
3 INSURANCE PROVISIONS 68,005,153 56,770,888 44,260,929
4 FINANCIAL LIABILITIES 544,179 544,294 613,789
4.1 Financial l iabilities at fair value through profit or loss - - 67,878
4.2 Other financial l iabilities 544,179 544,294 545,911
5 PAYABLES 144,084 125,348 102,298
5.1 Payables arising out of direct insurance operations 94,044 68,076 60,545
5.2 Payables arising out of reinsurance operations 12,856 10,914 10,028
5.3 Other payables 37,184 46,358 31,725
6 OTHER LIABILITIES 536,616 631,665 371,842
6.1Liabilities directly associated with non - current assets and disposal groups
classified as held for sale- - -
6.2 Deferred tax liabilities 108,897 74,910 159,816
6.3 Current tax l iabilities 422,849 553,195 210,013
6.4 Other l iabilities 4,870 3,560 2,013
TOTAL SHAREHOLDERS' EQUITY AND LIABILITIES 72,003,597 60,189,243 47,012,627
SHAREHOLDERS' EQUITY AND LIABILITIES
72

With reference to the 2011 result for the period reported in the annual consolidated
financial statements prepared according to local accounting standards, the Company
opted to apply the conditions contained in Isvap Regulation No. 28 of 17 February 2009
and modified by Isvap Regulation No. 2934 of 27 September 2011, amended by
Regulation No. 43 of 12 July 2012, concerning the assessment of financial instruments
for working capital, considering all bonds classified under this category (with the
exception of those expiring in April 2012) at the value approved in the last semi-annual
report available (June 30, 2011), for securities acquired during the year at their
purchase value. For further details, disclosed as required by law, reference should be
made to the financial statements of the Company for the year ending 31 December
2011.
Data in thousand Euros
31/12/2013 31/12/2012 31/12/2011
1.1 Net premiums earned 13,200,235 10,535,625 9,524,903
1.1.1 Gross earned premiums 13,234,450 10,561,925 9,544,202
1.1.2 Earned premiums ceded (34,215) (26,301) (19,300)
1.2 Fee and commission income - 187 3,150
1.3 Net Income from financial instruments at fair value through profit or loss 744,535 1,465,183 (416,636)
1.4 Income from subsidiaries, associated companies and joint ventures - - 42,288
1.5Income from other financial instruments and land and buildings
(investment properties) 2,299,056 1,898,260 1,414,684
1.5.1 Interest income 2,090,411 1,739,213 1,348,222
1.5.2 Other income 30,496 30,255 17,624
1.5.3 Realized gains 178,149 128,792 48,838
1.5.4 Unrealized gains - - -
1.6 Other income 851 2,760 16,141
1 TOTAL INCOME 16,244,678 13,902,015 10,584,531
2.1 Net Insurance benefits and claims (15,275,329) (12,996,478) (9,894,396)
2.1.1 Claims paid and change in insurance provisions (15,295,296) (13,008,039) (9,903,381)
2.1.2 Reinsurers' share 19,967 11,562 8,985
2.2 Fee and commission expenses - (126) (2,280)
2.3 Expenses from subsidiaries, associated companies and joint ventures (1,648) (224) -
2.4Expenses from other financial instruments and land and buildings
(investment properties)(48,432) (136,206) (79,132)
2.4.1 Interest expense (18,455) (22,826) (26,280)
2.4.2 Other expenses - - -
2.4.3 Realized losses (29,976) (113,380) (52,852)
2.4.4 Unrealized losses - - -
2.5 Acquisition and administration costs (381,723) (286,757) (305,425)
2.5.1 Commissions and other acquisition costs (315,060) (227,574) (254,169)
2.5.2 Investment management expenses (26,509) (21,489) (18,734)
2.5.3 Other administration costs (40,154) (37,695) (32,521)
2.6 Other expenses (30,943) (32,427) (22,541)
2 TOTAL COSTS AND EXPENSES (15,738,075) (13,452,218) (10,303,773)
EARNINGS BEFORE TAXES 506,603 449,797 280,758
3 Income taxes (250,483) (176,425) (109,912)
EARNINGS AFTER TAXES 256,120 273,372 170,846
4 RESULT OF DISCONTINUED OPERATIONS - - -
CONSOLIDATED RESULT OF THE PERIOD 256,120 273,372 170,846
Result fo the period attributable to the group 256,120 273,372 170,846
Result fo the period attributable to minority interests - - -
INCOME STATEMENT
73

PART B – BASIS OF PREPARATION AND ACCOUNTING STANDARDS
CONSOLIDATION PRINCIPLES
Consolidation Scope
The consolidation scope includes Poste Vita S.p.A. and the subsidiary Poste Assicura
S.p.A., an insurance company founded in 2010 whose principal activity is the provision,
in Italy and abroad, of all types of Non-Life insurance and reinsurance. Poste Assicura
S.p.A. also undertakes other activities connected with, or instrumental to, insurance or
reinsurance (as provided in Art. 4 of the Bylaws). Poste Assicura S.p.A. is currently
authorized to carry out insurance business in all Non-Life classes with the exception of
the automobile sector and its accessories. Poste Assicura S.p.A. is 100% owned by
Poste Vita S.p.A. and is fully consolidated.
The Company also holds a minority stake in the company Europa Gestioni Immobiliari
S.p.A., whose principal activity is performing real estate activities and transactions, in
Italy and abroad, for both itself and third parties. This shareholding is accounted for
under the equity method.
Per IAS 27, subsidiaries are entities over which the Company exercises control,
understood as the power to determine, directly or indirectly, all financial and operating
policies so as to obtain benefits for its activities.
Per IAS 28, an associated company is an entity over which the company has significant
influence and is neither a subsidiary nor a jointly controlled entity. Significant influence
is presumed to exist if the company owns, directly or indirectly, at least 20% of the
voting power exercisable in the relevant entity’s general meetings. The management of
such shareholding is reported in the section "consolidation methods".
Financial Statements used in the preparation of the Consolidated Financial
Statements
Reporting packages, prepared in accordance with IFRS were used in the preparation of
the Consolidated Financial Statements.
Entity Name Country of Registration Principal Activity Participation % Shareholding Consolidation method
Poste Assicura SpA Italy Insurance Subsidiary 100 Full consolidation
Europa Gestioni Immobiliare SpA Italy Property business Associated company 45 Equity method
74

Date of the Consolidated Financial Statements
The consolidation reference date is 31 December.
Consolidation Methods
The Consolidated Financial Statements include the financial statements of the
Company and of the subsidiary Poste Assicura, entirely owned by the Company, which
falls within the definition of a subsidiary per IAS 27 as control is exercised through both
the direct or indirect ownership of shares with voting rights, and the exercise of a
dominant influence, expressed by the power to determine, directly or indirectly, by
virtue of contractual or legal agreements, the entity’s financial and operating policies,
and obtain related benefits, regardless of the type of ownership. The existence of
potential voting rights exercisable at the balance sheet date is taken into account in
order to establish control.
The criteria adopted for the subsidiary’s consolidation were as follows:
assets and liabilities, expenses and income of consolidated entities are reported
in their entirety on a line by line basis, allocating to minority shareholders, if any,
their share of shareholders' equity and net income for the period; these items
are shown separately in the Statement of Shareholders’ equity and in the
Income Statement;
business combinations through which control of another entity was obtained
are accounted for through the “acquisition method”. The cost of a business
combination is represented by the "fair value" at the acquisition date of the
assets acquired, by the liabilities assumed, and by the equity instruments
issued, in addition to any other directly attributable costs; the difference
between the acquisition price and the fair value of the assets and liabilities
acquired, upon verification of their correct measurement, is recorded, if positive,
in intangible assets under "Goodwill" or, if negative, to the Income statement;
the acquisition of minority interests in already controlled entities is considered
within transactions in shareholders’ equity; in the absence of an accounting
standard of reference, the Group records in shareholders’ equity any difference
between the acquisition cost and the relative portion of Shareholders’ equity
acquired;
unrealized profits and losses arising from transactions between consolidated
companies, if significant, are eliminated, as well as receivables and payables,
costs and revenues, expenses and financial income;
profits or losses from the disposal of shares in subsidiaries are recorded in the
income statement for the amount corresponding to the difference between the
selling price and the corresponding share of the consolidated shareholders’
equity sold.
75

Investments in "associated companies", or in consolidated companies in which the
Group had significant influence (assumed when the shareholding is between 20% and
50%), were accounted for through the equity method.
Investments recorded using the equity method are recorded as follows:
• profits or losses attributable to the Group were recorded in the income
statement from the date that significant influence or control was obtained until
the date this significant influence or control terminated. When the Group’s
share of losses in an associate equals or exceeds its interest in the associate,
the Group does not recognize further losses, unless it has incurred obligations
or made payments on behalf of the associate. The changes in the
shareholders’ equity of the associate which are not related to the income
statement are recognized as an adjustment to shareholders’ equity reserves;
• unrealized gains on transactions between the Group and its associates are
eliminated to the extent of the Group’s interest in the associate. Unrealized
losses are also eliminated unless the transaction provides evidence of an
impairment of the asset transferred.
Further details of the consolidated subsidiaries and associates recorded with the equity
method is provided in Attachment No. 5 Isvap Regulation. No. 7.
Consolidation Differences
The differences between the Company’s share of shareholders’ equity of the relevant
entity and the book value of the investment shown in the individual financial statements
were directly allocated to the consolidated Shareholders' equity, under "Retained
earnings and other reserves."
76
ACCOUNTING STANDARDS
The Consolidated Financial Statements were prepared on a historical cost basis,
except in cases where the fair value criteria application was mandatory.
Below are the accounting principles and standards adopted for the preparation of the
Consolidated Financial Statements.
Intangible assets
Includes intangible assets such as non-monetary assets having no physical substance,
which are identifiable and controlled by the Group, from which future economic benefits
will flow to the Group, as provided by IAS 38.
Intangible assets were initially measured at cost. Subsequently, those with a finite
useful life (i.e. software) were amortized over their remaining useful life. Amortization
began when the asset was available for use and was systematically allocated over the
residual useful life, i.e. on the basis of its estimated useful Life.
Tangible Assets
Includes all property, plant and equipment, as defined by IAS 16.
These assets were recorded at cost and included expenses directly incurred to prepare
the assets for their use, dismantling and removal costs to be incurred as a result of
contractual obligations requiring the return of assets to their original condition. Tangible
assets are subsequently measured using the amortized cost method. Amortization was
made on a straight-line basis over the estimated remaining useful life. The assets were
recorded in the statement of financial position net of depreciation and of any
impairment losses.
The residual value and remaining useful life are assessed annually. In case of
deviations from previous estimates, the asset is written down for impairment losses and
the depreciation rate is recalculated.
Extraordinary maintenance costs that generate future economic benefits were
capitalized, while ordinary maintenance costs were recorded in the Income Statement
as incurred.
77

The estimated useful life for the various plant and machinery categories for the Poste
Vita Group is shown below:
Technical provisions to be borne by Reinsurers
Technical provisions were calculated based on the contractual terms and conditions
provided in reinsurance agreements as this is the most appropriate method to
represent the specific economic results of the sector.
Interests in associated companies
Includes investments in associates which are recorded using the equity method, in
proportion to the interest held by the Group.
Financial Instruments
Financial instruments relate to assets and liabilities which were initially recognized at
fair value, based on the purpose for which they were purchased. The accounting date
of the purchase and sale of financial instruments was determined according to
standardized categories. Changes in fair value between the trade date and the
settlement date were recorded in the financial statements.
Financial Assets
Financial assets were classified at the time of their initial recognition in one of the following categories and accounted for as follows:
Financial assets at fair value through profit or loss
This category included financial assets held for short-term trading, derivatives and
securities designated by the company to be measured at fair value through profit or
loss.
The securities included structured financial assets that should have been measured
separately if the derivative component was not closely related to the host contract, to
Asset Useful economic life Depreciation rate
Software 3 years 33%
Start-up and expansion costs 5 years 20%
Improvements on third party assetsRight of use residual
maturity
Furniture, office equipment and internal
means of transport8 years
12%
Plants and equipment 5 years 20%
78

assets covering pension funds, to Unit-and Index-linked policies and to any disposable
surpluses.
Such items were recorded on initial recognition at cost. Cost is determined to be the
financial asset’s fair value. Transaction costs were not considered in the initial
measurement but were recorded directly in the Income statement.
Financial assets at fair value through profit or loss are subsequently recorded at fair
value, with the corresponding changes recorded in the Income statement.
Financial assets at fair value through profit or loss were derecognized when contractual
rights to receive the cash flows related to the asset and the underlying risks were
transferred.
Loans and Receivables
Loans and receivables were recorded at amortized cost, determined using the effective
interest method, less any impairment losses.
Loans and receivables were initially recognized on the trade date at cost, intended as
the financial instrument’s fair value, plus any transaction costs.
Impairment losses were identified and measured at each balance sheet or interim
period closing date. Impairment losses were recorded as a cost reduction and posted
as an offsetting entry in the Income statement. If the reasons for the loss no longer
existed, write backs were recorded in the Income statement. Write backs should not
determine an asset book value exceeding the amortized cost that would have been
obtained had the impairment loss not been recorded.
Financial assets were derecognized from the statement of financial position when
contractual rights to receive the cash flows related to the asset and the underlying risks
were transferred.
The fair value of these assets was represented by the value derived from similar or
recent transactions or from valuation models.
Available-for-Sale Financial Assets
Available for Sale Financial Assets are non-derivative financial instruments that were
either specifically designated to this category or not classified in any of the previous
categories. These financial instruments were measured at fair value and profits or
losses were recorded in a shareholders’ equity reserve whose movements were
recorded in the components of other comprehensive income (fair value reserve); their
allocation in the income statement took place only after the financial asset was actually
disposed of (or terminated), or, in the case of accumulated losses, when the loss
already registered in the Income statement could have been recovered in the future.
The initial entry on the balance sheet was made on the trade date and at cost, intended
as the fair value of the financial asset, plus any costs directly attributable to the sale.
of the return on debt securities, based on the amortized cost method, is recorded in
the income statement, similarly to the effects of changes in exchange rates. Changes
in exchange rates relating to equity instruments available for sale were recorded in a
79

specific equity reserve whose movements were recorded in the Components of Other
Comprehensive Income.
Impairment losses were verified at each balance sheet or interim period closing.
Impairment losses were recorded as a cost reduction and posted as a set-off in the
Income statement by shifting shares of profits or losses cumulated and posted in the
specific Shareholders’ equity item. If the reasons for the impairment loss were missing,
write backs had to be recorded in the Income statement if they were debt securities
and in the Shareholders’ equity if they were equity securities. Write backs should not
determine an asset book value exceeding the amortized cost that would have been
obtained had the impairment loss not been recorded.
Financial assets were derecognized from the statement of financial position when
contractual rights to receive the cash flows related to the asset and the underlying risks
were transferred.
Determination of the fair value of financial assets – background
Paragraph 2 of IFRS 13 - Fair Value Measurement, approved with EU Regulation
1255/2012 of 11December 2012, states that "fair value is an evaluation criterion of the
market, not specific of the entity. While for some assets and liabilities transactions or
observable market information may be available, for other assets and liabilities such
information may not be available. However, the purpose of fair value assessment is the
same in both cases: to estimate the price at which an orderly transaction to sell an
asset or transfer a liability would take place among market participants at the
assessment date under current market conditions (i.e. to estimate an exit price on the
assessment date according to the market participant holding the asset or liability)".
The fair value measurement methods used by the Poste Vita Group were illustrated as
required in the above mentioned standard.
It is important to remember that the active market concept referred to a market where
exchange list prices were readily available or systematically dealt with in "alternative"
trading circuits. Their prices were considered reliable as were those observed by
contributors operating as primary intermediaries in different markets, where the prices
proposed were representative of potential transactions and reflected actual market
operations regularly occurring in normal trading.
The assets and liabilities involved were classified according to a hierarchy reflecting the
importance of the sources used in making the measurements.
This hierarchy was made up by the 3 levels in the aforementioned IFRS 13, in
particular:
Level 1 - the market price obtained on the basis of an active market listing;
Level 2 - input data different from the above that expressed market values, to be
directly or indirectly connected to the instrument to be measured,
deduced from products with similar risk characteristics;
Level 3 - inputs that were not directly or indirectly observable on the market which
implied estimates and assumptions made by the evaluator.
80

Further details on fair value measurement methods are provided in the paragraph “Fair
Value Measurement Methods”.
CI 2012
Other receivables
This item mainly included receivables from policyholders for unearned premiums, from
intermediaries and from insurance and reinsurance companies. Receivables were
measured at amortized cost, calculated by the effective rate of return method.
This method was not used for loans whose duration was so short as to render
receivable discounting negligible; these receivables were measured at historical cost,
which coincided with the nominal value and were subjected to impairment tests.
Other Assets
Deferred acquisition costs
This item included deferred acquisition costs, related to the acquisition of new
insurance contracts. Costs were accounted for using local accounting standards,
applied in the country of residence of the individual companies included in the
consolidation, as provided in IFRS 4.
Current and Deferred Tax Assets
This item included assets related to current and deferred taxes, as defined and
regulated by IAS 12. Deferred Tax Assets were subject to regular audit at the end of
the year, if any changes in the relevant tax regulations had taken place.
Other assets
Included in the “Other assets” were:
• deferred fee and commission expenses related to investment contracts, which
did not fall within IFRS 4, but in IAS 39, and as such were classified as liabilities at fair
value through profit or loss;
• transitory reinsurance accounts;
• other assets related to employee benefit plans, provided in IAS 19, consisting of
surpluses arising from severance pay and calculated according to national
accounting standards as opposed to IAS 19 calculations. With reference to the
criteria for determining the items relating to employee benefits, the section
"Other Payables" should be referred to;
• accruals and prepaid expenditure.
81

Cash and Cash Equivalents
This category included cash and available on-demand deposits. These were recorded
at their nominal value and, in the case of items denominated in foreign currency,
translated at the year-end exchange rate.
Impairment Losses
The carrying value of assets was analyzed at each balance sheet to determine whether
the assets had suffered any impairment losses. This was assessed by comparing the
book value of each asset to its estimated recoverable amount and if this value was
lower than the first, the asset was written down. The recoverable amount was the
higher of the fair value, net of sales costs, and the value–in-use.
All impairment losses were recorded in the income statement. When impairment was
no longer appropriate, the asset’s book value, less the cost of goodwill, was increased
to the new value arising from an estimate of its recoverable amount. This could not be
higher than the net book value before any previous impairment write-downs.
Shareholders' Equity attributable to the Group
Equity instruments ("Other equity instruments") and related capital reserves attributable
to the Group were recorded within this category.
"Retained earnings and other reserves" included profits or losses arising from the first
application of international accounting standards and consolidation reserves.
"Profits or losses on assets available-for-sale" included profits or losses related to the
measurement of the financial assets available for sale, net of any deferred tax and of
the part attributable to policyholders and accounted for under insurance liabilities (so-
called shadow accounting).
Other Profits or Losses directly recorded in Equity
This item included actuarial profits and losses and adjustments related to defined
benefit plans (IAS 19.93A) which were recorded directly in equity.
Provisions for risks and charges
Provisions for risks and charges were recorded to cover losses and liabilities of a
certain or probable nature, but for which the amount and/or date on which they
occurred could not be determined.
82

This item also included liabilities that were defined and governed by IAS 37. Provisions
were recorded in the financial statements when the Group had an obligation resulting
from a past event and could be required to settle the obligation. Amounts relating to
provisions were calculated based on an estimate of the expenditure required to settle
the obligation at the financial statement closing date and, if considered significant, were
discounted.
Technical Provisions
The description of the measurement criteria for "Technical Provisions" is shown in the
section "Technical Provisions and Premiums”.
Financial liabilities at fair value through profit or loss
This category included financial liabilities held for short term trading, derivative financial
instruments and liabilities at fair value through profit or loss. It also included financial
policies for Life insurance.
The initial book value in the financial statements corresponded to the liability’s fair
value at the settlement date. Costs or revenues directly attributable to transactions
were not considered in the initial registration and were recorded directly in the income
statement.
Subsequently, such items are recognized at fair value and the difference between the
fair value and the book value was recorded through profit or loss.
A financial liability at fair value through profit or loss is derecognized from the statement
of financial position when the contractual rights and underlying risks relative to the
liability were transferred.
Other Financial Liabilities
Classified under this category were financial liabilities that would not be used for
trading. These were subordinated loans incurred entirely by the Company with Poste
Italiane S.p.A.
Other financial liabilities were initially recognized at fair value as per the settlement
date, plus any transaction costs directly attributable to the transaction.
Subsequently, these liabilities were recorded at their amortized cost using the effective
interest method.
Payables
Payables arising from direct insurance operations
This item included trade payables arising from direct insurance operations. Such
payables were recorded at nominal value. Such payables are not discounted, as being
short-term payables, the effects would not be significant.
83

Payables arising from reinsurance operations
This item included trade payables arising from reinsurance operations, recorded at
nominal value. Such payables are not discounted, as being short-term payables, the
effects would not be significant.
Other Payables
Payables not originating from insurance operations were recorded under other
payables. In particular, this included employee termination benefits that were
calculated according to local accounting standards. Such payables are not discounted,
as they are short-term payables or payables involving the payment of interest
according to pre-established contracts. The categories relating to employee benefits
are the following:
Short-Term Benefits
Short-term employee benefits are employee benefits (other than termination benefits)
that are due within 12 months after the termination of the working period.
They included wages and salaries, social security contributions and paid annual and
sick leave. The undiscounted amount of short-term benefits expected to be paid to the
employee in return for work carried out during an administrative period was recorded in
labor costs.
Post-employment Benefits
Post-employment benefits were divided into two groups: defined benefit plans and
defined contribution plans. Since the benefit to be granted is quantifiable only after the
termination of the employment relationship for defined benefit plans, economic and
equity effects were determined based on actuarial calculations in accordance with IAS
19. In defined contribution plans, contribution costs were recorded in the income
statement when they were incurred, according to their nominal value.
Defined Benefit Plans
Severance pay is due to employees as part of the defined benefit plans in accordance
with article 2120 of the civil code:
- For all companies with at least 50 employees, subject to the reform on
supplementary pension plans, as of 1 January 2007, severance pay shall be
compulsorily granted to a supplementary pension fund — in the special
Treasury Fund established by INPS (National Social Welfare Institution).
Therefore, defined benefits owed by the company to the employee related only
to provisions accrued until 31 December 2006.
- In the case of companies with fewer than 50 employees, where the reform on
supplementary pension plans did not apply, accruing Severance Pay benefits
continued to increase the company’s liabilities.
Payables were projected into the future using the Projected Unit Credit Method to
calculate the amount likely to be paid upon employment termination. These amounts
84

were then discounted to take into account the time elapsed before the actual payment.
The assessment of payables recorded in the financial statements was based on the
conclusions reached by external actuaries.
Accrued severance pay for employment termination was calculated based on actuarial
assumptions, mainly according to: demographics (employee rotation and mortality) and
financial bases (inflation and discount rates with maturities consistent with the expected
obligation expiration). In companies with at least 50 employees, where the company
was not responsible for severance pay benefits accrued after 31 December 2006,
future wages were not included in the severance pay actuarial calculation. Due to
changes in the above-mentioned actuarial values, at each expiration, actuarial profits
and losses, defined as the difference between the liability’s book value and the current
value of the Group’s obligations at the end of the period, were recorded directly in
Shareholders’ Equity under “other components” in the Statement of Comprehensive
Income.
Defined benefit plans also included pension funds guaranteeing members and their
survivors supplementary pensions different to those provided by INPS, as per specific
regulation requirements, collective work agreements and law. In this case, the criteria
for initial recognition and subsequent measurement given for severance pay benefits
were applied. Like the severance pay, liability assessments recorded in the financial
statement were based on conclusions reached by actuaries external to the Group.
Defined contribution plans
Defined contribution plans included severance pay benefits payable to employees
pursuant to article 2120 of the Civil Code, limited to the severance pay benefits
accrued since January 1, 2007 and paid into a mandatory supplementary pension fund,
or in the Treasury Fund set up by INPS. In defined contribution plans, the contributions
payable were attributed to the Income statement when they were incurred, based on
their nominal value.
Employment Termination Benefits
Benefits payable to employees upon employment termination were recorded as
liabilities when the company decided to terminate the employment relationship with an
employee or group of employees before the standard retirement date, or in cases
where the employee or group of employees decided to accept a benefit offer in
exchange for the termination of the employment relationship. Benefits due for
employment termination were immediately recorded within labor costs.
Other Long Term Employee Benefits
Other long-term benefits were those not expected to be payable within twelve months
after the working period ended. Assessment of other long-term benefits did not
normally present the same uncertainty as post-employment benefits, and therefore IAS
19 provided some calculation simplifications: net changes in value of all liability
elements occurring during the year were recorded in full in the income statement.
85

Liabilities recorded in the financial statements under Other long-term benefits were
based on the conclusions reached by actuaries external to the Group.
Other Elements included in Liabilities
Liabilities of a group to be disposed of held for sale.
This item included the liabilities of a group to be disposed of held for sale, in
accordance with IFRS 5.
Current and Deferred Tax Liabilities
This item included tax liabilities regulated by IAS 12. Current tax liabilities were
calculated according to the tax laws in force on direct taxes.
Deferred liabilities pertaining to all temporary taxable differences between assets and
liabilities’ book value and the corresponding amounts recorded for tax purposes, were
recorded except for cases expressly provided for by paragraph 15 of IAS 12.
Deferred taxes on items directly recorded in Shareholders’ Equity were also directly recorded therein.
Other Liabilities
In particular, this item included:
• deferred fee and commission income relating to contracts not covered by IFRS
4;
• liabilities relating to defined benefit plans and other long-term benefits for
employees;
• accruals and deferrals.
Technical Provisions and Premiums
Contracts classified as "Insurance" as per IFRS 4 were measured and recorded
according to the accounting standards used to prepare the statutory financial
statements and were regulated by the provisions laid out in Decree No. 173/2997 and
No. 209/2005 and by Isvap Regulations No. 16, 21 and 22.
IFRS 4 considers Insurance contracts to be those transferring a significant insurance
risk.
IFRS 4 defines an insurance risk as a risk which, unlike a financial risk, is transferred
by the policyholder to the insurer. In turn, a financial risk is defined as “The risk of a
possible future change in one or more of a specified interest rate, financial instrument
price, commodity price, foreign exchange rate, index of prices or rates, credit rating or
86

credit index, or other specified variables, provided that, in the case of a non-financial
variable, the variable is not specific to a party to the contract".
Insurance risk is significant if, and only if, the insured event causes an insurer to pay
significant additional benefits in any circumstance, except those having no apparent
effect on the financial outcome of the operation, even if the insured event is extremely
unlikely to occur. Since IFRS 4 did not provide any specific indication on the level of
significance of the insurance risk, the Company had to define a threshold beyond
which any additional costs caused by the occurrence of an insured event would
generate the transfer of a significant insurance risk. This threshold was identified by the
Company’s Board of Directors. The assessment of significance was performed by
combining individual contracts into uniform categories based on the nature of risk
transferred to the Company.
Contracts not transferring significant insurance risk and classified as financial
instruments were recorded and measured according to the accounting standards used
in the preparation of the statutory financial statements when they contained a
discretionary participation feature.
IFRS 4.10 states that the unbundling of a contract classified as insurance, into a
deposit component and an insurance component is mandatory in some circumstances
and optional in others. In the case of unbundling, the deposit component falls within the
scope of IAS 32 and IAS 39, while the risk component falls within the scope of IFRS 4.
Unbundling is required if the company can measure the deposit component separately,
that is without considering the insurance component, and if the accounting standards
do not allow the proper recognition of rights and obligations arising from the deposit
component. Accordingly, the Company has decided not to carry out any unbundling.
Contracts (or parts of contracts) that did not transfer a significant insurance risk and
which lacked discretionary participation features were measured and recorded
according to IAS 39 or IAS 18, depending on whether they were classified as financial
instruments or service contracts.
Following are the considerations used to classify Non-Life and Life Classes as well as
the criteria used for their accounting and measurement.
Non-Life Classes
Non-Life contracts have all been classified as insurance contracts taking into account
that the essence of such contracts exposes the company to significant insurance risk.
Non-Life technical provisions were as follows:
Provision for unearned premiums was made up by the "Provision for unearned parts of
premiums" and "Provision for unexpired risks." The provision for unearned parts of
87
premiums was calculated according to the pro rata temporis method on the basis of
gross premiums written, net of acquisition costs.
The Provision for outstanding claims was measured analytically and on the basis of
prudential assumptions of available elements and of the final cost, to properly cover
claim compensation and their direct and indirect settlement costs. This process also
included an estimate of claims incurred but not yet reported for the year (IBNR).
With reference to the Liability Adequacy Test (LAT), obligations required by Italian
legislation to calculate Non-Life technical provisions were expected to be consistent
with the minimum provisions established by paragraph 16 of IFRS 4 and therefore the
Company was exempted from carrying out further Specific Adequacy Tests.
Specifically, the element of the Provision for unearned premiums - relative to the
Provision for unexpired risk, calculated and accrued whenever the technical report of
the individual business unit delivered expected claim expenses exceeding revenues for
subsequent years - represented a reasonable estimate of the Liability Adequacy Test.
Provisions for outstanding claims were determined, according to the final cost criteria,
as an estimate of the principal undiscounted future cash flows and, consequently, they
could be considered to be greater than the amount arising from the application of the
LAT according to IFRS 4.
Catastrophe and equalization provisions were written off since IFRS 4 did not allow the
recording of any accrual, based on the prudence principle, to face possible future
claims.
Provisions for increasing age calculations were provided in article 46, Isvap Regulation
No. 16. A flat-rate was used for 10% of gross premiums written for the year relating to
contracts indicated in the Regulation.
Life Classes
Class I products containing a revaluation clause of the insured service prorated to
returns from segregated accounts were classified as financial contracts. They included
a discretionary participation feature (so called “DPF”, as defined in Appendix A to IFRS
4), for which IFRS 4.35 refers to accounting standards as provided by local criteria.
During the year, the Company also placed Class I products connected to a specific
asset reserve. These products expire in 2015.
Bearing in mind that at contract end the sums accrued in “Posta Valore Più”
segregated accounts were expected to be automatically transferred, these contracts
were classified as financial contracts but, as indicated in the previous paragraph, they
were treated for accounting purposes as insurance contracts.
“Pure risk” products were classified as “Insurance”.
88

Class III products having a significant “insurance risk” were classified as insurance.
Contract classification resulted from internal analyses which verified, through yield
distribution curves, whether the company performed other significant services when the
insured event occurred.
Furthermore, according to IFRS 4, a test was performed to measure the reserves’
adequacy, (Liability Adequacy Test). The test was conducted by taking into account
the current value of future cash flows, obtained by projecting the expected cash flows
from the existing year-end portfolio, based on appropriate assumptions of the
expiration causes (mortality, termination, surrender, reduction) and expense trends.
Test results demonstrated that the technical provisions were adequate and no further
provisions were necessary.
Shadow Accounting
To mitigate differences between the financial assets included in segregated accounts,
valued according to IAS 39, and mathematical provisions measured according to local
accounting standards, "shadow accounting" was applied, as per paragraph 30 of IFRS
4, to contracts entered in segregated “Life” accounts.
Accounting standards applied to insurance liabilities (i.e. statutory technical provisions)
could be changed through shadow accounting to take into consideration capital gains
or losses recorded but not realized on assets having a direct effect on the measure of
insurance liabilities, as if they were realized.
Shadow accounting was applied using the “going concern approach" based on the
following:
• Realizing, for each segregated account, latent capital gains and losses as at the
reference date, over a perspective several year period, according to the ALM,
consistent with the characteristics of an assets and liabilities portfolio
representing the overall business reality. The possibility of their immediate
realization was therefore discarded;
• Determining insurance liability on the basis of the perspective return of each
segregated account, taking into consideration contract terms, minimum
guaranteed levels and any financial guarantees offered.
Commission income and expenses
This item included fees and commissions related to investment contracts that did not
fall within the scope of IFRS 4. In particular, these were the part of explicit and implicit
loadings for the year and of management fees relating to commission income and of
acquisition costs for commission expenses.
89

Investment income and expenses
Net income from financial instruments at fair value through profit or loss
Included profits and losses and positive and negative changes in value of the
assets and liabilities present in the category “fair value through profit or loss”.
Changes in value were determined based on the difference between the financial
instruments’ fair value and its book value as recorded in this category.
Income / Expenses from subsidiaries, associated companies and joint ventures
Included income / expenses from investments in associates. This was, in
particular, the Group’s profit share for the period from subsidiaries.
Income / Expenses from other financial instruments and investment properties
This item included:
• income/expenses and capital gains/losses on investments classified in the "available for sale" category;
• income and expenses for loans and receivables and other financial liabilities;
• proceeds and expenses relating to investment properties.
Other income
This item included, in particular:
income from the sale of goods and services other than financial services and from
the use, by third parties, of tangible and intangible assets and other assets;
other net technical income, related to insurance contracts;
exchange rate differences recorded in the income statement as per IAS 21;
realized gains and impairment reversals relating to tangible and intangible assets.
Net insurance benefits and claims
This category included amounts paid net of recoveries, changes in provisions for
outstanding claims and in other Non-Life technical provisions, the change in
mathematical provisions and other technical provisions for Life insurance, the change
in technical provisions relating to contracts for which the investment risk is borne by
policyholders in relation to insurance contracts and financial instruments within the
scope of IFRS 4. The amounts entered were inclusive of settlement expenses and net
of amounts ceded to reinsurers.
90

Expenses from subsidiaries, associated companies and joint ventures
Expenses from subsidiaries, associated companies and joint ventures recorded in the
corresponding asset item were recorded in this category.
Expenses from other financial instruments and investment properties
This item included expenses from investment properties and financial instruments not
measured at fair value in the Income Statement. This included, primarily, other charges
from investments, as well as costs related to investment properties and in particular,
charges and maintenance and repair costs that did not increase the value of property
investments; losses from the elimination of a financial asset or liability and of property
investment; valuation losses, including depreciation, amortization and impairment
losses.
Acquisition and Administration Costs
This item included commissions, other acquisition expenses and acquisition costs, net
of reinsurance ceded, related to insurance contracts; operating expenses on
investments, general expenses and personnel costs for managing financial instruments
and property investments; other administrative expenses, general and personnel
expenses not allocated to charges for claims, to acquisition costs of insurance
contracts and to investment management fees.
Other expenses
This item included, in particular:
costs related to the sale of goods and services not of a financial
nature;
other net technical charges, related to insurance contracts;
provisions made during the year;
exchange rate differences recorded in the Income statement as per
IAS 21;
losses, impairment losses and depreciation related to tangible assets -
when not allocated to specific items - and to intangible assets.
> 374 I 2012
Uncertainties on the use of estimates
As required by paragraph 116 of IAS 1, we declare that the Consolidated Financial
Statements have been prepared with clarity and give a true and fair view of the net
assets, financial position and economic results of the year.
The Notes to the Consolidated Financial Statements illustrated the reasoning behind
the estimate and valuation criteria used in applying international accounting standards.
91

The application of these estimates and assumptions impacted the figures reported in
the Consolidated Financial Statements and the notes thereto. The final financial
statement values used for these estimates and assumptions could differ from those
reported in previous financial statements due to the uncertainty which characterized the
assumptions and conditions upon which the estimates were based. Estimates and
underlying assumptions were reviewed periodically and any changes were recorded in
the period in which the estimate revision occurred, if the revision affected only the
current period, or also in subsequent periods if the revision affected the current and
future periods.
During the current financial year, estimates were used in the following cases:
in determining the fair value of financial assets and liabilities when this was not
available in active markets;
in estimating the recoverability of deferred tax assets;
in quantifying provisions for risks and charges and for employee benefits, when
the amount or date of occurrence and actuarial assumptions applied could not be
determined;
in determining technical provisions for Life insurance;
in determining the shadow accounting extent, as previously described;
in determining technical provisions for Non-Life insurance.
Fair Value Measurement Method
According to the provisions of IFRS 13 - Fair Value Measurement, which was approved
by EU Regulation No. 1255/2012 of December 11, 2012, the following describes the
method used to measure fair value within the Poste Vita Group.
The assets and liabilities involved (specifically, assets and liabilities recorded at fair
value and assets and liabilities recorded at cost or amortized cost, the fair value of
which were illustrated in the Notes to the financial statements) were classified
according to a hierarchy reflecting the importance of the sources used for
measurement.
The hierarchy was composed of three levels as described below.
Level 1: This level included fair value assessments made using listed prices
(unadjusted) in active markets for identical assets or liabilities that the entity could
access at the measurement date. The Poste Vita Group used the following financial
instrument categories:
Bonds listed on active markets:
• Bonds issued by the Italian State: The evaluation was carried out
considering the prices recorded on the MTS (Mercato Telematico dei
Titoli di Stato all’ingrosso) - Electronic Market for the wholesale of
Bonds.
92

• Bonds issued by EU government bodies or Italian or foreign non-
governmental bodies: the measurement was carried out using the prices
reported on regulated markets according to the following hierarchy:
a. the “bid” price recorded at 4:00pm London time (GMT), provided by a globally recognized info provider;
b. the last bid price in the regulated markets recognized by Consob
pursuant to resolution No. 16370 of March 4, 2008.
stocks listed in active markets: assessment was carried out considering the
price from the last contract traded on the applicable Stock Exchange on that
date.
listed investment fund: this category included funds invested in financial
instruments listed on active markets. The assessment was carried out
considering the NAV (Net Asset Value) determined by the fund manager.
Financial liabilities listed in active markets: this category included plain bonds,
for which the assessment was carried out using the last "ask" price provided by
a globally recognized info provider.
Level 1 Bond instrument listing included the credit risk element.
Level 2: Assessments in this level were made using different input from listed prices
included in Level 1, directly or indirectly found for assets or liabilities. The Poste Vita
Group recorded the following categories of financial instruments:
Bonds traded on inactive or unlisted markets:
Plain and non-government, Italian and foreign bonds: the assessment
was carried out using the discounted cash flow method which included
the discounting of future cash flows. This method used a yield curve
incorporating the credit spread risk, based on the asset swap spread
determined on the issuer’s listed and liquid benchmark security. The
yield curve could be subject to limited adjustments to take into account
the cash risk arising from the lack of an active market.
Structured Bonds: the assessment was made using the building block
approach that involved the break-down of the structured position into its
basic components: a bond component and an optional component.
The evaluation of the bond component was made on the basis of
discounted cash flows, applicable to plain bonds as defined in the
previous paragraph. The optional component that, given the
characteristics of the bonds included in Poste Vita Group’s portfolio, was
attributable to interest rate risk, was assessed with a closed formula
approach, according to traditional options valuation models with specific
underlying risk factors.
93

Unlisted securities: included in this category when referring to the listed price
securities issued by the same issuer. A discount factor was applied to these
securities, representing the implicit cost in the conversion of Class B and C
securities into Class A listed securities.
Derivative financial instruments:
Warrant: given the characteristics of portfolio instruments, the assessment was carried out using a numerical model based on a closed formula.
Financial liabilities traded on inactive or unlisted markets:
Plain Bonds: the assessment was carried out using the discounted
cash flow method. This method used a yield curve as input to
incorporate the credit spread risk.
Structured Bonds: the assessment was made through the building
block approach that involved the break-down of the structured
standing into its basic components: a bond component and an
optional component. The evaluation of the bond component was
made on the basis of the discounted cash flow method, applicable to
plain bonds as defined in the previous paragraph. The optional
component that, given the characteristics of the bonds included in
Poste Vita Group’s portfolio, was attributable to interest rate risk,
was assessed with a closed formula approach, according to
traditional options valuation models with specific underlying risk
factors.
Level 3: this level included fair value measurements made using unobservable inputs
for assets or liabilities. The Poste Vita Group included the following categories of
financial instruments:
Real Estate Funds subject to capital calls and closed end private equity
funds subject to capital calls: this category included all funds invested in
unlisted instruments. Fair value assessment was made based on the NAV
(Net Asset Value) communicated by the fund manager. The NAV was then
adjusted according to capital calls and repayments communicated by fund
managers.
Interests in the associated Company Europa Gestioni Immobiliari (EGI)
were measured with the equity method.
Financial liabilities were measured at depreciated cost.
94

Accounting Standards and Interpretations of New and Upcoming Application
Accounting standards and interpretations applied as of January 1, 2013
The amendments, interpretations and changes listed below are applicable as of
January 1, 2013:
• IAS 19 - "Employee benefits" amended by EU Regulation No.
475/2012. The change abolished the so-called "corridor method" and
the possibility of recording the actuarial results through profit or loss,
exclusively allowing their immediate registration in full in the Statement
of Other Comprehensive Income. The Regulation also provided
additional information on defined benefit plans, as shown in the notes to
the financial statements; in particular: a sensitivity analysis of defined
benefit plans, mainly referring to severance pay, with regard to changes
in the main actuarial assumptions; specification of actuarial profits and
losses depending on whether they originated from changes in financial
or demographic assumptions; information on the main actuarial
assumptions used for liability assessment.
• IFRS 13 - "Fair Value Measurement" adopted by EU Regulation No.
1255/2012. The new standard introduced a unique framework for fair
value measurement of both financial and non-financial assets and
liabilities. In particular, the new standard provided a clear and precise
definition of fair value and a guide on the procedures and methods for
its measurement. In order to increase the consistency and comparability
of measurements and related disclosures, the Regulation also clarified
methods for classifying assets and liabilities at fair value within the fair
value hierarchy, as already required by IFRS 7, based on the input used
in the assessment methods.
• IFRIC 20 - "Excavation costs in the production phase of open mines"
adopted by EU Regulation No. 1255/2012, this interpretation was
irrelevant to the Group's activities.
• IAS 12 - “Income Taxes – Deferred Taxation: recovery of underlying
assets”, changes adopted by EU Regulation No. 1255/2012, having
retroactive effect from January 1, 2012. Changes particularly concerned
deferred taxes applied to property investments measured with the fair
value model according to IAS 40. To date, the Poste Vita Group does
not have any investment properties.
• IFRS 7 - "Financial Instruments: Disclosures - Offsetting Financial
Assets and Liabilities" as amended by EU Regulation No. 1256/2012.
Changes provided additional information requirements enabling users of
financial statements to better assess the actual or potential effects of
95
offset agreements on the entity’s balance sheet and financial position. In
particular, these changes related to all recorded financial instruments,
subject to offset according to paragraph 42 of IAS 32, or that were
subject to an executive offset framework agreement or to a similar
agreement (e.g. offset agreements on derivatives, repurchase
agreements meeting international global master repurchase agreement
standards; etc.), regardless of whether the financial instruments
themselves were or were not offset according to paragraph 42 of IAS
32.
• 2009 - 2011 Annual Improvements Cycle adopted by EU Regulation No.
301/2013. The regulation changed some accounting standards, such as
IAS 1, 16, 32, 34 and IFRS 1 to remove standard inconsistencies or
clarify terminology.
• Furthermore, EU Regulation No. 1256/2012 of December 29, 2012
which adopted, among others, the amendment to IFRS 7 - "Financial
Instruments: Disclosures - Offsetting of Financial assets and Liabilities",
provided for the retroactive repeal of paragraph 13 – Derecognition, as
of July 1, 2011.
Accounting standards and interpretations to be used in the near future
The following accounting standards, interpretations and amendments are applicable as
of January 1, 2014:
• IAS 27 - "Separate Financial Statements" as amended by EU Regulation No.
1254/2012. These amendments consist of extrapolating the rules governing the
preparation of the consolidated financial statements and in referring them to a new,
dedicated accounting standard (IFRS 10 - "Consolidated Financial Statements"). The
new IAS 27 thus has the task of defining and regulating the standards only for drafting
separate financial statements, remaining essentially unchanged from the previous
version in this respect.
• IAS 28 - "Shareholdings in Associated Companies and Joint Ventures" amended by
EU Regulation No. 1254/2012. The accounting standard has been integrated with
requirements for the equity method application in joint venture shareholdings.
• IFRS 10 - "Consolidated Financial Statements" adopted by EU Regulation No.
1254/2012. The new standard established the rules for the preparation and
presentation of consolidated financial statements, integrating rules previously included
in IAS 27 - Consolidated and Separate Financial Statements and in SIC-12 - Special
purpose vehicles. The new standard included a new definition of control to be used as
the sole basis for all entities consolidation, and eliminated inconsistencies or
96

interpretation uncertainties between IAS 27 and SIC 12, and lastly, laid down rules for
the clear and unambiguous identification of "de facto control".
IFRS 11 - "Joint Arrangements" adopted by EU Regulation No. 1254/2012. The new
standard established financial reporting rules for entities that are part of a joint
arrangement and superseded IAS 31 - Interests in Joint Ventures and SIC-13 -
Jointly Controlled Entities - Non-monetary contributions in kind by venturers. IFRS
11 also provided criteria for the identification of joint arrangements by focusing on
the rights and obligations of the arrangement, rather than on their legal form. Unlike
previous provisions in IAS 31, it did not allow using the proportional consolidation
method as an accounting method for interests in joint ventures.
IFRS 12 - "Disclosure of Interests in Other Entities" adopted by EU Regulation No.
1254/2012. IFRS 12 combined, enhanced and replaced the disclosure requirements
for subsidiaries, joint arrangements, associated companies and unconsolidated
structured entities. This standard included all summary information required from an
entity to enable financial statement users to assess the nature of risks related to
interests in other entities and the effects of these interests on the statement of
financial position, financial performance and cash flows.
IAS 32 - "Financial Instruments: Presentation - Offsetting Financial Assets and
Liabilities" amended by EU Regulation No. 1256/2012. Subsequent to the
amendment to IFRS 7, the revised IAS 32 provided additional guidance to reduce
inconsistencies in the practical application of the standard.
Amendments to IFRS 10, 12 and IAS 27 adopted by EU Regulation No. 1174/2013.
In order to provide rules on investment entities, the following standards have been
changed:
IFRS 10 - amended to require that investment entities assess subsidiaries at
fair value through profit or loss rather than consolidate them to better reflect
their business model;
IFRS 12 - amended to require the submission of specific disclosures on investment entities’ subsidiaries;
IAS 27- amended to remove the possibility for investment entities of opting for
investments valuation at cost of certain subsidiaries, by requiring mandatory fair
value assessment in their separate financial statements.
IAS 36- Impairment of assets amended by EU Regulation No. 1374/2013.
Changes aimed at clarifying that information to be provided on the recoverable
amount of assets only related to assets whose value had been reduced, when
this value was based on the fair value net of disposal costs.
97

IAS 39-Financial instruments: Recognition and Measurement as amended by
EU Regulation No. 1375/2013. Changes related to situations where
a derivative used as a hedging instrument was subject to novation by a
counterparty to another central counterparty as a result of laws or regulations.
In particular, it was established that, in such cases, hedge accounting could
continue regardless of novation.
Finally, at the approval date of these financial statements, some accounting standards,
interpretations and amendments issued by IASB were still under consideration and had
not yet been approved by the EU. These included:
• Exposure Draft "IFRS 9 – Financial Instruments", in the context of the draft
revision of the current IAS 39;
• some Exposure Drafts, also issued during the draft revision of the current IAS
39, which relate to amortized cost and Impairment, Fair Value Options for
Financial Liabilities, Expected loan losses and Hedge Accounting;
. Exposure Draft "Annual Improvements Cycle to IFRS" relating to the periods
2010-2012, 2011-2013 and 2012-2014 as part of annual projects for the
improvement and general review of international accounting standards;
• Exposure Draft "Assessment of Non-Financial Liabilities" in the draft revision
of the current IAS 37, relating to the recognition and measurement of provisions
and potential liabilities and assets.
• Exposure Draft "Revenue from Contracts with Customers" draft revision of the
existing IAS 11 and IAS 18, in the context of revenue recognition;
• Exposure Draft "Insurance Contracts" in the IFRS 4 draft revision concerning
the accounting of insurance contracts;
• Exposure Draft “Leasing” revision of the current IAS 17 regarding leasing
accounting;
. Exposure Draft "Operating Segments" as part of the revision of IFRS 8,
concerning the recognition and measurement of operating segments;
• Interpretation of “Accounting for Put Options issued by the Parent Company in
favor of minority shareholders”
• Exposure Draft “IAS 28 – Equity method: Shareholders’ Equity shares in other
companies";
98
• Exposure Draft "IAS 16 - Property, Plant and Equipment" and "IAS 38 -
Intangible Assets - Clarification of Acceptable Methods of Depreciation and
Amortization.
• Exposure Draft "IFRS 10 - Consolidated Financial Statements" and "IAS 28 -
Investments in associates and joint ventures: Sale or Transfer of Assets
between an Investor and its Associate or Joint Venture”
• Exposure Draft "IFRS 11 - Joint Arrangements: Acquisition of an interest in a
Joint operation."
. Exposure Draft "IAS 19 - Defined Benefit Plans - Employee contributions";
• Interpretation of "IFRIC 21 - Interpretation on the accounting for levies imposed
by government to enter into a certain market”.
• Exposure Draft “IAS 27 –Equity Method in Separate Financial Statements”;
• Discussion Paper “Conceptual Framework for Financial Reporting” under the
project to revise the present Framework;
• Exposure Draft “IFRS 14 - Regulatory Deferral Accounts”, allowing only those
who adopt IFRS for the first time to continue recognize amounting relative to
rate regulations according to previous accounting standards.
99

PART C- NOTES TO THE CONSOLIDATED BALANCE SHEET
ASSETS
1. INTANGIBLE ASSETS
Intangible assets at 31 December 2013 amounted to €10,513k, compared to €4,853k
at 31 December 2012.
The following table provides a break-down of the carrying value:
Intangible assets mainly comprise software programme licenses (net book value of
€6,903k at 31 December 2013) and the capitalized costs incurred in software
development activity still to be completed at the end of the period (which did not,
therefore, generate economic benefits in the year) totaling €3,590k at 31 December
2013.
Software licenses are amortised at a rate of 33%. There were no impairment losses
recorded during the year.
The increase of €3,590k in intangibles in progress relates to capitalized costs incurred
for software development still in progress at 31 December 2013. The increase in
software, of €2,077k, net of amortization for the period, relates to the capitalization of
(data in thousand Euros)
Other intangible assets 31/12/2013 31/12/2012
Cost 20,450.3 11,183.6 9,266.7 82.9%
Accumulated amortisation 9,937.3 6,330.3 3,607.0 57.0%
Carrying amount 10,513.0 4,853.3 5,659.7 116.6%
Change
(data in thousand Euros)
Other intangible assets 31/12/2013 31/12/2012
Software 6,902.7 4,826.1 2,076.6 43.0%
Intangible in progress 3,590.1 - 3,590.1 n.s.
Start-up and expansion 20.2 27.2 (7.0) (25.9%)
Carrying amount 10,513.0 4,853.3 5,659.6 116.6%
Change
(data in thousand Euros)
Other intangible assets 2012 Increases Decreases 2013
Software - Cost 10,664.7 5,676.6 16,341.3
- Accumulated amortisation (5,838.6) (3,600.0) (9,438.6)
Intangible in progress - cost - 3,590.1 3,590.1
- Accumulated amortisation - - -
Start-up and expansion cost 518.9 - 518.9
- Accumulated amortisation (491.7) (7.0) (498.7)
Total 4,853.3 5,659.6 - 10,513.0
100

deferred charges for the acquisition of software application licenses and updates of
other management software.
2. TANGIBLE ASSETS
Tangible assets totaled €2,954k at 31 December 2013, an increase of €542k
compared to 31 December 2012.
The following table shows a breakdown of tangible assets:
Tangible assets primarily relate to assets used in the business operations: fixtures and
fittings (€447k, net of accumulated depreciation), computer equipment (€2,337k, net of
accumulated depreciation), telephone system (€163k, net of accumulated depreciation)
and leasehold improvements (€8k, net of accumulated depreciation).
The following table shows a breakdown of the movement in the year:
The increase mainly related to the purchase of new computers and electronic
equipment during the year totaling €1,120k.
(data in thousand Euros)
Other tangible assets 31/12/2013 31/12/2012
Cost 5,572.8 4,286.6 1,286.2 30.0%
Accumulated depreciation 2,619.2 1,874.9 744.3 39.7%
Carring Amount 2,953.6 2,411.7 541.9 22.5%
Change
(data in thousand Euros)
Other tangible assets 31/12/2013 31/12/2012
Fixtures and fittings 446.6 473.4 (26.8) (5.7%)
Computer equipment 2,336.8 1,812.5 524.3 28.9%
Telephone system 162.6 100.1 62.5 62.4%
Leasehold improvements 7.7 25.7 (18.0) (70.0%)
Carring Amount 2,953.7 2,411.7 542.0 22.5%
Change
(data in thousand Euros)
Other assets 2012 Increases Decreases 2013
Computer equipment - costs 3,026.2 1,119.6 4,145.8
- Accumulated depreciation (1,213.7) (595.3) (1,809.0)
Fixtures and fittings - costs 857.6 62.7 920.3
- Accumulated depreciation (384.2) (89.5) (473.7)
Telephone system - costs 206.2 100.6 306.8
- Accumulated depreciation (106.1) (38.1) (144.2)
Leasehold improvements - costs 196.6 3.2 199.8
- Accumulated depreciation (170.9) (21.3) (192.2)
Total 2,411.6 541.9 - 2,953.6
101

3. AMOUNTS CEDED TO REINSURERS FROM TECHNICAL PROVISIONS
These totaled €40,340k at 31 December 2013, an increase of €12,391k compared to 31 December 2012 (€27,949k). A break-down of the balance is provided below:
The year on year increase in the amount of insurance provisions ceded to reinsurers
was due to business growth.
4. FINANCIAL INVESTMENTS
Financial investments at 31 December 2013 totaled €69,852,153k, a 19.8% increase
compared to €58,307,422k at 31 December 2012, and consisted of the following:
Interests in associated
Europa Gestioni Immobiliare S.p.A. (EGI), an associate of the Group was consolidated
using the equity method. EGI is a company operating in property management and
development within the Poste Italiane Group S.p.A.. The Group held an investment of
45% and the decrease of €1,647k during 2013 arose as a result of losses recorded by
EGI in 2013. For more details regarding the fair value level assigned to the investments
in this category, please see Attachment 5 D.3, D.4, D.5 to these financial statements.
(data in thousand Euros)
Amounts ceded to reinsurers from technical provisions 31/12/2013 31/12/2012
Non-life provisions
Provisions for unearned premiums 5,515.1 5,706.5 191.4- -3.4%
Provisions for outstanding claims 10,090.7 7,515.3 2,575.4 34.3%
Other provisions 761.8 225.3 536.5 238.1%
Life provisions - - -
Provisions for outstanding claims 3,591.1 3,518.7 72.4 2.1%
Mathematical provisions 20,380.9 10,982.8 9,398.1 85.6%
Provisions for policies where the investment risk is
borne by the policyholders and provisions for pension
funds - - -
Other provisions - - -
Total 40,339.6 27,948.6 12,391.0 44.3%
Change
(data in thousand Euros)
Financial investments 31/12/2013 31/12/2012
Investments in subsidiaries, associated companies and joint ventures 197,019.2 198,666.1 (1,646.9) (0.8%)
Loans and receivables 11,457.8 102,146.0 (90,688.2) (88.8%)
A vailable for sale financial assets 59,159,854.6 47,924,881.1 11,234,973.5 23.4%
Financial assets at fair value through profit or loss 10,483,821.3 10,081,729.1 402,092.2 4.0%
Total financial investments 69,852,152.9
58,307,422.3 11,544,730.6 19.8%
Change
102

Loans and Receivables
Loans and Receivables amounted to €11,458k at 31 December 2013, compared to
€102,146k at 31 December 2012 and, comprised of the following:
Loans
The total of €142k at 31 December 2013 (€101,471k at 31 December 2012), consisted
entirely to the balance of the current account and the relating accrued interest.
Receivables
Receivables totaling €11,316k at 31 December 2013 (€675k as at 31 December 2012)
related to subscriptions to capital calls on mutual funds for which the corresponding
shares have not yet been issued.
Available-for-Sale Financial Assets
The total balance is composed of the following:
Unrealized gains, the difference between the book value and market value at 31
December 2013, totaling €1,218,565k were recorded for those Financial instruments
classified as "Available-for-Sale Financial assets". By applying the Shadow Accounting
option per International Accounting Standards, €1,145,079k of the gains were
transferred as retrocessions to policyholders with contra-assets in technical provisions.
The remaining €73,485k were recorded in the Shareholders' equity fair value provisions
for €48,385k, net of taxes.
Equity securities, classified in the AFS category, totaling €5,284k (€4,526k as at 31
December 2012), related to Class I products linked to segregated accounts.
Bonds totaled €57,617,659k (€45,752,186k as at 31 December 2012), of which
€56,483,696k related to listed instruments issued by European countries and leading
European companies and €1,133,964k of unlisted securities, including specific CDP
S.p.A. issuances (private placement) with a fair value of €1,058,019k used for covering
Class I "specific asset" insurance policies placed during the previous year.
Investment fund units, totaling €1,536,911k (€2,168,169k as at 31 December 2012)
consisted of €1,165,886k in funds primarily invested in stocks and €371,025k in mutual
funds that are mainly invested in bonds.
(data in thousand Euros)
Available for sale financial assets 31/12/2013 31/12/2012
Equities 5,284.5 4,525.8 758.7 16.8%
Bonds 57,617,659.2 45,752,186.2 11,865,473.0 25.9%
Investment Fund units 1,536,910.9 2,168,169.1 (631,258.2) (29.1%)
Total 59,159,854.6 47,924,881.1 11,234,973.5 23.4%
Change
103

For more details regarding the fair value level assigned to the investments in this
category, please see Attachment 5 D.3, D.4, D.5 to these financial statements.
Financial assets at fair value through profit or loss
These amounted to €10,483,821k at 31 December 2013, compared to €10,081,729k at
31 December 2012, and consisted of the following:
Bonds of €6,560,746k at 31 December 2013 (€6,152,553k at 31 December 2012)
included €5,888,910k of stripped “BTP” Treasury Bonds purchased to cover Class III
insurance policies, with the remaining €671,836k invested in corporate bonds issued
by leading issuers and included in segregated accounts;
Structured bonds totaling €2,983,252k at 31 December 2013 (€3,102,350k at 31
December 2012) consist of investments whose profits are related to specific market
index performances, primarily to cover index-linked products. The overall decrease in
2013 of €119,098k was due to the disposal of financial instruments totaling €818,688k
to cover corresponding Class III settlements, partly offset by a corresponding positive
effect in the Income Statement of approximately €42,712k and an increase in the fair
value of the assets of €156,878k. The remaining increase of €500,000k was due to the
investment in a new Constant Maturity Swap-type issuance by CDP.
Other financial assets totaling €729,835k at 31 December 2013 (€708,680k at 31
December 2012) related to mutual fund shares held primarily to cover unit linked
products. The increase of €21,155k compared to the prior year, was primarily due to
the combined effect of:
a) new investments of €50,347k, made in two new internal unit-linked insurance
products;
b) a €15,562k increase in fair value; and
c) disposals totaling €45,202k of Class III settlements, related to "old" unit-linked
products, which delivered a positive effect on the Income Statement of €449k.
d) €114,457k relating to these products were repaid at maturity at the beginning of
2014.
(data in thousand Euros)
Financial assets at fair value through
profit or loss31/12/2013 31/12/2012
Bonds 6,560,746.0 6,152,553.0 408,193.0 6.6%
Structured bonds 2,983,252.1 3,102,350.0 (119,097.9) (3.8%)
Other financial investments 729,835.0 708,679.8 21,155.2 3.0%
Derivatives 209,988.2 118,146.3 91,841.9 77.7%
Total 10,483,821.3
10,081,729.1 402,092.2 4.0%
Change
104

Derivatives totaling €209,988k at 31 December 2013 (€118,146k at 31 December
2012) were warrants intended to cover index-linked policies. The Company has not
entered into or adjusted any derivative transactions during the year.
At 31 December 2013 the nominal value of Group warrants totaled €6,057,718k, in line
with 31 December 2012, with a fair value of €209,988k, an increase on the prior year
value of €91,842k.
The warrants portfolio is composed as follows:
For more details regarding the fair value level assigned to the investments in this
category, please see Attachment 5 D.3, D.4, D.5 to these financial statements.
5. OTHER RECEIVABLES
Other receivables at 31 December 2013 amounted to €73,003k, an increase of
€32,130k compared to €40,873k at 31 December 2012. The balance consisted of the
following:
The book value of trade receivables and other receivables was in line with their fair
value. Trade receivables were short-term and did not bear interest.
(data in thousand Euros)
Warrants
Policy Nominal value Fair value Nominal value Fair value
Alba 787,244 16,320 787,244 9,250
Terra 1,470,339 26,628 1,470,339 13,836
Quarzo 1,381,607 27,273 1,381,607 13,194
Titanium 721,107 31,664 721,107 18,302
Arco 200,000 28,160 200,000 15,120
Prisma 197,421 23,495 197,421 13,683
6Speciale 200,000 240 200,000 1,584
6Aavanti 200,000 220 200,000 1,352
6Sereno 200,000 14,010 200,000 8,410
Primula 200,000 13,054 200,000 7,690
Top5 250,000 13,300 250,000 6,325
Top5 edizione II 250,000 15,625 250,000 9,400
Total 6,057,718 209,988 6,057,718 118,146
31.12.2013 31.12.2012
(data in thousand Euros)
Other receivables 31/12/2013 31/12/2012
Receivables arising out of direct insurance operations 10,225.4 7,521.9 2,703.5 35.9%
Receivables arising out of reinsurance operations 11,022.2 6,444.7 4,577.5 71.0%
Other receivables 51,755.5 26,906.9 24,848.6 92.4%
Total other receivables 73,003.1 40,873.5 32,129.6 78.6%
Change
105

With regards to Receivables from policyholders, the Group did not present any
particular credit risk concentration since credit exposure was divided among a large
number of counterparties.
Receivables arising out of Direct Insurance Operations
At 31 December 2013 this balance amounted to €10,225k, compared to €7,522k at 31
December 2012 and was composed as follows:
Receivables from policyholders amounted to €1,936k at 31 December 2013 and
included expired premiums not yet collected and due. The total balance consisted of
premiums not collected by Non-Life insurance of €965k for 2013 and €303k for
previous year receivables, for which write off was not considered necessary since they
were still due. The remaining €668k related to Life insurance premiums for the year not
yet collected.
The increase compared to the previous year was attributable to the growth in premium
collection.
Receivables from intermediaries totaling €7,458k at 31 December 2013 (€5,230k at 31
December 2012) related to premiums issued at year-end which, although already
collected by the intermediary as of 31 December 2013, were paid to the company in
early January 2014.
€7,400k of the total balance related to receivables from Poste Italiane S.p.A. and
referred to products placed in the last days of the year that were accounted for
subsequently. Such receivables were accounted for in early January 2014.
The change compared to the previous year was attributable to the growth in premium
collection
Receivables from co-insurance agreements amounted to €831k at 31 December 2013
(€1,004k at 31 December 2012) and related to the co-insurance agreement with
Eurizon Vita S.p.A. for the amounts owed by it to the Company in its capacity as
leading company for products placed before 30 September 2004.
Receivables out of reinsurance operations
These receivables amounted to €11,022k at 31 December 2013, compared to €6,445k
at 31 December 2012 and related to recoveries from reinsurers for claims and
commissions. The increase compared to the previous year was connected to business
growth.
(data in thousand Euros)
Receivables arising out of direct insurance operations 31/12/2013 31/12/2012
Receivables from policyholders 1,936.4 1,287.9 648.5 50.4%
Receivables from intermediaries for premiums 7,457.9 5,230.4 2,227.5 42.6%
Receivables from co - insurance agreements 831.1 1,003.6 (172.5) -17.2%
Total 10,225.4 7,521.9 2,703.5 35.9%
Change
106

Other receivables
Other receivables totaled €51,755k at 31 December 2013 (€26,907k at 31
December2012) and were comprised of the following:
Receivables from policyholders for stamp duty of €48,275k related to stamp duty on
financial policies listed in Life Insurance Classes III and V.
Receivables from Poste Italiane group companies of €2,176k at 31 December 2013,
mainly related to the receivable against Bancoposta Fondi SGR for VAT paid in 2013
on invoices for Insurance asset management fees, that will be adjusted in the course of
2014, amounting to €2,006k.
Third party receivables primarily related to advances and loans to suppliers (not belonging to Poste Italiane Group) for credit notes.
6. OTHER ASSETS
Other assets totaled €1,219,779k at 31 December 2013, an increase of €439,338k
compared to 31 December 2012, and included the following:
Deferred acquisition costs amounted to €44,505k at 31 December 2013 (€30,705k at
31 December 2012) and included the undepreciated element of acquisition
commissions paid in advance on FIP products (Individual Pension Plans) of €41,800k
and to Poste Italiane for the placement of products pertinent to Non-Life insurance,
totaling €2,706k. The increase compared to 2012 was due to the growth of premiums
relating to Individual Pension Plans products in 2013.
Deferred Tax Assets amounting to €9,754k at 31 December 2013 (€8,415k at 31
December 2012) were calculated as the total of the temporary differences arising
between the accounting value of financial statements assets and liabilities and the
(data in thousand Euros)
Other receivables 31/12/2013 31/12/2012
Receivables from policyholders for stamp duty 48,274.9 25,329.2 22,945.7 90.6%
Receivables from PI group companies 2,176.3 99.0 2,077.3 2098.3%
Receivables from third parties 1,164.5 1,369.4 (204.9) -15.0%
Other receivables 139.8 109.2 30.6 28.0%
Total 51,755.5 26,906.8 24,848.7 92.4%
Change
(data in thousand Euros)
Other assets 31/12/2013 31/12/2012
Non-current assets or disposal groups classified as held
Deferred acquisition costs 44,505.3 30,704.5 13,800.8 44.9%
Deferred tax assets 9,754.2 8,415.3 1,338.9 15.9%
Tax receivables 1,164,432.9 740,329.0 424,103.9 57.3%
Other assets 1,086.4 991.5 94.9 9.6%
Total 1,219,778.8 780,440.3 439,338.5 56.3%
Change
107

respective tax value according to the provisions of IAS 12, where recovery was
possible.
Temporary differences mainly originated from risk provisions and value adjustments
made on the equities included in current assets, as well as other negative income
components, such as the non-deductible surplus of changes in provisions for
outstanding claims and provisions for bad debts, the taxes of which will be recorded on
a straight-line basis in subsequent years.
Current tax assets amounting to €1,164,433k at 31 December 2013 (€740,329k at 31
December 2012) mainly related to tax credits on mathematical provisions as per
Legislation No. 191/2004 for almost €926,929k (€729,360k as at 31 December 2012),
to credit for advance IRES payments to the Parent Company for the 2013 tax period
after having joined the Consolidated tax system for €160,634k (€1,727k as at 31
December 2012), and to credit an advance IRAP payment of €74,145k (€7,500k as at
31 December 2012). The increase in advances compared to 2012, net of debt
offsetting arising from tax consolidation relationship, was related to the combined
provisions of Legislative Decree 133/2013 and of Ministerial Decree of November 30,
2013, which raised the advances to 130% of previous year’s taxes. Other activities at
the period end amounted to €1,086k (€992k as at 31 December 2012), and mainly
related to costs incurred during the year that had been deferred to the following year on
an accrual basis.
7. CASH AND CASH EQUIVALENTS
Cash and cash equivalents at 31 December 2013 were €804,856k, compared to €1,025,293k at 31 December 2012.
The balance is composed as follows:
Short-term bank and post office deposits as well as cash and duty stamps were
included in this item.
(data in thousand Euros)
Cash and cash equivalents 31/12/2013 31/12/2012
Cash at bank deposits 773,062.9 963,381.6 (190,318.7) -19.8%
Cash in post office current accounts deposits 31,786.8 61,907.0 (30,120.2) -48.7%
Cheques and cash in hand 6.4 4.3 2.1 48.8%
Total 804,856.1 1,025,292.9 (220,436.8) -21.5%
Change
108

LIABILITIES
1. SHAREHOLDERS’ EQUITY
Shareholders' equity attributable to the Group amounted to €2,763,515k at 31
December 2013 (€2,108,439k at 31 December 2012). The movement in individual
reserves is shown in the Statement of Changes in Shareholders' Equity.
Shareholders' equity is composed as follows:
The change compared to the previous year was due to: i) the increase in the share
capital subscribed by Poste Italiane S.p.A. and paid respectively in July (€200m) and
December (€150m), ii) result for the period and iii) changes in the revenue reserve
arising from financial assets available for sale. During the year, €533k of these assets
were transferred to the income statement.
The following table shows the reconciliation of shareholders' equity and the result for the period for 2011-2013.
Shareholders' equity attributable to the group 31/12/2013 31/12/2012
Share capital 1,216,607.9 866,607.9 350,000.0 40.4%
Revenue reserves and other reserves: 1,142,652.1 869,280.0 273,372.1 31.4%
Legal reserve 60,412.5 33,869.8 26,542.7 78.4%
Extraordinary reserve 648.0 648.0 - 0.0%
Organization fund 2,582.3 2,582.3 - 0.0%
Consolidation reserve 428.0 428.0 - 0.0%
Previous revenue reserves 1,078,581.3 831,751.9 246,829.4 29.7%
Reserve for unrealized gains or losses on available for sale financial
assets 148,130.1 99,211.2 48,918.9 49.3%
Reserve for other unrealized gains and losses through equity 5.3 (31.8) 37.1 -116.7%
Result of the period 256,119.9 273,372.1 (17,252.2) -6.3%
Total 2,763,515.3 2,108,439.4 655,075.9 31.1%
(data in thousand Euros)
Change
(data in thousand Euros)
Result of the
period
Shareholders'
equity
Result of the
period
Changes in
equity
Shareholders
' equity
Result of
the period
Changes in
equity
Shareholders'
equity
2011 31/12/2011 2012 31/12/2012 31/12/2012 2013 31/12/2013 31/12/2013
Local financial statement 80,315 1,428,257 530,853 - 1,959,109 238,207 350,000 2,547,317
Measurement of financial assets 53,813 313,056 (258,024) 0 55,032 17,276 72,307
AFS securities net of deferred policyholder liabilities 0 (90,477) 0 187,579 97,102 0 47,735 144,837
Measurement of investments (cost method) (3,667) (44,248) (4,583) 0 (48,832) (3,822) (52,654)
Actuarial differences on severance pay 0 85 0 (101) (17) 0 32 16
Adjustment on deferred acquisition costs 797 (31) 31 0 0 0 0
Other minor adjustments (1,033) (1,033) 1,040 0 7 1,049 1,056
IAS/IFRS Company financial statement 130,225 1,605,608 269,317 187,478 2,062,402 252,710 397,768 2,712,880
Retained Earnings of the consolidated subsidiary 1,217 480 4,264 (6) 4,738 5,128 4 9,869
Fair value reserve (AFS) of the subsidiary 0 (2,025) 0 4,135 2,110 0 1,183 3,293
Equity method investements 39,404 39,407 (208) (9) 39,190 (1,718) 1 37,473
IAS/IFRS consolidated financial statement 170,846 1,643,469 273,372 191,598 2,108,439 256,120 398,956 2,763,516
Reconciliation statement of the result of the period and sheroholders' equity of the Group and the Parent Company
109

2. PROVISIONS
Provisions at 31 December 2013 totaled €10,050k, compared to €8,609k at 31
December 2012. This item included provisions for the following liabilities:
Application of the Law 166/08 (so-called "dormant insurance") for approximately
€1m;
legal disputes, for approximately €3.3m;
tax liabilities which could arise from ongoing litigation (claims for approximately
€2.3m). The risk of potential litigation related to the "deductibility" of major
expenses (incurred in 2010) with respect to Law 166/08 for approximately
€3.4m was also taken into consideration.
The €1.4m increase compared to 31 December 2012 was mainly due to the provision
made to cover liabilities on pending legal disputes at the end of the period and only
partly due to an increase of previous estimates, particularly for cases regarding expired
policies.
3. INSURANCE PROVISIONS
Insurance provisions at 31 December 2013 totaled €68,005,153k, an increase of
€11,234,265k, compared to €56,770,888k at 31 December 2012, and comprised the
following:
Non-Life Technical Provisions
At 31 December 2013 non-life technical provisions, recorded gross of reinsurance,
included: provisions for unearned premiums (€31,777k), provisions for outstanding
claims (€26,106k) and other provisions (€4,807k). It also included the provision made
following the adequacy test on the provision for unearned premiums.
Insurance provisions 31/12/2013 31/12/2012
Non-l i fe classes :
Provisions for unearned premiums 31,776.6 25,460.5 6,316.1 24.8%
Provisions for outstanding claims 26,105.5 16,368.2 9,737.3 59.5%
Other insurance provisions 4,806.8 1,443.6 3,363.2 233.0%
Total Non-life Classes 62,688.9 43,272.3 19,416.6 44.9%
Li fe classes :
Mathematical provisions 55,723,799.4 45,175,796.8 10,548,002.6 23.3%
Provisions for outstanding claims 229,343.9 204,395.5 24,948.4 12.2%
Other insurance provisions 2,799,143.7 1,707,366.5 1,091,777.2 63.9%
9,190,176.6 9,640,057.2 (449,880.6) -4.7%
Total Life Classes 67,942,463.6 56,727,616.0 11,214,847.6 19.8%
Total 68,005,152.5 56,770,888.3 11,234,264.2 19.8%
(data in thousand Euros)
Change
Provisions for policies where the investment risk is
borne by the policyholders
110

In particular, with reference to Class 16 (Pecuniary losses), the only class with a
negative performance at the end of 2013 mainly due to the economic downturn, a
provision for unearned premiums for unexpired risks equal to €4,400k was recorded,
according to the hands-on method suggested by the Supervisory Authorities, deemed
suitable to meet IFRS 4 requirements for the adequacy test on these provisions. The
item also included an increasing age provision of €407k. According to Article 37,
paragraph 8, of Legislative Decree No. 209 of September 7, 2005 and to Article 46 of
Isvap Regulation No. 16, the provision was established using the lump sum criteria for
an amount of 10% of the gross premiums written in the year for contracts specified in
the Regulation. Provisions for outstanding claims, allocated to cover claims incurred
but not reported (IBNR) amounted to €4,790k. Provisions for unearned premiums and
outstanding claims reflected the growth of premium collection.
Life Technical Provisions
Contracts classified as "insurance contracts" and as "financial instruments with
discretionary participation", which used the same accounting and assessment criteria
of Italian financial statements, as required by IFRS 4 par.15, were subjected to a LAT
– Liability Adequacy Test, to verify the net insurance provision adequacy as compared
to “realistic provisions", based on the cash flow present value, obtained by projecting
the expected cash flow generated by the existing portfolio at year-end and assumptions
based on the expiration causes (mortality, termination, surrender, reduction) and on
changes in expenditure.
The results of the analysis confirmed the technical provisions’ adequacy, removing the
need for further provisions. These results, described in Part F "Risk information" proved
the adequacy of the provisions recorded in the financial statements.
At 31 December 2013, "Other provisions" included the provision for future expenses
(art. 31 Isvap Regulation No. 21/2008) of €72,226k, the provision for supplementary
insurance premiums of €3,288k and the provision for deferred liabilities to
policyholders, accrued according to the shadow accounting method, pursuant to par.
30 of IFRS 4, totaling €2,723,630k.
4. FINANCIAL LIABILITIES
The following table shows the breakdown of financial liabilities:
Financial liabilities 31/12/2013 31/12/2012
Financial liabilities classified as held for trading
Financial liabilities at fair value through profit or loss
Other financial liabilities 544,179.1 544,293.6 (114.4) 0.0%
Total 544,179.1 544,293.6 (114.4) 0.0%
(data in thousand Euros)
Change
111

Other financial liabilities amounting to €544,179k at 31 December 2013 related to
subordinated loan notes of €540,000k (€400,000k of which have an indefinite maturity),
remunerated at market rates, adjusted to the conditions laid down by Art. 45 Chapter
IV, Title III of Legislative Decree No. 209 dated September 7, 2005 and subsequent
amendments, entered into by the Company entirely with Poste Italiane S.p.A. The
remaining €4,179k related to accrued expenses.
5. PAYABLES
Payables at 31 December 2013 were €144,084k, an increase of €18,736k compared to
€125,347k at 31 December 2012. The following table sets forth a breakdown of
payables:
Payables arising out of direct insurance operations:
Commissions payable to Poste Italiane SpA of €91,064k at 31 December 2013
(€67,349k at 31 December 2012), related to invoices to be received from Poste Italiane
S.p.A., for commissions earned for the sale of insurance products in November and
December that will be settled in early 2014. The increase was linked to the growth of
collection.
Payables to policyholders totaled €2,480k at 31 December 2013 (€490k at 31
December 2012) and mainly related to payables arising in the period to policyholders
for settlement is not yet due.
Payables relating to co-insurance agreements amounting to €500k at 31 December
2013 related to the co-insurance agreement with Eurizon Vita S.p.A. for the amounts
owed to it by the Company in its capacity as leading company for products placed
before 30 September 2004.
Payables 31/12/2013 31/12/2012
Payables arising out of direct insurance operations 94,043.7 68,075.6 25,968.1 38.1%
Payables arising out of reinsurance operations 12,856.2 10,913.8 1,942.4 17.8%
Other payables 37,184.0 46,358.1 (9,174.1) -19.8%
Total 144,083.9 125,347.5 18,736.4 14.9%
(data in thousand Euros)
Change
Payables arising out of direct insurance operations 31/12/2013 31/12/2012
Commissions payable to Poste italiane 91,063.8 67,348.5 23,715.3 35.2%
Payables to policyholders 2,480.0 490.1 1,989.9 406.0%
Payables relating to co - insurance agreements 499.9 237.0 262.9 110.9%
Total 94,043.7 68,075.6 25,968.1 38.1%
(data in thousand Euros)
Change
112
Payables arising out of reinsurance operations
Payables arising out of reinsurance operations at 31 December 2013 totaled €12,856k,
an increase of €1,942k compared to €10,914k at 31 December 2012. The increase is
attributable to business growth.
Other Payables
Other payables amounting to €37,184k at 31 December 2013 (€46,358k at 31
December 2012) were comprised as follows:
Amounts due to third party suppliers related to trade payables for services rendered by
companies not included in the Poste Italiane Group, part of which had not yet been
invoiced at year-end (€18,639k at 31 December 2013).
Payables to Poste Italiane Group suppliers (€9,650k at 31 December 2013) related to
services provided by associates of the Poste Italiane Group.
Payables to MEF – Ministry of Finance, amounting to €3,575k at 31 December 2013
related to amounts payable to the Fund set up by the MEF for policies expiring after 28
October 2008, when Law 166/2008 came into force, introducing "dormant policy"
regulations. These will be settled in May 2014.
Payables arising from purchased funds amounted to €2,439k at 31 December 2013
and relate to amounts owed for funds purchased and not yet settled at the end of 2013.
The transaction settlement took place in early 2014.
In accordance with IVASS provisions contained in Regulation 7, the liability for
employee severance pay has been recorded under other payables.
According to international accounting standards, and in relation to information provided
by the International Accounting Standards Board (IASB) and by the International
Financial Reporting Interpretations Committee (IFRIC), severance pay was considered
as a defined-benefit plan.
Actuarial assessment of the severance pay was carried out according to the "accrued
benefits" method using the "Projected Unit Credit" (PUC) criterion as provided in
paragraphs 64-66 of IAS 19.
The assessment took into account individual employees at 30 November 2013. So-
called "Terminated but not settled" employees and Temporary employees, i.e. those
who had already stopped working or who will interrupt their employment during the next
Other payables 31/12/2013 31/12/2012
Payables to third party suppliers 18,639.4 13,780.3 4,859.1 35%
Payables to PI Group suppliers 9,650.2 17,082.4 (7,432.2) -44%
Payables to MEF Ministry of Finance 3,575.0 13,372.9 (9,797.9) -73%
Payables arising from human resources management 2,397.0 2,162.8 234.2 11%
of which severance pay 823.3 804.6 18.7 2%
Payables arising from purchased funds 2,439.4 - 2,439.4 n.s.
Other payables 483.0 (40.3) 523.3 -1298%
Total 37,184.0 46,358.1 (9,174.1) -19.8%
(data in thousand Euros)
Change
113

months, and have yet to receive severance pay, were not individually considered in the
assessments. The IAS 19 liability was then assumed as equal to the accrued statutory
reserve.
The actuarial model for severance pay assessment was based on various demographic
and economic assumptions.
Some assumptions made explicit reference to factors directly related to the Company,
while others used best practice benchmarks.
Below are the key assumptions used:
Movements of this liability in the last two years were as follows:
6. OTHER LIABILITIES
Amounted to €536,616k at 31 December 2013 compared to €631,665k at 31
December 2012, and consist of the following:
31/12/2013 30/06/2013 31/12/2012
Annual discount rate 3.17% 3.12% 3.12%
Annual inflation rate 2.00% 2.00% 2.00%
Annual severance pay accrual rate 3.00% 3.00% 3.00%
Severance pay 31/12/2013 31/12/2012
Book value at the beginning of the period 804.7 615.9 188.8 31%
Service Cost 36.2 19.0 17.2 90%
Interest cost 23.1 28.0 (4.9) -17%
Benefits paid (6.9) (5.3) (1.6) 31%
Transfers in/(out) 21.2 (15.5) 36.7
Actuarial (Gains)/Losses (55.0) 162.5 (217.5) -134%
Book value at the end of the period 823.3 804.6 18.7 2.3%
(data in thousand Euros)
Change
Other liabilities 31/12/2013 31/12/2012
Liabilities directly associated with non - current
assets and disposal groups classified as held for sale
Deferred tax liabilities 108,897.1 74,909.5 33,987.6 45.4%
Current tax liabilities 422,848.8 553,195.1 (130,346.3) -23.6%
Other liabilities 4,870.2 3,560.5 1,309.7 36.8%
Total 536,616.1 631,665.1 (95,049.0) -15.0%
(data in thousand Euros)
Change
114

Tax payables totaled €422,849k at 31 December 2013, as follows:
Payables for reserve advance(€282,295k at 31 December 2013) related to payables to
tax authorities, relative to advance tax payments on mathematical provisions made in
2013, but accounted for in May 2014. The increase compared to last year was due to
an increase in the mathematical provisions recorded during the period.
The IRES debt equal to €55,938k at 31 December 2013, included in payables for
current taxes, related to the additional 8.5% IRES tax required of banks, insurance
companies and other financial companies for 2013, as per Article 2, paragraph 2, of
Legislative Decree No.133/2013.
Payables to tax authorities for stamp duty at 31 December 2012, for financial policies
included in Life classes III and V (as provided for in the 24 May 2012 implementing
decree issued pursuant to article 19 paragraph 5 of Decree-Law No. 201, 6 December
2011 amended by Law No. 214 of 2 December 2011)1, amounted to €43,844k.
Moreover, payables to tax authorities for substitute taxes on FIP products (Individual
Pension Plans) totaled €6,924k at 31December 2013. The increase from 31 December
2012 is related to the increased collection of FIP products:
Payables for withholding and substitute taxes for amounts paid for life policies were
€4,300k at 31 December 2013.
Deferred tax liabilities of €108,897k at 31 December 2013 included the tax effect of all
temporary differences of an economic and equity nature which will be transferred to
future years, mainly attributable to financial asset adjustments.
Other liabilities
Other liabilities totaled €4,870k at 31 December 2013 (€3,560kat 31 December 2012)
and mainly related to amounts due to personnel for outstanding leave not taken, to the
fourteenth month payment and bonuses.
1 Paragraph 7 of the implementing decree provided that for communications relating to Life Class III and V policies, the duty stamp
is payable at the time of repayment or surrender. However, for each year of contract duration, the companies must record the duty stamp value of each policy in force at year-end and enter this sum in the balance sheet as debt toward the Tax Authorities. This debt will be cancelled in later periods as a tax set-off for policyholders, through the tax payment determined cumulatively upon repayment or surrender of each individual policy.
Current tax liabilities 31/12/2013 31/12/2012
Payables for reserve advance L.D. 209/2002 282,295.1 266,380.0 15,915.1 6.0%
Payables for current taxes 83,970.7 60,812.5 23,158.2 38.1%
Payables to PI for transferred taxes 193,122.9 (193,122.9) -100.0%
Payable to tax authorities for IPP (Individual Pension Plan) substitute tax 6,923.5 4,569.0 2,354.5 51.5%
Payable to tax authorities for stamp duty 43,843.9 23,562.7 20,281.2 86.1%
Payable for withholding taxes on life policies 4,300.1 3,336.1 964.0 28.9%
Other 1,515.5 1,411.9 103.6 7.3%
Total 422,848.8 553,195.1 (130,346.3) -23.6%
(data in thousand Euros)
Change
115

PART D – NOTES TO THE CONSOLIDATED INCOME STATEMENT
1.1 NET EARNED PREMIUMS
Total net earned premiums amounted to €13,200,235k for the year ended 31
December 2013, an increase of €2,664,611k compared to €10,535,625k for the year
ended 31 December 2012.
Total gross premiums written totaled €13,244,002k for the year ended 31 December
2013, a 25% increase compared to the year ended 31 December 2012 (€10,567,909k).
Total premiums ceded amounted to €34,655k for the year ended 31 December 2013,
compared to €26,638k for the year ended 31 December 2012.
All gross premiums written relative to the insurance group portfolio fell within the scope
of IFRS 4; with reference to Life Classes, €13,063,895k related to contracts with profit
sharing, while €108,732k related to contracts without profit sharing.
1.2 FEE AND COMMISSION INCOME
Fee and commission income for the year ended 31 December 2012 totaled €187k and
related to commissions on Class III contracts issued prior to 2005, all expired at 31
December 2012. These were classified as financial contracts and did not fall under
IFRS 4 application.
1.3 NET INCOME FROM FINANCIAL INSTRUMENTS AT FAIR VALUE
THROUGH PROFIT OR LOSS
Net income from financial instruments at fair value through profit or loss amounted to
€744,535k for the year ended 31 December 2013, compared to €1,465,183k for the
year ended 31 December 2012. The decrease was attributable to less favorable market
conditions.
2013 2012
“Life” gross premiums 13,172,627.2 10,516,665.9 2,655,961.3 25.3%
“Non-life” gross premiums 71,375.2 51,243.4 20,131.8 39.3%
Total gross premiums written 13,244,002.4 10,567,909.3 2,676,093.1 25.3%
Change in provision for unearned premiums (9,552.6) (5,984.0) (3,568.6) 59.6%
Gross earned premiums 13,234,449.8 10,561,925.3 2,672,524.5 25.3%
Life premiums ceded to reinsurers (11,098.4) (9,115.1) (1,983.3) 21.8%
Non-life premiums ceded to reinsurers (23,556.3) (17,522.9) (6,033.4) 34.4%
Total premiums ceded to reinsurers (34,654.7) (26,638.0) (8,016.7) 30.1%
Change in the reinsurers' provision for unearned premiums 440.2 337.2 103.0 30.5%
Earned premiums ceded (34,214.5) (26,300.8) (7,913.7) 30.1%
Total net premiums 13,200,235.3 10,535,624.5 2,664,610.8 25.3%
(data in thousand Euros)
Change
116

The following table shows the breakdown of net income from financial instruments at
fair value through profit or loss:
1-4 -1.5 NET INCOME FROM INTERESTS IN SUBSIDIARIES, ASSOCIATED
COMPANIES AND JOINT VENTURES FROM OTHER FINANCIAL INSTRUMENTS
AND INVESTMENT PROPERTIES
This item totaled €2,248,977k for the year ended 31 December 2013, an increase of
€487,147k compared to 31 December 2012, as shown below:
Net income from financial assets classified as available-for-sale amounted to
€2,259,536k for the year ended 31 December 2013, compared to €1,770,652k for the
year ended 31 December 2012, with the increase attributable to the growth in managed
volumes and positive returns achieved in the period.
A small part of net charges of approximately €10,559k for the year ended 31 December
2013 (€8,822k for the year ended 31 December 2012) related to interest expenses on
subordinated loans underwritten with Poste Italiane S.p.A. of €18,455k, interest income
on bank and post office current accounts of €9,544k and net accrual accounting losses
attributable to the subsidiary EGI, totaling €1,648k.
1.6 OTHER INCOME
Other income amounted to €851k for the year ended 31 December 2013 and mainly
related to: i) write-off of premiums ceded in previous years and recovery of premiums
ceded following the termination of the reinsurance contract with Swiss Re (€526k); ii)
accrued interest on IRES credit (corporate tax) recorded following online refund
requests for 2004 – 2007 pursuant to L. Decree No. 185/2008, with reference to the
10% lump sum IRAP (tax) deduction, and for 2007 - 2011 according to L. Decree n.
201/2011 for IRAP tax deductions on labor costs (€158k) and iii) write-off of prior year
settlements and commissions (€59k).
Interest/Inco
me
Other income Realized
gains
Total realized
income
Unrealize
d gains
Total income
2013
Total income
2012
Net Income from financial assets at fair value through profit or loss 308,214.7 (149.0) 15,939.6 324,005.4 420,530.0 744,535.4 1,465,183.1 (720,647.7) -49.2%
(data in thousand Euros)
Change
Interest/IncomeOther income
and expenses
Net realized
gains
Total realized
income and
expenses
Net
unrealize
d losses
Total income
and expenses
2013
Total income and
expenses
2012
From available for sale financial assets 2,080,866.70 30,496.4 148,172.9 2,259,536.0 2,259,536.0 1,770,651.6 488,884.4 27.6%
From cash and cash equivalents 9,543.90 9,543.9 9,543.9 14,228.5 (4,684.6) -32.9%
From other financial liabilities (18,455.4) (18,455.4) (18,455.4) (22,826.2) 4,370.8 -19.1%
From interests in associated companies (1,647.9) (1,647.9) (224.0) (1,423.8) 635.5%
Total 2,071,955.17 30,496.40 148,172.90 2,250,624.47 (1,647.9) 2,248,976.6 1,761,829.8 487,146.8 27.7%
Change
(data in thousand Euros)
117
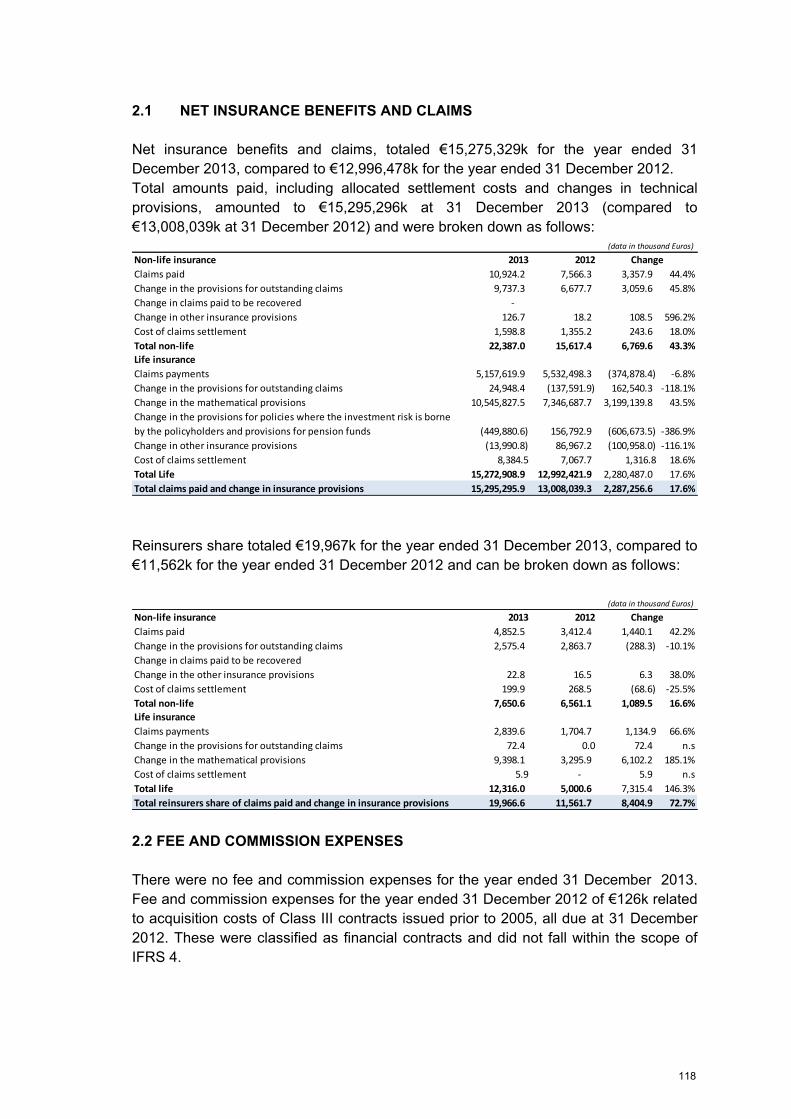
2.1 NET INSURANCE BENEFITS AND CLAIMS
Net insurance benefits and claims, totaled €15,275,329k for the year ended 31
December 2013, compared to €12,996,478k for the year ended 31 December 2012.
Total amounts paid, including allocated settlement costs and changes in technical
provisions, amounted to €15,295,296k at 31 December 2013 (compared to
€13,008,039k at 31 December 2012) and were broken down as follows:
Reinsurers share totaled €19,967k for the year ended 31 December 2013, compared to
€11,562k for the year ended 31 December 2012 and can be broken down as follows:
2.2 FEE AND COMMISSION EXPENSES
There were no fee and commission expenses for the year ended 31 December 2013.
Fee and commission expenses for the year ended 31 December 2012 of €126k related
to acquisition costs of Class III contracts issued prior to 2005, all due at 31 December
2012. These were classified as financial contracts and did not fall within the scope of
IFRS 4.
Non-life insurance 2013 2012
Claims paid 10,924.2 7,566.3 3,357.9 44.4%
Change in the provisions for outstanding claims 9,737.3 6,677.7 3,059.6 45.8%
Change in claims paid to be recovered -
Change in other insurance provisions 126.7 18.2 108.5 596.2%
Cost of claims settlement 1,598.8 1,355.2 243.6 18.0%
Total non-life 22,387.0 15,617.4 6,769.6 43.3%
Claims payments 5,157,619.9 5,532,498.3 (374,878.4) -6.8%
Change in the provisions for outstanding claims 24,948.4 (137,591.9) 162,540.3 -118.1%
Change in the mathematical provisions 10,545,827.5 7,346,687.7 3,199,139.8 43.5%
Change in the provisions for policies where the investment risk is borne
by the policyholders and provisions for pension funds (449,880.6) 156,792.9 (606,673.5) -386.9%
Change in other insurance provisions (13,990.8) 86,967.2 (100,958.0) -116.1%
Cost of claims settlement 8,384.5 7,067.7 1,316.8 18.6%
Total Life 15,272,908.9 12,992,421.9 2,280,487.0 17.6%
Total claims paid and change in insurance provisions 15,295,295.9 13,008,039.3 2,287,256.6 17.6%
(data in thousand Euros)
Change
Life insurance
Non-life insurance 2013 2012
Claims paid 4,852.5 3,412.4 1,440.1 42.2%
Change in the provisions for outstanding claims 2,575.4 2,863.7 (288.3) -10.1%
Change in claims paid to be recovered
Change in the other insurance provisions 22.8 16.5 6.3 38.0%
Cost of claims settlement 199.9 268.5 (68.6) -25.5%
Total non-life 7,650.6 6,561.1 1,089.5 16.6%
Claims payments 2,839.6 1,704.7 1,134.9 66.6%
Change in the provisions for outstanding claims 72.4 0.0 72.4 n.s
Change in the mathematical provisions 9,398.1 3,295.9 6,102.2 185.1%
Cost of claims settlement 5.9 - 5.9 n.s
Total life 12,316.0 5,000.6 7,315.4 146.3%
Total reinsurers share of claims paid and change in insurance provisions 19,966.6 11,561.7 8,404.9 72.7%
Life insurance
Change
(data in thousand Euros)
118

2.5 Acquisition and administration costs
The following table shows the breakdown of acquisition and administration costs
related to Life and Non-Life insurance business:
Acquisition commissions, net of changes in commissions for amortization, of €307,853k
for the year ended 31 December 2013 (€215,325k for the year ended 31 December
2012) related to commissions paid to Poste Italiane’s distribution network for the sale of
insurance products. Commissions relating to long-term contracts were amortized
according to Isvap Regulation No. 22 of April 4, 2008.
The increase in 2013 was primarily attributable to an increased collection and different
marketing mix. In 2013, Life insurance also included the marketing of Class III and
"specific asset” products which guaranteed a greater economic payment at the time of
placement, compared to traditional Class I products which generated value uniformly
over the contract duration. Other acquisition costs amounted to €19,708k for the year
ended 31 December 2013 (€18,663k for the year ended 31 December 2012) and
included costs arising from insurance contract termination, different from acquisition
commissions. In particular, they included advertising costs for the sale of insurance
products, administrative costs connected to application processing and policy issue,
and to the share of costs of employees who were involved, in whole or in part, in
organization or production. Commissions and profit share from reinsurers of €12,500k
for the year ended 31 December 2013 (€6,413k for the year ended 31 December 2012)
included commissions paid to the Company by reinsurers, measured on the share of
premiums ceded for contracts written. The increase was attributable to business
growth.
Costs not directly or indirectly attributable to the acquisition of premiums and contracts,
to settlement of claims, or to investment management were considered as other
administrative costs and totaled €40,154k for the year ended 31 December 2013,
compared to €37,695k for the year ended 31 December 2012.
Non-life insurance 2013 2012
Commissions and other acquisitions costs: 15,304.7 10,996.5 4,308.2 39.2%
Acquisition commissions 13,248.6 8,509.1 4,739.5 55.7%
Other acquisition costs 2,056.1 2,487.4 (431.3) -17.3%
Commissions and profit share from reinsurers (10,556.8) (5,044.2) (5,512.6) 109.3%
Total Non-life 4,747.9 5,952.3 (1,204.4) -20.2%
Commissions and other acquisitions costs: 312,255.7 222,990.9 89,264.8 40.0%
Acquisition commissions 294,603.9 206,815.4 87,788.5 42.4%
Other acquisition costs 17,651.8 16,175.5 1,476.3 9.1%
Commissions and profit share from reinsurers (1,943.6) (1,369.0) (574.6) 42.0%
Total life 310,312.1 221,621.9 88,690.2 40.0%
Investment management expenses 26,508.8 21,488.6 5,020.2 23.4%
Other administration costs 40,153.9 37,694.6 2,459.3 6.5%
Total administration expenses 381,722.7 286,757.4 94,965.3 33.1%
(data in thousand Euros)
Change
Life insurance
119
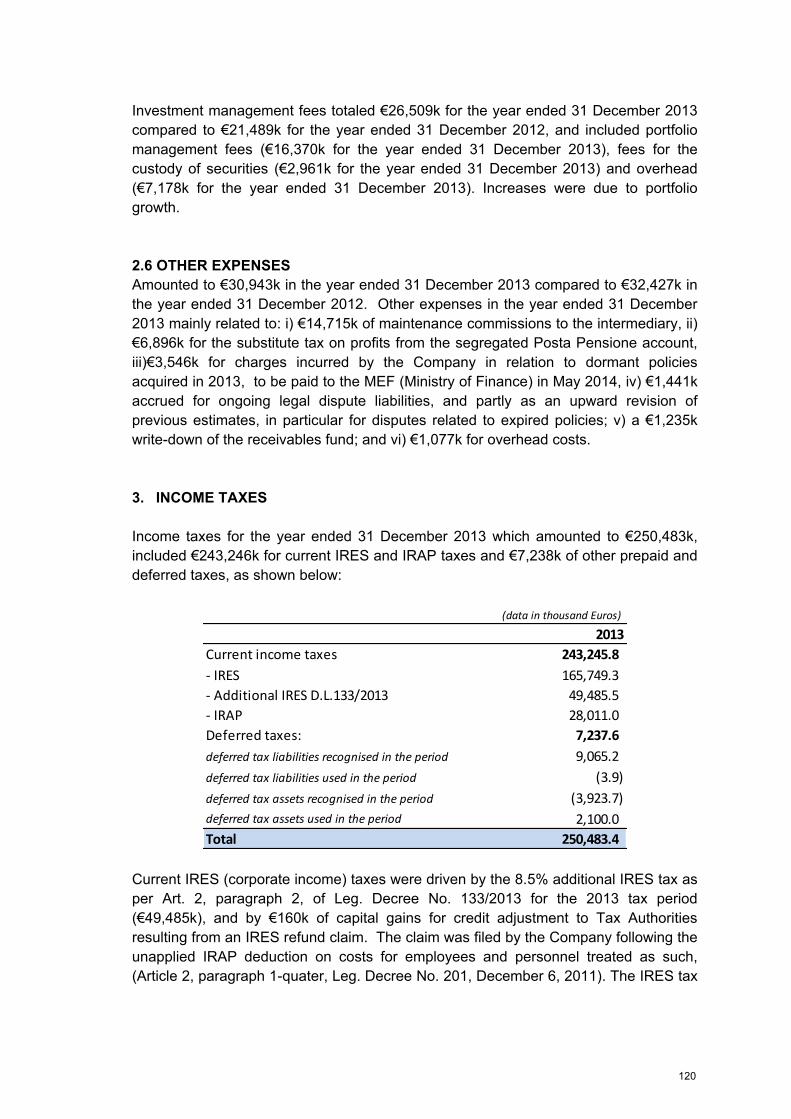
Investment management fees totaled €26,509k for the year ended 31 December 2013
compared to €21,489k for the year ended 31 December 2012, and included portfolio
management fees (€16,370k for the year ended 31 December 2013), fees for the
custody of securities (€2,961k for the year ended 31 December 2013) and overhead
(€7,178k for the year ended 31 December 2013). Increases were due to portfolio
growth.
2.6 OTHER EXPENSES
Amounted to €30,943k in the year ended 31 December 2013 compared to €32,427k in
the year ended 31 December 2012. Other expenses in the year ended 31 December
2013 mainly related to: i) €14,715k of maintenance commissions to the intermediary, ii)
€6,896k for the substitute tax on profits from the segregated Posta Pensione account,
iii)€3,546k for charges incurred by the Company in relation to dormant policies
acquired in 2013, to be paid to the MEF (Ministry of Finance) in May 2014, iv) €1,441k
accrued for ongoing legal dispute liabilities, and partly as an upward revision of
previous estimates, in particular for disputes related to expired policies; v) a €1,235k
write-down of the receivables fund; and vi) €1,077k for overhead costs.
3. INCOME TAXES
Income taxes for the year ended 31 December 2013 which amounted to €250,483k,
included €243,246k for current IRES and IRAP taxes and €7,238k of other prepaid and
deferred taxes, as shown below:
Current IRES (corporate income) taxes were driven by the 8.5% additional IRES tax as
per Art. 2, paragraph 2, of Leg. Decree No. 133/2013 for the 2013 tax period
(€49,485k), and by €160k of capital gains for credit adjustment to Tax Authorities
resulting from an IRES refund claim. The claim was filed by the Company following the
unapplied IRAP deduction on costs for employees and personnel treated as such,
(Article 2, paragraph 1-quater, Leg. Decree No. 201, December 6, 2011). The IRES tax
2013
Current income taxes 243,245.8
- IRES 165,749.3
- Additional IRES D.L.133/2013 49,485.5
- IRAP 28,011.0
Deferred taxes: 7,237.6
deferred tax liabilities recognised in the period 9,065.2
deferred tax liabilities used in the period (3.9)
deferred tax assets recognised in the period (3,923.7)
deferred tax assets used in the period 2,100.0
Total 250,483.4
(data in thousand Euros)
120

was accounted for as a direct reduction of taxes for the year ending 31 December
2013.
Deferred tax assets and liabilities were calculated according to the tax rates expected
to be applied during the year in which the assets are realized, based on information
available at year-end.
Net charges recorded in the income statement related to the transfer of deferred tax
liabilities of €9,061k for the year. This amount was influenced by the provision of IRES
and IRAP tax liabilities to higher financial income for IAS / IFRS purposes, compared to
those measured according to the criteria laid down by tax regulations (€9,027k).
Regarding the movement of deferred tax assets, deferred tax benefits of €1,824k was
mainly driven by the provision for risks and by adjustments to shares held in current
assets in the Company’s statement of financial position, as well as other negative
income components, such as the non-deductible surplus of the change in provision for
outstanding claims, whose tax accrual accounting was to be attributed on a straight-line
basis over the following years.
The following table provides a reconciliation between taxes recorded in the financial
statements and theoretical taxes, calculated according to the nominal IRES tax rate of
27.5%. IRAP was not taken into account since the tax base was determined by criteria
different than that required by tax regulations for IRES purposes.
2013
Amount Tax rate
Result before taxes 506,603.3
Theoretical income taxes (IRES at 27.5% only) 139,315.9 27.50%
Change in life classes technical provisions 40,808.5 8.09%
Non-deductible interest 1,363.0 0.27%
Non-deductible gains and losses 414.8 0.08%
IRAP tax deduction from IRES (2,607.0) (0.52%)
ACE benefit (8,472.9) (1.68%)
Other 2,378.2 0.58%
IRES income taxes 173,200.5 34.33%
IRAP income taxes 27,957.4 5.54%
Additional 8.5% 49,485.5 9.81%
IRES L.D. 201/2011 refund (160.0) (0.03%)
Income taxes for the period 250,483.4 49.64%
(data in thousand Euros)
121

Unified Management and Coordination
The Company is wholly owned by Poste Italiane S.p.A. which carries out management
and coordination for the Group. The key financial information of Poste Italiane S.p.A.,
as reported in their standalone financial statements as at 31 December 2012 is
presented below.
Reference should be made to Poste Italiane S.p.A.‘s financial statements, that together
with the independent auditors report, are available in the form and manner established
by law.
122

BALANCE SHEET
ASSETS 31/12/2012 31/12/2011
Non-current assets 6,271,014 6,550,670
Assets attributable to BancoPosta 51,568,812 42,369,061
Current assets 3,419,576 4,079,257
Non-current assets held for sale 129 6,568
TOTAL ASSETS 61,259,531 53,005,556
SHAREHOLDERS' EQUITY AND LIABILITIES 31/12/2012 31/12/2011
Shareholders' equity 4,312,870 2,921,982
Share capital 1,306,110 1,306,110
Reserves 1,163,588 166,471
Retained Earnings 1,843,172 1,449,401
Non-current liabilities 2,293,610 2,187,283
Liabilities attributable to BancoPosta 49,781,518 41,914,079
Current liabilities 4,871,533 5,982,212
TOTAL SHAREHOLDERS' EQUITY AND LIABILITIES 61,259,531 53,005,556
SEPARATE INCOME STATEMENT
Year 2012 Year 2011
Revenue from sales and services 9,206,306 9,467,614
Other income from financial activities 155,686 124,693
Other operating income 123,280 166,479
Total revenue 9,485,272 9,758,786
Cost of goods and services 2,121,093 1,943,330
Other expenses from financial activities 1,472 21,514
Staff costs 5,658,396 5,681,006
Amortization, depreciation and impairment 525,546 475,453
Capitalised costs and expenses -7,629 -8,421
Other operating costs 235,725 244,140
Operating profit/(loss) 950,669 1,401,763
Finance costs 115,027 146,504
Finance income 90,694 135,323
Profit /(Loss) before taxe 926,336 1,390,583
Income tax expenses 204,091 692,045
PROFIT FOR THE YEAR 722,245 698,539
(data in thousand Euros)
123

PART E – OTHER INFORMATION
Human resources
At 31 December 2013 the Group had 317 employees, an increase of 38 from the
previous year. The increase is primarily related to strengthening the organizational
structure in respect of the growth in size and volume.
Fees paid for statutory audit and non-audit services As per the provisions of art. 149-duodecies of the CONSOB Issuer Regulation, the
following is a breakdown of the fees for the year, net of expenses and VAT, for services
provided by external auditors and entities belonging to the Poste Vita Group:
Solvency Margin
The elements forming the Solvency margin, calculated with the consolidation-based
method, amounted to €3,102m, compared to a required solvency margin of €2,545m;
consequently, the solvency ratio at year-end 2013 was equal to 1.22. Further details
can be found in the spreadsheet in Attachment 1 of Isvap Regulation No. 18.
Workforce structure 2013 2012 Change
Senior management 32 31 1
Middle management 113 90 23
Employees 161 149 12
Temporary contracts 11 9 2
Direct workforce 317 279 38
Type of servicesSubject providing the
serviceRecipient
Fees (in
thousand Euros )
External audit PricewaterhouseCoopers Poste Vita Spa 243
Compliance services PricewaterhouseCoopers Poste Vita Spa 63
External audit PricewaterhouseCoopers Poste Assicura SpA 85
Total 391
124

Significant events occurred after year-end
In order to support the commercial developments expected for the next three years,
while maintaining a solvency ratio of 120% until the introduction of the new Solvency II
Regulations, Poste Vita’s Board of Directors resolved the issuance of a subordinated
loan for the notional total amount of €750m, to be placed in the professional investor
market.
On 19 February 2014 official changes to Poste Vita and Poste Assicura’s distribution
agreements with Poste Italiane S.p.A. were made and signed, and will be effective until
March 2019, with the possibility of a tacit renewal for another five years (unless
terminated). On 2 April 2014, IVASS began an inspection of the Company, which is still
underway.
125

PART F: NOTES ON TRANSACTIONS WITH RELATED PARTIES
Transactions between Poste Vita S.p.A. and its subsidiary Poste Assicura S.p.A. are
eliminated from the Consolidated Financial Statements. Intragroup transactions mainly
related to personnel secondment, rent and space organization, administration, support,
IT support and communications and marketing.
The balances of financial and commercial transactions between the Group and related
parties were as follows:
The Company is wholly owned by Poste Italiane S.p.A, which provides management
and coordination activities to the Group.
Transactions with Poste Italiane S.p.A. (who holds all the shares), were governed by
written contracts, adjusted to market conditions mainly concerning:
the placement and distribution of insurance products at post offices and related
activities;
post office current accounts;
partial secondment of personnel used by the Company;
support in business organization, personnel selection and management;
pick-up, packaging and shipping service for ordinary mail; and
call center services.
A service contract relating for information technology is currently being finalized with
Poste Italiane S.p.A.
Furthermore, as at 31 December 2013 subordinated loan notes totaling €540m issued
by the Company were underwritten by Poste Italiane S.p.A., and remunerated at
market conditions, thus reflecting the creditworthiness of the insurance Company.
Assets Liabilities Assets Liabilities
Associated company 197,019 198,666
Other related parties 241,044 644,750 98,206 628,602
Income Expenses Income Expenses
Associated company 1,648 224
Other related parties 1,865 362,789 3,847 271,282
Counterpart31.12.2013 31.12.2012
(data in thousand Euros)
(data in thousand Euros)
31.12.2013Counterpart
31.12.2012
126

Among the activities, is reported at 31 December 2013 the value of the investment in
the associated company Europa Gestioni Immobiliare S.p.A. (EGI) for €197,019K and
among the charges the related losses recorded by EGI for the current year equal to
€1,648K.
In addition to the relationship with the Company, the Group companies also maintained
operational relations with other Poste Italiane Group companies, particularly for:
managing the Company’s available assets and of part of the Segregated
Accounts’ portfolio investments (Bancoposta SGR Funds);
printing, enveloping and mail delivery through information systems;
management of incoming mail, dematerialization and filing of printed
documentation (Postel);
services related to network connections with the Italian post office counters
(Postecom);
mobile telephone services (Poste Mobile);
advice on obligations pertaining to occupational health and safety (Poste
Tutela);
Term Life Insurance Policies (Postel and BdM-MCC)
Policies for Non-Life classes (PdM-MCC – Postel), General Third Party Liability
(Postel) and Fire – Loans (BdM – MMC).
These relationships were also governed at market conditions.
Rome, March 25, 2014
The Board of Directors
127

128

129

130

Poste Vita S.p.A. 00144, Roma (RM), Piazzale Konrad Adenauer, 3 • Tel.: (+39) 06 549241 • Fax: (+39) 06 54924203 • www.postevita.it
Partita IVA 05927271006 • Codice Fiscale 07066630638 • Capitale Sociale Euro 1.216.607.898,00 i.v. • Registro Imprese di Roma
n. 29149/2000, REA n. 934547 • Iscritta alla Sezione I dell’Albo delle imprese di assicurazione al n. 1.00133 • Autorizzata
all’esercizio dell’attività assicurativa in base alle delibere ISVAP n. 1144/1999, n. 1735/2000, n. 2462/2006 e n. 2987/2012 • Società
capogruppo del gruppo assicurativo Poste Vita, iscritto all’albo dei gruppi assicurativi al n. 043 • Società con socio unico, Poste
Italiane S.p.A., soggetta all’attività di direzione e coordinamento di quest’ultima.
Certificate of the Consolidated Financial Statements pursuant to art.
154-bis,
paragraph 5 of Legislative Decree dated February 24, 1998, no. 58 and
of art. 81-ter of Consob Regulation no. 11971 dated May 14, 1999
and subsequent amendments and additions
1. We, the undersigned Maria Bianca Farina, in her capacity as Managing Director, and
Giuseppe Ricciarelli, in his capacity as Manager in Charge of preparing the
accounting documents of Poste Vita S.p.A., also taking into account the provisions
of art. 154 bis, paragraphs 3 and 4, and of Legislative Decree no. 58 dated February
24, 1998, hereby certify:
the adequacy regarding the Company’s characteristics and
the actual application
of the administrative and accounting procedures in drawing up the Consolidated
Financial Statements for the period January 1–December 31, 2013.
2. For this purpose, the following is reported:
2.1 as highlighted in the Internal Control – Integrate Framework model issued by the
Committee of Sponsoring Organization of the Treadway Commission, which
represents the generally accepted reference framework at international level
for Internal Control, expressly mentioned by Confindustria in the Guidelines for
carrying out the activities of the Manager in Charge of preparing the Company’s
accounting documents pursuant to art. 154-bis of the Consolidated Law on
Finance TUF, an internal control system, even if well conceived and
implemented, can only provide reasonable, but not absolute certainty on the
achievement of Company objectives, among which are the correctness and
truthfulness of the financial information.
131

2.2 During the year activities aiming at updating the main administrative and
accounting procedures were completed, while other activities, among which
those aiming to verify the actual application of the above-mentioned
administrative and accounting procedures, are in progress.
3. Moreover, we certify that,
3.1 the consolidated financial statements:
a. were drafted in compliance with the provisions of the Civil Code, Legislative
Decree no. 173/1997, Legislative Decree no. 209/2005 and to applicable ISVAP
rules, regulations and memorandums;
b. correspond to the accounting books and records;
c. are suitable to provide a true and correct representation of the asset, economic
and financial position of Poste Vita S.p.A. and the undertakings included in the
consolidation taken as a whole;
3.2 the management report includes a reliable analysis of the management trend and
operating results, and of the Company’s situation and that of the undertakings
included in the consolidation, together with a description of the main risks and
uncertainties to which they are exposed.
Rome, March 25, 2014
The Managing Director The Manager in Charge of
preparing the accounting documents
Maria Bianca Farina Giuseppe Ricciarelli
132

BALANCE SHEET- ASSETS
31/12/2013 31/12/20121 INTANGIBLE ASSETS 10,513 4,853 1.1 Goodwill - - 1.2 Other intangible assets 10,513 4,853 2 TANGIBLE ASSETS 2,954 2,412 2.1 Land and buildings - - 2.2 Other tangible assets 2,954 2,412
3 AMOUNTS CEDED TO REINSURERS FROM TECHNICAL PROVISIONS 40,340 27,949
4 INVESTMENTS 69,852,153 58,307,422 4.1 Land and buildings (investment properties) - - 4.2 Investments in subsidiaries, associated companies and joint ventures 197,019 198,666 4.3 Held to maturity investments - - 4.4 Loans and receivables 11,458 102,146 4.5 Available for sale financial assets 59,159,855 47,924,881 4.6 Financial assets at fair value through profit or loss 10,483,821 10,081,729 5 OTHER RECEIVABLES 73,003 40,873 5.1 Receivables arising out of direct insurance operations 10,225 7,522 5.2 Receivables arising out of reinsurance operations 11,022 6,445 5.3 Other receivables 51,755 26,907 6 OTHER ASSETS 1,219,779 780,440 6.1 Non-current assets or disposal groups as classified as held for sale - - 6.2 Deferred acquisition costs 44,505 30,704 6.3 Deferred tax assets 9,754 8,415 6.4 Tax receivables 1,164,433 740,329 6.5 Other assets 1,086 992 7 CASH AND CASH EQUIVALENTS 804,856 1,025,293
TOTAL ASSETS 72,003,597 60,189,243
data in thousand Euros
133
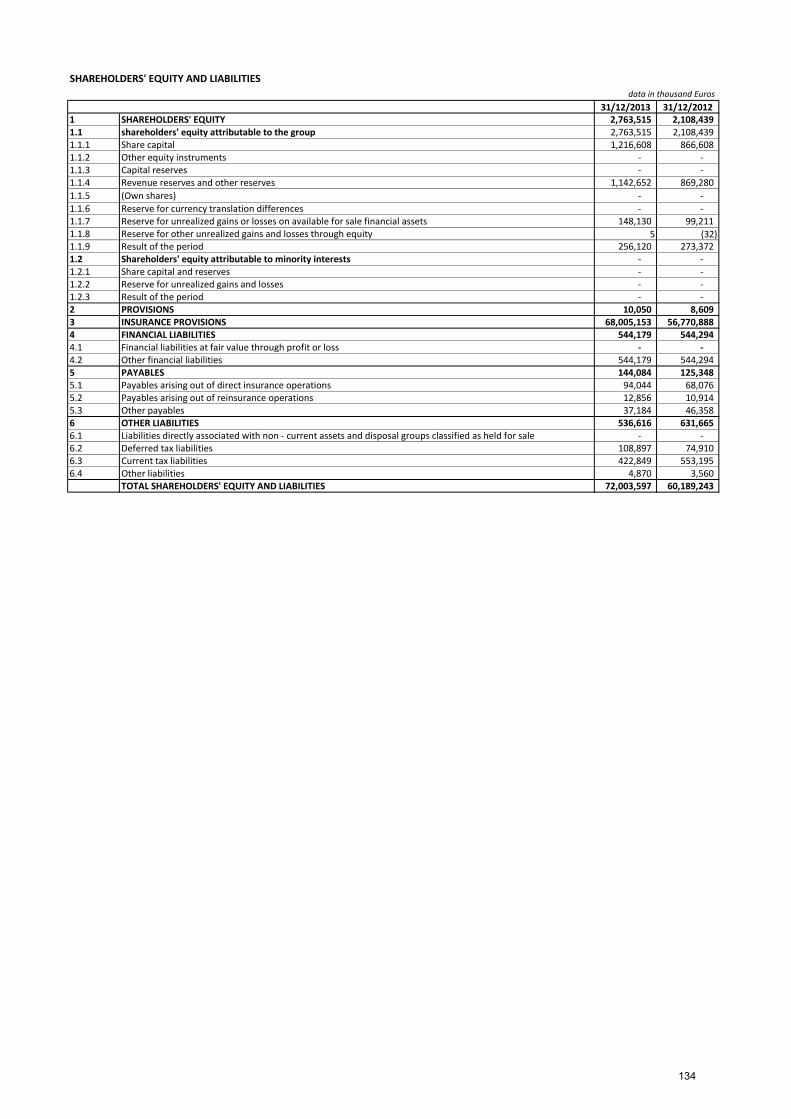
SHAREHOLDERS' EQUITY AND LIABILITIES
31/12/2013 31/12/20121 SHAREHOLDERS' EQUITY 2,763,515 2,108,439 1.1 shareholders' equity attributable to the group 2,763,515 2,108,439 1.1.1 Share capital 1,216,608 866,608 1.1.2 Other equity instruments - - 1.1.3 Capital reserves - - 1.1.4 Revenue reserves and other reserves 1,142,652 869,280
1.1.5 (Own shares) - -
1.1.6 Reserve for currency translation differences - - 1.1.7 Reserve for unrealized gains or losses on available for sale financial assets 148,130 99,211 1.1.8 Reserve for other unrealized gains and losses through equity 5 (32)1.1.9 Result of the period 256,120 273,372 1.2 Shareholders' equity attributable to minority interests - - 1.2.1 Share capital and reserves - - 1.2.2 Reserve for unrealized gains and losses - - 1.2.3 Result of the period - - 2 PROVISIONS 10,050 8,609 3 INSURANCE PROVISIONS 68,005,153 56,770,888 4 FINANCIAL LIABILITIES 544,179 544,294 4.1 Financial liabilities at fair value through profit or loss - - 4.2 Other financial liabilities 544,179 544,294 5 PAYABLES 144,084 125,348 5.1 Payables arising out of direct insurance operations 94,044 68,076 5.2 Payables arising out of reinsurance operations 12,856 10,914 5.3 Other payables 37,184 46,358 6 OTHER LIABILITIES 536,616 631,665 6.1 Liabilities directly associated with non - current assets and disposal groups classified as held for sale - - 6.2 Deferred tax liabilities 108,897 74,910 6.3 Current tax liabilities 422,849 553,195 6.4 Other liabilities 4,870 3,560
TOTAL SHAREHOLDERS' EQUITY AND LIABILITIES 72,003,597 60,189,243
data in thousand Euros
134

INCOME STATEMENT
data in thousand Euros
31/12/2013 31/12/20121.1 Net premiums earned 13,200,235 10,535,625 1.1.1 Gross earned premiums 13,234,450 10,561,925 1.1.2 Earned premiums ceded (34,215) (26,301)1.2 Fee and commission income - 187 1.3 Net Income from financial instruments at fair value through profit or loss 744,535 1,465,183 1.4 Income from subsidiaries, associated companies and joint ventures - -
1.5 Income from other financial instruments and land and buildings (investment properties) 2,299,056 1,898,260
1.5.1 Interest income 2,090,411 1,739,213 1.5.2 Other income 30,496 30,255 1.5.3 Realized gains 178,149 128,792 1.5.4 Unrealized gains - - 1.6 Other income 851 2,760 1 TOTAL INCOME 16,244,678 13,902,015 2.1 Net Insurance benefits and claims (15,275,329) (12,996,478)2.1.1 Claims paid and change in insurance provisions (15,295,296) (13,008,039)2.1.2 Reinsurers' share 19,967 11,562 2.2 Fee and commission expenses - (126)2.3 Expenses from subsidiaries, associated companies and joint ventures (1,648) (224)2.4 Expenses from other financial instruments and land and buildings (investment properties) (48,432) (136,206)2.4.1 Interest expense (18,455) (22,826)2.4.2 Other expenses - - 2.4.3 Realized losses (29,976) (113,380)2.4.4 Unrealized losses - - 2.5 Acquisition and administration costs (381,723) (286,757)2.5.1 Commissions and other acquisition costs (315,060) (227,574)2.5.2 Investment management expenses (26,509) (21,489)2.5.3 Other administration costs (40,154) (37,695)2.6 Other expenses (30,943) (32,427)2 TOTAL COSTS AND EXPENSES (15,738,075) (13,452,218)
EARNINGS BEFORE TAXES 506,603.28 449,797.33 3 Income taxes (250,483) (176,425)
EARNINGS AFTER TAXES 256,120 273,372 4 RESULT OF DISCONTINUED OPERATIONS - -
CONSOLIDATED RESULT OF THE PERIOD 256,120 273,372 Result fo the period attributable to the group 256,120 273,372 Result fo the period attributable to minority interests - -
135

COMPREHENSIVE INCOME STATEMENT
2013 2012
CONSOLIDATED RESULT OF THE PERIOD 256,120 273,372
Other income components net of taxes without reclassification in the income statement - -
Change in Shareholders' equity of subsidiaries - -
Change in reserve for revaluation model on intangible assets - -
Change in reserve for revaluation model on tangible assets - -
Income and expenses from on - current assets and disposal groups classified as held for sale - -
Profit and actuarial losses and adjustments arising from defined benefit plans 36 - 107
Other components - -
Other income components net of taxes with reclassification in the income statement - -
Reserve due to net exchange differences - -
Profit or losses from available for sale financial assets 48,919 191,713
Profit or losses from financial flow hedging instruments - -
Profit or losses from net investment hedging instruments in foreign operations - -
Change in Shareholders' equity of subsidiaries 1 - 9
Income and expenses from on - current assets and disposal groups classified as held for sale - -
Other components - -
TOTAL COMPONENTS OF OTHER COMPREHENSIVE INCOME 48,956 191,598
TOTAL CONSOLIDATED COMPREHENSIVE INCOME STATEMENT 305,076 464,970
attributable to the group 305,076 464,970
attributable to minority interests - -
in thousand Euros
12 Appendix to Consolidated Financial Statement 136
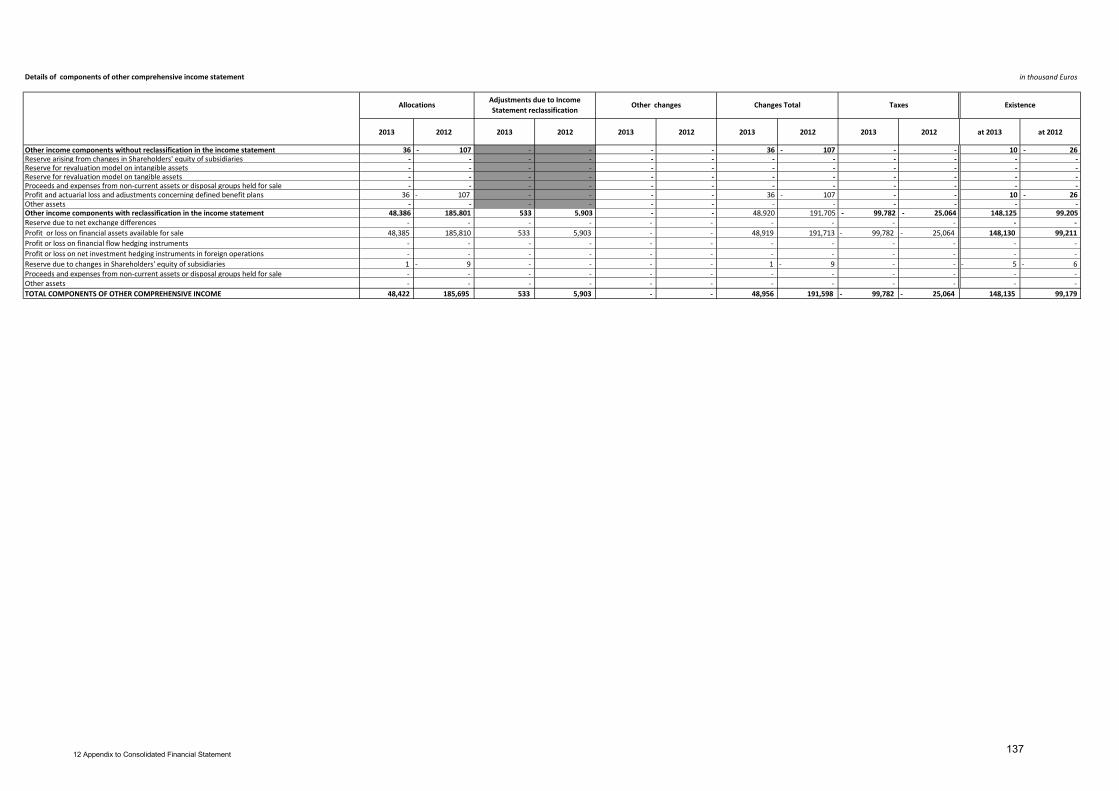
Details of components of other comprehensive income statement
2013 2012 2013 2012 2013 2012 2013 2012 2013 2012 at 2013 at 2012
Other income components without reclassification in the income statement 36 - 107 - - - - 36 - 107 - - 10 - 26 Reserve arising from changes in Shareholders' equity of subsidiaries - - - - - - - - - - - - Reserve for revaluation model on intangible assets - - - - - - - - - - - - Reserve for revaluation model on tangible assets - - - - - - - - - - - - Proceeds and expenses from non-current assets or disposal groups held for sale - - - - - - - - - - - - Profit and actuarial loss and adjustments concerning defined benefit plans 36 - 107 - - - - 36 - 107 - - 10 - 26 Other assets - - - - - - - - - - - - Other income components with reclassification in the income statement 48,386 185,801 533 5,903 - - 48,920 191,705 - 99,782 - 25,064 148,125 99,205 Reserve due to net exchange differences - - - - - - - - - - - -
Profit or loss on financial assets available for sale 48,385 185,810 533 5,903 - - 48,919 191,713 - 99,782 - 25,064 148,130 99,211
Profit or loss on financial flow hedging instruments - - - - - - - - - - - -
Profit or loss on net investment hedging instruments in foreign operations - - - - - - - - - - - -
Reserve due to changes in Shareholders' equity of subsidiaries 1 - 9 - - - - 1 - 9 - - - 5 - 6 Proceeds and expenses from non-current assets or disposal groups held for sale - - - - - - - - - - - - Other assets - - - - - - - - - - - -
TOTAL COMPONENTS OF OTHER COMPREHENSIVE INCOME 48,422 185,695 533 5,903 - - 48,956 191,598 - 99,782 - 25,064 148,135 99,179
in thousand Euros
AllocationsAdjustments due to Income
Statement reclassificationOther changes Changes Total Taxes Existence
12 Appendix to Consolidated Financial Statement137

STATEMENT OF CHANGES IN SHAREHOLDERS' EQUITY
Amounts as of 31-
12-2011Changes in amount Allocation
Transfer to profit and
loss accountOther transfer
Amounts
as of 31-12-12
Changes in
amountAllocation
Transfer to profit and
loss accountOther transfer
Amounts
as of 31-12-13
866,608 - - - - 866,608 - 350,000 - - 1,216,608
Other equity instruments - - - - - - - - - - -
Capital reserves - - - - - - - - - - -
Revenue reserves and other reserves 698,434 - 170,846 - - 869,280 - 273,372 - - 1,142,652
Own shares) - - - - - - - - - - -
Result of the period 170,846 - 102,526 - - 273,372 - 17,252 - - - 256,120
Components of other comprehensive income 92,419 - - 185,695 5,903 - 99,179 - 48,422 533 - 148,135
1,643,469 - 459,067 5,903 - 2,108,439 - 654,542 533 - 2,763,515
Capital and reserves attributable to minority interests - - - - - - - - - - -
Result of the period - - - - - - - - - - -
Components of other comprehensive income - - - - - - - - - - -
- - - - - - - - - - -
1,643,469 - 459,067 5,903 - 2,108,439 - 654,542 533 - 2,763,515
in thousand Euros
Total
Shareholders' equity
attributable to the group
Share capital
Total attributable to the group
Shareholders' equity
attributable to minority
interestsTotal attributable to minority interests
12 Appendix to Consolidated Financial Statement138

STATEMENT OF CASH FLOW (indirect method)
2013 2012
Result of the period before taxes 506,603 449,797
Changes in non-monetary items 10,796,317 11,423,471
Change in the provisions for unearned premiums for non-life segment 9,230 5,647
Change in the provisions for outstanding claims and other technical provisions for non-life segment 7,266 3,816
Change in the mathematical provisions and other insurance provisions for life segment 11,205,377 12,490,465
Change in deferred acquisition costs -13,801 -11,627
Change in provisions 1,441 -11,691
Other non-monetary proceeds and expenses from financial instruments, property investments and shareholdings -418,882 -1,057,410
Other changes 5,685 4,272
Change in receivables and payables from operating activities -222,243 219,821
Change in receivables and payables arising out of direct insurance and reinsurance operations 22,140 27,572
Change in other receivables and payables -244,383 192,248
Income taxes paid -311,997 -67,008
Net cash flows from monetary items related to investing or financing activity -402,092 -438,809
Financial liabilities from financial contracts issued by insurance companies - -
Payables to banks and customers - -
Loans and receivables from banks or customers - -
Other financial instruments at fair value through profit or loss -402,092 -438,809
TOTAL NET CASH FLOWS FROM OPERATING ACTIVITIES 10,366,588 11,587,273
Net cash flows from land and buildings (investment properties) - -
Net cash flows from investments in subsidiaries, associated companies and joint ventures 1,647 233
Net cash flows from loans and receivables 90,688 106,397
Net cash flows from held to maturity investments - -
Net cash flows from available for sale financial assets -10,816,091 -11,232,538
Net cash flows from tangible and intangible assets -10,553 -7,324
Net cash flows from other investing activities - -
TOTAL NET CASH FLOWS FROM INVESTING ACTIVITIES -10,734,309 -11,133,233
Net cash flows from equity instruments attributable to the group 147,399 16,246
Net cash flows from own shares - -
Distribution of dividends attributable to the group - -
Net cash flows from share capital and reserves attributable to minority interests - -
Net cash flows from subordinated liabilities and other similar liabilities -114 -1,617
Net cash flows from other financial liabilities 0 0
TOTAL NET CASH FLOWS FROM FINANCING ACTIVITY 147,284 14,629
Effect of exchange rate changes on cash and cash equivalents - -
CASH AND CASH EQUIVALENTS AT THE BEGINNING OF THE PERIOD 1,025,293 556,624
CHANGES IN CASH AND CASH EQUIVALENTS -220,437 468,669
CASH AND CASH EQUIVALENTS AT THE END OF THE PERIOD 804,856 1,025,293
in thousand Euros
12 Appendix to Consolidated Financial Statement
139

BALANCE SHEET BY BUSINESS SEGMENT
31/12/2013 31/12/2012 31/12/2013 31/12/2012 31/12/2013 31/12/2012 31/12/2013 31/12/2012 31/12/2013 31/12/20121 INTANGIBLE ASSETS 3,132 0 7,381 4,853 - - - - 10,513 4,853
2 TANGIBLE ASSETS - - 2,954 2,412 - - - - 2,954 2,412
3 AMOUNTS CEDED TO REINSURERS FROM TECHNICAL PROVISIONS 16,368 13,447 23,972 14,502 - - - - 40,340 27,949
4 INVESTMENTS 88,870 71,133 69,791,459 58,264,465 - - 28,175 - 28,175 - 69,852,153 58,307,422
4.1 Land and buildings (investment properties) - - - - - - - - - -
4.2 Investments in subsidiaries, associated companies and joint ventures - - 225,195 226,842 - - 28,175 - 28,175 - 197,019 198,666 4.3 Held to maturity investments - - - - - - - - - -
4.4 Loans and receivables - - 11,458 102,146 - - - - 11,458 102,146
4.5 Available for sale financial assets 88,870 71,133 59,070,985 47,853,748 - - - - 59,159,855 47,924,881
4.6 Financial assets at fair value through profit or loss - - 10,483,821 10,081,729 - - - - 10,483,821 10,081,729
5 OTHER RECEIVABLES 10,741 7,123 63,660 34,826 - - 1,398 - 1,076 - 73,003 40,873
6 OTHER ASSETS 9,658 6,423 1,210,121 774,017 - - - - 1,219,779 780,440
6.1 Deferred acquisition costs 2,706 2,875 41,800 27,829 - - - - 44,505 30,704
6.2 Other assets 6,952 3,548 1,168,322 746,187 - - - - 1,175,273 749,736
7 CASH AND CASH EQUIVALENTS 13,530 10,066 791,327 1,015,226 - - - - 804,856 1,025,293
ASSETS TOTAL 142,298 108,193 71,890,873 60,110,301 - - 29,574 - 29,252 - 72,003,597 60,189,243
1 SHAREHOLDERS' EQUITY 25,482 18,413 2,765,048 2,117,040 - - 27,014 - 27,014 - 2,763,515 2,108,439
2 PROVISIONS - - 10,050 8,609 - - - - 10,050 8,609
3 INSURANCE PROVISIONS 62,689 43,272 67,942,464 56,727,616 - - - - 68,005,153 56,770,888
4 FINANCIAL LIABILITIES - - 544,179 544,294 - - - - 544,179 544,294
4.1 Financial liabilities at fair value through profit or loss - - - - - - - - - -
4.2 Other financial liabilities - - 544,179 544,294 - - - - 544,179 544,294
5 PAYABLES 19,012 14,121 126,470 112,303 - - 1,398 - 1,076 - 144,084 125,348
6 OTHER LIABILITIES 7,688 4,867 528,928 626,798 - - - - 536,616 631,665
TOTAL SHAREHOLDERS' EQUITY AND LIABILITIES 114,871 80,673 71,917,138 60,136,660 - - 28,412 - 28,090 - 72,003,597 60,189,243
in thousand Euros
Non-life insurance Life insurance … (*) Intersectorial removals Total
140

INCOME STATEMENT BY BUSINESS SEGMENT
2013 2012 2013 2012 2013 2012 2013 2012 2013 20121.1 Net premiums 38,706 28,074 13,161,529 10,507,551 - - - - 13,200,235 10,535,625 1.1.1 Gross earned premiums 61,823 45,259 13,172,627 10,516,666 - - - - 13,234,450 10,561,925 1.1.2 Earned premiums ceded (23,116) (17,186) (11,098) (9,115) - - - - (34,215) (26,301)1.2 Fee and commission income - - - 187 - - - - - 187 1.3 Net Income from financial instruments at fair value through profit or loss - - 744,535 1,465,183 - - - - 744,535 1,465,183 1.4 Income from interests in subsidiaries, associated companies and joint ventures - - - - - - - - - - 1.5 Income from other financial instruments and land and buildings (investment properties) 3,300 2,902 2,295,756 1,895,358 - - - - 2,299,056 1,898,260 1.6 Other income 905 1,231 1,736 2,787 - - (1,789) (1,258) 851 2,760 1 TOTAL REVENUES AND INCOME 42,911 32,207 16,203,556 13,871,066 - - (1,789) (1,258) 16,244,678 13,902,015 2.1 Net outstanding claims charges (14,736) (9,056) (15,260,593) (12,987,421) - - - - (15,275,329) (12,996,478)2.1.1 Claims paid and change in insurance provisions (22,387) (15,617) (15,272,909) (12,992,422) - - - - (15,295,296) (13,008,039)2.1.2 Reinsurers' share 7,651 6,561 12,316 5,001 - - - - 19,967 11,562 2.2 Fee and commission expenses - - - (126) - - - - - (126)2.3 Expenses from subsidiaries, associated companies and joint ventures - - (1,648) (224) - - - - (1,648) (224)2.4 Expenses from other financial instruments and land and buildings (investment properties) (0) (79) (48,431) (136,127) - - - - (48,432) (136,206)2.5 Acquisition and administration costs (12,680) (12,040) (369,042) (274,717) - - - - (381,723) (286,757)2.6 Other operating expenses (3,802) (2,817) (28,930) (30,868) - - 1,789 1,258 (30,943) (32,427)2 TOTAL COSTS AND EXPENSES (31,219) (23,992) (15,708,645) (13,429,483) - - 1,789 1,258 (15,738,075) (13,452,218)
RESULT OF THE PERIOD BEFORE TAXES 11,692 8,214 494,911 441,583 - - - - 506,603 449,797
in thousand Euros
Non-life insurance Life insurance … (*) Intersectorial removals Total
141

Consolidation scope
Name CountryMethod
(1)
Activity
(2)
%
Direct participation
%
Total sharing
(3)
%
Votes availability in the
Shareholders' general
meeting
(4)
% consolidation
Poste Assicura IT G 1 100 100 100 100
12 Appendix to Consolidated Financial Statement142

Details of unconsolidated subsidiaries in thousand Euros
Name CountryActivity
(1)
Type
(2)
%
Direct participation
% Total sharing
(3)
%
Votes availability in
the Shareholders'
general meeting
(4)
Book value
EGI SPA IT 10 b 45% 45% 45% 197,019
12 Appendix to Consolidated Financial Statement143

Details of tangible and intangible assets
At costAt redefined value
or at fair valueTotal book value
Investment properties - - -
Other properties - - -
Other tangible assets 2,954 - 2,954
Other intangible assets 10,513 - 10,513
in thousand Euros
12 Appendix to Consolidated Financial Statement144

Details of amounts ceded to reinsurers from technical provisions
31/12/2013 31/12/2012 31/12/2013 31/12/2012 31/12/2013 31/12/2012
Non-life provisions 16,368 13,447 - - 16,368 13,447
Provisions for unearned premiums 5,515 5,707 - - 5,515 5,707
Provisions for outstanding claims 10,091 7,515 - - 10,091 7,515
Other provisions 762 225 - - 762 225
Life provisions 23,972 14,502 - - 23,972 14,502 Provisions for outstanding claims 3,591 3,519 - - 3,591 3,519
Mathematical provisions 20,381 10,983 - - 20,381 10,983
Provisions for policies where the investment risk
is borne by the policyholders and provisions for
pension funds - - - - - -
Other provisions - - - - - -
Total amounts ceded to reinsurers from technical provisions 40,340 27,949 - - 40,340 27,949
Direct insurance Accepted reinsurance Total book value
in thousand Euros
12 Appendix to Consolidated Financial Statement
145

Details of financial assets
31/12/2013 31/12/2012 31/12/2013 31/12/2012 31/12/2013 31/12/2012 31/12/2013 31/12/2012 31/12/2013 31/12/2012 31/12/2013 31/12/2012
Equities and derivatives at cost - - - - - - - - - -
Equities at fair value - - 5,284 4,526 - - - - 5,284 4,526 of which quoted - - 5,284 4,526 - - - - 5,284 4,526
Debt securities - - 57,617,659 45,752,186 - - 9,543,998 9,254,904 67,161,657 55,007,090
of which quoted - - 56,483,696 44,673,345 - - 9,541,546 9,252,352 66,025,242 53,925,696
Shares of UCIs - - 1,536,911 2,168,169 - - 729,835 708,679 2,266,746 2,876,848
Loans and receivables to customers - - - - - - - - - -
Loans and receivables to banks 142 101,471 - - - - - - 142 101,471
Deposits under reinsurance business accepted - - - - - - - - - -
Financial assets components of insurance contracts - - - - - - - - - -
Other loans and receivables 11,316 675 - - - - - - 11,316 675
Non hedging derivatives - - - - - - 209,988 118,146 209,988 118,146
Hedging derivatives - - - - - - - - - -
Other financial assets - - - - - - - - - -
Total 11,458 102,146 59,159,855 47,924,881 - - 10,483,821 10,081,729 69,655,134 58,108,756
in thousand Euros
Held to maturity investments Loans and receivables Financial assets available for sale
Financial assets at fair value through profit or lossTotal
book value Financial assets held for
trading
Financial assets designated as at fair value
through profit or loss
12 Appendix to Consolidated Financial Statement
146
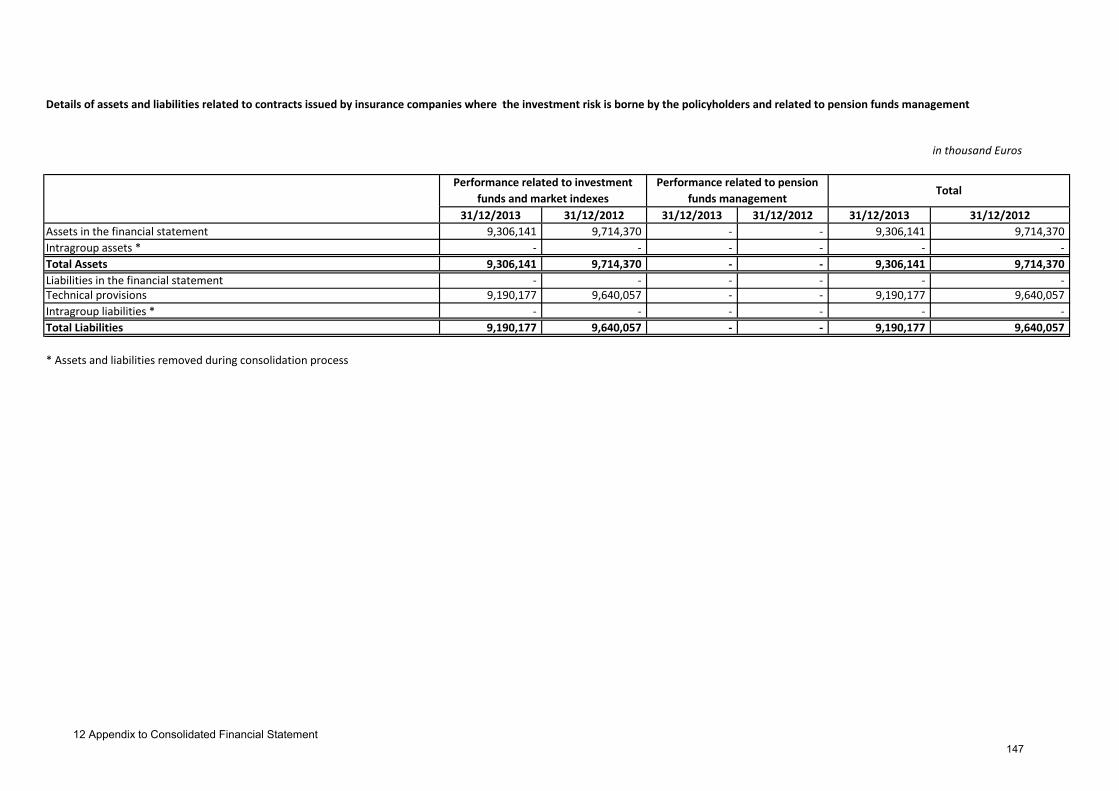
in thousand Euros
31/12/2013 31/12/2012 31/12/2013 31/12/2012 31/12/2013 31/12/2012
Assets in the financial statement 9,306,141 9,714,370 - - 9,306,141 9,714,370
Intragroup assets * - - - - - -
Total Assets 9,306,141 9,714,370 - - 9,306,141 9,714,370
Liabilities in the financial statement - - - - - - Technical provisions 9,190,177 9,640,057 - - 9,190,177 9,640,057
Intragroup liabilities * - - - - - -
Total Liabilities 9,190,177 9,640,057 - - 9,190,177 9,640,057
* Assets and liabilities removed during consolidation process
Details of assets and liabilities related to contracts issued by insurance companies where the investment risk is borne by the policyholders and related to pension funds management
Performance related to investment
funds and market indexes
Performance related to pension
funds managementTotal
12 Appendix to Consolidated Financial Statement
147

Details of technical provisions
31/12/2013 31/12/2012 31/12/2013 31/12/2012 31/12/2013 31/12/2012
Non-life provisions 62,689 43,272 62,689 43,272
Provisions for unearned premiums 31,777 25,461 31,777 25,461
Provisions for outstanding claims 26,106 16,368 26,106 16,368
Other provisions 4,807 1,444 4,807 1,444
of which provisions for liability adequacy test 4,400 1,163 4,400 1,163 Life provisions 67,942,464 56,727,616 67,942,464 56,727,616
Provisions for outstanding claims 229,344 204,395 229,344 204,395
Mathematical provisions 55,723,799 45,175,797 55,723,799 45,175,797
Provisions for policies where the investment risk is borne by the policyholders and
provisions for pension funds 9,190,177 9,640,057 9,190,177 9,640,057
Other provisions 2,799,144 1,707,366 2,799,144 1,707,366
of which provisions for liability adequacy test - - -
of which deferred policyholder liabilities 2,723,630 1,619,279 2,723,630 1,619,279
Total technical provisions 68,005,153 56,770,888 68,005,153 56,770,888
Direct insurance Accepted insurance Total book value
in thousand Euros
12 Appendix to Consolidated Financial Statement
148

Details of financial liabilities
31/12/2013 31/12/2012 31/12/2013 31/12/2012 31/12/2013 31/12/2012 31/12/2013 31/12/2012
Participatory financial instruments - - - - - -
Subordinated liabililities - - 544,179 544,294 544,179 544,294
Financial liabilities related to financial contracts issued by insurance companies - - - - - -
from investment contracts where the investment risk is borne by the policyholders - - - - - - from pension funds management - - - - - - from other contracts - - - - - -
Deposits received from reinsurers - - - - - -
Financial liabilities components of insurance contracts - - - - - -
Issued debt securities - - - - - -
Liabilities to customers - - - - - -
Liabilities to banks - - - - - -
Other loans - - - - - -
Non hedging derivatives - - - - - -
Hedging derivatives - - - - - -
Other financial liabilities - - - - - -
Total - - 544,179 544,294 544,179 544,294
in thousand Euros
Financial liabilities at fair value through profit or loss
Other financial liabilities Total book valueFinancial liabilities held for trading
Financial assets designated as at fair
value through profit or loss
12 Appendix to Consolidated Financial Statement
149
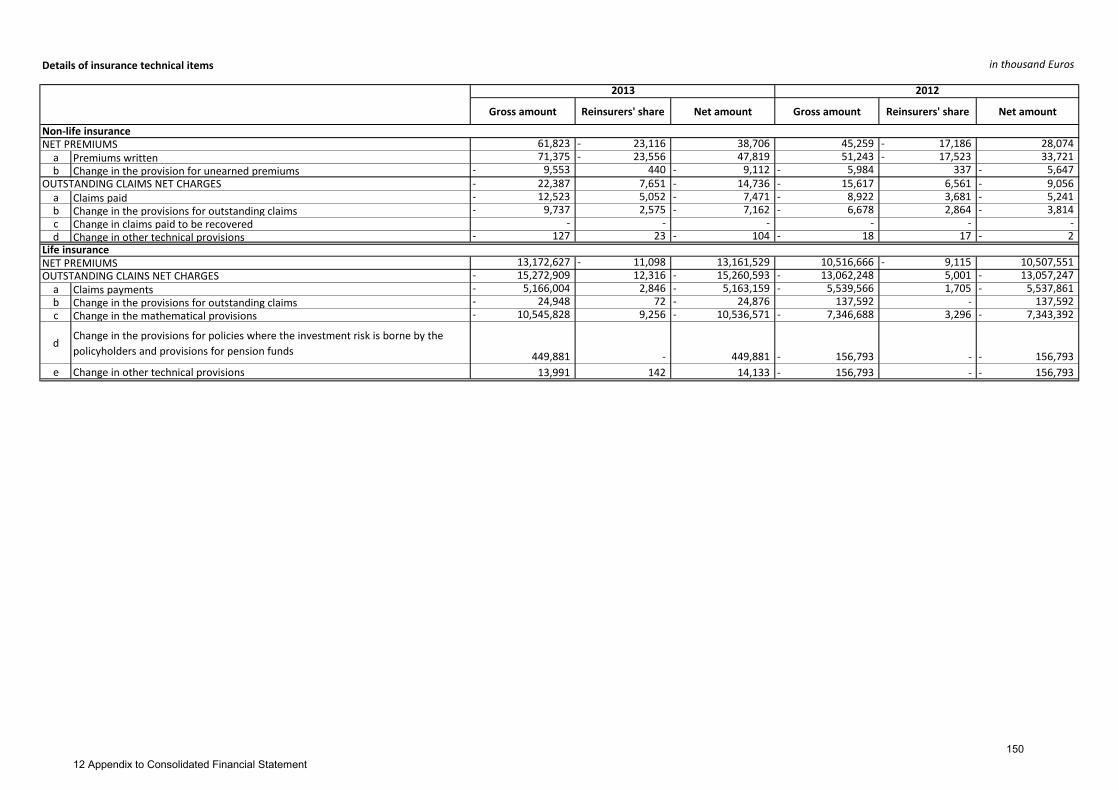
Details of insurance technical items
Gross amount Reinsurers' share Net amount Gross amount Reinsurers' share Net amount
61,823 23,116 - 38,706 45,259 17,186 - 28,074 a Premiums written 71,375 23,556 - 47,819 51,243 17,523 - 33,721 b Change in the provision for unearned premiums 9,553 - 440 9,112 - 5,984 - 337 5,647 -
22,387 - 7,651 14,736 - 15,617 - 6,561 9,056 - a Claims paid 12,523 - 5,052 7,471 - 8,922 - 3,681 5,241 - b Change in the provisions for outstanding claims 9,737 - 2,575 7,162 - 6,678 - 2,864 3,814 - c Change in claims paid to be recovered - - - - - - d Change in other technical provisions 127 - 23 104 - 18 - 17 2 -
NET PREMIUMS 13,172,627 11,098 - 13,161,529 10,516,666 9,115 - 10,507,551 15,272,909 - 12,316 15,260,593 - 13,062,248 - 5,001 13,057,247 -
a Claims payments 5,166,004 - 2,846 5,163,159 - 5,539,566 - 1,705 5,537,861 - b Change in the provisions for outstanding claims 24,948 - 72 24,876 - 137,592 - 137,592 c Change in the mathematical provisions 10,545,828 - 9,256 10,536,571 - 7,346,688 - 3,296 7,343,392 -
dChange in the provisions for policies where the investment risk is borne by the
policyholders and provisions for pension funds 449,881 - 449,881 156,793 - - 156,793 -
e Change in other technical provisions 13,991 142 14,133 156,793 - - 156,793 -
in thousand Euros
Life insurance
OUTSTANDING CLAINS NET CHARGES
2013 2012
Non-life insuranceNET PREMIUMS
OUTSTANDING CLAIMS NET CHARGES
12 Appendix to Consolidated Financial Statement
150

Financial and investment proceeds and expenses
Unrealized
gains
Value
reinstatement
Unrealized
losses
Value
reduction 2,389,081 30,496 149 199,114 35,001 2,583,541 430,079 - 9,548 - 420,530 3,004,071 2,615,877
a From property investment - - - - - - - - - - - - -
b From interests in subsidiaries, associated companies and joint ventures - - - - - - - - - - - - -
c From held to maturity investments - - - - - - - - - - - - - d From loans and receivables - - - - - - - - - - - - - e From financial assets available for sale 2,080,867 30,496 - 178,149 29,976 2,259,536 - - - - - 2,259,536 1,770,652
f From financial assets held for trading - - - - - - - - - - - - -
g From financial assets at fair value through profit or loss 308,215 - 149 20,965 5,025 324,005 430,079 - 9,548 - 420,530 744,535 845,226 - - - - - - - - - - - - - 9,544 - - - - 9,544 - - - - - 9,544 14,228 - 18,455 - - - - - 18,455 - - - - - - 18,455 - 22,826
a From financial liabilities held for trading - - - - - - - - - - - - -
b From financial liabilities at fair value through profit or loss - - - - - - - - - - - - -
c From other financial liabilities - 18,455 - - - - - 18,455 - - - - - - 18,455 - 22,826
- - - - - - - - - - - - - Total 2,380,170 30,496 149 199,114 35,001 2,574,630 430,079 - 9,548 - 420,530 2,995,160 2,607,279
in thousand Euros
Investment result
Other receivables resultCash and cash equivalents resultFinancial liabilities result
Payables result
Total realized income and
expensesRealized losses
Unrealized gains Unrealized lossesTotal non realized proceeds and
expenses
Total proceeds and
expenses 2013
Total proceeds and
expenses
2012
Interest Other incomeOther
expensesRealized gains
12 Appendix to Consolidated Financial Statement
151

Details of insurance operating expenses
2013 2012 2013 201215,305 8,509 312,256 225,479
a Acquisition commissions 13,079 8,808 308,384 216,286 b Other acquisition costs 2,056 - 17,652 18,663 c Change of deferred acquisition costs 169 - 299 13,970 - 11,453 - d Collecting commissions - - 190 1,983
10,557 - 5,044 - 1,944 - 1,369 - 292 102 26,216 21,387
7,640 5,986 32,514 31,708 Total 12,680 9,553 369,042 277,205
in thousand Euros
Investment management expenses Other administration costs
Non-life insurance Life insurance
Gross commissions costs and other commissions
Commissions and profit sharing from reinsurers
12 Appendix to Consolidated Financial Statement152

Details of reclassified financial assets and of effects on the income statement and comprehensive return
from to
Profit or loss in
other
components of
the
comprehensive
income
statement
Reclassified
assets up to
Year n
Reclassified
assets in Year
n
Reclassified
assets up to
Year n
Profit or loss in
the income
statement
Profit or loss in
the income
statement
Profit or loss in the
income statement
In absence of
reclassification
Total
Reclassified financial assets categories
Type of assets
Amount of
reclassified
assets in year n
as of
reclassification
date
Book value of reclassified
assets as of 31-12-(n)
Profit or loss in other components of
the comprehensive income
statement
In absence of reclassification
Fair value of reclassified assets
as of 31-12-(n)Reclassified assets in Year n
Profit or loss in other components of
the comprehensive income
statement
In absence of reclassification
Profit or loss in the
income statement
In absence of
reclassification
Reclassified assets up to Year n Reclassified assets in Year n Reclassified assets up to Year n
Reclassified
assets in Year
n
Profit or loss in
other
components of
the
comprehensive
income
statement
12 Appendix to Consolidated Financial Statement
153

Assets and liabilities at fair value on a recurring and non-recurring basis:distribution by fair value levels
31/12/2013 31/12/2012 31/12/2013 31/12/2012 31/12/2013 31/12/2012 31/12/2013 31/12/2012
57,814,489 33,671,555 1,133,964 13,097,726 211,402 1,155,601 59,159,855 47,924,881
Financial assets held for trading - - - - - - - -
Financial assets at fair value through profit or loss 9,769,431 89,373 714,390 9,966,418 - 25,938 10,483,821 10,081,729
- - - - - - - - - - - - - - - -
- - - - - - - -
67,583,921 33,760,927 1,848,353 23,064,144 211,402 1,181,539 69,643,676 58,006,610
Financial liabilities held for trading - - - - - - - -
Financial liabilities at fair value through profit or loss - - - - - - - -
- - - - - - - -
- - - - - - - -
- - - - - - - -
- - - - - - - -
in thousand Euros
Financial liabilities at fair value through
profit or loss
Total liabilities at fair value on a recurring basis
Assets and liabilities at fair value on a non-recurring basis
Non-current assets or disposal groups held for sale
Liabilities associated to a disposal group held for sale
Financial assets available for sale
Financial assets at fair value through
profit or loss
Property investmentsTangible assets
Total
Assets and liabilities at fair value on a recurring basis
Intangible assets
Total assets at fair value on a recurring basis
Level 1 Level 2 Level 3
12 Appendix to Consolidated Financial Statement154

Details of changes in level 3 assets and liabilities at fair value on a recurring basis
Financial assets held
for trading
Financial assets
designed as at fair
value through profit
or loss
Financial liabilities
held for trading
Financial liabilities
designed as at fair
value through profit
or loss
Initial existence 1,155,601 - 25,938 - - -
Acquisitions/Issues 152,303 - 41,576 - - -
Sales/buy backs 1,188,096 - - 82,865 - - - - Pay-backs - - - - - -
Profit or loss in the income statement 12,496 - - 15,351 - - -
- of which realized gains/losses - - 14,927 - - -
Profit or loss in components of other comprehensive income statement 104,090 - - - - -
Transfers in level 3 - - - - - -
Transfers to other levels - - - - - -
Other changes - - - - - -
Final existence 211,402 - 0 - - -
in thousand Euros
Financial liabilities at fair value through
profit or loss
Financial assets
available for sale
Financial assets at fair value through profit
or loss
Property investments Tangible assets Intangible assets
12 Appendix to Consolidated Financial Statement155

Assets and liabilities not at fair value: distribution by fair value levels
31/12/2013 31/12/2012 31/12/2013 31/12/2012 31/12/2013 31/12/2012 31/12/2013 31/12/2012 31/12/2013 31/12/2012
Assets - - - - - - - - - -
- - - - - - - - - -
Loans and receivables 11,458 102,146 - - - - 11,458 102,146 11,458 102,146
197,019 198,666 - - - - 197,019 198,666 197,019 198,666 - - - - - - - - - -
2,954 2,412 - - - - 2,954 2,412 2,954 2,412
211,431 303,224 - - - - 211,431 303,224 211,431 303,224
- - - - - - - - - -
544,179 544,294 - - - - 544,179 544,294 544,179 544,294 Other financial liabilities
Investments held to maturity
Interests in subsidiaries, associated companies and joint venturesProperty investments
Tangible assets
Total assets
Level 1 Level 2 Level 3 Total
in thousand Euros
Book valueFair value
156