Embed Size (px)
Citation preview
Postal Customer Satisfaction: A Primer of Four Surveys
RARC ReportReport Number RARC-WP-17-010
August 28, 2017
Cover
Executive Summary
A well-designed survey helps businesses understand customer needs and loyalties in ways that allow for rapid, customer-focused change. Consider a customer who returns to the same dealership every three years to lease a new car. After 20 years, her usual salesperson can almost predict the day she will arrive. But then, one year, she does not come. The salesperson leaves her messages, describing new cars on the lot. He sends hand-written notes attached to preferred customer mailings. Nothing. Surveys can take the guesswork out of customer satisfaction. Were the last lease negotiations a hassle? Was she satisfied with the service department? Would she recommend the car to a friend? If the dealership surveyed the customer immediately after her last lease, or at any interim service visit, it could have determined what aspect of the business-customer relationship was no longer working. It could have used her feedback to make changes or follow up on her complaints. Instead, she defected to a competitor. When properly constructed and correctly applied, surveys can be powerful customer retention tools.
The U.S. Postal Service, committed to excellent customer service, embarked on several initiatives to elevate the importance of customer experience in its daily operations. To understand its customers’ needs and loyalties, it conducts four major customer satisfaction surveys that feed the Customer Insights (CI) Index. The CI Index serves as a dashboard metric of customer experience, contributes to postal management’s pay-for-performance system, and is reported to Congress and the Postal Regulatory Commission.
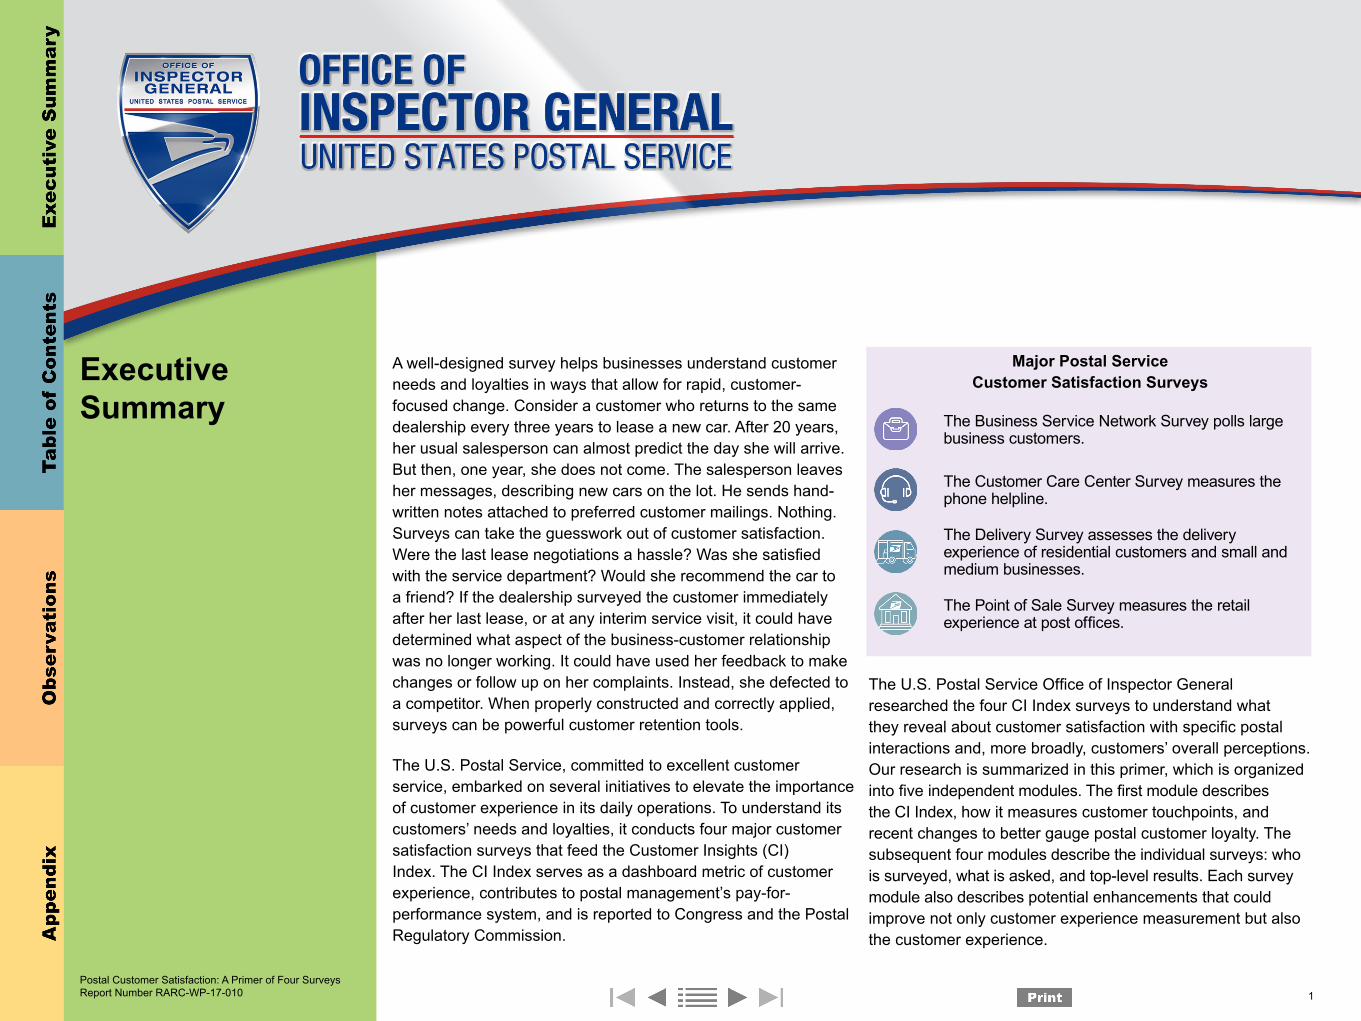
Major Postal Service Customer Satisfaction Surveys
The Business Service Network Survey polls large business customers.
The Customer Care Center Survey measures the phone helpline.
The Delivery Survey assesses the delivery experience of residential customers and small and medium businesses.
The Point of Sale Survey measures the retail experience at post offices.
The U.S. Postal Service Office of Inspector General researched the four CI Index surveys to understand what they reveal about customer satisfaction with specific postal interactions and, more broadly, customers’ overall perceptions. Our research is summarized in this primer, which is organized into five independent modules. The first module describes the CI Index, how it measures customer touchpoints, and recent changes to better gauge postal customer loyalty. The subsequent four modules describe the individual surveys: who is surveyed, what is asked, and top-level results. Each survey module also describes potential enhancements that could improve not only customer experience measurement but also the customer experience.
Postal Customer Satisfaction: A Primer of Four Surveys Report Number RARC-WP-17-010 1
Table of Contents
CoverExecutive Summary......................................................................................1Observations ................................................................................................3
Introduction ..............................................................................................3Positive Customer Experiences Can Drive Revenue ........................3The OIG’s Approach ...........................................................................4
Module 1: Customer Insights Index .........................................................5Description .........................................................................................5Discussion ..........................................................................................7
Module 2: Business Service Network ......................................................9Description .........................................................................................9Discussion ........................................................................................10
Module 3: Customer Care Center .........................................................11Description .......................................................................................11Discussion ........................................................................................12
Module 4: Delivery .................................................................................14Description .......................................................................................14Discussion ........................................................................................15
Module 5: Point of Sale .........................................................................18Description .......................................................................................18Discussion ........................................................................................19
Crosscutting Insights .............................................................................21Conclusion .............................................................................................22
Appendix: Management’s Comments ........................................................... 23Contact Information ....................................................................................25
Postal Customer Satisfaction: A Primer of Four Surveys Report Number RARC-WP-17-010 2
Observations IntroductionYou just mailed a care package to your son, a college freshman. While you were at the post office counter, you picked up a book of stamps and grabbed another Flat Rate Box for the next care package. After completing the transaction, the retail clerk hands you a receipt, circling a survey invitation on the bottom. Your line was short, the building was well stocked, and you have always received excellent service from this post office, so you decide to complete the survey. When the survey asks what the post office should do to improve your satisfaction, you write, “Nothing. The clerk, Tony, was great. Give him a raise!” Ever wonder what happens to your comments? Was Tony rewarded?
The survey you completed is one of four primary tools the U.S. Postal Service (USPS) uses to assess customer satisfaction across various touchpoints:
The Business Service Network (BSN) Survey polls large business customers.
The Customer Care Center (CCC) Survey measures the phone helpline.
The Delivery Survey assesses the delivery experience of residential customers and small and medium businesses (SMBs).
The Point of Sale (POS) Survey measures the retail experience at post offices.
Altogether, the surveys ask over 50 questions.1 Data is collected on satisfaction rating scales, in multiple-choice questions, and through open-ended responses, called “verbatims.” In fiscal year (FY) 2016, a single question from each survey was combined and weighted in a dashboard, called the Customer Insights (CI) Index.2
Positive Customer Experiences Can Drive Revenue
Customer service is an organizational priority for the Postal Service, both in its day-to-day operations and its future planning. To “provide excellent customer experiences” is one of four performance outcome goals outlined in its FY 2016 Annual Report to Congress.3 Delivering a world-class customer experience is also the first of four Future Ready goals laid out in the Postal Service’s Five-Year Strategic Plan.4 Besides highlighting customer experience in its corporate goals, the Postal Service has embarked on several initiatives to elevate the importance of customer experience in its daily operations.
The CI Index, rolled out in FY 2014, is part of this strategy. It gives postal management a multi-channel barometer of the customer’s experience with the agency and is tied into the organization’s pay-for-performance system: higher scores on the four CI Index surveys equal a higher bonus potential. The Postal Service also improved information dissemination through the rollout of a new tool to review and analyze survey results. Called the Customer Insights 2.0 Platform (CI Platform), this analytic tool enables analysts at all management levels to view survey results, including high-level CI Index scores, survey-specific details, and area- and district-level reporting.5 Another customer service initiative was the October 2016 appointment of a Chief Customer and Marketing Officer.
1 The exact number of questions is difficult to assess; multiple questions have sub parts, and some questions are only asked of specific customer segments.2 This changed in FY 2017; the Delivery Survey will now report a composite of four questions in its CI Index score. 3 Postal Service, United States Postal Service FY2016 Annual Report to Congress, December 29, 2016, https://about.usps.com/who-we-are/financials/annual-reports/
fy2016.pdf, p. 13.4 Postal Service, Future Ready: U.S. Postal Service® Five-Year Strategic Plan, September 30, 2016, http://about.usps.com/strategic-planning/five-year-strategic-
plan-2017-2021.pdf, p. 18.5 For the CCC Survey, only the CI Index question results are included on the CI Platform.
Postal Customer Satisfaction: A Primer of Four Surveys Report Number RARC-WP-17-010 3
Together, these initiatives underscore leadership’s commitment to understanding and improving the customer experience across the organization, and with good reason — experts agree that companies that deliver an outstanding customer experience, across all company touchpoints, earn higher revenues.6 For an example, see the case study to the right.7
Because the CI Index is critical in gauging customer perceptions of the Postal Service, the U.S. Postal Service Office of Inspector General (OIG) reviewed the four surveys used in the Index to assess the type of information collected and what the Postal Service does with the voluminous results. The OIG found that the survey responses contain valuable information about specific interactions customers have with the Postal Service and also about customers’ broader perceptions of the organization and their continuing loyalty. However, our research also uncovered potential enhancements and improvements.
The OIG’s Approach
The OIG conducted interviews with the relevant postal departments and customer analytics group to better understand each survey’s goals and how the data supports organizational objectives. The team also interviewed district and area marketing managers and consumer and industry contact managers to understand how survey results are used to improve service in the field. High-level data analysis was applied to the 1.7 million survey results across customer touchpoints for FY 2016. Lastly, the OIG reviewed how various organizations in the public and private sectors conduct satisfaction surveys.
This primer is divided into five modules. The first module describes the CI Index, its role in measuring customers’ satisfaction with specific interactions in the postal system, and new efforts to gather data on their broader perception of the Postal Service in general. The subsequent four modules focus on the individual surveys, describing who is surveyed, what is asked, and top-level results. While most results presented are from FY 2016, changes to the Index and each survey are noted for FY 2017. Following each survey’s one-page description, there is a discussion of opportunities that might enhance the agency’s ability to assess and act on customer sentiment. The Postal Service has a robust and evolving survey program, which clearly demonstrates its commitment to understanding its customers’ needs. With minor enhancements to the surveys and a renewed approach to conducting crosscutting survey analysis, the Postal Service could gain an even more nuanced and comprehensive perspective on the postal customer’s total experience.
6 Alex Rawson, Ewan Duncan, and Conor Jones, “The Truth About Customer Experience,” Harvard Business Review, September 2013, https://hbr.org/2013/09/the-truth-about-customer-experience and Harold Fanderl and Jesko Perrey, “Best of Both Worlds: Customer Experience for More Revenues and Lower Costs,” McKinsey & Company, April 2014, http://www.mckinsey.com/business-functions/marketing-and-sales/our-insights/best-of-both-worlds-customer-experience-for-more-revenues-and-lower-costs.
7 Sources for the case study include Chase Purdy, “Domino’s Stock Has Outperformed Google, Facebook, Apple, and Amazon This Decade,” Quartz, March 22, 2017, https://qz.com/938620/dominos-dpz-stock-has-outperformed-google-goog-facebook-fb-apple-aapl-and-amazon-amzn-this-decade/ and Paul Farhi, “Behind Domino’s mea culpa ad campaign,” Washington Post, January 13, 2010, http://www.washingtonpost.com/wp-dyn/content/article/2010/01/12/AR2010011201696.html.
Case StudyDomino’s Pizza Listening to Cutomers
In 2009, Domino’s stock was $8 a share. In 2017, it was $218. This growth outperformed Google, Facebook, and Amazon. What is the pizza chain’s secret? Domino’s listened to its customers and made changes in order to improve. The company recognized customer complaints about its poor-quality pizza in a mea culpa ad campaign in 2010, vowing to do better. As it adjusted its pizza recipe, menu offerings, and customer facing IT, it ran a simultaneous social media campaign to gather information about what customers thought of their new efforts — including both positive and negative reviews. For Domino’s, transparency, positive change, and embracing customer feedback paid off.
Postal Customer Satisfaction: A Primer of Four Surveys Report Number RARC-WP-17-010 4
Module 1: Customer Insights Index Description
Customer Insights (CI) Index
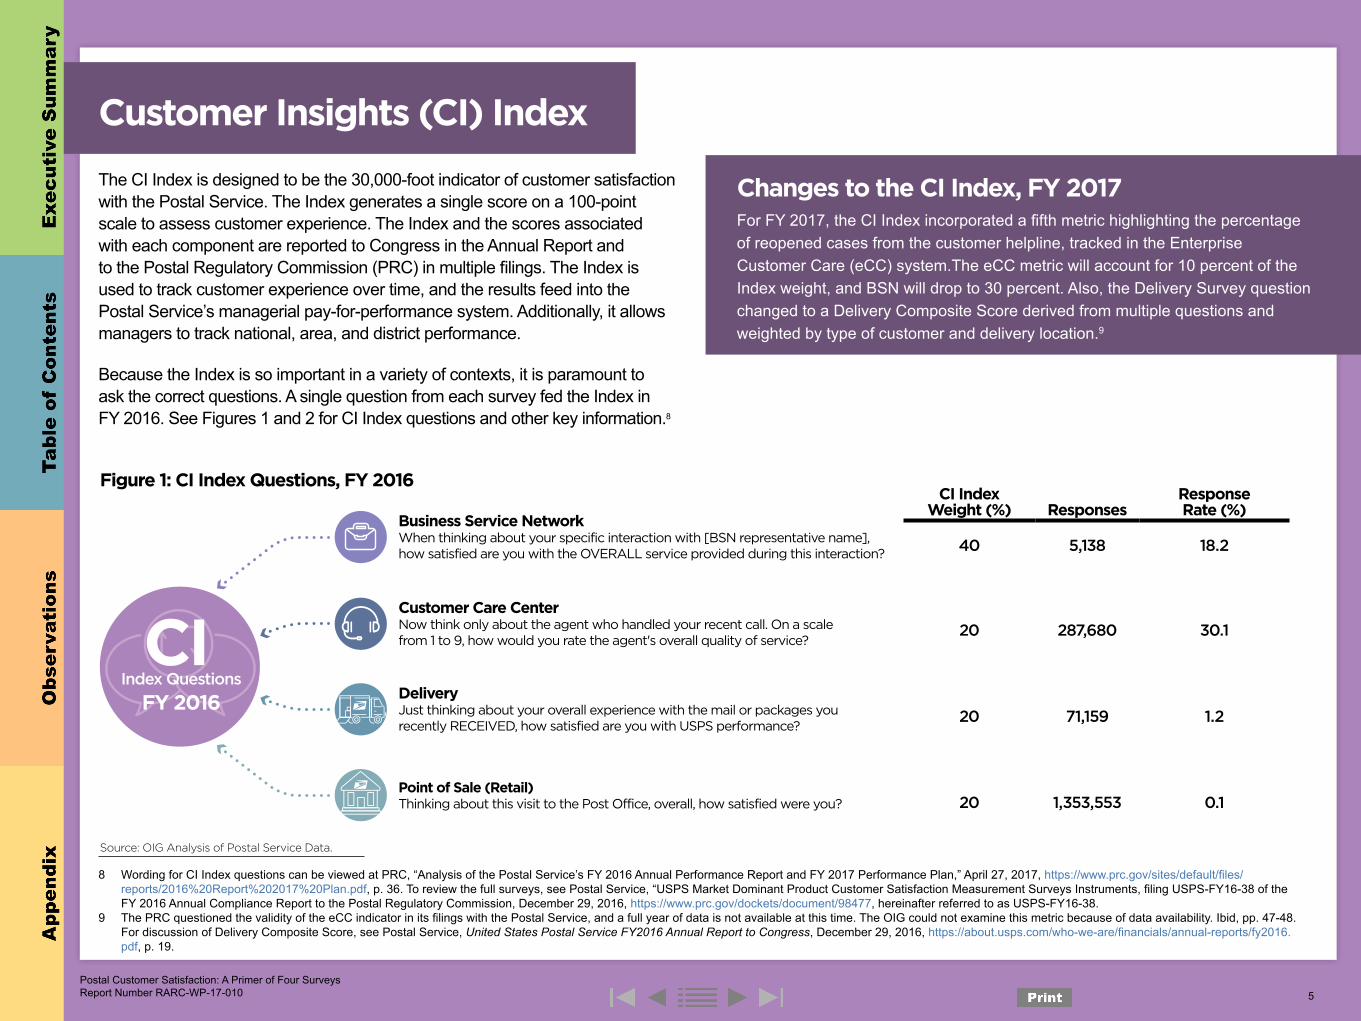
The CI Index is designed to be the 30,000-foot indicator of customer satisfaction with the Postal Service. The Index generates a single score on a 100-point scale to assess customer experience. The Index and the scores associated with each component are reported to Congress in the Annual Report and to the Postal Regulatory Commission (PRC) in multiple filings. The Index is used to track customer experience over time, and the results feed into the Postal Service’s managerial pay-for-performance system. Additionally, it allows managers to track national, area, and district performance.
Because the Index is so important in a variety of contexts, it is paramount to ask the correct questions. A single question from each survey fed the Index in FY 2016. See Figures 1 and 2 for CI Index questions and other key information.8
Changes to the CI Index, FY 2017For FY 2017, the CI Index incorporated a fifth metric highlighting the percentage of reopened cases from the customer helpline, tracked in the Enterprise Customer Care (eCC) system.The eCC metric will account for 10 percent of the Index weight, and BSN will drop to 30 percent. Also, the Delivery Survey question changed to a Delivery Composite Score derived from multiple questions and weighted by type of customer and delivery location.9
Figure 1: CI Index Questions, FY 2016
Customer Care CenterNow think only about the agent who handled your recent call. On a scalefrom 1 to 9, how would you rate the agent's overall quality of service?
Business Service NetworkWhen thinking about your specific interaction with [BSN representative name],how satisfied are you with the OVERALL service provided during this interaction?
DeliveryJust thinking about your overall experience with the mail or packages yourecently RECEIVED, how satisfied are you with USPS performance?
Point of Sale (Retail)Thinking about this visit to the Post Office, overall, how satisfied were you?
CI Index Questions
FY 2016
Source: OIG Analysis of Postal Service Data.
CI Index Weight (%) Responses
Response Rate (%)
40 5,138 18.2
20 287,680 30.1
20 71,159 1.2
20 1,353,553 0.1
8 Wording for CI Index questions can be viewed at PRC, “Analysis of the Postal Service’s FY 2016 Annual Performance Report and FY 2017 Performance Plan,” April 27, 2017, https://www.prc.gov/sites/default/files/reports/2016%20Report%202017%20Plan.pdf, p. 36. To review the full surveys, see Postal Service, “USPS Market Dominant Product Customer Satisfaction Measurement Surveys Instruments, filing USPS-FY16-38 of the FY 2016 Annual Compliance Report to the Postal Regulatory Commission, December 29, 2016, https://www.prc.gov/dockets/document/98477, hereinafter referred to as USPS-FY16-38.
9 The PRC questioned the validity of the eCC indicator in its filings with the Postal Service, and a full year of data is not available at this time. The OIG could not examine this metric because of data availability. Ibid, pp. 47-48. For discussion of Delivery Composite Score, see Postal Service, United States Postal Service FY2016 Annual Report to Congress, December 29, 2016, https://about.usps.com/who-we-are/financials/annual-reports/fy2016.pdf, p. 19.
Postal Customer Satisfaction: A Primer of Four Surveys Report Number RARC-WP-17-010 5
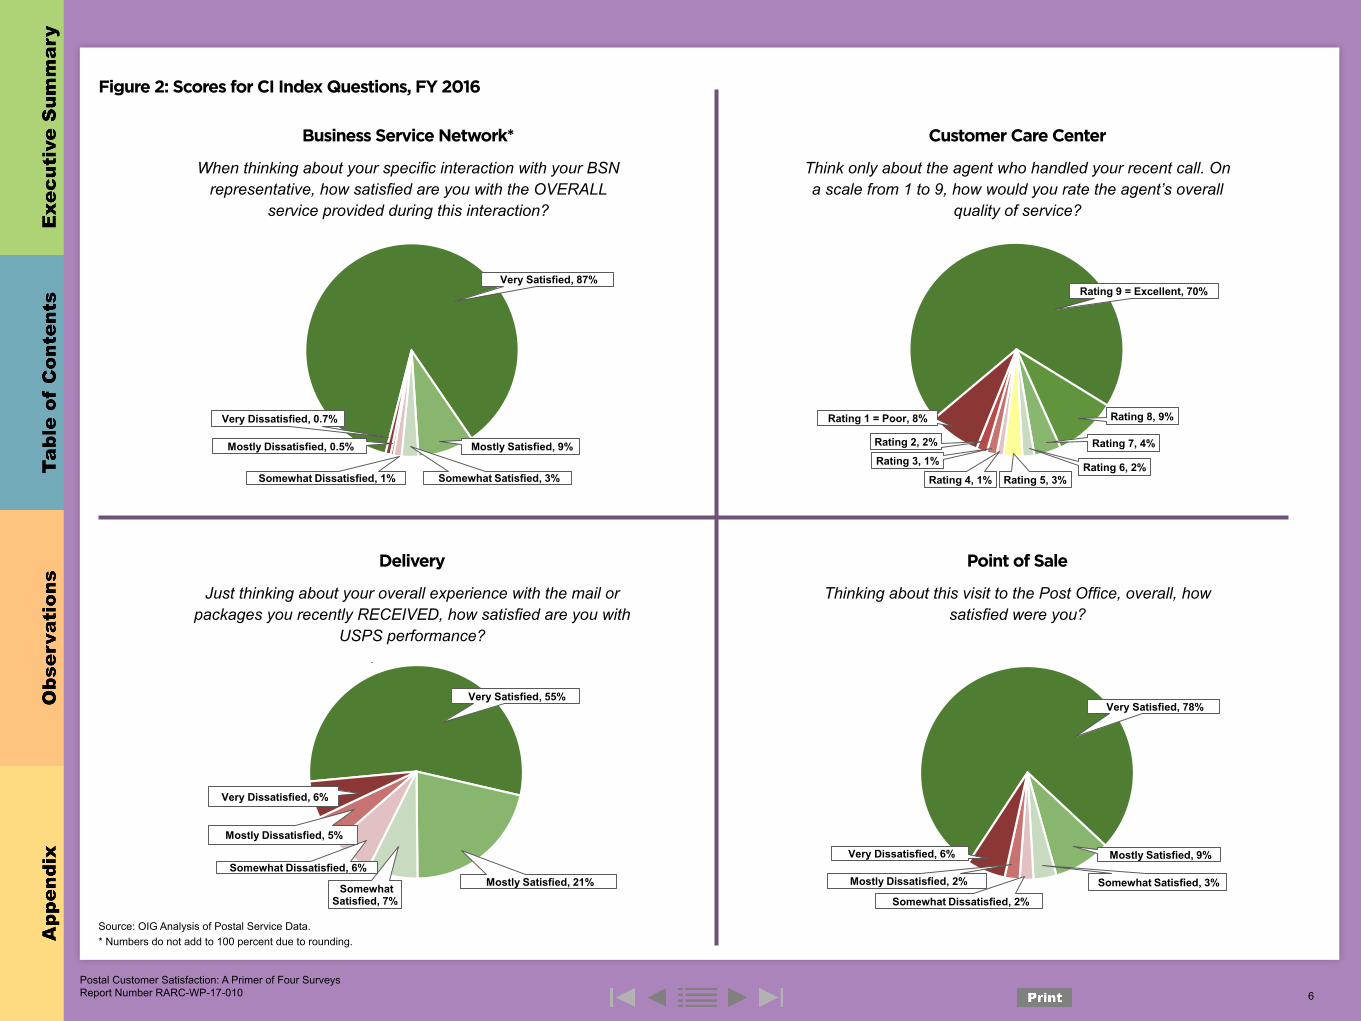
Figure 2: Scores for CI Index Questions, FY 2016
Business Service Network*
When thinking about your specific interaction with your BSN representative, how satisfied are you with the OVERALL
service provided during this interaction?
Figure 2: Scores for CI Index Questions, FY 2016
Source: OIG Analysis of Postal Service Data.
Business Service NetworkWhen thinking about your specific interaction with your BSN
representative, how satisfied are you with the OVERALL service provided during this interaction?
Customer Care CenterThink only about the agent who handled your recent call. On a scale from 1 to 9, how would you rate the agent's overall quality of service?
DeliveryJust thinking about your overall experience with the mail or packages
you recently RECEIVED, how satisfied are you with USPS performance?
Point of SaleThinking about this visit to the Post Office, overall, how satisfied were
you?
Very Satisfied, 87%
Mostly Satisfied, 9%
Somewhat Satisfied, 3%Somewhat Dissatisfied, 1%
Mostly Dissatisfied, 0.5%
Very Dissatisfied, 0.7%
Rating 9 = Excellent, 70%
Rating 8, 9%
Rating 7, 4%
Rating 6, 2%Rating 5, 3%Rating 4, 1%
Rating 3, 1%
Rating 2, 2%
Rating 1 = Poor, 8%
Very Satisfied, 55%
Mostly Satisfied, 21%Somewhat Satisfied, 7%
Somewhat Dissatisfied, 6%
Mostly Dissatisfied, 5%
Very Dissatisfied, 6%
Very Satisfied, 78%
Mostly Satisfied, 9%
Somewhat Satisfied, 3%
Somewhat Dissatisfied, 2%
Mostly Dissatisfied, 2%
Very Dissatisfied, 6%
5
Final Review
Delivery
Just thinking about your overall experience with the mail or packages you recently RECEIVED, how satisfied are you with
USPS performance?
Figure 2: Scores for CI Index Questions, FY 2016
Source: OIG Analysis of Postal Service Data.
Business Service NetworkWhen thinking about your specific interaction with your BSN
representative, how satisfied are you with the OVERALL service provided during this interaction?
Customer Care CenterThink only about the agent who handled your recent call. On a scale from 1 to 9, how would you rate the agent's overall quality of service?
DeliveryJust thinking about your overall experience with the mail or packages
you recently RECEIVED, how satisfied are you with USPS performance?
Point of SaleThinking about this visit to the Post Office, overall, how satisfied were
you?
Very Satisfied, 87%
Mostly Satisfied, 9%
Somewhat Satisfied, 3%Somewhat Dissatisfied, 1%
Mostly Dissatisfied, 0.5%
Very Dissatisfied, 0.7%
Rating 9 = Excellent, 70%
Rating 8, 9%
Rating 7, 4%
Rating 6, 2%Rating 5, 3%Rating 4, 1%
Rating 3, 1%
Rating 2, 2%
Rating 1 = Poor, 8%
Very Satisfied, 55%
Mostly Satisfied, 21%Somewhat Satisfied, 7%
Somewhat Dissatisfied, 6%
Mostly Dissatisfied, 5%
Very Dissatisfied, 6%
Very Satisfied, 78%
Mostly Satisfied, 9%
Somewhat Satisfied, 3%
Somewhat Dissatisfied, 2%
Mostly Dissatisfied, 2%
Very Dissatisfied, 6%
5
Final Review
Customer Care Center
Think only about the agent who handled your recent call. On a scale from 1 to 9, how would you rate the agent’s overall
quality of service?
Figure 2: Scores for CI Index Questions, FY 2016
Source: OIG Analysis of Postal Service Data.
Business Service NetworkWhen thinking about your specific interaction with your BSN
representative, how satisfied are you with the OVERALL service provided during this interaction?
Customer Care CenterThink only about the agent who handled your recent call. On a scale from 1 to 9, how would you rate the agent's overall quality of service?
DeliveryJust thinking about your overall experience with the mail or packages
you recently RECEIVED, how satisfied are you with USPS performance?
Point of SaleThinking about this visit to the Post Office, overall, how satisfied were
you?
Very Satisfied, 87%
Mostly Satisfied, 9%
Somewhat Satisfied, 3%Somewhat Dissatisfied, 1%
Mostly Dissatisfied, 0.5%
Very Dissatisfied, 0.7%
Rating 9 = Excellent, 70%
Rating 8, 9%
Rating 7, 4%
Rating 6, 2%Rating 5, 3%Rating 4, 1%
Rating 3, 1%
Rating 2, 2%
Rating 1 = Poor, 8%
Very Satisfied, 55%
Mostly Satisfied, 21%Somewhat Satisfied, 7%
Somewhat Dissatisfied, 6%
Mostly Dissatisfied, 5%
Very Dissatisfied, 6%
Very Satisfied, 78%
Mostly Satisfied, 9%
Somewhat Satisfied, 3%
Somewhat Dissatisfied, 2%
Mostly Dissatisfied, 2%
Very Dissatisfied, 6%
5
Final Review
Point of Sale
Thinking about this visit to the Post Office, overall, how satisfied were you?
Figure 2: Scores for CI Index Questions, FY 2016
Source: OIG Analysis of Postal Service Data.
Business Service NetworkWhen thinking about your specific interaction with your BSN
representative, how satisfied are you with the OVERALL service provided during this interaction?
Customer Care CenterThink only about the agent who handled your recent call. On a scale from 1 to 9, how would you rate the agent's overall quality of service?
DeliveryJust thinking about your overall experience with the mail or packages
you recently RECEIVED, how satisfied are you with USPS performance?
Point of SaleThinking about this visit to the Post Office, overall, how satisfied were
you?
Very Satisfied, 87%
Mostly Satisfied, 9%
Somewhat Satisfied, 3%Somewhat Dissatisfied, 1%
Mostly Dissatisfied, 0.5%
Very Dissatisfied, 0.7%
Rating 9 = Excellent, 70%
Rating 8, 9%
Rating 7, 4%
Rating 6, 2%Rating 5, 3%Rating 4, 1%
Rating 3, 1%
Rating 2, 2%
Rating 1 = Poor, 8%
Very Satisfied, 55%
Mostly Satisfied, 21%Somewhat Satisfied, 7%
Somewhat Dissatisfied, 6%
Mostly Dissatisfied, 5%
Very Dissatisfied, 6%
Very Satisfied, 78%
Mostly Satisfied, 9%
Somewhat Satisfied, 3%
Somewhat Dissatisfied, 2%
Mostly Dissatisfied, 2%
Very Dissatisfied, 6%
5
Final Review
Source: OIG Analysis of Postal Service Data.* Numbers do not add to 100 percent due to rounding.
Postal Customer Satisfaction: A Primer of Four Surveys Report Number RARC-WP-17-010 6
Discussion
The Postal Service asks more than 50 questions across the four surveys, but most of them are focused on measuring satisfaction with specific interactions customers have with the organization. For example, a question that measures satisfaction with a retail interaction is, “Thinking about this visit to the Post Office, overall, how satisfied were you?” However, research demonstrates the importance of measuring customer experience more broadly.10 Two customer experience measurements are widely used in the private sector to accomplish broader measurement: the Customer Effort Score (CES) and the Net Promoter Score (NPS). Before going into the specifics of each CI Index survey, an explanation about the Postal Service’s approach to capturing overall customer sentiment through its surveys is warranted.
CES is a retention or loyalty indicator that measures how easy it is to conduct a transaction. The theory is that customers who easily accomplish their tasks are less likely to defect to another service provider.11 The question measures the amount of effort put forth to complete a transaction. This has applicability across postal touchpoints, such as mailing packages, purchasing stamps, or resolving delivery issues. Beginning in December 2016, the CCC Survey included the CES question asking respondents to rate their issue-resolution effort on a scale of 1 (very low) to 5 (very high).12 If added to other CI Index surveys, this question could help the organization understand how customers perceive the ease of navigating the postal system and compare its results to the scores of other, similar companies. For example, how easy is it for customers to complete a retail transaction compared to other retailers?
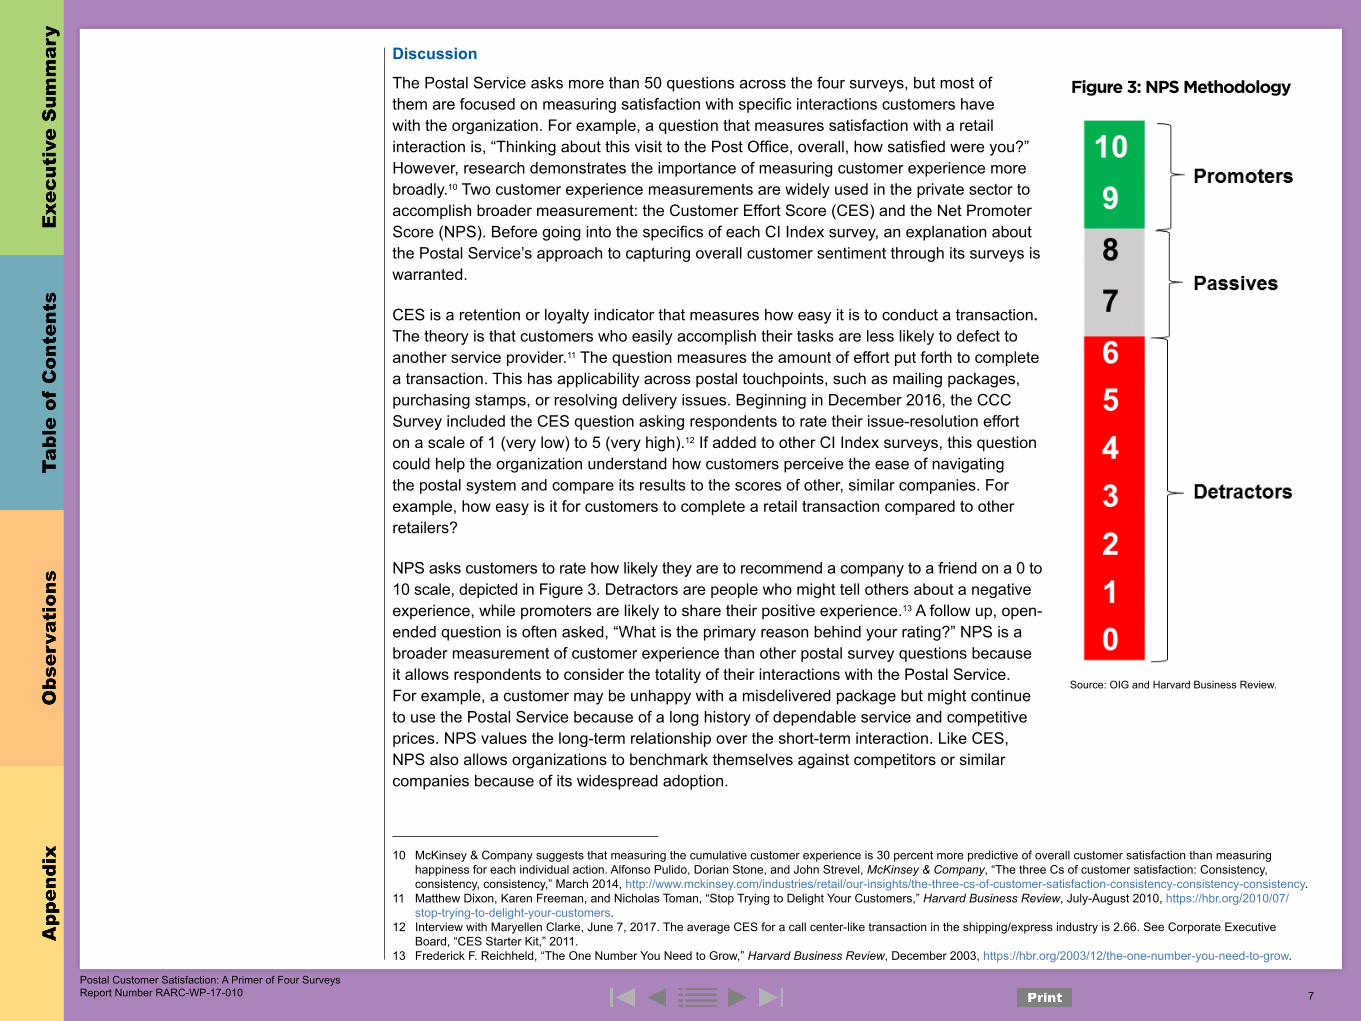
NPS asks customers to rate how likely they are to recommend a company to a friend on a 0 to 10 scale, depicted in Figure 3. Detractors are people who might tell others about a negative experience, while promoters are likely to share their positive experience.13 A follow up, open-ended question is often asked, “What is the primary reason behind your rating?” NPS is a broader measurement of customer experience than other postal survey questions because it allows respondents to consider the totality of their interactions with the Postal Service. For example, a customer may be unhappy with a misdelivered package but might continue to use the Postal Service because of a long history of dependable service and competitive prices. NPS values the long-term relationship over the short-term interaction. Like CES, NPS also allows organizations to benchmark themselves against competitors or similar companies because of its widespread adoption.
10 McKinsey & Company suggests that measuring the cumulative customer experience is 30 percent more predictive of overall customer satisfaction than measuring happiness for each individual action. Alfonso Pulido, Dorian Stone, and John Strevel, McKinsey & Company, “The three Cs of customer satisfaction: Consistency, consistency, consistency,” March 2014, http://www.mckinsey.com/industries/retail/our-insights/the-three-cs-of-customer-satisfaction-consistency-consistency-consistency.
11 Matthew Dixon, Karen Freeman, and Nicholas Toman, “Stop Trying to Delight Your Customers,” Harvard Business Review, July-August 2010, https://hbr.org/2010/07/stop-trying-to-delight-your-customers.
12 Interview with Maryellen Clarke, June 7, 2017. The average CES for a call center-like transaction in the shipping/express industry is 2.66. See Corporate Executive Board, “CES Starter Kit,” 2011.
13 Frederick F. Reichheld, “The One Number You Need to Grow,” Harvard Business Review, December 2003, https://hbr.org/2003/12/the-one-number-you-need-to-grow.
Figure 3: NPS Methodology
Source: OIG and Harvard Business Review.
Postal Customer Satisfaction: A Primer of Four Surveys Report Number RARC-WP-17-010 7
In April 2017, the Postal Service added the NPS question to all four surveys, asking respondents how likely they are to recommend USPS to someone else. It also added the NPS verbatim question on all the surveys. However, the Postal Service’s implementation is imperfect because the CCC Survey asks the question on a 1 to 9 scale, rather than the standard 0 to 10 scale the other surveys use.14 This makes precise CCC comparison against the other postal surveys or industry surveys impossible. As part of its FY 2018 pay-for-performance planning process, the Postal Service is assessing whether to continue collecting NPS data.15 Retaining the NPS question, even if the scores are low, provides another critical lens through which the Postal Service can view the overall customer experience and benchmark against NPS scores of companies it wants to emulate.
The addition of the CES question to the CCC Survey and the NPS question to all surveys will give the Postal Service a multi-faceted perspective on the customer experience. Data from these questions could help the Postal Service gauge customer loyalty broadly, complementing insights from satisfaction-rating questions that provide information on specific touchpoints.
14 Often, Interactive Voice Response (IVR) surveys avoid using 10 as a rating option to avoid keypad confusion, but this makes CCC Survey results different from the results of the other CI Index surveys, which all use the typical 0 to 10 scale. This prevents precise comparability and benchmarking.
15 Interview with Dan Barrett, Director, Customer and Market Insights, June 16, 2017.
The Postal Service
can benchmark its
performance against
competitors by continuing
to track NPS and CES.
Postal Customer Satisfaction: A Primer of Four Surveys Report Number RARC-WP-17-010 8
Module 2: Business Service Network Description
Business Service Network (BSN)
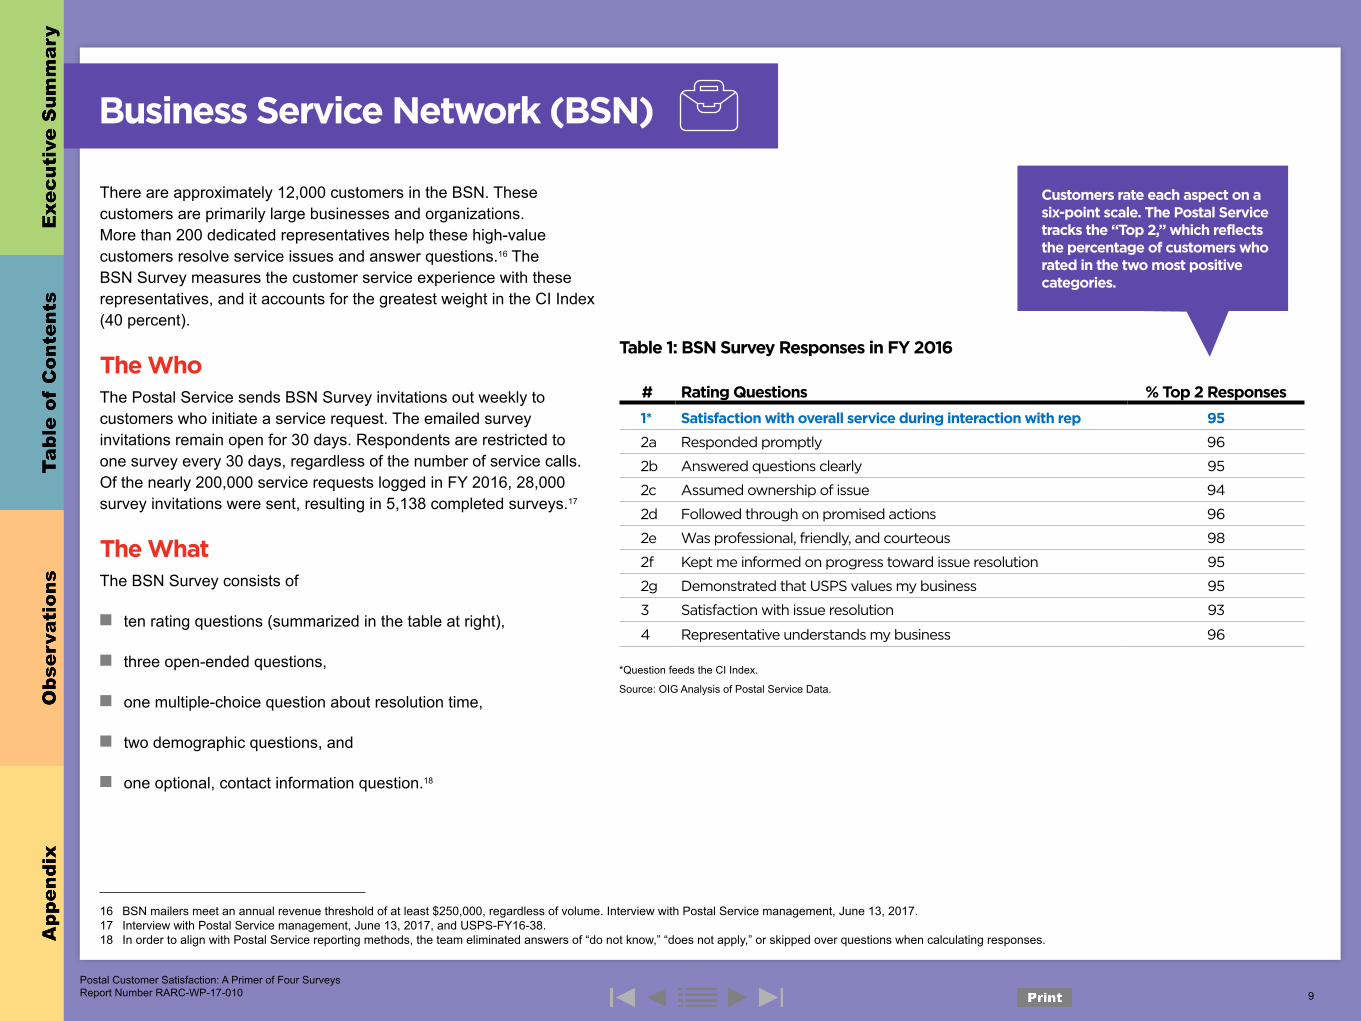
There are approximately 12,000 customers in the BSN. These customers are primarily large businesses and organizations. More than 200 dedicated representatives help these high-value customers resolve service issues and answer questions.16 The BSN Survey measures the customer service experience with these representatives, and it accounts for the greatest weight in the CI Index (40 percent).
The WhoThe Postal Service sends BSN Survey invitations out weekly to customers who initiate a service request. The emailed survey invitations remain open for 30 days. Respondents are restricted to one survey every 30 days, regardless of the number of service calls. Of the nearly 200,000 service requests logged in FY 2016, 28,000 survey invitations were sent, resulting in 5,138 completed surveys.17
The WhatThe BSN Survey consists of
■ ten rating questions (summarized in the table at right),
■ three open-ended questions,
■ one multiple-choice question about resolution time,
■ two demographic questions, and
■ one optional, contact information question.18
Table 1: BSN Survey Responses in FY 2016
# Rating Questions % Top 2 Responses
1* Satisfaction with overall service during interaction with rep 95
2a Responded promptly 96
2b Answered questions clearly 95
2c Assumed ownership of issue 94
2d Followed through on promised actions 96
2e Was professional, friendly, and courteous 98
2f Kept me informed on progress toward issue resolution 95
2g Demonstrated that USPS values my business 95
3 Satisfaction with issue resolution 93
4 Representative understands my business 96
*Question feeds the CI Index.
Source: OIG Analysis of Postal Service Data.
Customers rate each aspect on a six-point scale. The Postal Service tracks the “Top 2,” which reflects the percentage of customers who rated in the two most positive categories.
Postal Customer Satisfaction: A Primer of Four Surveys Report Number RARC-WP-17-010 9
16 BSN mailers meet an annual revenue threshold of at least $250,000, regardless of volume. Interview with Postal Service management, June 13, 2017.17 Interview with Postal Service management, June 13, 2017, and USPS-FY16-38.18 In order to align with Postal Service reporting methods, the team eliminated answers of “do not know,” “does not apply,” or skipped over questions when calculating responses.
Discussion
Given the importance of BSN customers to the Postal Service’s bottom line and the imperative to quickly resolve problems with these valuable customers, it is not surprising that this survey includes useful features that could be replicated in other surveys. For example, it has an opt-in contact question, allowing customers to request follow up, and uses “hot alerts” to notify management if customers leave negative ratings. These tools allow managers to quickly act on feedback and correct a problem before it is perpetuated. The OIG identified two opportunities for the Postal Service to strengthen this survey.
Survey Customers Immediately
BSN Survey invitations are currently sent out in weekly batches. This gives the Postal Service time to review the invitations to make sure a person is not surveyed more than once per month. However, a delayed survey invitation can limit the usefulness of feedback. In fact, 6 percent of respondents could not recall their BSN interaction by the time they started the survey.19 Survey vendors recommend sending a more immediate invitation, usually within a few hours of service: data quality is better when the interaction is fresh in the customer’s mind.20
Streamline Verbatim Questions
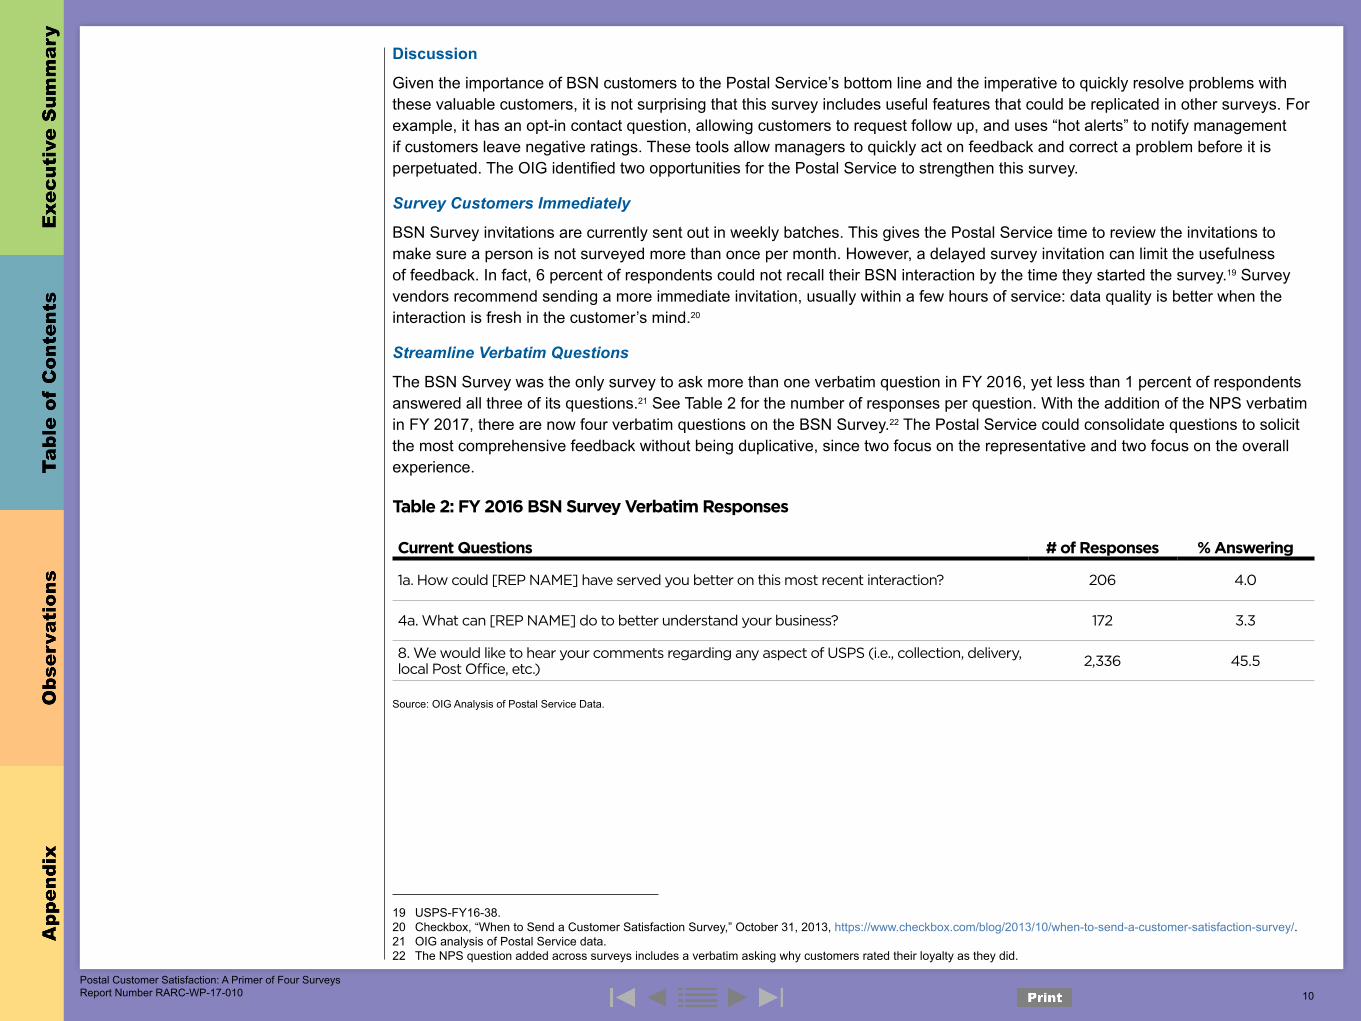
The BSN Survey was the only survey to ask more than one verbatim question in FY 2016, yet less than 1 percent of respondents answered all three of its questions.21 See Table 2 for the number of responses per question. With the addition of the NPS verbatim in FY 2017, there are now four verbatim questions on the BSN Survey.22 The Postal Service could consolidate questions to solicit the most comprehensive feedback without being duplicative, since two focus on the representative and two focus on the overall experience.
Table 2: FY 2016 BSN Survey Verbatim Responses
Current Questions # of Responses % Answering
1a. How could [REP NAME] have served you better on this most recent interaction? 206 4.0
4a. What can [REP NAME] do to better understand your business? 172 3.3
8. We would like to hear your comments regarding any aspect of USPS (i.e., collection, delivery, local Post Office, etc.)
2,336 45.5
Source: OIG Analysis of Postal Service Data.
19 USPS-FY16-38.20 Checkbox, “When to Send a Customer Satisfaction Survey,” October 31, 2013, https://www.checkbox.com/blog/2013/10/when-to-send-a-customer-satisfaction-survey/.21 OIG analysis of Postal Service data.22 The NPS question added across surveys includes a verbatim asking why customers rated their loyalty as they did.
Figure 4: Changes in CI Index Delivery Metric
Postal Customer Satisfaction: A Primer of Four Surveys Report Number RARC-WP-17-010 10
Module 3: Customer Care Center Description
Customer Care Center (CCC)
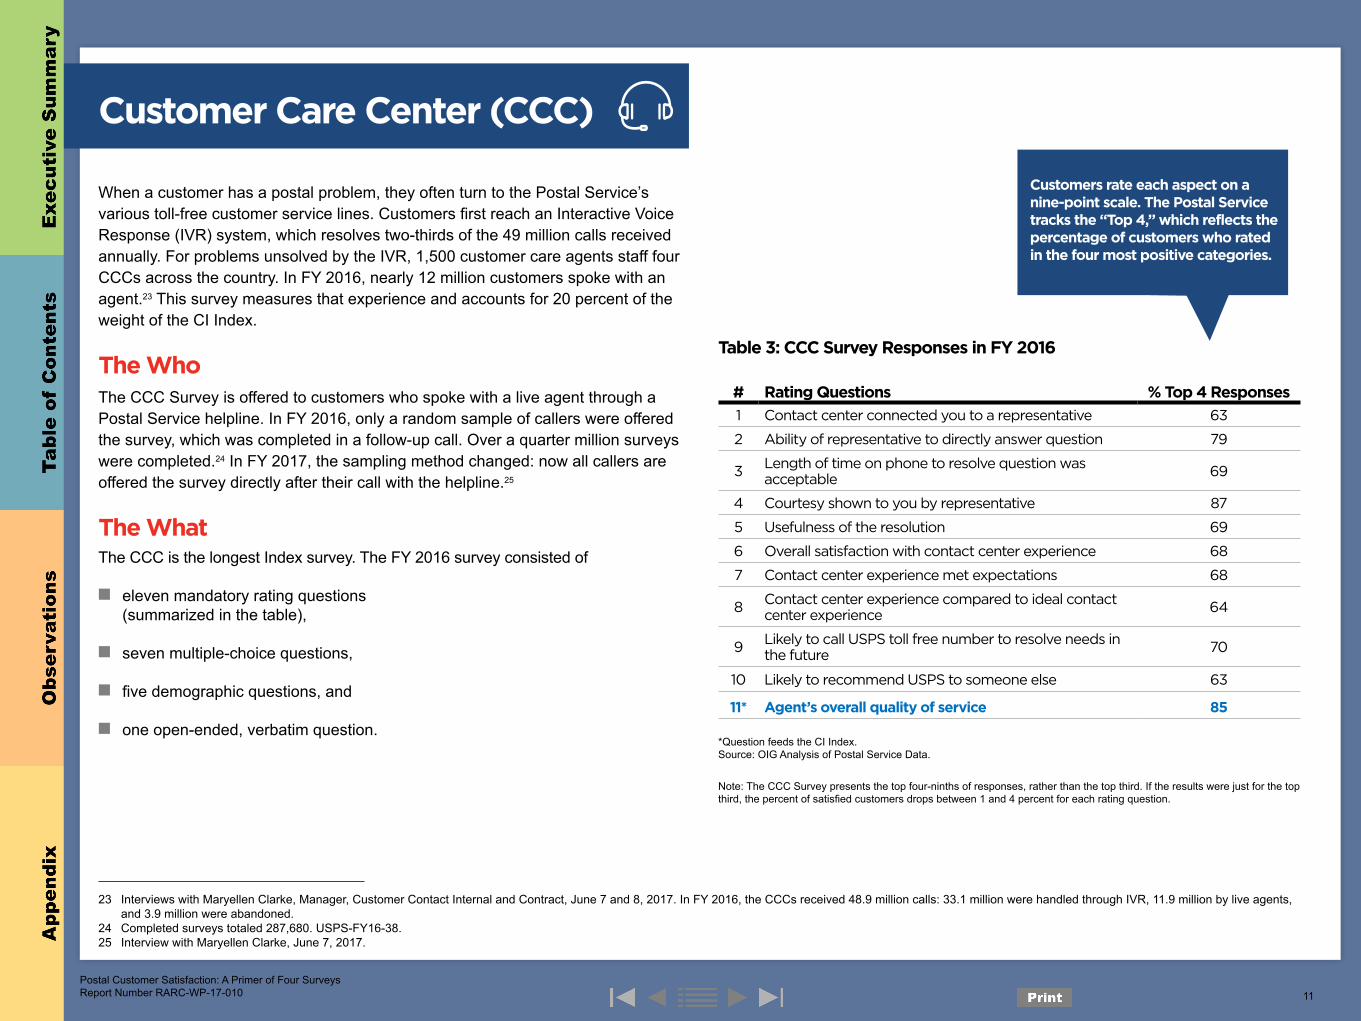
When a customer has a postal problem, they often turn to the Postal Service’s various toll-free customer service lines. Customers first reach an Interactive Voice Response (IVR) system, which resolves two-thirds of the 49 million calls received annually. For problems unsolved by the IVR, 1,500 customer care agents staff four CCCs across the country. In FY 2016, nearly 12 million customers spoke with an agent.23 This survey measures that experience and accounts for 20 percent of the weight of the CI Index.
The WhoThe CCC Survey is offered to customers who spoke with a live agent through a Postal Service helpline. In FY 2016, only a random sample of callers were offered the survey, which was completed in a follow-up call. Over a quarter million surveys were completed.24 In FY 2017, the sampling method changed: now all callers are offered the survey directly after their call with the helpline.25
The WhatThe CCC is the longest Index survey. The FY 2016 survey consisted of
■ eleven mandatory rating questions (summarized in the table),
■ seven multiple-choice questions,
■ five demographic questions, and
■ one open-ended, verbatim question.
Table 3: CCC Survey Responses in FY 2016
# Rating Questions % Top 4 Responses
1 Contact center connected you to a representative 63
2 Ability of representative to directly answer question 79
3Length of time on phone to resolve question was acceptable
69
4 Courtesy shown to you by representative 87
5 Usefulness of the resolution 69
6 Overall satisfaction with contact center experience 68
7 Contact center experience met expectations 68
8Contact center experience compared to ideal contact center experience
64
9Likely to call USPS toll free number to resolve needs in the future
70
10 Likely to recommend USPS to someone else 63
11* Agent’s overall quality of service 85
*Question feeds the CI Index.Source: OIG Analysis of Postal Service Data.
Note: The CCC Survey presents the top four-ninths of responses, rather than the top third. If the results were just for the top third, the percent of satisfied customers drops between 1 and 4 percent for each rating question.
Customers rate each aspect on a nine-point scale. The Postal Service tracks the “Top 4,” which reflects the percentage of customers who rated in the four most positive categories.
Postal Customer Satisfaction: A Primer of Four Surveys Report Number RARC-WP-17-010 11
23 Interviews with Maryellen Clarke, Manager, Customer Contact Internal and Contract, June 7 and 8, 2017. In FY 2016, the CCCs received 48.9 million calls: 33.1 million were handled through IVR, 11.9 million by live agents, and 3.9 million were abandoned.
24 Completed surveys totaled 287,680. USPS-FY16-38.25 Interview with Maryellen Clarke, June 7, 2017.
Discussion
The OIG observed that the CCC Survey, of the four CI Index surveys, is managed quite independently. The Customer Engagement and Strategic Alignment group at postal headquarters manages the BSN, Delivery, and POS Surveys, but it does not manage CCC. One reason could be that the contractor running the CCC Survey, ForeSee, is different from the contractor running the other three surveys, Maritz. Another reason could be that, unlike the other surveys that factor into bonuses for field management, the scores from the CCC Survey only factor into bonuses at the national level because care center operations are managed by headquarters and not at the area or district level. The CCC management team has a good handle on the analysis of survey data to improve care center operations, but the broader postal management structure loses the opportunity to see the interconnections between this touchpoint and others. The first enhancement below tries to address this issue by making the raw data available. Other enhancements would improve the response time to negative feedback, allow customer segment analysis, and reduce the possibility of conflicting interpretation of CCC Survey responses.
Provide Postal Analysts Access to Raw Data
ForeSee provides care center management with weekly, monthly, and quarterly analysis. This reporting highlights key metrics, trends, call volume, and a detailed analysis of satisfaction by type of complaint, time of day, and day of week. The data summaries help the Senior Vice President for Sales and Customer Relations decide how to allocate resources and improve training. However, the raw data from the CCC Survey is not available on the CI Platform, so other postal departments cannot scan CCC verbatims for crosscutting problems. For example, a customer might call with a complaint about wait time in line at a post office; the survey indicates that the agent who handled the complaint was excellent, but in the verbatim comment, the customer says she wishes more people were working at her post office on Saturday mornings. Because the information is stovepiped, the Retail component will not learn of the comment, nor will it be able to act on it. The absence of raw data hampers holistic customer satisfaction analysis across the organization.
Use Hot Alerts
Industry best practices require near real-time alerts when customers are unhappy.26 The CCC Survey could institute a system where a negative response to questions about the live agent (questions 2, 4, and 11) could immediately ping care center management, allowing immediate follow-up with the CCC agent and customer.
Use a Consistent Satisfaction Indicator
The CI Index should funnel scores from the most indicative question from each touchpoint survey into a dashboard for postal leadership to assess customer satisfaction. However, the CI Index uses a different question to assess customer satisfaction than the ones used by the team overseeing the care centers. The CI Index, used by the Postal Service’s executive leadership team, focuses on the customer’s rating of the agent’s quality of service (Q11 in Table 3).27 The Senior Vice President for Sales and Customer Relations appraises the effectiveness of care center staff using a composite of three questions: overall satisfaction with contact center (Q6), contact center met expectations (Q7), and contact center experience compared to ideal experience (Q8).28
26 CFI Group, “Top 10 Customer Satisfaction Survey Best Practices,” https://cdncom.cfigroup.com/wp-content/uploads/CFI-Top-survey-best-practices.pdf. CCC Survey results are available the next day with an additional day’s lag for transcription of narrative comments.
27 The CCC group explained the Executive Leadership Team decided which question to use for the CI Index, which differed from the questions the group uses to measure success. Interview with Maryellen Clarke, May 22, 2017.
28 Interview with Kristen Holtz, Postal Service Account Representative from ForeSee, May 22, 2017.
Postal Customer Satisfaction: A Primer of Four Surveys Report Number RARC-WP-17-010 12
The measurement used can lead to different assumptions about the customer experience. The percentage of customers rating live agents positively was nearly 20 points higher than the percentage of customers rating their contact center experience positively in FY 2016.29 Using different metrics to track the success of the CCC can give confusing signals. If customers continue to give their agents high scores — and this score factors into bonus calculations and informs the PRC and Congress about customer satisfaction — the Postal Service might overlook care center problems outside the agent’s control. For example, verbatim comments indicate that customers are happy with the agent who helped them but are disappointed with the amount of time they waited on hold before reaching the representative. Focusing only on agent satisfaction might obscure opportunities to improve the overall care center experience, like hiring more agents to reduce call wait time or changing work schedules to accommodate call volumes. While different measurement structures can make sense for different objectives, a nearly 20-point disparity indicates a disconnect between the component and corporate goals that warrants further consideration.
29 USPS-FY16-38.
The percent of customers
rating agents positively
was nearly 20 points
higher than those rating
their contact center
experience positively.
Postal Customer Satisfaction: A Primer of Four Surveys Report Number RARC-WP-17-010 13
Module 4: Delivery Description
Delivery
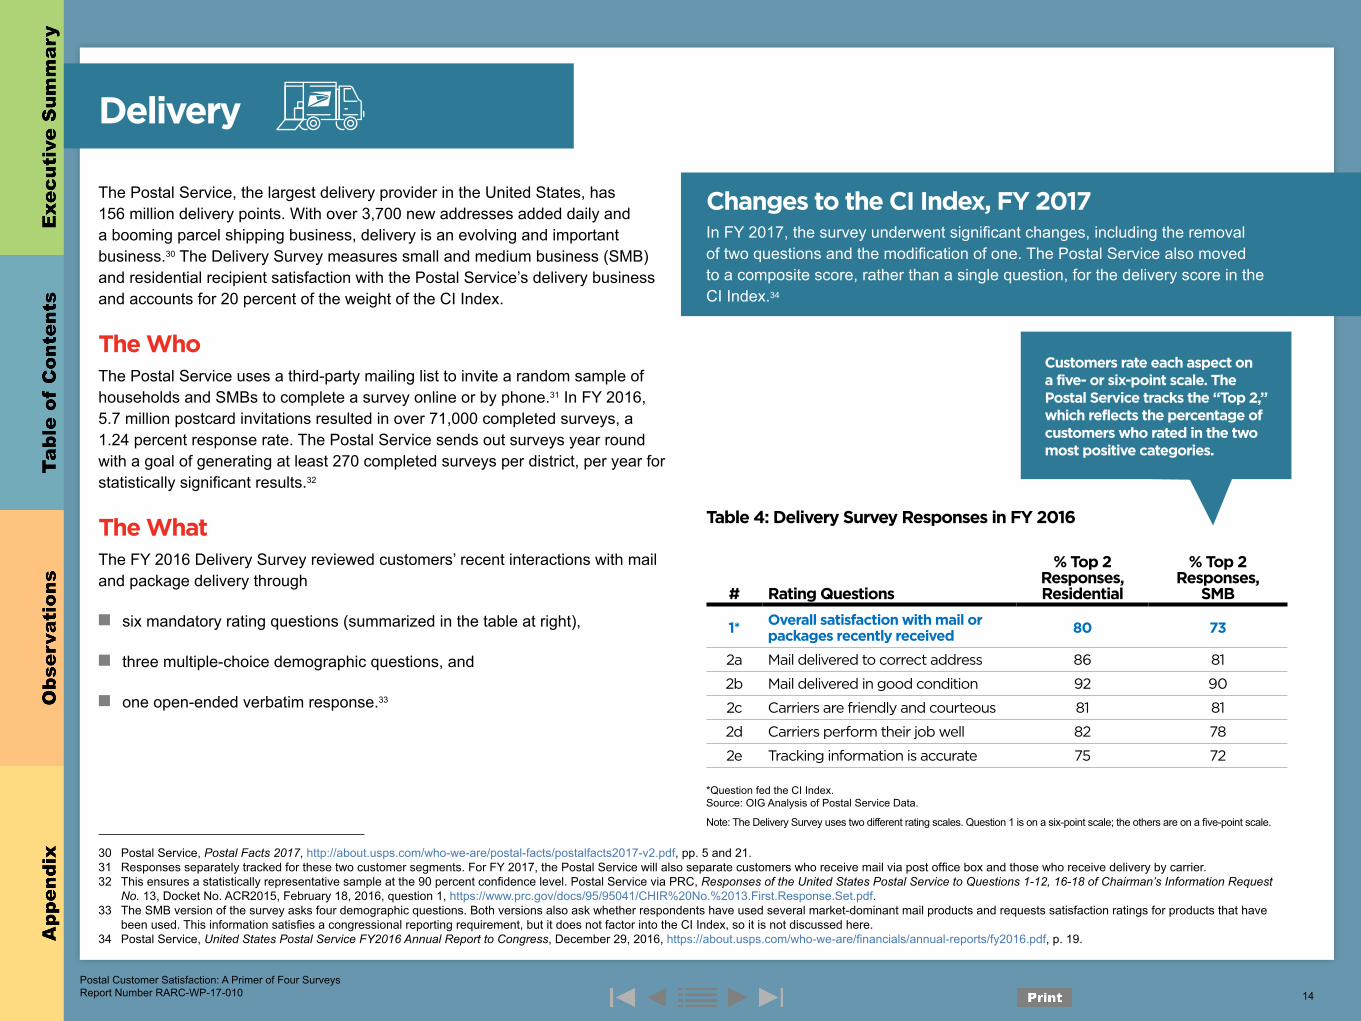
The Postal Service, the largest delivery provider in the United States, has 156 million delivery points. With over 3,700 new addresses added daily and a booming parcel shipping business, delivery is an evolving and important business.30 The Delivery Survey measures small and medium business (SMB) and residential recipient satisfaction with the Postal Service’s delivery business and accounts for 20 percent of the weight of the CI Index.
The WhoThe Postal Service uses a third-party mailing list to invite a random sample of households and SMBs to complete a survey online or by phone.31 In FY 2016, 5.7 million postcard invitations resulted in over 71,000 completed surveys, a 1.24 percent response rate. The Postal Service sends out surveys year round with a goal of generating at least 270 completed surveys per district, per year for statistically significant results.32
The WhatThe FY 2016 Delivery Survey reviewed customers’ recent interactions with mail and package delivery through
■ six mandatory rating questions (summarized in the table at right),
■ three multiple-choice demographic questions, and
■ one open-ended verbatim response.33
Changes to the CI Index, FY 2017In FY 2017, the survey underwent significant changes, including the removal of two questions and the modification of one. The Postal Service also moved to a composite score, rather than a single question, for the delivery score in the CI Index.34
Table 4: Delivery Survey Responses in FY 2016
# Rating Questions
% Top 2 Responses, Residential
% Top 2 Responses,
SMB
1* Overall satisfaction with mail or packages recently received 80 73
2a Mail delivered to correct address 86 81
2b Mail delivered in good condition 92 90
2c Carriers are friendly and courteous 81 81
2d Carriers perform their job well 82 78
2e Tracking information is accurate 75 72
*Question fed the CI Index.Source: OIG Analysis of Postal Service Data.
Note: The Delivery Survey uses two different rating scales. Question 1 is on a six-point scale; the others are on a five-point scale.
Customers rate each aspect on a five- or six-point scale. The Postal Service tracks the “Top 2,” which reflects the percentage of customers who rated in the two most positive categories.
Postal Customer Satisfaction: A Primer of Four Surveys Report Number RARC-WP-17-010 14
30 Postal Service, Postal Facts 2017, http://about.usps.com/who-we-are/postal-facts/postalfacts2017-v2.pdf, pp. 5 and 21.31 Responses separately tracked for these two customer segments. For FY 2017, the Postal Service will also separate customers who receive mail via post office box and those who receive delivery by carrier.32 This ensures a statistically representative sample at the 90 percent confidence level. Postal Service via PRC, Responses of the United States Postal Service to Questions 1-12, 16-18 of Chairman’s Information Request
No. 13, Docket No. ACR2015, February 18, 2016, question 1, https://www.prc.gov/docs/95/95041/CHIR%20No.%2013.First.Response.Set.pdf.33 The SMB version of the survey asks four demographic questions. Both versions also ask whether respondents have used several market-dominant mail products and requests satisfaction ratings for products that have
been used. This information satisfies a congressional reporting requirement, but it does not factor into the CI Index, so it is not discussed here.34 Postal Service, United States Postal Service FY2016 Annual Report to Congress, December 29, 2016, https://about.usps.com/who-we-are/financials/annual-reports/fy2016.pdf, p. 19.
Discussion
Scores on the Delivery Survey have dropped each of the last two years, but modifications to the survey instrument mean the Postal Service will not be able to see if recent delivery customer-facing initiatives have improved customer satisfaction.35 In addition, the survey invitation does not generate enough responses to be useful at the district or unit level. The enhancements below are designed to help the Postal Service gather more feedback, track service over time, and create more tools to help local post offices fix delivery problems.
Change the Survey Invitation to Increase Response Rates
During FY 2016, the Postal Service tested two new types of Delivery Survey invitations to see if they generated more responses. An oversized postcard did not, but a sealed envelope with an invitation on letterhead dramatically increased response rates from 1.2 percent to approximately 7 percent. According to the Postal Service, the sealed envelope would cost about $500,000 more to send each year.36 The PRC recommended that, “the Postal Service take steps to meet its internal goal to ensure the Delivery Survey results are statistically valid and accurate reflections of customer experience at the district level.”37 Interviews with area and district marketing managers revealed that the insufficiency of unit-level responses made the information somewhat unusable. Their concern was that they were not getting adequate insight into local issues to make changes. For example, one district marketing manager noted that one of her cities only received eight completed Delivery Surveys but more than 1,000 customer complaint inquiries last year.38 If the Postal Service is concerned about the additional cost associated with a new format, it could sample more in the regions that have the most room for improvement.
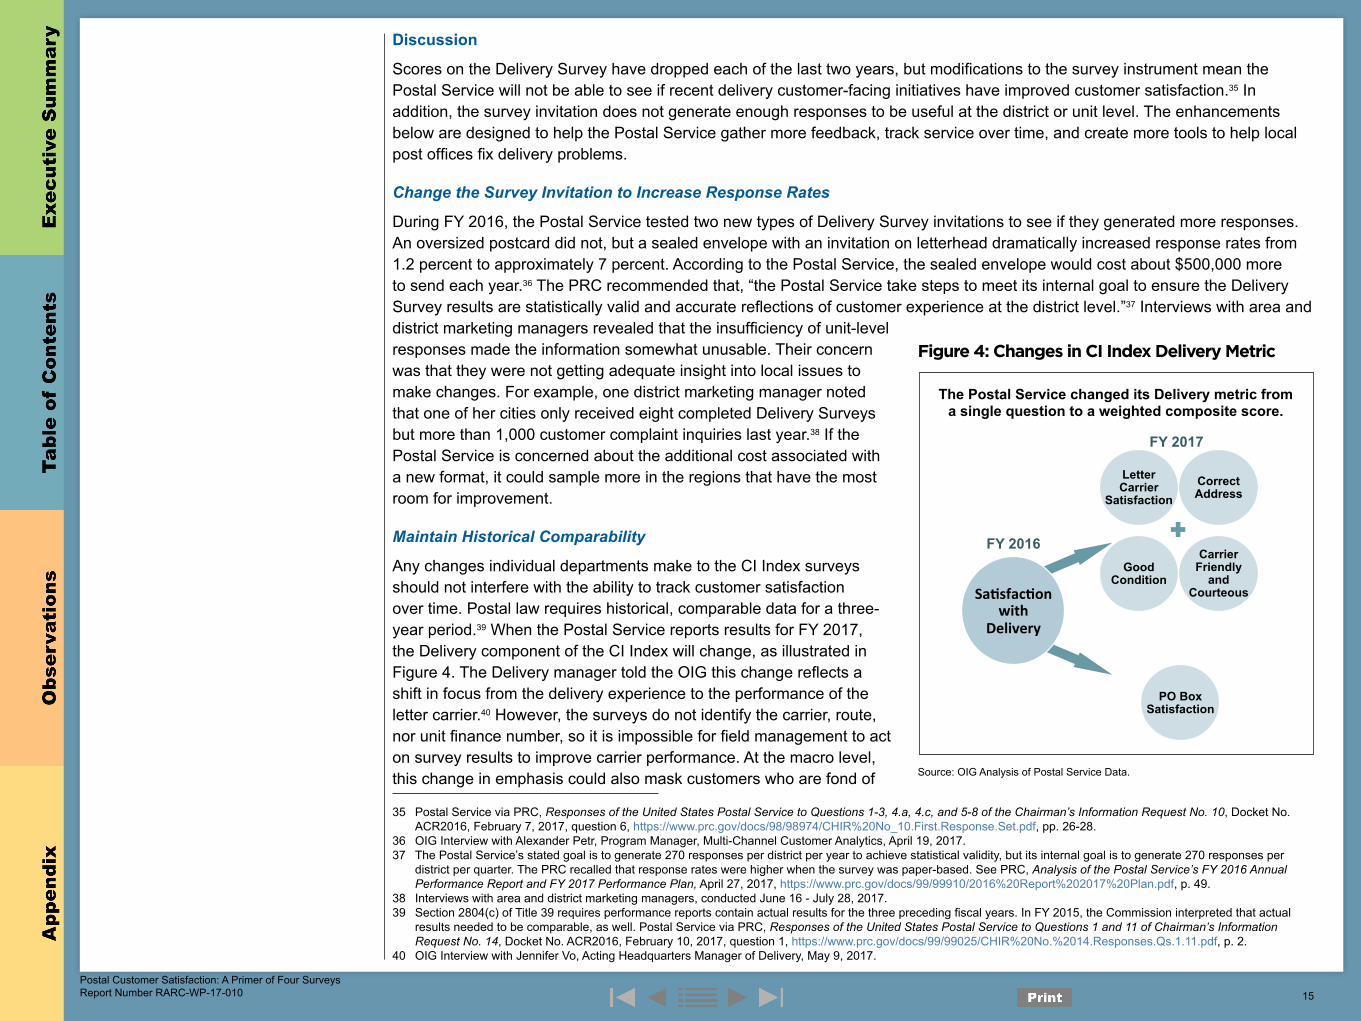
Maintain Historical Comparability
Any changes individual departments make to the CI Index surveys should not interfere with the ability to track customer satisfaction over time. Postal law requires historical, comparable data for a three-year period.39 When the Postal Service reports results for FY 2017, the Delivery component of the CI Index will change, as illustrated in Figure 4. The Delivery manager told the OIG this change reflects a shift in focus from the delivery experience to the performance of the letter carrier.40 However, the surveys do not identify the carrier, route, nor unit finance number, so it is impossible for field management to act on survey results to improve carrier performance. At the macro level, this change in emphasis could also mask customers who are fond of
35 Postal Service via PRC, Responses of the United States Postal Service to Questions 1-3, 4.a, 4.c, and 5-8 of the Chairman’s Information Request No. 10, Docket No. ACR2016, February 7, 2017, question 6, https://www.prc.gov/docs/98/98974/CHIR%20No_10.First.Response.Set.pdf, pp. 26-28.
36 OIG Interview with Alexander Petr, Program Manager, Multi-Channel Customer Analytics, April 19, 2017.37 The Postal Service’s stated goal is to generate 270 responses per district per year to achieve statistical validity, but its internal goal is to generate 270 responses per
district per quarter. The PRC recalled that response rates were higher when the survey was paper-based. See PRC, Analysis of the Postal Service’s FY 2016 Annual Performance Report and FY 2017 Performance Plan, April 27, 2017, https://www.prc.gov/docs/99/99910/2016%20Report%202017%20Plan.pdf, p. 49.
38 Interviews with area and district marketing managers, conducted June 16 - July 28, 2017.39 Section 2804(c) of Title 39 requires performance reports contain actual results for the three preceding fiscal years. In FY 2015, the Commission interpreted that actual
results needed to be comparable, as well. Postal Service via PRC, Responses of the United States Postal Service to Questions 1 and 11 of Chairman’s Information Request No. 14, Docket No. ACR2016, February 10, 2017, question 1, https://www.prc.gov/docs/99/99025/CHIR%20No.%2014.Responses.Qs.1.11.pdf, p. 2.
40 OIG Interview with Jennifer Vo, Acting Headquarters Manager of Delivery, May 9, 2017.
Figure 4: Changes in CI Index Delivery Metric
Letter Carrier
Satisfaction Correct Address
Good Condition
Carrier Friendly
and Courteous Sa#sfac#on
withDelivery
PO Box Satisfaction
The Postal Service changed its Delivery metric from a single question to a weighted composite score.
FY 2016
FY 2017
Source: OIG Analysis of Postal Service Data.
Postal Customer Satisfaction: A Primer of Four Surveys Report Number RARC-WP-17-010 15
The Delivery Index score on
the CI Index jumped more
than eight points when the
question changed.
their letter carrier but dissatisfied with their package delivery. The PRC expressed concern with this change, requesting a way to compare FY 2016 to FY 2017, as required by law. The Postal Service responded that yearly comparison was no longer possible at the CI level because, in addition to the new composite questions, the weights applied to the scores for different customer segments changed.41 This deprives the Postal Service of the opportunity to see whether it has turned the corner on Delivery Survey scores, which were the only ones that had fallen year-to-year since the CI Index was created in FY 2014. In the near term, Delivery Survey scores are not comparable until the establishment of new baselines: the Delivery Index score jumped more than eight points in the month the new index took effect.42
Include an Opt-In Contact Question
Asking the customer to provide contact information in the Delivery Survey could help field managers resolve issues and increase goodwill. Customers sometimes willingly supply contact information in their verbatim responses, with hopes of being contacted for issue resolution. This information is currently stripped from survey responses because of a legacy policy to protect personally-identifiable information in verbatims. Adding an opt-in contact question to the surveys, as is done in the BSN Survey, removes the legal privacy concern. Customer information could be further protected by restricting access to only the manager responsible for contacting the customer. The Postal Service would have to word the question carefully to avoid the implication that all indiviuals providing contact information will be contacted. But allowing postal management the means to contact customers with complaints could help resolve specific problems and avoid escalation of customer frustration to more public platforms, like social media.
Make Survey Data Actionable at Local Level
Information identifying personnel, including carriers, is scrubbed from the verbatims by the contractor before the Postal Service receives it.43 This scrubbing was originally enacted when any postal employee could read verbatims, but now only approved users can access the CI Index tools. Name removal causes about a week’s delay in loading information to the CI Platform, postponing the ability of postmasters and district managers to respond to customer complaints and limiting the scope of action. The Postal Service could ask its General Counsel to review this policy with regard to the verbatims securely located on the limited-access CI Platform. If specific employee information was available to management, they could provide positive feedback to carriers as well as head off problems more quickly and accurately. This could also save the Postal Service money by eliminating the need for contractors to read every verbatim. Furthermore, ensuring surveys can be traced to the local level is critical, especially for the Delivery Survey. Currently, surveys can be traced to the ZIP Code level, but they cannot be traced to a customer’s destination delivery unit (DDU).44 If the Delivery Survey was changed to enable identification of a respondent’s DDU, the Postal Service could employ push notifications to alert local post offices of negative reviews as they come in.
Formalize Sharing of Best Practices
Delivery Survey results are usually analyzed at the district and area levels. A district with good scores has evidence that its tactics are working, but a district that is not scoring well does not have a template for how to improve. The Postal Service could consider creating a program to share best practices and successful tactics. The Postal Service already internally reports the top 10 and bottom 10 scoring districts. It could use this as an opportunity to acknowledge the highest performances by collecting and
41 Postal Service via PRC, Responses of the United States Postal Service to Questions 1-3, 4.a, 4.c, and 5-8 of the Chairman’s Information Request No. 10, Docket No. ACR2016, February 7, 2017, question 6, https://www.prc.gov/docs/98/98974/CHIR%20No_10.First.Response.Set.pdf, pp. 25-28.
42 Postal Service, “Customer Insights Index by Month, September 2016 to October 2016,” Customer Insights 2.0 Platform, http://blue.usps.gov/caweb/cesa/customer-insights-2.htm.
43 Interview with Alexander Petr, April 19, 2017.44 Unit level information was originally provided within the CI Platform at the beginning of FY 2017 but has since been removed. Managers were concerned that unit-level
data could not identify the exact depot from which each carrier originated.
Postal Customer Satisfaction: A Primer of Four Surveys Report Number RARC-WP-17-010 16
reporting their best practices.45 These practices could be shared through an internal best practices video, email campaign, or could be the subject of Stand Up Talks, the Postal Service’s most common method for disseminating short and focused training to field employees. Headquarters could also create an informal competition for “Most Improved District” or “Best New Idea” to generate enthusiasm and sharing. Codifying best practices can help institutional knowledge grow, ensuring no region has to start over if a successful manager leaves the organization or is relocated.
45 This is done occasionally in the Postal Service’s regional newsletters.
Postal Customer Satisfaction: A Primer of Four Surveys Report Number RARC-WP-17-010 17
Module 5: Point of Sale Description
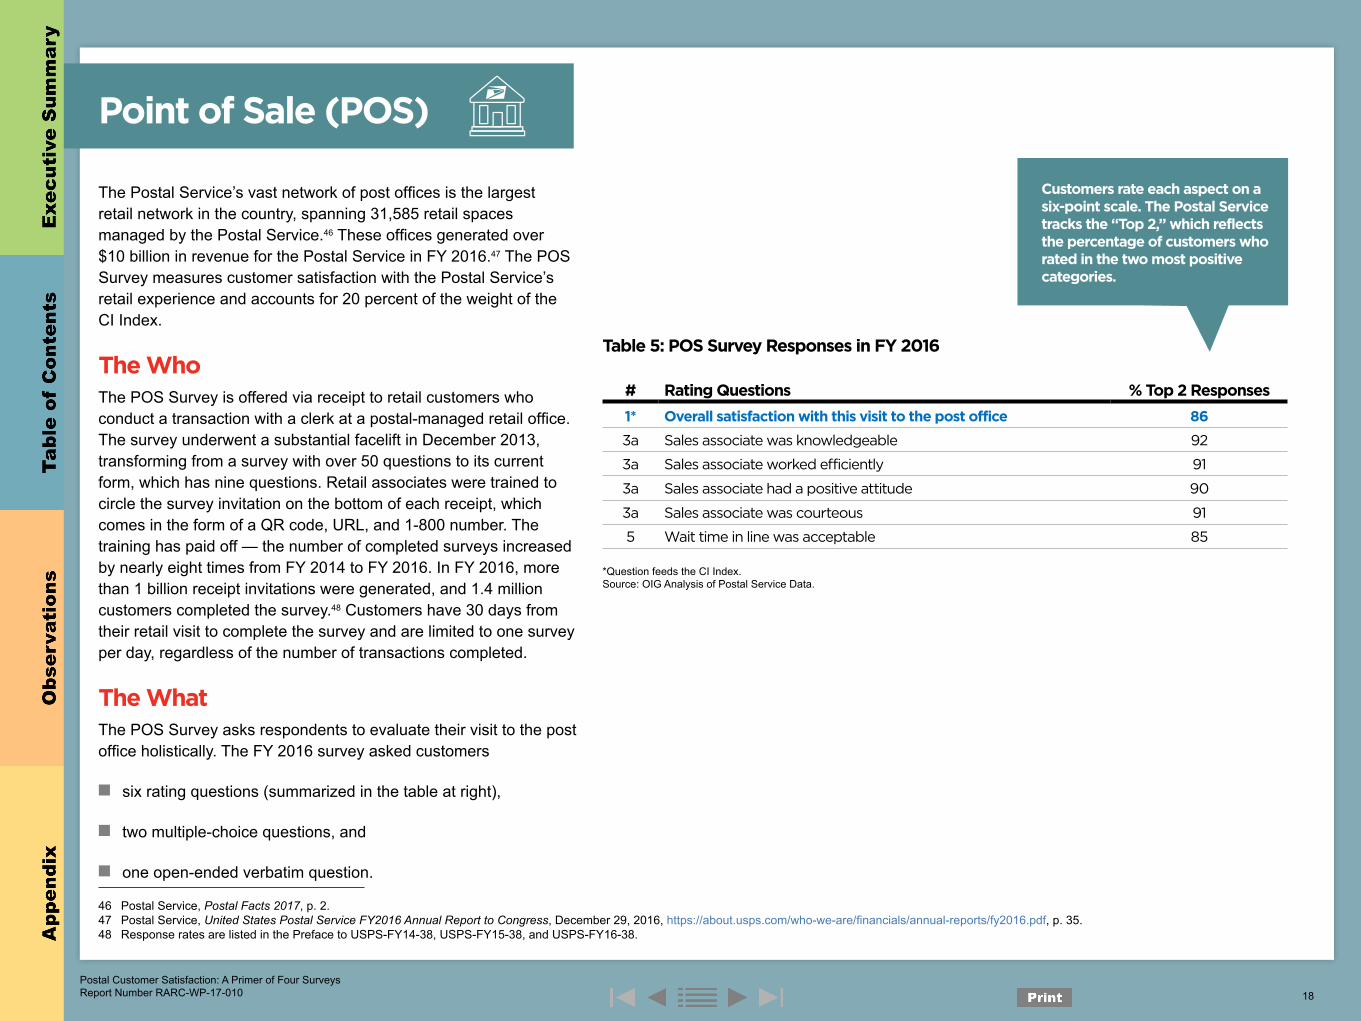
Point of Sale (POS)
The Postal Service’s vast network of post offices is the largest retail network in the country, spanning 31,585 retail spaces managed by the Postal Service.46 These offices generated over $10 billion in revenue for the Postal Service in FY 2016.47 The POS Survey measures customer satisfaction with the Postal Service’s retail experience and accounts for 20 percent of the weight of the CI Index.
The WhoThe POS Survey is offered via receipt to retail customers who conduct a transaction with a clerk at a postal-managed retail office. The survey underwent a substantial facelift in December 2013, transforming from a survey with over 50 questions to its current form, which has nine questions. Retail associates were trained to circle the survey invitation on the bottom of each receipt, which comes in the form of a QR code, URL, and 1-800 number. The training has paid off — the number of completed surveys increased by nearly eight times from FY 2014 to FY 2016. In FY 2016, more than 1 billion receipt invitations were generated, and 1.4 million customers completed the survey.48 Customers have 30 days from their retail visit to complete the survey and are limited to one survey per day, regardless of the number of transactions completed.
The WhatThe POS Survey asks respondents to evaluate their visit to the post office holistically. The FY 2016 survey asked customers
■ six rating questions (summarized in the table at right),
■ two multiple-choice questions, and
■ one open-ended verbatim question.
46 Postal Service, Postal Facts 2017, p. 2.47 Postal Service, United States Postal Service FY2016 Annual Report to Congress, December 29, 2016, https://about.usps.com/who-we-are/financials/annual-reports/fy2016.pdf, p. 35.48 Response rates are listed in the Preface to USPS-FY14-38, USPS-FY15-38, and USPS-FY16-38.
Table 5: POS Survey Responses in FY 2016
# Rating Questions % Top 2 Responses
1* Overall satisfaction with this visit to the post office 86
3a Sales associate was knowledgeable 92
3a Sales associate worked efficiently 91
3a Sales associate had a positive attitude 90
3a Sales associate was courteous 91
5 Wait time in line was acceptable 85
*Question feeds the CI Index.Source: OIG Analysis of Postal Service Data.
Customers rate each aspect on a six-point scale. The Postal Service tracks the “Top 2,” which reflects the percentage of customers who rated in the two most positive categories.
Postal Customer Satisfaction: A Primer of Four Surveys Report Number RARC-WP-17-010 18
Discussion
POS Surveys account for the overwhelming number of CI Index surveys, with more than a million responses during FY 2016. Interviews with area and district marketing managers revealed several ad-hoc initiatives postal management is taking to increase the number of POS Survey responses, such as personally engaging with customers waiting in line and experimenting with tear-off pads containing survey links. The OIG suggests experimentation with mobile satisfaction kiosks and several other enhancements to increase the amount and actionability of feedback the Postal Service receives from its retail customers.
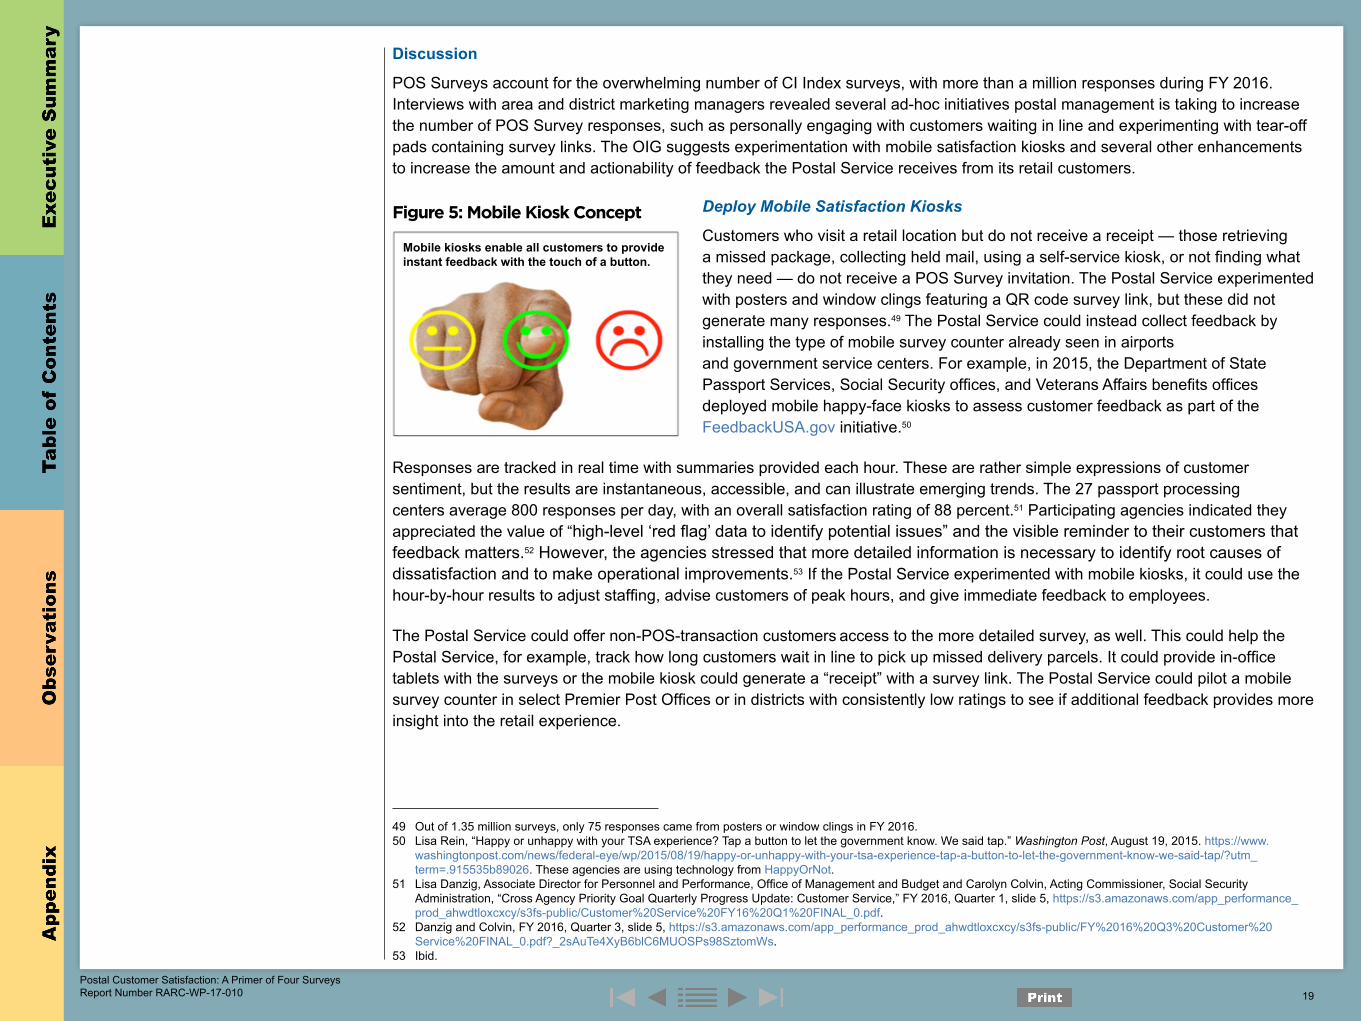
Deploy Mobile Satisfaction Kiosks
Customers who visit a retail location but do not receive a receipt — those retrieving a missed package, collecting held mail, using a self-service kiosk, or not finding what they need — do not receive a POS Survey invitation. The Postal Service experimented with posters and window clings featuring a QR code survey link, but these did not generate many responses.49 The Postal Service could instead collect feedback by installing the type of mobile survey counter already seen in airports and government service centers. For example, in 2015, the Department of State Passport Services, Social Security offices, and Veterans Affairs benefits offices deployed mobile happy-face kiosks to assess customer feedback as part of the FeedbackUSA.gov initiative.50
Responses are tracked in real time with summaries provided each hour. These are rather simple expressions of customer sentiment, but the results are instantaneous, accessible, and can illustrate emerging trends. The 27 passport processing centers average 800 responses per day, with an overall satisfaction rating of 88 percent.51 Participating agencies indicated they appreciated the value of “high-level ‘red flag’ data to identify potential issues” and the visible reminder to their customers that feedback matters.52 However, the agencies stressed that more detailed information is necessary to identify root causes of dissatisfaction and to make operational improvements.53 If the Postal Service experimented with mobile kiosks, it could use the hour-by-hour results to adjust staffing, advise customers of peak hours, and give immediate feedback to employees.
The Postal Service could offer non-POS-transaction customers access to the more detailed survey, as well. This could help the Postal Service, for example, track how long customers wait in line to pick up missed delivery parcels. It could provide in-office tablets with the surveys or the mobile kiosk could generate a “receipt” with a survey link. The Postal Service could pilot a mobile survey counter in select Premier Post Offices or in districts with consistently low ratings to see if additional feedback provides more insight into the retail experience.
Figure 5: Mobile Kiosk Concept
Mobile kiosks enable all customers to provide instant feedback with the touch of a button.
Postal Customer Satisfaction: A Primer of Four Surveys Report Number RARC-WP-17-010 19
49 Out of 1.35 million surveys, only 75 responses came from posters or window clings in FY 2016.50 Lisa Rein, “Happy or unhappy with your TSA experience? Tap a button to let the government know. We said tap.” Washington Post, August 19, 2015. https://www.
washingtonpost.com/news/federal-eye/wp/2015/08/19/happy-or-unhappy-with-your-tsa-experience-tap-a-button-to-let-the-government-know-we-said-tap/?utm_term=.915535b89026. These agencies are using technology from HappyOrNot.
51 Lisa Danzig, Associate Director for Personnel and Performance, Office of Management and Budget and Carolyn Colvin, Acting Commissioner, Social Security Administration, “Cross Agency Priority Goal Quarterly Progress Update: Customer Service,” FY 2016, Quarter 1, slide 5, https://s3.amazonaws.com/app_performance_prod_ahwdtloxcxcy/s3fs-public/Customer%20Service%20FY16%20Q1%20FINAL_0.pdf.
52 Danzig and Colvin, FY 2016, Quarter 3, slide 5, https://s3.amazonaws.com/app_performance_prod_ahwdtloxcxcy/s3fs-public/FY%2016%20Q3%20Customer%20Service%20FINAL_0.pdf?_2sAuTe4XyB6blC6MUOSPs98SztomWs.
53 Ibid.
Include an Opt-In Contact Question
Adding an opt-in contact question to the POS Survey could allow postal management to contact customers to resolve specific problems before they are escalated to more public platforms, like social media. The POS Survey could adopt the language of the BSN Survey, which asks, “Would you like a manager to contact you to find out how we can improve?” This question implies a follow-up will occur, so if the Postal Service gives customers an option to provide contact information, they should intend to use it. Privacy protections will also need to be put in place, such as restricting access to only the manager who will contact the customer.
Include Customer Segmentation Questions
The POS Survey is the only CI Index survey that does not collect any information to assist in grouping customer segments by attribute. At a minimum, knowing if the respondent came in for personal or business reasons would give the Postal Service valuable insight. The expectations of an SMB owner could drastically differ from the retail expectations of individuals. This type of analysis could help the Postal Service tailor its offerings to meet specific needs. Additionally, the Postal Service could add an optional demographic question on age, which is already asked on the CCC and Delivery Surveys.
Use Hot Alerts
The POS Survey could use a “hot alert,” similar to that of the BSN Survey, to alert field management when a negative survey response is received from a particular post office. Although the survey can be completed up to 30 days after the post office visit, the sooner negative feedback makes it to the field, the sooner corrective actions can be taken.
Make Survey Data Actionable at Local Level
Information identifying specific post offices and clerks is scrubbed from the verbatims by the contractor before the Postal Service receives it.54 As described in the Delivery Module, the scrubbing delays the ability of postmasters to respond to customer complaints by one week. If the General Counsel decides the new, limited-access CI Platform provides acceptable privacy protection for verbatims, free of redactions, management would have access to names identified by customers. This could help them funnel positive feedback to postal clerks, head off problems more quickly and accurately, and save the Postal Service money by eliminating the need for contractors to read every verbatim.
Formalize Sharing of Best Practices
POS Survey results are usually analyzed at the district and area levels. A district with good scores can keep doing what it is doing, but a unit that does not score well lacks a template for how to improve. To their credit, many district managers reported sharing best practices and incentivizing postmasters to improve POS scores through district-wide contests and other incentives. A formalized best practice program could foster institutional knowledge, ensuring this information is disseminated across all districts. This is especially salient given the number of temporary and acting district managers. Creating a formalized practice would ensure best practices are shared even when management changes.
54 Interview with Alexander Petr, April 19, 2017.
Postal Customer Satisfaction: A Primer of Four Surveys Report Number RARC-WP-17-010 20
Crosscutting InsightsThe Postal Service hopes to deliver a world-class customer experience. Underpinning this strategy are the CI Index surveys that measure customer satisfaction at four postal touchpoints. These surveys give postal departments valuable insight into the transactions within their purview. With the recent, experimental addition of the NPS question, postal leadership also has a way to assess its overall relationship with the customer through a loyalty indicator. Together, the data on transaction satisfaction and customer loyalty provide a more robust picture of brand health and growth potential than measuring only one aspect of customer satisfaction. Beyond the rating scales and multiple choice questions, the Postal Service also has a trove of data in the verbatims. These narrative reviews of postal touchpoints are truly the voice of the customer and merit thoughtful consideration.
Making sense of 1.7 million responses to CI Index surveys, many of which also include open-ended verbatim responses, is a monumental task. Leaving verbatim review solely to stakeholders in the field can limit analysis to parochial interests instead of a Postal Service-wide view. A district manager might only review surveys for his region; after all, her bonus depends on it. Narrow analysis helps channel feedback to the appropriate retail and delivery managers, but it does not identify issues that cross district or area boundaries nor identify why an issue occurs in one region and not another. Fortunately, the Postal Service’s CI Platform enables analysis of the verbatims with a new text-reading tool.55
This tool can be especially helpful for identifying verbatim responses that span across postal touchpoints. For example, a delivery customer might complain about an issue they experienced at a post office. Even though the customer left the feedback on the Delivery Survey, it is important this information makes its way back to the retail manager. Similarly, if a BSN customer reports that mailings arrived late in a particular neighborhood, this information needs to funnel back to the field as well. Headquarters, with the help of its text analytics software, can fulfill this liaison role, making sure that relevant data from one department makes its way to other departments. Comprehensive analysis across surveys will be especially important going forward with the addition of an NPS verbatim question for FY 2017. When customers explain their reasoning behind their rating, answers will likely cut across touchpoints. Postal headquarters will need to analyze and disseminate the responses to the appropriate stakeholders to make the analysis useful.
Another use for the text-mining tools is to identify areas for further probing. For example, customers continually remark that mail is delivered too early, too late, or at a different time every day in verbatims. This indicates that time of delivery is important to customers. The Postal Service could use temporary questions to dive into this feedback to understand what is causing the problem and possible resolution strategies. It has experimented with these questions in the past, for example, asking about accuracy of tracking information. These questions could help make the surveys more actionable at the local level, but could also lead to valuable product and service development for the organization. Temporary questions, used sparingly and changed quarterly, would allow the Postal Service to sense the pulse of the customer on emerging issues without permanently adding multiple questions to already lengthy surveys or violating legal requirements.56
55 Interview with Alexander Petr, April 6, 2017, and OIG analysis of Postal Service data on the Customer Insights 2.0 Platform.56 PRC staff indicated temporary questions would not interfere with their ability to assess compliance with the law. Interview with PRC staff, June 12, 2017.
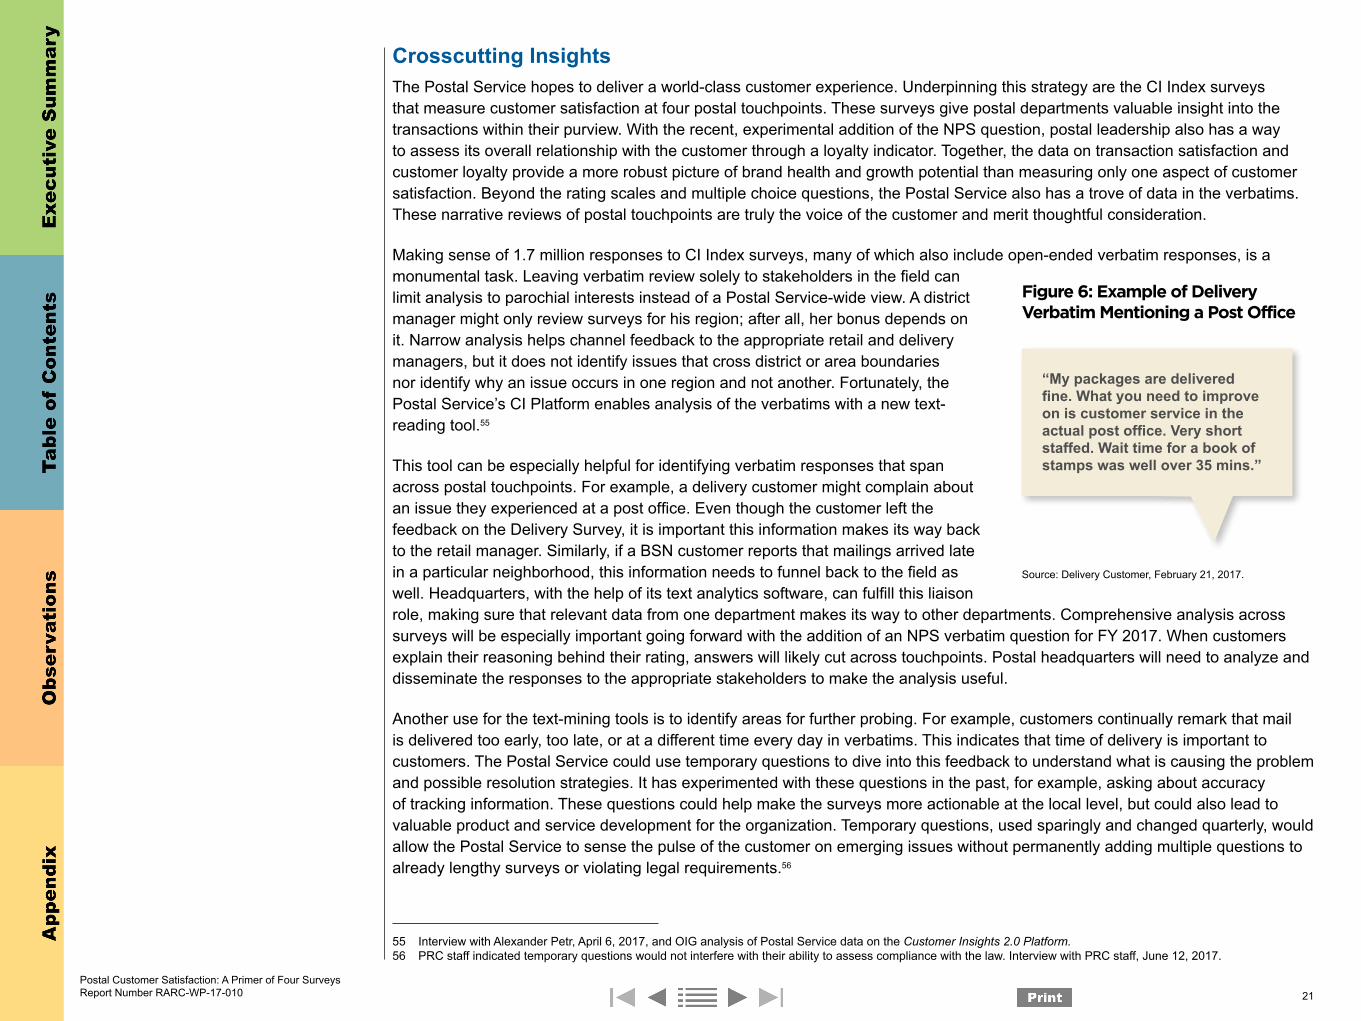
Figure 6: Example of Delivery Verbatim Mentioning a Post Office
“My packages are delivered fine. What you need to improve on is customer service in the actual post office. Very short staffed. Wait time for a book of stamps was well over 35 mins.”
Source: Delivery Customer, February 21, 2017.
Postal Customer Satisfaction: A Primer of Four Surveys Report Number RARC-WP-17-010 21
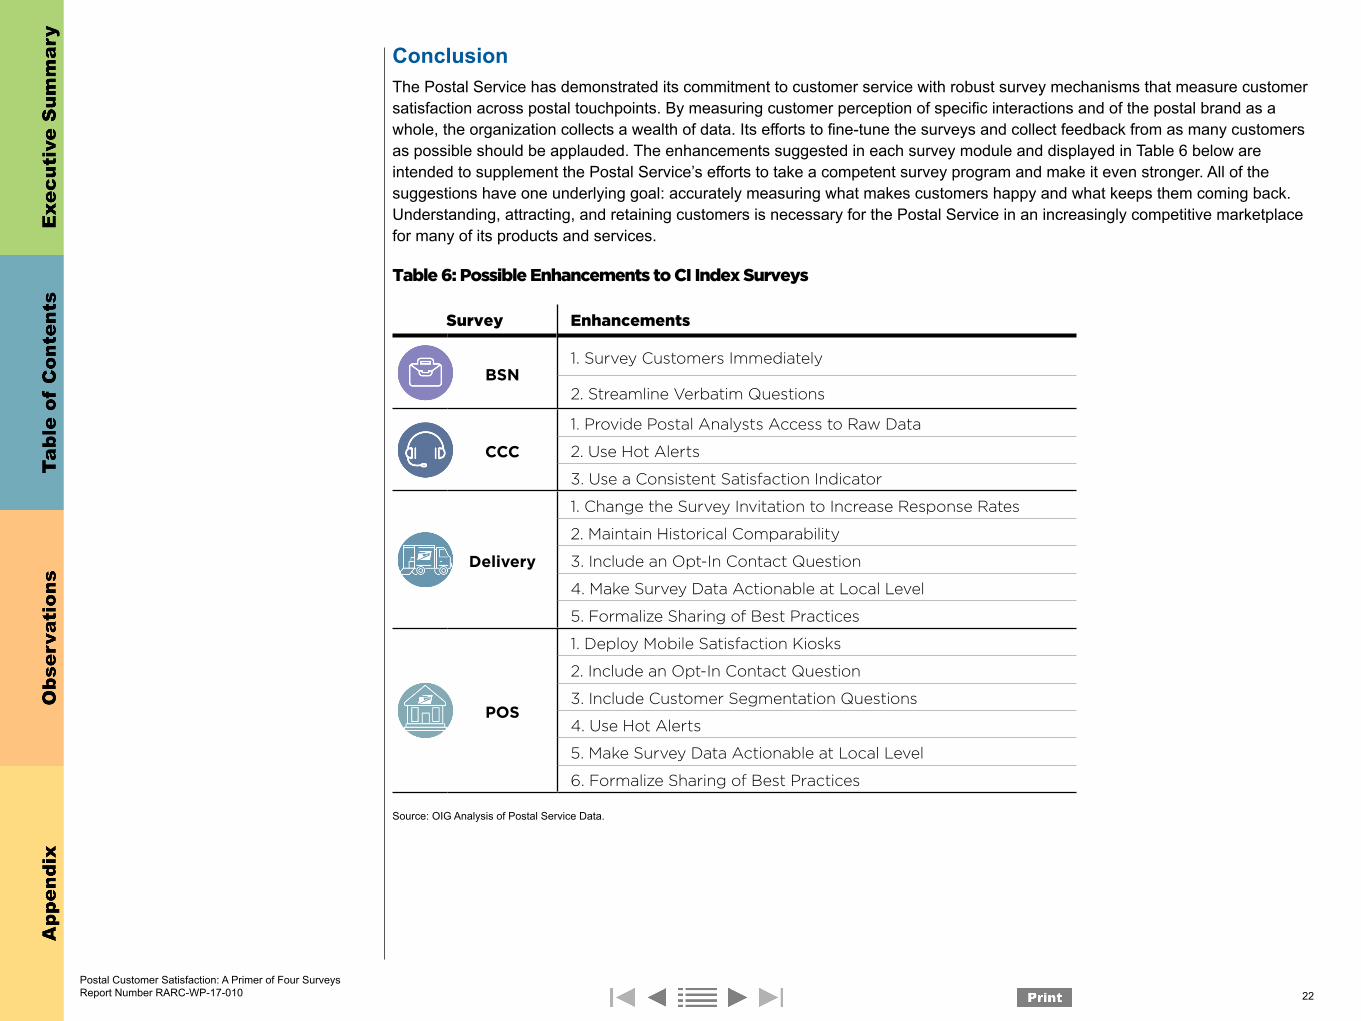
ConclusionThe Postal Service has demonstrated its commitment to customer service with robust survey mechanisms that measure customer satisfaction across postal touchpoints. By measuring customer perception of specific interactions and of the postal brand as a whole, the organization collects a wealth of data. Its efforts to fine-tune the surveys and collect feedback from as many customers as possible should be applauded. The enhancements suggested in each survey module and displayed in Table 6 below are intended to supplement the Postal Service’s efforts to take a competent survey program and make it even stronger. All of the suggestions have one underlying goal: accurately measuring what makes customers happy and what keeps them coming back. Understanding, attracting, and retaining customers is necessary for the Postal Service in an increasingly competitive marketplace for many of its products and services.
Table 6: Possible Enhancements to CI Index Surveys
Survey Enhancements
BSN1. Survey Customers Immediately
2. Streamline Verbatim Questions
CCC
1. Provide Postal Analysts Access to Raw Data
2. Use Hot Alerts
3. Use a Consistent Satisfaction Indicator
Delivery
1. Change the Survey Invitation to Increase Response Rates
2. Maintain Historical Comparability
3. Include an Opt-In Contact Question
4. Make Survey Data Actionable at Local Level
5. Formalize Sharing of Best Practices
POS
1. Deploy Mobile Satisfaction Kiosks
2. Include an Opt-In Contact Question
3. Include Customer Segmentation Questions
4. Use Hot Alerts
5. Make Survey Data Actionable at Local Level
6. Formalize Sharing of Best Practices
Source: OIG Analysis of Postal Service Data.
Postal Customer Satisfaction: A Primer of Four Surveys Report Number RARC-WP-17-010 22
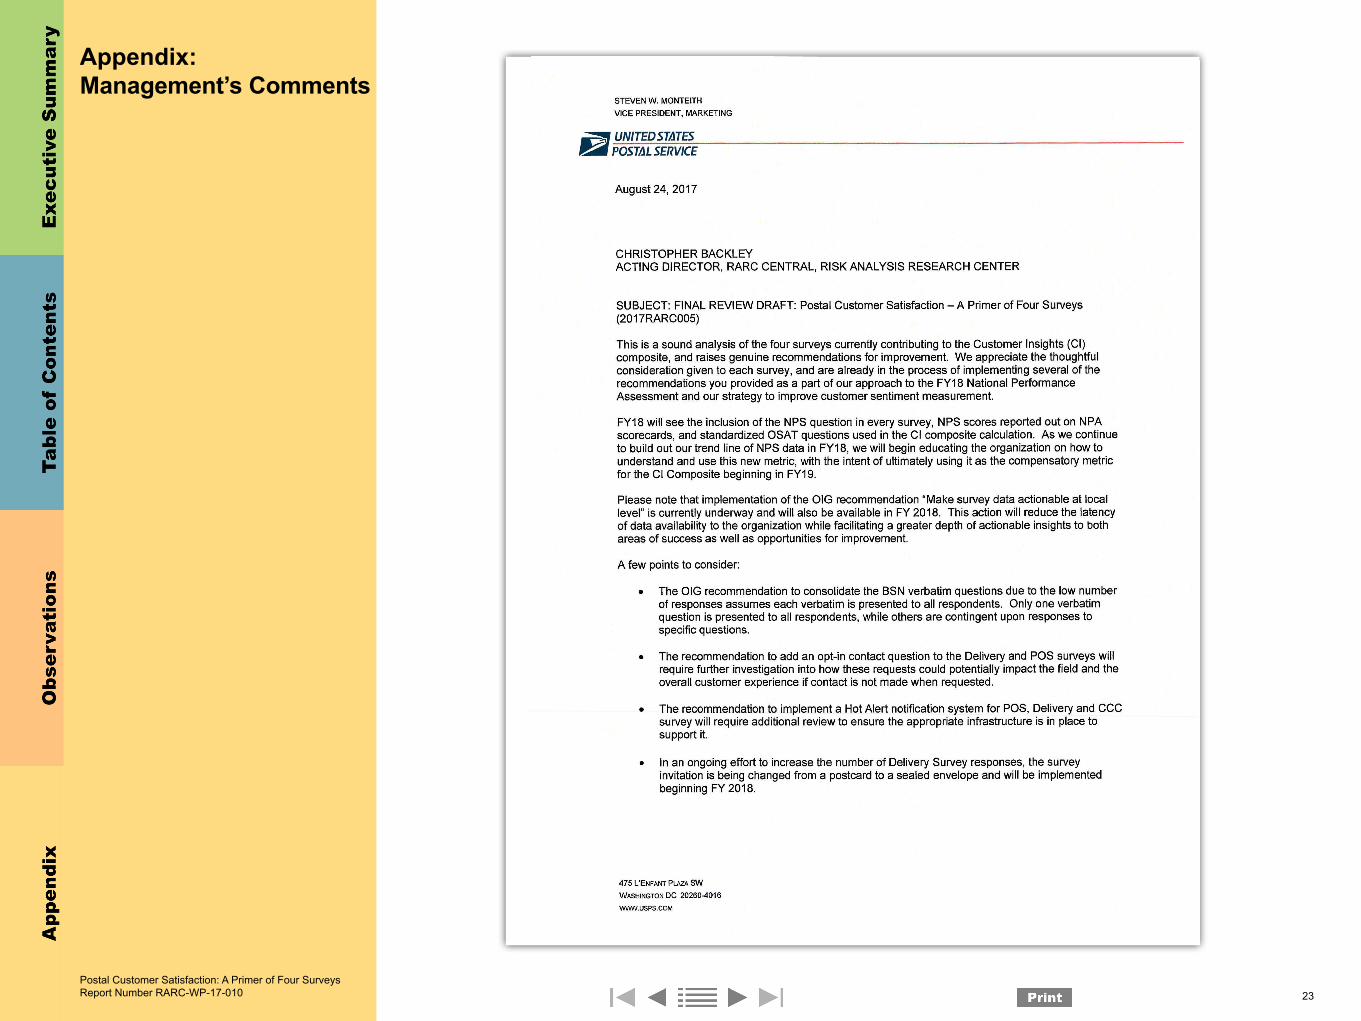
Appendix: Management’s Comments
Postal Customer Satisfaction: A Primer of Four Surveys Report Number RARC-WP-17-010 23
Postal Customer Satisfaction: A Primer of Four Surveys Report Number RARC-WP-17-010 24
Contact Information
Contact us via our Hotline and FOIA forms. Follow us on social networks.
Stay informed.
For media inquiries, contact Agapi DoulaverisTelephone: [email protected]
Postal Customer Satisfaction: A Primer of Four Surveys Report Number RARC-WP-17-010 25