Embed Size (px)
Citation preview
Page 1/22
Long-Term Impacts of Reservoir Operation on theSpatiotemporal Variation in Nitrogen Forms in thePost-Three Gorges Dam Period (2004–2016)Bei Nie ( [email protected] )
Wuhan University https://orcid.org/0000-0002-7163-2326Yuhong Zeng
Wuhan UniversityLanhua Niu
Changjiang Water Resources CommissionXiaofeng Zhang
Wuhan University
Research Article
Keywords: Three Gorges Reservoir, Spatiotemporal variations, Water level, Nitrogen transformation,External input
Posted Date: April 23rd, 2021
DOI: https://doi.org/10.21203/rs.3.rs-421628/v1
License: This work is licensed under a Creative Commons Attribution 4.0 International License. Read Full License
Version of Record: A version of this preprint was published at Environmental Science and PollutionResearch on July 28th, 2021. See the published version at https://doi.org/10.1007/s11356-021-15557-z.
Page 2/22
AbstractNitrogen (N) is an essential nutrient limiting life, and its biochemical cycling and distribution in rivershave been markedly affected by river engineering construction and operation. Here, we comprehensivelyanalyzed the spatiotemporal variations and driving environmental factors of N distributions based on thelong-term observations (from 2004 to 2016) of seven stations in the Three Gorges Reservoir (TGR). In thestudy period, the overall water quality status of the river reach improved, whereas N pollution was severeand tended to be aggravated after the TGR impoundment. The anti-seasonal reservoir operation stronglyaffected the variations in N forms. The total nitrogen (TN) concentration in the mainstream of theYangtze River continuously increased, although it was still lower than that in the incoming tributaries (Wuand Jialing rivers). Further analysis showed that this increase occurred probably because of externalinputs, including the upstream (76%), non-point (22%), and point source pollution inputs (2%). Besides,different N forms showed signi�cant seasonal variations; among them, the TN and nitrate nitrogenconcentrations were the lowest in the impoundment season (October–February), and the ammonianitrogen concentrations were the highest in the sluicing season (March–May). These parameters variedlikely because of internal N transformation. Redundancy analysis revealed that the water level regulatedby the anti-seasonal operation was the largest contributor. Our �ndings could provide a basis formanaging and predicting the water quality in the Yangtze River.
1. IntroductionDams play a signi�cant role in addressing the demand for �ood control, power generation, andnavigation improvement (Chen et al., 2019; Li et al., 2012; Nilsson et al., 2005). Rivers worldwide havebeen intensively dammed; more than 70,000 large dams have been constructed, and many others havebeen proposed or are under construction (Maavara et al., 2015; Shi et al., 2020). However, these projectslikely disrupt the river continuity and may have adverse consequences on the balance and functionalintegrity of river systems (Nilsson et al., 2005; Tang et al., 2018; Wang, 2020; Yan et al., 2015). Afterimpoundment, dam-affected river reaches would be converted into lakes, and this modi�ed �uvial regimelikely increases the water retention time and changes the seasonality of suspended and dissolvedmaterial �uxes (Eiriksdottir et al., 2017; Friedl and Wüest, 2002; Maeck et al., 2013). Moreover, the biota,especially microorganisms, may be affected by anoxia, sedimentation, and nutrient level variations inreservoir systems (Eiriksdottir et al., 2017; Yan et al., 2015).
Nitrogen, an essential component of all living organisms and primary nutrient for biological growth, isstrongly related to the water trophic status (Kuypers et al., 2018; Ran et al., 2017; Zheng et al., 2016). Themicrobial transformation of N is generally described as an orderly cycle that includes six processes,namely, N �xation, nitri�cation, denitri�cation, anammox, assimilation, and ammoniation. In the aquaticecosystem, inorganic N conversion, such as nitri�cation and denitri�cation, has been an essential topicfor several decades (Boyer et al., 2006; Zhu et al., 2018). Ammonia can be oxidized to nitrate throughnitri�cation and eventually converted back to dinitrogen through denitri�cation or anaerobic ammoniumoxidation. These alterations of the N oxidation state are controlled primarily by microbial reactions, which
Page 3/22
can be affected by many factors (Kim et al., 2016; Povilaitis et al., 2012). For instance, nitri�cation isaerobic, whereas denitri�cation usually involves anaerobic and heterotrophic bacteria (Kim et al., 2016;Zhu et al., 2018).
With a length of over 6000 km, the Yangtze River has hundreds of large dams (higher than 15 m; Li et al.,2017; Ran et al., 2017). Three Gorges Reservoir (TGR), one of the largest hydropower complex projects inthe world, has signi�cantly reversed the seasonal changes in natural hydrology; in its operation, the waterlevel is arti�cially regulated to a low level for the need of hydropower energy or �ood control in summerand a high level for stable water supply or navigation in winter (Han et al., 2018). The dam holds waterand sediments, and 1.8×10¹² kg of sediments (retention rate over 80%) were trapped from 2003 to 2013along the 700 km-long TGR (Yang et al., 2014); the clear water discharge has caused substantial river bederosion downstream the dam. The Three Gorges Project also faced severe controversies concerning theenvironmental and ecological impact of dams; for instance, water eutrophication, along with constructionand operation, has become a hot and critical issue (Chai et al., 2009; Gao et al., 2016; Liu et al., 2018; Ranet al., 2017; Zhou et al., 2013). In the TGR basin, NO − 3-N and TN are identi�ed as vital pollution indicesin an assessment based on the Canadian Council of Ministers of the Environment Water Quality Index(Xia et al., 2018). Although the TGR has accounted for 5% of N retention in the Yangtze River basin fromland to sea since 2004, the enhanced signals of dissolved inorganic nitrogen (DIN) concentrations in thelower reach of the Yangtze River have also been observed (Sun et al., 2013). The DIN concentrationdramatically increased from an average of 37 µmol L− 1 in the 1980s to 120 µmol L− 1 in the 2000s (Dai etal., 2011). The reservoir operation has implications not only for N transport but also for N transformationin the TGR (Chai et al., 2016; Shi et al., 2020; Wang, 2020). For example, frequent arti�cial �oods createdby the reservoir operation can reduce the ability of soil to retain nutrients and promote the release of N insediments via coupled nitri�cation-denitri�cation processes (Ye et al., 2019; Yu et al., 2020). Morefunctional genes involved in N cycling have been observed in the TGR basin, indicating a higher level ofbacterial activity in generating more nitrogenous nutrients (Yan et al., 2015). Since the construction of theThree Gorges Dam (TGD), the transport and transfer patterns of N have changed dramatically, and thesevariations potentially have a sustainable and crucial effect on the N distribution and trophic status in theTGR.
Therefore, the spatiotemporal variations in N and their relationship with environmental factors should bestudied to assess the water quality status and impact of TGR operation, especially when the hydrologyregime has undergone tremendous changes since TGR impoundment. The in�uencing mechanisms ofthe changing hydrological regime on N cycling in the TGR have been revealed through laboratoryexperiments by arti�cially increasing hydrostatic pressure, creating an anti-seasonal wet-dry cycle, andprolonging water residence time (Chai et al., 2016; Shi et al., 2020; Yu et al., 2020). However, most studieshave preferred short-term investigation because of di�culties in obtaining long-term observed data (Dinget al., 2019; Huang et al., 2014; Luo et al., 2011; Ran et al., 2017). The time variability of N in TGR involvesa wide range of scales from days, months, to multi-years because of the coupled effect of natural(precipitation and monsoon) and anthropogenic (regular operation and staged impoundment of TGR)
Page 4/22
factors; as such, studies based on massive monitoring data are more valuable for assessing the long-term impact of TGR operation on N distribution. Besides, studies may explore the relationship betweenenvironmental factors and different N forms based on long-term monitoring data on water quality andhydrological parameters.
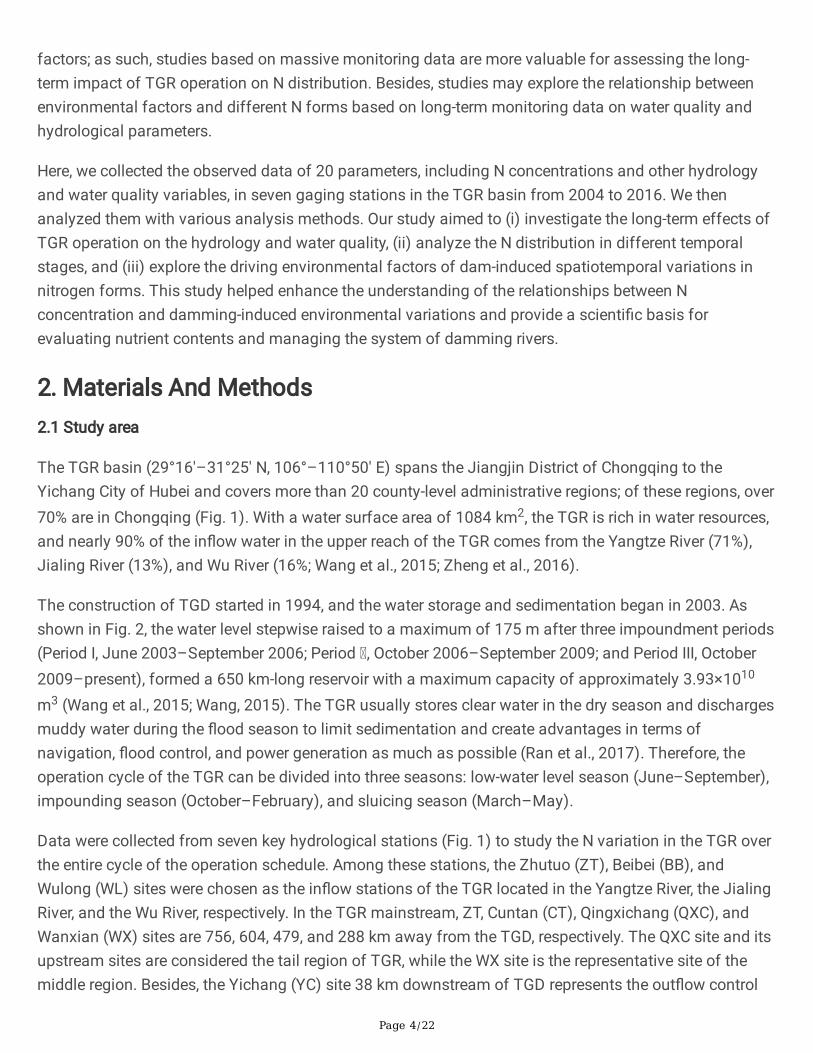
Here, we collected the observed data of 20 parameters, including N concentrations and other hydrologyand water quality variables, in seven gaging stations in the TGR basin from 2004 to 2016. We thenanalyzed them with various analysis methods. Our study aimed to (i) investigate the long-term effects ofTGR operation on the hydrology and water quality, (ii) analyze the N distribution in different temporalstages, and (iii) explore the driving environmental factors of dam-induced spatiotemporal variations innitrogen forms. This study helped enhance the understanding of the relationships between Nconcentration and damming-induced environmental variations and provide a scienti�c basis forevaluating nutrient contents and managing the system of damming rivers.
2. Materials And Methods2.1 Study area
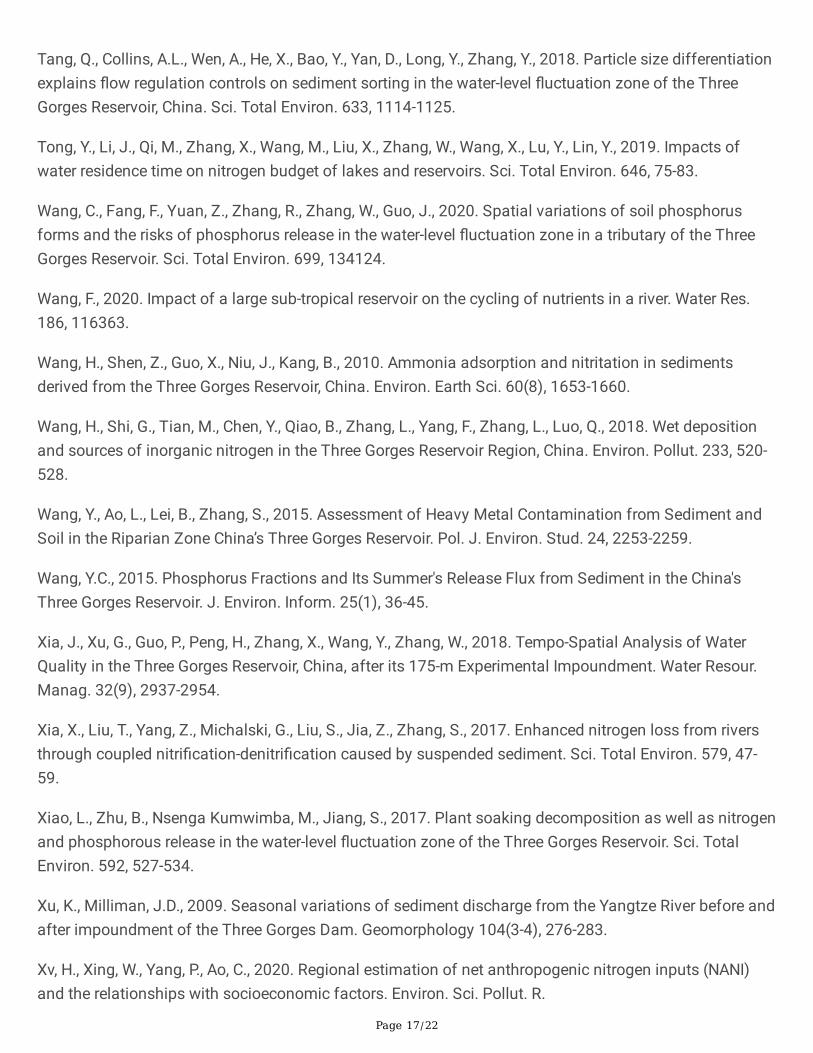
The TGR basin (29°16′–31°25′ N, 106°–110°50′ E) spans the Jiangjin District of Chongqing to theYichang City of Hubei and covers more than 20 county-level administrative regions; of these regions, over70% are in Chongqing (Fig. 1). With a water surface area of 1084 km2, the TGR is rich in water resources,and nearly 90% of the in�ow water in the upper reach of the TGR comes from the Yangtze River (71%),Jialing River (13%), and Wu River (16%; Wang et al., 2015; Zheng et al., 2016).
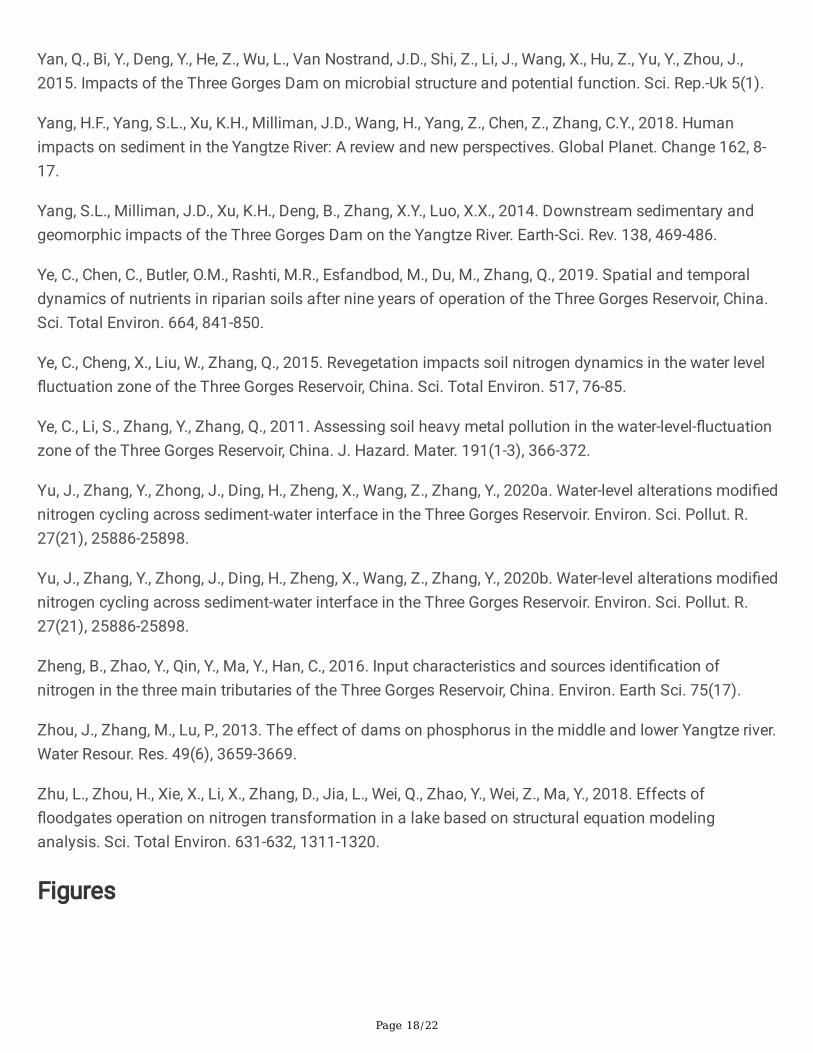
The construction of TGD started in 1994, and the water storage and sedimentation began in 2003. Asshown in Fig. 2, the water level stepwise raised to a maximum of 175 m after three impoundment periods(Period I, June 2003–September 2006; Period , October 2006–September 2009; and Period III, October2009–present), formed a 650 km-long reservoir with a maximum capacity of approximately 3.93×10¹⁰
m3 (Wang et al., 2015; Wang, 2015). The TGR usually stores clear water in the dry season and dischargesmuddy water during the �ood season to limit sedimentation and create advantages in terms ofnavigation, �ood control, and power generation as much as possible (Ran et al., 2017). Therefore, theoperation cycle of the TGR can be divided into three seasons: low-water level season (June–September),impounding season (October–February), and sluicing season (March–May).
Data were collected from seven key hydrological stations (Fig. 1) to study the N variation in the TGR overthe entire cycle of the operation schedule. Among these stations, the Zhutuo (ZT), Beibei (BB), andWulong (WL) sites were chosen as the in�ow stations of the TGR located in the Yangtze River, the JialingRiver, and the Wu River, respectively. In the TGR mainstream, ZT, Cuntan (CT), Qingxichang (QXC), andWanxian (WX) sites are 756, 604, 479, and 288 km away from the TGD, respectively. The QXC site and itsupstream sites are considered the tail region of TGR, while the WX site is the representative site of themiddle region. Besides, the Yichang (YC) site 38 km downstream of TGD represents the out�ow control
Page 5/22
station for a comparative study. The river reaches from the WX to the YC site were converted to a lakewith a decreased water velocity and prolonged retention time.
2.2 Data collection, sampling, and analysisThe water samples were collected and analyzed in accordance with the Environmental Quality Standardsfor Surface Water in China (MEPC, 2002). The observed monthly hydrology and water quality data from2004 to 2016 were gathered from the Changjiang Water Resources Commission. Twenty parameters wereincluded: water level (Z, m), �ow rate (Q, m3 s− 1), water temperature (WT, °C), �ow velocity (U, m s− 1), pH,electrical conductance (EC, µS cm− 1), oxidation-reduction potential (ORP, mv), �uoride (F−, mg L− 1),suspended sediment (SS, mg L− 1), chloride (Cl−, mg L− 1), sulfate (SO2 − 4, mg L− 1), water hardness (mgL− 1), alkalinity (mg L− 1), permanganate index (PI, mg L− 1), dissolved oxygen (DO, mg L− 1), 5-daybiochemical dissolved oxygen demand (BOD5, mg L− 1), ammonium nitrogen (NH + 4-N, mg L− 1), nitrite-
nitrogen (NO − 2-N, mg L− 1), nitrate-nitrogen (NO − 3-N, mg L− 1), and total nitrogen (TN, mg L− 1). Here, thesum of NH + 4-N, NO − 2-N, and NO − 3-N refers to the DIN, and the difference between TN and DIN refersto residue-N, including particulate nitrogen and dissolved organic nitrogen. At the YC site, severalparameters, including �ow velocity, F−, SO2 − 4, PI, and BOD5, and observations before 2007 (Period )were unavailable.
One-way ANOVA was performed to explain the signi�cance of variations in N concentrations (NH + 4-N,NO − 2-N, NO − 3-N, and TN) in different temporal stages. The mutation points and trends of thesevariations were determined via the Mann–Kendall (MK) test. The relationships between various N formsand environmental variables were determined through redundancy analysis (RDA). In RDA, all data werelogarithmically transformed to eliminate the in�uence of extreme values on ordination scores. Pearsoncorrelation analysis was also applied for comparison.
2.3 N input, output, and retentionRocks are the major components of the riverbed along the main channel, so the direct groundwaterdischarge into the TGR can be ignored. Therefore, the total N input of the TGR mainly includes upstream,point source, and non-point source pollution inputs. Given the di�culties in obtaining detailed andcomprehensive data, the load of total N input (Lin) can be estimated based on the mass balance for theTGR as follows:
where RN is the annual N retained by the reservoir (%), which can be calculated on the basis of thetheoretical relationship proposed by Howarth et al. (1996):
Page 6/22
where H is the mean depth (m), and T is the water residence time (yr) estimated as
Where V is the effective reservoir volume (m3). Lout is the load of out�ow (YC site), which can becalculated as
where CN is the TN concentration (mg L−1), and t is the elapsed time.
3. Results3.1 General variation trend of hydrological and water quality regimes
Since the operation of the TGR began, the hydrological and water quality regimes have undergonesigni�cant temporal and spatial variations. The values of 16 environmental factors (except four N forms)in different impoundment periods and seasons are listed in Table s1. The three impoundmentsdramatically raised the water level and substantially decreased the suspended sediment concentration(Css) and �ow velocity in the TGR. Among the seven stations, the WX site suffered the most remarkableeffect of TGR operation, that is, the water level rose by 23.8 m, whereas �ow velocity and Css respectivelydropped by 46.7% and 84% from Period to Period (Table s1). One-way ANOVA revealed that the watertemperature and �ow rate in all stations exhibited no signi�cant trend (Table s2). The periodic mean pHvalues were greater than 8.0, and water alkalinity also increased over time. This result indicated that theoverlying water in the TGR would remain in a weak alkaline state in the long run. An overall rise in ionconcentration level was found during the three periods, with a sharp increase in Cl− and SO2 − 4, a slightincrease in F−, EC, and water hardness, especially at the WX site, the closest site to the TGD. The periodicaveraged ORP and DO concentrations shared a similar trend; they signi�cantly decreased from Period toPeriod and slightly increased in Period . During the monitoring period, the F−, DO, PI, and BOD5
concentrations were in the ranges of 0.07–1.05, 5.45–10.95, 0.55–32.59, and 0.20–2.41 mg L− 1,respectively. Although the inter-annual variations in these four parameters showed different trends, the F−,DO, and BOD5 concentrations in all the stations reached the requirement of Class standard (MEPC,
2002). The PI concentration was lower than the Class standard (6 mg L− 1), but it met the Class standard (4 mg L− 1), indicating an overall water quality improvement after the TGR impoundment.
Through the anti-seasonal reservoir operation, the water level in the dry season was higher than that inthe rainy season (low-water level season or June–September). The �ow rate, �ow velocity, watertemperature, and Css were the highest in the low-water level season because of frequent �ooding in
Page 7/22
summer (Table s1). In addition to pH, ORP, Cl−, and BOD5, other water quality parameters exhibited
signi�cant seasonal changes; among them, water hardness, water alkalinity, EC, F−, SO2 − 4, and DO werethe highest in the impounding season and the lowest in the low-water level season (Table s2).3.2 Spatial-temporal variation in N in the TGR basin
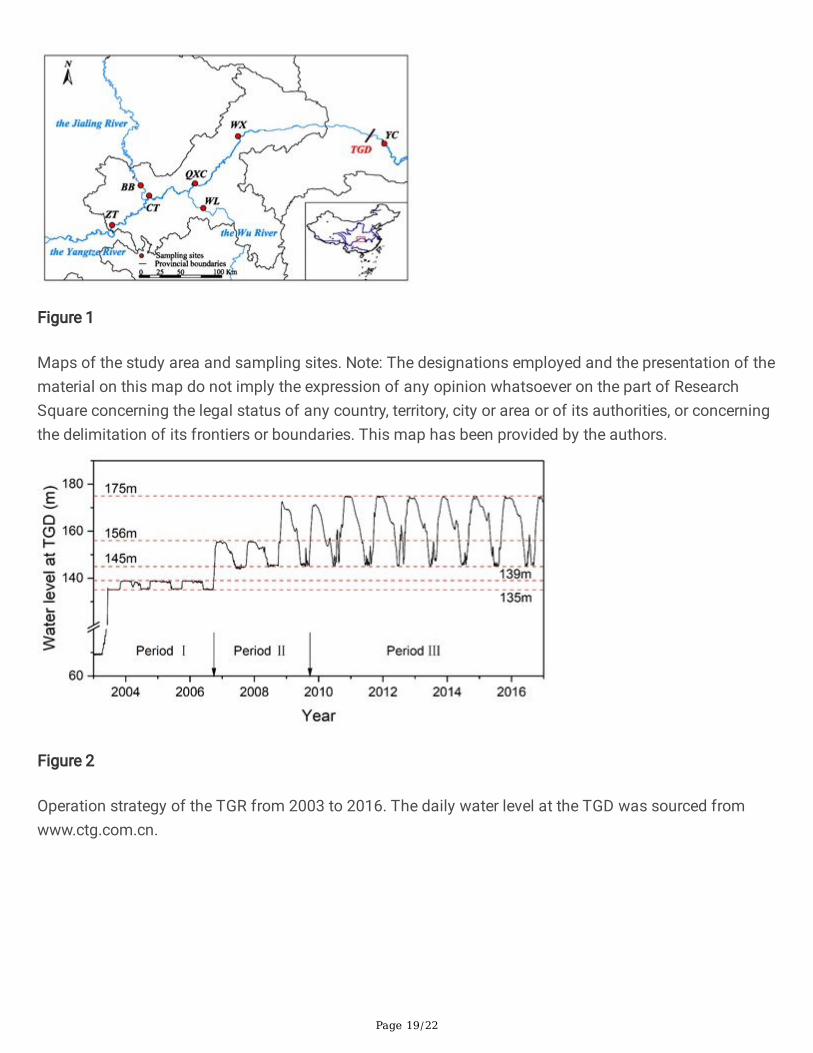
Although the overall water quality has been improved, N pollution in the TGR is severe and aggravated. Asshown in Fig. 3, the TN concentration in almost all stations reached or was even worse than the Class standard (> 2 mg L− 1; MEPC, 2002). The TN concentrations signi�cantly increased toward the TGD in themainstream from 1.57 mg L− 1 at the ZT site to 1.86 mg L− 1 at the WX site. The DIN is the existingprimary form of TN, which mainly consisted of NO − 3-N (80–91%) and some NH + 4-N (2–10%) and NO − 2-N (< 2%). The percentage of NO − 3-N increased gradually from upstream (80.2% at ZT) todownstream (85.5% at WX) in the mainstream. On a multi-year average, the TN concentration was 2.43mg L− 1 in the Wu River (WL station) and 2.01 mg L− 1 in the Jialing River (BB station), indicating relativelyhigher TN concentrations in tributaries than in the mainstream. Similar to the mainstream of YangtzeRiver, tributaries dominantly had NO − 3-N, which accounted for 91.0% of TN at the WL station and 81.5%at the BB station. Besides, the multi-year averaged TN concentration decreased slightly in the outlet (1.83mg L− 1 at the YC station), whereas NO − 3-N took more part of TN form (87.5%) than that in the middleregion of TGR (85.5% at the WX station).
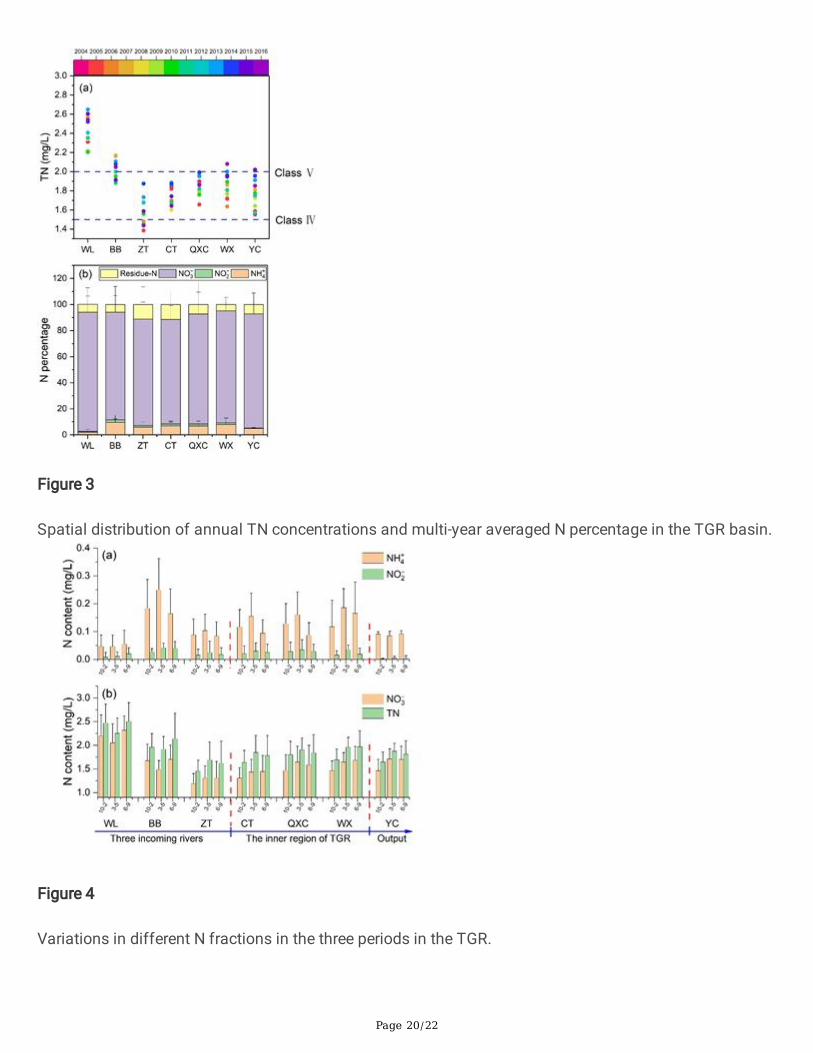
In the long term, the TN concentration in the tail region was less affected by the construction andoperation of the TGR without an evident trend in the staged TN concentrations, but it notably increased inthe middle region (WX site) and outlet (YC site; Table s2). By contrast, the concentrations of N fractionssigni�cantly changed because of the considerable variations in the hydrologic regime in the threeimpoundments (Period to Period ). In Fig. 4, the NO − 3-N concentration in the mainstream of the TGRcontinuously increased, whereas the NH + 4-N concentration decreased. These similar trends wereobserved at the WL site; however, the NH + 4-N increased in Period at the BB site compared with that inPeriod . The staged averaged NO3-N and NH + 4-N concentrations at the YC station in Period werehigher than those in Period . Besides, the concentrations of NO − 2-N in the seven stations were relativelylower than those of the other N forms, and the varying trend was not evident.
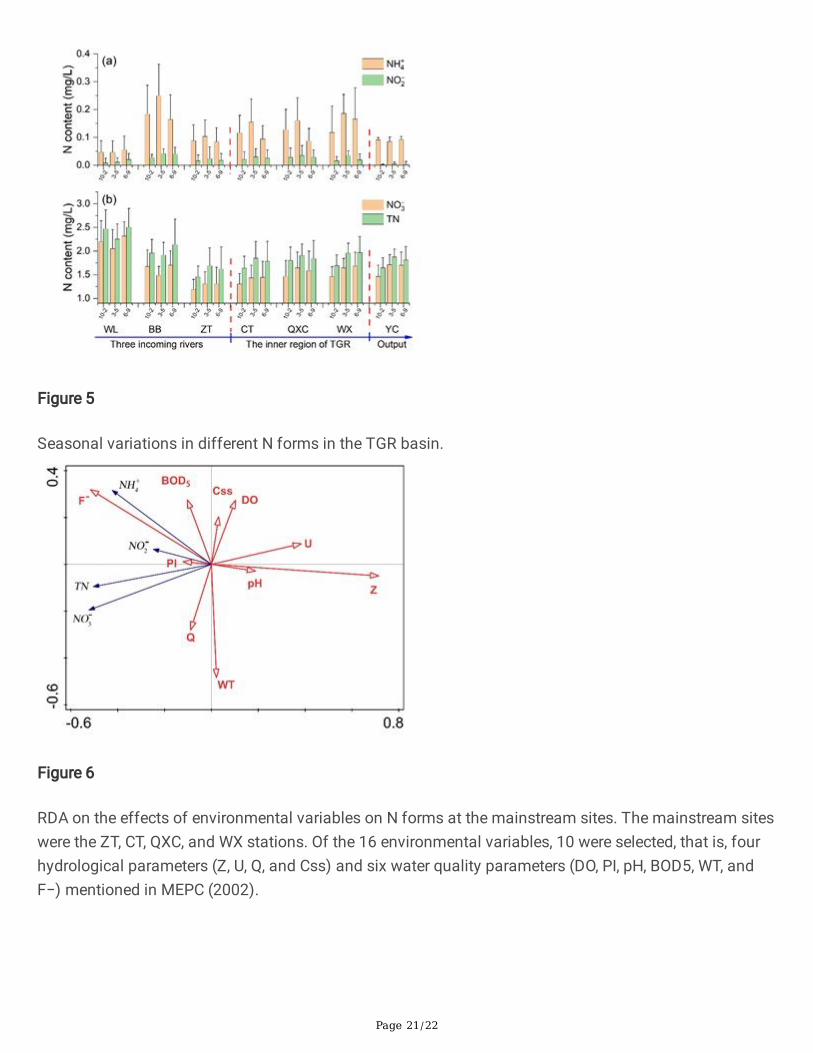
The temporal variations in N concentrations displayed dramatic seasonality patterns (Fig. 5). The highestconcentration of NH + 4-N was observed in the sluicing season (March–May), and the maximum ratio of3.8 in the two other seasons occurred at the WX site in 2014. Although extreme differences were found inseveral years, no clear trend in the seasonal concentrations of NO − 2-N, especially in the tail region (p > 0.05), was detected. The concentrations of NO − 3-N and TN were one order magnitude higher than thoseof NH + 4-N and NO − 2-N, and ANOVA revealed that their seasonal variations were signi�cant. Theconcentrations of the NO − 3-N and TN were the lowest in the impounding season and relatively high inthe two other seasons. This event reoccurred in each year at the WX site within the TGR, especially in2008 when the TN concentration in the low-water level season (2.12 mg L− 1) was approximately 1.42times that in the impounding season (1.50 mg L− 1).
Page 8/22
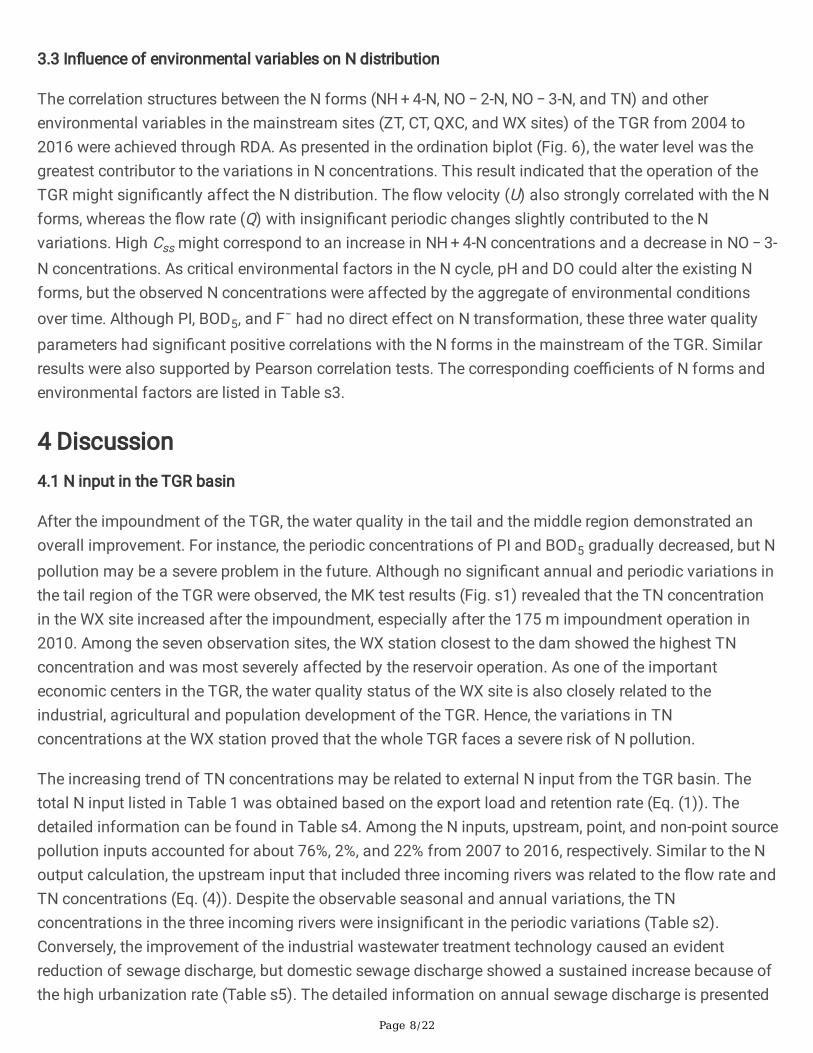
3.3 In�uence of environmental variables on N distribution
The correlation structures between the N forms (NH + 4-N, NO − 2-N, NO − 3-N, and TN) and otherenvironmental variables in the mainstream sites (ZT, CT, QXC, and WX sites) of the TGR from 2004 to2016 were achieved through RDA. As presented in the ordination biplot (Fig. 6), the water level was thegreatest contributor to the variations in N concentrations. This result indicated that the operation of theTGR might signi�cantly affect the N distribution. The �ow velocity (U) also strongly correlated with the Nforms, whereas the �ow rate (Q) with insigni�cant periodic changes slightly contributed to the Nvariations. High Css might correspond to an increase in NH + 4-N concentrations and a decrease in NO − 3-N concentrations. As critical environmental factors in the N cycle, pH and DO could alter the existing Nforms, but the observed N concentrations were affected by the aggregate of environmental conditionsover time. Although PI, BOD5, and F− had no direct effect on N transformation, these three water qualityparameters had signi�cant positive correlations with the N forms in the mainstream of the TGR. Similarresults were also supported by Pearson correlation tests. The corresponding coe�cients of N forms andenvironmental factors are listed in Table s3.
4 Discussion4.1 N input in the TGR basin
After the impoundment of the TGR, the water quality in the tail and the middle region demonstrated anoverall improvement. For instance, the periodic concentrations of PI and BOD5 gradually decreased, but Npollution may be a severe problem in the future. Although no signi�cant annual and periodic variations inthe tail region of the TGR were observed, the MK test results (Fig. s1) revealed that the TN concentrationin the WX site increased after the impoundment, especially after the 175 m impoundment operation in2010. Among the seven observation sites, the WX station closest to the dam showed the highest TNconcentration and was most severely affected by the reservoir operation. As one of the importanteconomic centers in the TGR, the water quality status of the WX site is also closely related to theindustrial, agricultural and population development of the TGR. Hence, the variations in TNconcentrations at the WX station proved that the whole TGR faces a severe risk of N pollution.
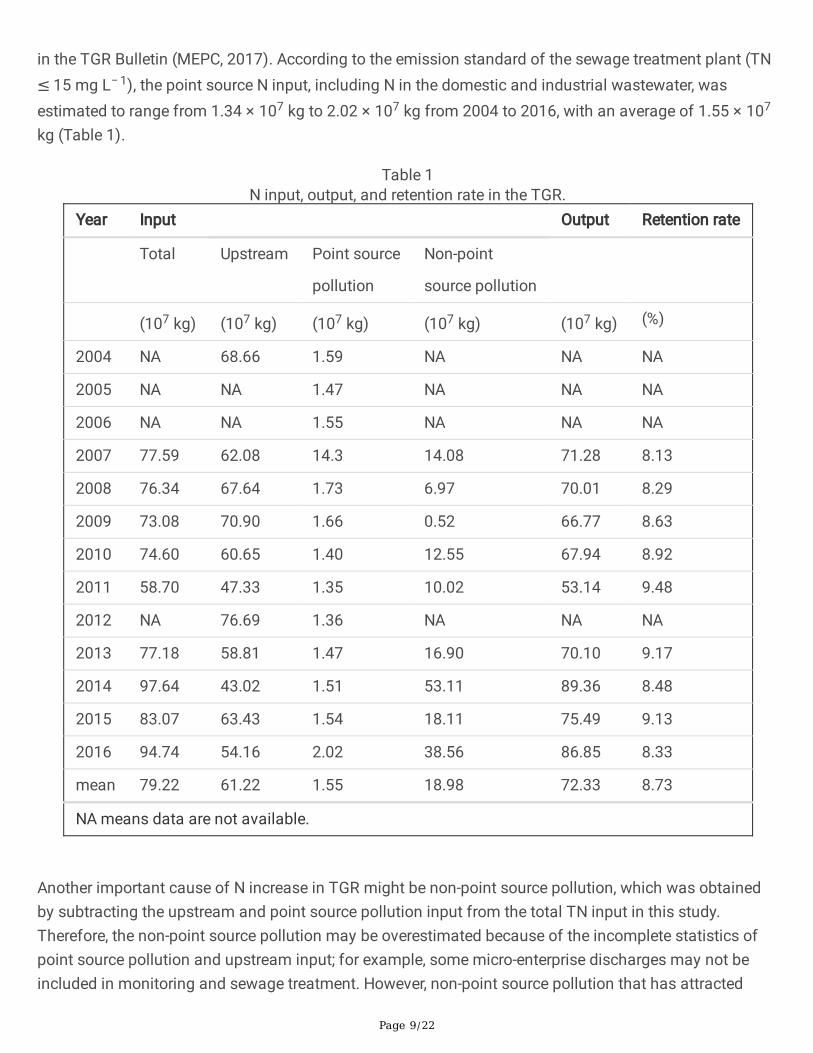
The increasing trend of TN concentrations may be related to external N input from the TGR basin. Thetotal N input listed in Table 1 was obtained based on the export load and retention rate (Eq. (1)). Thedetailed information can be found in Table s4. Among the N inputs, upstream, point, and non-point sourcepollution inputs accounted for about 76%, 2%, and 22% from 2007 to 2016, respectively. Similar to the Noutput calculation, the upstream input that included three incoming rivers was related to the �ow rate andTN concentrations (Eq. (4)). Despite the observable seasonal and annual variations, the TNconcentrations in the three incoming rivers were insigni�cant in the periodic variations (Table s2).Conversely, the improvement of the industrial wastewater treatment technology caused an evidentreduction of sewage discharge, but domestic sewage discharge showed a sustained increase because ofthe high urbanization rate (Table s5). The detailed information on annual sewage discharge is presented
Page 9/22
in the TGR Bulletin (MEPC, 2017). According to the emission standard of the sewage treatment plant (TN ≤ 15 mg L− 1), the point source N input, including N in the domestic and industrial wastewater, wasestimated to range from 1.34 × 10⁷ kg to 2.02 × 10⁷ kg from 2004 to 2016, with an average of 1.55 × 10⁷
kg (Table 1).
Table 1N input, output, and retention rate in the TGR.
Year Input Output Retention rate
Total Upstream Point source
pollution
Non-point
source pollution
(107 kg) (107 kg) (107 kg) (107 kg) (107 kg) (%)
2004 NA 68.66 1.59 NA NA NA
2005 NA NA 1.47 NA NA NA
2006 NA NA 1.55 NA NA NA
2007 77.59 62.08 14.3 14.08 71.28 8.13
2008 76.34 67.64 1.73 6.97 70.01 8.29
2009 73.08 70.90 1.66 0.52 66.77 8.63
2010 74.60 60.65 1.40 12.55 67.94 8.92
2011 58.70 47.33 1.35 10.02 53.14 9.48
2012 NA 76.69 1.36 NA NA NA
2013 77.18 58.81 1.47 16.90 70.10 9.17
2014 97.64 43.02 1.51 53.11 89.36 8.48
2015 83.07 63.43 1.54 18.11 75.49 9.13
2016 94.74 54.16 2.02 38.56 86.85 8.33
mean 79.22 61.22 1.55 18.98 72.33 8.73
NA means data are not available.
Another important cause of N increase in TGR might be non-point source pollution, which was obtainedby subtracting the upstream and point source pollution input from the total TN input in this study.Therefore, the non-point source pollution may be overestimated because of the incomplete statistics ofpoint source pollution and upstream input; for example, some micro-enterprise discharges may not beincluded in monitoring and sewage treatment. However, non-point source pollution that has attracted
Page 10/22
more attention plays a vital role in the cumulative increase in TN (Alexander et al., 2002; Ma et al., 2011).In addition to natural N �xation through natural vegetation and atmospheric lightning, drasticallyincreased human activities have strongly in�uenced N loads in the TGR basin (Boyer et al., 2006; Chen etal., 2016; Galloway et al., 2008; Xv et al., 2020). With expanding population and agricultural activity,chemical fertilizers have been excessively utilized in China, and approximately 53.2% were N fertilizers inthe TGR basin from 2004 to 2016 (NBSCC, 2017). In the entire TGR, the incremental net N fertilizer rangesfrom 294.0 × 10⁶ kg to 332.2 × 10⁶ kg, with an average of 320.5 × 10⁶ kg N (Table s5). The massive useof N fertilizer has become a crucial N source, accounting for more than 50% of the net anthropogenicregional N input (NANI), followed by atmospheric N deposition, feed nitrogen input, and crop �xation(Ding et al., 2020; Xv et al., 2020). According to data from hundreds of observational sites, the average Nwet deposition over China increased by nearly 25% from the 1990s to the 2000s (Jia et al., 2015). Asimilar increasing trend also occurred in the TGR basin, where atmospheric N deposition increased by22% from 2006 to 2016 (Table s5). This variation could be attributed to the exponential increase inenergy consumption and industrial waste gas (Table s6), identi�ed as potential sources of atmospheric Ndeposition (Wang et al., 2018). Moreover, crops have been increasing since the 2006 drought, and the useof feed N has increased with the exponentially growing population and economy in Chongqing (Tables6). Under rainfall and irrigation actions, considerable non-point source N likely enters the water columnthrough surface runoff, subsurface �ow, farmland drainage, seepage (Gao et al., 2016b), and frequent�ooding caused by reservoir operation aggravates the loss of N.
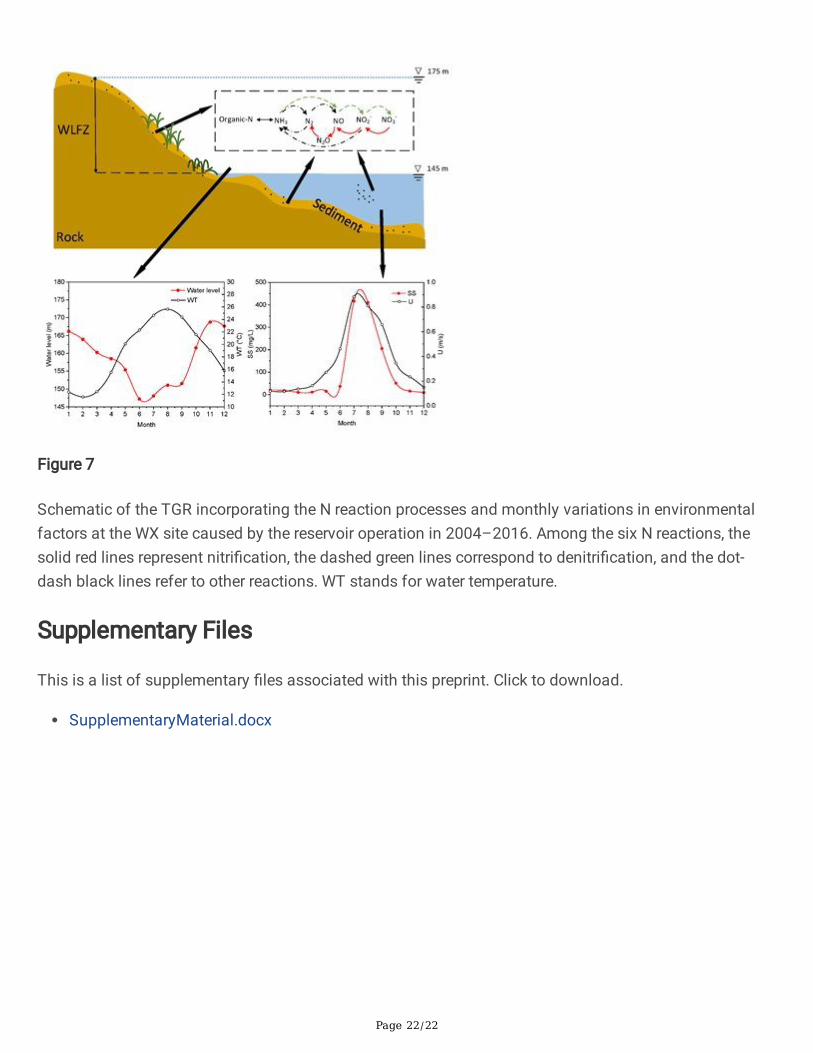
4.2 Impact of the water level variations in the TGR on N transformationInternal biogeochemical transformations, including 14 discrete redox reactions that can convert N redoxstates from − 3 to + 5, are more complex and unpredictable based on our current understanding than thedetermined external N inputs in the TGR (Kuypers et al., 2018). These reactions (Fig. 7) were susceptibleto environmental factors and likely to be altered by large water level �uctuations (145–175 m) and thecorresponding dramatic environmental changes, resulting in the variations in N forms. The strong impactof environmental variables was also demonstrated by the result of RDA (Fig. 6).
Although the water dilution effect caused by the impoundment can alleviate pollution (Jiang et al., 2018),the periodic mean NO − 3-N and TN concentrations continuously increased during three impoundments,indicating the greater effect of the ever-increasing external input from a long run. However, the change inthe proportion of N forms caused by reservoir storage could not be ignored. For example, the NH + 4-Nconcentration decreased signi�cantly when the concentrations of other N forms increased (Fig. 4). Duringthe three impoundments, the water area of the TGR basin, which was about 2.53 times at 175 m (1084km2) than at 135 m (428 km2), increased as the water level rose, leading to a sharp increase in the water-sediment interface (Wang et al., 2020). This increased interface area would provide larger places for Ncycling and facilitate the entry of N to the waterbody. An anti-seasonal hydrological regime may bringabout more marked differences in N distribution in a year than the long-term effects of the threeimpoundment periods.
Page 11/22
In a low-water level season, a water level �uctuation zone (WLFZ) of about 350 km2 along the reservoirbecomes exposed; in the WLFZ, carbon and N contents in soil are high because of the continuousaccumulation of organic matter (Wang et al., 2020; Ye et al., 2011). In this season, high temperature isfavorable to the growth of plants in the WLFZ, where more than 80 species of vascular plants wererecovered in 2015 (MEPC, 2017); thus, the absorption and utilization of bioavailable N forms arepromoted (Ye et al., 2015). The corresponding water temperature is suitable for nitri�cation; at thistemperature, the involved microorganisms generally have greater abundance and diversity (Kuypers et al.,2018). The low-water level season of the TGR is consistent with the rainy season of the Yangtze River(May–October). Thus, the increased rainfall and frequent �ood in the upper reaches of the Yangtze Riverand the TGR basin could lead to an increase in the �ow velocity in this season by one order of magnitudecompared with those in the impounding season (Fig. 7). The increased water velocity strengthens thedisturbance to the bottom of the river and promotes the ammoni�cation of organic N with oxygenreplenishment in the water-sediment surface (Yu et al., 2019); this phenomenon may partially explain thehigher NH + 4-N concentration in the sluicing and low-water level seasons. On the other hand, the stronghydrodynamic disturbance facilitates the suspension of sediments, while the nitri�cation rate enhancesas Css increases (Wang et al., 2010). The SS is possibly an anoxic/low-oxygen microsite, so couplednitri�cation-denitri�cation may occur in the water column (Xia et al., 2017), and nitrate produced throughnitri�cation at SS can be converted into dinitrogen gas (N2) through denitri�cation. This N loss
enhancement is approximate 25–120% caused by 1 g L− 1 SS in the Yangtze River (Xia et al., 2017).Although the release amount is relatively small, nitrous oxide (N2O) is the primary ozone-depleting agentand potent greenhouse gas that profoundly affects the ecological environment (Kuypers et al., 2018; Shiet al., 2020).
When the water level remains high (impoundment season), the short-term vegetation in the �uctuatingzone becomes submerged, decomposes, and releases N, thereby increasing the risk of eutrophication ofthe TGR during the impoundment season. For example, 81.1 kg N ha− 1 was released from nine dominantplant species after 200 days of soaking in the WLFZ (Xiao et al., 2017). The high hydrostatic pressurecaused by the large water depth signi�cantly increased the release and ammoni�cation of N but slightlyaffected nitrate reductase activity (denitri�cation); consequently, NH + 4-N and NO − 3-N accumulate (Chaiet al., 2009). However, the concentrations of NO − 3-N and TN were the lowest in the impounding season.This phenomenon may be caused by many factors; among them, the dilution effect might make thegreatest contribution to reducing N concentrations because of the dramatically increased storagecapacity from 1.71 × 10⁹ m3 to 3.93 × 10⁹ m3, comparing to the relatively insigni�cant variations in Ninput in the short term. Besides, the reduced water velocity could weaken the entry of N into the waterbody and prolong the residence time of water in the TGR (Shi et al., 2020). In the reach from the ZT to theWX site, the water residence time increased from 2.69 days in the low-water level season to 30.27 days inthe impoundment season in 2016. The observably extended water residence time accelerates N removalfrom a waterbody (Keys et al., 2019; Saunders and Kalff, 2001; Tong et al., 2019). However, a decrease inCss provides fewer places for coupled nitri�cation-denitri�cation processes, and these processes are alsoinhibited by low temperature in the impoundment season (Palacin-Lizarbe et al., 2018). The nitri�cation
Page 12/22
rate decreases rapidly when the temperature is lower than 15°C and nearly stops below 5°C. Similarly, thedenitri�cation rates immediately decrease with both cooling and lower reactive nitrogen load (Palacin-Lizarbe et al., 2018).
The reservoir operation has regulated the water level and resulted in dramatic environmental variations.Further developments about the relationship between N cycling and other environmental factors are stillneeded to help explain the N variation caused by the reservoir operation and eventually improve thepredictions and management of the water quality in the Yangtze River.
5. ConclusionIn this study, data on 20 hydrological and water quality parameters of seven gaging stations in the TGRbasin were collected from 2004 to 2016. The operation of the TGR signi�cantly changed the hydrologicalregime of natural rivers, improving the water level while decreasing the Css and water velocity. Theimpoundment alleviated the water pollution and reduced the PI and BOD5 concentrations, but the TNconcentration still met or was even worse than the Class standard of China. The multi-year averaged TNconcentration increased along the mainstream of the Yangtze River, but it was still lower than that in theincoming Wu River (2.43 mg/L) and Jialing River (2.01 mg/L). The DIN was the most abundant N form,which consisted of NO− 3-N (80%–91%) and some NH+ 4-N (2%–10%), and NO− 2-N (<2%). The Ndistribution at different temporal levels was subjected to synthesis analysis. No evident trend was foundin the periodic TN concentrations except at the WX and YC sites, whereas other DIN forms markedlychanged. The anti-seasonal reservoir operation signi�cantly caused the seasonal variations in different Nforms. Among them, the NO− 3-N and TN concentrations were the lowest in the impoundment season,whereas the NH+ 4-N concentrations were the highest in the sluicing season.
External input and internal transformation contribute to variations in N distribution. The continuous long-term increase in the TN concentrations of the TGR was the integrated result of the upstream, non-point,and point source pollution inputs, which accounted for 76%, 22%, and 2%, respectively. In terms ofinternal transformation, the RDA results revealed that the water level regulated by the anti-seasonalreservoir operation had the highest correlation with the variations in N forms. In the low-water levelseason, high water temperature, �ow velocity, and Css would enhance the N release from the water-sediment interface and promote the coupled nitri�cation-denitri�cation process. In the impoundmentseason, the dilution effect and low N reaction rate might jointly result in the lowest NO− 3-N and TNconcentrations.
Further studies on the impact of reservoir operation based on long-term observation and analysis willpromote an accurate and comprehensive understanding of N distribution and improve the assessmentand prediction of the water quality of the TGR and the Yangtze River.
Declarations
Page 13/22
Ethics approval and consent to participate
All the authors have read and approved the manuscript and consented to participation.
Consent for publication
All the authors have consented to publication.
Availability of data and materials
All the data and materials in the manuscript are available upon request.
Competing interests
The authors declare no competing interests.
Funding
This work was supported in part by the National Key Research and Development Program of China(No.2016YFA0600901), National Natural Science Foundation of China (No. 518979197).
Authors' contributions
Bei Nie: Conceptualization, Formal analysis, Visualization, Writing- Original draft preparation
Yuhong Zeng: Supervision, Writing- Reviewing and Editing, Funding acquisition
Lanhua Niu: Resources
Xiaofeng Zhang: Project administration, Funding acquisition
Acknowledgements
We appreciate the valuable comments and suggestions of the journal editors and anonymous reviewers.The authors also thank the Changjiang Water Resources Commission for providing the unique researchdataset.
ReferencesAlexander, R.B., Johnes, P.J., Boyer, E.W., Smith, R.A., 2002. A Comparison of Models for Estimating theRiverine Export of Nitrogen from Large Watersheds. Biogeochemistry 57/58(1), 295-339.
Boyer, E.W., Alexander, R.B., Parton, W.J., Li, C., Butterbach-Bahl, K., Donner, S.D., Skaggs, R.W., Del, G.S.,2006. Modeling denitri�cation in terrestrial and aquatic ecosystems at regional scales. Ecol. Appl. 16(6),2123-2142.

Page 14/22
Boyer, E.W., Howarth, R.W., Galloway, J.N., Dentener, F.J., Green, P.A., Vörösmarty, C.J., 2006. Riverinenitrogen export from the continents to the coasts. Global Biogeochem. Cy. 20(1).
Chai, B., Huang, T., Zhao, X., Li, Y., 2016. Effects of Hydrostatic Pressure on the NitrogenCycle ofSediment. Pol. J. Environ. Stud. 25(6), 2293-2304.
Chai, C., Yu, Z., Shen, Z., Song, X., Cao, X., Yao, Y., 2009. Nutrient characteristics in the Yangtze RiverEstuary and the adjacent East China Sea before and after impoundment of the Three Gorges Dam. Sci.Total Environ. 407(16), 4687-4695.
Chen, F., Hou, L., Liu, M., Zheng, Y., Yin, G., Lin, X., Li, X., Zong, H., Deng, F., Gao, J., Jiang, X., 2016. Netanthropogenic nitrogen inputs (NANI) into the Yangtze River basin and the relationship with riverinenitrogen export. Journal of Geophysical Research: Biogeosciences 121(2), 451-465.
Chen, J., Wang, P., Wang, C., Wang, X., Miao, L., Liu, S., Yuan, Q., 2019. Dam construction alters functionand community composition of diazotrophs in riparian soils across an environmental gradient. SoilBiology and Biochemistry 132, 14-23.
Dai, Z., Du, J., Zhang, X., Su, N., Li, J., 2011. Variation of Riverine Material Loads and EnvironmentalConsequences on the Changjiang (Yangtze) Estuary in Recent Decades (1955−2008). Environ. Sci.Technol. 45(1), 223-227.
Ding, S., Chen, P., Liu, S., Zhang, G., Zhang, J., Dan, S.F., 2019. Nutrient dynamics in the Changjiang andretention effect in the Three Gorges Reservoir. J. Hydrol. 574, 96-109.
Ding X.,Wang Y., Han Y., Fu J., 2020. Evaluating of net anthropogenic nitrogen inputs and its in�uencingfactors in the Three Gorges Reservoir Area. China Environ Sci, 2020, 40(1): 206-216. (in Chinese)
Eiriksdottir, E.S., Oelkers, E.H., Hardardottir, J., Gislason, S.R., 2017. The impact of damming on riverine�uxes to the ocean: A case study from Eastern Iceland. Water Res. 113, 124-138.
Friedl, G., Wüest, A., 2002. Disrupting biogeochemical cycles - Consequences of damming. Aquat. Sci.64(1), 55-65.
Galloway, J.N., Townsend, A.R., Erisman, J.W., Bekunda, M., Cai, Z., Freney, J.R., Martinelli, L.A., Seitzinger,S.P., Sutton, M.A., 2008. Transformation of the Nitrogen Cycle: Recent Trends, Questions, and PotentialSolutions. Science (American Association for the Advancement of Science) 320(5878), 889-892.
Gao, Q., Li, Y., Cheng, Q., Yu, M., Hu, B., Wang, Z., Yu, Z., 2016. Analysis and assessment of the nutrients,biochemical indexes and heavy metals in the Three Gorges Reservoir, China, from 2008 to 2013. WaterRes. 92, 262-274.
Han, C., Zheng, B., Qin, Y., Ma, Y., Yang, C., Liu, Z., Cao, W., Chi, M., 2018. Impact of upstream river inputsand reservoir operation on phosphorus fractions in water-particulate phases in the Three Gorges
Page 15/22
Reservoir. Sci. Total Environ. 610-611, 1546-1556.
Huang, Y., Zhang, P., Liu, D., Yang, Z., Ji, D., 2014. Nutrient spatial pattern of the upstream, mainstreamand tributaries of the Three Gorges Reservoir in China. Environ. Monit. Assess. 186(10), 6833-6847.
Jia, Y., Yu, G., He, N., Zhan, X., Fang, H., Sheng, W., Zuo, Y., Zhang, D., Wang, Q., 2015. Spatial and decadalvariations in inorganic nitrogen wet deposition in China induced by human activity. Sci. Rep.-Uk 4(1).
Jiang, T., Wang, D., Wei, S., Yan, J., Liang, J., Chen, X., Liu, J., Wang, Q., Lu, S., Gao, J., Li, L., Guo, N., Zhao,Z., 2018. In�uences of the alternation of wet-dry periods on the variability of chromophoric dissolvedorganic matter in the water level �uctuation zone of the Three Gorges Reservoir area, China. Sci. TotalEnviron. 636, 249-259.
Keys, T. A., Caudill, M. F., & Scott, D. T. (2019). Storm effects on nitrogen �ux and longitudinal variability ina river–reservoir system. River Res. Appl. 35(6), 577-586.
Kim, H., Bae, H., Reddy, K.R., Ogram, A., 2016. Distributions, abundances and activities of microbesassociated with the nitrogen cycle in riparian and stream sediments of a river tributary. Water Res. 106,51-61.
Kuypers, M.M.M., Marchant, H.K., Kartal, B., 2018. The microbial nitrogen-cycling network. Nat. Rev.Microbiol. 16(5), 263-276.
Li, J., Dong, S., Yang, Z., Peng, M., Liu, S., Li, X., 2012. Effects of cascade hydropower dams on thestructure and distribution of riparian and upland vegetation along the middle-lower Lancang-MekongRiver. Forest Ecol. Manag. 284, 251-259.
Li, L., Shen, X., Jiang, M., 2017. Change characteristics of DSi and nutrition structure at the Yangtze RiverEstuary after Three Gorges Project impounding and their ecological effect. Arch. Environ. Prot. 43(2), 74-79.
Liu, X., Beusen, A.H.W., Van Beek, L.P.H., Mogollón, J.M., Ran, X., Bouwman, A.F., 2018. Exploringspatiotemporal changes of the Yangtze River (Changjiang) nitrogen and phosphorus sources, retentionand export to the East China Sea and Yellow Sea. Water Res. 142, 246-255.
Luo, G., Bu, F., Xu, X., Cao, J., Shu, W., 2011. Seasonal variations of dissolved inorganic nutrientstransported to the Linjiang Bay of the Three Gorges Reservoir, China. Environ. Monit. Assess. 173(1-4), 55-64.
Ma, X., Li, Y., Zhang, M., Zheng, F., Du, S., 2011. Assessment and analysis of non-point source nitrogenand phosphorus loads in the Three Gorges Reservoir Area of Hubei Province, China. Sci. Total Environ.412-413, 154-161.
Page 16/22
Maavara, T., Parsons, C.T., Ridenour, C., Stojanovic, S., Dürr, H.H., Powley, H.R., Van Cappellen, P., 2015.Global phosphorus retention by river damming. Proceedings of the National Academy of Sciences112(51), 15603-15608.
Maeck, A., DelSontro, T., McGinnis, D.F., Fischer, H., Flury, S., Schmidt, M., Fietzek, P., Lorke, A., 2013.Sediment Trapping by Dams Creates Methane Emission Hot Spots. Environ. Sci. Technol. 47(15), 8130-8137.
MEPC., 2002. Environmental Quality Standards for Surface Water (GB 3838-2002). Ministry ofEnvironmental Protection of China (in Chinese).
MEPC., 2017. Three Gorges Bulletin in 2005-2017. Ministry of Environmental Protection of China (inChinese).
NBSCC., 2017. China Statistical Yearbook in 2005-2017. National Bureau of Statistics of China (inChinese).
Nilsson, C., Reidy, C.A., Dynesius, M., Revenga, C., 2005. Fragmentation and �ow regulation of the world'slarge river systems. Science 308(5720), 405-408.
Palacin-Lizarbe, C., Camarero, L., Catalan, J., 2018. Denitri�cation Temperature Dependence in Remote,Cold, and N-Poor Lake Sediments. Water Resour. Res. 54(2), 1161-1173.
Povilaitis, A., Stålnacke, P., Vassiljev, A., 2012. Nutrient retention and export to surface waters inLithuanian and Estonian river basins. Hydrology Research 43(4), 359-373.
Ran, X., Bouwman, L., Yu, Z., Beusen, A., Chen, H., Yao, Q., 2017. Nitrogen transport, transformation, andretention in the Three Gorges Reservoir: A mass balance approach. Limnol. Oceanogr. 62(5), 2323-2337.
Saunders, D.L., Kalff, J., 2001. Nitrogen retention in wetlands, lakes and rivers. Hydrobiologia 443(1), 205-212.
Shi, W., Chen, Q., Zhang, J., Liu, D., Yi, Q., Chen, Y., Ma, H., Hu, L., 2020. Nitrous oxide emissions fromcascade hydropower reservoirs in the upper Mekong River. Water Res. 173, 115582.
Sun, C., Shen, Z., Liu, R., Xiong, M., Ma, F., Zhang, O., Li, Y., Chen, L., 2013. Historical trend of nitrogen andphosphorus loads from the upper Yangtze River basin and their responses to the Three Gorges Dam.Environ. Sci. Pollut. R. 20(12), 8871-8880.
Sun, C.C., Shen, Z.Y., Xiong, M., Ma, F.B., Li, Y.Y., Chen, L., Liu, R.M., 2013. Trend of dissolved inorganicnitrogen at stations downstream from the Three-Gorges Dam of Yangtze River. Environ. Pollut. 180, 13-18.
Page 17/22
Tang, Q., Collins, A.L., Wen, A., He, X., Bao, Y., Yan, D., Long, Y., Zhang, Y., 2018. Particle size differentiationexplains �ow regulation controls on sediment sorting in the water-level �uctuation zone of the ThreeGorges Reservoir, China. Sci. Total Environ. 633, 1114-1125.
Tong, Y., Li, J., Qi, M., Zhang, X., Wang, M., Liu, X., Zhang, W., Wang, X., Lu, Y., Lin, Y., 2019. Impacts ofwater residence time on nitrogen budget of lakes and reservoirs. Sci. Total Environ. 646, 75-83.
Wang, C., Fang, F., Yuan, Z., Zhang, R., Zhang, W., Guo, J., 2020. Spatial variations of soil phosphorusforms and the risks of phosphorus release in the water-level �uctuation zone in a tributary of the ThreeGorges Reservoir. Sci. Total Environ. 699, 134124.
Wang, F., 2020. Impact of a large sub-tropical reservoir on the cycling of nutrients in a river. Water Res.186, 116363.
Wang, H., Shen, Z., Guo, X., Niu, J., Kang, B., 2010. Ammonia adsorption and nitritation in sedimentsderived from the Three Gorges Reservoir, China. Environ. Earth Sci. 60(8), 1653-1660.
Wang, H., Shi, G., Tian, M., Chen, Y., Qiao, B., Zhang, L., Yang, F., Zhang, L., Luo, Q., 2018. Wet depositionand sources of inorganic nitrogen in the Three Gorges Reservoir Region, China. Environ. Pollut. 233, 520-528.
Wang, Y., Ao, L., Lei, B., Zhang, S., 2015. Assessment of Heavy Metal Contamination from Sediment andSoil in the Riparian Zone China’s Three Gorges Reservoir. Pol. J. Environ. Stud. 24, 2253-2259.
Wang, Y.C., 2015. Phosphorus Fractions and Its Summer's Release Flux from Sediment in the China'sThree Gorges Reservoir. J. Environ. Inform. 25(1), 36-45.
Xia, J., Xu, G., Guo, P., Peng, H., Zhang, X., Wang, Y., Zhang, W., 2018. Tempo-Spatial Analysis of WaterQuality in the Three Gorges Reservoir, China, after its 175-m Experimental Impoundment. Water Resour.Manag. 32(9), 2937-2954.
Xia, X., Liu, T., Yang, Z., Michalski, G., Liu, S., Jia, Z., Zhang, S., 2017. Enhanced nitrogen loss from riversthrough coupled nitri�cation-denitri�cation caused by suspended sediment. Sci. Total Environ. 579, 47-59.
Xiao, L., Zhu, B., Nsenga Kumwimba, M., Jiang, S., 2017. Plant soaking decomposition as well as nitrogenand phosphorous release in the water-level �uctuation zone of the Three Gorges Reservoir. Sci. TotalEnviron. 592, 527-534.
Xu, K., Milliman, J.D., 2009. Seasonal variations of sediment discharge from the Yangtze River before andafter impoundment of the Three Gorges Dam. Geomorphology 104(3-4), 276-283.
Xv, H., Xing, W., Yang, P., Ao, C., 2020. Regional estimation of net anthropogenic nitrogen inputs (NANI)and the relationships with socioeconomic factors. Environ. Sci. Pollut. R.
Page 18/22
Yan, Q., Bi, Y., Deng, Y., He, Z., Wu, L., Van Nostrand, J.D., Shi, Z., Li, J., Wang, X., Hu, Z., Yu, Y., Zhou, J.,2015. Impacts of the Three Gorges Dam on microbial structure and potential function. Sci. Rep.-Uk 5(1).
Yang, H.F., Yang, S.L., Xu, K.H., Milliman, J.D., Wang, H., Yang, Z., Chen, Z., Zhang, C.Y., 2018. Humanimpacts on sediment in the Yangtze River: A review and new perspectives. Global Planet. Change 162, 8-17.
Yang, S.L., Milliman, J.D., Xu, K.H., Deng, B., Zhang, X.Y., Luo, X.X., 2014. Downstream sedimentary andgeomorphic impacts of the Three Gorges Dam on the Yangtze River. Earth-Sci. Rev. 138, 469-486.
Ye, C., Chen, C., Butler, O.M., Rashti, M.R., Esfandbod, M., Du, M., Zhang, Q., 2019. Spatial and temporaldynamics of nutrients in riparian soils after nine years of operation of the Three Gorges Reservoir, China.Sci. Total Environ. 664, 841-850.
Ye, C., Cheng, X., Liu, W., Zhang, Q., 2015. Revegetation impacts soil nitrogen dynamics in the water level�uctuation zone of the Three Gorges Reservoir, China. Sci. Total Environ. 517, 76-85.
Ye, C., Li, S., Zhang, Y., Zhang, Q., 2011. Assessing soil heavy metal pollution in the water-level-�uctuationzone of the Three Gorges Reservoir, China. J. Hazard. Mater. 191(1-3), 366-372.
Yu, J., Zhang, Y., Zhong, J., Ding, H., Zheng, X., Wang, Z., Zhang, Y., 2020a. Water-level alterations modi�ednitrogen cycling across sediment-water interface in the Three Gorges Reservoir. Environ. Sci. Pollut. R.27(21), 25886-25898.
Yu, J., Zhang, Y., Zhong, J., Ding, H., Zheng, X., Wang, Z., Zhang, Y., 2020b. Water-level alterations modi�ednitrogen cycling across sediment-water interface in the Three Gorges Reservoir. Environ. Sci. Pollut. R.27(21), 25886-25898.
Zheng, B., Zhao, Y., Qin, Y., Ma, Y., Han, C., 2016. Input characteristics and sources identi�cation ofnitrogen in the three main tributaries of the Three Gorges Reservoir, China. Environ. Earth Sci. 75(17).
Zhou, J., Zhang, M., Lu, P., 2013. The effect of dams on phosphorus in the middle and lower Yangtze river.Water Resour. Res. 49(6), 3659-3669.
Zhu, L., Zhou, H., Xie, X., Li, X., Zhang, D., Jia, L., Wei, Q., Zhao, Y., Wei, Z., Ma, Y., 2018. Effects of�oodgates operation on nitrogen transformation in a lake based on structural equation modelinganalysis. Sci. Total Environ. 631-632, 1311-1320.
Figures
Page 19/22
Figure 1
Maps of the study area and sampling sites. Note: The designations employed and the presentation of thematerial on this map do not imply the expression of any opinion whatsoever on the part of ResearchSquare concerning the legal status of any country, territory, city or area or of its authorities, or concerningthe delimitation of its frontiers or boundaries. This map has been provided by the authors.
Figure 2
Operation strategy of the TGR from 2003 to 2016. The daily water level at the TGD was sourced fromwww.ctg.com.cn.
Page 20/22
Figure 3
Spatial distribution of annual TN concentrations and multi-year averaged N percentage in the TGR basin.
Figure 4
Variations in different N fractions in the three periods in the TGR.
Page 21/22
Figure 5
Seasonal variations in different N forms in the TGR basin.
Figure 6
RDA on the effects of environmental variables on N forms at the mainstream sites. The mainstream siteswere the ZT, CT, QXC, and WX stations. Of the 16 environmental variables, 10 were selected, that is, fourhydrological parameters (Z, U, Q, and Css) and six water quality parameters (DO, PI, pH, BOD5, WT, andF−) mentioned in MEPC (2002).
Page 22/22
Figure 7
Schematic of the TGR incorporating the N reaction processes and monthly variations in environmentalfactors at the WX site caused by the reservoir operation in 2004–2016. Among the six N reactions, thesolid red lines represent nitri�cation, the dashed green lines correspond to denitri�cation, and the dot-dash black lines refer to other reactions. WT stands for water temperature.
Supplementary Files
This is a list of supplementary �les associated with this preprint. Click to download.
SupplementaryMaterial.docx