Embed Size (px)
Citation preview
Economic and Financial Affairs
ISSN 2443-8014 (online)
Post-Programme Surveillance Report
Portugal, Summer 2018
INSTITUTIONAL PAPER 087 | SEPTEMBER 2018
EUROPEAN ECONOMY
European Economy Institutional Papers are important reports analysing the economic situation and economic developments prepared by the European Commission's Directorate-General for Economic and Financial Affairs, which serve to underpin economic policy-making by the European Commission, the Council of the European Union and the European Parliament. Views expressed in unofficial documents do not necessarily represent the views of the European Commission.
LEGAL NOTICE
Neither the European Commission nor any person acting on behalf of the European Commission is responsible for the use that might be made of the information contained in this publication. This paper exists in English only and can be downloaded from https://ec.europa.eu/info/publications/economic-and-financial-affairs-publications_en.
Luxembourg: Publications Office of the European Union, 2018
PDF ISBN 978-92-79-77468-3 ISSN 2443-8014 doi:10.2765/305795 KC-BC-18-019-EN-N
© European Union, 2018 Reuse is authorised provided the source is acknowledged. The reuse policy of European Commission documents is regulated by Decision 2011/833/EU (OJ L 330, 14.12.2011, p. 39). For any use or reproduction of material that is not under the EU copyright, permission must be sought directly from the copyright holders.
European Commission Directorate-General for Economic and Financial Affairs
Post-Programme Surveillance Report
Portugal, Summer 2018
EUROPEAN ECONOMY Institutional Paper 087
ACKNOWLEDGEMENTS
The report was prepared in the Directorate General Economic and Financial Affairs under the direction of
Servaas Deroose, Deputy Director General, Carlos Martínez Mongay, Director, and Christian Weise,
Head of Unit for Portugal.
Contributors:
Stefan Bohner, Duy Huynh-Olesen, Violeta Klyviene, Radoslav Krastev, Clément Reinvaldt, Nigel
Nagarajan (FISMA), Michal Strojwas (FISMA), Markus Wintersteller (FISMA), Miguel Amorim
(EMPL) and Aron Kiss (EMPL). Assistance was provided by Anastasia Kouskouni.
The Post-Programme Surveillance assessment of the report was prepared in liaison with the ECB.
This report reflects information available up until 23rd
August 2018.
ABBREVIATIONS
iii
ACE Allowance for Corporate Equity
BdP Banco de Portugal
BFL Budget Framework Law
CET1 Common Equity Tier 1
CGD Caixa Geral de Depósitos
CIT Corporate Income Tax
DBP Draft Budgetary Plan
DGAL Directorate-General
for Local Administration
DGO Directorate-General for Budget
DSA Debt Sustainability Analysis
EC European Commission
ECB European Central Bank
EDP Energias de Portugal
EPC Economic Policy Committee
EPL Employment Protection Legislation
ESM European Stability Mechanism
EU European Union
FAM Municipality Support Fund
FDI Foreign Direct Investment
GDP Gross Domestic Product
GFCF Gross Fixed Capital Formation
HICP Harmonised Index of Consumer
Prices
IGCP Portuguese Treasury and Debt
Management Agency
IMF International Monetary Fund
IMI Immovable Property Tax
IMPIC Institute for Monitoring Public
Procurement
INE National Statistical Office
IP Infraestruturas de Portugal
MIP Macroeconomic imbalance
procedure
MTO Medium term Objective
NFCs Non-financial Corporations
NPLs Non-performing loans
OECD Organisation for Economic Co-
operation and Development
PER Special Revitalisation Process for
Enterprises
PIT Personal Income Tax
PPS Post-programme surveillance
PPP public-private partnership
q-o-q Quarter on quarter
RoE Return on Equity
RoA Return on Assets
SGP Stability and Growth Pact
SMEs Small and Medium-sized Enterprises
SOEs State-owned Enterprises
ULC Unit Labour Costs
UTAM Technical Unit for the follow-up and
monitoring of state-owned
enterprises
UTAP Technical unit for the follow-up of
PPP projects
VAT Value Added Tax
y-o-y Year on year

EXECUTIVE SUMMARY
5
This report presents the findings of the eighth post-programme surveillance (PPS) mission of
Commission staff, in liaison with ECB staff, which took place in Lisbon during 4-12 June 2018. Since
the conclusion of the seventh post-programme surveillance mission in December 2017, growth has
moderated somewhat in line with developments in other EU markets. The short-term economic and
financial situation of Portugal remains largely favourable but the risks to the outlook have increased due
to the more uncertain external environment. Overall, Portugal’s economic adjustment is proceeding at a
steady pace. The country's indebtedness is decreasing and the fiscal position is improving. Nevertheless,
debt levels remain high and the positive momentum needs to be sustained. Some progress is also achieved
in structural reforms, particularly in the financial sector, but growth-enhancing reforms need to continue
in order to improve the economy’s convergence prospects and resilience to shocks.
Economic growth moderates but remains robust. Economic growth peaked at 2.7% in 2017, the highest
rate since 2000, and is expected to moderate to 2.2% in 2018 and 2.0% in 2019, according to the
Commission 2018 interim summer forecast. The economic growth is broad-based and is also benefiting
from a continuous positive cycle in tourism and a more recent recovery in the construction sector. The
labour market is expected to retain a strong, albeit slowing, rate of improvement, reflecting significant
employment growth in labour intensive sectors. Risks to the economic outlook are tilted to the downside
and have increased recently due to the uncertain external environment, including episodes of volatility in
European bond markets and heightened trade protectionism at global level.
Public finances have been improving but further fiscal consolidation will be important for ensuring a
steady decline in the still very high public debt level. Following a headline deficit outturn of 3.0% of
GDP in 2017 (0.9% of GDP net of the recapitalisation of Caixa Geral de Depósitos – CGD), the
Commission 2018 spring forecast projects deficits of 0.9% of GDP in 2018 and 0.6% of GDP in 2019.
However, the assessment of Stability and Growth Pact (SGP) compliance points to some deviation from
the requested structural adjustment effort in 2017 and to a risk of significant deviation for both 2018 and
2019, both on the basis of the Commission spring forecast and on the basis of the Stability Programme.
The commitment of the Portuguese authorities to use windfall gains to reduce the general government
debt ratio is therefore welcome. As such, the current favourable cyclical conditions together with the
decline in interest payments would be used to build up fiscal buffers. After falling by 4.2 percentage
points to 125.7% in 2017, the gross public debt-to-GDP ratio is projected to decrease further by around
3 percentage points per year in 2018 and 2019.
There remains a need for fiscal-structural reforms to continue. While the scope of the expenditure
review has been increasing, planned further steps still need to be specified and a comprehensive ex-post
evaluation of achievements is still outstanding. Cost-effectiveness continues to be promoted in the health
sector as a whole, but the recurrent accumulation of hospital arrears has been only temporarily
interrupted by clearance measures. The sustainability of the pension system appears ensured in the short-
term but adverse demographic developments pose challenges in the medium-term. While state-owned
enterprises continue to improve their operational results, their debt is still elevated and net results are
still negative.
Supported by the on-going economic recovery, Portugal’s banks have made significant progress in
strengthening their balance sheets, but vulnerabilities remain. They have continued to deleverage,
improved their capital positions, decreased non-performing loans, and further reduced costs. The
banking sector as a whole returned to profitability in 2017 after many loss-making years. Despite this
progress, the banking sector continues to be weighed down by low profitability, thin capital buffers, as
well as still high ratios of non-performing loans. Consequently, continued efforts by banks to further
improve their financial soundness and profitability as well as their internal governance are essential. A
critical challenge will be to maintain the momentum in the reduction of impaired assets, which weigh on
banks’ profitability, funding and capital costs. High rates of non-performing loans also hinder a more
efficient allocation of resources in the corporate sector and thus weaken investment and growth. Reforms
in the tax and judicial areas were undertaken to facilitate the restructuring of viable firms and expedite
6
the liquidation of non-viable ones; it is still too early to assess their effectiveness. While deleveraging
continues, credit to non-financial corporations is growing, with the increase driven by less-indebted
firms.
Structural reforms remain essential to boost potential growth and enhance the country's resilience to
shocks. Despite the improvement in the labour market and the progress reported in education, skill levels
remain relatively low, having a negative impact on productivity. The segmentation of the labour market
also remains a concern as the share of involuntary temporary contracts is high. To address the problem,
authorities initiated legal amendments aimed at restricting temporary contracts and strengthening
collective bargaining. However, this also entails risks that some temporary jobs may not be created
anymore. In the context of rising house prices and rents, the government has also initiated legislative
reforms addressing the main weaknesses on the housing market. The challenge is to keep the right
balance between protecting tenants and ensuring a more efficient use of the housing stock. In network
industries, the renegotiation of concession contracts is proceeding but it is too early to assess its impact.
The authorities aim to improve the business environment by a wide range of measures, including
continuing efforts for recapitalisation of potentially viable but highly indebted firms and support to
internationalisation of SMEs. An ambitious set of measures for administrative simplification is being
implemented which could contribute to decrease the burden on companies and increase the efficiency of
the public administration. The business environment is still negatively affected by existing barriers to
competition in services, particularly in regulated professions. The competition authority and the OECD
have recently proposed a large number of reforms in this area.
Sovereign financing and the capacity to repay are sound but yields remain vulnerable to financial
market conditions. The overall favourable economic outlook and the ongoing adjustment, particularly in
the public debt-to-GDP ratio, have clearly been supporting the country's financing terms. Moreover,
early repayments to the IMF over the past two years contributed to smoothing the debt redemption profile
and lower interest costs. Nevertheless, high private and public debt is still a burden for the country's
position on the bond markets, notably in the context of contagion risks. Yields on Portuguese bonds have
continued decreasing until April, helped also by rating upgrades. Portugal is now at investment grade
with three of the four major rating agencies. However, after a spike at the end of May, yields have
stabilised at a slightly higher level, which points to Portugal’s vulnerability to volatile financial market
conditions.
The next PPS mission will most likely take place in November 2018.
7
1. Introduction 9
2. Recent economic developments 11
2.1. Macroeconomic situation and outlook 11
2.2. Public Finances 14
2.3. Financial stability and indebtedness 16
3. Policy issues 21
3.1. Public Finance 21
3.2. Fiscal-structural issues 23
3.3. Financial and corporate sectors 26
3.4. Structural reforms 28
4. Sovereign financing and capacity to repay 35
A1. European Commission Debt sustainability analysis 37
A2. European Commission macroeconomic and fiscal projections (2018 spring
forecast) 39
LIST OF TABLES
2.1. Financial stability indicators 17
LIST OF GRAPHS
2.1. Contributions to real GDP growth 11
2.2. Net capital stock per person employed 11
2.3. Contributions to Current Account Balance 12
2.4. Employment evolution by sectors 12
2.5. Ratio of house prices to rent prices 13
2.6. Budget execution (General Government) 15
2.7. Budget execution (State) 15
2.8. Budget execution (Social security) 15
2.9. Budget execution (Central administration) 15
2.10. New loans granted 16
2.11. Private indebtedness 18
2.12. Recent macroeconomic developments 19
2.13. Recent financial developments 20

8
4.1. 10-year government bond yields 35
4.2. Redemption profile 36
A1.1. Macroeconomic risks: growth and interest rate 38
A1.2. Fiscal consolidation and ageing costs 38
1. INTRODUCTION
9
Staff from the European Commission (EC), in
liaison with the European Central Bank (ECB),
undertook the eighth post-programme
surveillance (PPS) mission to Portugal between
4 June and 12 June 2018. The European Stability
Mechanism (ESM) participated in the meetings on
aspects related to its own Early Warning System.
PPS aims at a broad monitoring of economic,
fiscal and financial conditions with a view to
assessing the repayment capacity of a country that
has received financial assistance(1). While there is
no policy conditionality under PPS, the Council
can issue recommendations for corrective actions
if necessary and where appropriate. PPS is
biannual in terms of reporting and missions.
(1) PPS is established by Article 14 of the two-pack
Regulation (EU) N°472/2013. It started after the expiry of the EU/IMF financial assistance programme and lasts at
least until 75% of the financial assistance has been repaid,
which is expected in 2035.

2. RECENT ECONOMIC DEVELOPMENTS
11
2.1. MACROECONOMIC SITUATION AND
OUTLOOK
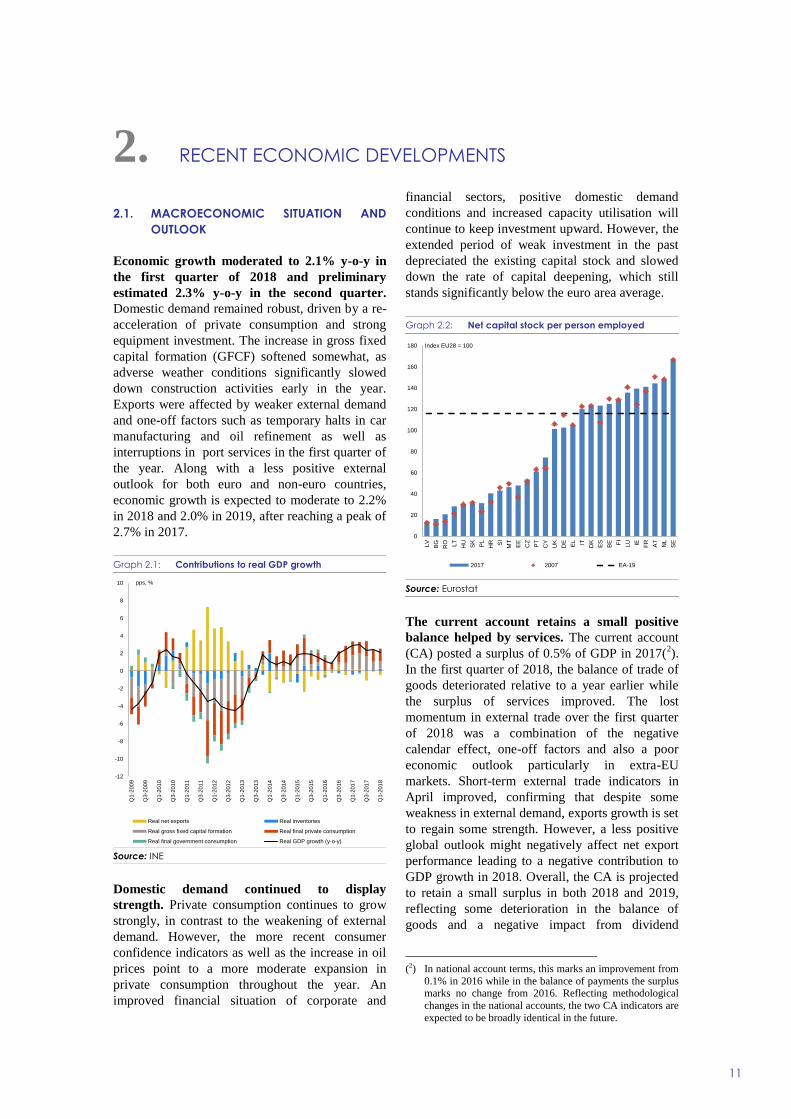
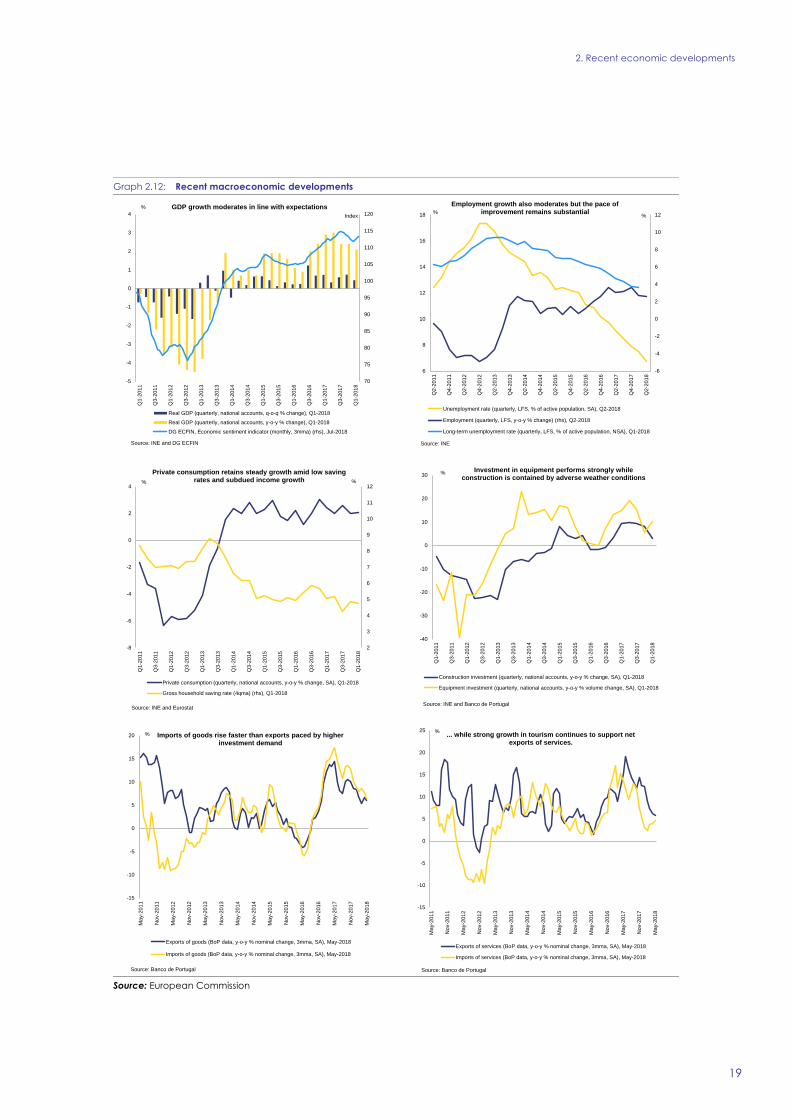
Economic growth moderated to 2.1% y-o-y in
the first quarter of 2018 and preliminary
estimated 2.3% y-o-y in the second quarter.
Domestic demand remained robust, driven by a re-
acceleration of private consumption and strong
equipment investment. The increase in gross fixed
capital formation (GFCF) softened somewhat, as
adverse weather conditions significantly slowed
down construction activities early in the year.
Exports were affected by weaker external demand
and one-off factors such as temporary halts in car
manufacturing and oil refinement as well as
interruptions in port services in the first quarter of
the year. Along with a less positive external
outlook for both euro and non-euro countries,
economic growth is expected to moderate to 2.2%
in 2018 and 2.0% in 2019, after reaching a peak of
2.7% in 2017.
Graph 2.1: Contributions to real GDP growth
Source: INE
Domestic demand continued to display
strength. Private consumption continues to grow
strongly, in contrast to the weakening of external
demand. However, the more recent consumer
confidence indicators as well as the increase in oil
prices point to a more moderate expansion in
private consumption throughout the year. An
improved financial situation of corporate and
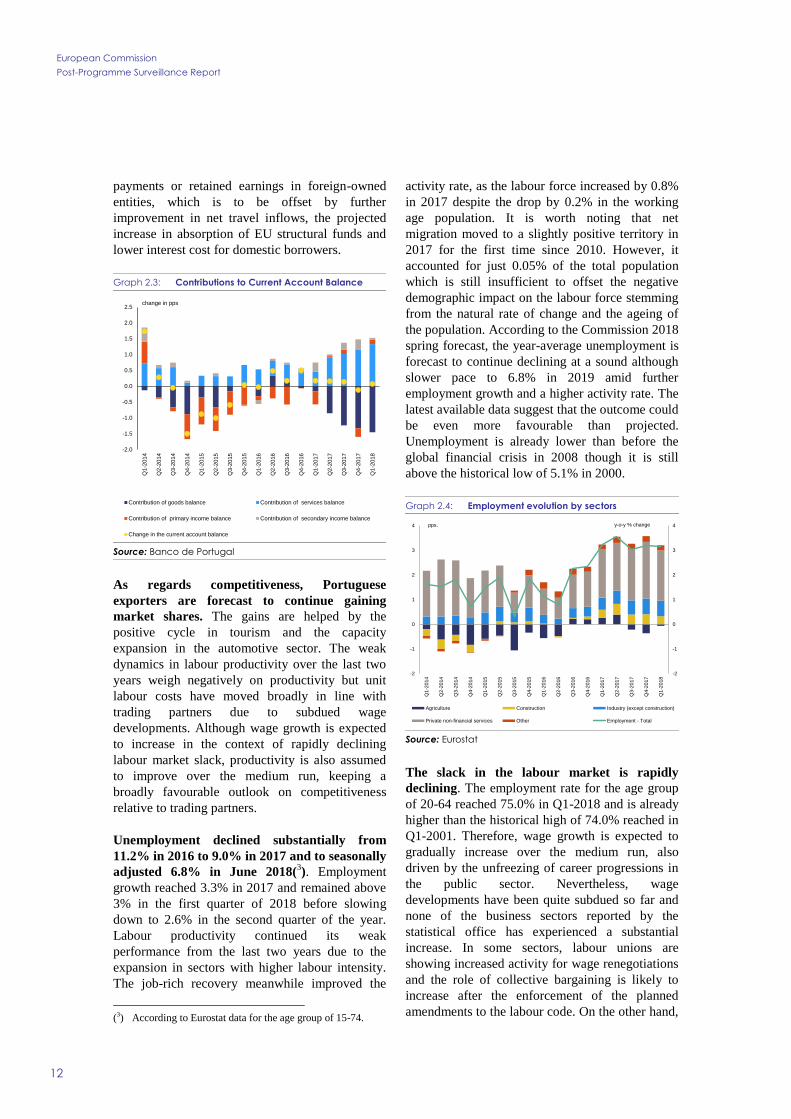
financial sectors, positive domestic demand
conditions and increased capacity utilisation will
continue to keep investment upward. However, the
extended period of weak investment in the past
depreciated the existing capital stock and slowed
down the rate of capital deepening, which still
stands significantly below the euro area average.
Graph 2.2: Net capital stock per person employed
Source: Eurostat
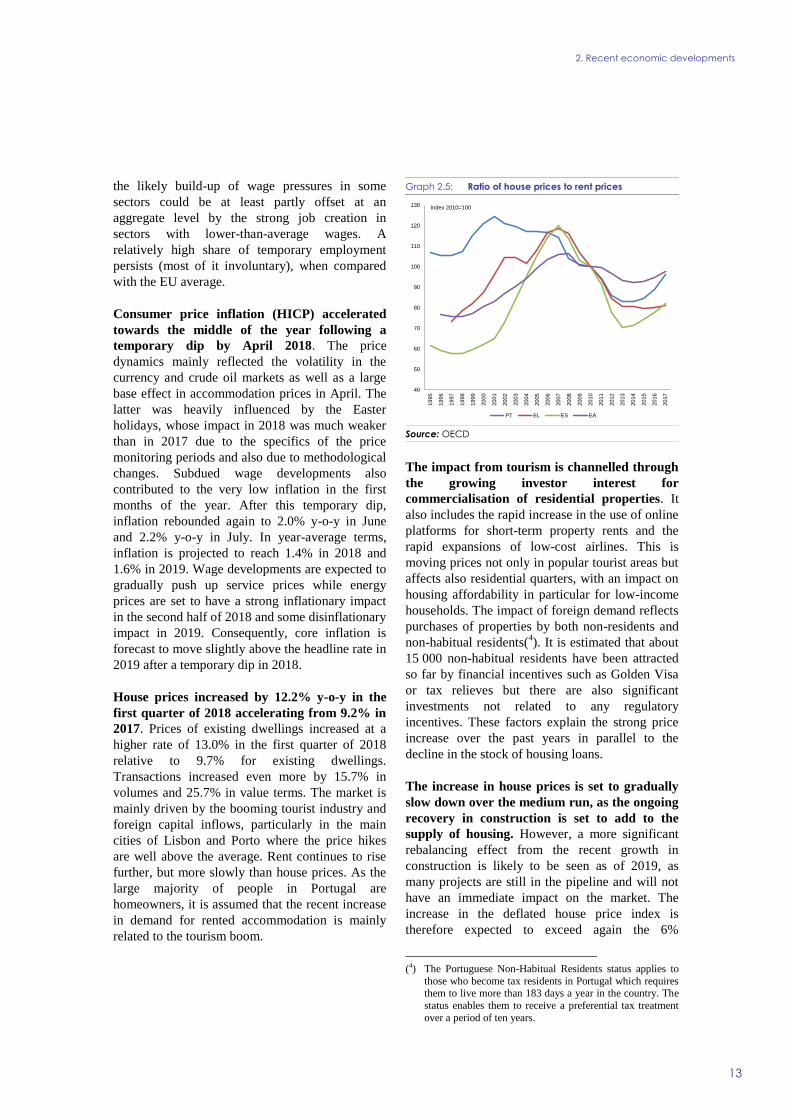
The current account retains a small positive
balance helped by services. The current account
(CA) posted a surplus of 0.5% of GDP in 2017(2).
In the first quarter of 2018, the balance of trade of
goods deteriorated relative to a year earlier while
the surplus of services improved. The lost
momentum in external trade over the first quarter
of 2018 was a combination of the negative
calendar effect, one-off factors and also a poor
economic outlook particularly in extra-EU
markets. Short-term external trade indicators in
April improved, confirming that despite some
weakness in external demand, exports growth is set
to regain some strength. However, a less positive
global outlook might negatively affect net export
performance leading to a negative contribution to
GDP growth in 2018. Overall, the CA is projected
to retain a small surplus in both 2018 and 2019,
reflecting some deterioration in the balance of
goods and a negative impact from dividend
(2) In national account terms, this marks an improvement from
0.1% in 2016 while in the balance of payments the surplus marks no change from 2016. Reflecting methodological
changes in the national accounts, the two CA indicators are
expected to be broadly identical in the future.
-12
-10
-8
-6
-4
-2
0
2
4
6
8
10
Q1-2
009
Q3-2
009
Q1-2
010
Q3-2
010
Q1-2
011
Q3-2
011
Q1-2
012
Q3-2
012
Q1-2
013
Q3-2
013
Q1-2
014
Q3-2
014
Q1-2
015
Q3-2
015
Q1-2
016
Q3-2
016
Q1-2
017
Q3-2
017
Q1-2
018
Real net exports Real inventories
Real gross fixed capital formation Real final private consumption
Real final government consumption Real GDP growth (y-o-y)
pps, %
0
20
40
60
80
100
120
140
160
180
LV
BG
RO LT
HU
SK
PL
HR SI
MT
EE
CZ
PT
CY
UK
DE
EL IT
DK
ES
BE FI
LU IE FR
AT
NL
SE
2017 2007 EA-19
Index EU28 = 100
European Commission
Post-Programme Surveillance Report
12
payments or retained earnings in foreign-owned
entities, which is to be offset by further
improvement in net travel inflows, the projected
increase in absorption of EU structural funds and
lower interest cost for domestic borrowers.
Graph 2.3: Contributions to Current Account Balance
Source: Banco de Portugal
As regards competitiveness, Portuguese
exporters are forecast to continue gaining
market shares. The gains are helped by the
positive cycle in tourism and the capacity
expansion in the automotive sector. The weak
dynamics in labour productivity over the last two
years weigh negatively on productivity but unit
labour costs have moved broadly in line with
trading partners due to subdued wage
developments. Although wage growth is expected
to increase in the context of rapidly declining
labour market slack, productivity is also assumed
to improve over the medium run, keeping a
broadly favourable outlook on competitiveness
relative to trading partners.
Unemployment declined substantially from
11.2% in 2016 to 9.0% in 2017 and to seasonally
adjusted 6.8% in June 2018(3). Employment
growth reached 3.3% in 2017 and remained above
3% in the first quarter of 2018 before slowing
down to 2.6% in the second quarter of the year.
Labour productivity continued its weak
performance from the last two years due to the
expansion in sectors with higher labour intensity.
The job-rich recovery meanwhile improved the
(3) According to Eurostat data for the age group of 15-74.
activity rate, as the labour force increased by 0.8%
in 2017 despite the drop by 0.2% in the working
age population. It is worth noting that net
migration moved to a slightly positive territory in
2017 for the first time since 2010. However, it
accounted for just 0.05% of the total population
which is still insufficient to offset the negative
demographic impact on the labour force stemming
from the natural rate of change and the ageing of
the population. According to the Commission 2018
spring forecast, the year-average unemployment is
forecast to continue declining at a sound although
slower pace to 6.8% in 2019 amid further
employment growth and a higher activity rate. The
latest available data suggest that the outcome could
be even more favourable than projected.
Unemployment is already lower than before the
global financial crisis in 2008 though it is still
above the historical low of 5.1% in 2000.
Graph 2.4: Employment evolution by sectors
Source: Eurostat
The slack in the labour market is rapidly
declining. The employment rate for the age group
of 20-64 reached 75.0% in Q1-2018 and is already
higher than the historical high of 74.0% reached in
Q1-2001. Therefore, wage growth is expected to
gradually increase over the medium run, also
driven by the unfreezing of career progressions in
the public sector. Nevertheless, wage
developments have been quite subdued so far and
none of the business sectors reported by the
statistical office has experienced a substantial
increase. In some sectors, labour unions are
showing increased activity for wage renegotiations
and the role of collective bargaining is likely to
increase after the enforcement of the planned
amendments to the labour code. On the other hand,
-2.0
-1.5
-1.0
-0.5
0.0
0.5
1.0
1.5
2.0
2.5
Q1-2
014
Q2-2
014
Q3-2
014
Q4-2
014
Q1-2
015
Q2-2
015
Q3-2
015
Q4-2
015
Q1-2
016
Q2-2
016
Q3-2
016
Q4-2
016
Q1-2
017
Q2-2
017
Q3-2
017
Q4-2
017
Q1-2
018
Contribution of goods balance Contribution of services balance
Contribution of primary income balance Contribution of secondary income balance
Change in the current account balance
change in pps
-2
-1
0
1
2
3
4
-2
-1
0
1
2
3
4
Q1-2
014
Q2-2
014
Q3-2
014
Q4-2
014
Q1-2
015
Q2-2
015
Q3-2
015
Q4-2
015
Q1-2
016
Q2-2
016
Q3-2
016
Q4-2
016
Q1-2
017
Q2-2
017
Q3-2
017
Q4-2
017
Q1-2
018
Agriculture Construction Industry (except construction)
Private non-financial services Other Employment - Total
pps. y-o-y % change
2. Recent economic developments
13
the likely build-up of wage pressures in some
sectors could be at least partly offset at an
aggregate level by the strong job creation in
sectors with lower-than-average wages. A
relatively high share of temporary employment
persists (most of it involuntary), when compared
with the EU average.
Consumer price inflation (HICP) accelerated
towards the middle of the year following a
temporary dip by April 2018. The price
dynamics mainly reflected the volatility in the
currency and crude oil markets as well as a large
base effect in accommodation prices in April. The
latter was heavily influenced by the Easter
holidays, whose impact in 2018 was much weaker
than in 2017 due to the specifics of the price
monitoring periods and also due to methodological
changes. Subdued wage developments also
contributed to the very low inflation in the first
months of the year. After this temporary dip,
inflation rebounded again to 2.0% y-o-y in June
and 2.2% y-o-y in July. In year-average terms,
inflation is projected to reach 1.4% in 2018 and
1.6% in 2019. Wage developments are expected to
gradually push up service prices while energy
prices are set to have a strong inflationary impact
in the second half of 2018 and some disinflationary
impact in 2019. Consequently, core inflation is
forecast to move slightly above the headline rate in
2019 after a temporary dip in 2018.
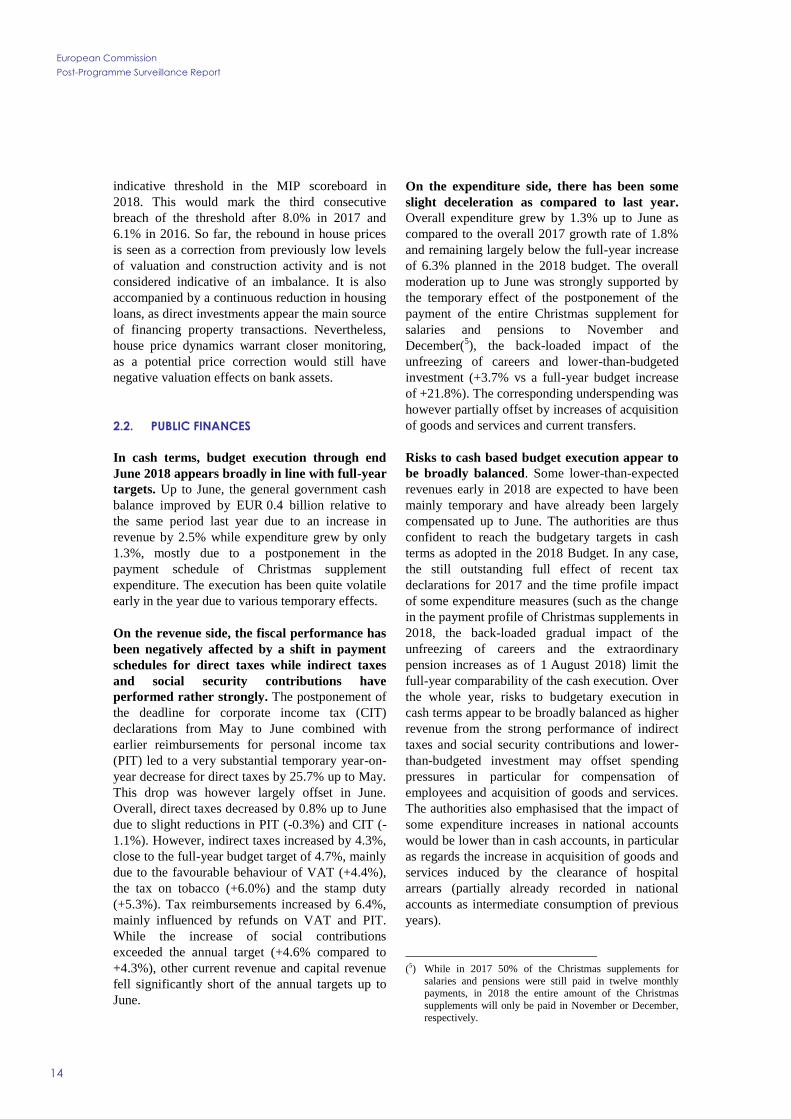
House prices increased by 12.2% y-o-y in the
first quarter of 2018 accelerating from 9.2% in
2017. Prices of existing dwellings increased at a
higher rate of 13.0% in the first quarter of 2018
relative to 9.7% for existing dwellings.
Transactions increased even more by 15.7% in
volumes and 25.7% in value terms. The market is
mainly driven by the booming tourist industry and
foreign capital inflows, particularly in the main
cities of Lisbon and Porto where the price hikes
are well above the average. Rent continues to rise
further, but more slowly than house prices. As the
large majority of people in Portugal are
homeowners, it is assumed that the recent increase
in demand for rented accommodation is mainly
related to the tourism boom.
Graph 2.5: Ratio of house prices to rent prices
Source: OECD
The impact from tourism is channelled through
the growing investor interest for
commercialisation of residential properties. It
also includes the rapid increase in the use of online
platforms for short-term property rents and the
rapid expansions of low-cost airlines. This is
moving prices not only in popular tourist areas but
affects also residential quarters, with an impact on
housing affordability in particular for low-income
households. The impact of foreign demand reflects
purchases of properties by both non-residents and
non-habitual residents(4). It is estimated that about
15 000 non-habitual residents have been attracted
so far by financial incentives such as Golden Visa
or tax relieves but there are also significant
investments not related to any regulatory
incentives. These factors explain the strong price
increase over the past years in parallel to the
decline in the stock of housing loans.
The increase in house prices is set to gradually
slow down over the medium run, as the ongoing
recovery in construction is set to add to the
supply of housing. However, a more significant
rebalancing effect from the recent growth in
construction is likely to be seen as of 2019, as
many projects are still in the pipeline and will not
have an immediate impact on the market. The
increase in the deflated house price index is
therefore expected to exceed again the 6%
(4) The Portuguese Non-Habitual Residents status applies to
those who become tax residents in Portugal which requires them to live more than 183 days a year in the country. The
status enables them to receive a preferential tax treatment
over a period of ten years.
40
50
60
70
80
90
100
110
120
130
1995
1996
1997
1998
1999
2000
2001
2002
2003
2004
2005
2006
2007
2008
2009
2010
2011
2012
2013
2014
2015
2016
2017
PT EL ES EA
Index 2010=100
European Commission
Post-Programme Surveillance Report
14
indicative threshold in the MIP scoreboard in
2018. This would mark the third consecutive
breach of the threshold after 8.0% in 2017 and
6.1% in 2016. So far, the rebound in house prices
is seen as a correction from previously low levels
of valuation and construction activity and is not
considered indicative of an imbalance. It is also
accompanied by a continuous reduction in housing
loans, as direct investments appear the main source
of financing property transactions. Nevertheless,
house price dynamics warrant closer monitoring,
as a potential price correction would still have
negative valuation effects on bank assets.
2.2. PUBLIC FINANCES
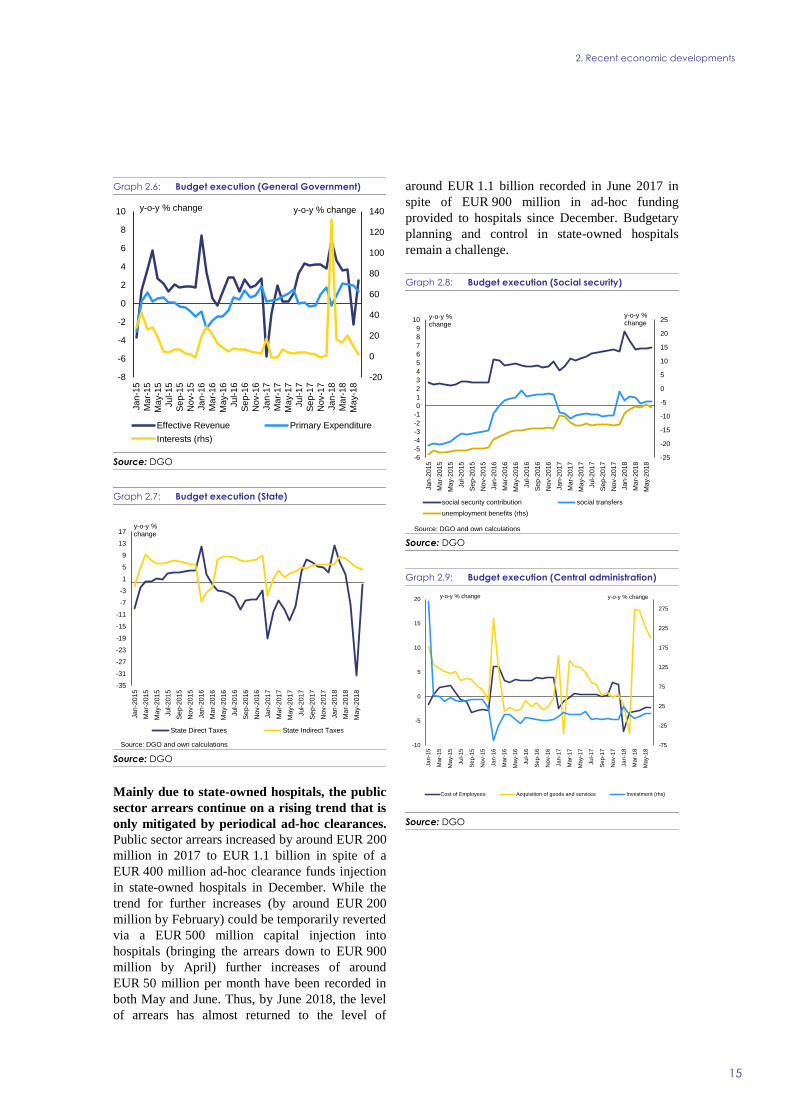
In cash terms, budget execution through end
June 2018 appears broadly in line with full-year
targets. Up to June, the general government cash
balance improved by EUR 0.4 billion relative to
the same period last year due to an increase in
revenue by 2.5% while expenditure grew by only
1.3%, mostly due to a postponement in the
payment schedule of Christmas supplement
expenditure. The execution has been quite volatile
early in the year due to various temporary effects.
On the revenue side, the fiscal performance has
been negatively affected by a shift in payment
schedules for direct taxes while indirect taxes
and social security contributions have
performed rather strongly. The postponement of
the deadline for corporate income tax (CIT)
declarations from May to June combined with
earlier reimbursements for personal income tax
(PIT) led to a very substantial temporary year-on-
year decrease for direct taxes by 25.7% up to May.
This drop was however largely offset in June.
Overall, direct taxes decreased by 0.8% up to June
due to slight reductions in PIT (-0.3%) and CIT (-
1.1%). However, indirect taxes increased by 4.3%,
close to the full-year budget target of 4.7%, mainly
due to the favourable behaviour of VAT (+4.4%),
the tax on tobacco (+6.0%) and the stamp duty
(+5.3%). Tax reimbursements increased by 6.4%,
mainly influenced by refunds on VAT and PIT.
While the increase of social contributions
exceeded the annual target (+4.6% compared to
+4.3%), other current revenue and capital revenue
fell significantly short of the annual targets up to
June.
On the expenditure side, there has been some
slight deceleration as compared to last year.
Overall expenditure grew by 1.3% up to June as
compared to the overall 2017 growth rate of 1.8%
and remaining largely below the full-year increase
of 6.3% planned in the 2018 budget. The overall
moderation up to June was strongly supported by
the temporary effect of the postponement of the
payment of the entire Christmas supplement for
salaries and pensions to November and
December(5), the back-loaded impact of the
unfreezing of careers and lower-than-budgeted
investment (+3.7% vs a full-year budget increase
of +21.8%). The corresponding underspending was
however partially offset by increases of acquisition
of goods and services and current transfers.
Risks to cash based budget execution appear to
be broadly balanced. Some lower-than-expected
revenues early in 2018 are expected to have been
mainly temporary and have already been largely
compensated up to June. The authorities are thus
confident to reach the budgetary targets in cash
terms as adopted in the 2018 Budget. In any case,
the still outstanding full effect of recent tax
declarations for 2017 and the time profile impact
of some expenditure measures (such as the change
in the payment profile of Christmas supplements in
2018, the back-loaded gradual impact of the
unfreezing of careers and the extraordinary
pension increases as of 1 August 2018) limit the
full-year comparability of the cash execution. Over
the whole year, risks to budgetary execution in
cash terms appear to be broadly balanced as higher
revenue from the strong performance of indirect
taxes and social security contributions and lower-
than-budgeted investment may offset spending
pressures in particular for compensation of
employees and acquisition of goods and services.
The authorities also emphasised that the impact of
some expenditure increases in national accounts
would be lower than in cash accounts, in particular
as regards the increase in acquisition of goods and
services induced by the clearance of hospital
arrears (partially already recorded in national
accounts as intermediate consumption of previous
years).
(5) While in 2017 50% of the Christmas supplements for
salaries and pensions were still paid in twelve monthly payments, in 2018 the entire amount of the Christmas
supplements will only be paid in November or December,
respectively.
2. Recent economic developments
15
Graph 2.6: Budget execution (General Government)
Source: DGO
Graph 2.7: Budget execution (State)
Source: DGO
Mainly due to state-owned hospitals, the public
sector arrears continue on a rising trend that is
only mitigated by periodical ad-hoc clearances.
Public sector arrears increased by around EUR 200
million in 2017 to EUR 1.1 billion in spite of a
EUR 400 million ad-hoc clearance funds injection
in state-owned hospitals in December. While the
trend for further increases (by around EUR 200
million by February) could be temporarily reverted
via a EUR 500 million capital injection into
hospitals (bringing the arrears down to EUR 900
million by April) further increases of around
EUR 50 million per month have been recorded in
both May and June. Thus, by June 2018, the level
of arrears has almost returned to the level of
around EUR 1.1 billion recorded in June 2017 in
spite of EUR 900 million in ad-hoc funding
provided to hospitals since December. Budgetary
planning and control in state-owned hospitals
remain a challenge.
Graph 2.8: Budget execution (Social security)
Source: DGO
Graph 2.9: Budget execution (Central administration)
Source: DGO
-20
0
20
40
60
80
100
120
140
-8
-6
-4
-2
0
2
4
6
8
10
Jan
-15
Mar-
15
May-1
5
Jul-1
5
Se
p-1
5
Nov-1
5
Jan
-16
Mar-
16
May-1
6
Jul-1
6
Se
p-1
6
Nov-1
6
Jan
-17
Mar-
17
May-1
7
Jul-1
7
Se
p-1
7
Nov-1
7
Jan
-18
Mar-
18
May-1
8
Effective Revenue Primary Expenditure
Interests (rhs)
y-o-y % change y-o-y % change
-35
-31
-27
-23
-19
-15
-11
-7
-3
1
5
9
13
17
Jan
-2015
Mar-
2015
Ma
y-2
015
Jul-2
015
Se
p-2
015
Nov-2
015
Jan
-2016
Ma
r-2016
Ma
y-2
016
Jul-2
016
Se
p-2
016
Nov-2
016
Jan
-2017
Ma
r-2017
Ma
y-2
017
Jul-2
017
Se
p-2
017
Nov-2
017
Jan
-2018
Ma
r-2018
Ma
y-2
018
State Direct Taxes State Indirect Taxes
Source: DGO and own calculations
y-o-y % change
-25
-20
-15
-10
-5
0
5
10
15
20
25
-6
-5
-4
-3
-2
-1
0
1
2
3
4
5
6
7
8
9
10
Jan
-2015
Ma
r-2015
Ma
y-2
015
Jul-2
015
Se
p-2
015
Nov-2
015
Jan
-2016
Ma
r-2016
Ma
y-2
016
Jul-2
016
Se
p-2
016
Nov-2
016
Jan
-2017
Ma
r-2017
May-2
017
Jul-2
017
Se
p-2
017
Nov-2
017
Jan
-2018
Ma
r-2018
Ma
y-2
018
social security contribution social transfers
unemployment benefits (rhs)
Source: DGO and own calculations
y-o-y % change
y-o-y % change
-75
-25
25
75
125
175
225
275
-10
-5
0
5
10
15
20
Jan
-15
Mar-
15
May-1
5
Jul-1
5
Se
p-1
5
Nov-1
5
Jan
-16
Mar-
16
May-1
6
Jul-1
6
Se
p-1
6
Nov-1
6
Jan
-17
Mar-
17
May-1
7
Jul-1
7
Se
p-1
7
Nov-1
7
Jan
-18
Mar-
18
May-1
8
Cost of Employees Acquisition of goods and services Investment (rhs)
y-o-y % change y-o-y % change
European Commission
Post-Programme Surveillance Report
16
2.3. FINANCIAL STABILITY AND INDEBTEDNESS
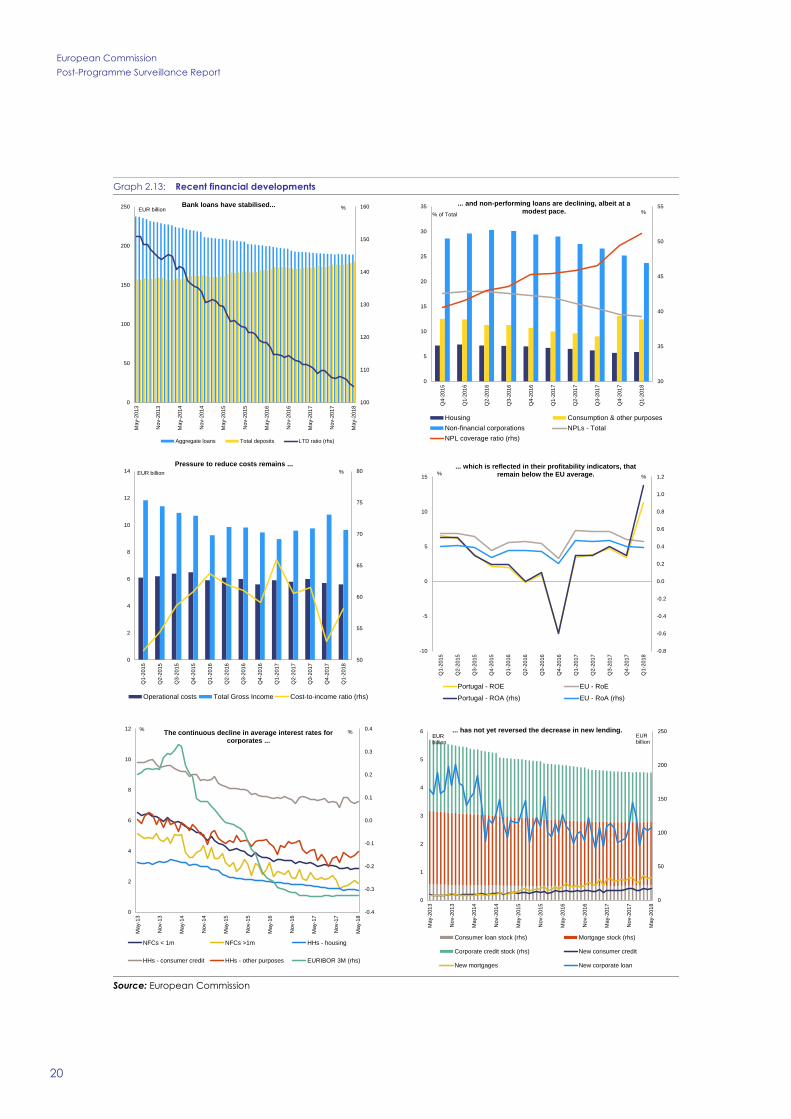
For the first time since 2010 credit to the non-
financial private sector stopped shrinking. It
increased by 0.3% between Q1 2017 and Q1 2018,
while credit to non-financial corporations
increased by 0.1%. Resident banks' corporate
exposure shrank by 3.1% between March 2017 and
March 2018, whereas foreign institutions increased
their loans over the same period by 5.5%, albeit on
a smaller total volume. Credit is increasing, despite
ongoing passive deleveraging, as the sum of loans
and securities has grown less than nominal GDP.
For the moment, the high level of non-performing
loans (NPLs) on banks’ balance sheets is not
constraining the supply of loans to healthy firms
with good business models. Indeed, competition
amongst banks is very intense in this segment.
Banks strongly increased their lending to firms
with the best risk profiles, while decreasing their
exposure to firms in the worst risk quartile, mainly
through the write-off and restructuring of NPLs.
Corporate loan interest rates have more than
halved since 2012 and edge ever closer to
European averages. The average interest rate on
new corporation loans stood at 2.4% in March
2018.
Mortgage interest rates have fallen below 1.5%.
As with corporate loans, mortgage interest rates
have continued to fall since 2012, and reached a
Q1 average of 1.5% compared to an average 1.8%
in the first three months of 2017. Although 40% of
mortgages granted in 2017 were on a fixed rate for
the first five years, nearly all mortgages in
Portugal are at a variable rate. In 2017, 43% of
property purchases were financed through
domestic mortgages. This figure has increased
since 2013, when that share was only 25%. On a
monthly basis, newly granted mortgages have
trebled since 2012-2014 when they amounted to
less than EUR 200 million per month. Between
March 2017 and March 2018 the monthly average
was above EUR 700 million, roughly half the
monthly average in 2003-2007. At the same time,
mortgage redemptions still stand at a higher rate,
so the stock of outstanding mortgages shrank by
1.6% between Q1-2017 and Q1-2018.
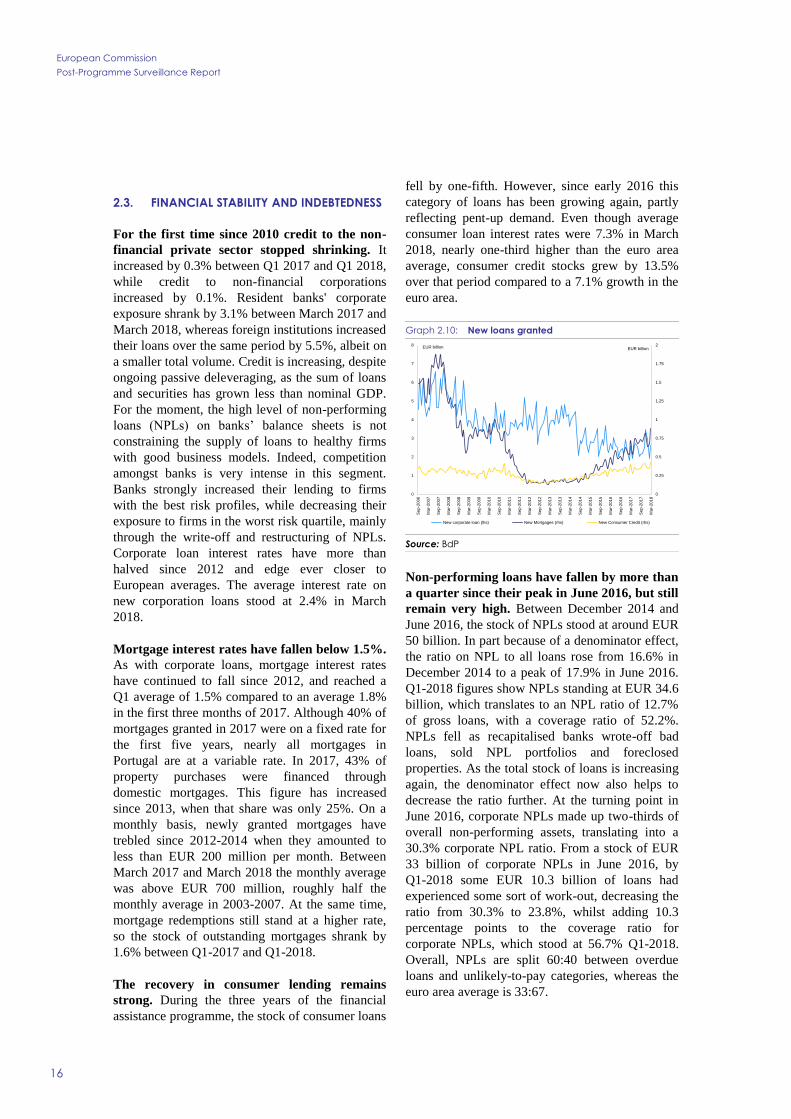
The recovery in consumer lending remains
strong. During the three years of the financial
assistance programme, the stock of consumer loans
fell by one-fifth. However, since early 2016 this
category of loans has been growing again, partly
reflecting pent-up demand. Even though average
consumer loan interest rates were 7.3% in March
2018, nearly one-third higher than the euro area
average, consumer credit stocks grew by 13.5%
over that period compared to a 7.1% growth in the
euro area.
Graph 2.10: New loans granted
Source: BdP
Non-performing loans have fallen by more than
a quarter since their peak in June 2016, but still
remain very high. Between December 2014 and
June 2016, the stock of NPLs stood at around EUR
50 billion. In part because of a denominator effect,
the ratio on NPL to all loans rose from 16.6% in
December 2014 to a peak of 17.9% in June 2016.
Q1-2018 figures show NPLs standing at EUR 34.6
billion, which translates to an NPL ratio of 12.7%
of gross loans, with a coverage ratio of 52.2%.
NPLs fell as recapitalised banks wrote-off bad
loans, sold NPL portfolios and foreclosed
properties. As the total stock of loans is increasing
again, the denominator effect now also helps to
decrease the ratio further. At the turning point in
June 2016, corporate NPLs made up two-thirds of
overall non-performing assets, translating into a
30.3% corporate NPL ratio. From a stock of EUR
33 billion of corporate NPLs in June 2016, by
Q1-2018 some EUR 10.3 billion of loans had
experienced some sort of work-out, decreasing the
ratio from 30.3% to 23.8%, whilst adding 10.3
percentage points to the coverage ratio for
corporate NPLs, which stood at 56.7% Q1-2018.
Overall, NPLs are split 60:40 between overdue
loans and unlikely-to-pay categories, whereas the
euro area average is 33:67.
0
0.25
0.5
0.75
1
1.25
1.5
1.75
2
0
1
2
3
4
5
6
7
8
Se
p-2
006
Mar-
2007
Se
p-2
007
Mar-
2008
Se
p-2
008
Mar-
2009
Se
p-2
009
Mar-
2010
Se
p-2
010
Mar-
2011
Se
p-2
011
Mar-
2012
Se
p-2
012
Mar-
2013
Se
p-2
013
Mar-
2014
Se
p-2
014
Mar-
2015
Se
p-2
015
Mar-
2016
Se
p-2
016
Mar-
2017
Se
p-2
017
Mar-
2018
EUR billionEUR billion
New corporate loan (lhs) New Mortgages (rhs) New Consumer Credit (rhs)
2. Recent economic developments
17
Banks have high levels of deposits, despite rates
of deposit remuneration at a low level in
absolute terms. Contrary to other countries
receiving financial assistance, deposits in
Portuguese banks grew steadily throughout the
years of the assistance programme. Aggregate
deposits grew 2.6% between March 2017 and
March 2018, boosted by corporate savings which
increased 11.2%, whilst household deposits
increased with 0.6%. Contrary to other EU-
jurisdictions, Portuguese banks are legally
forbidden to charge negative interest rates, even
for large companies. This restriction increases the
incentives for multinationals to deposit excess
liquidity in Portugal. Sight deposits generally
remain unremunerated in Portugal. Household and
corporate deposits with up to 1 year maturity
earned 0.2% and 0.1% interest, respectively, in
March 2018.
Banks appear to have adequate liquidity. The
system's loan-to-deposit ratio read 106% in April
2018, reflecting a 71 percentage points decrease
from its peak in June 2010. The liquidity coverage
ratio (LCR) stood at 173%. Borrowing from the
ECB is predominantly through the targeted longer-
term refinancing operations (TLTROs),
redeemable in 2020. In May, this figure read EUR
22 billion, equivalent to 5.6% of banks' total
liabilities.
Capital levels have increased but still remain
low in comparison with most other euro area
countries. The CET1 ratio increased by 2.8
percentage points to 13.6% in Q1-2018 Since
autumn 2016, four out of Portugal's six biggest
banks saw capital injections amounting to EUR
7.25 billion. Workout of NPLs and de-
consolidation of subsidiaries also had the effect of
decreasing risk-weighted assets in the denominator
significantly. Despite observable and tangible
progress by banks in strengthening their capital
positions, Portugal has still the euro area's third
lowest capital ratio relative to risk-weighted assets.
Banks' net income has turned positive. In 2017,
return on equity (ROE) was 3.4%, while return on
assets (ROA) was 0.3% in Portugal relative to euro
area averages of 6.1% and 0.4% respectively.
Portugal's banking system recorded losses almost
continuously between 2011 and 2016 (the
exception was 2015, when a small profit was
recorded). Portuguese lenders have managed to
break even due to cost reduction efforts and lower
loan loss provisions. Despite falling loan stocks
and increasing deposits, net interest income has
increased, as deposit remuneration has fallen close
to zero in most banks. Furthermore, banks’ trading
results also benefitted from an increase in the value
of sovereign bond holdings over 2017. In addition,
the recovery in the real estate market is making it
easier for banks to sell foreclosed properties. Still,
important differences persist between banks in
terms of profitability.
Novo Banco's EUR 1.4 billion loss in 2017 stems
mainly from a reinforcement of provision and
impairments for loans, securities and equity
participations. As Novo Banco fell below a
certain capital threshold, the contingent capital
mechanism was invoked to bring CET1 back up to
the minimum designated in the said mechanism.
The resolution fund injected EUR 792 million in
Novo Banco in May 2018, out of which EUR 430
million needed to be borrowed from the state. For
eight years, the national resolution fund can be
called upon to inject up to a total of EUR 3.9
billion if specified assets within Novo Banco
(valued at EUR 7.9 billion in June 2016), cause the
CET1 to fall below thresholds agreed amongst the
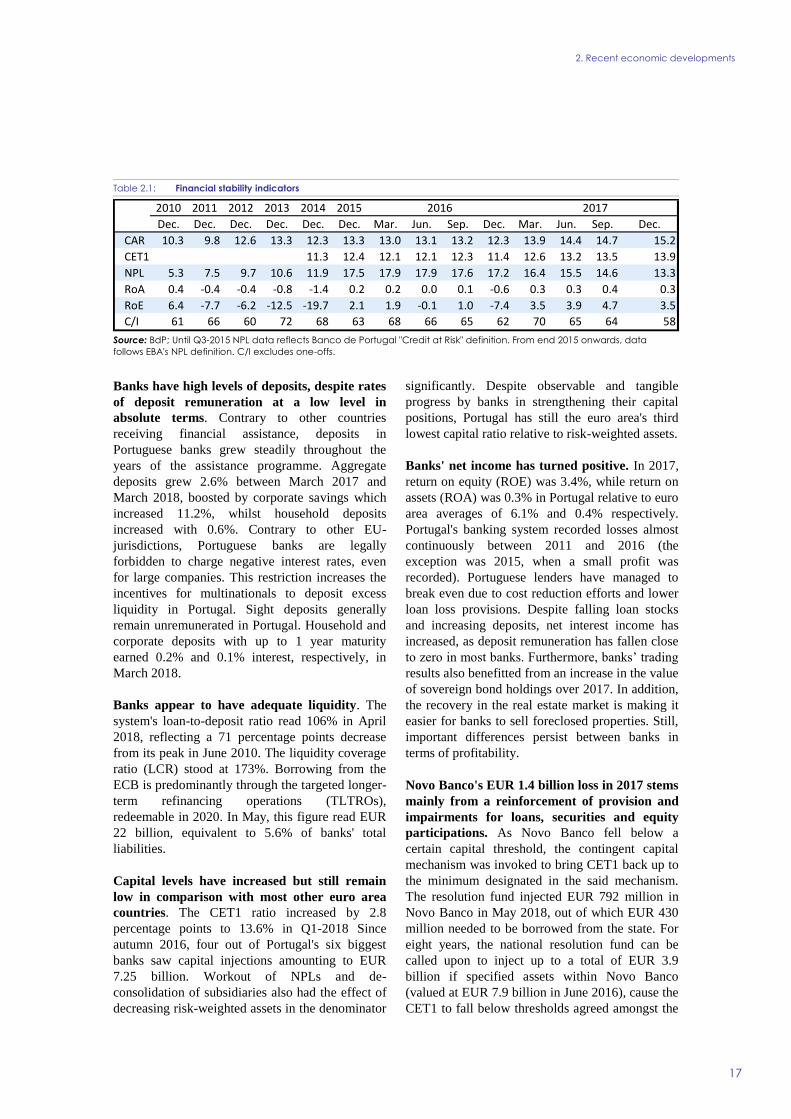
Table 2.1: Financial stability indicators
Source: BdP; Until Q3-2015 NPL data reflects Banco de Portugal "Credit at Risk" definition. From end 2015 onwards, data
follows EBA's NPL definition. C/I excludes one-offs.
2010 2011 2012 2013 2014 2015 2016 2017
Dec. Dec. Dec. Dec. Dec. Dec. Mar. Jun. Sep. Dec. Mar. Jun. Sep. Dec.
CAR 10.3 9.8 12.6 13.3 12.3 13.3 13.0 13.1 13.2 12.3 13.9 14.4 14.7 15.2
CET1 11.3 12.4 12.1 12.1 12.3 11.4 12.6 13.2 13.5 13.9
NPL 5.3 7.5 9.7 10.6 11.9 17.5 17.9 17.9 17.6 17.2 16.4 15.5 14.6 13.3
RoA 0.4 -0.4 -0.4 -0.8 -1.4 0.2 0.2 0.0 0.1 -0.6 0.3 0.3 0.4 0.3
RoE 6.4 -7.7 -6.2 -12.5 -19.7 2.1 1.9 -0.1 1.0 -7.4 3.5 3.9 4.7 3.5
C/I 61 66 60 72 68 63 68 66 65 62 70 65 64 58
European Commission
Post-Programme Surveillance Report
18
mechanism's participants. In Q1-2018 Novo Banco
realised a EUR 61 million profit.
Almost all banks are presently engaged in the
process of restructuring. In 2017, the cost-to-
income ratio fell 6 percentage points to 53%, close
to the euro area's median. Despite tangible
progress in cost reduction, reducing costs further
will remain high on the agenda of banks as their
business model changes. As in other European
countries, banks now face increasing pressure to
move their businesses online and invest more in
new digital technologies. This, in turn, implies
higher investments in IT infrastructure to support
changes in business models.
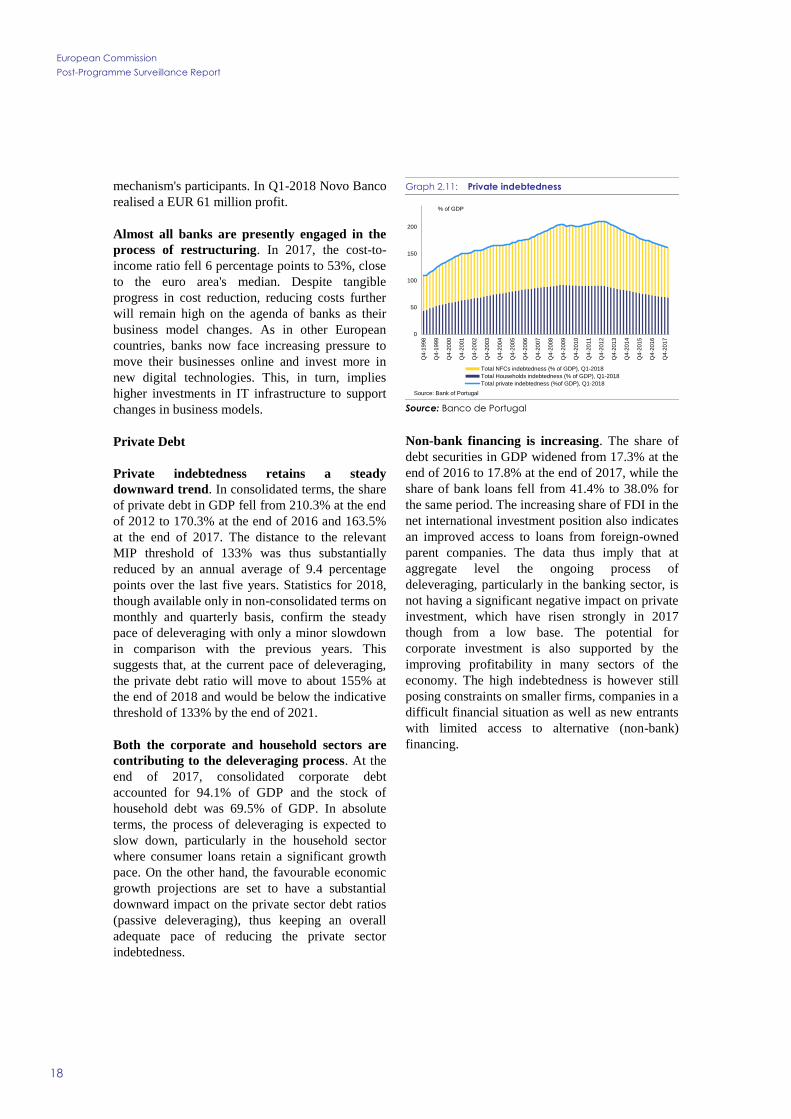
Private Debt
Private indebtedness retains a steady
downward trend. In consolidated terms, the share
of private debt in GDP fell from 210.3% at the end
of 2012 to 170.3% at the end of 2016 and 163.5%
at the end of 2017. The distance to the relevant
MIP threshold of 133% was thus substantially
reduced by an annual average of 9.4 percentage
points over the last five years. Statistics for 2018,
though available only in non-consolidated terms on
monthly and quarterly basis, confirm the steady
pace of deleveraging with only a minor slowdown
in comparison with the previous years. This
suggests that, at the current pace of deleveraging,
the private debt ratio will move to about 155% at
the end of 2018 and would be below the indicative
threshold of 133% by the end of 2021.
Both the corporate and household sectors are
contributing to the deleveraging process. At the
end of 2017, consolidated corporate debt
accounted for 94.1% of GDP and the stock of
household debt was 69.5% of GDP. In absolute
terms, the process of deleveraging is expected to
slow down, particularly in the household sector
where consumer loans retain a significant growth
pace. On the other hand, the favourable economic
growth projections are set to have a substantial
downward impact on the private sector debt ratios
(passive deleveraging), thus keeping an overall
adequate pace of reducing the private sector
indebtedness.
Graph 2.11: Private indebtedness
Source: Banco de Portugal
Non-bank financing is increasing. The share of
debt securities in GDP widened from 17.3% at the
end of 2016 to 17.8% at the end of 2017, while the
share of bank loans fell from 41.4% to 38.0% for
the same period. The increasing share of FDI in the
net international investment position also indicates
an improved access to loans from foreign-owned
parent companies. The data thus imply that at
aggregate level the ongoing process of
deleveraging, particularly in the banking sector, is
not having a significant negative impact on private
investment, which have risen strongly in 2017
though from a low base. The potential for
corporate investment is also supported by the
improving profitability in many sectors of the
economy. The high indebtedness is however still
posing constraints on smaller firms, companies in a
difficult financial situation as well as new entrants
with limited access to alternative (non-bank)
financing.
0
50
100
150
200
Q4-1
998
Q4-1
999
Q4-2
000
Q4-2
001
Q4-2
002
Q4-2
003
Q4-2
004
Q4-2
005
Q4-2
006
Q4-2
007
Q4-2
008
Q4-2
009
Q4-2
010
Q4-2
011
Q4-2
012
Q4-2
013
Q4-2
014
Q4-2
015
Q4-2
016
Q4-2
017
Total NFCs indebtedness (% of GDP), Q1-2018
Total Households indebtedness (% of GDP), Q1-2018
Total private indebtedness (%of GDP), Q1-2018
Source: Bank of Portugal
% of GDP
2. Recent economic developments
19
Graph 2.12: Recent macroeconomic developments
Source: European Commission
70
75
80
85
90
95
100
105
110
115
120
-5
-4
-3
-2
-1
0
1
2
3
4
Q1-2
011
Q3-2
011
Q1-2
012
Q3-2
012
Q1-2
013
Q3-2
013
Q1-2
014
Q3-2
014
Q1-2
015
Q3-2
015
Q1-2
016
Q3-2
016
Q1-2
017
Q3-2
017
Q1-2
018
GDP growth moderates in line with expectations
Real GDP (quarterly, national accounts, q-o-q % change), Q1-2018
Real GDP (quarterly, national accounts, y-o-y % change), Q1-2018
DG ECFIN, Economic sentiment indicator (monthly, 3mma) (rhs), Jul-2018
Source: INE and DG ECFIN
Index
%
2
3
4
5
6
7
8
9
10
11
12
-8
-6
-4
-2
0
2
4
Q1-2
011
Q3-2
011
Q1-2
012
Q3-2
012
Q1-2
013
Q3-2
013
Q1-2
014
Q3-2
014
Q1-2
015
Q3-2
015
Q1-2
016
Q3-2
016
Q1-2
017
Q3-2
017
Q1-2
018
Private consumption retains steady growth amid low saving rates and subdued income growth
Private consumption (quarterly, national accounts, y-o-y % change, SA), Q1-2018
Gross household saving rate (4qma) (rhs), Q1-2018
% %
Source: INE and Eurostat
-40
-30
-20
-10
0
10
20
30
Q1-2
011
Q3-2
011
Q1-2
012
Q3-2
012
Q1-2
013
Q3-2
013
Q1-2
014
Q3-2
014
Q1-2
015
Q3-2
015
Q1-2
016
Q3-2
016
Q1-2
017
Q3-2
017
Q1-2
018
Investment in equipment performs strongly while construction is contained by adverse weather conditions
Construction investment (quarterly, national accounts, y-o-y % change, SA), Q1-2018
Equipment investment (quarterly, national accounts, y-o-y % volume change, SA), Q1-2018
Source: INE and Banco de Portugal
%
-15
-10
-5
0
5
10
15
20
May-2
011
Nov-2
011
May-2
012
Nov-2
012
May-2
013
Nov-2
013
May-2
014
Nov-2
014
May-2
015
Nov-2
015
May-2
016
Nov-2
016
May-2
017
Nov-2
017
May-2
018
Imports of goods rise faster than exports paced by higher investment demand
Exports of goods (BoP data, y-o-y % nominal change, 3mma, SA), May-2018
Imports of goods (BoP data, y-o-y % nominal change, 3mma, SA), May-2018
Source: Banco de Portugal
%
-15
-10
-5
0
5
10
15
20
25
May-2
011
Nov-2
011
May-2
012
Nov-2
012
May-2
013
Nov-2
013
May-2
014
Nov-2
014
May-2
015
Nov-2
015
May-2
016
Nov-2
016
May-2
017
Nov-2
017
May-2
018
... while strong growth in tourism continues to support net exports of services.
Exports of services (BoP data, y-o-y % nominal change, 3mma, SA), May-2018
Imports of services (BoP data, y-o-y % nominal change, 3mma, SA), May-2018
Source: Banco de Portugal
%
-6
-4
-2
0
2
4
6
8
10
12
6
8
10
12
14
16
18
Q2-2
011
Q4-2
011
Q2-2
012
Q4-2
012
Q2-2
013
Q4-2
013
Q2-2
014
Q4-2
014
Q2-2
015
Q4-2
015
Q2-2
016
Q4-2
016
Q2-2
017
Q4-2
017
Q2-2
018
Employment growth also moderates but the pace of improvement remains substantial
Unemployment rate (quarterly, LFS, % of active population, SA), Q2-2018
Employment (quarterly, LFS, y-o-y % change) (rhs), Q2-2018
Long-term unemployment rate (quarterly, LFS, % of active population, NSA), Q1-2018
%%
Source: INE
European Commission
Post-Programme Surveillance Report
20
Graph 2.13: Recent financial developments
Source: European Commission
100
110
120
130
140
150
160
0
50
100
150
200
250
May-2
013
Nov-2
013
May-2
014
Nov-2
014
May-2
015
Nov-2
015
May-2
016
Nov-2
016
May-2
017
Nov-2
017
May-2
018
Bank loans have stabilised...
Aggregate loans Total deposits LTD ratio (rhs)
EUR billion %
-0.4
-0.3
-0.2
-0.1
0.0
0.1
0.2
0.3
0.4
0
2
4
6
8
10
12
May-1
3
Nov-1
3
May-1
4
Nov-1
4
May-1
5
Nov-1
5
May-1
6
Nov-1
6
May-1
7
Nov-1
7
May-1
8
The continuous decline in average interest rates for corporates ...
NFCs < 1m NFCs >1m HHs - housing
HHs - consumer credit HHs - other purposes EURIBOR 3M (rhs)
%%
0
50
100
150
200
250
0
1
2
3
4
5
6
May-2
013
Nov-2
013
May-2
014
Nov-2
014
May-2
015
Nov-2
015
May-2
016
Nov-2
016
May-2
017
Nov-2
017
May-2
018
... has not yet reversed the decrease in new lending.
Consumer loan stock (rhs) Mortgage stock (rhs)
Corporate credit stock (rhs) New consumer credit
New mortgages New corporate loan
EUR billion
EUR billion
30
35
40
45
50
55
0
5
10
15
20
25
30
35
Q4-2
015
Q1-2
016
Q2-2
016
Q3-2
016
Q4-2
016
Q1-2
017
Q2-2
017
Q3-2
017
Q4-2
017
Q1-2
018
... and non-performing loans are declining, albeit at a modest pace.
Housing Consumption & other purposes
Non-financial corporations NPLs - Total
NPL coverage ratio (rhs)
% of Total %
50
55
60
65
70
75
80
0
2
4
6
8
10
12
14
Q1-2
015
Q2-2
015
Q3-2
015
Q4-2
015
Q1-2
016
Q2-2
016
Q3-2
016
Q4-2
016
Q1-2
017
Q2-2
017
Q3-2
017
Q4-2
017
Q1-2
018
Pressure to reduce costs remains ...
Operational costs Total Gross Income Cost-to-income ratio (rhs)
EUR billion %
-0.8
-0.6
-0.4
-0.2
0.0
0.2
0.4
0.6
0.8
1.0
1.2
-10
-5
0
5
10
15
Q1-2
015
Q2-2
015
Q3-2
015
Q4-2
015
Q1-2
016
Q2-2
016
Q3-2
016
Q4-2
016
Q1-2
017
Q2-2
017
Q3-2
017
Q4-2
017
Q1-2
018
... which is reflected in their profitability indicators, that remain below the EU average.
Portugal - ROE EU - RoE
Portugal - ROA (rhs) EU - RoA (rhs)
%%
3. POLICY ISSUES
21
3.1. PUBLIC FINANCE
The Commission 2018 spring forecast projects
the headline deficit at 0.9% of GDP in 2018,
impacted by further banking support operations, in
particular the activation of the Novo Banco
contingent capital mechanism (0.4% of GDP),
while the deficit net of one-offs is set to improve to
0.5% of GDP (see Table 3.1). As the impact of
discretionary measures and savings in interest
expenditure in 2018 is expected to be broadly
neutral, the structural balance is projected to
remain broadly stable. The Stability Programme
targets a revised headline deficit of 0.7% of GDP
for 2018, i.e. 0.4% of GDP below the approved
2018 Budget target of 1.1% of GDP. The
improvement by 0.4% of GDP mostly reflects the
improved carry-over from 2017 on current
expenditure mitigated by the 0.4% of GDP
negative impact of the Novo Banco contingent
capital mechanism. Thus, on the expenditure side,
a downward revision by 0.8% of GDP of current
expenditure is partially offset by a 0.3% of GDP
increase of capital expenditure, resulting in an
overall decrease of expenditure of 0.5% of GDP.
This 0.5% of GDP improvement on the
expenditure side is however accompanied by a
slight downward revision of overall revenue by
0.1% of GDP as increases for taxes and social
contributions (0.4% of GDP) and capital revenue
(0.1% of GDP) are more than outweighed by
strong downward revisions of sales and other
current revenue (-0.6% of GDP). The 0.2% of
GDP difference between the headline deficit of
0.9% of GDP in the Commission spring forecast
and the 0.7% of GDP target in the Stability
Programme is mostly related to higher expected
compensation of employees in the spring forecast.
The structural balance is projected to remain
stable in 2018 according to the spring forecast
while the Stability Programme projects an
improvement in the structural balance by around
0.4% of GDP in 2018. The 0.4% of GDP
divergence is due to the difference in the headline
deficit, a more positive output gap projection in the
spring forecast resulting in a higher cyclical
adjustment than in the Stability Programme and a
difference in one-off expenditure, related to the
inclusion of the ‘unusual event’ exceptional
wildfire prevention structural expenditure and of
payments to Greece as one-off in the Stability
Programme. The structural primary balance is
expected to deteriorate by 0.3% of GDP according
to the Commission spring forecast and to improve
by 0.1% of GDP according to the Stability
Programme.
For 2019, the Commission spring forecast
projects a headline deficit of 0.6% of GDP in
2019 under the no-policy change assumption,
0.4% of GDP above the 0.2% of GDP target in the
Stability Programme. About half of the divergence
is related to higher expected pressures for
compensation of employees, another 0.1% of GDP
to pressures on other expenditure items (as
expenditure measures could not be fully factored
in) and another 0.1% of GDP due to lower indirect
tax revenue resulting from the spring forecast’s
slightly more conservative macro scenario and
insufficiently specified tax measures. The
Commission 2018 spring forecast takes fully into
account the deficit-increasing measures included in
the Stability Programme’s baseline scenario, i.e.
the carry-over of the 2018 PIT bracket revision,
the unfreezing of careers and the increases in other
social benefits. It instead takes into account only
half of the estimated budgetary impact of the
impact of the spending review on intermediate
consumption and other current expenditure, as this
measure has not yet been sufficiently specified for
2019. Savings in interest expenditure, while not
explicitly considered a measure in the Commission
forecast, broadly coincide with those of the
Stability Programme.
The Commission spring forecast projects a
slight deterioration of the structural balance by
about 0.1% of GDP in 2019 as compared to a
planned improvement by 0.3% of GDP in the
Stability Programme. The 0.4% of GDP difference
in the structural balance variation is mostly related
to the difference in the evolution of the headline
balance but also to the more positive output gap
evolution based on lower potential growth
estimates than in the Stability Programme
(partially compensated by the offsetting of the
2018 one-off difference).
After rising slightly to 129.9% in 2016,
Portugal’s gross general government debt-to-
GDP ratio fell by 4.2 percentage points to
125.7% in 2017. This results from a decrease of
European Commission
Post-Programme Surveillance Report
22
2.1% of GDP in stock-flow adjustments (mainly a
1.5% of GDP reduction in the cash buffer), strong
nominal growth and the primary surplus. The
Commission 2018 spring forecast projects the
gross public debt-to-GDP to further decline to
122.5% in 2018 and 119.5% in 2019, mainly due
to primary budget surpluses and high nominal
GDP growth. The Stability Programme expects
somewhat lower ratios of 122.2% of GDP in 2018
and 118.4% of GDP in 2019, mostly due to
projected lower headline deficits and higher
nominal GDP growth in 2019. Risks to the fiscal
outlook are tilted to the downside, linked to
uncertainties in the external environment,
including contagion from other developments in
the euro area, and the further deficit increasing
impact of potential banking support measures (in
particular a renewed activation of the Novo Banco
contingent capital mechanism).
The assessment of Stability and Growth Pact
(SGP) compliance points to some deviation in
2017 and to risks of significant deviation for
both 2018 and 2019 and over 2017-2018 and
2018-2019 taken together. Portugal is subject to
the preventive arm of the SGP as of 2017 and has
to ensure compliance with the required adjustment
towards the Medium-Term Objective (MTO). To
this end, Portugal is required to contain the growth
rate in net primary expenditure corresponding to
annual structural adjustments of at least 0.6% of
GDP towards the MTO over 2017-2019.
In 2017, Portugal achieved an improvement of
the structural balance of 0.9% of GDP, which is
in line with the required adjustment towards
the MTO. On the other hand, the growth rate of
government expenditure, net of discretionary
revenue measures and one-offs, exceeded the
applicable expenditure benchmark rate, leading to
a negative deviation of 0.5% of GDP in the
underlying fiscal position. Following an overall
assessment, both indicators point to some
deviation from the recommended adjustment path
towards the MTO in 2017.
For 2018 and 2019, the Commission spring
forecast projects the growth rate of nominal
primary government expenditure, net of
discretionary revenue measures and one-offs, to
exceed the applicable expenditure benchmark
rate. This is estimated to lead to negative
deviations of 1.4% of GDP and 1.0% of GDP of
the underlying fiscal position in 2018 and 2019,
respectively, as compared to the required annual
structural adjustment of 0.6% of GDP. The
structural balance is projected to remain
unchanged in 2018 and to slightly deteriorate by
0.1% of GDP in 2019, below the recommended
annual structural adjustment of at least 0.6% of
GDP towards the MTO in both years. Following
an overall assessment, there is a risk of significant
deviation from the recommended adjustment path
towards the MTO in both years and over 2017-
2018 and 2018-2019 taken together based on the
Commission 2018 spring forecast. An overall
assessment on the basis of the Stability Programme
also points to a planned risk of a significant
deviation in both 2018 and 2019 and over 2017-
2018 and 2018-2019 taken together.
Based on both the Stability Programme data and
on the Commission 2018 spring forecast, Portugal
is expected to make sufficient progress towards
compliance with the debt reduction benchmark in
2018 and 2019.
3. Policy issues
23
3.2. FISCAL-STRUCTURAL ISSUES
While the overall spending review was recently
broadened and now shows more ambitious
savings targets, future steps still remain to be
specified. A series of initiatives across various
public sectors (healthcare, education, state-owned
enterprises, internal administration, justice) and
areas (public procurement, real estate
management, human resources) continue to be put
in place. For instance, previously announced
initiatives to reduce absenteeism in the public
sector have started to be implemented. This
includes the review of around 6 000 medical
panels in the education sector in late 2017 to
identify incorrect sick leaves, which has
contributed to the return to work of over half of the
assessed cases. Another 6 000 reviews were
planned to be carried out between March and
August 2018. A new monitoring system to assess
absenteeism has also been set up. While savings
and efficiency gains are foreseen overall, measures
still need to be specified for the often substantial
savings planned for future years. Furthermore, the
exercise is not yet undergoing a regular and
independent ex-post analysis. This has so far only
been done for selected cases on an ad-hoc basis by
the authorities.
The number of employees and the wage bill
appear to remain under continued pressure to
increase above budget targets. The 2017 wage
bill increased by 1.9% in nominal terms,
significantly above the 2017 budget while the
average headcount of public employees increased
by 0.8% in 2017 notwithstanding the planned
decrease according to the 2:1 replacement ratio
rule. This tendency of increasing numbers of
public employees appears to be confirmed by the
evolution in Q1-2018 that recorded a further 0.8%
y-o-y increase in the number of public employees,
(in particular due to high increases in the areas of
health and education) as compared to the
stabilisation targeted in the Stability Programme.
At the same time, the wide-ranging programme to
convert temporary contracts for permanent tasks in
the public sector into permanent contracts is
expected to be concluded by the end of 2018
(concerning an estimated 20 000 people) (6).The
(6) While the temporary workers are already included in the
public employment statistics, the conversion of their
planned extension of the 35 hour week in the
health sector to employees with private sector
contracts (around 40% of the workforce) is
expected to put additional pressure on the
headcount and the wage bill (e.g. via extra hours
compensation) as of 1 July 2018. The unfreezing
of career progression – which had been frozen
since 2010 – has started as of January 2018. The
additional payments are gradually being phased in
(25% as of January 2018, 50% as of September
2018, 75% as of May 2019 and 100% as of
December 2019) with an estimated incremental
cost of around 0.2% of GDP in both 2018 and
2019 and another 0.1% of GDP in 2020 according
to the Stability Programme. The precise modalities
of the unfreezing for some specific careers (in
particular for teachers) are still under negotiation
and might put some significant upward pressure on
the overall cost of the unfreezing measure.
There has been progress in local administration
reforms and the decentralisation package is
planned to be gradually implemented as of
2019. Overall local and regional debt and arrears
have continued their decline while the overall local
and regional budgetary surplus has slightly
decreased in 2017. Employment in local
administration increased by 1.9% in 2017 as
compared to 0.8% for overall general government.
The Municipality Support Fund (FAM – a debt
workout mechanism for over-indebted
municipalities) has continued its disbursements
reaching EUR 318 million. While the Financial
Coordination Council set up in 2014 has not been
convening, there have been quarterly meetings of
the Regional Coordination Council. The
Directorate-General for Local Administration
(DGAL) supported by UTAM and the Directorate-
General for Budget (DGO; on regional
government) have improved the monitoring of
local State-Owned Enterprises (SOEs) and PPPs
supported by a decree law from July 2017 creating
the obligation for local SOEs to provide direct
information without going through the local
authorities, while information on local PPPs has
been reported quarterly since 2016. The
decentralisation process on a wide range of
domains, in particular education and health, with
the purpose to increase the share of resources spent
at local level, is planned to be gradually
contracts into permanent contracts may increase the long-
term liabilities of the State.
European Commission
Post-Programme Surveillance Report
24
implemented over three years as of 2019. The
parliamentary approval of a framework agreement
is expected to be concluded before the autumn in
parallel with a revision of the local finance law to
adjust human resources and local finances, and is
to be complemented later by a series of sectoral
decree-laws. The volume of financial transfers to
the municipalities to compensate for the new tasks
is planned to reach around EUR 1 billion to
EUR 1.2 billion and to be implemented in a
budget-neutral way.
The implementation of the Budget Framework
Law (BFL) that entered into force in September
2015 is being postponed via an amending law in
the Parliament due to cumulative delays. The
Law is designed to make budget units more
accountable and strengthen the medium- to long-
term focus of public finances and allowed for a
three-year transitional period for applying most
new features. The BFL's implementation unit has
convened regularly and preparatory work mostly in
terms of IT systems setup has been progressing, in
particular as regards the state accounting entity
project (7). According to a draft law submitted to
Parliament the government intends to delay the
entry into force of the main provisions of the
revised BFL by one and a half years to 1 April
2020. Thus, only the 2021 budget is planned to be
prepared under the new rules. Some elements
might however become operational at an earlier
stage. In terms of regulatory preparation a series of
decree laws will require adjustment and
consolidation and the decree law on the setup of
the new budgetary programmes will need to be
prepared(8). The full effective application of the
new accrual-based public accounting framework
that was last set to start in January 2018 has been
rescheduled to January 2019 following delays in
particular for local authorities and Social Security.
Except for PIT, only relatively minor shifts in
taxation are being implemented in 2018. In
addition to the already previously planned full
abolishment of the PIT surcharge also for higher
tax brackets, new PIT reform measures were
introduced in the 2018 budget, increasing in
particular the number of tax brackets and the level
(7) A first preliminary opening balance sheet has been
established as of 1 January 2018. (8) The draft amendment to the BFL sets a new deadline by
June 2019 for the approval of the corresponding decree law
on budgetary programmes.
of the net income guarantee ('mínimo de
existência'). The authorities estimate the cost of the
latter two measures at EUR 230 million in 2018
and EUR 156 million in 2019 when the 2018 PIT
declarations are made. While the 2018 draft budget
did not include any major changes to CIT rules,
Parliament adopted an increase of the State
surcharge from 7% to 9% for large companies with
profits exceeding EUR 35 million. This was
accompanied by a measure increasing incentives
for reinvesting profits. The 2% increase in the
State surcharge is estimated to bring around
EUR 60 million in additional revenue in 2018. The
proposal for a major reform to deferred tax assets
(DTA) rules and timelines, first brought up in
autumn 2017 during the 2018 budget discussions,
is still being evaluated. A new proposal might be
included in the 2019 draft budget. While some
small changes to CIT tax benefits may also already
be inserted into the 2019 draft budget, more ample
changes are only planned to be decided once the
dedicated working group on the evaluation of tax
benefits will have presented their report (expected
for March 2019).
As regards indirect taxes, the new VAT
exemption regime on imports is expected to lead to
some short-term revenue shortfalls from customs
VAT that are however expected to be compensated
by lower reimbursements within the year. The
"other taxes" with planned revenue of
EUR 90 million in 2019 as shown in the Stability
programme still need to be specified in the
preparation of the 2019 draft budget.
Net revenues of taxes newly introduced in 2017
appear to have been lower than expected. The
revenue of EUR 70 million in 2017 from the new
tax on sugary drinks turned out to be close to the
EUR 80 million target. However, the progressive
additional real estate tax (AIMI) introduced in
2017 and earmarked for the Social Security's
Financial Stabilisation Fund may bring
significantly lower net revenue than expected.
While gross revenues of around EUR 130 million
are expected for 2017 only EUR 50 million have
effectively been assigned to the Stabilisation Fund.
The reduced transfer to the Fund reflects the
expected impact of the deductibility of the
additional real estate tax for rented-out properties
in PIT and CIT declarations. The final net revenue
impact of AIMI will thus only be known after
3. Policy issues
25
completion of the 2017 PIT and CIT declaration
process.
Although the exact measures of further early
retirement reform are still subject to change,
their aim is to gradually further relax the
conditions and penalties for early retirement for
long careers. A first change of the rules for early
retirement was implemented as of October 2017.
This allows people who are now 60 years or older
and that have made contributions for 48 years or
more (9) to the social security or the legacy civil
service pension system to retire early without
penalty. This change is estimated to cover 11 500
early pensioners in 2018. The authorities are now
discussing further steps with the social partners.
The reforms will most likely be phased in over
three years, from 2019-2021. According to the
authorities, the affected cohorts are likely to
diminish over time, and while budgetary impacts
are planned to be limited, the reforms can be
expected to result in a decrease in the effective age
of early retirement.
Discretionary permanent increases in social
security spending are currently matched by
strong increases in social security contributions
which are, however, not permanent but cyclical.
In addition to the annual update to pensions as of
1 January, another extraordinary update of lower
pensions that were not updated between 2011 and
2015 will be carried out in August this year
(similar to the extraordinary update of August
2017). Several increases to the amounts and
coverage of various social transfers in the non-
contributory part of the social security system are
also being implemented, such as in the areas of
child benefits, inclusion of people with disabilities,
low income pensioners and low income families.
The relatively strong planned increases in
expenditure however are more than offset by
continued strong revenues from social security
contributions, particularly supported by steady
employment increases. For the medium term, the
authorities have acknowledged the ageing-cost
related challenge of the pension system and are
currently working with the OECD on a report to be
presented in early 2019 on possible ways forward.
(9) Or those at 60 years or more with 46 years of contributions
or more if they also started making contributions to the
Social Security when they were 14 years or less.
Additional ad-hoc funding including capital
injections continues to be administered
regularly to mitigate the long-standing issue of
rising hospital arrears. After a strong increase in
hospital arrears during most of 2017,
EUR 400 million were injected into the health
system in December, followed by an additional
EUR 500 million for capital injections into
hospitals between March and April 2018. Another
tranche of a further EUR 500 million for capital
injections are planned to be released in the second
half of 2018. Finally, a central reserve of
EUR 300 million would be available at year-end
bringing the total expected extra funding to around
EUR 1.7 billion over the two years. The authorities
thereby aim to prevent arrears from exceeding the
level seen at the end of 2017. While the injections
help to reduce the stock of arrears, their
accumulation appears to primarily reflect a
problem of under budgeting, monitoring and
enforcement practices in certain hospitals.
A new mission structure for hospitals has been
set up to tackle arrears and improve efficiency.
In the short term, the cross-departmental mission
structure will analyse the best way of
administering the remaining EUR 500 million to
be injected into the hospitals this year in order to
maximise their impact and to minimise moral
hazard. In the medium term, the structure will look
into ways of progressively eliminating the creation
of new hospital arrears. This will be done, for
instance, by improving the budgeting process with
more adequate financing, through better
information of actual costs in the hospitals, and by
optimising management and ensuring appropriate
incentives for health professionals. This entity’s
initial proposals are planned before the 2019 draft
budget. The implementation schedule for the
previously announced Integrated Responsibility
Centres, which seek to give more autonomy to
hospital teams as a way of promoting
organisational innovation and efficiency, still
remains to be established.
In view of continuous spending pressures, cost-
effectiveness continues to be promoted in the
National Health Service and in hospitals in
particular. The share of generics in the
pharmaceutical market continues to increase,
supported by incentives for pharmacies to promote
generics and by a rising number of generics being
approved at hospital level. According to the
European Commission
Post-Programme Surveillance Report
26
authorities, the use of generics is contributing to
the reduction in expenditure per patient, which has
been falling for a number of years. The use of
biosimilars also continues to increase, with
contractual incentives in hospitals and national
guidance in place to promote their use. Centralised
purchasing and annual price revisions also
continue to yield savings, although this may tend
to become increasingly difficult for the former
over time. Continuous spending pressures remain,
however, in particular related to the access to
innovations and the 35 hours for all health
personnel. In more general terms, pressures from
the costs of ageing also represent an increasing
challenge, as the long-term increase in public
health expenditure in Portugal is set to be among
the largest in the EU.
Despite continued progress in certain sectors,
aggregated operational results of State-Owned
Enterprises (SOEs) showed a mixed picture in
2017. Compared to 2016, overall EBITDA for
SOEs fell by 6% in 2017, driven mainly by a
significant deterioration in the results of health
SOEs. While still negative by a significant margin,
overall net profits improved by 17% in 2017,
largely on the back of substantial improvements in
the transport sector, which more than made up for
the decreases in the health sector. The Portuguese
authorities are committed to come close to
eliminating negative net profits by the end of this
year, which may be challenging. The non-
consolidated debt of public corporations included
in general government remains high despite having
fallen from 19.8% to 18.3% of GDP between 2017
and 2018. It fell by a further 0.1% of GDP in the
first quarter of 2018. Changes in working hours in
health SOEs as well as the unfreezing of careers in
general are already putting pressure on operational
costs and can be expected to continue to do so
beyond 2018.
Policy measures to enhance SOE monitoring
are slowly being rolled out. Some of the updates
planned for SIRIEF (the financial information
transfer system from SOEs to authorities) have
been implemented. The automatic uploading of
data to the system, for instance, is now available,
although it will take some time for all companies
to start using this feature. It is estimated that the
feature will be fully operational by 2019. In
addition to the annual submission by SOEs of
Activity and Budget Plans to the authorities, a
more comprehensive risk assessment methodology
is being introduced this year. Although it remains
at an early stage, the aim is to eventually transform
it into an early warning system for SOEs.
Management incentives for good governance in
SOEs remain frozen until financial results
improve.
Public-Private Partnership (PPP) payments are
projected to remain stable in 2018, although
new projects are planned for the next few years.
PPP payments turned out at around
EUR 1.6 billion in 2017, with a similar amount
being expected for 2018. While the trend of PPP
payments overall is projected to decrease over
time, the forecast does not include any new PPP
contracts to be signed, and is limited to the 2017
PPP portfolio and does therefore not include the
Metro do Porto operation and maintenance
contract nor the ANA airport concession. A new
Lisbon hospital PPP is expected to be awarded in
2020, with two new clinical services contracts to
be tendered within the upcoming two years. All of
these new contracts will be structured under the
2012 PPP law, which foresees more systematic
costs-benefits analysis for PPP projects that are
undertaken following the moratorium on PPPs
during the adjustment programme. Over the longer
term there is an expectation that as existing
contracts expire and Infraestruturas de Portugal
(IP) is likely to internalise the costs and
responsibilities arising from the State’s road
concessions, associated expenditures as a whole
for the public sector should gradually fall.
3.3. FINANCIAL AND CORPORATE SECTORS
A policy-related factor supporting the reduction
of NPLs is the authorities’ comprehensive
strategy addressing the issue of non-performing
assets. The NPL ratio remains among the highest
in the euro area, despite a drop by more than a
quarter in the stock of NPLs since June 2016. The
decline has been driven by economic growth,
write-offs and sales of non-performing loan
portfolios and improved loan recoveries. The
strategy is designed around three pillars: (a) a set
of legal and judicial reforms to enable banks to
sell, write off or maximise the recovery of non-
performing credits; (b) an "intrusive" prudential
supervision anchored in the SSM NPL reduction
targets for banks; and, (c) the full use of NPL
3. Policy issues
27
management solutions such as the creditors'
coordination platform, a joint venture between
three major Portuguese banks, which aims to
accelerate NPL reduction through joint work on
shared non-performing exposures. Continued
implementation of the measures included in the
comprehensive strategy would allow banks to
make more rapid progress in dealing with their bad
loans. In particular the limitation of access to PER
by non-insolvent companies and allowing more
flexibility for tax credits to be restructured should
further allow the banks to deal with their bad
assets. Nonetheless, despite the progress already
achieved, the stock of NPLs in Portugal is still
substantial, and authorities and banks should keep
up the NPL reduction momentum.
Banco de Portugal has introduced a borrower-
based macro-prudential measure covering new
mortgage and consumer loans. The central bank
aims at preventing excessive risk-taking by the
financial sector, in a context where credit standards
(in terms of loan-to-value (LTV), loan-to-income
(LTI) ratios and interest spreads applied to new
lending) have been eased over the past quarters,
and this trend is expected to further continue. This
macro-prudential measure is applicable to credit
agreements concluded since 1 July 2018 and
targets lenders and financial companies authorised
to grant this type of credit in Portugal. The
measure is aimed at promoting the adoption of
prudent credit standards on loans granted to
households in order to increase the sustainability
of households’ finances, and thus to bolster
financial stability and mitigate systemic risk. More
specifically, the measure introduces upper limits
to: (a) the loan-to-value ratio; (b) the debt service-
to-income ratio; (c) the maturity of loans; and (d) a
requirement of regular payments of both interest
and capital over the duration of the loan
agreement.
Work on strengthening the future loss-
absorbing capacity of Portuguese lenders is now
entering the implementation phase. MREL(10
) is
a critical part of each institution's resolution
strategy, in addition to having a well-coordinated
resolution plan. Significant institutions in Portugal
(10) MREL, or the minimum requirement for own funds and
eligible liabilities, set in place by the Single Resolution
Board, is the minimum loss-absorbing funds financial
institutions must hold.
have been informed about their respective
preliminary MREL targets. The aggregate amount
of bail-in-able debt to be issued over the next years
is significant, and may put pressure on profit
margins. Nevertheless, banks are confident they
will meet the MREL regulatory requirements. For
some lenders, MREL targets are already binding.
Most lenders are expected to start issuing MREL
eligible debt in 2018-2019. Achieving the
mandated amounts by the end of the transition
period in 2022 will in most cases imply a
combination of a reduction in risk-weighted assets
and wholesale funding issuance.
Insolvency procedures require further
improvements in terms of streamlining and
effectiveness. While the number of insolvencies
filed has been decreasing since 2014, the backlog
of cases is sizeable and procedures tend to be
lengthy. The average length for insolvency cases
was 49 months at the end of 2017, whereas the
average credit recovery rate for the creditor was
below 6% of the nominal value of the original
loan. Given that close to 90% of all insolvency
proceedings concern amounts that are below the
threshold of EUR 50 000, these indicators show
that bottlenecks in the capacity of the insolvency
system are likely to remain in place going forward.
Inefficiencies in insolvency proceedings also have
a major impact on the market value of non-
performing loan portfolios – the longer the
proceedings, the lower the value the market
assigns to these exposures. Notwithstanding the
many legislative amendments already introduced
to both the insolvency system and executive
proceedings, there is room for further
improvements that would not only increase the
marketable value of bad credits but also allow a
truly fresh start for some of the debtors.
European Commission
Post-Programme Surveillance Report
28
3.4. STRUCTURAL REFORMS
Labour Market
The government and the social partners signed
a tripartite agreement in June 2018 to address
labour market segmentation and strengthen
collective bargaining. The act followed extensive
tripartite discussions, built on the Green Paper on
Labour Relations (2016) and framed by the
Tripartite Commitment towards a Medium-Term
Agreement, signed in January 2017. The debate in
parliament started in July and is expected to
continue after the summer. Three strategic
objectives underpin the agreement: reduce labour
market segmentation and tackle precariousness;
promote a greater dynamism of collective
bargaining; strengthen the means and instruments
of labour market regulation.
The proposed measures tighten the regulation
of temporary contracts, but also extend the
probation period in case of first-time hires and
the long-term unemployed. Significant legal
changes include reducing the maximum duration
of fixed-term contracts from three to two years and
limiting the justifications for the use of temporary
contracts. The tripartite agreement also calls for
taxing excessive labour turnover, whereby the
definition of excessive (by sector) is to be defined
under regulatory decree, with the involvement of
Social Partners. Other measures aim to discourage
informal or under-declared work and promote
permanent hiring in seasonal economic sectors.
Protection of temporary agency workers is also
strengthened. At the same time, the probationary
period of workers on their first job and newly hired
long-term unemployed increased to 180 days (but
professional traineeships would also count towards
the probationary period). In parallel, the
government presented a Resolution by the Council
of Ministers on the approval of the Action
Programme to combat precariousness and to
promote collective bargaining.
Overall, the measures have the potential to
reduce labour market segmentation, although
there is a risk of new distortions being created.
Overall effects may depend on details that are yet
to be worked out. For example, the definition of
"excessive turnover", on which a surcharge of
social security contributions may be based, will be
important. Tightening the rules on temporary
contracts may reduce their use in favour of
permanent jobs, but it involves the risk that some
temporary jobs may not be created anymore. The
continued reliance on extensive dialogue and
social consensus is to be welcomed as it may help
to strike the right balance between the needs of
employees and employers.
The planned measures also tighten the rules
regarding working time regulation. The package
includes provisions to eliminate the so-called
"bank of hours based on individual agreement" and
the "collective bank of hours with individual
agreement origin", creating instead a new bank of
hours based on group agreements. Such working
time schemes should in the future be negotiated in
collective agreements (or the new group
agreements) and would not be allowed on
individual basis.
Further progress is reported on active labour
market policies. The assessment of adopted
measures like Contrato-Emprego and Prémio-
Emprego since 2017 until March 2018 proved an
increase in the total coverage of both measures.
The implementation of the measure Contrato-
Geracao targeting the employment of young
people and older long-term unemployed is
included in the tripartite agreement. The one-stop
shops for employment are now implemented
covering three areas of intervention: upgrade of the
online interface, improved relationship with users
(to promote a more personalised and integrated
service) and stronger coordination with other
services (notably Social Security).
The increasing minimum wage sets the wage
level for an ever larger share of workers, but
adverse effects on employment are not clearly
observable to date. The minimum wage was
increased by about 5% to EUR 557 per month in
2017, and by another 4% to EUR 580 as of
1 January 2018. The government intends to raise
the minimum wage again in 2019. Increases since
2014 lead to a significant increase in coverage.
According to administrative data (based on social
security declarations), 22% of workers earned the
minimum wage in 2017, up from 20.6% from
2016. Quarterly reports by the government monitor
the effects of the minimum wage on the labour
market. The minimum wage increases continue in
a context of strong employment growth. In
3. Policy issues
29
particular, the employment rate of low-skilled
workers has rebounded strongly in the past three
years. Still, the impact of (past and future
minimum wage increases) on employability of low
skilled workers and the wage distribution needs
continuous monitoring.
Collective bargaining numbers are increasing
towards pre-crisis levels. According to official
data, the number of new or renewed collective
agreements in 2017 revealed a substantial increase
since 2015, especially at firm and sector levels.
The number of covered workers has reached the
highest level (around 821 000) in 2017 recovering
from the lowest (around 242 000) in 2013 and the
vast majority are covered by sector level
agreements. After the new rules on the extension
of collective agreements were put in place (namely
the reduction to 35 working days of the
administrative deadline to publish extension
ordinances), the average number of days for the
publication decreased from 53 to 34. In the first
quarter of 2018, the number of workers estimated
to be covered by renewed collective agreements is
around 75 000, more than doubling the number of
the first quarter of 2017.
Social policies
In order to improve and simplify access to
social security, the government is implementing
new functionalities. Following the 2018 National
Reform Plan’s strategy for "Simplifying the Social
Security System", a wide range of measures (42)
are planned, some of which are already under
implementation. One of the most important
consists of a new online simulator allowing
estimating the amount of the pension to be earned
when reaching retirement age. This measure is
taken up strongly by the potential users, with a
total of 1.03 million of simulations over the first
month. Other measures include the online
availability of various debt-related functionalities,
including consultation of the contributory situation
and debt management by citizens; a queue
management system; and an online application and
consultancy system for social and family benefits.
Portugal continues to pursue a strategy of
reinstatement of social benefits along with social
inclusion measures. The coverage of social
protection for low-income families (RSI-
Rendimento Social de Insercao) has increased
mainly due to simplification of procedures as well
as to specific measures aiming to improve the
benefit take-up level. In addition, child benefits
(coverage and amounts) for children up to 36
months of age as well as supplementary social
benefits (CSI) for pensioners have increased
gradually.
Education and vocational training
The Portuguese National Reform Programme
addresses different levels of education and
training. The main objectives are to reduce school
failure and early leaving from education and
training (especially those not in education,
employment or training (NEETs) and to increase
skills and employability of young people and
adults. As regards vocational education and
training (VET), the government proposes an
adjustment of the system to labour market needs,
meaning a close relationship between the National
Catalogue of Qualifications, the establishment of
an Anticipation of Labour Market Needs System
and the European Quality Assurance in VET. The
QUALIFICA programme is a main driver of the
process, targeting low-skilled adults, unemployed
people and NEETs. Until the end of April 2018,
this programme accounted for 179 480 adults
engaged, 98 275 oriented to education and training
programmes, 42 034 on recognition of prior
learning, and 13 452 already certified.
Portugal is one of the first member states to
complete the action phase of the National Skills
Strategy. In the final report presented in May,
three main priorities were identified in the action
phase: communication and awareness; access,
quality and outcomes; and effective financing and
governance. Although these priorities have mostly
only long-term impact in of the actual
implementation of reforms, the trends are already
positive. The retention rate has been decreasing in
the last three school years in all cycles and the
early leaving rate from education has reached
12.6% in 2017 (getting near the 10% target of
2020). The National Programme to Promote
School Success included action strategic plans in
663 out of 811 public school clusters across the
country, including 585 new full-time teachers and
other specialists. The Specific Tutorial Support
reached already more than 80% of all the eligible
students, engaging more than 2 700 tutors. For the
2016/17 school year, the tutorship programme
European Commission
Post-Programme Surveillance Report
30
reveals improved behaviour, assiduity,
performance and satisfaction of students.
Measures to increase participation in Science,
Technology, Engineering and Mathematics
(STEM) are being implemented. For 2018, the
government recommended higher education
institutions to allocate increased national
competition placements to STEM areas. In
addition, 36% of the Professional Higher
Technical Courses on offer were in STEM areas,
representing 42% of the newly enrolled in 2018.
The spending on education has been reviewed,
with the 2018 State Budget aiming at:
demographic evolution of the teaching staff,
reduction of absenteeism, rationalisation of
Association Contracts, elimination of banking
transfer commissions and saving on school
management by the use of digital tools. These
measures could account for EUR 50 million in
additional savings.
Business environment
The efforts for improving the business
environment involve measures for direct
support to investors and reduction of the
administrative burden. Direct support measures
include the Capitalizar programme for
restructuring and recapitalisation of potentially
viable but highly indebted firms and a wide range
of activities run by the investment agency AICEP
in support of FDI and internationalisation of
domestic companies, mostly SMEs. The reforms
aimed at reducing the administrative burden are
concentrated on the Simplex+ programme for
modernisation and simplification of public services
but cover also other areas such as regulated
professions as well as measures described in other
parts of this report, including the labour market,
housing, and judicial reforms.
Following the expansion of the Capitalizar
programme in 2017, some new measures have
been introduced by June 2018. These include a
business mediator to help debtors during
insolvency and restructuring, new credit lines, tax
incentives for reinvestment of profits, the reversion
of the burden of proof for new management and
insolvency administrators regarding the company’s
tax debit and the launch of business training to
promote interaction between firms and new
investors. New measures are also designed in
support of access to equity financing, including
venture capital and business angels, as well as the
creation of a Business Gateway website to
centralise the information on financial support.
Besides, an early warning system to prevent
insolvencies is set to be introduced by the end of
2018. It is estimated by the government that 87%
or 73 measures under the Capitalizar programme
were either implemented or in progress as of June
2018.
Support for export-oriented investments is
expanding. The measures undertaken by the
investment agency AICEP for internationalisation
of domestic companies, mainly SMEs, are based
on six pillars. These encompass general and tailor-
made services related to: market research, human
resources, financing, FDI, branding, and reduction
of red tape. The agency is working with
universities on development of online e-learning
tools and tailor-made support programmes. A large
number of internationalisation projects are also
benefiting from EU funding. The agency thus
estimates that the share of exports in GDP is set to
rise from about 43% in 2017 to 50% by 2020-21,
driven mainly by SMEs.
A roadmap to decrease administrative burden
is being implemented. An evaluation of Simplex+
2017 is ongoing following the evaluation of
selected measures to Simplex+ 2016. Some
planned measures under Simplex+ 2017 include:
expanding Espaço Empresa giving customised
services for businesses to local investment desks
run by municipalities, with back office supported
from the central administration; replacing paper
files with digital ones for tax inspection or
introducing templated electronic invoices. The
Simplex+ programme is introducing some
administrative simplification for public
procurement and some horizontal issues relevant
for business-administration relations, mainly
through e-government initiatives of digitalisation
and implementation of the once-only principle.
The shift towards e-procurement is expected to
increase SMEs participation in public tenders.
Administrative and regulatory barriers still
restrict competition in professional services. The
by-laws for highly regulated professions are more
restrictive than the framework law setting the basis
for the sector. Many activities are reserved to
3. Policy issues
31
highly regulated professions, preventing
competitors from provision of ancillary services
and resulting in higher prices and lower choice,
innovation and quality of services. Following a
joint study with the OECD, released in July 2018,
the Portuguese Competition Authority has drafted
a large number of proposals to the government to
further simplify regulations for highly regulated
professions and transport services. However, the
follow-up process may be relatively long and is
likely to face resistance from interested parties.
Justice sector and public procurement
The efficiency of the justice system is improving
but the length of proceedings remains among
the worst in the EU. The data are heavily affected
by the backlog, as the closure of old cases weighs
on the average outcome while the disposition time
on new cases is much more efficient. A three-
pronged strategy started to be implemented in
2017, introducing changes to the judicial system to
speed up insolvency and restructuring proceedings.
Progress is reported in insolvency procedures,
liquidation and corporate restructuring while no or
very limited progress is observed in administrative
and fiscal cases. Authorities are implementing
ambitious reforms in all judicial areas but a more
significant impact on outcomes is expected in only
two or three years.
Administrative and tax courts still face
significant challenges. It is estimated that more
than 30% of the fiscal cases take more than three
years to be resolved. There are also some purely
technical or organisational issues slowing the
efficiency of judicial procedures that need to be
properly addressed, according to the progress
evaluation presented by the state experts. Measures
have been proposed such as new sections in the
administrative court dealing with public officials’
claims and the creation of two sections in the tax
courts, one for execution and one for reviewing
administrative infringement procedures. The
shortage of human resources is also tackled as new
staff is being hired and trained.
The use of direct awards declined since the
entry into force of the new procurement code as
of January 2018. Data show a decline by about
30% y-o-y in the first quarter of 2018 due to the
lowering of the thresholds. The new code
transposes the European Public Procurement
Directives promoting transparency and better
management of public contracts. In particular, a
contract manager figure is set to give support in
technically and financially complex contracts. The
revision also brings stricter restrictions on the use
of direct awards and it will include a prior
consultation of three tenders mandatory for higher
value non-competitive procedures. This is
welcome given the shortcomings regarding
transparency of public procurement procedures.
However, the efficiency of the public procurement
needs to be further improved in order to have a
critical impact on the quality of publicly financed
projects.
Corruption remains an area of concern for
businesses in Portugal. The 2017 Eurobarometer
shows that 58% of business representatives in
Portugal consider corruption a problem for their
company (EU average: 37%). The Prosecutor
General continues efforts to improve the
effectiveness of anti-corruption investigations.
Measures in this area include digitalisation of the
collection and analysis of evidence and
strengthening cooperation with audit and control
bodies. On the preventive side, prevention plans
set up in each public institution have been largely
formalistic and not adapted to each organisation
nor complemented by adequate monitoring. Some
efforts are being made by the Council for the
Prevention of Corruption to improve the culture of
integrity in public institutions. The ad-hoc
parliamentary committee for improving
transparency in public offices has not yet
concluded its work and many of the anticorruption
pledges introduced in the government programme
(Governo de Portugal 2015) have not yet been
adopted. These include dedicated lobbying
regulation, a code of conduct to political offices
holders, senior public officials and civil servants, a
public registry of interests for local government
officials and a ban on the acceptance of judicial
cases against public bodies for Members of
Parliament working as lawyers.
Transport
The transport sector is expected to attract
significant investments in infrastructure over
the medium run. Most of the funding will be
directed to railways and ports where the value of
projects in the pipeline is estimated at
EUR 2.2 billion and EUR 2.5 billion respectively.
European Commission
Post-Programme Surveillance Report
32
The national budget and EU funds are the main
source for railway investments while most of the
financing in ports (83%) is expected to come from
the private sector. To a large extent the projects in
the two sectors are complementary and aimed at
improving the cargo links of Portuguese ports with
Spain and expanding the range of business
activities in port areas in line with the new port
strategy adopted in 2017. The other major
investments in the transport sector are the ongoing
expansions of the metro lines in Lisbon and Porto
and the main Humberto Delgado airport in Lisbon
as well as the expected commercialisation of
Lisbon's complementary Montijo airport as of
2022.
Railways are still underused, particularly in the
connection with Spain. Consequently, freight rail
traffic intensity remains among the lowest in
Europe. A detailed joint strategy by Portugal and
Spain, including the deployment of rail
interoperability in the Iberian Peninsula and
ultimately its connection with the French rail
network, is still missing. However, investment
commitments to three railway links with Spain
have been defined and progress has been achieved
with the adoption of the Commission decision in
April 2018 on the cross-border section Évora-
Mérida, connecting the port of Sines with Spain as
part of the Trans-European Atlantic Core Network
Corridor. As most of the current railway projects
are moving from design to a construction phase,
efficient implementation, also in the context of the
new procurement code, provides a good
opportunity to boost the international rail
performance. This is crucial to address the
peripheral situation of Portugal and exploit the
potential of Portuguese ports, so far harmed by a
‘road-only’ model.
Port concessions renegotiations are progressing
but a framework law is still lacking. The Leixões
port concession has been renegotiated, apparently
yielding positive results in terms of lower user
charges, higher cargo volumes and further
investment in the port. The goal of renegotiating
the main remaining port concessions is included in
the Memorandum of Understanding but the
process is falling significantly behind schedule.
For future concessions, a new framework law that
would introduce performance oriented objectives
in contractual agreements for concessions has been
in the government plans for more than three years.
However, the promulgation is being delayed. Port
concessions have been meanwhile examined by the
aforementioned joint study of the OECD and the
Portuguese Competition Authority and have been
outlined as one of the problematic areas in the
sector, particularly as concerns the long period of
concessions.
After a very strong performance of ports in
2017, cargo volumes dropped by around 10% in
the first quarter of 2018, reflecting repair and
maintenance works and bad weather. Port
activities however rebounded in April and May
and full-year growth is now expected at 3%, yet
much weaker than in 2017. On the other hand, the
cruise segment is expected to expand much faster
as cruise ship activity in the port of Lisbon surged
by 53% y-o-y in Jan-Apr 2018.
Energy
The energy market is clearly improving though
prices remain above the EU average. In the
electricity sector, the price margin relative to the
EU average is relatively small for industrial users
and more significant (8.9%) for household users,
according to the latest available Eurostat data for
the second half of 2017. The difference in the
household sector is due to the larger burden of
levies and taxes in Portugal, as the price excluding
those charges is below the EU average. This
burden is generated to a large extent by charges
related to the need of repaying the tariff debt in the
sector as well as the feed-in tariff reflecting
financial commitments to power producers in the
past. The tariff debt declined by 7% in both 2016
and 2017 and is projected to further decline by
17% in 2018. Under the current baseline scenario,
the debt is expected to be fully repaid by the end of
2021. This would reduce the overall burden on the
final price paid by household and industrial
consumers. The feed-in tariff is also expected to
decline, as all new contracts with producers are
signed on market terms without any regulatory
burden on final prices and commitments to past
contracts affecting the feed-in tariff will gradually
expire over the coming decade. Meanwhile the
liberalisation of supplies has advanced with the
share of users buying electricity from the free
market growing well above 90%.
New investment projects might develop the
electricity sector further. In addition to the large
3. Policy issues
33
projects in the hydropower sector, new
photovoltaic capacity for a total of over one
gigawatt have been installed and approved on
market terms by June 2018. The electricity
interconnection with Spain is expected to be
upgraded by a new link although the current export
capacity restraints are linked mostly to the
interconnection of Spain with France. Portugal is
also contemplating a project for building a power
link to Morocco in order to expand the options for
exporting electricity in periods of excess supply. in
addition, the heavy rainfalls in March and April
were also positive for the energy market by
boosting the country's electricity exports and
filling up water reservoirs for balancing power
supplies. This impact was particularly strong in
March, where the renewable power production
exceeded the monthly consumption of electricity.
As regards natural gas supplies, the price for
industrial users is similar to the EU average but
significantly higher (26%) for household users.
The margins are identical with or without taxes
and levies. The use of natural gas by households is
however low in Portugal due to the very limited
need for heating energy. In the household gas
sector, about 96% of the customers are serviced on
the liberalised market while the market for
industrial users is fully liberalised. Therefore price
fluctuations largely depend on external market
factors with pipeline gas covering about two-thirds
of consumption and the rest is covered by LNG.
Housing
The housing market continues facing a number
of problems stemming from inefficient use of
the housing stock and volatile property and
rental prices. It is estimated that about 12% of the
housing stock is underused due to various factors
such as insufficient levels of investment in
renovation, income disparities and rental market
failures. While some of the problems are due to
objective factors such as uneven market dynamics
in tourist and residential areas, some of the
inefficiencies are driven by the regulatory
framework. The problems faced by property
owners include non-payment of rents and slow
procedures for contract enforcement. As a result,
property owners are often not interested in long-
term rentals and this tendency is further supported
by the strong rise in demand for short-term rents in
popular tourist areas. This is creating significant
price pressures on the rental market, particularly in
the city of Lisbon, while at aggregated national
level rental prices are less dynamic than the house
price index reported in chapter 2.1.
To address inefficiencies, the government
adopted in April 2018 a comprehensive set of
housing policies and market reforms. The so-
called package of New Generation of Housing
Policies comprises measures and programmes
aimed at supporting access to housing, affordable
rental prices, mobility, and social integration of
neighbourhoods. The package includes a
programme to promote public housing for low
income families or direct financial support to low-
income families, tax incentives to long-term rents
and a new insurance instrument for non-payment
of rents to be equally paid by tenants and
landlords. There are also measures promoting
refurbishment of properties. Overall, the legal
package is trying to address the main weaknesses
on the housing market and is also expanding the
social element of the regulatory framework.
However, the proposals have generated a heated
debate with mixed reactions among property
owners and tenants. In particular, the national and
Lisbon associations of property owners expressed
concerns that the measures will further shift the
regulatory framework in favour of tenants and
discourage property owners to rent out. There is a
risk that the legal amendments might fail to strike
the right balance between supply and demand in
order to encourage a more efficient use of the
housing stock.

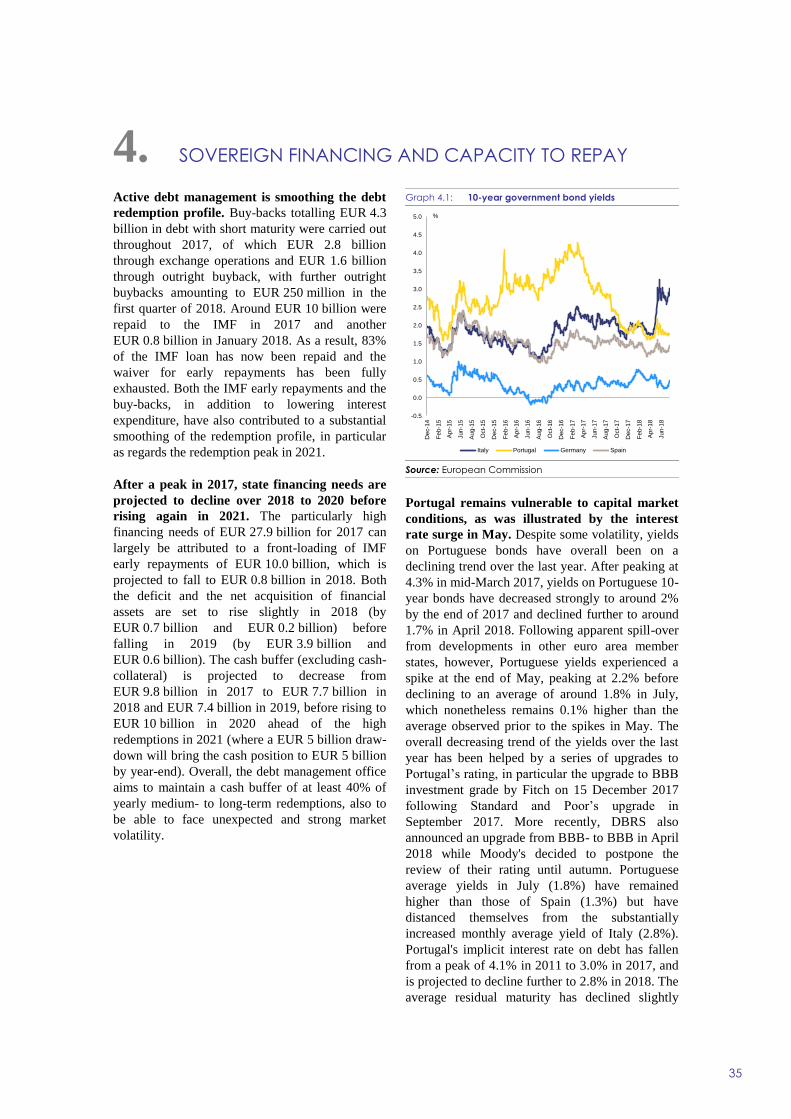
4. SOVEREIGN FINANCING AND CAPACITY TO REPAY
35
Active debt management is smoothing the debt
redemption profile. Buy-backs totalling EUR 4.3
billion in debt with short maturity were carried out
throughout 2017, of which EUR 2.8 billion
through exchange operations and EUR 1.6 billion
through outright buyback, with further outright
buybacks amounting to EUR 250 million in the
first quarter of 2018. Around EUR 10 billion were
repaid to the IMF in 2017 and another
EUR 0.8 billion in January 2018. As a result, 83%
of the IMF loan has now been repaid and the
waiver for early repayments has been fully
exhausted. Both the IMF early repayments and the
buy-backs, in addition to lowering interest
expenditure, have also contributed to a substantial
smoothing of the redemption profile, in particular
as regards the redemption peak in 2021.
After a peak in 2017, state financing needs are
projected to decline over 2018 to 2020 before
rising again in 2021. The particularly high
financing needs of EUR 27.9 billion for 2017 can
largely be attributed to a front-loading of IMF
early repayments of EUR 10.0 billion, which is
projected to fall to EUR 0.8 billion in 2018. Both
the deficit and the net acquisition of financial
assets are set to rise slightly in 2018 (by
EUR 0.7 billion and EUR 0.2 billion) before
falling in 2019 (by EUR 3.9 billion and
EUR 0.6 billion). The cash buffer (excluding cash-
collateral) is projected to decrease from
EUR 9.8 billion in 2017 to EUR 7.7 billion in
2018 and EUR 7.4 billion in 2019, before rising to
EUR 10 billion in 2020 ahead of the high
redemptions in 2021 (where a EUR 5 billion draw-
down will bring the cash position to EUR 5 billion
by year-end). Overall, the debt management office
aims to maintain a cash buffer of at least 40% of
yearly medium- to long-term redemptions, also to
be able to face unexpected and strong market
volatility.
Graph 4.1: 10-year government bond yields
Source: European Commission
Portugal remains vulnerable to capital market
conditions, as was illustrated by the interest
rate surge in May. Despite some volatility, yields
on Portuguese bonds have overall been on a
declining trend over the last year. After peaking at
4.3% in mid-March 2017, yields on Portuguese 10-
year bonds have decreased strongly to around 2%
by the end of 2017 and declined further to around
1.7% in April 2018. Following apparent spill-over
from developments in other euro area member
states, however, Portuguese yields experienced a
spike at the end of May, peaking at 2.2% before
declining to an average of around 1.8% in July,
which nonetheless remains 0.1% higher than the
average observed prior to the spikes in May. The
overall decreasing trend of the yields over the last
year has been helped by a series of upgrades to
Portugal’s rating, in particular the upgrade to BBB
investment grade by Fitch on 15 December 2017
following Standard and Poor’s upgrade in
September 2017. More recently, DBRS also
announced an upgrade from BBB- to BBB in April
2018 while Moody's decided to postpone the
review of their rating until autumn. Portuguese
average yields in July (1.8%) have remained
higher than those of Spain (1.3%) but have
distanced themselves from the substantially
increased monthly average yield of Italy (2.8%).
Portugal's implicit interest rate on debt has fallen
from a peak of 4.1% in 2011 to 3.0% in 2017, and
is projected to decline further to 2.8% in 2018. The
average residual maturity has declined slightly
-0.5
0.0
0.5
1.0
1.5
2.0
2.5
3.0
3.5
4.0
4.5
5.0
Dec-1
4
Feb-1
5
Ap
r-15
Jun
-15
Au
g-1
5
Oct-
15
Dec-1
5
Feb-1
6
Ap
r-16
Jun
-16
Au
g-1
6
Oct-
16
Dec-1
6
Feb-1
7
Ap
r-17
Jun
-17
Au
g-1
7
Oct-
17
Dec-1
7
Feb-1
8
Ap
r-18
Jun
-18
Italy Portugal Germany Spain
%
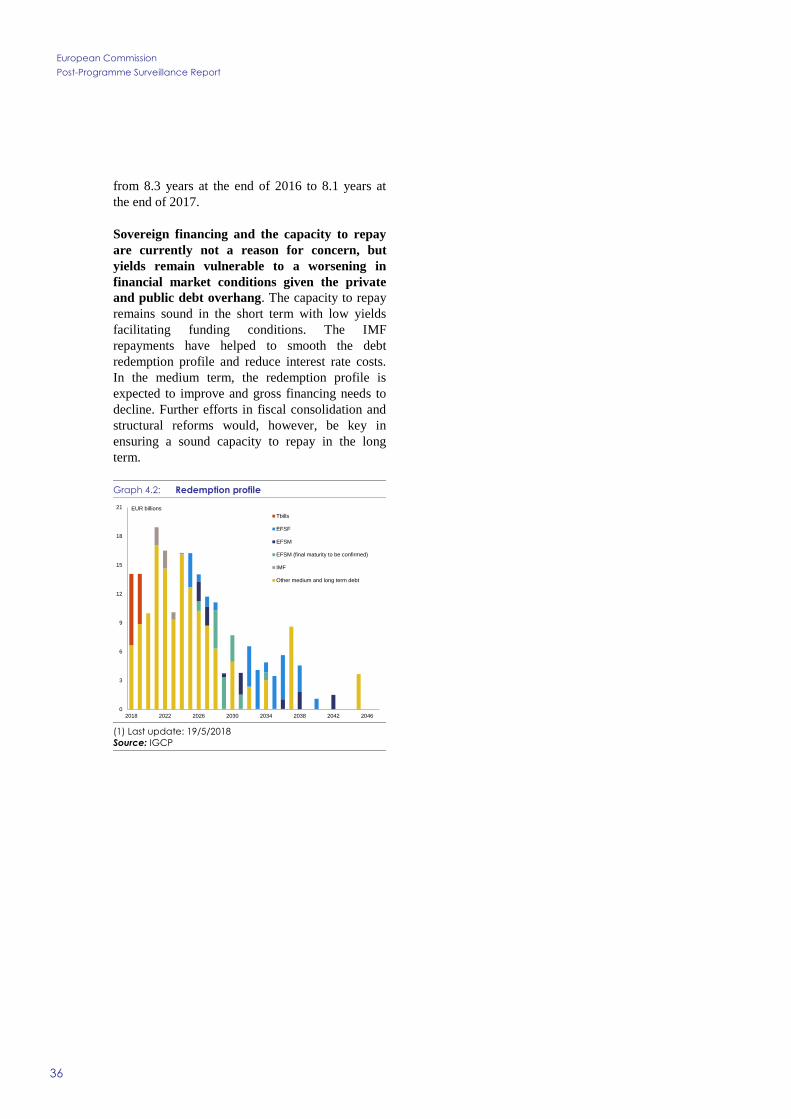
European Commission
Post-Programme Surveillance Report
36
from 8.3 years at the end of 2016 to 8.1 years at
the end of 2017.
Sovereign financing and the capacity to repay
are currently not a reason for concern, but
yields remain vulnerable to a worsening in
financial market conditions given the private
and public debt overhang. The capacity to repay
remains sound in the short term with low yields
facilitating funding conditions. The IMF
repayments have helped to smooth the debt
redemption profile and reduce interest rate costs.
In the medium term, the redemption profile is
expected to improve and gross financing needs to
decline. Further efforts in fiscal consolidation and
structural reforms would, however, be key in
ensuring a sound capacity to repay in the long
term.
Graph 4.2: Redemption profile
(1) Last update: 19/5/2018
Source: IGCP
0
3
6
9
12
15
18
21
2018 2022 2026 2030 2034 2038 2042 2046
EUR billions
Tbills
EFSF
EFSM
EFSM (final maturity to be confirmed)
IMF
Other medium and long term debt
ANNEX 1
European Commission Debt sustainability analysis
37
This Debt Sustainability Analysis (DSA) uses the
Commission 2018 spring forecast as a starting
point to ensure cross-country consistency and to
take into account second-round macroeconomic
effects. The debt ratio in 2017 turned out at
125.7% of GDP, a 4.2 pps. decrease from 2016,
mostly due to higher growth, falling interest
expenditure and substantial negative (i.e. debt-
decreasing) stock-flow adjustments (in particular a
decrease of the cash buffer). For 2018, the
Commission 2018 spring forecast projects a ratio
of 122.5% of GDP. This corresponds to a decrease
by 3.2 pps., which is mostly due to an increasing
primary surplus that is however partially offset by
lower GDP growth, and slightly debt-increasing
stock-flow adjustments explaining the deceleration
of the decrease as compared to 2017. For the outer
years, the analysis rests on the following
assumptions: (i) the structural primary fiscal
balance (before costs of ageing) remains
unchanged at a surplus of 2.3% of GDP from 2019
under the no-policy-change assumption,
(ii) inflation converges linearly to 2.0% by 2022
and remains at that level thereafter, (iii) the
nominal long-term interest rate on new and rolled-
over debt converges linearly to 5% by 2026 in line
with the assumptions agreed with the Economic
Policy Committee’s (EPC) Ageing Working
Group, (iv) real GDP growth rates of around 1%,
and (v) ageing costs develop according to the
Commission and EPC 2018 Ageing Report.
The baseline scenario results in an annual average
decrease of the gross debt-to-GDP ratio by around
1.4pps. of GDP from 2019 onwards and thus
ensures a declining path down to 108.5% of GDP
by 2028. This declining debt trajectory is sensitive
to financial market volatility and vulnerable to
negative economic developments. Graph A1.1
presents a sensitivity analysis with respect to
macro-economic and financial market risks. More
precisely, the graph illustrates the sensitivity of the
debt trajectory to an increase of real GDP growth
and hikes in interest rates as from 2018. The
analysis suggests that a lower GDP growth rate by
0.5 pps. or a one percentage point increase in the
interest rate on maturing and new debt would
increase the debt ratio by 0.6% and 0.2% of GDP,
respectively, in 2018. Debt would be at about
115% and 113% of GDP respectively by the end of
the projection period. A combined negative growth
and interest shock could put the debt-to-GDP ratio
on an accelerating path towards the end of the
projection period, again exceeding 120% of GDP
in 2028. On the other hand, a positive shock to
medium and long-term growth or permanently
lower interest rates would result in a more solid
path of debt reduction of close to 2 pps. per annum
to around 103% of GDP in 2028. A combination of
higher GDP growth and lower interest rates could
further accelerate the pace of the debt ratio
reduction to around 2.4 percentage points per year,
thereby allowing for a fall in debt to around 98%
of GDP in 2028.
Additional fiscal consolidation would clearly
accelerate the debt reduction path as shown in
Graph A1.2, illustrating the effect of alternative
fiscal consolidation paths. Full compliance with
the requirements of the Stability and Growth Pact
(SGP) would considerably further accelerate debt
reduction. The SGP scenario assumes convergence
to the Medium-Term-Objective (MTO) according
to the matrix of required fiscal adjustment in
Annex 2 of the January 2015 Communication on
flexibility in fiscal rules (11
). This would imply that
the MTO of a structural balance of 0.25% of GDP
would be reached in 2021 with a fiscal effort of
0.6% of GDP every year from 2019 to 2021.
Maintaining the MTO over the longer term horizon
would require structural primary surpluses of
around 4% until the end of the projection horizon.
Under these assumptions, the debt-to-GDP ratio
would markedly accelerate its decline to around 3
percentage points per annum, falling to 92% by
2028.
(11) COM(2015) 12.
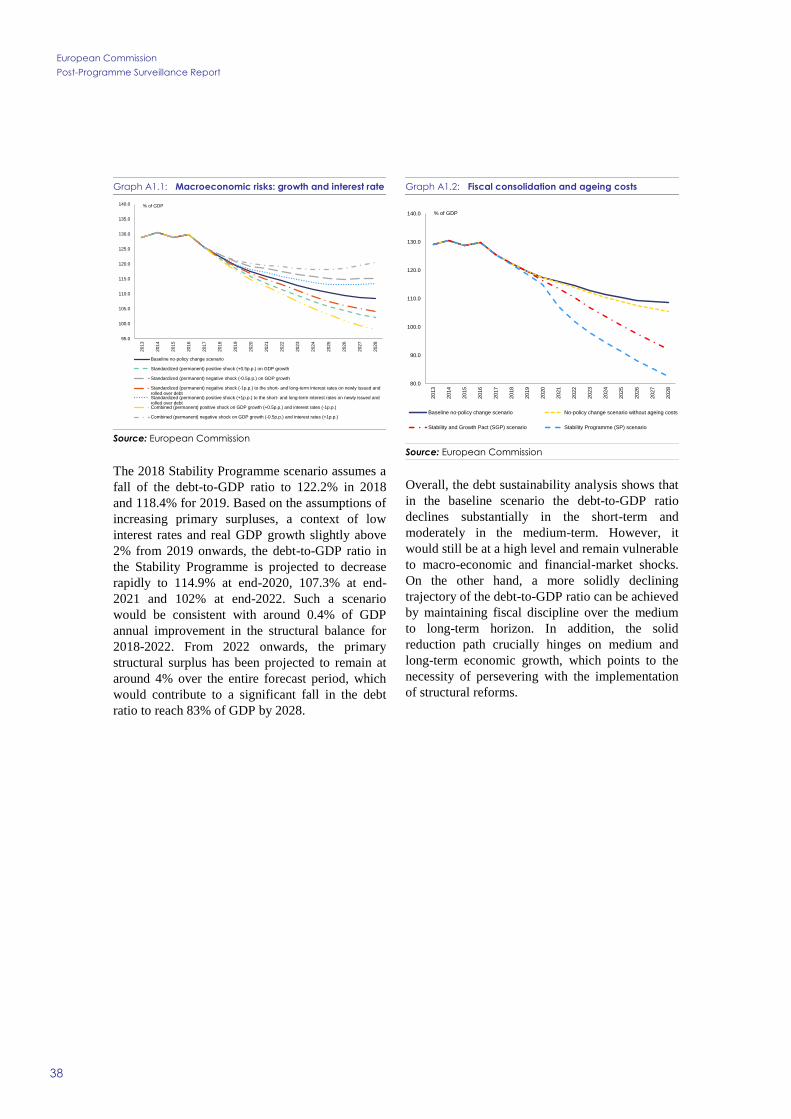
European Commission
Post-Programme Surveillance Report
38
Graph A1.1: Macroeconomic risks: growth and interest rate
Source: European Commission
The 2018 Stability Programme scenario assumes a
fall of the debt-to-GDP ratio to 122.2% in 2018
and 118.4% for 2019. Based on the assumptions of
increasing primary surpluses, a context of low
interest rates and real GDP growth slightly above
2% from 2019 onwards, the debt-to-GDP ratio in
the Stability Programme is projected to decrease
rapidly to 114.9% at end-2020, 107.3% at end-
2021 and 102% at end-2022. Such a scenario
would be consistent with around 0.4% of GDP
annual improvement in the structural balance for
2018-2022. From 2022 onwards, the primary
structural surplus has been projected to remain at
around 4% over the entire forecast period, which
would contribute to a significant fall in the debt
ratio to reach 83% of GDP by 2028.
Graph A1.2: Fiscal consolidation and ageing costs
Source: European Commission
Overall, the debt sustainability analysis shows that
in the baseline scenario the debt-to-GDP ratio
declines substantially in the short-term and
moderately in the medium-term. However, it
would still be at a high level and remain vulnerable
to macro-economic and financial-market shocks.
On the other hand, a more solidly declining
trajectory of the debt-to-GDP ratio can be achieved
by maintaining fiscal discipline over the medium
to long-term horizon. In addition, the solid
reduction path crucially hinges on medium and
long-term economic growth, which points to the
necessity of persevering with the implementation
of structural reforms.
95.0
100.0
105.0
110.0
115.0
120.0
125.0
130.0
135.0
140.0
2013
2014
2015
2016
2017
2018
2019
2020
2021
2022
2023
2024
2025
2026
2027
2028
Baseline no-policy change scenario
Standardized (permanent) positive shock (+0.5p.p.) on GDP growth
Standardized (permanent) negative shock (-0.5p.p.) on GDP growth
Standardized (permanent) negative shock (-1p.p.) to the short- and long-term interest rates on newly issued androlled over debtStandardized (permanent) positive shock (+1p.p.) to the short- and long-term interest rates on newly issued androlled over debtCombined (permanent) positive shock on GDP growth (+0.5p.p.) and interest rates (-1p.p.)
Combined (permanent) negative shock on GDP growth (-0.5p.p.) and interest rates (+1p.p.)
% of GDP
80.0
90.0
100.0
110.0
120.0
130.0
140.0
2013
2014
2015
2016
2017
2018
2019
2020
2021
2022
2023
2024
2025
2026
2027
2028
Baseline no-policy change scenario No-policy change scenario without ageing costs
Stability and Growth Pact (SGP) scenario Stability Programme (SP) scenario
% of GDP
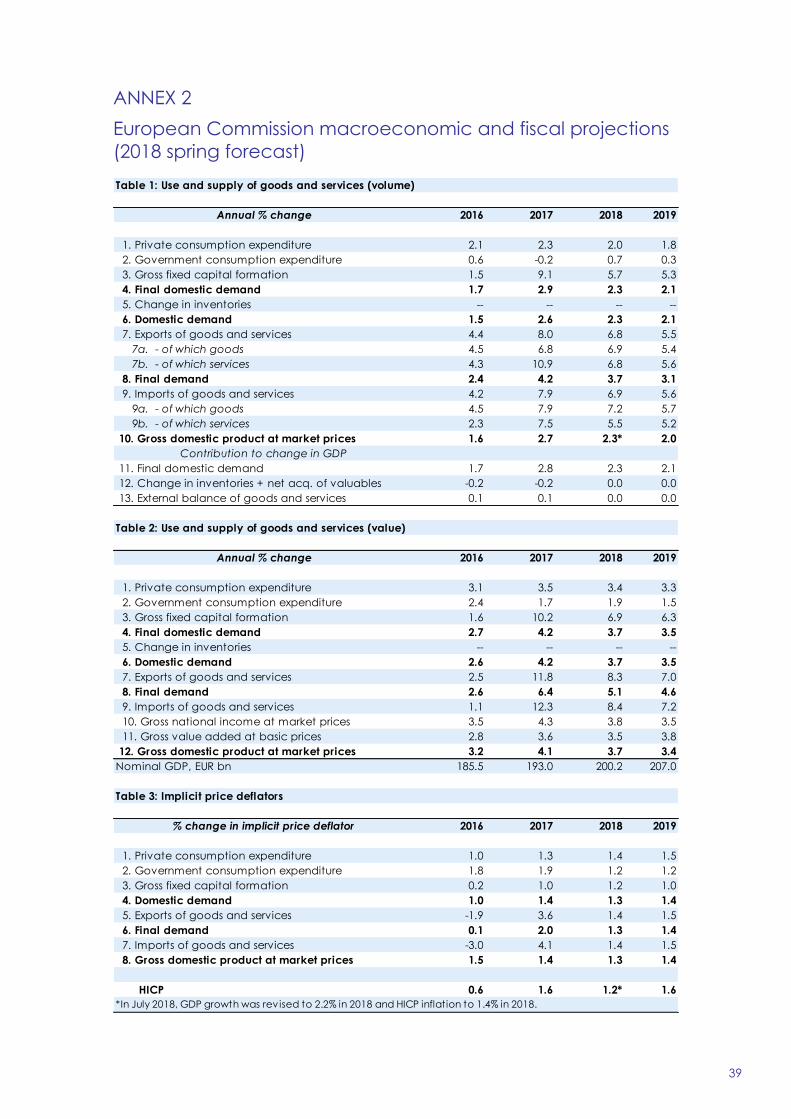
ANNEX 2
European Commission macroeconomic and fiscal projections
(2018 spring forecast)
39
Table 1: Use and supply of goods and services (volume)
Annual % change 2016 2017 2018 2019
1. Private consumption expenditure 2.1 2.3 2.0 1.8
2. Government consumption expenditure 0.6 -0.2 0.7 0.3
3. Gross fixed capital formation 1.5 9.1 5.7 5.3
4. Final domestic demand 1.7 2.9 2.3 2.1
5. Change in inventories -- -- -- --
6. Domestic demand 1.5 2.6 2.3 2.1
7. Exports of goods and services 4.4 8.0 6.8 5.5
7a. - of which goods 4.5 6.8 6.9 5.4
7b. - of which services 4.3 10.9 6.8 5.6
8. Final demand 2.4 4.2 3.7 3.1
9. Imports of goods and services 4.2 7.9 6.9 5.6
9a. - of which goods 4.5 7.9 7.2 5.7
9b. - of which services 2.3 7.5 5.5 5.2
10. Gross domestic product at market prices 1.6 2.7 2.3* 2.0
Contribution to change in GDP
11. Final domestic demand 1.7 2.8 2.3 2.1
12. Change in inventories + net acq. of valuables -0.2 -0.2 0.0 0.0
13. External balance of goods and services 0.1 0.1 0.0 0.0
Table 2: Use and supply of goods and services (value)
Annual % change 2016 2017 2018 2019
1. Private consumption expenditure 3.1 3.5 3.4 3.3
2. Government consumption expenditure 2.4 1.7 1.9 1.5
3. Gross fixed capital formation 1.6 10.2 6.9 6.3
4. Final domestic demand 2.7 4.2 3.7 3.5
5. Change in inventories -- -- -- --
6. Domestic demand 2.6 4.2 3.7 3.5
7. Exports of goods and services 2.5 11.8 8.3 7.0
8. Final demand 2.6 6.4 5.1 4.6
9. Imports of goods and services 1.1 12.3 8.4 7.2
10. Gross national income at market prices 3.5 4.3 3.8 3.5
11. Gross value added at basic prices 2.8 3.6 3.5 3.8
12. Gross domestic product at market prices 3.2 4.1 3.7 3.4
Nominal GDP, EUR bn 185.5 193.0 200.2 207.0
Table 3: Implicit price deflators
% change in implicit price deflator 2016 2017 2018 2019
1. Private consumption expenditure 1.0 1.3 1.4 1.5
2. Government consumption expenditure 1.8 1.9 1.2 1.2
3. Gross fixed capital formation 0.2 1.0 1.2 1.0
4. Domestic demand 1.0 1.4 1.3 1.4
5. Exports of goods and services -1.9 3.6 1.4 1.5
6. Final demand 0.1 2.0 1.3 1.4
7. Imports of goods and services -3.0 4.1 1.4 1.5
8. Gross domestic product at market prices 1.5 1.4 1.3 1.4
HICP 0.6 1.6 1.2* 1.6
*In July 2018, GDP growth was rev ised to 2.2% in 2018 and HICP inflation to 1.4% in 2018.
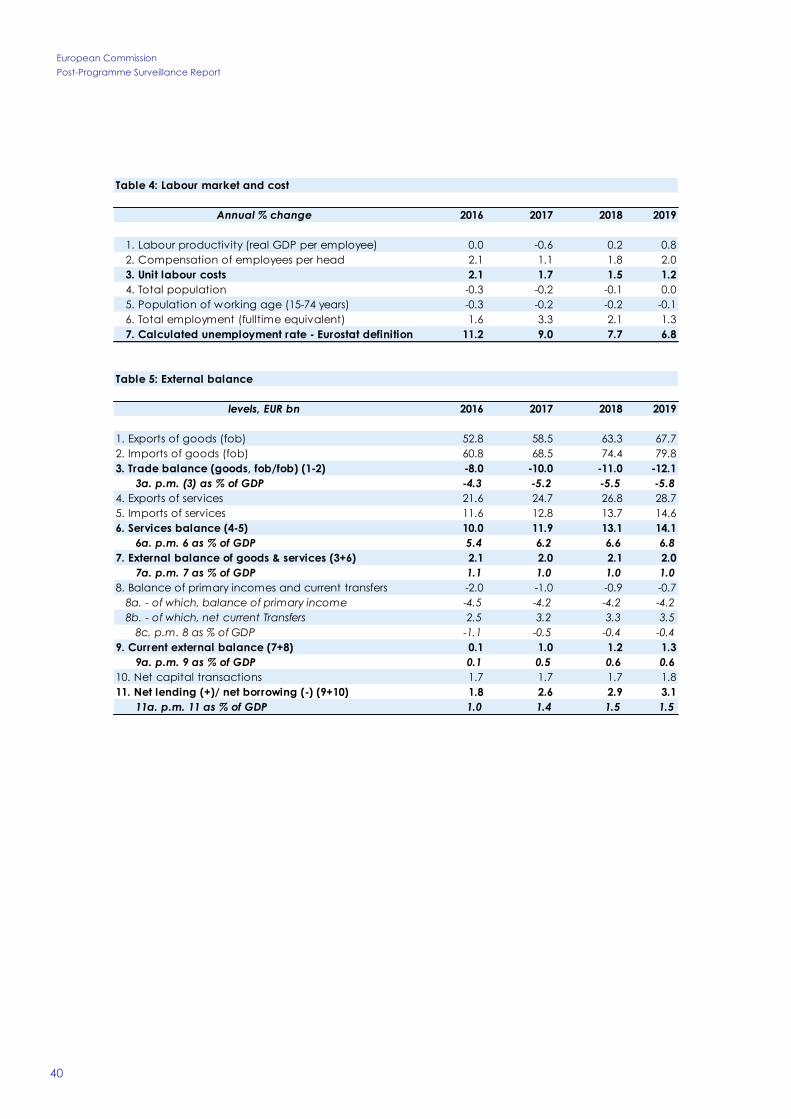
European Commission
Post-Programme Surveillance Report
40
Table 4: Labour market and cost
Annual % change 2016 2017 2018 2019
1. Labour productivity (real GDP per employee) 0.0 -0.6 0.2 0.8
2. Compensation of employees per head 2.1 1.1 1.8 2.0
3. Unit labour costs 2.1 1.7 1.5 1.2
4. Total population -0.3 -0.2 -0.1 0.0
5. Population of working age (15-74 years) -0.3 -0.2 -0.2 -0.1
6. Total employment (fulltime equivalent) 1.6 3.3 2.1 1.3
7. Calculated unemployment rate - Eurostat definition (%) 11.2 9.0 7.7 6.8
Table 5: External balance
levels, EUR bn 2016 2017 2018 2019
1. Exports of goods (fob) 52.8 58.5 63.3 67.7
2. Imports of goods (fob) 60.8 68.5 74.4 79.8
3. Trade balance (goods, fob/fob) (1-2) -8.0 -10.0 -11.0 -12.1
3a. p.m. (3) as % of GDP -4.3 -5.2 -5.5 -5.8
4. Exports of services 21.6 24.7 26.8 28.7
5. Imports of services 11.6 12.8 13.7 14.6
6. Services balance (4-5) 10.0 11.9 13.1 14.1
6a. p.m. 6 as % of GDP 5.4 6.2 6.6 6.8
7. External balance of goods & services (3+6) 2.1 2.0 2.1 2.0
7a. p.m. 7 as % of GDP 1.1 1.0 1.0 1.0
8. Balance of primary incomes and current transfers -2.0 -1.0 -0.9 -0.7
8a. - of which, balance of primary income -4.5 -4.2 -4.2 -4.2
8b. - of which, net current Transfers 2.5 3.2 3.3 3.5
8c. p.m. 8 as % of GDP -1.1 -0.5 -0.4 -0.4
9. Current external balance (7+8) 0.1 1.0 1.2 1.3
9a. p.m. 9 as % of GDP 0.1 0.5 0.6 0.6
10. Net capital transactions 1.7 1.7 1.7 1.8
11. Net lending (+)/ net borrowing (-) (9+10) 1.8 2.6 2.9 3.1
11a. p.m. 11 as % of GDP 1.0 1.4 1.5 1.5
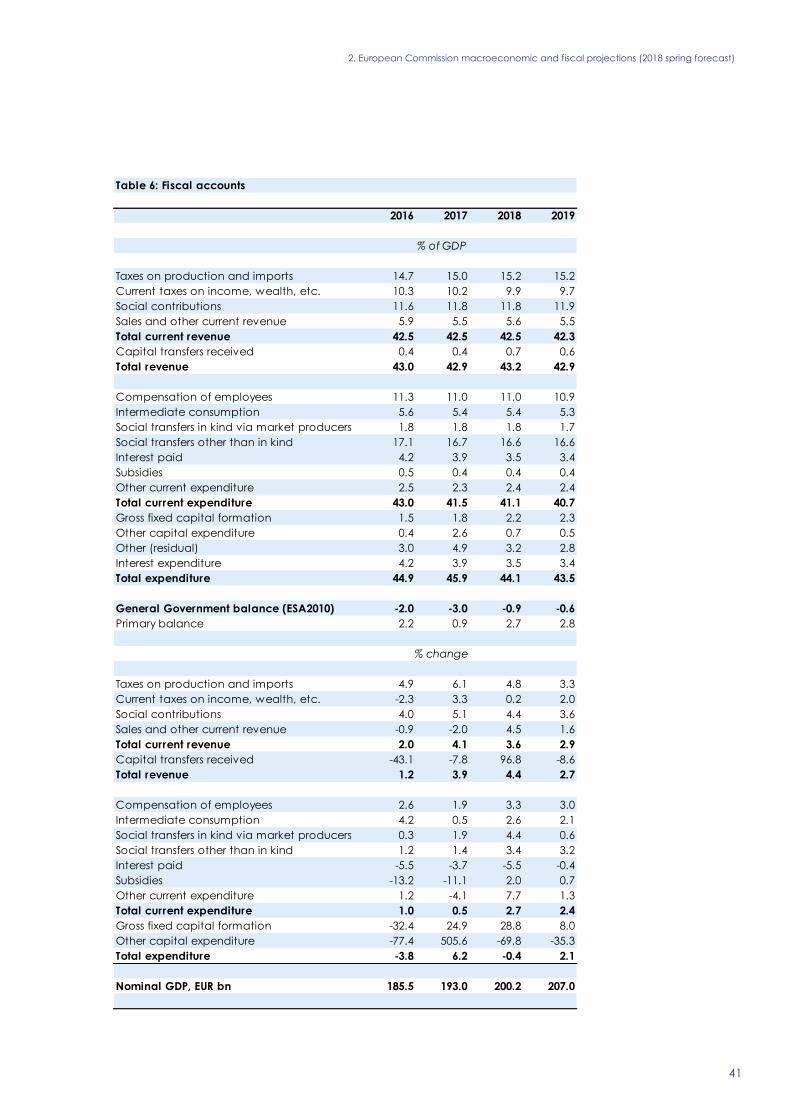
2. European Commission macroeconomic and fiscal projections (2018 spring forecast)
41
Table 6: Fiscal accounts
2016 2017 2018 2019
Taxes on production and imports 14.7 15.0 15.2 15.2
Current taxes on income, wealth, etc. 10.3 10.2 9.9 9.7
Social contributions 11.6 11.8 11.8 11.9
Sales and other current revenue 5.9 5.5 5.6 5.5
Total current revenue 42.5 42.5 42.5 42.3
Capital transfers received 0.4 0.4 0.7 0.6
Total revenue 43.0 42.9 43.2 42.9
Compensation of employees 11.3 11.0 11.0 10.9
Intermediate consumption 5.6 5.4 5.4 5.3
Social transfers in kind via market producers 1.8 1.8 1.8 1.7
Social transfers other than in kind 17.1 16.7 16.6 16.6
Interest paid 4.2 3.9 3.5 3.4
Subsidies 0.5 0.4 0.4 0.4
Other current expenditure 2.5 2.3 2.4 2.4
Total current expenditure 43.0 41.5 41.1 40.7
Gross fixed capital formation 1.5 1.8 2.2 2.3
Other capital expenditure 0.4 2.6 0.7 0.5
Other (residual) 3.0 4.9 3.2 2.8
Interest expenditure 4.2 3.9 3.5 3.4
Total expenditure 44.9 45.9 44.1 43.5
General Government balance (ESA2010) -2.0 -3.0 -0.9 -0.6
Primary balance 2.2 0.9 2.7 2.8
Taxes on production and imports 4.9 6.1 4.8 3.3
Current taxes on income, wealth, etc. -2.3 3.3 0.2 2.0
Social contributions 4.0 5.1 4.4 3.6
Sales and other current revenue -0.9 -2.0 4.5 1.6
Total current revenue 2.0 4.1 3.6 2.9
Capital transfers received -43.1 -7.8 96.8 -8.6
Total revenue 1.2 3.9 4.4 2.7
Compensation of employees 2.6 1.9 3.3 3.0
Intermediate consumption 4.2 0.5 2.6 2.1
Social transfers in kind via market producers 0.3 1.9 4.4 0.6
Social transfers other than in kind 1.2 1.4 3.4 3.2
Interest paid -5.5 -3.7 -5.5 -0.4
Subsidies -13.2 -11.1 2.0 0.7
Other current expenditure 1.2 -4.1 7.7 1.3
Total current expenditure 1.0 0.5 2.7 2.4
Gross fixed capital formation -32.4 24.9 28.8 8.0
Other capital expenditure -77.4 505.6 -69.8 -35.3
Total expenditure -3.8 6.2 -0.4 2.1
Nominal GDP, EUR bn 185.5 193.0 200.2 207.0
% of GDP
% change
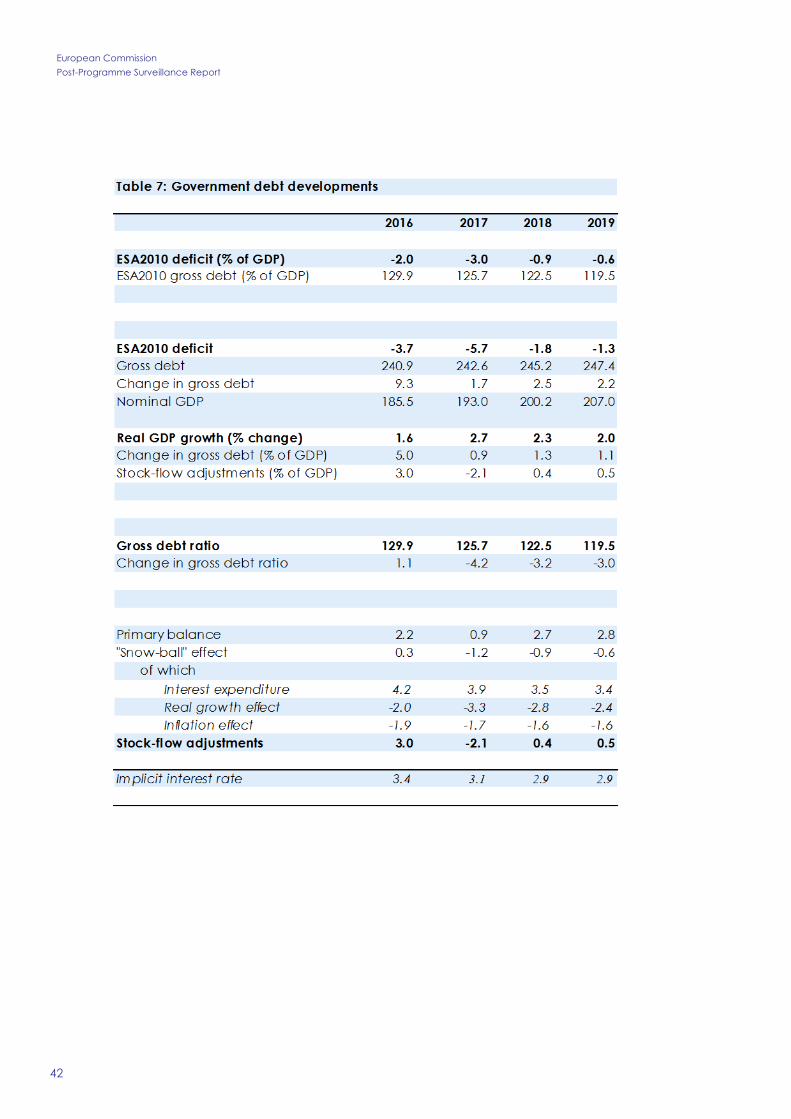
European Commission
Post-Programme Surveillance Report
42
EUROPEAN ECONOMY INSTITUTIONAL SERIES European Economy Institutional series can be accessed and downloaded free of charge from the following address: https://ec.europa.eu/info/publications/economic-and-financial-affairs-publications_en?field_eurovoc_taxonomy_target_id_selective=All&field_core_nal_countries_tid_selective=All&field_core_date_published_value[value][year]=All&field_core_tags_tid_i18n=22621. Titles published before July 2015 can be accessed and downloaded free of charge from: • http://ec.europa.eu/economy_finance/publications/european_economy/index_en.htm
(the main reports, e.g. Economic Forecasts) • http://ec.europa.eu/economy_finance/publications/occasional_paper/index_en.htm
(the Occasional Papers) • http://ec.europa.eu/economy_finance/publications/qr_euro_area/index_en.htm
(the Quarterly Reports on the Euro Area)


GETTING IN TOUCH WITH THE EU In person All over the European Union there are hundreds of Europe Direct Information Centres. You can find the address of the centre nearest you at: http://europa.eu/contact. On the phone or by e-mail Europe Direct is a service that answers your questions about the European Union. You can contact this service:
• by freephone: 00 800 6 7 8 9 10 11 (certain operators may charge for these calls),
• at the following standard number: +32 22999696 or • by electronic mail via: http://europa.eu/contact.
FINDING INFORMATION ABOUT THE EU Online Information about the European Union in all the official languages of the EU is available on the Europa website at: http://europa.eu. EU Publications You can download or order free and priced EU publications from EU Bookshop at: http://publications.europa.eu/bookshop. Multiple copies of free publications may be obtained by contacting Europe Direct or your local information centre (see http://europa.eu/contact). EU law and related documents For access to legal information from the EU, including all EU law since 1951 in all the official language versions, go to EUR-Lex at: http://eur-lex.europa.eu. Open data from the EU The EU Open Data Portal (http://data.europa.eu/euodp/en/data) provides access to datasets from the EU. Data can be downloaded and reused for free, both for commercial and non-commercial purposes.