Embed Size (px)
Citation preview

Page 1 of 19
Post Incident Action Report
December 2016 Ice Storm
Planning Chiefs: Alan Fraser, Mike McCann, and Tyler Nice
Date: March 24, 2017
TABLE OF CONTENTS
INTRODUCTION ........................................................................................................................................ 2
EVENT SUMMARY ................................................................................................................................... 2
STAFFING METRICS ............................................................................................................................... 5
COMMUNICATION METRICS ................................................................................................................. 8
POST EVENT ACTION PLAN ............................................................................................................... 10
General to Each Office Chief: ............................................................................................................. 12
Planning ................................................................................................................................................ 12
Operations ........................................................................................................................................... 14
Logistics ............................................................................................................................................... 14
Finance ................................................................................................................................................. 15
Public Information ............................................................................................................................. 15
Safety .................................................................................................................................................... 15
Liaison .................................................................................................................................................. 15
Customer Service............................................................................................................................... 16
CUSTOMER FEEDBACK ...................................................................................................................... 16
SMART METER TECHNOLOGY .......................................................................................................... 17
CONCLUSIONS ....................................................................................................................................... 19
Page 2 of 19
INTRODUCTION
The intent of this document is to capture lessons learned from the December 2016 ice storm,
develop a plan of action to address identified improvements, and assign responsibility and
resources to address the identified improvements. The primary goal of this Post Incident Action
Report is to document improvements and transfer this knowledge soon after the incident into an
action plan that can be used to improve EWEB’s response for the next incident command
system (ICS) event. Different from the 2014 Post Action Report, additional documentation, such
as specific “hot wash” notes will be available in the ICS share point 2016 storm folder. This
report provides an action plan and gives responsibility to ICS chiefs to implement.
EVENT SUMMARY
In December 2016, the City of Eugene experienced a substantial ice storm that resulted in
damage to vegetation and structures, and in turn caused significant damage to EWEB’s electric
distribution system, and some damage to the transmission system. Fortunately, the storm was
localized to the Eugene area, which allowed EWEB to readily obtain external assistance such
as line technician crews; which increased 5 times above normal EWEB line crew staffing. The
storm damage cost in Lane County was almost $9.5 million with EWEB’s cost just above $4
million. The storm damage had only a single historic comparator, the Columbus Day storm of
1962. The storm required about in 10 days to restore power to all EWEB customers.
On December 14, freezing rain began falling in the southern Willamette Valley in late morning
and ice was accumulating on structures, trees and power lines by early afternoon.
Temperatures were forecasted to rise above freezing and precipitation was to stop by
midafternoon. Neither of those changes occurred resulting in additional freezing rain
accumulation. The EWEB electric system began experiencing the first storm related outages by
about 2 pm. At 3 pm, EWEB declared a state of emergency and established an incident
command system (ICS) to address the damage and resulting outages from the ice storm.
Between about 4 pm and midnight, EWEB’s electric system suffered significant damage
resulting in widespread outages. Freezing rain continued off and on until about midnight, and
temperatures hovered around freezing throughout the Eugene metro area. Earlier in the
evening, EWEB began the process of requesting additional line crews through existing mutual
aid agreements. By midnight on December 14, approximately 17,000 EWEB customers were
without power, eight distribution feeders were locked out, and three 115-kV transmission lines
had experienced an outage.
The ice storm was highly localized to the Eugene area. Minimal outages were experienced by
of EWEB’s upriver service territory. In Eugene, the hardest hit areas were South Eugene, West
Eugene and the River Road/Santa Clara area.
The situation remained extremely dangerous in Eugene overnight as trees and ice continued to
fall. EWEB field staff spent much of their time Wednesday night and Thursday morning in
Page 3 of 19
make-safe operations and relieving Eugene police and fire personnel who were monitoring
downed lines.
By daybreak on Thursday, December 15, EWEB was operating with 9 four-person line crews
and 5 two-person trouble crews to address outages to 15,000 customers involving a damaged
115-kV transmission line and nine locked out feeders. The 115-kV BPA Eugene-River Road
transmission circuit was lost when a large tree fell through the bottom 2 phases. While there
was no additional precipitation, temperatures remained at or below freezing and trees continued
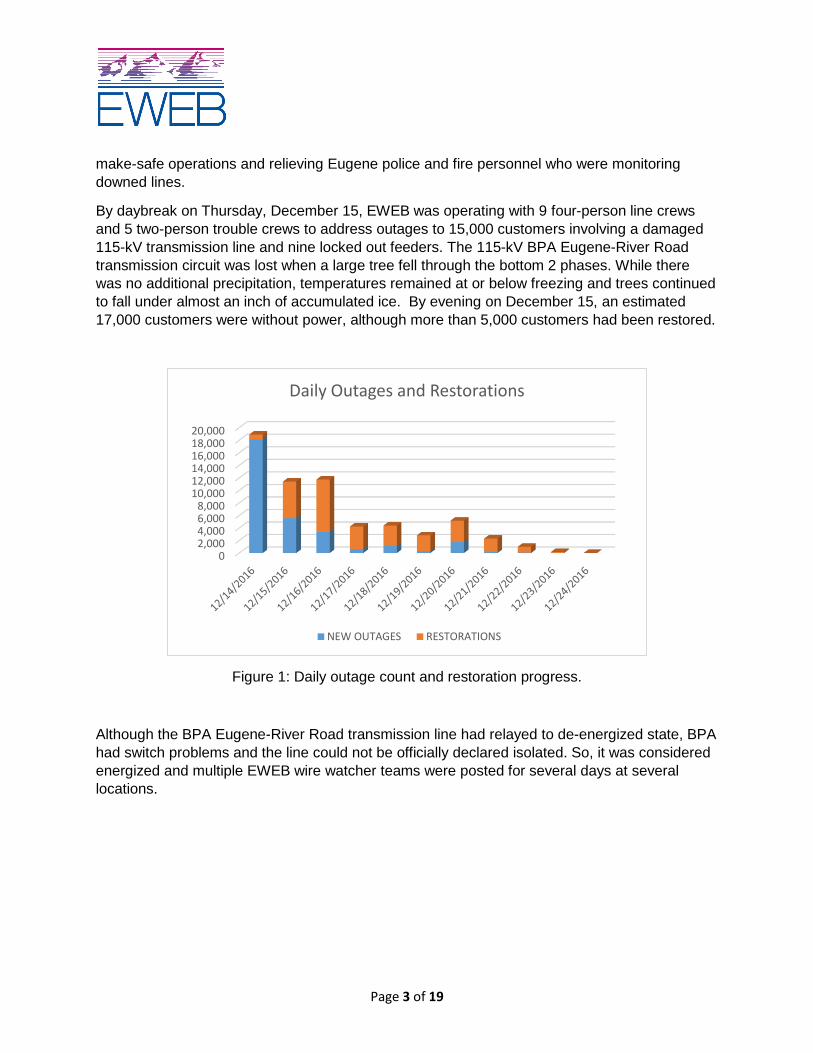
to fall under almost an inch of accumulated ice. By evening on December 15, an estimated
17,000 customers were without power, although more than 5,000 customers had been restored.
Figure 1: Daily outage count and restoration progress.
Although the BPA Eugene-River Road transmission line had relayed to de-energized state, BPA
had switch problems and the line could not be officially declared isolated. So, it was considered
energized and multiple EWEB wire watcher teams were posted for several days at several
locations.
02,0004,0006,0008,000
10,00012,00014,00016,00018,00020,000
Daily Outages and Restorations
NEW OUTAGES RESTORATIONS

Page 4 of 19
Figure 2: Downed line supported by communications lines.

Page 5 of 19
Over the next several days, outage estimates varied between a high of approximately 22,000
customers to around 17,000 or 18,000 customers. Temperatures remained near the freezing
mark but no additional precipitation occurred. As a result, the situation in the field began to
stabilize and EWEB crews with support from up to 24 contractor or mutual aid crews began to
make progress towards system repair and restoration. The majority of the damage occurred in
the first 3 days.
On Saturday, December 17, EWEB had 18 line crews in the field as well as teams of wire
watchers, flaggers, tree crews, assessors, triage teams, and parts runners. It was estimated
that around 9,000 customers were still without power. By Monday, December 19, local
temperatures finally climbed into the 40s and accumulated ice started coming off at which point
24 crews were working. By the end of the day Monday, the outage number had been reduced
to less than 5,000 customers. On December 20, there were 28 crews in the field and the
outage number had been further reduced to 3,000 customers. Assessors had been deployed
with crews to help identify damage near where crews had been deployed. This tactic helped
keep crews working in their localized area and minimized non-productive travel time.
Typically, restoration projects are prioritized by the largest number of customer restorations. As
repairs impact smaller number of customers, the restoration rate slowed. Assessors were
deployed to work the customer outage list from the bottom-up to begin the process of restoring
customers with isolated outages. Also, many customers on the outage list were called to
validate where work remained. Both these actions helped to prioritize work and keep crews
working where they were needed.
Most of the storm related work was wrapped up on December 21st and 22nd, when 28 crews
(four EWEB crews and 24 contract and mutual aid crews) were able to reduce the outage
number to less than 500 customers. Several of the out of town crews began to demobilize on
December 22nd. The remainder demobilized on Friday, December 23rd.
The storm response was declared over and EWEB went out of ICS at 3:30 pm on Friday,
December 23rd. At that point, only customers waiting for an electrician to make reconnection
repairs remained out of power. Crews and troubleshooters remained available throughout the
weekend to address any calls for reconnection that came in.
STAFFING METRICS
At the peak of the outage, it is estimated that 22,500 customers were without power at one time.
This is approximately one quarter of the EWEB system. During the restoration the following
restoration actions were executed:
28 poles were installed of various sizes,
Page 6 of 19
44 transformers were replaced,
157 cross arms replaced,
104 cutout fuses restored,
Twenty-eight 115 kV transmission insulators were replaced,
Approximately 400 distribution insulators and pins were replaced.
Exceptionally notable were that no injuries were recorded to any EWEB, mutual aid or
contractor crews or field workers. Only minor equipment damage (from falling trees) was noted.
EWEB received mutual aid support from Central Lincoln PUD, Springfield Utility Board,
Bonneville Power Administration, and Portland General Electric. Line crews were contracted
from Potelco, ILB, Key Line and Christenson.
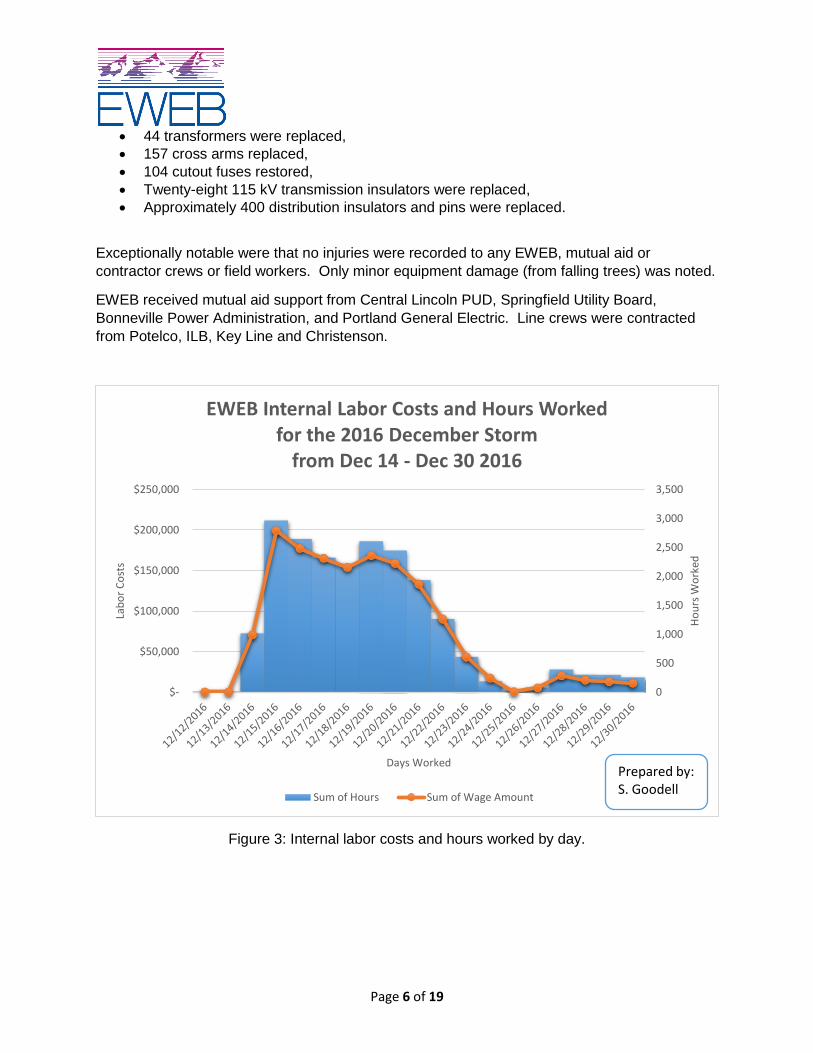
Figure 3: Internal labor costs and hours worked by day.
0
500
1,000
1,500
2,000
2,500
3,000
3,500
$-
$50,000
$100,000
$150,000
$200,000
$250,000
Ho
urs
Wo
rked
Lab
or
Co
sts
Days Worked
EWEB Internal Labor Costs and Hours Worked for the 2016 December Storm
from Dec 14 - Dec 30 2016
Sum of Hours Sum of Wage Amount
Prepared by: S. Goodell
Page 7 of 19
Unprecedented in this outage for EWEB was the scope of involvement throughout the utility and
the labor hours and cost invested into restoration efforts. At the storm’s peak, EWEB labor was
over 3,000 combined hours per day, or over $200,000 per day.
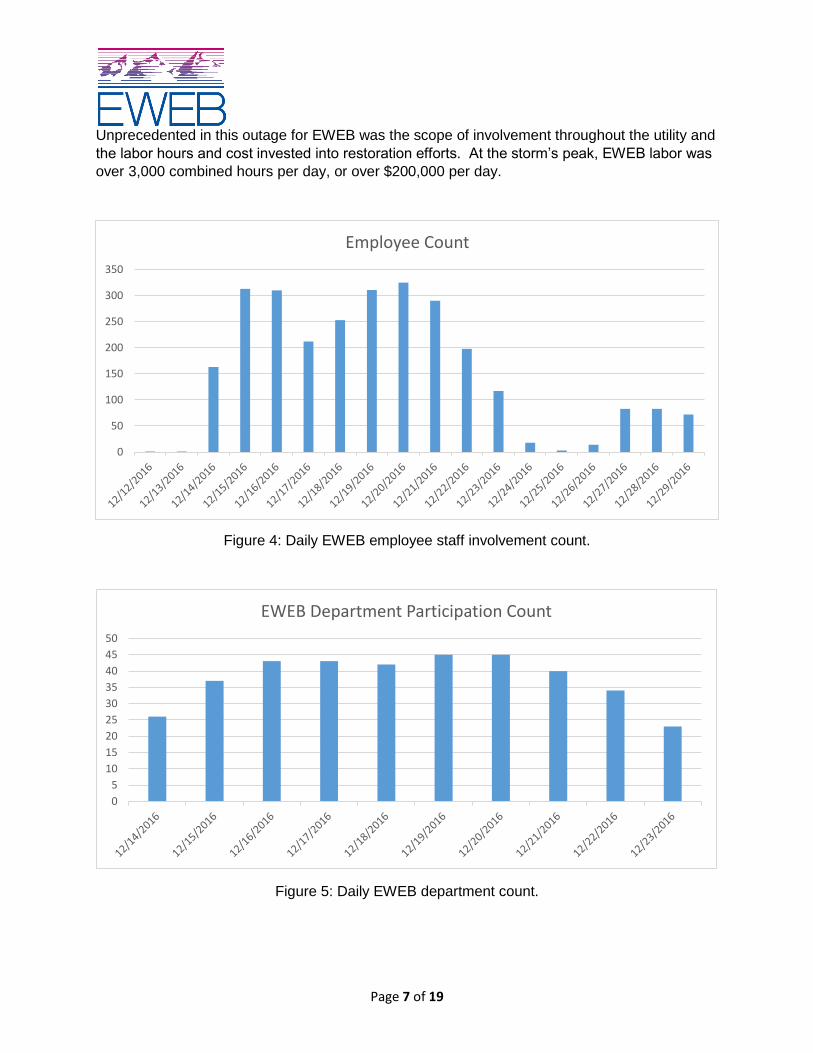
Figure 4: Daily EWEB employee staff involvement count.
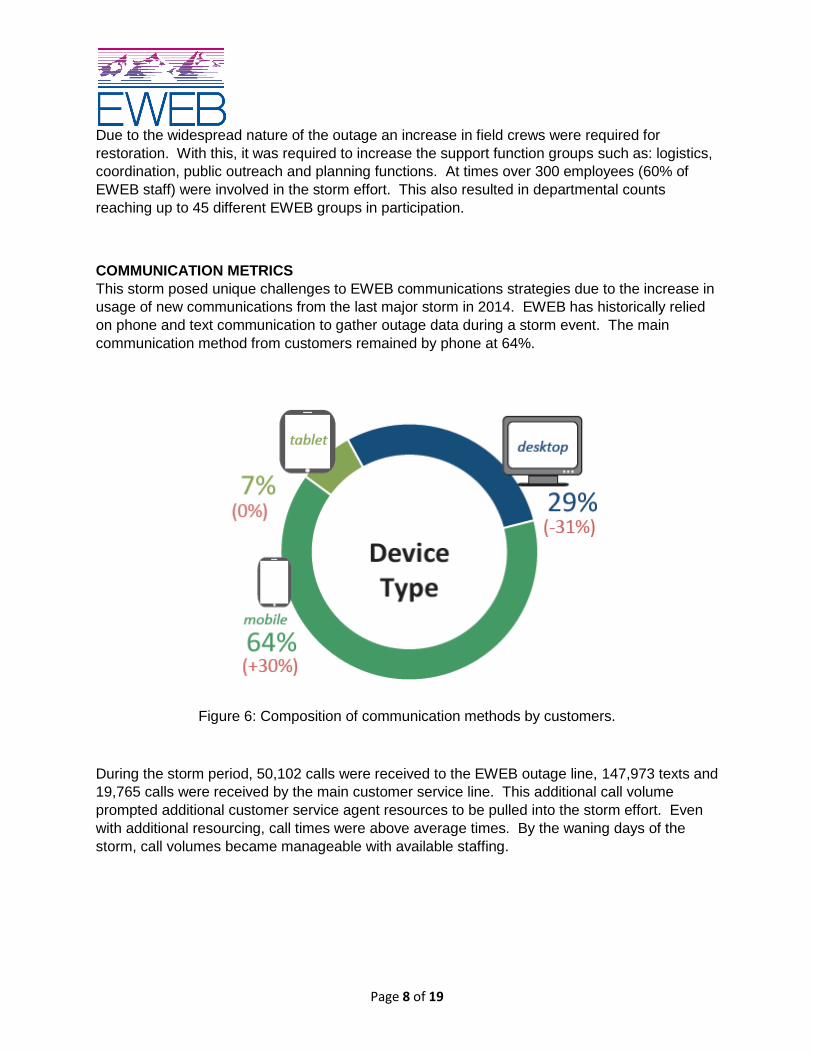
Figure 5: Daily EWEB department count.
0
50
100
150
200
250
300
350
Employee Count
0
5
10
15
20
25
30
35
40
45
50
EWEB Department Participation Count
Page 8 of 19
Due to the widespread nature of the outage an increase in field crews were required for
restoration. With this, it was required to increase the support function groups such as: logistics,
coordination, public outreach and planning functions. At times over 300 employees (60% of
EWEB staff) were involved in the storm effort. This also resulted in departmental counts
reaching up to 45 different EWEB groups in participation.
COMMUNICATION METRICS
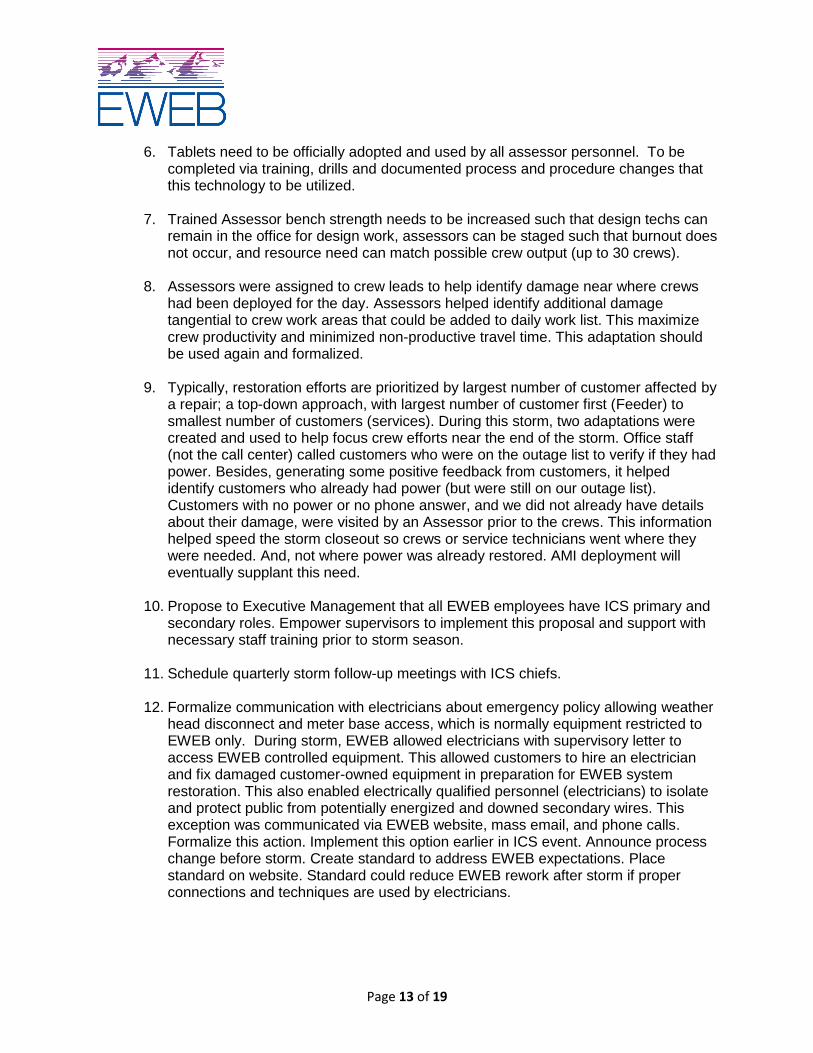
This storm posed unique challenges to EWEB communications strategies due to the increase in
usage of new communications from the last major storm in 2014. EWEB has historically relied
on phone and text communication to gather outage data during a storm event. The main
communication method from customers remained by phone at 64%.
Figure 6: Composition of communication methods by customers.
During the storm period, 50,102 calls were received to the EWEB outage line, 147,973 texts and
19,765 calls were received by the main customer service line. This additional call volume
prompted additional customer service agent resources to be pulled into the storm effort. Even
with additional resourcing, call times were above average times. By the waning days of the
storm, call volumes became manageable with available staffing.

Page 9 of 19
Figure 7: Calls and texts to EWEB dedicated outage lines per day.
A change from the last major outage’s communication methods was the presence of social
media via the EWEB Facebook page, personal messages, and Twitter. Due to a backup in call
response time and a failure in the text based outage system at the peak of the damage,
customers turned to Facebook and Twitter in a more widespread fashion. This increase was
also due to this technology being more of a usage in news and corporate communication as
was in 2014 during the last storm. EWEB responded with dedicated staff to answer personam
messages and to post updates via the social media outlets. Over the storm, EWEB posted 178
updates on Facebook (which does not include replying to comments updating customers).
Facebook likes increased by 37% (+1,466) during the span of the outage event.

Page 10 of 19
Figure 8: Facebook analytics per day.
This outage demonstrated the need for EWEB to increase its outward communication during
future events. In addition the importance of keeping up to date the website, along with keeping
operational it’s standard communication systems (text, phone) were recognized as important to
keeping information from customers coming in and sharing out.
POST EVENT ACTION PLAN
Due to the unprecedented severity and duration of the 2016 Ice Storm, several weaknesses to
EWEB’s day to day and ICS systems and practices were exposed. These weaknesses resulted
in loss of efficiency and duplication of efforts in addition to burnout of staff in some instances
during the storm. In many areas, these weaknesses served as a catalyst for EWEB to react in
flexible, novel and innovative ways in a relatively short timeframe. At times, crew resources
were increased over 5 times of those during normal daily operation. A bottleneck in planning
and support groups, which remained at normal staffing levels, caused a lack of resources to
push work from customer reports and assessments to repair efforts. As a result, several new
systems and practices were put in place during the storm which will be retained for future storm

Page 11 of 19
events. These processes were focused around streamlining and higher efficiency to deliver
more repair and construction design packets to the field personnel in a quicker.
As part of EWEB’s process and per FEMA standards of practice, “hot wash” sessions were
completed at several levels of the ICS involving individuals that were involved in the event. This
was comprised of surveys, in person working meetings, and feedback forms. Using these
methods, open and honest communication took place around the successes and failures
experienced. Typically, solutions were developed, managed and executed where possible by
frontline staff to increase the buy in, feasibility and usability. Detailed minutes from these
sessions were recorded and were used to develop a comprehensive list of action items.
Below are the top six goals and actions taken from the EWEB post event analysis, which are
due by September 1, 2017 (responsibilities noted for each):
1. Each chief ensure there are at least 3 backups identified and trained in each position in the ICS structure. (All Chiefs and Commander)
2. Add the following positions to the ICS Structure (ICS Commander): a. IT primary and backups to be on hand around the clock during ICS (Logistics) b. Board liaison (assigned to ET Member) to communicate directly with board
during event. (ET) c. Add Customer information coordinator – i.e. social networking, website.
(Information) d. Warehouse to be moved under finance (Finance).
3. Determine the number of resources needed for Responder data scrubbing and train
individuals. (Planning)
4. Hold functional exercise drills during “blue sky operations”. (ICS Commander)
5. Create “mission control center” where information is shown and accessible to all visually throughout outage. (Planning)
6. Each chief participate in quarterly briefings during 2017 to discuss progress towards completing actions in this report.
The below discussion will address details of additional deficiencies experienced throughout the storm categorized by ICS sections. The ICS Chiefs for each section are to manage and assign each task within the section in order to complete the task by September 1, 2017. This is not an exhaustive list of details gathered from individual group feedback for specific process changes internal to each section. Through each section’s post storm analysis, specific tasks have been developed for process improvement specific to those groups. These tasks have been identified as those with direct inter-section benefit.

Page 12 of 19
General to Each Office Chief:
The following tasks are general to each office. General ICS Policy/procedure changes where
applicable to be documented, and approved by ICS Commanders.
1. Each Chief or IC needs to have a runner so they can focus on high level work and strategic vision. To be identified as added role and assigned by each chief.
2. All groups (Planning, Liaison, Logistics, etc.) need to have 24 hour presence throughout event.
3. All officers need to set up a staffing plan during a storm & submit it to the IC.
4. Training to be 3 to 4 deep in all positions. A centralized list needs to be created and maintained which notes all trained individuals and their completed training – i.e.: ICS courses, ICS task role, wire watch, assessor and training status.
5. Transfer of information at shift changes by all positions need to be completed.
6. Need to ensure briefing information is shared with others from the top down so everyone is informed.
7. ICS white board showing current office chief positions needs to be visible for all to see.
Planning
1. Need to limit the amount of people working and coming/going from the Coordinators office. Too noisy at times which makes it hard to focus & hear the radio. Defined working space for planning staff needs to be finalized to avoid this issue.
2. Need to train more employees on Responder. This will allow for more efficient and quicker processing of outage data with the goal of closer to real time outage rate reporting. Expected need is at least 10 individuals which will be trained such that notes can be added and incidents closed out if reconnaissance results in power restorations.
3. Workflow processes (from outage report to design submittal to Ops) need to be documented and an efficiency analysis applied to simplify and speed up steps.
4. Wire Watchers to be called in as soon as Assessors are called in. This process change needs to be documented and approved by Planning Chiefs.
5. Use trained individuals to get pictures of what is going on in the field, to share with customers and assessment personnel.
Page 13 of 19
6. Tablets need to be officially adopted and used by all assessor personnel. To be
completed via training, drills and documented process and procedure changes that this technology to be utilized.
7. Trained Assessor bench strength needs to be increased such that design techs can remain in the office for design work, assessors can be staged such that burnout does not occur, and resource need can match possible crew output (up to 30 crews).
8. Assessors were assigned to crew leads to help identify damage near where crews had been deployed for the day. Assessors helped identify additional damage tangential to crew work areas that could be added to daily work list. This maximize crew productivity and minimized non-productive travel time. This adaptation should be used again and formalized.
9. Typically, restoration efforts are prioritized by largest number of customer affected by a repair; a top-down approach, with largest number of customer first (Feeder) to smallest number of customers (services). During this storm, two adaptations were created and used to help focus crew efforts near the end of the storm. Office staff (not the call center) called customers who were on the outage list to verify if they had power. Besides, generating some positive feedback from customers, it helped identify customers who already had power (but were still on our outage list). Customers with no power or no phone answer, and we did not already have details about their damage, were visited by an Assessor prior to the crews. This information helped speed the storm closeout so crews or service technicians went where they were needed. And, not where power was already restored. AMI deployment will eventually supplant this need.
10. Propose to Executive Management that all EWEB employees have ICS primary and secondary roles. Empower supervisors to implement this proposal and support with necessary staff training prior to storm season.
11. Schedule quarterly storm follow-up meetings with ICS chiefs.
12. Formalize communication with electricians about emergency policy allowing weather head disconnect and meter base access, which is normally equipment restricted to EWEB only. During storm, EWEB allowed electricians with supervisory letter to access EWEB controlled equipment. This allowed customers to hire an electrician and fix damaged customer-owned equipment in preparation for EWEB system restoration. This also enabled electrically qualified personnel (electricians) to isolate and protect public from potentially energized and downed secondary wires. This exception was communicated via EWEB website, mass email, and phone calls. Formalize this action. Implement this option earlier in ICS event. Announce process change before storm. Create standard to address EWEB expectations. Place standard on website. Standard could reduce EWEB rework after storm if proper connections and techniques are used by electricians.

Page 14 of 19
13. Develop procedure about encountering downed wires. Several Assessor teams were
hung-up for hours waiting for wire watch to relieve them. Unfortunately, valuable day light was lost for assessing. (This occurred at the same time as a water line break, and this relates to more staff needed for both wire watch and wire watch coordinators.)
14. Determine who can be assessing and when. We had trained assessor staff get benched by ICS commander due to adverse conditions; other field staff continued to work. A possible compromise may have been to allow assessors into areas where the system is known to be de-energized (tap line with all taps open), daylight assessing, and/or no backyard assessing. Are there exceptions to allow assessors to be deployed?
Operations
1. The process for work packet organization for next day work staging needs to be refined, documented and structured such that jobs are organized and easily viewed by outside groups to be able to know what work will be taking place.
2. The process for getting staff working when they come in needs to be refined so that crews are not waiting for work at the start of the day.
3. Need updated staffing list & what they are cleared to do for operations field staff.
4. Identify and develop blue-sky field data collection techniques and tools that can also be used in storm. Therefore, storm response is practiced daily with normal work practices.
Logistics
1. Need more trained wire watchers. Need to be able to change out teams more often when in the field to avoid burn out. A centralized wire watch list needs to be collected, monitored and maintained. Coordination needed with Safety for this task.
2. Staff coordinators need to be increased. During this storm, there also occurred a water break. Both tasks were too much for existing staff and duties needed to be divided to support both needs.
3. Contractors a. Need better check in/out process b. When assigning hotel rooms, need to list name with room number so check
out procedure can be completed in a more organized way, and any belongings left can be sent back.
4. Logistics needs a designated office location.
Page 15 of 19
Finance
1. Need more staff to rotate in/out of positions (office/contracting and warehouse)
2. Ran out of storm baskets throughout – resources and materials need to be identified and assembled to match Ops output. System for creation of baskets and management of output to be documented and refined.
3. FEMA documentation needs refinement. Forms and records used by operations needs to be vetted by finance for compliance and both groups to coordinate (led by Finance) to establish forms which are useable by Ops and deliver needed information to Finance.
4. The adaption of capitalization policy allowed crews to issue materials and be prepared to …..
Public Information
1. Set up command role for PIO in customer service.
2. Responder training for better updates to PIO staff as well so that they can research and gather data for reporting out.
3. A team to process social network messages and feedback to be created and constraints and goals defined around messaging.
Safety
1. Need more trained wire watchers. Need to be able to change out teams more often when in the field to avoid burn out. A centralized wire watch list needs to be collected, monitored and maintained. Coordination needed with Logistics for this task.
2. Need to work on parking lot safety & safe access to the building. Had 9 slips & falls due to the icy parking lot & sidewalks.
a. Working on getting a blade to put on the front of a truck and assigning staff to lot maintenance.
3. Effective community communication about downed wires needs to be increased to
public. Will need to coordinate with external communication.
4. Fire & Police need more training on what to do about a down wire.
Liaison
1. When the phone system was bogged down with calls, calls to the liaison weren’t coming through, line busy. Will need to be communicated and confirmed with other agencies to email to Liaison dedicated email address.

Page 16 of 19
2. Need to inform EWEB employees & other agencies about Liaison email address.
3. Recommend having a Storm Event email address that is monitored by dedicated
staff.
Customer Service
1. Need additional staff trained on phone operation and customer contact to allow for more call response resources.
2. Need more licenses for the phone system so more people can take calls.
3. Phone system needs capacity increased to avoid bottleneck due to bandwidth shortages.
CUSTOMER FEEDBACK
As part of the post storm information gathering, management wanted to obtain customer
feedback on EWEB’s restoration efforts. Communications, marketing and research teams
created an outage survey to obtain customer feedback primarily for those who weren’t able to
attend a January 9, 2017 open house (where EWEB solicited direct feedback from customers
wishing to share their experience). This survey was sent out via EWEB’s Cvent system by
email to 15,777 customers including current connections and business currents lists, major
customer luncheon list and a number of hand-picked community members. Links to the survey
were also included on Facebook and Twitter during this time as well as news releases.
A total of 580 responses were gathered with a 95% confidence level for the data (based on
24,000 customers without power). Below are the statistics for the responses:
95% of the responders were residential customers,
72% of were without power for multiple days.
93% of the responders did not need the support of an electrician to repair damage to their connected service.
74% of the customers were aware that EWEB does not know they are without power, and that they must alert us.
49% of the responders reported they or someone they knew experienced significant hardship during the outage.
Results of the survey turned back that 33% of customers believed that changes to EWEB’s tree
practices would have reduced the impact of the ice storm. 150 of the customers that reported
back had specific suggested locations in need of tree trimming.
The question was asked to customers around the interest in adopting smart meter technology
whereby EWEB would be able to know if a customer is out of power without calling based on
feedback from the meter. 43% of the respondents said they are interested in this technology
and feature. Additional Smart Meter discussion will be included in the following section of this
report.

Page 17 of 19
Figure 9: Additional customer survey questions.
SMART METER TECHNOLOGY
EWEB currently uses standard electric and water meters for nearly all meter infrastructure.
These are typically digital meters that must be read physically by a EWEB meter reader to
gather usage information. Due to the stand alone nature of these meters and inability to
communicate back to EWEB upon outage, customers must directly report outages.
EWEB has chosen and awarded a smart meter platform to be rolled out to the EWEB electric
and water system. Presently the roll out of this system is under an opt-in program whereby
customers must proactively request upgrade of their meters from a conventional to smart
technology. This system has resulted in a multi-year, indeterminate rate of deployment for the
system with a low adoption and low proactive request rate by customers due to unfamiliarity
with the program and a small amount of customers skeptical of the system’s use and safety due
to wireless technology.
The customer survey mentioned in the above section shows that 43% of the responding
customers are interested in the technologies benefits. Specifically, figure 10 details the
questions that were asked of interested features along with % of customers interested.

Page 18 of 19
Figure 10: Customer interest response to smart meter features.
Of customers not interested, or unsure, figure 11 details results to reasons why they were not
willing or unsure to adopt the technology.
Figure 11: Customer reasons for not being interested or unsure of smart grid technology.
In the context of outage management and widespread outage response, smart meter
technology provides several benefits. During the recent outage, a major constraint was to
determine the scope of a feeder or tap outage based on isolated customer calls. In the first 48
hours of the outage existing systems could not handle the amount of calls, texts and reported
outages. Without this up to date and real time information, brute force, manual process to

Page 19 of 19
analyze and collect the outage data must be performed. Using such manual processes results
in a delay in actionable data and increased risk of human error and duplicity of work in the field
from the use of paper methods.
With smart meter technology, customer calls are not relied upon to gather location, duration and
quantity of outages. Smart meter technology would provide for a streamlined and efficient path
for outage data to flow in a reportable and manageable means. If this data were in place during
the 2016 ice storm, the outage duration and efficiency of response would have been improved
due to a clarity of outage data at the beginning and throughout the outage. The timeliness of
this information would aid in planning and prioritization of locations and customers to target
restoration based on severity of outage numbers and duration. Additionally, feedback of
restoration processes would be real time and automatic. During this outage, the feedback on if
individual customers were restored did not come in a timely manner. This resulted in field crews
being re-deployed to sites, and assessors completing designs multiple times without knowing of
the restoration being complete.
In conclusion regarding smart grid technology, additional benefits and risks need to be closely
analyzed and in the context of outage management in addition to everyday business regarding
metering of customer data. To solve a needed problem of reliable, real time data feedback from
the field is of high importance when making decisions during an evolving event and when
assessing and managing restoration of a widespread outage.
CONCLUSIONS
The 2016 December Ice Storm was one of the largest outages EWEB has experienced.
Procuring ample contractor crews early on was crucial to speeding up recovery.
Support functions such as Planning, Logistics etc., need increased staffing proportional to the increase of crews.
Internet based communication is becoming more prevalent as a relied upon means of communication for customers and will need to be ramped up to meet need during outages.
Customer outage data was slow moving using existing means, as was feedback of restoration efforts. Smart meter technology can serve as one solution to these issues.
Customer call center resourcing needs increased (additional training for backups) as well as text and call based systems to handle call volume for an outage of this size.
ICS training programs need to be solidified and tracked to ensure staff is trained on procedures.
“Blue Sky” functional drills during need to take place to practice and streamline processes.
Available technology needs to be leveraged and integrated for more efficient and higher quality data usage (iPad do-forms, GIS, SCADA, responder).