Embed Size (px)
Citation preview
By Sergey Kiselev Roman Romashkin
Issue Paper No. 40
ICTSD Programme on Agricultural Trade and Sustainable DevelopmentApril 2012
Possible Effects of Russia's WTO Accession on Agricultural Trade and Production
l ICTSD Programme on Agricultural Trade and Sustainable Development
By Sergey Kiselev Roman Romashkin
Possible Effects of Russiaʼs WTO Accession on Agricultural Trade and Production
Issue Paper 40
April 2012
ii S. Kiselev, R. Romashkin – Possible Effects of Russia’s WTO Accession on Agricultural Trade and Production
Published by
International Centre for Trade and Sustainable Development (ICTSD)International Environment House 27 Chemin de Balexert, 1219 Geneva, SwitzerlandTel: +41 22 917 8492 Fax: +41 22 917 8093E-mail: [email protected] Internet: www.ictsd.org
Publisher and Director: Ricardo Meléndez-OrtizProgrammes Director: Christophe BellmannProgramme Team: Jonathan Hepburn, Ammad Bahalim, Tyler Blake
Acknowledgments
This paper has been produced under the ICTSD Programme on Agricultural Trade and Sustainable Development. ICTSD wishes gratefully to acknowledge the support of its core and thematic donors, including: the UK Department for International Development (DFID), the Swedish International Development Cooperation Agency (SIDA); the Netherlands Directorate-General of Development Cooperation (DGIS); the Ministry of Foreign Affairs of Denmark, Danida; the Ministry for Foreign Affairs of Finland; the Ministry of Foreign Affairs of Norway; Australia’s AusAID; the Inter American Development Bank (IADB); and Oxfam Novib.
ICTSD gratefully acknowledges feedback and suggestions on earlier versions of this study, including detailed comments from Lars Brink, Alan Matthews and Eugenia Serova.
For more information about ICTSD’s Programme on Agricultural Trade and SustainableDevelopment, visit our website at http://ictsd.net/programmes/agriculture/
ICTSD welcomes feedback and comments on this document. These can be forwarded to Jonathan Hepburn at jhepburn [at] ictsd.ch
Citation: Kiselev, Sergey; Roman Romashkin; (2012); Possible Effects of Russia’s WTO Accession on Agricultural Trade and Production; ICTSD Programme on Agricultural Trade and Sustainable Development; Issue Paper No. 40; International Centre for Trade and Sustainable Development,Geneva, Switzerland, www.ictsd.org.
Copyright ICTSD, 2012. Readers are encouraged to quote and reproduce this material for educational, non-profit purposes, provided the source is acknowledged.
This work is licensed under the Creative Commons Attribution-Noncommercial-No-DerivativeWorks 3.0 License. To view a copy of this license, visit http://creativecommons.org/licenses/bync-nd/3.0/ or send a letter to Creative Commons, 171 Second Street, Suite 300, San Francisco, California, 94105, USA.
The views expressed in this publication are those of the author(s) and do not necessarily reflectthe views of ICTSD or the funding institutions.
ISSN 1817 356X
iiiICTSD Programme on Agricultural Trade and Sustainable Development
TABLE OF CONTENTS
LIST OF FIGURES ivLIST OF TABLES viLIST OF ABBREVIATIONS AND ACRONYMS viiiFOREWORD ixEXECUTIVE SUMMARY 11. MAJOR CHARACTERISTICS OF RUSSIAʼS AGRICULTURE 4 1.1 Dynamics of Russiaʼs Agriculture Development 4
1.2 Production of Main Agricultural Commodities in 2008-2010 4
1.3 Market Volumes of Main Agricultural and Food Commodities in 2008-2010 7
2. MAJOR CHARACTERISTICS OF RUSSIAʼS AGRICULTURAL TRADE 13 2.1 Russiaʼs Agricultural Trade and its Regulation 13
2.2 Russiaʼs Agricultural and Food Trade 19
3. MAJOR PARAMETERS OF RUSSIAʼS COMMITMENTS IN AGRICULTURE 324. INFLUENCE OF RUSSIAʼS ACCESSION TO THE WTO ON BELARUS,
KAZAKHSTAN, AND DEVELOPING COUNTRIES 37ENDNOTES 40REFERENCES 42ANNEX I: GENERAL CHARACTERISTICS OF RUSSIAʼS AGRICULTURE, TRADE AND MAIN MARKETS OF AGRICULTURAL AND FOOD COMMODITIES 43ANNEX II: RUSSIAʼS AGRICULTURAL AND FOOD TRADE WITH DEVELOPING AND CIS COUNTRIES IN 2010 47ANNEX III: RUSSIAʼS AGRICULTURAL AND FOOD IMPORTS FROM DEVELOPING COUNTRIES 55
iv S. Kiselev, R. Romashkin – Possible Effects of Russia’s WTO Accession on Agricultural Trade and Production
LIST OF FIGURES
Figure 1. Cumulative indexes of agricultural production in Russia (%)
Figure 2. Investments in fixed assets in agriculture and food production industry and their shares in total investments in fixed assets in 2000-2009
Figure 3. Expenditures of Russia’s consolidated budget on agriculture and fisheries in 2005-2009 (USD million).
Figure 4. Values of production of main agricultural commodities in 2008-2010 (USD million)
Figure 5. Shares of main agricultural commodities in gross agricultural production in 2008-2010 (%)
Figure 6. Production of main plant products in 2008-2010 (thousand tonnes)
Figure 7. Production of main animal products in 2008-2010 (thousand tonnes)
Figure 8. Market volumes of main agricultural and food commodities in 2008-2010 (USD million)
Figure 9. Components of the average market volumes of main agricultural and food commodities in 2008-2010 (USD million)
Figure 10. Structure of the average market volumes of main agricultural and food commodities in 2008-2010 (%)
Figure 11. Foreign trade in agricultural and food products in Russia, 2005-2010 ( USD billion)
Figure 12. Growth rates of imports of agricultural and food commodities in Russia, 2005-2010 (%)
Figure 13. Components of Russia’s meat and meat products supply in 2005-2010
Figure 14. Russia’s import of meat and poultry in 2006-2010 (thousand tonnes)
Figure 15. Components of sugar supply in Russia
Figure 16. The structure of Russian trade with developed, developing and CIS countries
Figure 17. Russia’s agricultural and food trade with developed, developing and CIS countries in 2010 (USD million)
Figure 18. Russia’s imports of main agricultural and food commodity groups from developed, developing and CIS countries in 2010 (USD million)
Figure 19. Structure of Russia’s imports of main agricultural and food commodity groups from developed, developing and CIS countries in 2010 (%)
Figure 20. Russia’s exports of main agricultural and food commodity groups to developed, developing and CIS countries in 2010 (USD million)
Figure 21. Structure of Russia’s exports of main agricultural and food commodity groups to developed, developing and CIS countries in 2010 (%)
Figure 22. Russia’s cattle and poultry production in slaughter weight (thousand tonnes)
Figure 23. Russia’s meat imports in 2000, 2005, 2009 and 2010 (thousand tonnes)
Figure 24. Production of sugar and sugar beets in Russia in 2008-2010 (thousand tonnes)
Figure 25. Russia’s sugar import in 2000, 2005, 2009 and 2010 (thousand tonnes)
Figure 26. Wine production in Russia in 2000-2009 (million litres)
vICTSD Programme on Agricultural Trade and Sustainable Development
Figure 27. Russia’s wine import in 2000, 2005, 2009 and 2010 (million litres)
Figure 28. Russia’s imports and domestic production of rice in 2000, 2005, 2009 and 2010 (thousand tonnes)
Figure 29. Russia’s imports of coffee in 2000, 2005, 2009 and 2010 (thousand tonnes)
Figure 30. Russia’s imports of tea in 2000, 2005, 2009 and 2010 (thousand tonnes)
Figure 31. Russia’s imports of fruits in 2000, 2005, 2009 and 2010 (thousand tonnes)
Figure 32. Gross grain harvests in Russia (million tonnes)
Figure 33. Russia’s grain exports in 2000, 2005, 2009 and 2010 (thousand tonnes)
vi S. Kiselev, R. Romashkin – Possible Effects of Russia’s WTO Accession on Agricultural Trade and Production
LIST OF TABLES
Table 1. Role of agriculture and food production in Russia’s economy
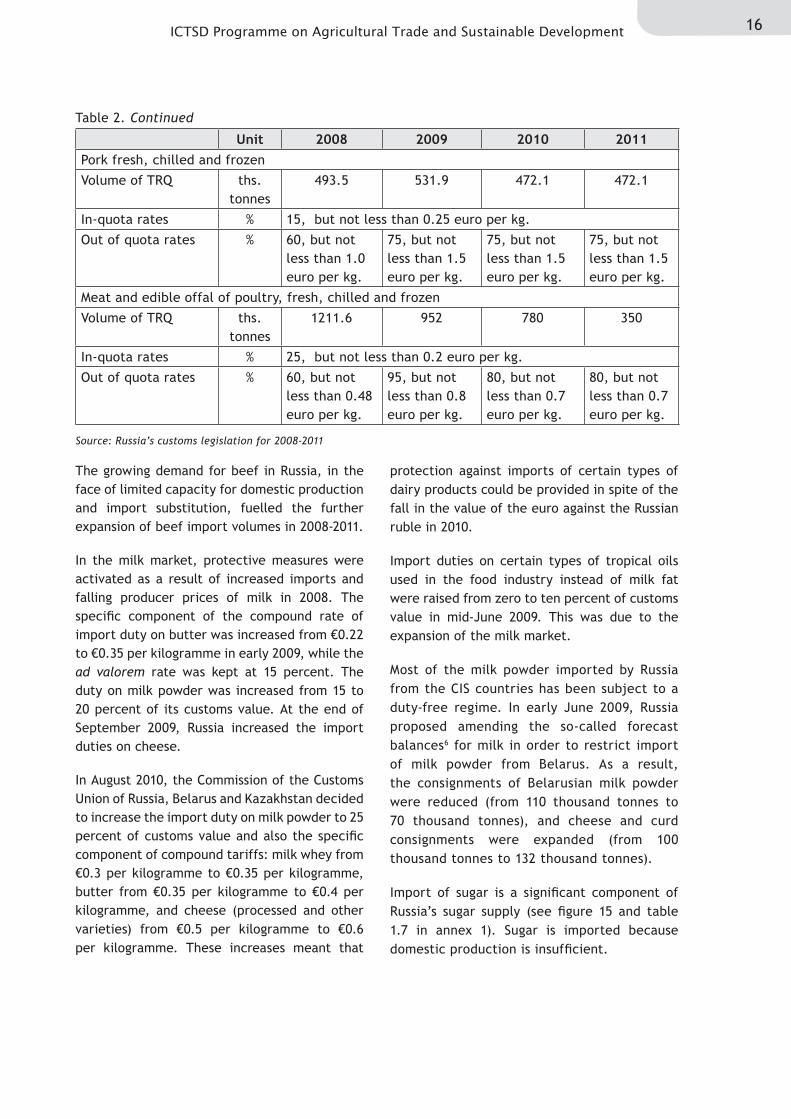
Table 2. Russia’s TRQ (volumes and tariff rates) for beef, pork and poultry in 2008-2011
Table 3. Russian export and sugar imports in 2008-2009
Table 4. Russia’s domestic support (Total AMS) commitments
Table 5. Domestic support for agriculture in Russia, 2006-2008 (USD billion)
Table 6. Simple average tariffs for agricultural and food commodities: applied and bound rates (%)
Table 7. Simple average MFN applied tariffs for different groups of agricultural goods and final bound rates, Russian Federation (%)
Table 8. Tariff rate quotas in Russia’s market access commitments
Table 9. Values of Russia’s imports of agricultural and food commodities from developing countries in 2010 (million USD)
Table 1.1 Investments in fixed assets in agriculture and food production industry and their shares in total investments in fixed assets in 2000-2009
Table 1.2 Values of production of main agricultural commodities and their shares in gross agricultural production in 2008-2010
Table 1.3 Production of main agricultural commodities in 2008-2010
Table 1.4 Market volumes of main agricultural and food commodities in 2008-2010 (thousand tonnes)
Table 1.5 Supply and utilization of meat and meat products in Russia in 2005-2009 (thousand tonnes)
Table 1.6 Russia’s meat and poultry import in 2006-2010 (thousand tonnes)
Table 1.7 Sugar supply and utilization in Russia in 2007/2008 – 2009/2010 (thousand tonnes)
Table 1.8 The structure of Russia’s trade with developed, developing and CIS countries (%)
Table 1.9 Russia’s agricultural and food trade with developed, developing and CIS countries in 2010 (million USD and %)
Table 2.1 Russia’s imports of agricultural and food commodities from developing and CIS countries in 2010
Table 2.2 Russia’s exports of agricultural and food commodities from developing and CIS countries in 2010
Table 3.1 Russia’s imports of meat of bovine animals
Table 3.2 Structure of Russia’s imports of meat of bovine animals (%)
Table 3.3 Russia’s imports of meat of swine
Table 3.4 Structure of Russia’s imports of meat of swine (%)
viiICTSD Programme on Agricultural Trade and Sustainable Development
Table 3.5 Russia’s imports of poultry meat
Table 3.6 Structure of Russia’s imports of poultry meat (%)
Table 3.7 Russia’s imports of sugar
Table 3.8 Structure Russia’s imports of sugar (%)
Table 3.9 Russia’s imports of wines
Table 3.10 Structure of Russia’s imports of wines (%)
Table 3.11 Russia’s imports of rice
Table 3.12 Structure of Russia’s imports of rice (%)
Table 3.13 Russia’s imports of coffee
Table 3.14 Structure of Russia’s imports of coffee (%)
Table 3.15 Russia’s imports of tea
Table 3.16 Structure of Russia’s imports of tea (%)
Table 3.17 Russia’s imports of bananas
Table 3.18 Structure of Russia’s imports of bananas (%)
Table 3.19 Russia’s imports of citrus
Table 3.20 Structure of Russia’s imports of citrus (%)
Table 3.21 Russia’s imports of grape
Table 3.22 Structure of Russia’s imports of grape (%)
viii S. Kiselev, R. Romashkin – Possible Effects of Russia’s WTO Accession on Agricultural Trade and Production
LIST OF ABBREVIATIONS AND ACRONYMS
AMS Aggregate Measurement of Support
CIS Commonwealth of Independent States
CU GSP Custom Union Generalised System of Preferences
GATT General Agreement on Tariffs and Trade
GDP Gross Domestic Product
NYMEX New York Mercantile Exchange
SPS measures Sanitary and Phytosanitary Measures
TRQ Tariff Rate Quota
WTO World Trade Organisation
ixICTSD Programme on Agricultural Trade and Sustainable Development
FOREWORD
The WTO’s 8th Ministerial Conference, in December 2011, endorsed Russia’s long-standing bid to join the organisation, following the approval of a package of reforms and commitments by the Working Party on Russia’s accession one month earlier. Russia is now widely expected to become a fully-fledged WTO member in mid-2012 with domestic ratification functionally completing the accession.
Russia had been negotiating to join the global trade body since 1993, making it the largest economy and only G-20 nation still outside the WTO. Its accession is a significant development for the organisation, with the potential to have important ramifications for trade and production both domestically and internationally, including in the agricultural sector.
As a major player in both economic and political terms, Russia’s entry into the multilateral trading system has both symbolic and immediate practical significance. Apart from the specific implications for particular products and markets, it is a move which has systemic importance as the country commits to engaging with its trading partners under a global framework of rules and processes, as well as to shaping the future evolution of this framework as an active member of the organisation.
The agricultural sector is of particular importance to Russia and to its trading partners, as the country is both a major exporter and importer of a number of important commodities. As Sergey Kiselev and Roman Romashkin point out in their paper, products such as meat, dairy products and sugar remain sensitive to competition from imports, and Russia’s WTO accession may allow developing country exporters of these products to benefit from greater access to Russian markets. At the same time, Russia is also an important exporter, in particular for products such as wheat and barley: importing countries could benefit from greater market stability resulting from Russia’s commitment to respect WTO rules on export restrictions in this area, for example. Increased market access for some products, such as wine and grapes, are likely to benefit both exporting countries and Russian consumers.
This study therefore seeks to provide policy-makers, negotiators and other stakeholders with an impartial, evidence-based assessment of the implications of Russia’s accession to the WTO for agricultural trade and production, looking in particular at how developing countries could be affected. It examines how disciplines on market access, domestic support and export competition in Russia’s accession agreement could be expected to affect particular products, and looks at what these would mean for specific exporting and importing countries. Finally, the study also explores how the terms of Russia’s accession to the WTO could influence agriculture in the countries of the Customs Union of Russia, Belarus and Kazakhstan and their international trade with third countries.
Russia’s embrace of WTO disciplines and economic prescriptions, together with the commitments it would make to trading partners as inscribed in the Accession Protocol and Working Party Report, will bring about significant reforms in Russia, not least to its agricultural sector. These will also be expected to be fueled and affected by new terms of engagement between the Russian economy and the rest of the world. And the other side of the coin will also be of great significance: how Russia’s agriculture under the new terms will have a bearing on the performance of the world’s agricultural activity, and more importantly the impact it will have in terms of food security, the ability of those under critical distress to respond to climate change, water shortages and poverty alleviation the world over. This study is a first modest contribution to what should be an informed understanding of these important matters. We hope it is of interest and use in the reader’s own work, and look forward to your comments.
Ricardo Meléndez-Ortiz Chief Executive, ICTSD
1 S. Kiselev, R. Romashkin – Possible Effects of Russia’s WTO Accession on Agricultural Trade and Production
EXECUTIVE SUMMARY
Since 1999, Russia’s agricultural production has been growing quite rapidly. The average growth rate of gross agricultural production for 1999-2010 amounted to 2.4 percent per year. In absolute terms, Russia’s average annual gross agricultural production reached USD 86.4 billion in 2008-2010.
Growth in agricultural production was accompanied by an increase in investment activity. Investment was stimulated through the implementation of the National Priority Project on “Development of the Agro-Industrial Complex” for the period 2006-2007 and also through the State Program for agriculture development and regulation of the markets for agricultural products, raw materials and food for the period 2008-2012. The period of 2005-2009 was characterized by a gradual increase in budgetary support to agriculture both in absolute terms and as a share of gross agricultural production. Increases in federal agricultural support encouraged some regional authorities to focus on support programs that had been developed by the federal government.
Russia’s growing agricultural and food markets are attractive both for domestic producers and to suppliers from abroad. Considering their competitive advantages and the competitiveness of domestic production, Russia’s producers are likely to increase production of oilseeds, vegetable oils and grains. The shares of domestic producers in the markets of animal products (meat and milk) will grow only if investment in livestock production goes up, and if there is also a high level of protection against imports. Protection will also be an important factor in increasing Russia’s domestic producers’ share of the sugar market.
However, Russia remains a net importer of agricultural and food products. Growth in agricultural production has occurred alongside an increase in agro-food imports. The products that are most sensitive to competition from imports are meat, dairy products and raw sugar. Agro-food imports originating in the CIS countries accounted for about 10 percent of all such imports in 2008-2010, and the share of non-CIS countries was about 90 percent.
Russia’s regulation of agro-food imports took the form of both tariff and non-tariff measures in 2008-2010. One of the important non-tariff measures was the use of forecast balances (quotas) between Russia and Belarus on trade in sugar, meat and meat products, and milk and dairy products. Other important measures to restrict imports from non-CIS countries are meat tariff quotas and a floating duty on raw sugar.
Russia’s agro-food exports have been growing alongside the increase in imports. Since 2002, Russia has become one of the largest suppliers of grain to the world market. Wheat and barley are Russia’s main export crops. Exports of corn and rice are gradually increasing. In addition, the modernization of the food industry has contributed to increasing Russia’s exports of beer, ice cream and dairy and meat products. More than two thirds of Russian agro-food exports were destined for non-CIS countries.
The major importers of Russian wheat are Egypt and Turkey. Large supplies of barley are delivered to Saudi Arabia, Libya and Iran. Large volumes of rice were exported to Turkey in 2010. The geographical proximity of these countries to Russia contributes to the competitive advantage of Russian exporters, who benefit from relatively low transportation costs.
Russia’s regulation of grain exports depends on the availability of grain in the domestic market. In case of a shortage of grains, both tariff and non-tariff measures have been used to restrict grain exports.
2ICTSD Programme on Agricultural Trade and Sustainable Development
In general, Russia’s imports of agricultural and food products are characterized by a low degree of substitution between goods from developing and from CIS countries. This is due to the specific set of commodities being imported and the limited capacity of CIS countries to meet demand from Russia. Probably, the meat commodity groups exhibit the highest degree of substitution.
Developing countries dominate over CIS countries in Russia’s agricultural trade. In 2010, agricultural exports to developing countries accounted for 39 percent of Russia’s total value of agricultural exports. The share of agricultural imports from developing countries to Russia was more than 31 percent. Meat, sugar, wine, rice, tea, coffee, fruit and tobacco are the main agricultural and food commodities imported from developing countries.
Brazil is the main developing country supplier of meat in Russia’s market. In 2010, Brazil represented 60.9 percent of Russia’s imports of meat of bovine animals from developing countries, and 99.3 percent and 94.6 percent of its imports of swine meat and poultry meat, respectively. Uruguay, Paraguay and Argentina are also large suppliers of meat of bovine animals.
All sugar imports to Russia from non-CIS countries are supplied by developing countries. Brazil is the main sugar supplier. In 2010, Brazil accounted for 85.8 percent of Russia’s sugar imports from developing countries.
The share of developing countries in Russia’s wine imports from non-CIS countries is less than ten percent. The main developing country suppliers of wine to Russia are Chile, Brazil, South Africa and Argentina.
Developing countries supply almost all imports of rice to Russia from non-CIS countries. Vietnam, Thailand, Pakistan and China are the main suppliers of rice to Russia’s market.
Against the background of growing imports of coffee, the share of developing countries in Russia’s coffee imports from non-CIS countries is declining. Brazil and Indonesia are the main suppliers of coffee to Russia from developing countries.
Almost all tea imports to Russia come from developing countries. Sri Lanka and India are the main suppliers. The supply of tea from China, Vietnam, Kenya and Indonesia has increased significantly.
Developing countries are the main suppliers of fruit to Russia. Developing countries account for 100 percent of Russia’s banana imports from non-CIS countries. The share for citrus fruits is about 90 percent, and for grapes about 80 percent.
Ecuador is the main supplier of bananas, and a significant share of Russia’s citrus imports originate in Turkey, Morocco, South Africa and Egypt. The main suppliers of fresh or dried grapes are Turkey, Chile and Iran.
Countries that export agricultural and food commodities to Russia will benefit from Russia’s accession to the WTO in several ways. They include a reduction in Russia’s custom duties; trade facilitation and predictability of Russia’s regulation of foreign trade activity; and unification and transparency of Russia’s non-tariff measures for trade regulation. These benefits will strengthen the competitiveness of imports in Russia’s domestic agricultural and food market. As consumer demand grows, this will lead to an increase in Russia’s agricultural and food imports.
Reduction of some kinds of budgetary support and restrictions on its use in Russia will reinforce the competitiveness of imports of agricultural and food products both from CIS and non-CIS countries.
3 S. Kiselev, R. Romashkin – Possible Effects of Russia’s WTO Accession on Agricultural Trade and Production
Russia is committed to using the Customs Union Generalized System of Preferences scheme. Under this scheme, import duties on products eligible for tariff preferences and originating from developing countries are 75 percent of the MFN duty rates (zero percent on such products from least-developed countries).
For several commodity groups, Russia’s commitments will allow substantial increases in trade, primarily in sugar and pork. In the intermediate term, it is possible to expect the competitiveness of Brazilian pork and raw sugar supply to further strengthen.
Accession to the WTO will not allow Russia to carry out its policy of substituting relatively low cost beef imports with domestic beef production. This will have a favourable effect on beef exporters in developing countries (Brazil, Uruguay and Paraguay), and on Russia’s consumers.
Chile, South Africa and Argentina will benefit from the significant reduction in Russia’s import duties on wine. These countries will compete against developed country exporters in Russia’s market as before.
Developing countries - the main suppliers of bananas, citrus, coffee and tea - will not receive significant benefits from the reduction of customs duties for these products, as the current levels of these duties are not high. However, substantial reduction of duties on grapes (from ten to five percent) will bring benefits for Turkey and Chile.
Removing various restrictions (both tariff and non-tariff) on access to Russia’s agricultural and food market will improve the terms of trade for non-CIS countries. This will contribute to some suppliers of agricultural and food commodities from CIS countries being replaced by exporters from non-CIS countries.
Non-CIS countries (including developing countries) may eventually see improvements not only in access to Russia’s market but also in access to the markets of Belarus and Kazakhstan, Russia’s Customs Union partners. Some benefits can also be obtained by developing countries through negotiations with Belarus and Kazakhstan on the terms of their accession to the WTO and the extension of their commitments to the whole Customs Union area, including Russia’s market.
Russia’s WTO commitments limit the use of export restrictions or prohibitions to temporary application only to prevent or relieve critical shortages of foodstuffs in Russia’s domestic market. Russia must notify beforehand the WTO Committee on Agriculture on the nature and duration of the measures to be taken and also consider the interests of other members of the WTO. These commitments will help developing countries to react in a timely way to possible prohibitions or restrictions of Russia’s grain exports.
Russia’s membership in the WTO will provide significant trade benefits for developing countries. In case of a breach of Russia’s obligations, the WTO dispute settlement system can be used to seek redress, an avenue that was not open before Russia acceded to the WTO.
4ICTSD Programme on Agricultural Trade and Sustainable Development
1. MAJOR CHARACTERISTICS OF RUSSIA’S AGRICULTURE
1.1 Dynamics of Russia’s Agriculture Development
Since 1999, Russia’s economy has been growing quite rapidly. During the period from 1999 to 2010, the average annual GDP growth rate was 5.4 percent. The cumulative GDP growth for the period following the default of 1998 amounted to 186.7 percent.
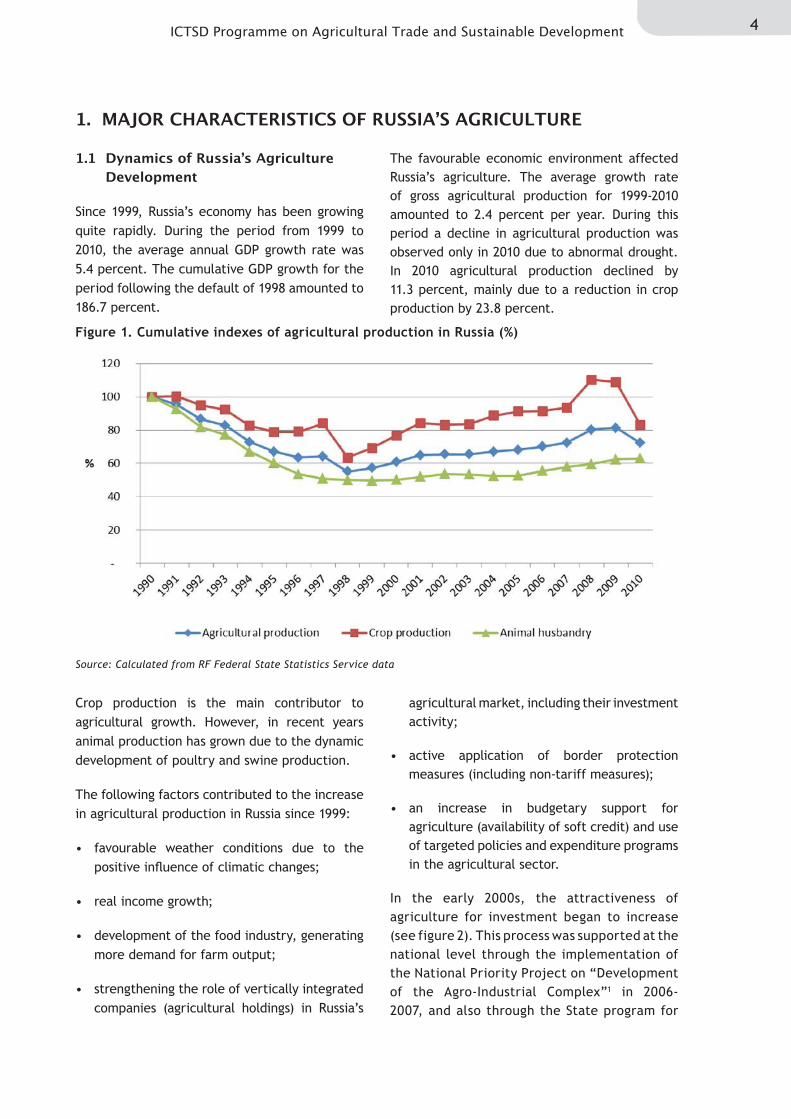
The favourable economic environment affected Russia’s agriculture. The average growth rate of gross agricultural production for 1999-2010 amounted to 2.4 percent per year. During this period a decline in agricultural production was observed only in 2010 due to abnormal drought. In 2010 agricultural production declined by 11.3 percent, mainly due to a reduction in crop production by 23.8 percent.
Figure 1. Cumulative indexes of agricultural production in Russia (%)
Source: Calculated from RF Federal State Statistics Service data
Crop production is the main contributor to agricultural growth. However, in recent years animal production has grown due to the dynamic development of poultry and swine production.
The following factors contributed to the increase in agricultural production in Russia since 1999:
• favourable weather conditions due to the positive influence of climatic changes;
• real income growth;
• development of the food industry, generating more demand for farm output;
• strengthening the role of vertically integrated companies (agricultural holdings) in Russia’s
agricultural market, including their investment activity;
• active application of border protection measures (including non-tariff measures);
• an increase in budgetary support for agriculture (availability of soft credit) and use of targeted policies and expenditure programs in the agricultural sector.
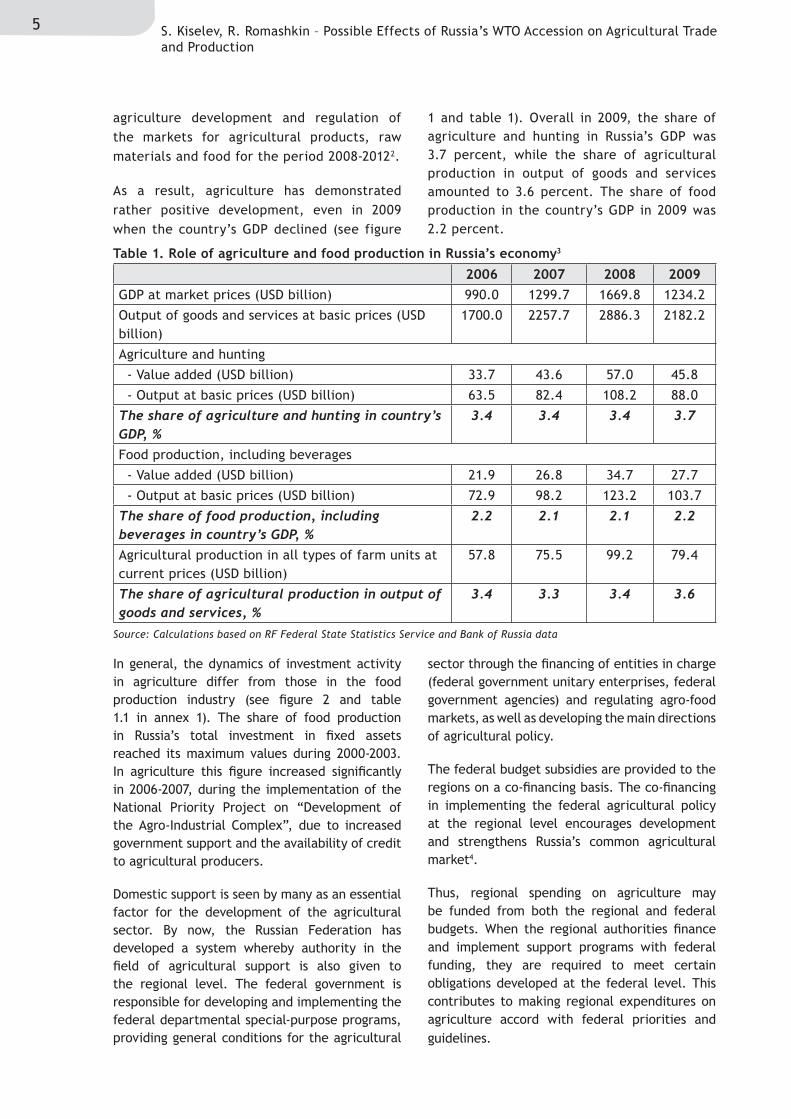
In the early 2000s, the attractiveness of agriculture for investment began to increase (see figure 2). This process was supported at the national level through the implementation of the National Priority Project on “Development of the Agro-Industrial Complex”1 in 2006-2007, and also through the State program for
5 S. Kiselev, R. Romashkin – Possible Effects of Russia’s WTO Accession on Agricultural Trade and Production
agriculture development and regulation of the markets for agricultural products, raw materials and food for the period 2008-20122.
As a result, agriculture has demonstrated rather positive development, even in 2009 when the country’s GDP declined (see figure
1 and table 1). Overall in 2009, the share of agriculture and hunting in Russia’s GDP was 3.7 percent, while the share of agricultural production in output of goods and services amounted to 3.6 percent. The share of food production in the country’s GDP in 2009 was 2.2 percent.
In general, the dynamics of investment activity in agriculture differ from those in the food production industry (see figure 2 and table 1.1 in annex 1). The share of food production in Russia’s total investment in fixed assets reached its maximum values during 2000-2003. In agriculture this figure increased significantly in 2006-2007, during the implementation of the National Priority Project on “Development of the Agro-Industrial Complex”, due to increased government support and the availability of credit to agricultural producers.
Domestic support is seen by many as an essential factor for the development of the agricultural sector. By now, the Russian Federation has developed a system whereby authority in the field of agricultural support is also given to the regional level. The federal government is responsible for developing and implementing the federal departmental special-purpose programs, providing general conditions for the agricultural
sector through the financing of entities in charge (federal government unitary enterprises, federal government agencies) and regulating agro-food markets, as well as developing the main directions of agricultural policy.
The federal budget subsidies are provided to the regions on a co-financing basis. The co-financing in implementing the federal agricultural policy at the regional level encourages development and strengthens Russia’s common agricultural market4.
Thus, regional spending on agriculture may be funded from both the regional and federal budgets. When the regional authorities finance and implement support programs with federal funding, they are required to meet certain obligations developed at the federal level. This contributes to making regional expenditures on agriculture accord with federal priorities and guidelines.
Table 1. Role of agriculture and food production in Russia’s economy3
Source: Calculations based on RF Federal State Statistics Service and Bank of Russia data
2006 2007 2008 2009 GDP at market prices (USD billion) 990.0 1299.7 1669.8 1234.2
Output of goods and services at basic prices (USD billion)
1700.0 2257.7 2886.3 2182.2
Agriculture and hunting
- Value added (USD billion) 33.7 43.6 57.0 45.8
- Output at basic prices (USD billion) 63.5 82.4 108.2 88.0
The share of agriculture and hunting in country’s GDP, %
3.4 3.4 3.4 3.7
Food production, including beverages
- Value added (USD billion) 21.9 26.8 34.7 27.7
- Output at basic prices (USD billion) 72.9 98.2 123.2 103.7
The share of food production, including beverages in country’s GDP, %
2.2 2.1 2.1 2.2
Agricultural production in all types of farm units at current prices (USD billion)
57.8 75.5 99.2 79.4
The share of agricultural production in output of goods and services, %
3.4 3.3 3.4 3.6
6ICTSD Programme on Agricultural Trade and Sustainable Development
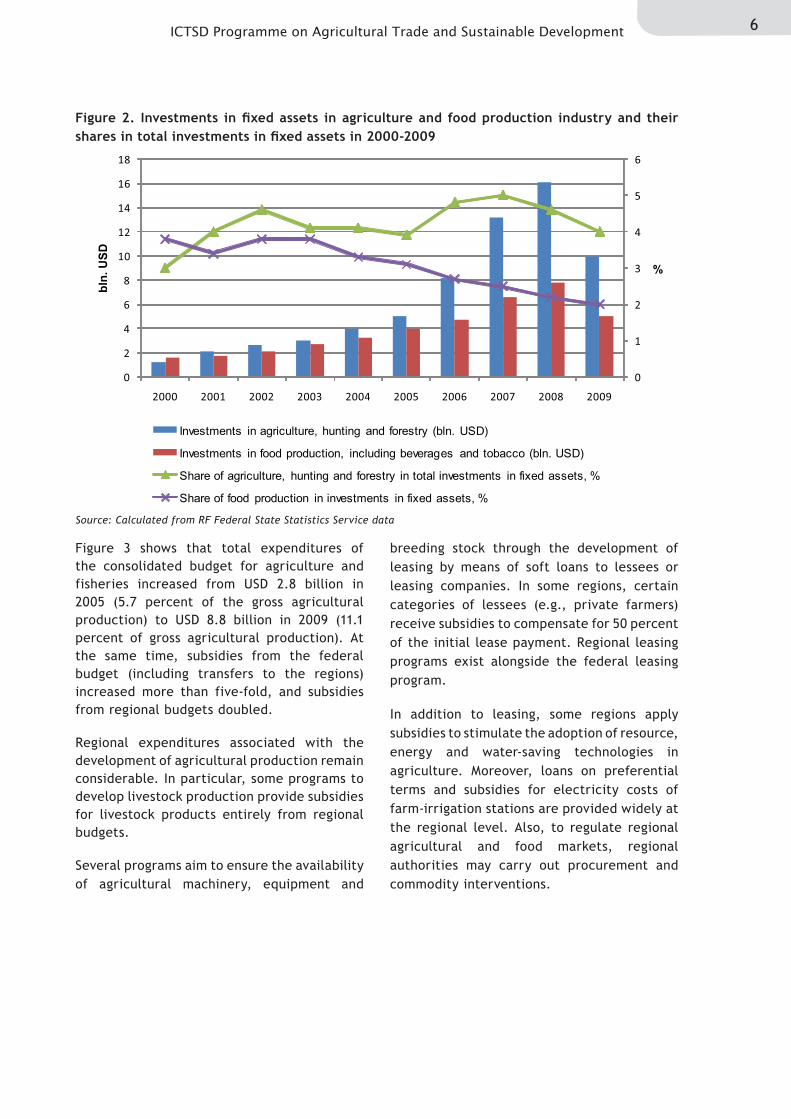
Figure 3 shows that total expenditures of the consolidated budget for agriculture and fisheries increased from USD 2.8 billion in 2005 (5.7 percent of the gross agricultural production) to USD 8.8 billion in 2009 (11.1 percent of gross agricultural production). At the same time, subsidies from the federal budget (including transfers to the regions) increased more than five-fold, and subsidies from regional budgets doubled.
Regional expenditures associated with the development of agricultural production remain considerable. In particular, some programs to develop livestock production provide subsidies for livestock products entirely from regional budgets.
Several programs aim to ensure the availability of agricultural machinery, equipment and
breeding stock through the development of leasing by means of soft loans to lessees or leasing companies. In some regions, certain categories of lessees (e.g., private farmers) receive subsidies to compensate for 50 percent of the initial lease payment. Regional leasing programs exist alongside the federal leasing program.
In addition to leasing, some regions apply subsidies to stimulate the adoption of resource, energy and water-saving technologies in agriculture. Moreover, loans on preferential terms and subsidies for electricity costs of farm-irrigation stations are provided widely at the regional level. Also, to regulate regional agricultural and food markets, regional authorities may carry out procurement and commodity interventions.
Figure 2. Investments in fixed assets in agriculture and food production industry and their shares in total investments in fixed assets in 2000-2009
Source: Calculated from RF Federal State Statistics Service data
0
1
2
3
4
5
6
0
2
4
6
8
10
12
14
16
18
2000 2001 2002 2003 2004 2005 2006 2007 2008 2009
%
bln.
USD
Investments in agriculture, hunting and forestry (bln. USD)
Investments in food production, including beverages and tobacco (bln. USD)
Share of agriculture, hunting and forestry in total investments in fixed assets, %
Share of food production in investments in fixed assets, %
7 S. Kiselev, R. Romashkin – Possible Effects of Russia’s WTO Accession on Agricultural Trade and Production
Therefore, the period of 2005-2009 is chara-cterized by a gradual increase in budgetary support to agriculture, both in absolute terms and in relation to gross agricultural output. Increases in federal agricultural support have encouraged regional authorities to focus on support programs that were developed by the federal government.
As a whole, by 2008 all the preconditions for maintaining steady growth in agriculture had been created. However, the potential to maintain this growth depends on numerous factors: macroeconomic stability, availability of long-term and short-term credit, changing consumer demand, state foreign trade policy, agriculture support policy and directions, exchange rate movements, and the evolution of the prices of agricultural commodities, food and inputs used in agricultural production.
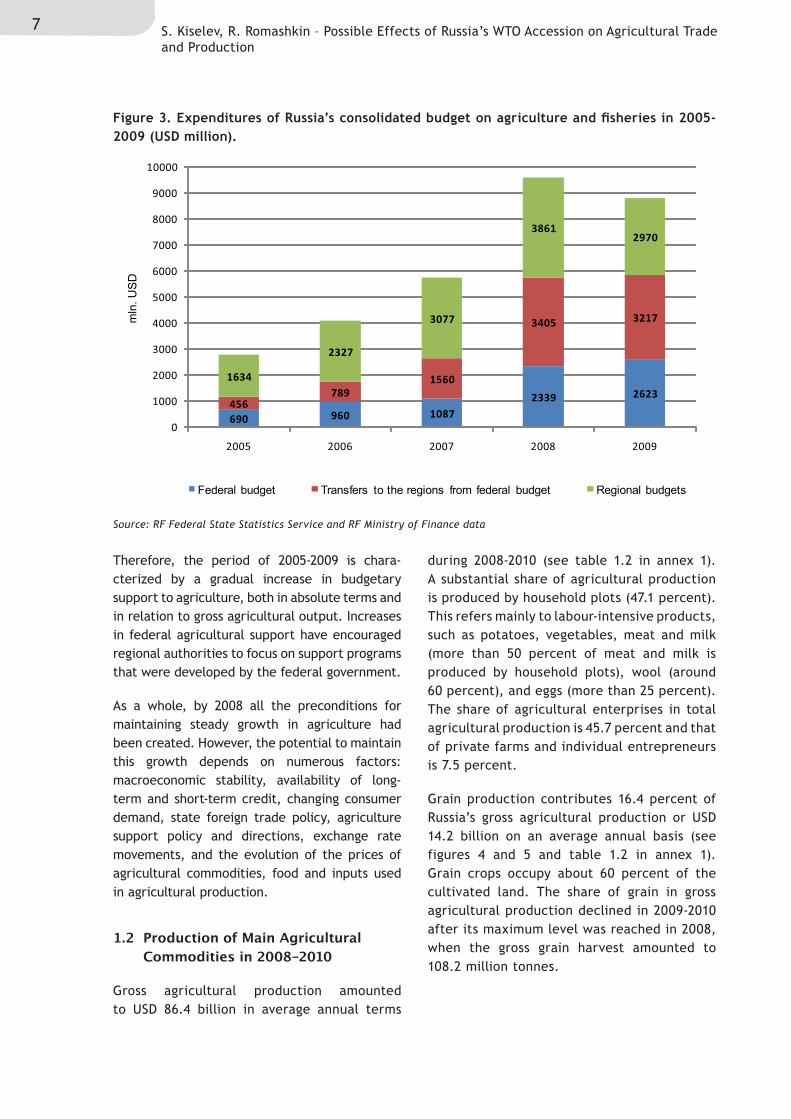
1.2 Production of Main Agricultural Commodities in 2008-2010
Gross agricultural production amounted to USD 86.4 billion in average annual terms
during 2008-2010 (see table 1.2 in annex 1). A substantial share of agricultural production is produced by household plots (47.1 percent). This refers mainly to labour-intensive products, such as potatoes, vegetables, meat and milk (more than 50 percent of meat and milk is produced by household plots), wool (around 60 percent), and eggs (more than 25 percent). The share of agricultural enterprises in total agricultural production is 45.7 percent and that of private farms and individual entrepreneurs is 7.5 percent.
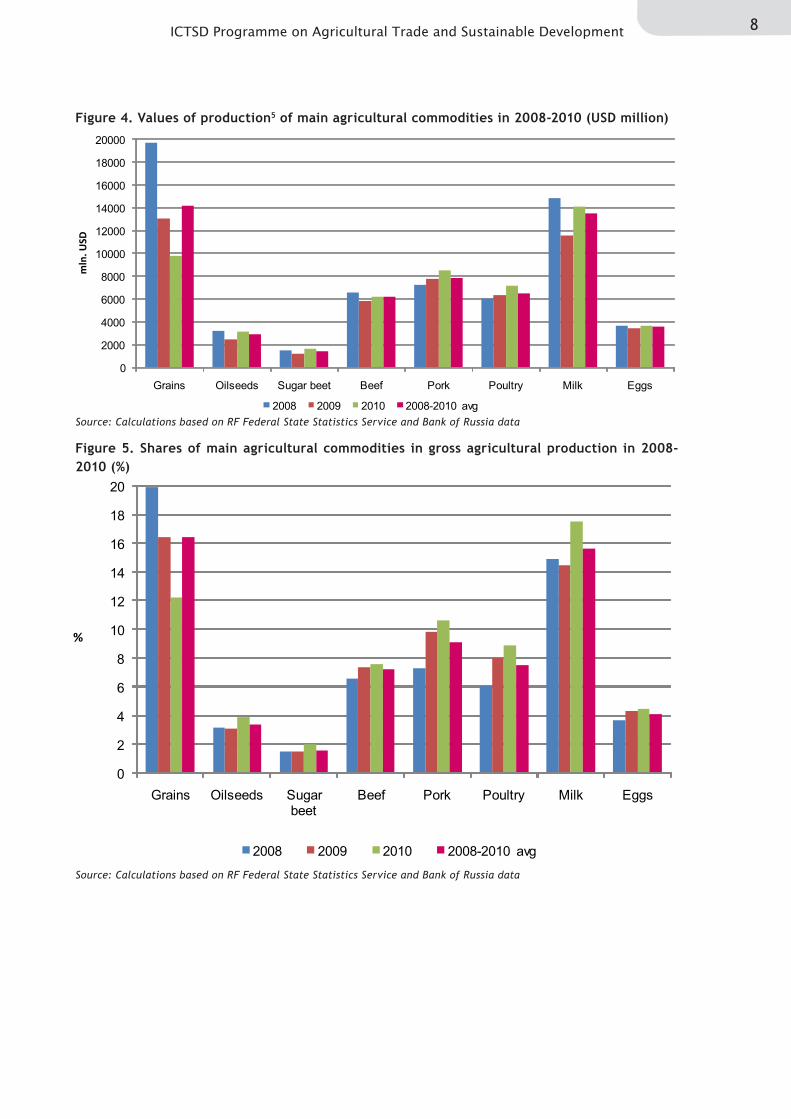
Grain production contributes 16.4 percent of Russia’s gross agricultural production or USD 14.2 billion on an average annual basis (see figures 4 and 5 and table 1.2 in annex 1). Grain crops occupy about 60 percent of the cultivated land. The share of grain in gross agricultural production declined in 2009-2010 after its maximum level was reached in 2008, when the gross grain harvest amounted to 108.2 million tonnes.
Figure 3. Expenditures of Russia’s consolidated budget on agriculture and fisheries in 2005-2009 (USD million).
Source: RF Federal State Statistics Service and RF Ministry of Finance data
690 960 10872339 2623
456789
1560
3405 3217
1634
2327
3077
38612970
0
1000
2000
3000
4000
5000
6000
7000
8000
9000
10000
2005 2006 2007 2008 2009
mln
. US
D
Federal budget Transfers to the regions from federal budget Regional budgets
8ICTSD Programme on Agricultural Trade and Sustainable Development
Figure 4. Values of production5 of main agricultural commodities in 2008-2010 (USD million)
Figure 5. Shares of main agricultural commodities in gross agricultural production in 2008-2010 (%)
Source: Calculations based on RF Federal State Statistics Service and Bank of Russia data
Source: Calculations based on RF Federal State Statistics Service and Bank of Russia data
0
2000
4000
6000
8000
10000
12000
14000
16000
18000
20000
Grains Oilseeds Sugar beet Beef Pork Poultry Milk Eggs
mln
. USD
2008 2009 2010 2008-2010 avg
0
2
4
6
8
10
12
14
16
18
20
Grains Oilseeds Sugar beet
Beef Pork Poultry Milk Eggs
%
2008 2009 2010 2008-2010 avg
9 S. Kiselev, R. Romashkin – Possible Effects of Russia’s WTO Accession on Agricultural Trade and Production
The value of production in the milk sector is very substantial, averaging USD 13.5 billion on an annual basis. The share of milk in gross agricultural production is 15.6 percent. The increase in the value of milk production in 2010 was linked to the favourable market environment that prevailed in that year. Although milk production declined by 1.7 percent to 32.0 million tonnes in 2010, due to a decrease in the number of cows by two percent, milk yield per cow increased by 2.5 percent or 113 kilogrammes (reaching 4600 kilogrammes per cow per year). This increase is the result of bringing herds up to date qualitatively, improving feeding, and technical and technological modernization of dairy farms.
The share of meat in gross agricultural production is much lower than that of milk. The share of pork production over the period considered was 9.1 percent (USD 7.9 billion),
poultry 7.5 percent (USD 6.5 billion), and beef 7.2 percent (USD 6.2 billion).
The egg industry evolved favourably over this period. The share of eggs in gross agricultural production was 4.1 percent (USD 3.6 billion) in 2008-2010. Egg production expanded due to the growing number of laying hens and improved laying ability. Egg production is more profitable than other types of livestock production.
The poultry industry grew the fastest during the period considered (see figure 7 and table 1.3 in annex 1). Poultry production increased by 27.9 percent in 2010 compared to 2008. Good results were also achieved in pork production.
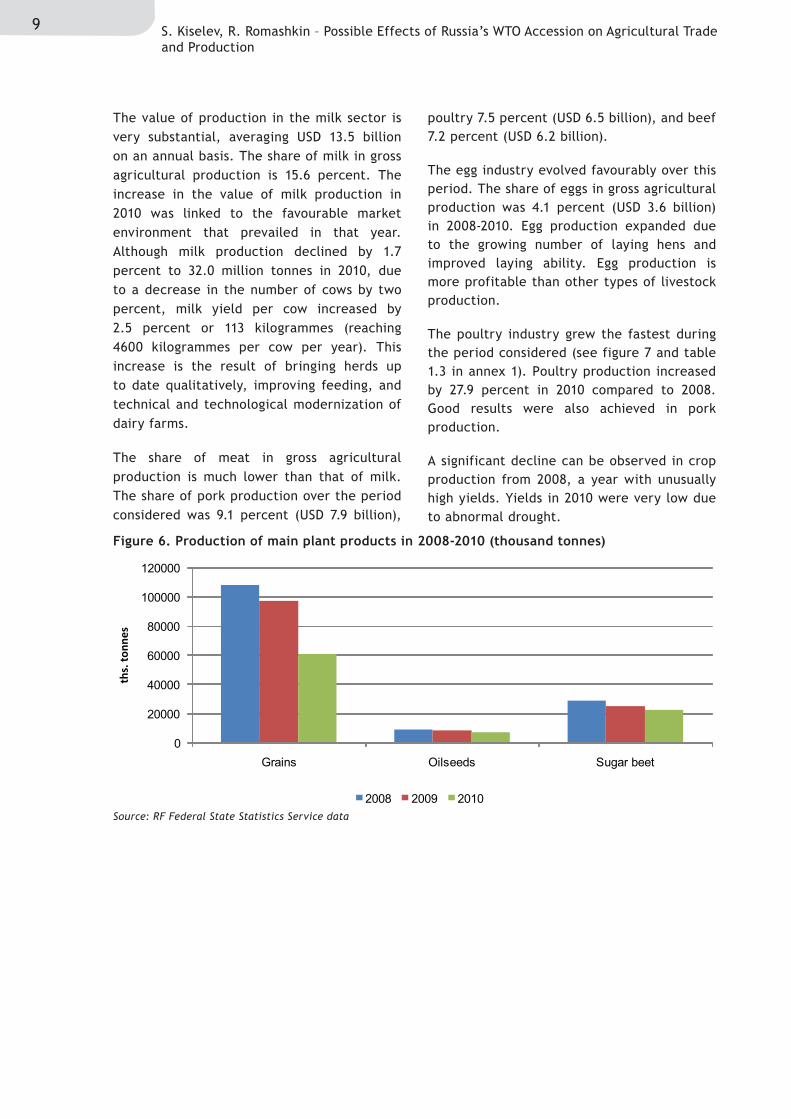
A significant decline can be observed in crop production from 2008, a year with unusually high yields. Yields in 2010 were very low due to abnormal drought.
Figure 6. Production of main plant products in 2008-2010 (thousand tonnes)
Source: RF Federal State Statistics Service data
0
20000
40000
60000
80000
100000
120000
Grains Oilseeds Sugar beet
ths.
tonn
es
2008 2009 2010
10ICTSD Programme on Agricultural Trade and Sustainable Development
Figure 7. Production of main animal products in 2008-2010 (thousand tonnes)
Figure 8. Market volumes of main agricultural and food commodities in 2008-2010 (USD million)
Source: RF Federal State Statistics Service data
Source: Calculations based on RF Federal State Statistics Service and RF Federal Customs Service data
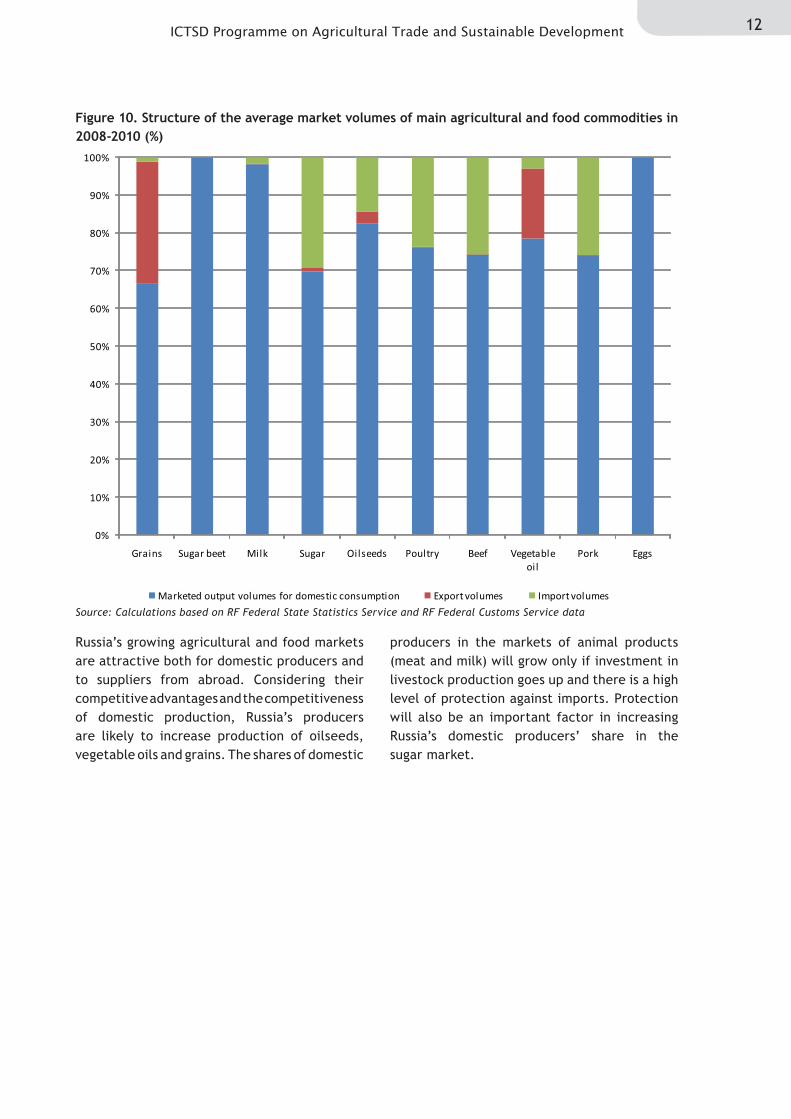
1.3 Market Volumes of Main Agricultural and Food Commodities in 2008-2010
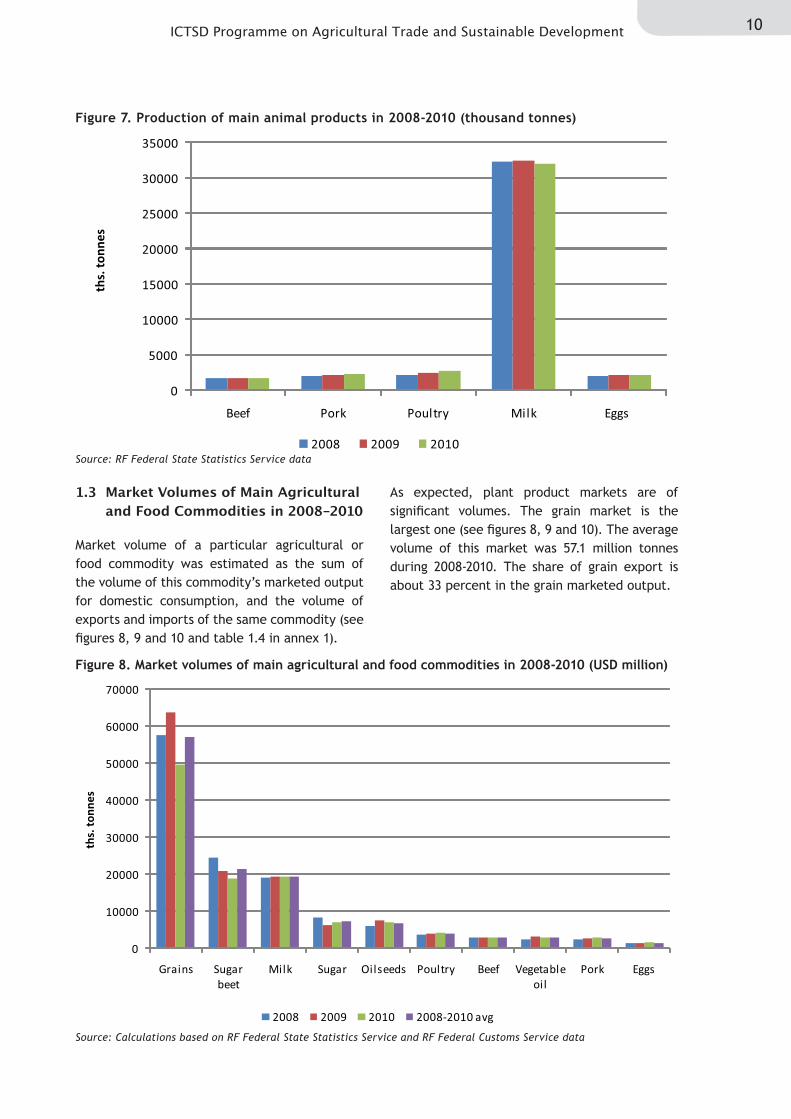
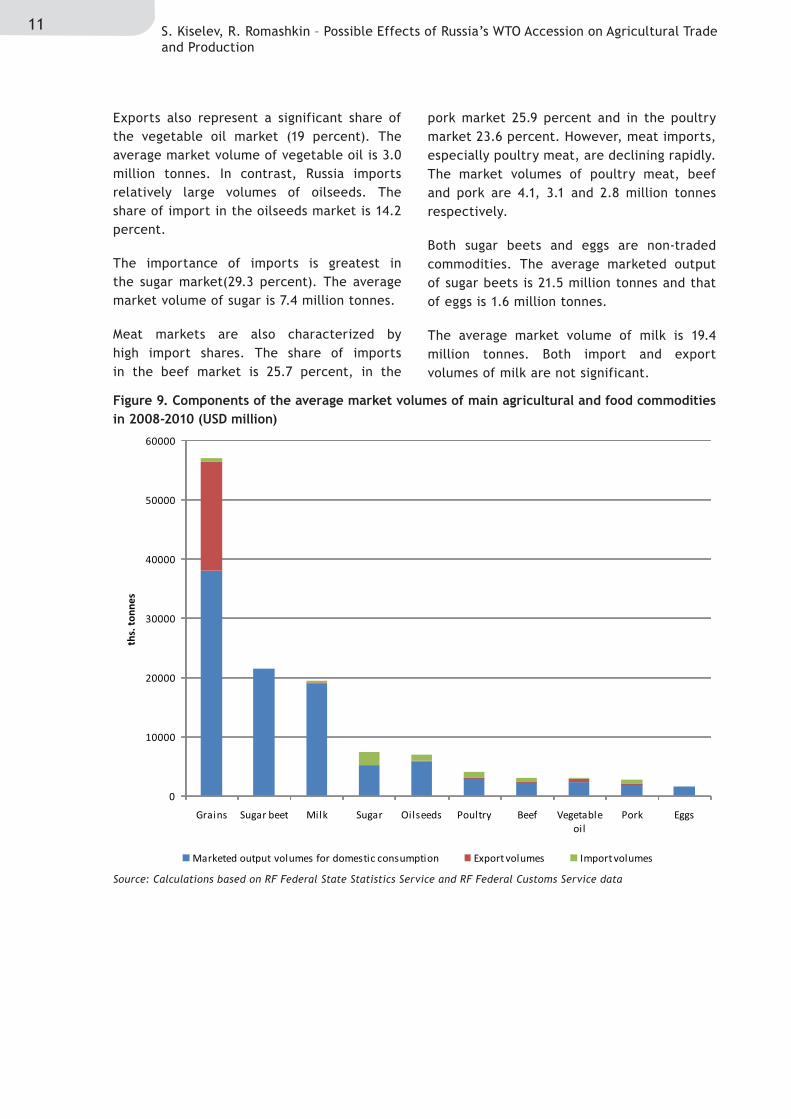
Market volume of a particular agricultural or food commodity was estimated as the sum of the volume of this commodity’s marketed output for domestic consumption, and the volume of exports and imports of the same commodity (see figures 8, 9 and 10 and table 1.4 in annex 1).
As expected, plant product markets are of significant volumes. The grain market is the largest one (see figures 8, 9 and 10). The average volume of this market was 57.1 million tonnes during 2008-2010. The share of grain export is about 33 percent in the grain marketed output.
0
5000
10000
15000
20000
25000
30000
35000
Beef Pork Poultry Milk Eggs
ths.
ton
nes
2008 2009 2010
0
10000
20000
30000
40000
50000
60000
70000
Grains Sugar beet
Milk Sugar Oilseeds Poultry Beef Vegetable oil
Pork Eggs
ths.
ton
nes
2008 2009 2010 2008-2010 avg
11 S. Kiselev, R. Romashkin – Possible Effects of Russia’s WTO Accession on Agricultural Trade and Production
Exports also represent a significant share of the vegetable oil market (19 percent). The average market volume of vegetable oil is 3.0 million tonnes. In contrast, Russia imports relatively large volumes of oilseeds. The share of import in the oilseeds market is 14.2 percent.
The importance of imports is greatest in the sugar market(29.3 percent). The average market volume of sugar is 7.4 million tonnes.
Meat markets are also characterized by high import shares. The share of imports in the beef market is 25.7 percent, in the
pork market 25.9 percent and in the poultry market 23.6 percent. However, meat imports, especially poultry meat, are declining rapidly. The market volumes of poultry meat, beef and pork are 4.1, 3.1 and 2.8 million tonnes respectively.
Both sugar beets and eggs are non-traded commodities. The average marketed output of sugar beets is 21.5 million tonnes and that of eggs is 1.6 million tonnes.
The average market volume of milk is 19.4 million tonnes. Both import and export volumes of milk are not significant.
Figure 9. Components of the average market volumes of main agricultural and food commodities in 2008-2010 (USD million)
Source: Calculations based on RF Federal State Statistics Service and RF Federal Customs Service data
0
10000
20000
30000
40000
50000
60000
Grains Sugar beet Milk Sugar Oilseeds Poultry Beef Vegetable oil
Pork Eggs
ths.
tonn
es
Marketed output volumes for domestic consumption Export volumes Import volumes
12ICTSD Programme on Agricultural Trade and Sustainable Development
Russia’s growing agricultural and food markets are attractive both for domestic producers and to suppliers from abroad. Considering their competitive advantages and the competitiveness of domestic production, Russia’s producers are likely to increase production of oilseeds, vegetable oils and grains. The shares of domestic
producers in the markets of animal products (meat and milk) will grow only if investment in livestock production goes up and there is a high level of protection against imports. Protection will also be an important factor in increasing Russia’s domestic producers’ share in the sugar market.
Figure 10. Structure of the average market volumes of main agricultural and food commodities in 2008-2010 (%)
Source: Calculations based on RF Federal State Statistics Service and RF Federal Customs Service data
0%
10%
20%
30%
40%
50%
60%
70%
80%
90%
100%
Grains Sugar beet Milk Sugar Oilseeds Poultry Beef Vegetable oil
Pork Eggs
Marketed output volumes for domestic consumption Export volumes Import volumes
13 S. Kiselev, R. Romashkin – Possible Effects of Russia’s WTO Accession on Agricultural Trade and Production
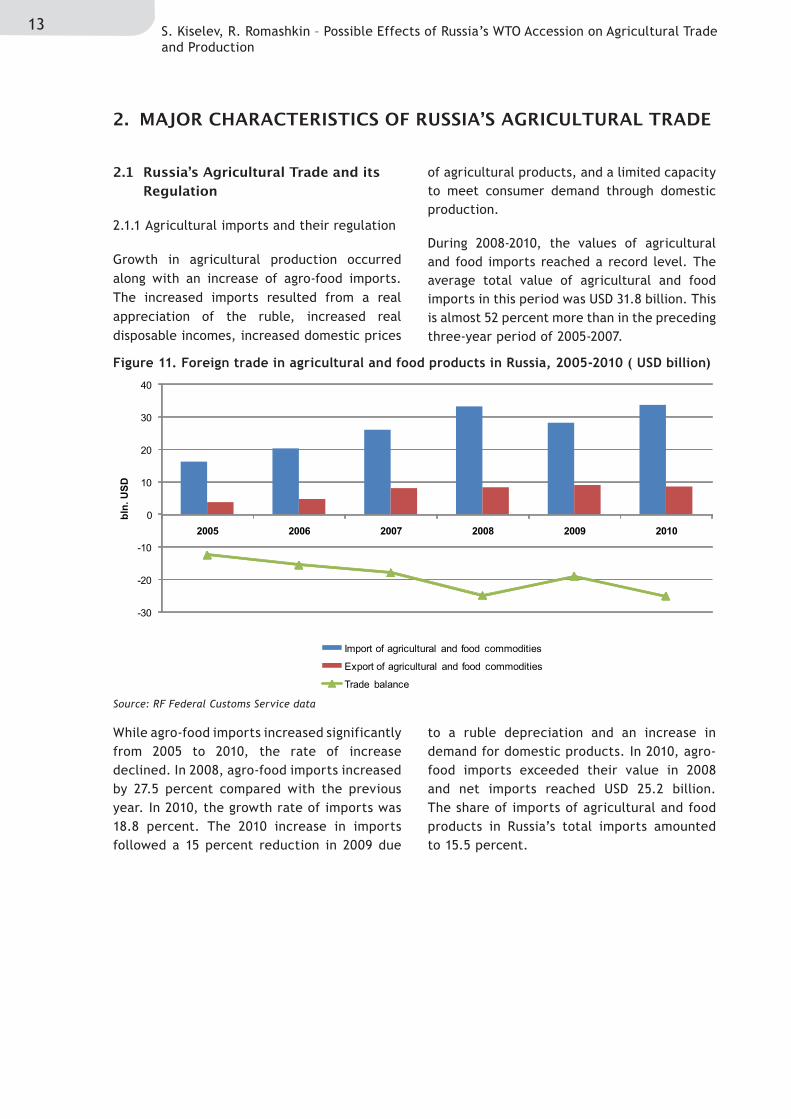
While agro-food imports increased significantly from 2005 to 2010, the rate of increase declined. In 2008, agro-food imports increased by 27.5 percent compared with the previous year. In 2010, the growth rate of imports was 18.8 percent. The 2010 increase in imports followed a 15 percent reduction in 2009 due
to a ruble depreciation and an increase in demand for domestic products. In 2010, agro-food imports exceeded their value in 2008 and net imports reached USD 25.2 billion. The share of imports of agricultural and food products in Russia’s total imports amounted to 15.5 percent.
Figure 11. Foreign trade in agricultural and food products in Russia, 2005-2010 ( USD billion)
2. MAJOR CHARACTERISTICS OF RUSSIA’S AGRICULTURAL TRADE
2.1 Russia’s Agricultural Trade and its Regulation
2.1.1 Agricultural imports and their regulation
Growth in agricultural production occurred along with an increase of agro-food imports. The increased imports resulted from a real appreciation of the ruble, increased real disposable incomes, increased domestic prices
of agricultural products, and a limited capacity to meet consumer demand through domestic production.
During 2008-2010, the values of agricultural and food imports reached a record level. The average total value of agricultural and food imports in this period was USD 31.8 billion. This is almost 52 percent more than in the preceding three-year period of 2005-2007.
Source: RF Federal Customs Service data
-30
-20
-10
0
10
20
30
40
2005 2006 2007 2008 2009 2010
bln.
USD
Import of agricultural and food commodities
Export of agricultural and food commodities
Trade balance
14ICTSD Programme on Agricultural Trade and Sustainable Development
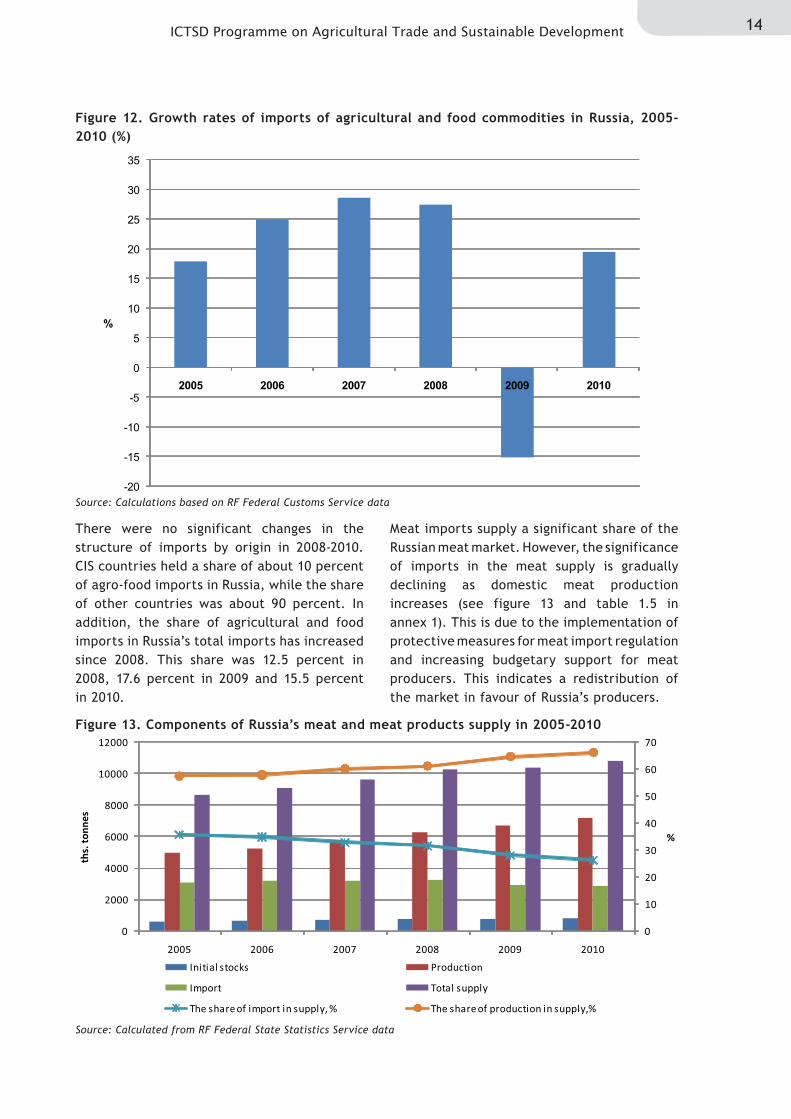
There were no significant changes in the structure of imports by origin in 2008-2010. CIS countries held a share of about 10 percent of agro-food imports in Russia, while the share of other countries was about 90 percent. In addition, the share of agricultural and food imports in Russia’s total imports has increased since 2008. This share was 12.5 percent in 2008, 17.6 percent in 2009 and 15.5 percent in 2010.
Meat imports supply a significant share of the Russian meat market. However, the significance of imports in the meat supply is gradually declining as domestic meat production increases (see figure 13 and table 1.5 in annex 1). This is due to the implementation of protective measures for meat import regulation and increasing budgetary support for meat producers. This indicates a redistribution of the market in favour of Russia’s producers.
Figure 12. Growth rates of imports of agricultural and food commodities in Russia, 2005-2010 (%)
Figure 13. Components of Russia’s meat and meat products supply in 2005-2010
Source: Calculations based on RF Federal Customs Service data
Source: Calculated from RF Federal State Statistics Service data
-20
-15
-10
-5
0
5
10
15
20
25
30
35
2005 2006 2007 2008 2009 2010
%
0
10
20
30
40
50
60
70
0
2000
4000
6000
8000
10000
12000
2005 2006 2007 2008 2009 2010
%
ths.
ton
nes
Initial stocks Production
Import Total supply
The share of import in supply, % The share of production in supply,%
15 S. Kiselev, R. Romashkin – Possible Effects of Russia’s WTO Accession on Agricultural Trade and Production
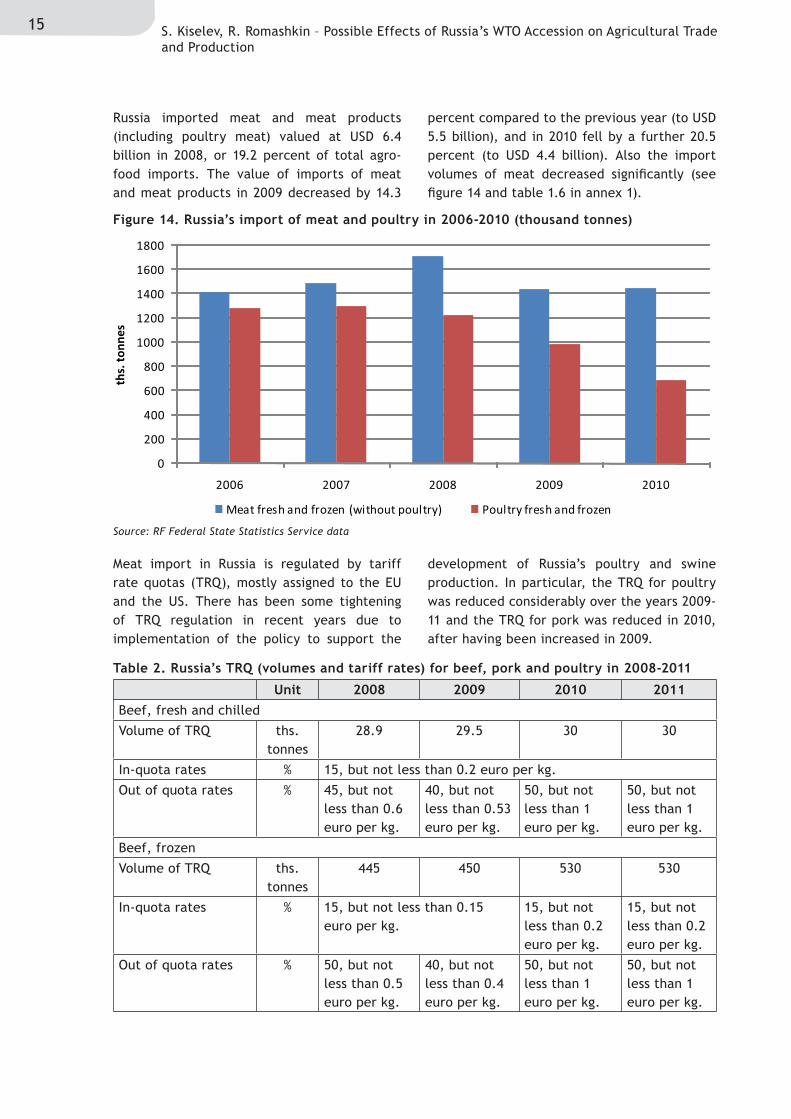
Russia imported meat and meat products (including poultry meat) valued at USD 6.4 billion in 2008, or 19.2 percent of total agro-food imports. The value of imports of meat and meat products in 2009 decreased by 14.3
percent compared to the previous year (to USD 5.5 billion), and in 2010 fell by a further 20.5 percent (to USD 4.4 billion). Also the import volumes of meat decreased significantly (see figure 14 and table 1.6 in annex 1).
Meat import in Russia is regulated by tariff rate quotas (TRQ), mostly assigned to the EU and the US. There has been some tightening of TRQ regulation in recent years due to implementation of the policy to support the
development of Russia’s poultry and swine production. In particular, the TRQ for poultry was reduced considerably over the years 2009-11 and the TRQ for pork was reduced in 2010, after having been increased in 2009.
Figure 14. Russia’s import of meat and poultry in 2006-2010 (thousand tonnes)
Table 2. Russia’s TRQ (volumes and tariff rates) for beef, pork and poultry in 2008-2011
Source: RF Federal State Statistics Service data
Unit 2008 2009 2010 2011Beef, fresh and chilled
Volume of TRQ ths. tonnes
28.9 29.5 30 30
In-quota rates % 15, but not less than 0.2 euro per kg.
Out of quota rates % 45, but not less than 0.6 euro per kg.
40, but not less than 0.53 euro per kg.
50, but not less than 1 euro per kg.
50, but not less than 1 euro per kg.
Beef, frozen
Volume of TRQ ths. tonnes
445 450 530 530
In-quota rates % 15, but not less than 0.15 euro per kg.
15, but not less than 0.2 euro per kg.
15, but not less than 0.2 euro per kg.
Out of quota rates % 50, but not less than 0.5 euro per kg.
40, but not less than 0.4 euro per kg.
50, but not less than 1 euro per kg.
50, but not less than 1 euro per kg.
0
200
400
600
800
1000
1200
1400
1600
1800
2006 2007 2008 2009 2010
ths.
ton
nes
Meat fresh and frozen (without poultry) Poultry fresh and frozen
16ICTSD Programme on Agricultural Trade and Sustainable Development
The growing demand for beef in Russia, in the face of limited capacity for domestic production and import substitution, fuelled the further expansion of beef import volumes in 2008-2011.
In the milk market, protective measures were activated as a result of increased imports and falling producer prices of milk in 2008. The specific component of the compound rate of import duty on butter was increased from €0.22 to €0.35 per kilogramme in early 2009, while the ad valorem rate was kept at 15 percent. The duty on milk powder was increased from 15 to 20 percent of its customs value. At the end of September 2009, Russia increased the import duties on cheese.
In August 2010, the Commission of the Customs Union of Russia, Belarus and Kazakhstan decided to increase the import duty on milk powder to 25 percent of customs value and also the specific component of compound tariffs: milk whey from €0.3 per kilogramme to €0.35 per kilogramme, butter from €0.35 per kilogramme to €0.4 per kilogramme, and cheese (processed and other varieties) from €0.5 per kilogramme to €0.6 per kilogramme. These increases meant that
protection against imports of certain types of dairy products could be provided in spite of the fall in the value of the euro against the Russian ruble in 2010.
Import duties on certain types of tropical oils used in the food industry instead of milk fat were raised from zero to ten percent of customs value in mid-June 2009. This was due to the expansion of the milk market.
Most of the milk powder imported by Russia from the CIS countries has been subject to a duty-free regime. In early June 2009, Russia proposed amending the so-called forecast balances6 for milk in order to restrict import of milk powder from Belarus. As a result, the consignments of Belarusian milk powder were reduced (from 110 thousand tonnes to 70 thousand tonnes), and cheese and curd consignments were expanded (from 100 thousand tonnes to 132 thousand tonnes).
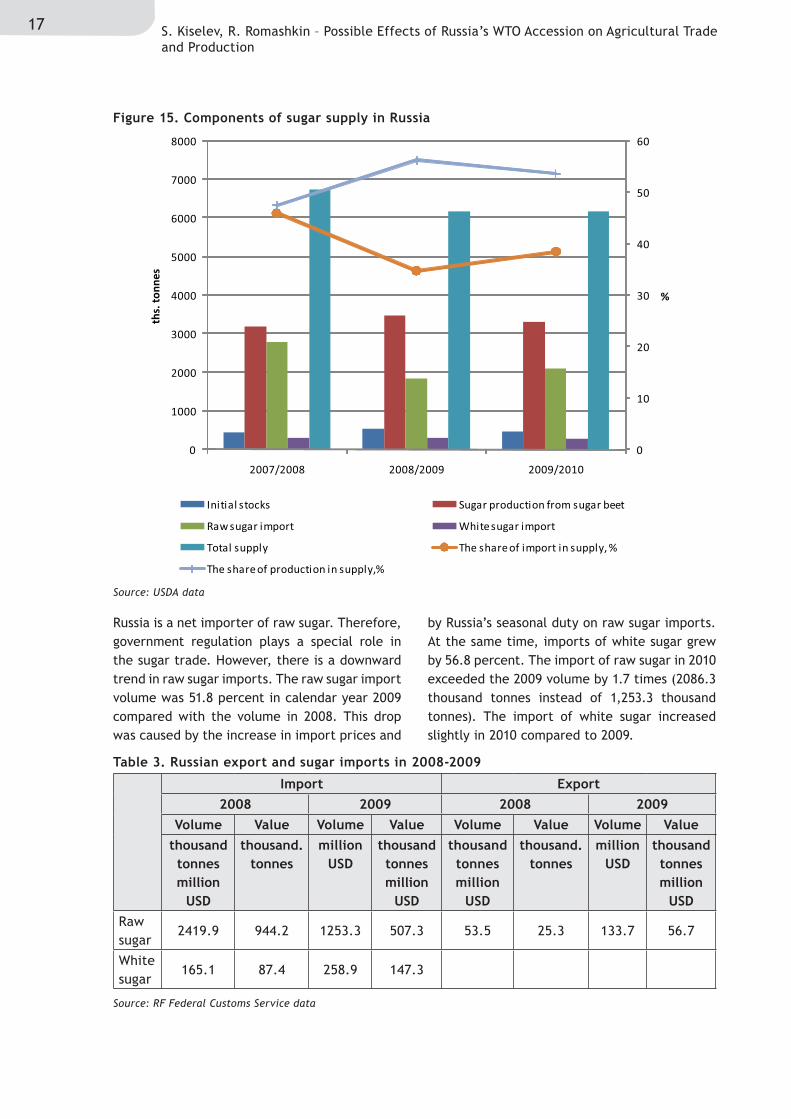
Import of sugar is a significant component of Russia’s sugar supply (see figure 15 and table 1.7 in annex 1). Sugar is imported because domestic production is insufficient.
Table 2. Continued
Source: Russia’s customs legislation for 2008-2011
Unit 2008 2009 2010 2011Pork fresh, chilled and frozen
Volume of TRQ ths. tonnes
493.5 531.9 472.1 472.1
In-quota rates % 15, but not less than 0.25 euro per kg.
Out of quota rates % 60, but not less than 1.0 euro per kg.
75, but not less than 1.5 euro per kg.
75, but not less than 1.5 euro per kg.
75, but not less than 1.5 euro per kg.
Meat and edible offal of poultry, fresh, chilled and frozen
Volume of TRQ ths. tonnes
1211.6 952 780 350
In-quota rates % 25, but not less than 0.2 euro per kg.
Out of quota rates % 60, but not less than 0.48 euro per kg.
95, but not less than 0.8 euro per kg.
80, but not less than 0.7 euro per kg.
80, but not less than 0.7 euro per kg.
17 S. Kiselev, R. Romashkin – Possible Effects of Russia’s WTO Accession on Agricultural Trade and Production
Figure 15. Components of sugar supply in Russia
Table 3. Russian export and sugar imports in 2008-2009
Source: USDA data
Source: RF Federal Customs Service data
Russia is a net importer of raw sugar. Therefore, government regulation plays a special role in the sugar trade. However, there is a downward trend in raw sugar imports. The raw sugar import volume was 51.8 percent in calendar year 2009 compared with the volume in 2008. This drop was caused by the increase in import prices and
by Russia’s seasonal duty on raw sugar imports. At the same time, imports of white sugar grew by 56.8 percent. The import of raw sugar in 2010 exceeded the 2009 volume by 1.7 times (2086.3 thousand tonnes instead of 1,253.3 thousand tonnes). The import of white sugar increased slightly in 2010 compared to 2009.
Import Export2008 2009 2008 2009
Volume Value Volume Value Volume Value Volume Valuethousand tonnes million
USD
thousand. tonnes
million USD
thousand tonnes million
USD
thousand tonnes million
USD
thousand. tonnes
million USD
thousand tonnes million
USDRaw sugar
2419.9 944.2 1253.3 507.3 53.5 25.3 133.7 56.7
White sugar
165.1 87.4 258.9 147.3
0
10
20
30
40
50
60
0
1000
2000
3000
4000
5000
6000
7000
8000
2007/2008 2008/2009 2009/2010
%
ths.
tonn
es
Initial stocks Sugar production from sugar beet
Raw sugar import White sugar import
Total supply The share of import in supply, %
The share of production in supply,%

18ICTSD Programme on Agricultural Trade and Sustainable Development
Since January 2010, Russia’s import duties on raw sugar have been determined by the price fluctuations of raw sugar at the New York Mercantile Exchange (NYMEX) in the range of USD 286.60 – 396.83 per tonne. When the raw sugar price exceeds the level of USD 396.83 per tonne the import duty is USD 140 per tonne. The import duty increases if prices decline. The maximum value of import duty is USD 270 per tonne. It is used if the price for raw sugar does not exceed the level of USD 286.60 per tonne.
A reduced duty on raw sugar is usually applied from 1 May to 31 July. During this period, the import duty amounts to USD 50 per tonne if the raw sugar quota is over USD 485.02 per tonne, with a maximum import duty of USD 250 per tonne – applied if the price for raw sugar does not exceed USD 286.6 per tonne.
In addition, since May 2010 the monitoring period of prices on raw sugar at the NYMEX has been reduced from three months to one month. This has helped to make customs regulation more responsive to changes in the global sugar market.
Belarus remains the main supplier of white sugar to Russia. Imports of white sugar are regulated by the agreement between Russia and Belarus. Imports of Belarusian sugar to Russia amounted to 100,000 tonnes in 2008. The agreed amount of sugar imports to Russia increased to 150,000 tonnes per year in 2009 and 2010. The supply of sugar from Belarus was fixed at 200,000 tonnes in 2011.
The regulation of agro-food imports therefore relied on both tariff and non-tariff measures in 2008-2010. One of the important non-tariff measures was the coordination of the forecast balances (quotas) between Russia and Belarus for the supply of meat and meat products, milk and dairy products, and sugar. Other important measures used to restrict imports from non-CIS countries were meat tariff quotas and the floating duty on raw sugar.
2.1.2 Agricultural exports and their regulation
Russia remains a net importer of agricultural and food products. However, Russia’s agro-food
exports have been growing alongside the increase in imports (see figure 11). Since 2002, Russia has become one of the largest suppliers of grain to the world market. In addition, the modernization of the food industry has contributed to increasing Russia’s exports of beer, ice cream, dairy and meat products.
The value of agro-food exports reached a record high of USD 9.3 billion in 2009. The share of agro-food exports in Russia’s total exports was 2.3 percent in 2008-2010. More than two thirds of Russian agro-food exports were destined for non-CIS countries.
Grains (mainly wheat) occupy the largest share in the value of Russia’s agro-food exports. However, in 2008 and 2010 exports of grain were significantly below the potential volumes due to Russia’s application of export restrictions. Prohibitive duties on exports of wheat and meslin (40 percent, but not less than €105 per tonne) and a ban on export to Belarus and Kazakhstan were applied between 1 February and 30 June 2008. Earlier, in November 2007, restrictive duties on exports of barley (30 percent, but not less than €70 per tonne) and on wheat and meslin (ten percent, but not less than €22 per tonne) from Russia to countries other than Belarus and Kazakhstan were established.
The problem of supporting grain exports has acquired particular importance due to the record harvest in 2008 and the convergence of domestic and world prices. In late 2008, a discussion was therefore begun on the possibility of subsidizing grain exports, reducing the tariffs (freight rates) on railway transportation and grain handling at ports, and accelerating value-added tax (VAT) refunds for the main grain exporting companies. However, the currency depreciation in late 2008 and early 2009 delayed the introduction of export subsidies. At the same time, there was a double reduction of the tariffs for the railway transportation of grains and products of the milling industry until 30 June 2009. In 2009, these preferential tariffs were extended until 31 March 2010.
Due to abnormal drought and the associated significant decrease in grain yields, Russia
19 S. Kiselev, R. Romashkin – Possible Effects of Russia’s WTO Accession on Agricultural Trade and Production
introduced a ban on exports of wheat and meslin, rye, barley, maize, and wheat flour from 15 August 2010 to 31 December 2010. In October 2010 the ban on the export of wheat and meslin, rye, barley, and maize was extended until 30 June 2011.
There is therefore a direct interdependence between the policies for grain exports and the availability of grains in the domestic market. At the same time, the support for exports takes the form of discounts on railway transportation of grains. To restrict grain exports Russia has used both tariffs and non-tariff measures (export bans).
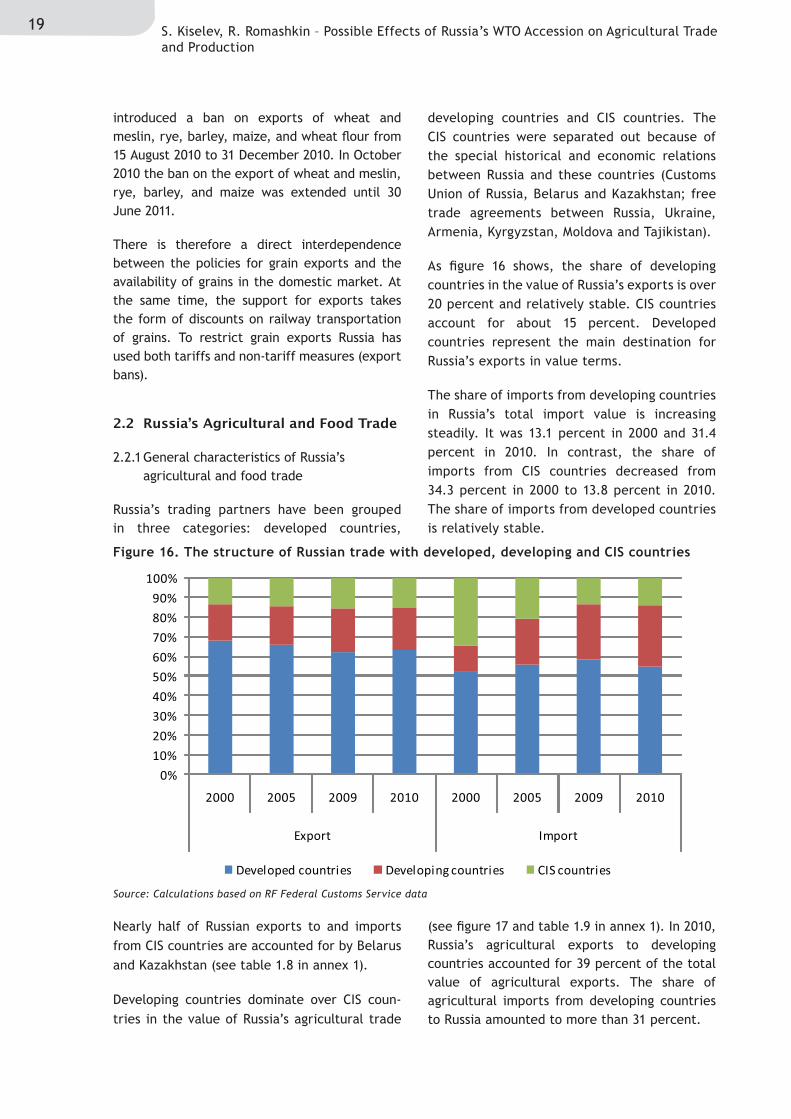
2.2 Russia’s Agricultural and Food Trade
2.2.1 General characteristics of Russia’s agricultural and food trade
Russia’s trading partners have been grouped in three categories: developed countries,
developing countries and CIS countries. The CIS countries were separated out because of the special historical and economic relations between Russia and these countries (Customs Union of Russia, Belarus and Kazakhstan; free trade agreements between Russia, Ukraine, Armenia, Kyrgyzstan, Moldova and Tajikistan).
As figure 16 shows, the share of developing countries in the value of Russia’s exports is over 20 percent and relatively stable. CIS countries account for about 15 percent. Developed countries represent the main destination for Russia’s exports in value terms.
The share of imports from developing countries in Russia’s total import value is increasing steadily. It was 13.1 percent in 2000 and 31.4 percent in 2010. In contrast, the share of imports from CIS countries decreased from 34.3 percent in 2000 to 13.8 percent in 2010. The share of imports from developed countries is relatively stable.
Nearly half of Russian exports to and imports from CIS countries are accounted for by Belarus and Kazakhstan (see table 1.8 in annex 1).
Developing countries dominate over CIS coun-tries in the value of Russia’s agricultural trade
(see figure 17 and table 1.9 in annex 1). In 2010, Russia’s agricultural exports to developing countries accounted for 39 percent of the total value of agricultural exports. The share of agricultural imports from developing countries to Russia amounted to more than 31 percent.
Figure 16. The structure of Russian trade with developed, developing and CIS countries
Source: Calculations based on RF Federal Customs Service data
0%
10%
20%
30%
40%
50%
60%
70%
80%
90%
100%
2000 2005 2009 2010 2000 2005 2009 2010
Export Import
Developed countries Developing countries CIS countries
20ICTSD Programme on Agricultural Trade and Sustainable Development
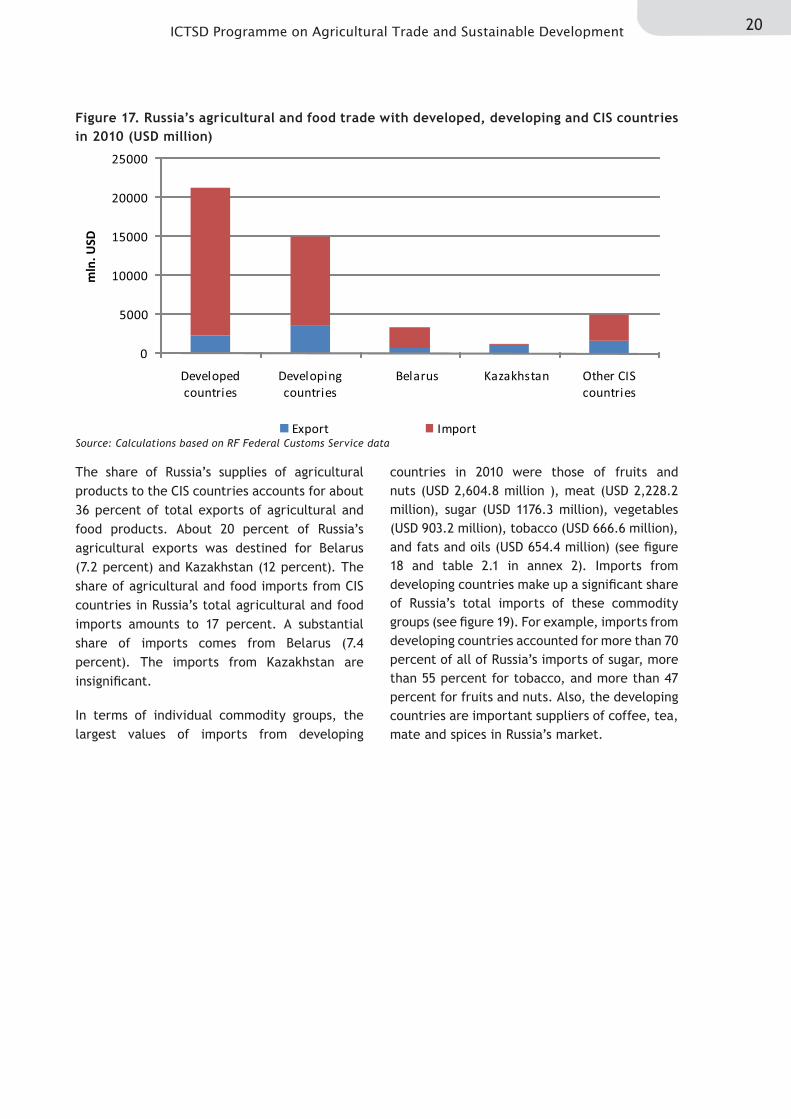
The share of Russia’s supplies of agricultural products to the CIS countries accounts for about 36 percent of total exports of agricultural and food products. About 20 percent of Russia’s agricultural exports was destined for Belarus (7.2 percent) and Kazakhstan (12 percent). The share of agricultural and food imports from CIS countries in Russia’s total agricultural and food imports amounts to 17 percent. A substantial share of imports comes from Belarus (7.4 percent). The imports from Kazakhstan are insignificant.
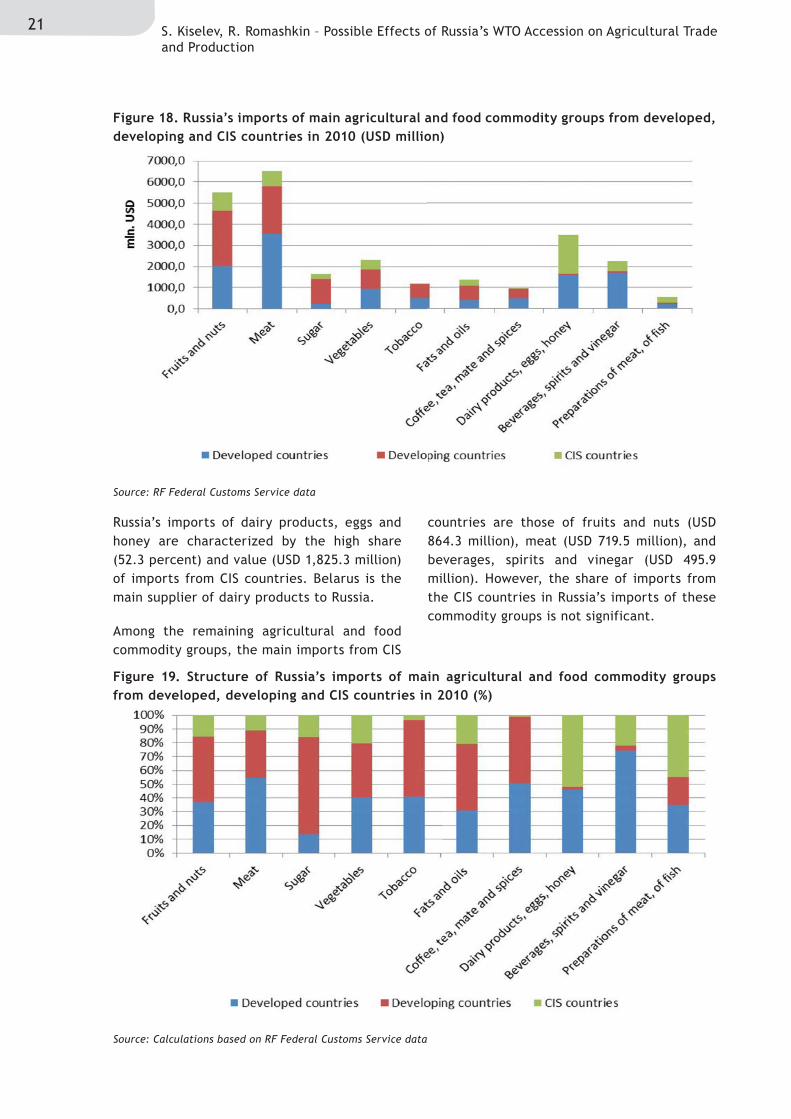
In terms of individual commodity groups, the largest values of imports from developing
countries in 2010 were those of fruits and nuts (USD 2,604.8 million ), meat (USD 2,228.2 million), sugar (USD 1176.3 million), vegetables (USD 903.2 million), tobacco (USD 666.6 million), and fats and oils (USD 654.4 million) (see figure 18 and table 2.1 in annex 2). Imports from developing countries make up a significant share of Russia’s total imports of these commodity groups (see figure 19). For example, imports from developing countries accounted for more than 70 percent of all of Russia’s imports of sugar, more than 55 percent for tobacco, and more than 47 percent for fruits and nuts. Also, the developing countries are important suppliers of coffee, tea, mate and spices in Russia’s market.
Figure 17. Russia’s agricultural and food trade with developed, developing and CIS countries in 2010 (USD million)
Source: Calculations based on RF Federal Customs Service data
0
5000
10000
15000
20000
25000
Developed countries
Developing countries
Belarus Kazakhstan Other CIS countries
mln
. USD
Export Import
21 S. Kiselev, R. Romashkin – Possible Effects of Russia’s WTO Accession on Agricultural Trade and Production
Figure 18. Russia’s imports of main agricultural and food commodity groups from developed, developing and CIS countries in 2010 (USD million)
Figure 19. Structure of Russia’s imports of main agricultural and food commodity groups from developed, developing and CIS countries in 2010 (%)
Source: RF Federal Customs Service data
Source: Calculations based on RF Federal Customs Service data
Russia’s imports of dairy products, eggs and honey are characterized by the high share (52.3 percent) and value (USD 1,825.3 million) of imports from CIS countries. Belarus is the main supplier of dairy products to Russia.
Among the remaining agricultural and food commodity groups, the main imports from CIS
countries are those of fruits and nuts (USD 864.3 million), meat (USD 719.5 million), and beverages, spirits and vinegar (USD 495.9 million). However, the share of imports from the CIS countries in Russia’s imports of these commodity groups is not significant.
22ICTSD Programme on Agricultural Trade and Sustainable Development
Figure 20. Russia’s exports of main agricultural and food commodity groups to developed, developing and CIS countries in 2010 (USD million)
Source: RF Federal Customs Service data
A considerable portion of Russia’s imports from the CIS countries consists of preparations of meat, of fish (45.1 percent) and products of the milling industry (40.5 percent). A substantial share of imports of these product groups comes from Belarus.
In general, Russia’s imports of agricultural and food products are therefore characterized by a low degree of substitution between goods from developing and from CIS countries. This is due to the specific characteristics of the goods concerned and the limited capacity of CIS countries to meet Russia’s demand. The
meat commodity groups probably exhibit the highest degree of substitution between CIS and developing country origins.
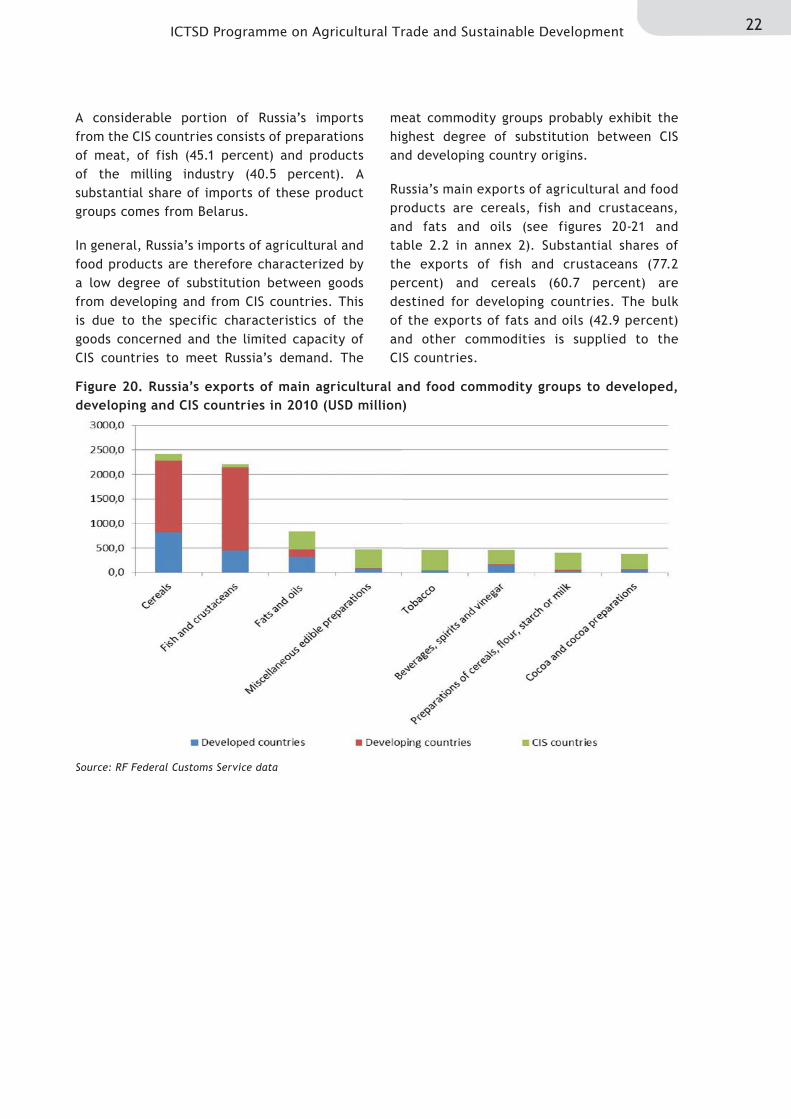
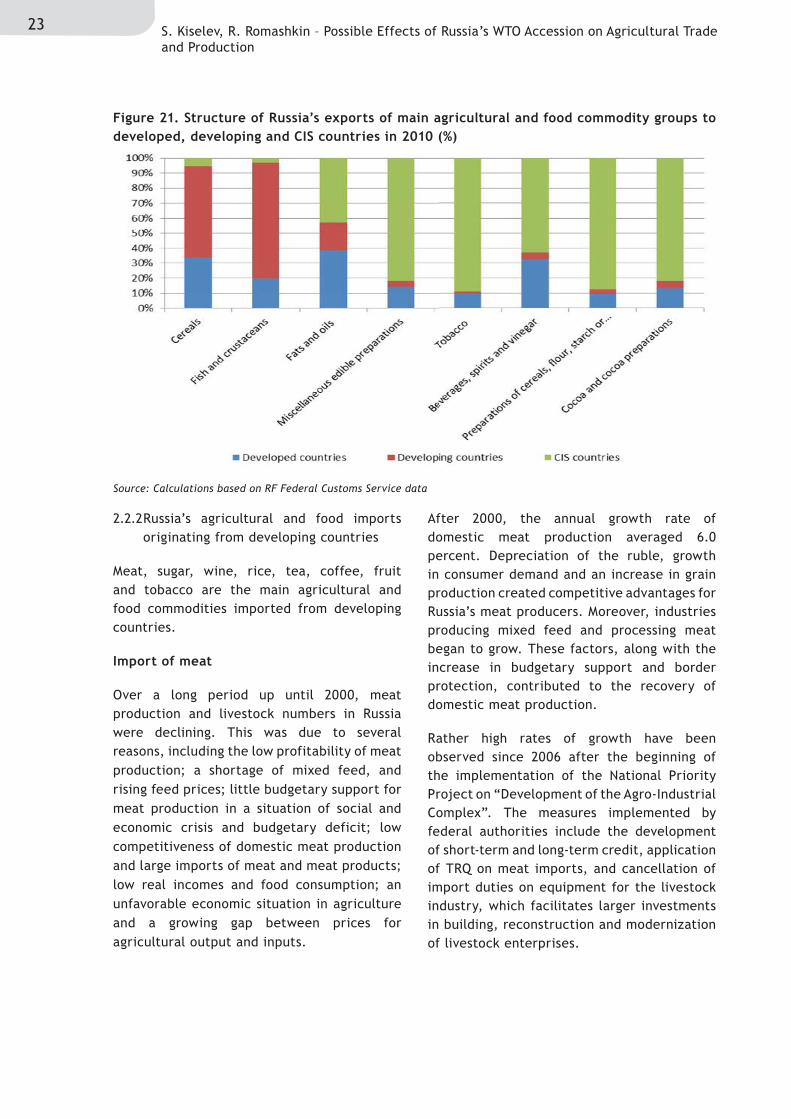
Russia’s main exports of agricultural and food products are cereals, fish and crustaceans, and fats and oils (see figures 20-21 and table 2.2 in annex 2). Substantial shares of the exports of fish and crustaceans (77.2 percent) and cereals (60.7 percent) are destined for developing countries. The bulk of the exports of fats and oils (42.9 percent) and other commodities is supplied to the CIS countries.
23 S. Kiselev, R. Romashkin – Possible Effects of Russia’s WTO Accession on Agricultural Trade and Production
Figure 21. Structure of Russia’s exports of main agricultural and food commodity groups to developed, developing and CIS countries in 2010 (%)
Source: Calculations based on RF Federal Customs Service data
2.2.2 Russia’s agricultural and food imports originating from developing countries
Meat, sugar, wine, rice, tea, coffee, fruit and tobacco are the main agricultural and food commodities imported from developing countries.
Import of meat
Over a long period up until 2000, meat production and livestock numbers in Russia were declining. This was due to several reasons, including the low profitability of meat production; a shortage of mixed feed, and rising feed prices; little budgetary support for meat production in a situation of social and economic crisis and budgetary deficit; low competitiveness of domestic meat production and large imports of meat and meat products; low real incomes and food consumption; an unfavorable economic situation in agriculture and a growing gap between prices for agricultural output and inputs.
After 2000, the annual growth rate of domestic meat production averaged 6.0 percent. Depreciation of the ruble, growth in consumer demand and an increase in grain production created competitive advantages for Russia’s meat producers. Moreover, industries producing mixed feed and processing meat began to grow. These factors, along with the increase in budgetary support and border protection, contributed to the recovery of domestic meat production.
Rather high rates of growth have been observed since 2006 after the beginning of the implementation of the National Priority Project on “Development of the Agro-Industrial Complex”. The measures implemented by federal authorities include the development of short-term and long-term credit, application of TRQ on meat imports, and cancellation of import duties on equipment for the livestock industry, which facilitates larger investments in building, reconstruction and modernization of livestock enterprises.
24ICTSD Programme on Agricultural Trade and Sustainable Development
Figure 22. Russia’s cattle and poultry production in slaughter weight (thousand tonnes)
Figure 23. Russia’s meat imports in 2000, 2005, 2009 and 2010 (thousand tonnes)
Source: RF Federal State Statistics Service data
Source: Calculations based on RF Federal Customs Service data
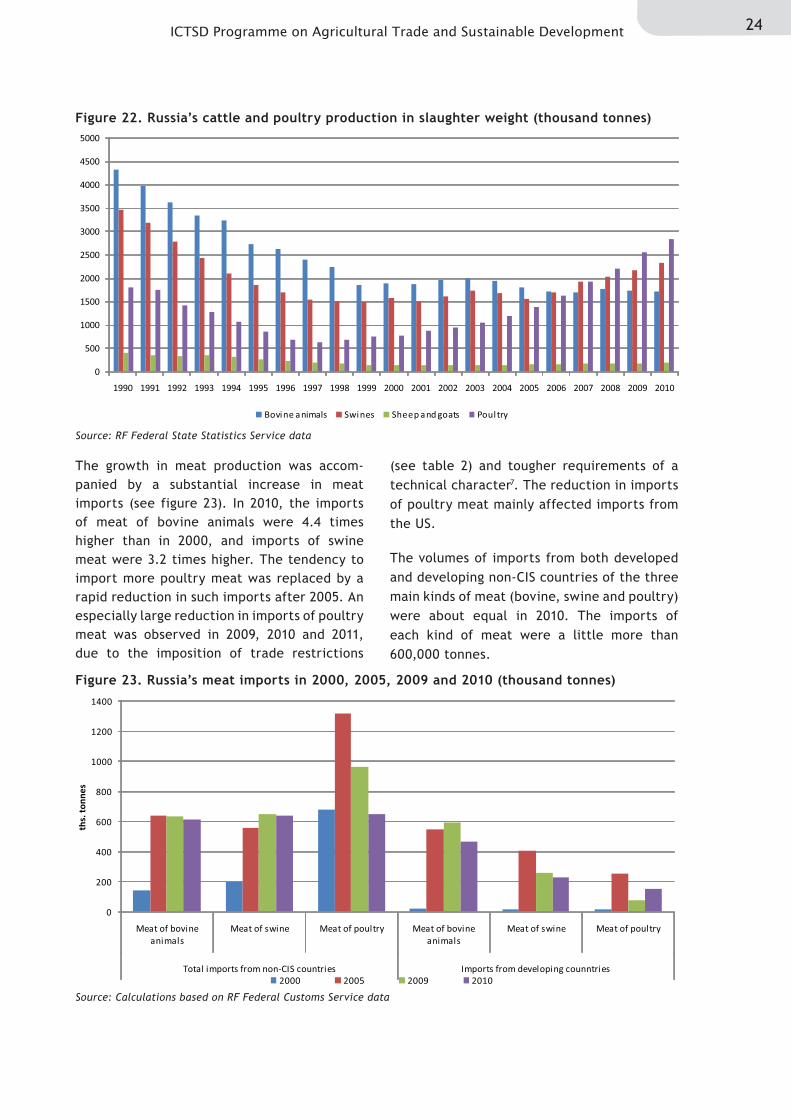
The growth in meat production was accom-panied by a substantial increase in meat imports (see figure 23). In 2010, the imports of meat of bovine animals were 4.4 times higher than in 2000, and imports of swine meat were 3.2 times higher. The tendency to import more poultry meat was replaced by a rapid reduction in such imports after 2005. An especially large reduction in imports of poultry meat was observed in 2009, 2010 and 2011, due to the imposition of trade restrictions
(see table 2) and tougher requirements of a technical character7. The reduction in imports of poultry meat mainly affected imports from the US.
The volumes of imports from both developed and developing non-CIS countries of the three main kinds of meat (bovine, swine and poultry) were about equal in 2010. The imports of each kind of meat were a little more than 600,000 tonnes.
0
500
1000
1500
2000
2500
3000
3500
4000
4500
5000
1990 1991 1992 1993 1994 1995 1996 1997 1998 1999 2000 2001 2002 2003 2004 2005 2006 2007 2008 2009 2010
Bovine animals Swines Sheep and goats Poultry
0
200
400
600
800
1000
1200
1400
Meat of bovine animals
Meat of swine Meat of poultry Meat of bovine animals
Meat of swine Meat of poultry
Total imports from non-CIS countries Imports from developing counntries
ths.
tonn
es
2000 2005 2009 2010
25 S. Kiselev, R. Romashkin – Possible Effects of Russia’s WTO Accession on Agricultural Trade and Production
Meat imports from developing countries are characterized by the same tendencies as meat imports overall. Developing countries have strengthened their positions in Russia’s market considerably. In 2010, the share of developing countries in Russia’s imports of meat of bovine animals, swine, and poultry from non-CIS countries increased to 76.0, 35.3 and 23.2 percent, respectively, from 15.8, 8.6, and 2.4 percent in 2000 (see annex 3, tables 3.1-3.6).
Brazil is the main supplier of meat from developing countries in Russia’s market. In 2010, the share of Brazil in Russia’s imports of meat of bovine animals, swine and poultry from developing countries amounted to 60.9, 99.3, and 94.6 percent, respectively. Uruguay,
Paraguay and Argentina are also large suppliers of meat of bovine animals.
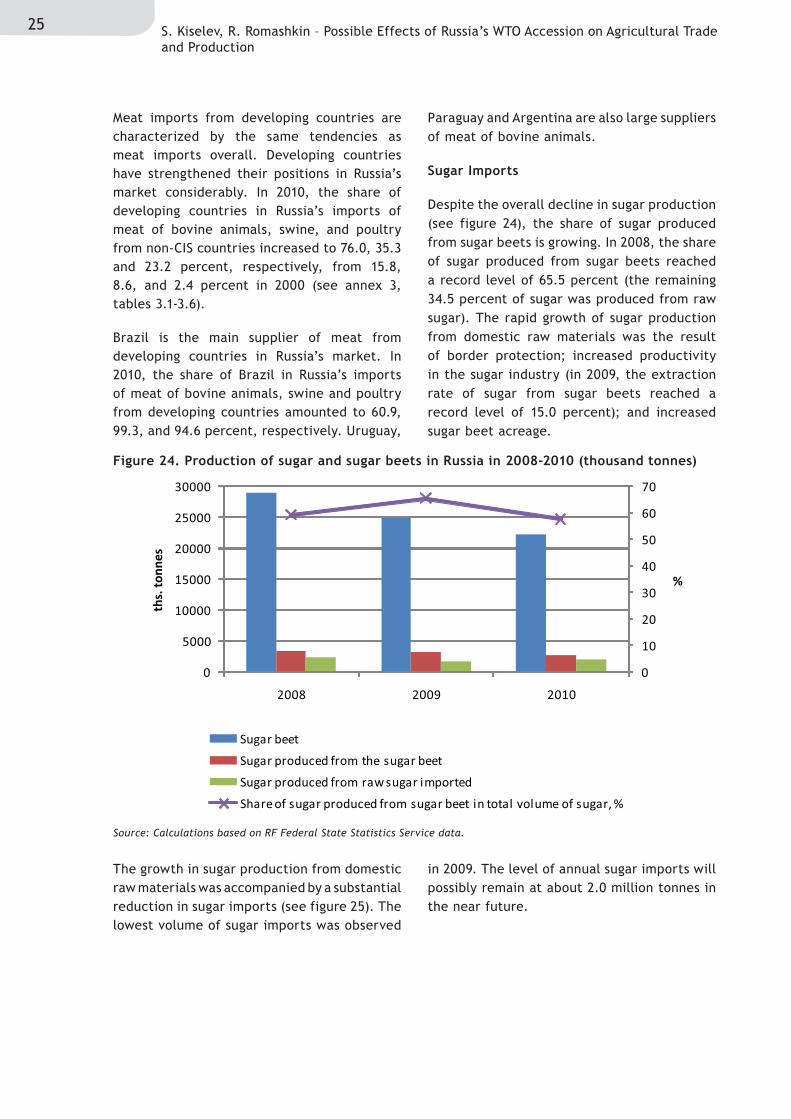
Sugar Imports
Despite the overall decline in sugar production (see figure 24), the share of sugar produced from sugar beets is growing. In 2008, the share of sugar produced from sugar beets reached a record level of 65.5 percent (the remaining 34.5 percent of sugar was produced from raw sugar). The rapid growth of sugar production from domestic raw materials was the result of border protection; increased productivity in the sugar industry (in 2009, the extraction rate of sugar from sugar beets reached a record level of 15.0 percent); and increased sugar beet acreage.
The growth in sugar production from domestic raw materials was accompanied by a substantial reduction in sugar imports (see figure 25). The lowest volume of sugar imports was observed
in 2009. The level of annual sugar imports will possibly remain at about 2.0 million tonnes in the near future.
Figure 24. Production of sugar and sugar beets in Russia in 2008-2010 (thousand tonnes)
Source: Calculations based on RF Federal State Statistics Service data.
0
10
20
30
40
50
60
70
0
5000
10000
15000
20000
25000
30000
2008 2009 2010
%
ths.
tonn
es
Sugar beet
Sugar produced from the sugar beet
Sugar produced from raw sugar imported
Share of sugar produced from sugar beet in total volume of sugar, %
26ICTSD Programme on Agricultural Trade and Sustainable Development
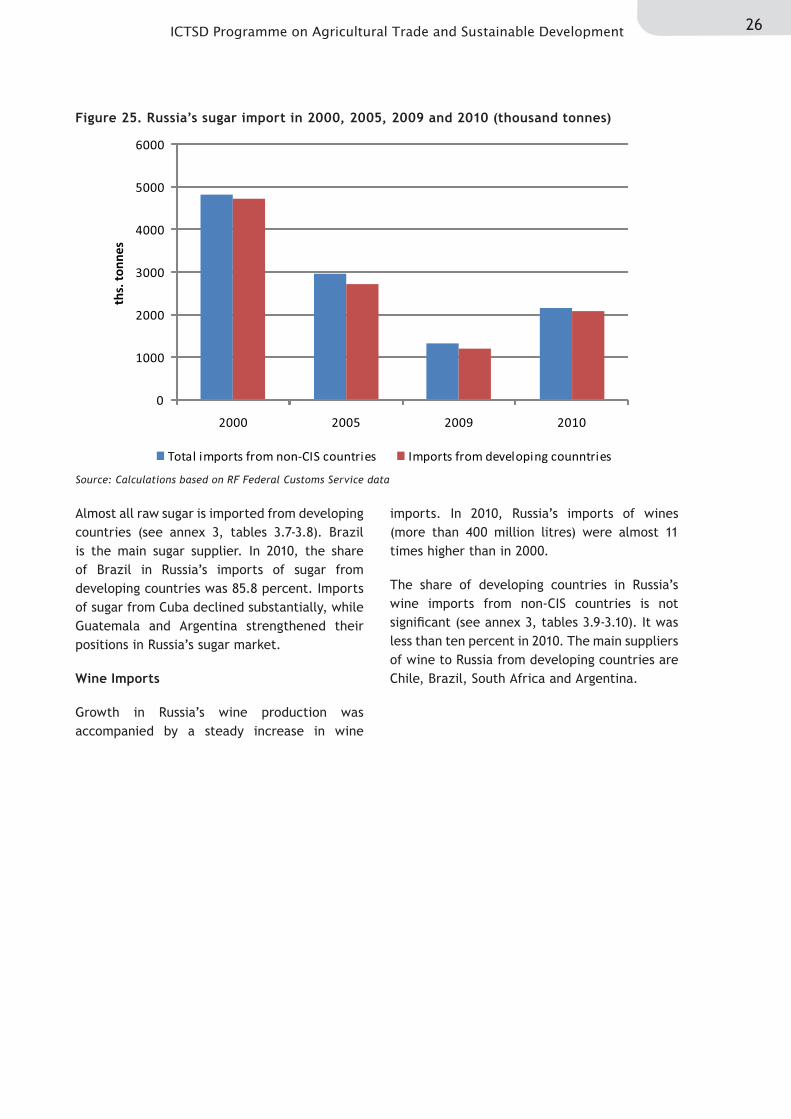
Almost all raw sugar is imported from developing countries (see annex 3, tables 3.7-3.8). Brazil is the main sugar supplier. In 2010, the share of Brazil in Russia’s imports of sugar from developing countries was 85.8 percent. Imports of sugar from Cuba declined substantially, while Guatemala and Argentina strengthened their positions in Russia’s sugar market.
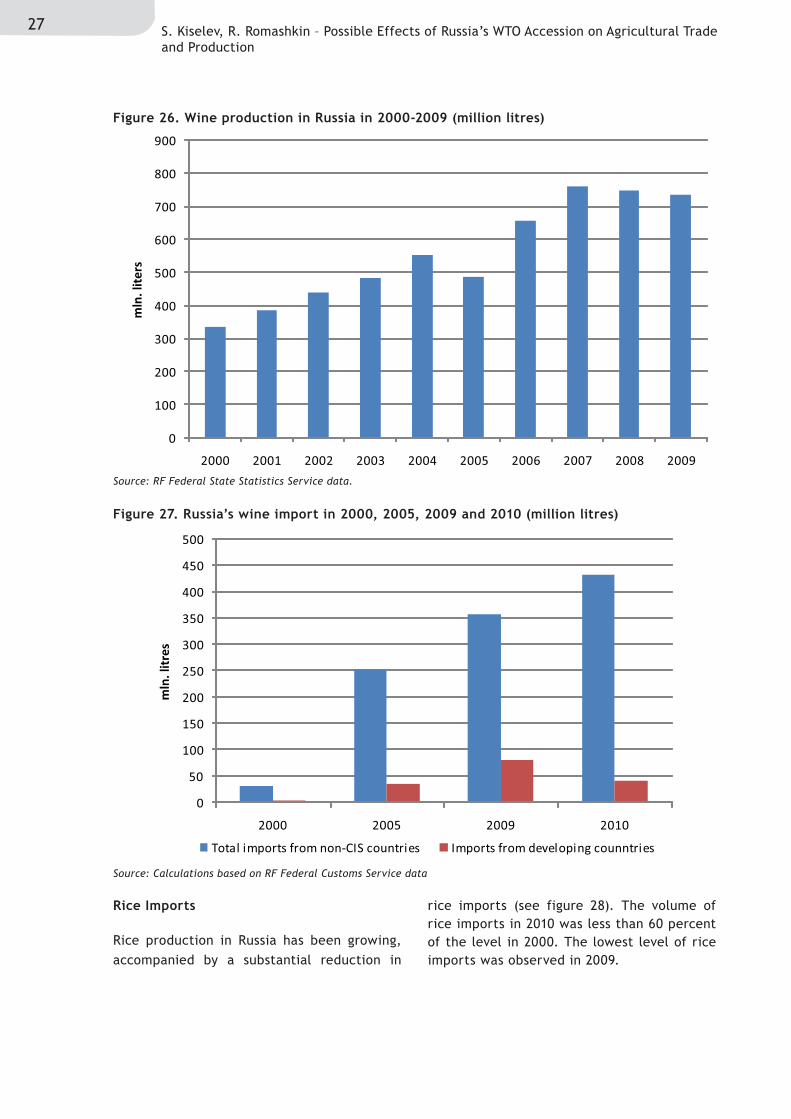
Wine Imports
Growth in Russia’s wine production was accompanied by a steady increase in wine
imports. In 2010, Russia’s imports of wines (more than 400 million litres) were almost 11 times higher than in 2000.
The share of developing countries in Russia’s wine imports from non-CIS countries is not significant (see annex 3, tables 3.9-3.10). It was less than ten percent in 2010. The main suppliers of wine to Russia from developing countries are Chile, Brazil, South Africa and Argentina.
Figure 25. Russia’s sugar import in 2000, 2005, 2009 and 2010 (thousand tonnes)
Source: Calculations based on RF Federal Customs Service data
0
1000
2000
3000
4000
5000
6000
2000 2005 2009 2010
ths.
ton
nes
Total imports from non-CIS countries Imports from developing counntries
27 S. Kiselev, R. Romashkin – Possible Effects of Russia’s WTO Accession on Agricultural Trade and Production
Figure 26. Wine production in Russia in 2000-2009 (million litres)
Figure 27. Russia’s wine import in 2000, 2005, 2009 and 2010 (million litres)
Source: RF Federal State Statistics Service data.
Source: Calculations based on RF Federal Customs Service data
Rice Imports
Rice production in Russia has been growing, accompanied by a substantial reduction in
rice imports (see figure 28). The volume of rice imports in 2010 was less than 60 percent of the level in 2000. The lowest level of rice imports was observed in 2009.
0
100
200
300
400
500
600
700
800
900
2000 2001 2002 2003 2004 2005 2006 2007 2008 2009
mln
. lit
ers
0
50
100
150
200
250
300
350
400
450
500
2000 2005 2009 2010
mln
. lit
res
Total imports from non-CIS countries Imports from developing counntries
28ICTSD Programme on Agricultural Trade and Sustainable Development
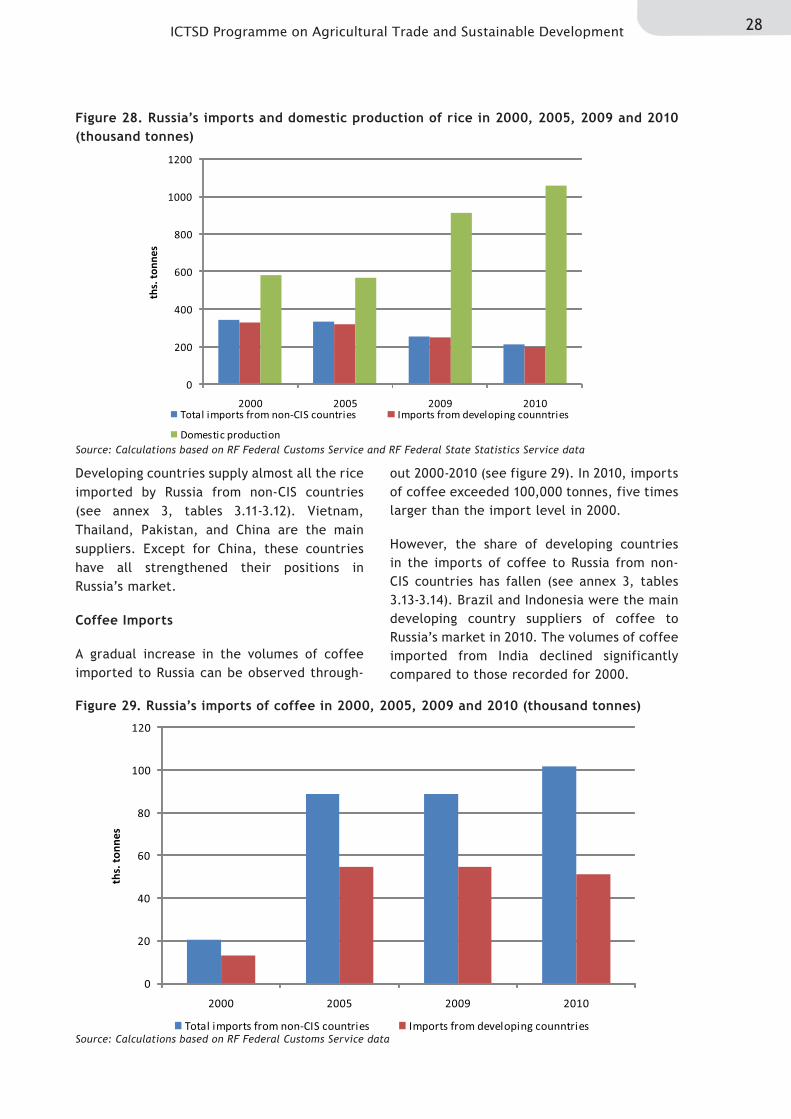
Figure 28. Russia’s imports and domestic production of rice in 2000, 2005, 2009 and 2010 (thousand tonnes)
Figure 29. Russia’s imports of coffee in 2000, 2005, 2009 and 2010 (thousand tonnes)
Source: Calculations based on RF Federal Customs Service and RF Federal State Statistics Service data
Source: Calculations based on RF Federal Customs Service data
Developing countries supply almost all the rice imported by Russia from non-CIS countries (see annex 3, tables 3.11-3.12). Vietnam, Thailand, Pakistan, and China are the main suppliers. Except for China, these countries have all strengthened their positions in Russia’s market.
Coffee Imports
A gradual increase in the volumes of coffee imported to Russia can be observed through-
out 2000-2010 (see figure 29). In 2010, imports of coffee exceeded 100,000 tonnes, five times larger than the import level in 2000.
However, the share of developing countries in the imports of coffee to Russia from non-CIS countries has fallen (see annex 3, tables 3.13-3.14). Brazil and Indonesia were the main developing country suppliers of coffee to Russia’s market in 2010. The volumes of coffee imported from India declined significantly compared to those recorded for 2000.
0
200
400
600
800
1000
1200
2000 2005 2009 2010
ths.
tonn
es
Total imports from non-CIS countries Imports from developing counntries
Domestic production
0
20
40
60
80
100
120
2000 2005 2009 2010
ths.
tonn
es
Total imports from non-CIS countries Imports from developing counntries
29 S. Kiselev, R. Romashkin – Possible Effects of Russia’s WTO Accession on Agricultural Trade and Production
Tea Imports
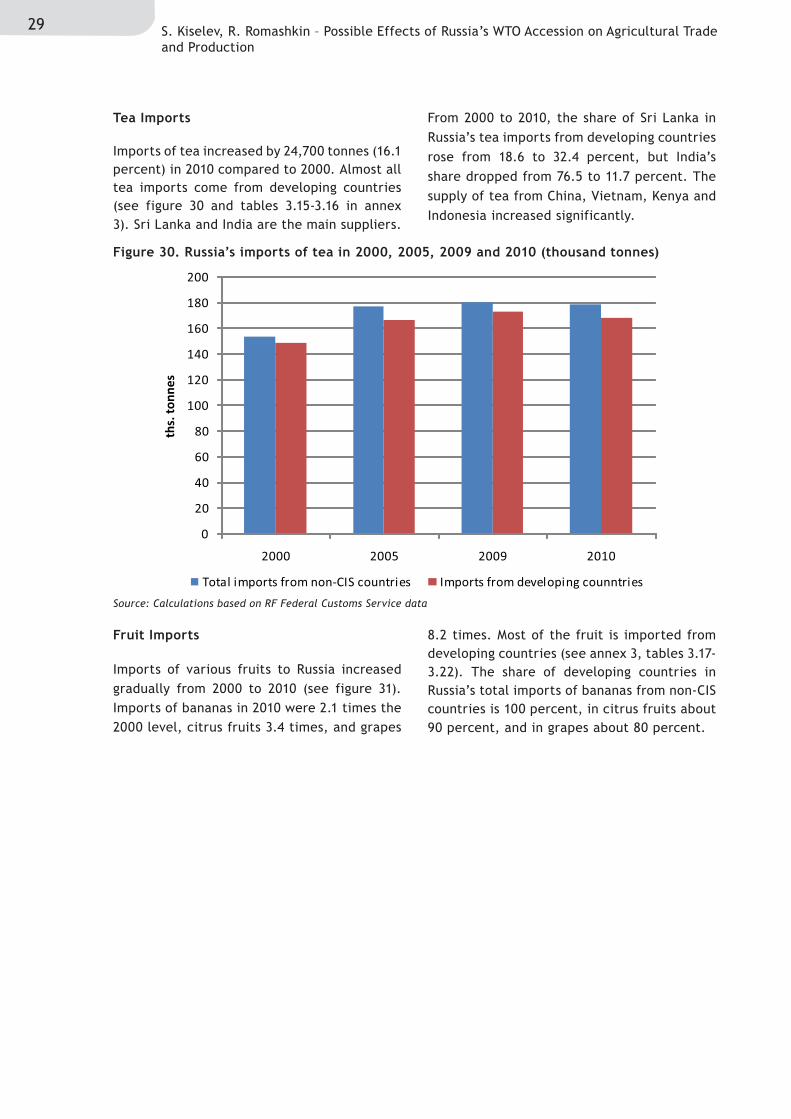
Imports of tea increased by 24,700 tonnes (16.1 percent) in 2010 compared to 2000. Almost all tea imports come from developing countries (see figure 30 and tables 3.15-3.16 in annex 3). Sri Lanka and India are the main suppliers.
From 2000 to 2010, the share of Sri Lanka in Russia’s tea imports from developing countries rose from 18.6 to 32.4 percent, but India’s share dropped from 76.5 to 11.7 percent. The supply of tea from China, Vietnam, Kenya and Indonesia increased significantly.
Fruit Imports
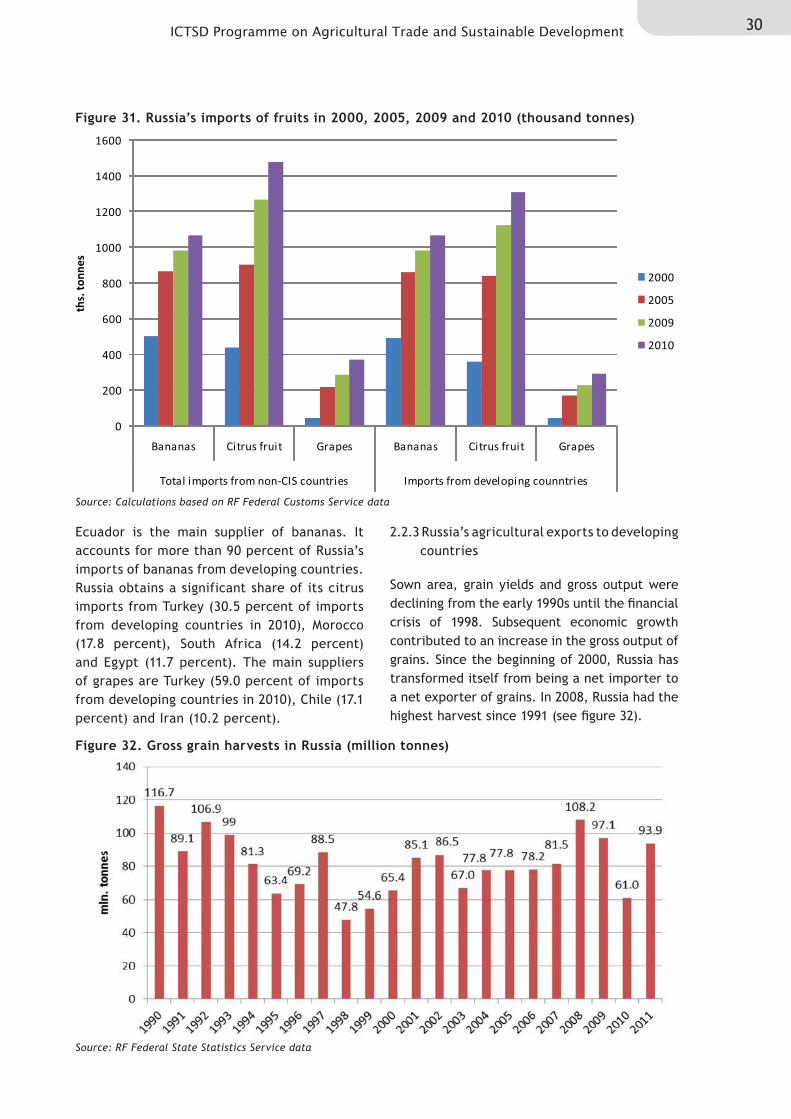
Imports of various fruits to Russia increased gradually from 2000 to 2010 (see figure 31). Imports of bananas in 2010 were 2.1 times the 2000 level, citrus fruits 3.4 times, and grapes
8.2 times. Most of the fruit is imported from developing countries (see annex 3, tables 3.17-3.22). The share of developing countries in Russia’s total imports of bananas from non-CIS countries is 100 percent, in citrus fruits about 90 percent, and in grapes about 80 percent.
Figure 30. Russia’s imports of tea in 2000, 2005, 2009 and 2010 (thousand tonnes)
Source: Calculations based on RF Federal Customs Service data
0
20
40
60
80
100
120
140
160
180
200
2000 2005 2009 2010
ths.
ton
nes
Total imports from non-CIS countries Imports from developing counntries
30ICTSD Programme on Agricultural Trade and Sustainable Development
Ecuador is the main supplier of bananas. It accounts for more than 90 percent of Russia’s imports of bananas from developing countries. Russia obtains a significant share of its citrus imports from Turkey (30.5 percent of imports from developing countries in 2010), Morocco (17.8 percent), South Africa (14.2 percent) and Egypt (11.7 percent). The main suppliers of grapes are Turkey (59.0 percent of imports from developing countries in 2010), Chile (17.1 percent) and Iran (10.2 percent).
2.2.3 Russia’s agricultural exports to developing countries
Sown area, grain yields and gross output were declining from the early 1990s until the financial crisis of 1998. Subsequent economic growth contributed to an increase in the gross output of grains. Since the beginning of 2000, Russia has transformed itself from being a net importer to a net exporter of grains. In 2008, Russia had the highest harvest since 1991 (see figure 32).
Figure 31. Russia’s imports of fruits in 2000, 2005, 2009 and 2010 (thousand tonnes)
Figure 32. Gross grain harvests in Russia (million tonnes)
Source: Calculations based on RF Federal Customs Service data
Source: RF Federal State Statistics Service data
0
200
400
600
800
1000
1200
1400
1600
Bananas Citrus fruit Grapes Bananas Citrus fruit Grapes
Total imports from non-CIS countries Imports from developing counntries
ths.
tonn
es
2000
2005
2009
2010
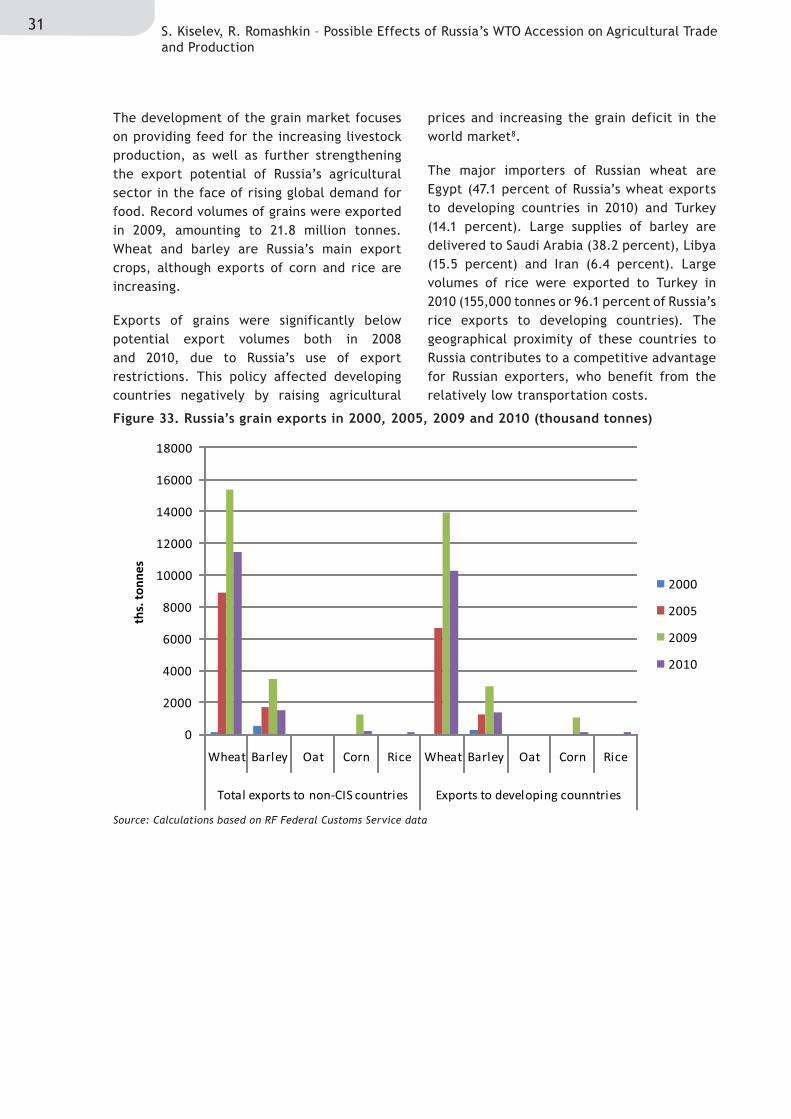
31 S. Kiselev, R. Romashkin – Possible Effects of Russia’s WTO Accession on Agricultural Trade and Production
The development of the grain market focuses on providing feed for the increasing livestock production, as well as further strengthening the export potential of Russia’s agricultural sector in the face of rising global demand for food. Record volumes of grains were exported in 2009, amounting to 21.8 million tonnes. Wheat and barley are Russia’s main export crops, although exports of corn and rice are increasing.
Exports of grains were significantly below potential export volumes both in 2008 and 2010, due to Russia’s use of export restrictions. This policy affected developing countries negatively by raising agricultural
prices and increasing the grain deficit in the world market8.
The major importers of Russian wheat are Egypt (47.1 percent of Russia’s wheat exports to developing countries in 2010) and Turkey (14.1 percent). Large supplies of barley are delivered to Saudi Arabia (38.2 percent), Libya (15.5 percent) and Iran (6.4 percent). Large volumes of rice were exported to Turkey in 2010 (155,000 tonnes or 96.1 percent of Russia’s rice exports to developing countries). The geographical proximity of these countries to Russia contributes to a competitive advantage for Russian exporters, who benefit from the relatively low transportation costs.
Figure 33. Russia’s grain exports in 2000, 2005, 2009 and 2010 (thousand tonnes)
Source: Calculations based on RF Federal Customs Service data
0
2000
4000
6000
8000
10000
12000
14000
16000
18000
Wheat Barley Oat Corn Rice Wheat Barley Oat Corn Rice
Total exports to non-CIS countries Exports to developing counntries
ths.
tonn
es
2000
2005
2009
2010
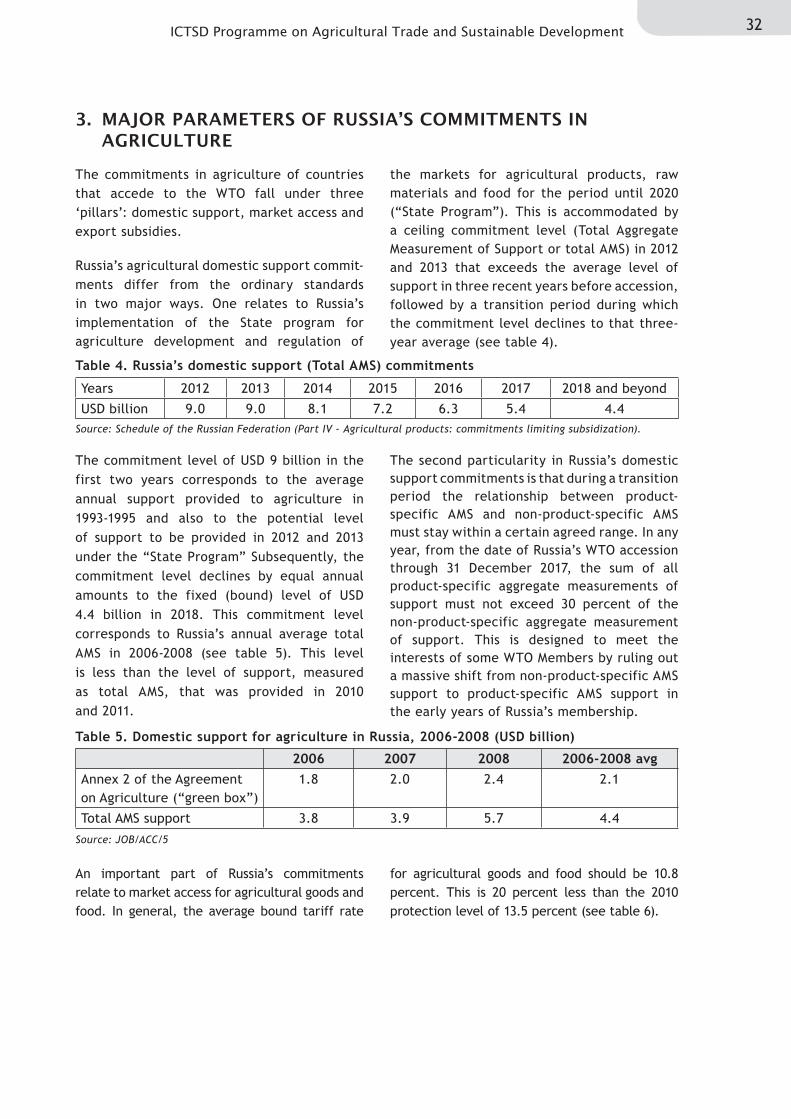
32ICTSD Programme on Agricultural Trade and Sustainable Development
Table 4. Russia’s domestic support (Total AMS) commitments
Table 5. Domestic support for agriculture in Russia, 2006-2008 (USD billion)
Source: Schedule of the Russian Federation (Part IV - Agricultural products: commitments limiting subsidization).
Source: JOB/ACC/5
3. MAJOR PARAMETERS OF RUSSIA’S COMMITMENTS IN AGRICULTURE
The commitments in agriculture of countries that accede to the WTO fall under three ‘pillars’: domestic support, market access and export subsidies.
Russia’s agricultural domestic support commit-ments differ from the ordinary standards in two major ways. One relates to Russia’s implementation of the State program for agriculture development and regulation of
the markets for agricultural products, raw materials and food for the period until 2020 (“State Program”). This is accommodated by a ceiling commitment level (Total Aggregate Measurement of Support or total AMS) in 2012 and 2013 that exceeds the average level of support in three recent years before accession, followed by a transition period during which the commitment level declines to that three-year average (see table 4).
An important part of Russia’s commitments relate to market access for agricultural goods and food. In general, the average bound tariff rate
for agricultural goods and food should be 10.8 percent. This is 20 percent less than the 2010 protection level of 13.5 percent (see table 6).
The commitment level of USD 9 billion in the first two years corresponds to the average annual support provided to agriculture in 1993-1995 and also to the potential level of support to be provided in 2012 and 2013 under the “State Program” Subsequently, the commitment level declines by equal annual amounts to the fixed (bound) level of USD 4.4 billion in 2018. This commitment level corresponds to Russia’s annual average total AMS in 2006-2008 (see table 5). This level is less than the level of support, measured as total AMS, that was provided in 2010 and 2011.
The second particularity in Russia’s domestic support commitments is that during a transition period the relationship between product-specific AMS and non-product-specific AMS must stay within a certain agreed range. In any year, from the date of Russia’s WTO accession through 31 December 2017, the sum of all product-specific aggregate measurements of support must not exceed 30 percent of the non-product-specific aggregate measurement of support. This is designed to meet the interests of some WTO Members by ruling out a massive shift from non-product-specific AMS support to product-specific AMS support in the early years of Russia’s membership.
Years 2012 2013 2014 2015 2016 2017 2018 and beyond
USD billion 9.0 9.0 8.1 7.2 6.3 5.4 4.4
2006 2007 2008 2006-2008 avgAnnex 2 of the Agreement on Agriculture (“green box”)
1.8 2.0 2.4 2.1
Total AMS support 3.8 3.9 5.7 4.4
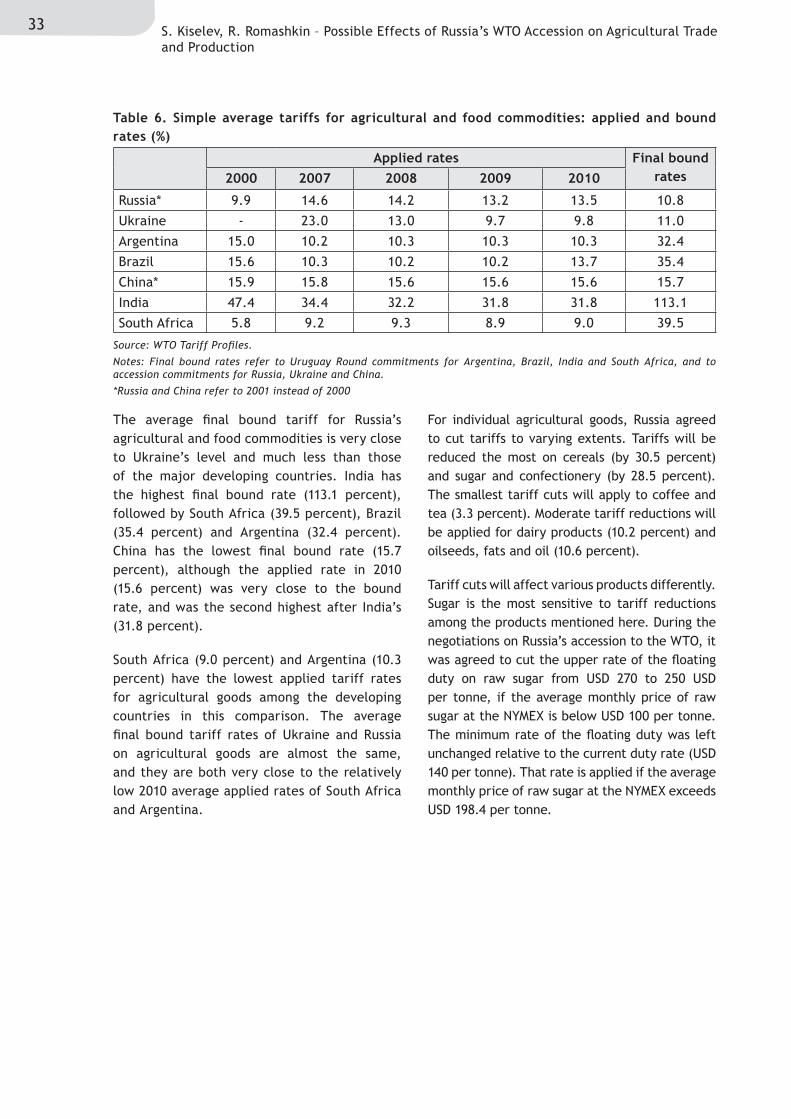
33 S. Kiselev, R. Romashkin – Possible Effects of Russia’s WTO Accession on Agricultural Trade and Production
Table 6. Simple average tariffs for agricultural and food commodities: applied and bound rates (%)
Source: WTO Tariff Profiles.
Notes: Final bound rates refer to Uruguay Round commitments for Argentina, Brazil, India and South Africa, and to accession commitments for Russia, Ukraine and China.
*Russia and China refer to 2001 instead of 2000
Applied rates Final bound rates2000 2007 2008 2009 2010
Russia* 9.9 14.6 14.2 13.2 13.5 10.8
Ukraine - 23.0 13.0 9.7 9.8 11.0
Argentina 15.0 10.2 10.3 10.3 10.3 32.4
Brazil 15.6 10.3 10.2 10.2 13.7 35.4
China* 15.9 15.8 15.6 15.6 15.6 15.7
India 47.4 34.4 32.2 31.8 31.8 113.1
South Africa 5.8 9.2 9.3 8.9 9.0 39.5
The average final bound tariff for Russia’s agricultural and food commodities is very close to Ukraine’s level and much less than those of the major developing countries. India has the highest final bound rate (113.1 percent), followed by South Africa (39.5 percent), Brazil (35.4 percent) and Argentina (32.4 percent). China has the lowest final bound rate (15.7 percent), although the applied rate in 2010 (15.6 percent) was very close to the bound rate, and was the second highest after India’s (31.8 percent).
South Africa (9.0 percent) and Argentina (10.3 percent) have the lowest applied tariff rates for agricultural goods among the developing countries in this comparison. The average final bound tariff rates of Ukraine and Russia on agricultural goods are almost the same, and they are both very close to the relatively low 2010 average applied rates of South Africa and Argentina.
For individual agricultural goods, Russia agreed to cut tariffs to varying extents. Tariffs will be reduced the most on cereals (by 30.5 percent) and sugar and confectionery (by 28.5 percent). The smallest tariff cuts will apply to coffee and tea (3.3 percent). Moderate tariff reductions will be applied for dairy products (10.2 percent) and oilseeds, fats and oil (10.6 percent).
Tariff cuts will affect various products differently. Sugar is the most sensitive to tariff reductions among the products mentioned here. During the negotiations on Russia’s accession to the WTO, it was agreed to cut the upper rate of the floating duty on raw sugar from USD 270 to 250 USD per tonne, if the average monthly price of raw sugar at the NYMEX is below USD 100 per tonne. The minimum rate of the floating duty was left unchanged relative to the current duty rate (USD 140 per tonne). That rate is applied if the average monthly price of raw sugar at the NYMEX exceeds USD 198.4 per tonne.
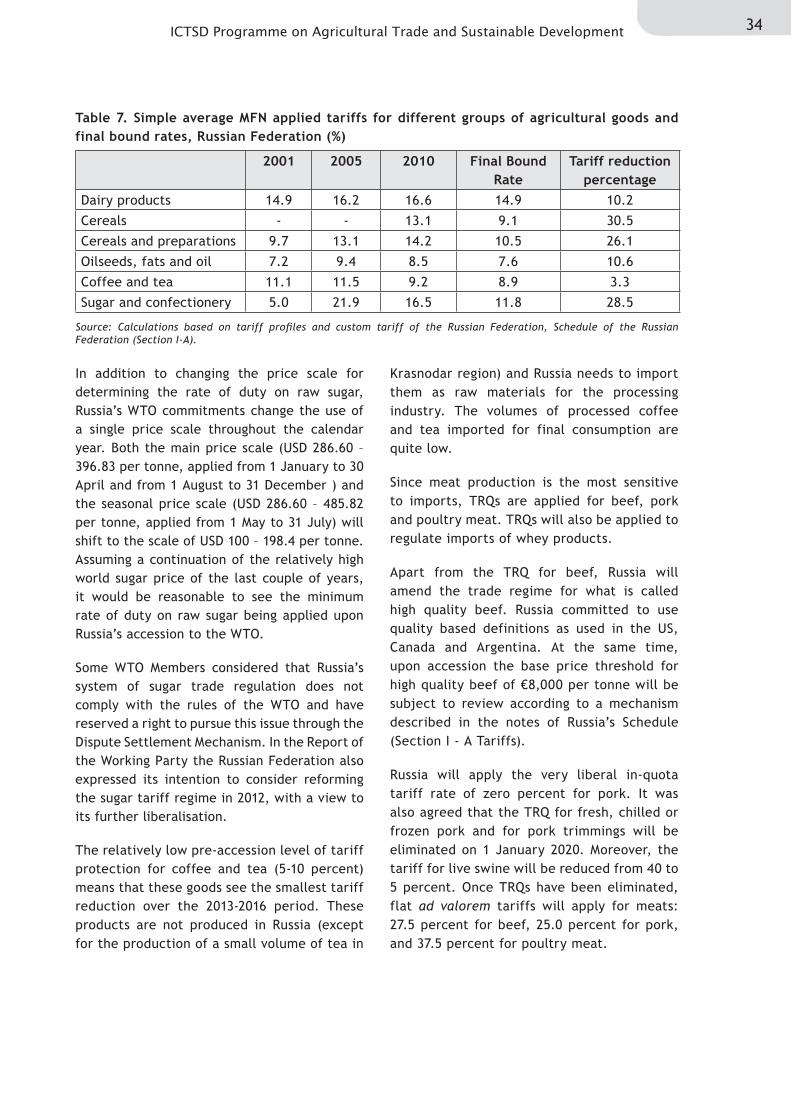
34ICTSD Programme on Agricultural Trade and Sustainable Development
Table 7. Simple average MFN applied tariffs for different groups of agricultural goods and final bound rates, Russian Federation (%)
Source: Calculations based on tariff profiles and custom tariff of the Russian Federation, Schedule of the Russian Federation (Section I-A).
In addition to changing the price scale for determining the rate of duty on raw sugar, Russia’s WTO commitments change the use of a single price scale throughout the calendar year. Both the main price scale (USD 286.60 – 396.83 per tonne, applied from 1 January to 30 April and from 1 August to 31 December ) and the seasonal price scale (USD 286.60 – 485.82 per tonne, applied from 1 May to 31 July) will shift to the scale of USD 100 – 198.4 per tonne. Assuming a continuation of the relatively high world sugar price of the last couple of years, it would be reasonable to see the minimum rate of duty on raw sugar being applied upon Russia’s accession to the WTO.
Some WTO Members considered that Russia’s system of sugar trade regulation does not comply with the rules of the WTO and have reserved a right to pursue this issue through the Dispute Settlement Mechanism. In the Report of the Working Party the Russian Federation also expressed its intention to consider reforming the sugar tariff regime in 2012, with a view to its further liberalisation.
The relatively low pre-accession level of tariff protection for coffee and tea (5-10 percent) means that these goods see the smallest tariff reduction over the 2013-2016 period. These products are not produced in Russia (except for the production of a small volume of tea in
Krasnodar region) and Russia needs to import them as raw materials for the processing industry. The volumes of processed coffee and tea imported for final consumption are quite low.
Since meat production is the most sensitive to imports, TRQs are applied for beef, pork and poultry meat. TRQs will also be applied to regulate imports of whey products.
Apart from the TRQ for beef, Russia will amend the trade regime for what is called high quality beef. Russia committed to use quality based definitions as used in the US, Canada and Argentina. At the same time, upon accession the base price threshold for high quality beef of €8,000 per tonne will be subject to review according to a mechanism described in the notes of Russia’s Schedule (Section I - A Tariffs).
Russia will apply the very liberal in-quota tariff rate of zero percent for pork. It was also agreed that the TRQ for fresh, chilled or frozen pork and for pork trimmings will be eliminated on 1 January 2020. Moreover, the tariff for live swine will be reduced from 40 to 5 percent. Once TRQs have been eliminated, flat ad valorem tariffs will apply for meats: 27.5 percent for beef, 25.0 percent for pork, and 37.5 percent for poultry meat.
2001 2005 2010 Final Bound Rate
Tariff reduction percentage
Dairy products 14.9 16.2 16.6 14.9 10.2
Cereals - - 13.1 9.1 30.5
Cereals and preparations 9.7 13.1 14.2 10.5 26.1
Oilseeds, fats and oil 7.2 9.4 8.5 7.6 10.6
Coffee and tea 11.1 11.5 9.2 8.9 3.3
Sugar and confectionery 5.0 21.9 16.5 11.8 28.5
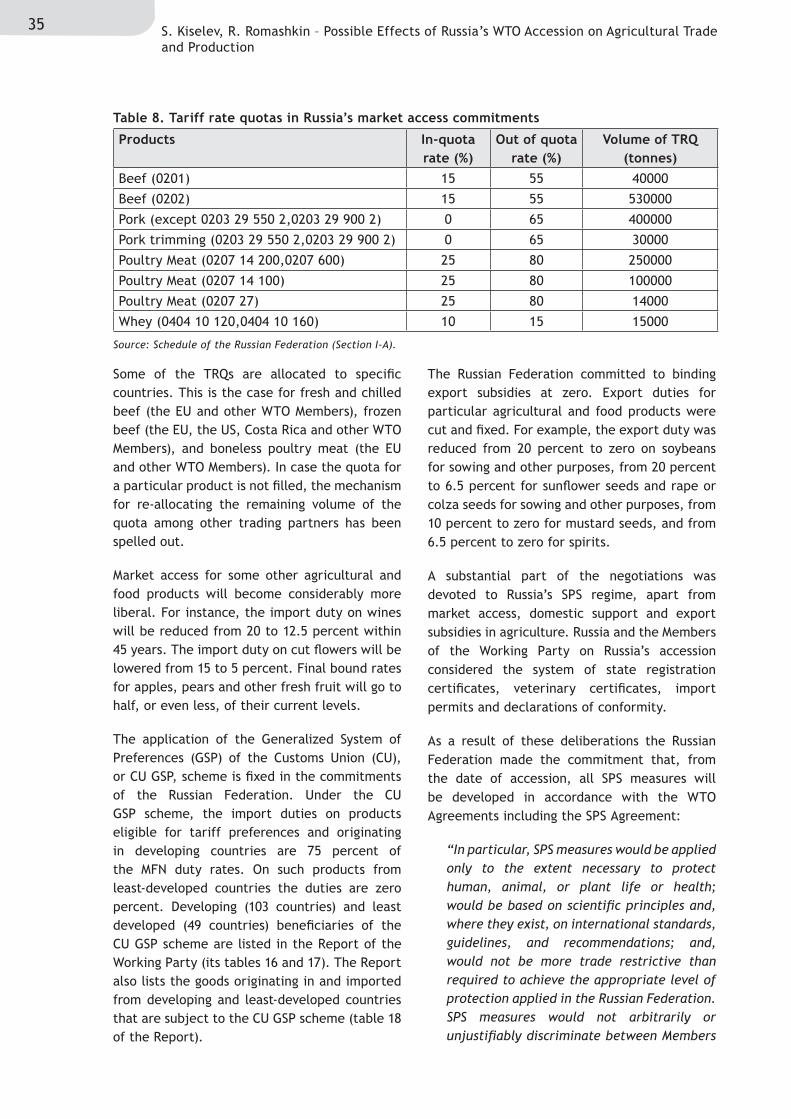
35 S. Kiselev, R. Romashkin – Possible Effects of Russia’s WTO Accession on Agricultural Trade and Production
Some of the TRQs are allocated to specific countries. This is the case for fresh and chilled beef (the EU and other WTO Members), frozen beef (the EU, the US, Costa Rica and other WTO Members), and boneless poultry meat (the EU and other WTO Members). In case the quota for a particular product is not filled, the mechanism for re-allocating the remaining volume of the quota among other trading partners has been spelled out.
Market access for some other agricultural and food products will become considerably more liberal. For instance, the import duty on wines will be reduced from 20 to 12.5 percent within 45 years. The import duty on cut flowers will be lowered from 15 to 5 percent. Final bound rates for apples, pears and other fresh fruit will go to half, or even less, of their current levels.
The application of the Generalized System of Preferences (GSP) of the Customs Union (CU), or CU GSP, scheme is fixed in the commitments of the Russian Federation. Under the CU GSP scheme, the import duties on products eligible for tariff preferences and originating in developing countries are 75 percent of the MFN duty rates. On such products from least-developed countries the duties are zero percent. Developing (103 countries) and least developed (49 countries) beneficiaries of the CU GSP scheme are listed in the Report of the Working Party (its tables 16 and 17). The Report also lists the goods originating in and imported from developing and least-developed countries that are subject to the CU GSP scheme (table 18 of the Report).
The Russian Federation committed to binding export subsidies at zero. Export duties for particular agricultural and food products were cut and fixed. For example, the export duty was reduced from 20 percent to zero on soybeans for sowing and other purposes, from 20 percent to 6.5 percent for sunflower seeds and rape or colza seeds for sowing and other purposes, from 10 percent to zero for mustard seeds, and from 6.5 percent to zero for spirits.
A substantial part of the negotiations was devoted to Russia’s SPS regime, apart from market access, domestic support and export subsidies in agriculture. Russia and the Members of the Working Party on Russia’s accession considered the system of state registration certificates, veterinary certificates, import permits and declarations of conformity.
As a result of these deliberations the Russian Federation made the commitment that, from the date of accession, all SPS measures will be developed in accordance with the WTO Agreements including the SPS Agreement:
“In particular, SPS measures would be applied only to the extent necessary to protect human, animal, or plant life or health; would be based on scientific principles and, where they exist, on international standards, guidelines, and recommendations; and, would not be more trade restrictive than required to achieve the appropriate level of protection applied in the Russian Federation. SPS measures would not arbitrarily or unjustifiably discriminate between Members
Table 8. Tariff rate quotas in Russia’s market access commitments
Source: Schedule of the Russian Federation (Section I-A).
Products In-quota rate (%)
Out of quota rate (%)
Volume of TRQ (tonnes)
Beef (0201) 15 55 40000
Beef (0202) 15 55 530000
Pork (except 0203 29 550 2,0203 29 900 2) 0 65 400000
Pork trimming (0203 29 550 2,0203 29 900 2) 0 65 30000
Poultry Meat (0207 14 200,0207 600) 25 80 250000
Poultry Meat (0207 14 100) 25 80 100000
Poultry Meat (0207 27) 25 80 14000
Whey (0404 10 120,0404 10 160) 10 15 15000
36ICTSD Programme on Agricultural Trade and Sustainable Development
where identical or similar conditions prevail, including between the territory of the Russian Federation and that of other Members. SPS measures would not be applied in a manner which would constitute a disguised restriction on international trade, and would not be
maintained without sufficient scientific evidence, except as provided for in Article 5.7 of the WTO SPS Agreement9”.
These commitments will facilitate exporters’ access to Russia’s market.
37 S. Kiselev, R. Romashkin – Possible Effects of Russia’s WTO Accession on Agricultural Trade and Production
4. INFLUENCE OF RUSSIA’S ACCESSION TO THE WTO ON BELARUS, KAZAKHSTAN, AND DEVELOPING COUNTRIES
Russia’s accession to the WTO and fulfillment of multilateral commitments in domestic support, market access, sanitary and phytosanitary measures, and technical regulation will stimulate increased transparency in foreign trade regulation, improve the access of imports to Russia’s market, and restrict Russia’s possibilities for supporting its agricultural producers and imposing unjustified measures that impede trade. The countries that export agricultural and food commodities to Russia will see the following benefits:
- reduction of Russia’s custom duties;
- trade facilitation
- predictability of Russia’s regulation of foreign trade;
- unification and transparency of Russia’s non-tariff measures of trade regulation.
Against the background of consumer demand growth, these benefits will lead to an increase in Russia’s agricultural and food imports. It is quite probable that, in response to consumer demand, the increase in imports of agricultural and food commodities will exceed the increase in domestic production. This might be the case for animal products in particular.
The average level of customs tariff protection of agricultural and food commodities in Russia was not high before WTO accession (see table 6). Therefore the improved access to Russia’s market will not lead to large benefits for exporting countries. Nevertheless, for several commodity groups the concessions made by
Russia will substantially improve trade for developing countries. The improved market access applies to commodities that Russia imports in large quantities (see table 9): raw sugar, meat of bovine animals and swine, fruits, tea, coffee and other products. Moreover, many agricultural and food commodities are recorded in the Report of the Working Party on Russia’s accession to the WTO as falling within the CU GSP. This applies to meat and edible meat offal; dairy products; live trees and other plants; bulbs, roots and the like; cut flowers and ornamental foliage; edible fruit and nuts; peel of citrus fruit or melons; coffee; tea; mate and spices; and rice and others. The consequence is that the import duties on such products originating in developing countries are 25 percent less than the MFN duty applied to imports originating in developed countries.
Among the developing countries, Brazil is the main supplier of pork and raw sugar to Russia. If Brazil maintains its competitiveness relative to other suppliers, its exports of these goods would benefit in the intermediate term from improved access to Russia’s market.
Brazil, Uruguay, Paraguay and Argentina are the main beef exporters to Russia. With a limit on trade-distorting support, and without the ability to raise customs duties above bound levels, Russia will depend on beef imports for a long period to come. Accession to the WTO will therefore not allow Russia to implement its policy of substituting relatively low cost beef imports with domestic beef production. This will have a positive influence on beef exporters and on Russia’s consumers.
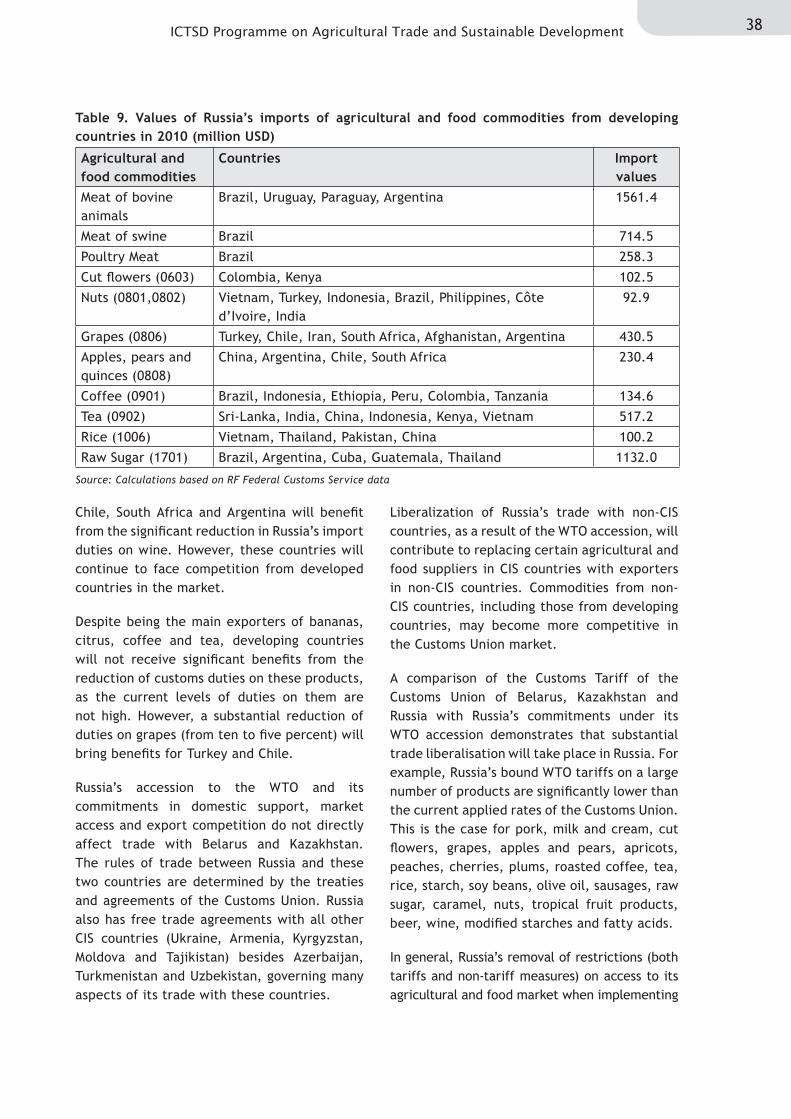
38ICTSD Programme on Agricultural Trade and Sustainable Development
Chile, South Africa and Argentina will benefit from the significant reduction in Russia’s import duties on wine. However, these countries will continue to face competition from developed countries in the market.
Despite being the main exporters of bananas, citrus, coffee and tea, developing countries will not receive significant benefits from the reduction of customs duties on these products, as the current levels of duties on them are not high. However, a substantial reduction of duties on grapes (from ten to five percent) will bring benefits for Turkey and Chile.
Russia’s accession to the WTO and its commitments in domestic support, market access and export competition do not directly affect trade with Belarus and Kazakhstan. The rules of trade between Russia and these two countries are determined by the treaties and agreements of the Customs Union. Russia also has free trade agreements with all other CIS countries (Ukraine, Armenia, Kyrgyzstan, Moldova and Tajikistan) besides Azerbaijan, Turkmenistan and Uzbekistan, governing many aspects of its trade with these countries.
Liberalization of Russia’s trade with non-CIS countries, as a result of the WTO accession, will contribute to replacing certain agricultural and food suppliers in CIS countries with exporters in non-CIS countries. Commodities from non-CIS countries, including those from developing countries, may become more competitive in the Customs Union market.
А comparison of the Customs Tariff of the Customs Union of Belarus, Kazakhstan and Russia with Russia’s commitments under its WTO accession demonstrates that substantial trade liberalisation will take place in Russia. For example, Russia’s bound WTO tariffs on a large number of products are significantly lower than the current applied rates of the Customs Union. This is the case for pork, milk and cream, cut flowers, grapes, apples and pears, apricots, peaches, cherries, plums, roasted coffee, tea, rice, starch, soy beans, olive oil, sausages, raw sugar, caramel, nuts, tropical fruit products, beer, wine, modified starches and fatty acids.
In general, Russia’s removal of restrictions (both tariffs and non-tariff measures) on access to its agricultural and food market when implementing
Table 9. Values of Russia’s imports of agricultural and food commodities from developing countries in 2010 (million USD)
Source: Calculations based on RF Federal Customs Service data
Agricultural and food commodities
Countries Import values
Meat of bovine animals
Brazil, Uruguay, Paraguay, Argentina 1561.4
Meat of swine Brazil 714.5
Poultry Meat Brazil 258.3
Cut flowers (0603) Colombia, Kenya 102.5
Nuts (0801,0802) Vietnam, Turkey, Indonesia, Brazil, Philippines, Côte d’Ivoire, India
92.9
Grapes (0806) Turkey, Chile, Iran, South Africa, Afghanistan, Argentina 430.5
Apples, pears and quinces (0808)
China, Argentina, Chile, South Africa 230.4
Coffee (0901) Brazil, Indonesia, Ethiopia, Peru, Colombia, Tanzania 134.6
Tea (0902) Sri-Lanka, India, China, Indonesia, Kenya, Vietnam 517.2
Rice (1006) Vietnam, Thailand, Pakistan, China 100.2
Raw Sugar (1701) Brazil, Argentina, Cuba, Guatemala, Thailand 1132.0
39 S. Kiselev, R. Romashkin – Possible Effects of Russia’s WTO Accession on Agricultural Trade and Production
its WTO commitments will inevitably lead to the reduction of the customs duties of the Customs Union. As a result, non-CIS countries (including developing countries) will see improvements not only in access to Russia’s market but also in access to the Belarus and Kazakhstan markets.
Furthermore, in terms of export duties the difference between Russia’s commitments in the WTO and the Customs Tariff of the Customs Union implies a need to bring them in line with each other when completing the formal accession process or shortly thereafter. In addition, given that Kazakhstan is a Member of the Customs Union and is at an advanced stage of the WTO accession, it must unify its commitments with those of Russia. This applies to approximately 30 percent of Kazakhstan’s customs duties.
Developing countries can also foresee benefits from Belarus and Kazakhstan acceding to the WTO, if the commitments of Belarus and Kazakhstan, as Members, would be extended to the Customs Union of Belarus, Kazakhstan and Russia. As a result, in negotiating the accessions of Belarus and Kazakhstan to the WTO, developing countries can improve their access to Russia’s market. That is an opportunity for developing countries to receive further benefits in Russia’s agricultural and food market. However, it would be more logical if Russia’s market access commitments would serve as the basis for the commitments that Kazakhstan and Belarus make as part of their own WTO accession negotiations.
Russia’s accession to the WTO also affects agriculture in Belarus and Kazakhstan because of the bound limit on non-exempt domestic support for agriculture. Reducing Russia’s trade-distorting domestic support and restricting its use will increase the competitiveness of imports of agricultural and food products both from CIS and non-CIS countries. However, many of the CIS countries are already members of the WTO, and their non-exempt domestic support for agriculture is restricted.
In acceding to the WTO Russia committed to applying any quantitative export restrictions in accordance with Article XI of the GATT 1994 and Article 12 of the WTO Agreement on Agriculture. This means that export prohibitions or restrictions can be temporarily applied only to prevent or relieve critical shortages of foodstuffs in Russia’s domestic market. Russia must also beforehand notify the WTO Committee on Agriculture of the nature and duration of the measures taken and consider the interests of other members of the WTO. These commitments will help developing countries react more effectively to possible prohibitions or restrictions on Russia’s grain exports.
Thus, Russia’s membership in the WTO will provide significant trade benefits for developing countries. In the case of violation of Russia’s obligations, they can use the WTO dispute settlement system to seek redress, an avenue that was not open before Russia acceded to the WTO.
40ICTSD Programme on Agricultural Trade and Sustainable Development
ENDNOTES
1 The National Priority Project on “Development of the Agro-Industrial Complex” encompasses overall three major directions: the ‘Accelerated development of cattle-breeding’, the ‘Encouragement of the development of smaller institutional forms of economic operations in the agricultural production sector’, and the ‘Provision with decent housing for young specialists (or, for their families) in the rural areas’.
2 The State program for agriculture development and regulation of the markets of agricultural products, raw materials and food for the period 2008-2012 was developed in conformity with the Federal Law “On Agriculture Development”. The Program defines the objectives, goals and the basic directions for development of agriculture and regulation of agricultural and food markets, necessary funding, measures for implementation and indicators of their outcomes.
3 Here and below to calculate amounts in USD the following annual average exchange rates have been used: for 2000 – 28.13 Rub/USD, 2001 – 29.17 Rub/USD, 2002 – 31.35 Rub/USD, 2003 – 30.68 Rub/USD, 2004 – 28.81 Rub/USD, 2005 – 28.28 Rub/USD, 2006 – 27.19 Rub/USD, 2007 – 25.58 Rub/USD, 2008 – 24.81 Rub/USD, 2009 – 31.68 Rub/USD, 2010 – 30.36 Rub/USD. These rates were provided by the Bank of Russia.
4 The following programs of support are co-financed by the federal and regional budgets: support for livestock breeding, sheep, reindeer, horse breeding, improved seed production, seed delivery in northern and mountainous areas of the country, the production of flax and hemp, care for perennial plants, the compensation of the cost of acquisition of application of chemicals and crop insurance, reimbursement of the cost of interest on loans obtained in the Russian credit institutions and loans received in agricultural credit consumer cooperatives, the compensation of damage to agricultural producers due to abnormal meteorological conditions, subsidies on diesel fuel.
5 Here and below the value of production results from the volumes of agricultural production multiplied by the corresponding producer prices.
6 Forecast balances for the deliveries of food products between Russia and Belarus are made regularly since 1997. Since 2008, they have been formed for five year periods for milk, meat and sugar.
7 From 1 January 2010, the decision of RF Federal service on customers’ rights protection and human well-being surveillance (Rospotrebnadzor) prohibited the use of solutions containing chlorine above the requirements set for drinking water (0.3-0.5 mg/l) in poultry processing. As a result of this decision, poultry imports from the US stopped completely until September 2010.
Furthermore, Rospotrebnadzor has prohibited the use of frozen poultry meat for the production of baby food, food for pregnant women and dietary products since 1 January 2010. Also since 1 January 2011, in the Russian Federation the use of frozen poultry meat is forbidden for the production of cooled natural semi-finished poultry products and foodstuff containing poultry meat without thermal processing of such products.
8 Mitra, S. and Josling, T. (2009) “Agricultural Export Restrictions: Welfare Implications and Trade Disciplines”. International Food and Agricultural Trade Policy Council. Agricultural and Rural Development Policy Series. IPC position paper, January 2009.
41 S. Kiselev, R. Romashkin – Possible Effects of Russia’s WTO Accession on Agricultural Trade and Production
Sharma, R. (2011) “Food Export Restrictions: Review of the 2007-2010 Experience and Considerations for Disciplining Restrictive Measures”. FAO Commodity and Trade Policy Research Working Paper No. 32. May 2011. http://ictsd.org/downloads/2011/05/sharma-export-restrictions.pdf
9 Report of the Working Party on the accession of the Russian Federation to the World Trade Organisation, WT/ACC/RUS/70, WT/MIN(11)/2, p.273
42ICTSD Programme on Agricultural Trade and Sustainable Development
REFERENCES
Customs Statistics of the Russian Federation Foreign Trade, 2000. The RF State Customs Committee. Moscow, 2001.
Customs Statistics of the Russian Federation Foreign Trade, 2005. The RF Federal Customs Service. Moscow, 2006.
Customs Statistics of the Russian Federation Foreign Trade, 2009. The RF Federal Customs Service. Moscow, 2010.
Customs Statistics of the Russian Federation Foreign Trade, 2010. The RF Federal Customs Service. Moscow, 2011.
Foreign Agricultural Service (FAS), U.S. Dept. of Agriculture. FAS Production, Supply and Distribution Online. Available online: http://www.fas.usda.gov/psdonline.
The Russian Statistical Year-Book, 2005. The RF Federal State Statistics Service. Moscow, 2006.
The Russian Statistical Year-Book, 2008. The RF Federal State Statistics Service. Moscow, 2009.
The Russian Statistical Year-Book, 2010. The RF Federal State Statistics Service. Moscow, 2011.
Report of the Working Party on the Accession of the Russian Federation to the World Trade Organization. WT/ACC/RUS/70, WT/MIN(11)/2. WTO, 17 November 2011.
Schedule CLXV - The Russian Federation
Kiselev, S.V. (2003). WTO and Russia’s Agriculture. Moscow. Russia.
Krylatykh, E.N., Strokova, O.G. (2002). Agricultural Issues of the CIS Countries Accession to the WTO. Moscow. Russia.
Matthews, A. “Russian WTO accession by end year?” Available at: http://capreform.eu/russian-wto-accession-by-end-year/.
Mitra, S. and Josling, T. (2009) “Agricultural Export Restrictions: Welfare Implications and Trade Disciplines”. International Food and Agricultural Trade Policy Council. Agricultural and Rural Development Policy Series. IPC position paper, January 2009.
Sharma, R. (2011) “Food Export Restrictions: Review of the 2007-2010 Experience and Considerations for Disciplining Restrictive Measures”. FAO Commodity and Trade Policy Research Working Paper No. 32. May 2011. Available at: http://ictsd.org/downloads/2011/05/sharma-export-restrictions.pdf
Tarr, D. (2008) ”Russian WTO Accession: Achievements, Impacts, Challenges”. Published by the Organization for Economic Cooperation and Development. Available at: http://www.oecd.org/dataoecd/28/4/40747249.pdf
United States Trade Representative (2011), “US Export Opportunities from Russia’s Membership in the WTO”. Available at: http://www.ustr.gov/countries-regions/europe-middle-east/russia-and-eurasia/russia-0.
William M. Liefert, Olga Liefert, and Eugenia Serova “Russia’s Transition to Major Player in World Agricultural Markets”. Choices. The Magazine of Food, Farm, and Resource Issues. 2nd Quarter 2009 / 24(2). Available at: http://www.choicesmagazine.org/magazine/article.php?article=78.
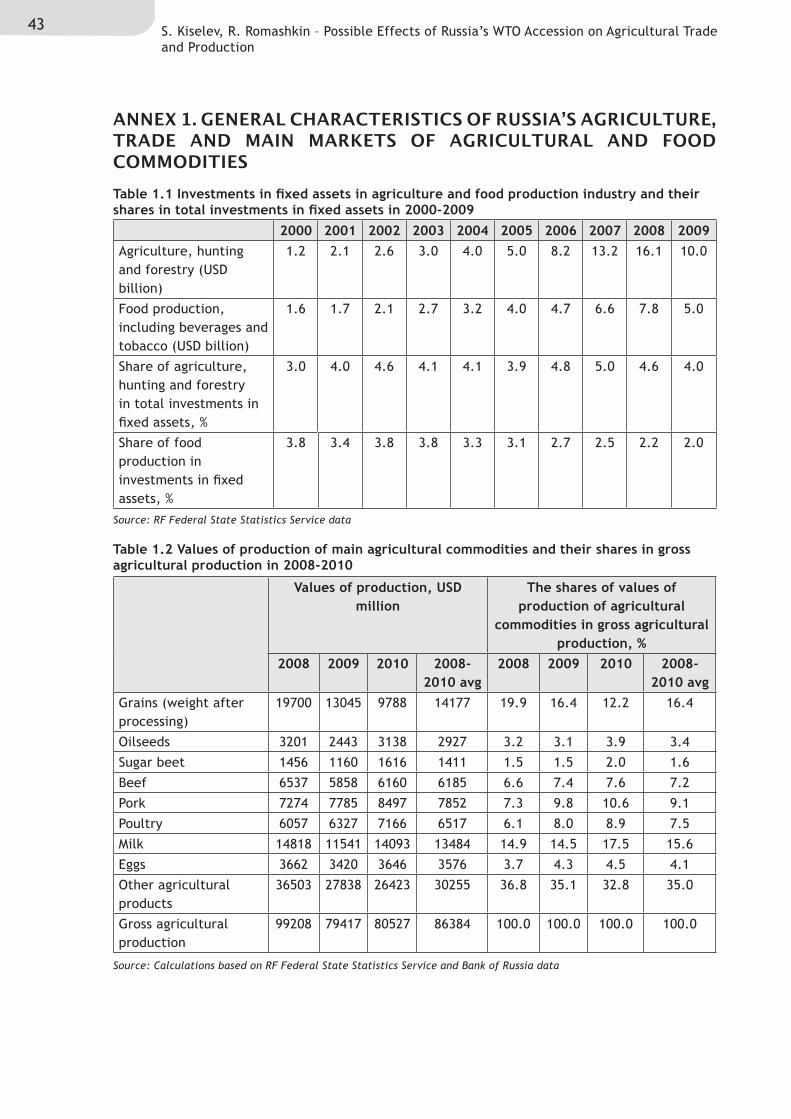
43 S. Kiselev, R. Romashkin – Possible Effects of Russia’s WTO Accession on Agricultural Trade and Production
ANNEX 1. GENERAL CHARACTERISTICS OF RUSSIA’S AGRICULTURE, TRADE AND MAIN MARKETS OF AGRICULTURAL AND FOOD COMMODITIES Table 1.1 Investments in fixed assets in agriculture and food production industry and their shares in total investments in fixed assets in 2000-2009
Table 1.2 Values of production of main agricultural commodities and their shares in gross agricultural production in 2008-2010
Source: RF Federal State Statistics Service data
Source: Calculations based on RF Federal State Statistics Service and Bank of Russia data
2000 2001 2002 2003 2004 2005 2006 2007 2008 2009Agriculture, hunting and forestry (USD billion)
1.2 2.1 2.6 3.0 4.0 5.0 8.2 13.2 16.1 10.0
Food production, including beverages and tobacco (USD billion)
1.6 1.7 2.1 2.7 3.2 4.0 4.7 6.6 7.8 5.0
Share of agriculture, hunting and forestry in total investments in fixed assets, %
3.0 4.0 4.6 4.1 4.1 3.9 4.8 5.0 4.6 4.0
Share of food production in investments in fixed assets, %
3.8 3.4 3.8 3.8 3.3 3.1 2.7 2.5 2.2 2.0
Values of production, USD million
The shares of values of production of agricultural
commodities in gross agricultural production, %
2008 2009 2010 2008-2010 avg
2008 2009 2010 2008-2010 avg
Grains (weight after processing)
19700 13045 9788 14177 19.9 16.4 12.2 16.4
Oilseeds 3201 2443 3138 2927 3.2 3.1 3.9 3.4
Sugar beet 1456 1160 1616 1411 1.5 1.5 2.0 1.6
Beef 6537 5858 6160 6185 6.6 7.4 7.6 7.2
Pork 7274 7785 8497 7852 7.3 9.8 10.6 9.1
Poultry 6057 6327 7166 6517 6.1 8.0 8.9 7.5
Milk 14818 11541 14093 13484 14.9 14.5 17.5 15.6
Eggs 3662 3420 3646 3576 3.7 4.3 4.5 4.1
Other agricultural products
36503 27838 26423 30255 36.8 35.1 32.8 35.0
Gross agricultural production
99208 79417 80527 86384 100.0 100.0 100.0 100.0
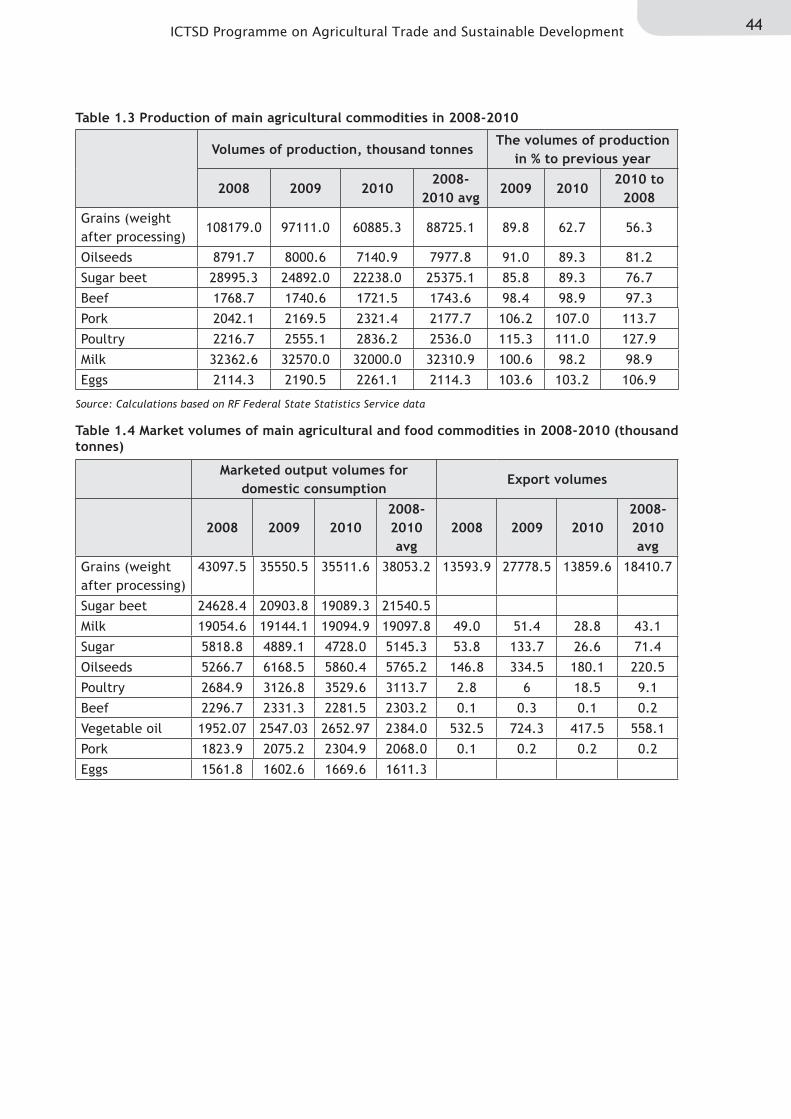
44ICTSD Programme on Agricultural Trade and Sustainable Development
Table 1.3 Production of main agricultural commodities in 2008-2010
Table 1.4 Market volumes of main agricultural and food commodities in 2008-2010 (thousand tonnes)
Source: Calculations based on RF Federal State Statistics Service data
Volumes of production, thousand tonnes
The volumes of production in % to previous year
2008 2009 20102008-
2010 avg2009 2010
2010 to 2008
Grains (weight after processing)
108179.0 97111.0 60885.3 88725.1 89.8 62.7 56.3
Oilseeds 8791.7 8000.6 7140.9 7977.8 91.0 89.3 81.2
Sugar beet 28995.3 24892.0 22238.0 25375.1 85.8 89.3 76.7
Beef 1768.7 1740.6 1721.5 1743.6 98.4 98.9 97.3
Pork 2042.1 2169.5 2321.4 2177.7 106.2 107.0 113.7
Poultry 2216.7 2555.1 2836.2 2536.0 115.3 111.0 127.9
Milk 32362.6 32570.0 32000.0 32310.9 100.6 98.2 98.9
Eggs 2114.3 2190.5 2261.1 2114.3 103.6 103.2 106.9
Marketed output volumes for
domestic consumption Export volumes
2008 2009 20102008-2010 avg
2008 2009 20102008-2010 avg
Grains (weight after processing)
43097.5 35550.5 35511.6 38053.2 13593.9 27778.5 13859.6 18410.7
Sugar beet 24628.4 20903.8 19089.3 21540.5
Milk 19054.6 19144.1 19094.9 19097.8 49.0 51.4 28.8 43.1
Sugar 5818.8 4889.1 4728.0 5145.3 53.8 133.7 26.6 71.4
Oilseeds 5266.7 6168.5 5860.4 5765.2 146.8 334.5 180.1 220.5
Poultry 2684.9 3126.8 3529.6 3113.7 2.8 6 18.5 9.1
Beef 2296.7 2331.3 2281.5 2303.2 0.1 0.3 0.1 0.2
Vegetable oil 1952.07 2547.03 2652.97 2384.0 532.5 724.3 417.5 558.1
Pork 1823.9 2075.2 2304.9 2068.0 0.1 0.2 0.2 0.2
Eggs 1561.8 1602.6 1669.6 1611.3
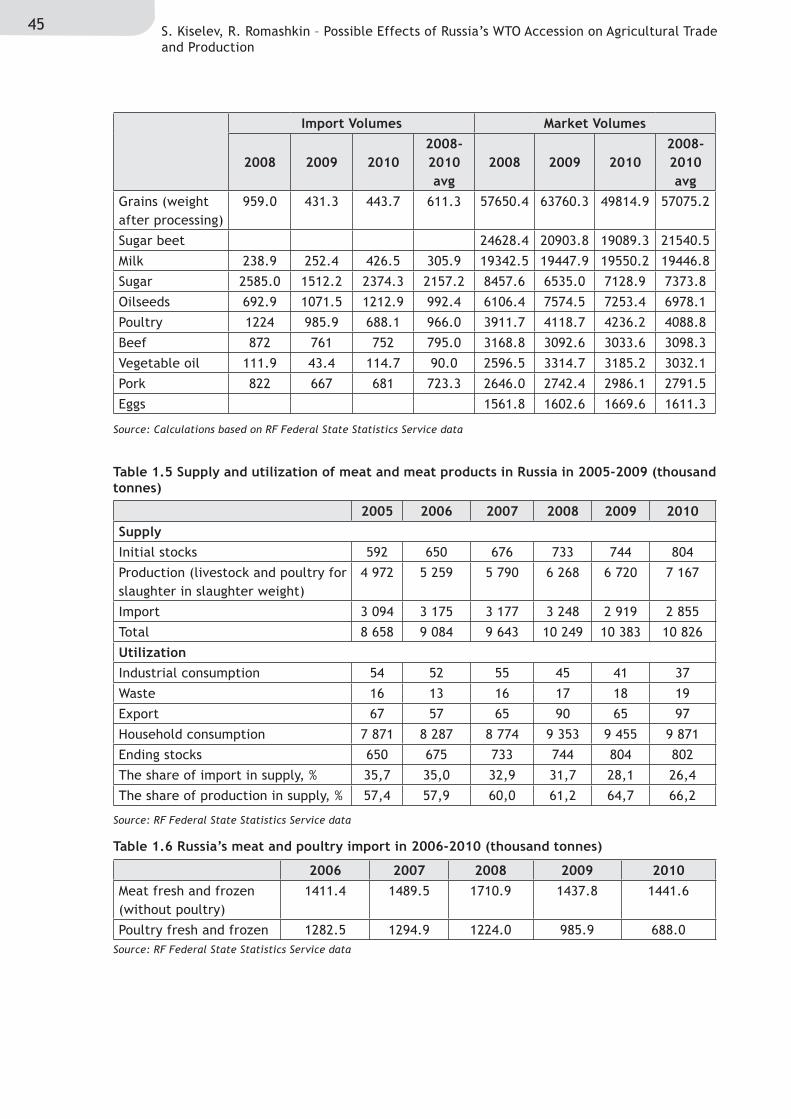
45 S. Kiselev, R. Romashkin – Possible Effects of Russia’s WTO Accession on Agricultural Trade and Production
Import Volumes Market Volumes
2008 2009 20102008-2010 avg
2008 2009 20102008-2010 avg
Grains (weight after processing)
959.0 431.3 443.7 611.3 57650.4 63760.3 49814.9 57075.2
Sugar beet 24628.4 20903.8 19089.3 21540.5
Milk 238.9 252.4 426.5 305.9 19342.5 19447.9 19550.2 19446.8
Sugar 2585.0 1512.2 2374.3 2157.2 8457.6 6535.0 7128.9 7373.8
Oilseeds 692.9 1071.5 1212.9 992.4 6106.4 7574.5 7253.4 6978.1
Poultry 1224 985.9 688.1 966.0 3911.7 4118.7 4236.2 4088.8
Beef 872 761 752 795.0 3168.8 3092.6 3033.6 3098.3
Vegetable oil 111.9 43.4 114.7 90.0 2596.5 3314.7 3185.2 3032.1
Pork 822 667 681 723.3 2646.0 2742.4 2986.1 2791.5
Eggs 1561.8 1602.6 1669.6 1611.3
Source: Calculations based on RF Federal State Statistics Service data
Table 1.5 Supply and utilization of meat and meat products in Russia in 2005-2009 (thousand tonnes)
Table 1.6 Russia’s meat and poultry import in 2006-2010 (thousand tonnes)
Source: RF Federal State Statistics Service data
Source: RF Federal State Statistics Service data
2005 2006 2007 2008 2009 2010Supply Initial stocks 592 650 676 733 744 804
Production (livestock and poultry for slaughter in slaughter weight)
4 972 5 259 5 790 6 268 6 720 7 167
Import 3 094 3 175 3 177 3 248 2 919 2 855
Total 8 658 9 084 9 643 10 249 10 383 10 826
UtilizationIndustrial consumption 54 52 55 45 41 37
Waste 16 13 16 17 18 19
Export 67 57 65 90 65 97
Household consumption 7 871 8 287 8 774 9 353 9 455 9 871
Ending stocks 650 675 733 744 804 802
The share of import in supply, % 35,7 35,0 32,9 31,7 28,1 26,4
The share of production in supply, % 57,4 57,9 60,0 61,2 64,7 66,2
2006 2007 2008 2009 2010Meat fresh and frozen (without poultry)
1411.4 1489.5 1710.9 1437.8 1441.6
Poultry fresh and frozen 1282.5 1294.9 1224.0 985.9 688.0
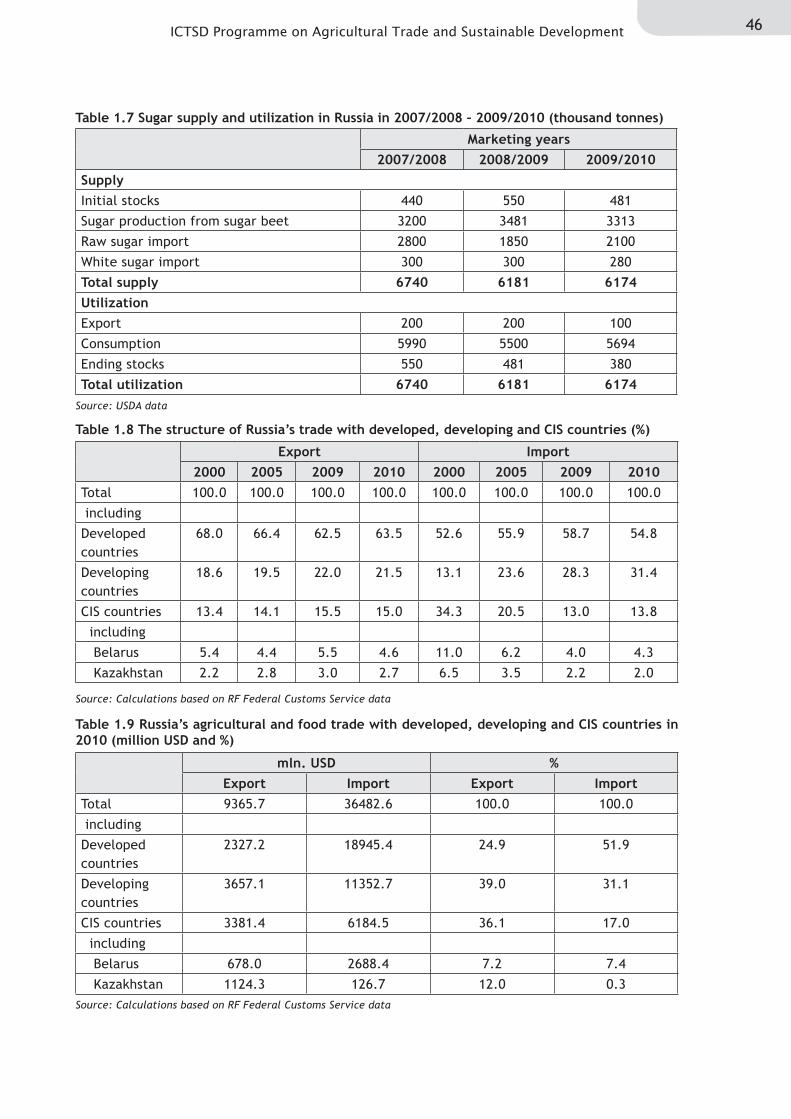
46ICTSD Programme on Agricultural Trade and Sustainable Development
Table 1.7 Sugar supply and utilization in Russia in 2007/2008 – 2009/2010 (thousand tonnes)
Table 1.8 The structure of Russia’s trade with developed, developing and CIS countries (%)
Table 1.9 Russia’s agricultural and food trade with developed, developing and CIS countries in 2010 (million USD and %)
Source: USDA data
Source: Calculations based on RF Federal Customs Service data
Source: Calculations based on RF Federal Customs Service data
Marketing years2007/2008 2008/2009 2009/2010
SupplyInitial stocks 440 550 481
Sugar production from sugar beet 3200 3481 3313
Raw sugar import 2800 1850 2100
White sugar import 300 300 280
Total supply 6740 6181 6174UtilizationExport 200 200 100
Consumption 5990 5500 5694
Ending stocks 550 481 380
Total utilization 6740 6181 6174
Export Import2000 2005 2009 2010 2000 2005 2009 2010
Total 100.0 100.0 100.0 100.0 100.0 100.0 100.0 100.0
including
Developed countries
68.0 66.4 62.5 63.5 52.6 55.9 58.7 54.8
Developing countries
18.6 19.5 22.0 21.5 13.1 23.6 28.3 31.4
CIS countries 13.4 14.1 15.5 15.0 34.3 20.5 13.0 13.8
including
Belarus 5.4 4.4 5.5 4.6 11.0 6.2 4.0 4.3
Kazakhstan 2.2 2.8 3.0 2.7 6.5 3.5 2.2 2.0
mln. USD % Export Import Export Import
Total 9365.7 36482.6 100.0 100.0
including
Developed countries
2327.2 18945.4 24.9 51.9
Developing countries
3657.1 11352.7 39.0 31.1
CIS countries 3381.4 6184.5 36.1 17.0
including
Belarus 678.0 2688.4 7.2 7.4
Kazakhstan 1124.3 126.7 12.0 0.3
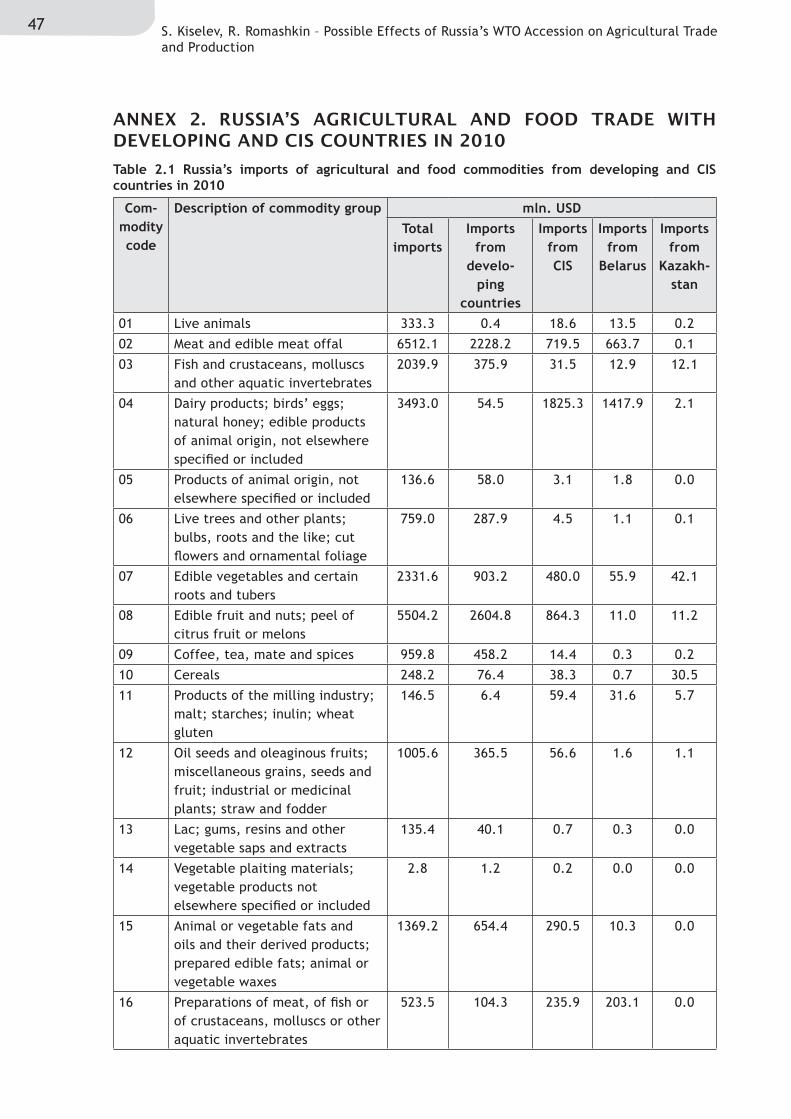
47 S. Kiselev, R. Romashkin – Possible Effects of Russia’s WTO Accession on Agricultural Trade and Production
ANNEX 2. RUSSIA’S AGRICULTURAL AND FOOD TRADE WITH DEVELOPING AND CIS COUNTRIES IN 2010Table 2.1 Russia’s imports of agricultural and food commodities from developing and CIS countries in 2010
Com-modity code
Description of commodity group mln. USDTotal
importsImports
from develo-
ping countries
Imports from CIS
Imports from
Belarus
Imports from
Kazakh-stan
01 Live animals 333.3 0.4 18.6 13.5 0.2
02 Meat and edible meat offal 6512.1 2228.2 719.5 663.7 0.1
03 Fish and crustaceans, molluscs and other aquatic invertebrates
2039.9 375.9 31.5 12.9 12.1
04 Dairy products; birds’ eggs; natural honey; edible products of animal origin, not elsewhere specified or included
3493.0 54.5 1825.3 1417.9 2.1
05 Products of animal origin, not elsewhere specified or included
136.6 58.0 3.1 1.8 0.0
06 Live trees and other plants; bulbs, roots and the like; cut flowers and ornamental foliage
759.0 287.9 4.5 1.1 0.1
07 Edible vegetables and certain roots and tubers
2331.6 903.2 480.0 55.9 42.1
08 Edible fruit and nuts; peel of citrus fruit or melons
5504.2 2604.8 864.3 11.0 11.2
09 Coffee, tea, mate and spices 959.8 458.2 14.4 0.3 0.2
10 Cereals 248.2 76.4 38.3 0.7 30.5
11 Products of the milling industry; malt; starches; inulin; wheat gluten
146.5 6.4 59.4 31.6 5.7
12 Oil seeds and oleaginous fruits; miscellaneous grains, seeds and fruit; industrial or medicinal plants; straw and fodder
1005.6 365.5 56.6 1.6 1.1
13 Lac; gums, resins and other vegetable saps and extracts
135.4 40.1 0.7 0.3 0.0
14 Vegetable plaiting materials; vegetable products not elsewhere specified or included
2.8 1.2 0.2 0.0 0.0
15 Animal or vegetable fats and oils and their derived products; prepared edible fats; animal or vegetable waxes
1369.2 654.4 290.5 10.3 0.0
16 Preparations of meat, of fish or of crustaceans, molluscs or other aquatic invertebrates
523.5 104.3 235.9 203.1 0.0
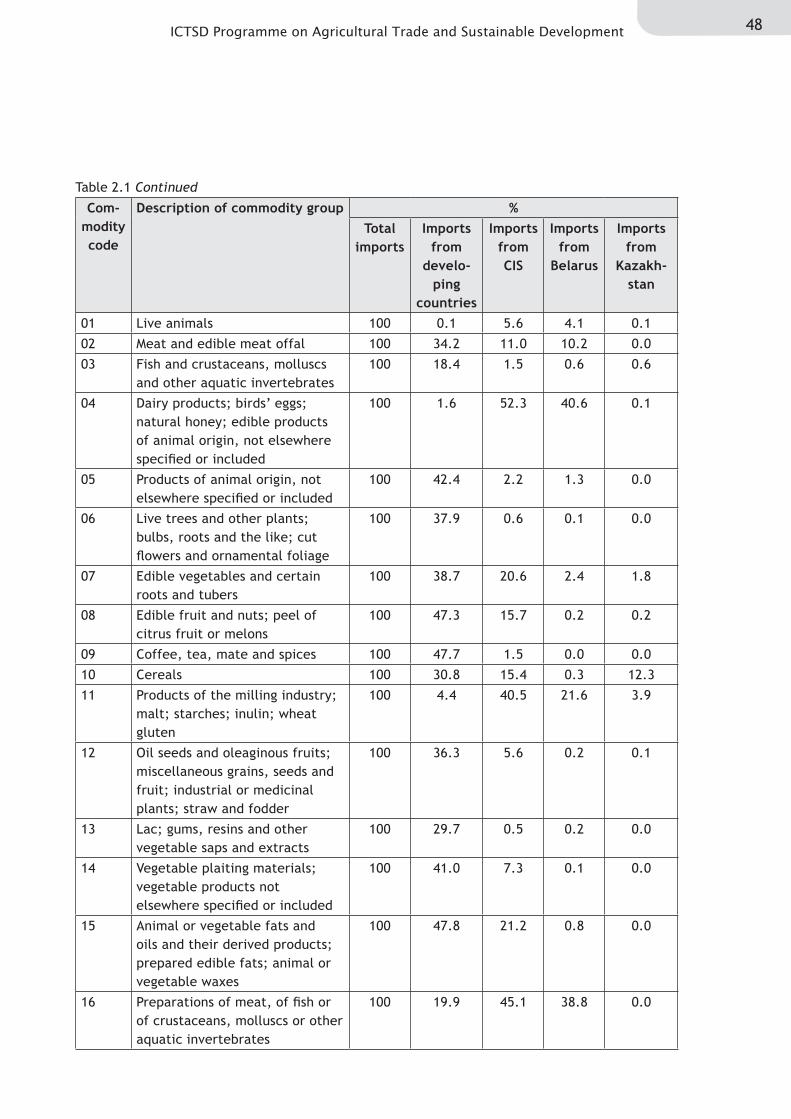
48ICTSD Programme on Agricultural Trade and Sustainable Development
Table 2.1 Continued
Com-modity code
Description of commodity group %Total
importsImports
from develo-
ping countries
Imports from CIS
Imports from
Belarus
Imports from
Kazakh-stan
01 Live animals 100 0.1 5.6 4.1 0.1
02 Meat and edible meat offal 100 34.2 11.0 10.2 0.0
03 Fish and crustaceans, molluscs and other aquatic invertebrates
100 18.4 1.5 0.6 0.6
04 Dairy products; birds’ eggs; natural honey; edible products of animal origin, not elsewhere specified or included
100 1.6 52.3 40.6 0.1
05 Products of animal origin, not elsewhere specified or included
100 42.4 2.2 1.3 0.0
06 Live trees and other plants; bulbs, roots and the like; cut flowers and ornamental foliage
100 37.9 0.6 0.1 0.0
07 Edible vegetables and certain roots and tubers
100 38.7 20.6 2.4 1.8
08 Edible fruit and nuts; peel of citrus fruit or melons
100 47.3 15.7 0.2 0.2
09 Coffee, tea, mate and spices 100 47.7 1.5 0.0 0.0
10 Cereals 100 30.8 15.4 0.3 12.3
11 Products of the milling industry; malt; starches; inulin; wheat gluten
100 4.4 40.5 21.6 3.9
12 Oil seeds and oleaginous fruits; miscellaneous grains, seeds and fruit; industrial or medicinal plants; straw and fodder
100 36.3 5.6 0.2 0.1
13 Lac; gums, resins and other vegetable saps and extracts
100 29.7 0.5 0.2 0.0
14 Vegetable plaiting materials; vegetable products not elsewhere specified or included
100 41.0 7.3 0.1 0.0
15 Animal or vegetable fats and oils and their derived products; prepared edible fats; animal or vegetable waxes
100 47.8 21.2 0.8 0.0
16 Preparations of meat, of fish or of crustaceans, molluscs or other aquatic invertebrates
100 19.9 45.1 38.8 0.0
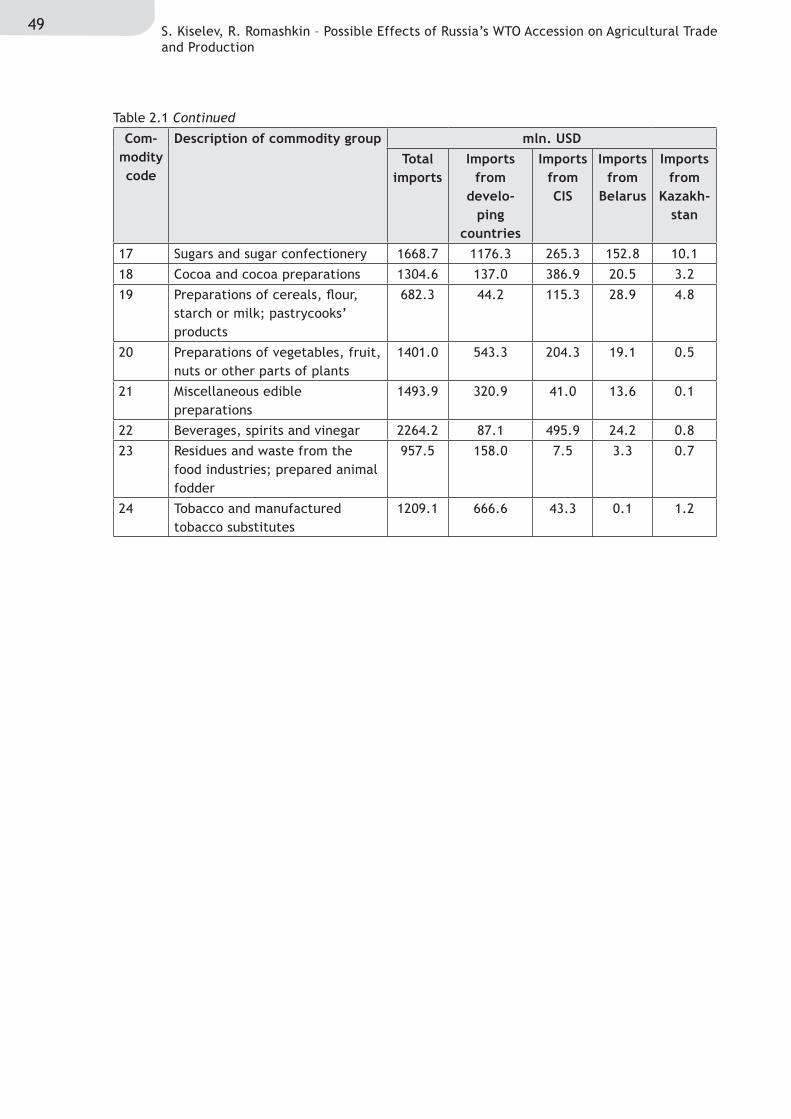
49 S. Kiselev, R. Romashkin – Possible Effects of Russia’s WTO Accession on Agricultural Trade and Production
Table 2.1 Continued
Com-modity code
Description of commodity group mln. USDTotal
importsImports
from develo-
ping countries
Imports from CIS
Imports from
Belarus
Imports from
Kazakh-stan
17 Sugars and sugar confectionery 1668.7 1176.3 265.3 152.8 10.1
18 Cocoa and cocoa preparations 1304.6 137.0 386.9 20.5 3.2
19 Preparations of cereals, flour, starch or milk; pastrycooks’ products
682.3 44.2 115.3 28.9 4.8
20 Preparations of vegetables, fruit, nuts or other parts of plants
1401.0 543.3 204.3 19.1 0.5
21 Miscellaneous edible preparations
1493.9 320.9 41.0 13.6 0.1
22 Beverages, spirits and vinegar 2264.2 87.1 495.9 24.2 0.8
23 Residues and waste from the food industries; prepared animal fodder
957.5 158.0 7.5 3.3 0.7
24 Tobacco and manufactured tobacco substitutes
1209.1 666.6 43.3 0.1 1.2
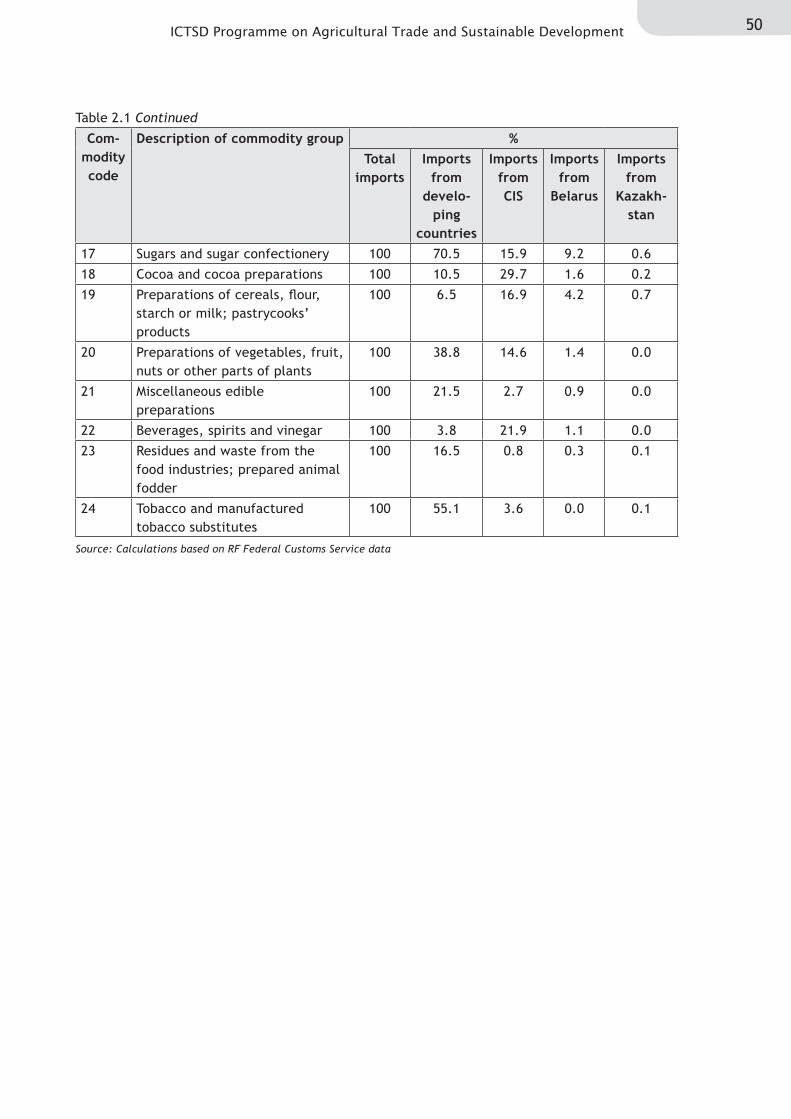
50ICTSD Programme on Agricultural Trade and Sustainable Development
Table 2.1 Continued
Com-modity code
Description of commodity group %Total
importsImports
from develo-
ping countries
Imports from CIS
Imports from
Belarus
Imports from
Kazakh-stan
17 Sugars and sugar confectionery 100 70.5 15.9 9.2 0.6
18 Cocoa and cocoa preparations 100 10.5 29.7 1.6 0.2
19 Preparations of cereals, flour, starch or milk; pastrycooks’ products
100 6.5 16.9 4.2 0.7
20 Preparations of vegetables, fruit, nuts or other parts of plants
100 38.8 14.6 1.4 0.0
21 Miscellaneous edible preparations
100 21.5 2.7 0.9 0.0
22 Beverages, spirits and vinegar 100 3.8 21.9 1.1 0.0
23 Residues and waste from the food industries; prepared animal fodder
100 16.5 0.8 0.3 0.1
24 Tobacco and manufactured tobacco substitutes
100 55.1 3.6 0.0 0.1
Source: Calculations based on RF Federal Customs Service data
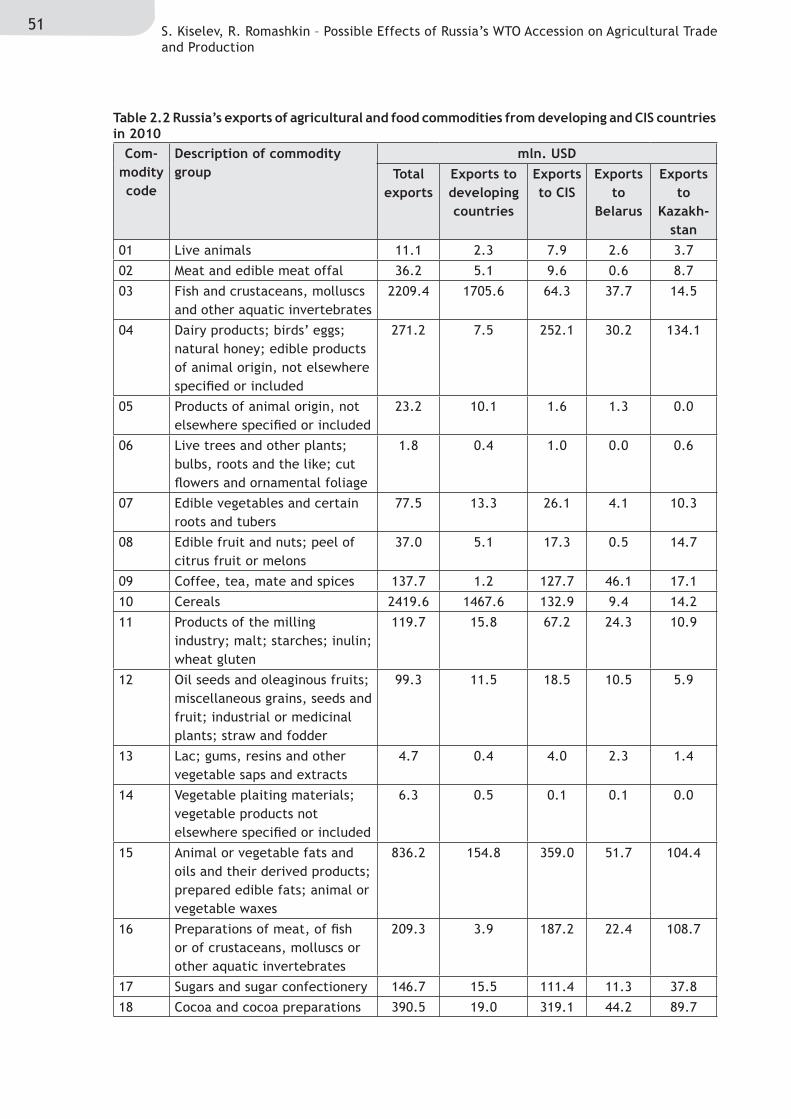
51 S. Kiselev, R. Romashkin – Possible Effects of Russia’s WTO Accession on Agricultural Trade and Production
Table 2.2 Russia’s exports of agricultural and food commodities from developing and CIS countries in 2010
Com-modity code
Description of commodity group
mln. USDTotal
exportsExports to developing countries
Exports to CIS
Exports to
Belarus
Exports to
Kazakh-stan
01 Live animals 11.1 2.3 7.9 2.6 3.7
02 Meat and edible meat offal 36.2 5.1 9.6 0.6 8.7
03 Fish and crustaceans, molluscs and other aquatic invertebrates
2209.4 1705.6 64.3 37.7 14.5
04 Dairy products; birds’ eggs; natural honey; edible products of animal origin, not elsewhere specified or included
271.2 7.5 252.1 30.2 134.1
05 Products of animal origin, not elsewhere specified or included
23.2 10.1 1.6 1.3 0.0
06 Live trees and other plants; bulbs, roots and the like; cut flowers and ornamental foliage
1.8 0.4 1.0 0.0 0.6
07 Edible vegetables and certain roots and tubers
77.5 13.3 26.1 4.1 10.3
08 Edible fruit and nuts; peel of citrus fruit or melons
37.0 5.1 17.3 0.5 14.7
09 Coffee, tea, mate and spices 137.7 1.2 127.7 46.1 17.1
10 Cereals 2419.6 1467.6 132.9 9.4 14.2
11 Products of the milling industry; malt; starches; inulin; wheat gluten
119.7 15.8 67.2 24.3 10.9
12 Oil seeds and oleaginous fruits; miscellaneous grains, seeds and fruit; industrial or medicinal plants; straw and fodder
99.3 11.5 18.5 10.5 5.9
13 Lac; gums, resins and other vegetable saps and extracts
4.7 0.4 4.0 2.3 1.4
14 Vegetable plaiting materials; vegetable products not elsewhere specified or included
6.3 0.5 0.1 0.1 0.0
15 Animal or vegetable fats and oils and their derived products; prepared edible fats; animal or vegetable waxes
836.2 154.8 359.0 51.7 104.4
16 Preparations of meat, of fish or of crustaceans, molluscs or other aquatic invertebrates
209.3 3.9 187.2 22.4 108.7
17 Sugars and sugar confectionery 146.7 15.5 111.4 11.3 37.8
18 Cocoa and cocoa preparations 390.5 19.0 319.1 44.2 89.7
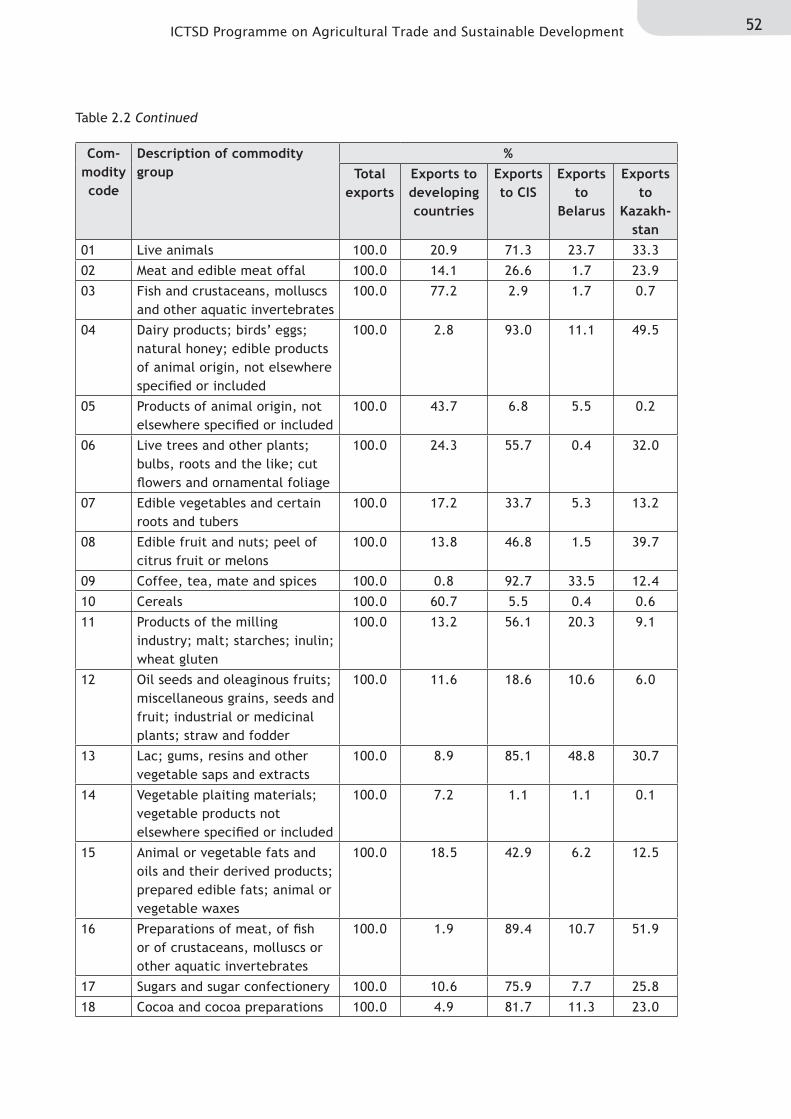
52ICTSD Programme on Agricultural Trade and Sustainable Development
Table 2.2 Continued
Com-modity code
Description of commodity group
%Total
exportsExports to developing countries
Exports to CIS
Exports to
Belarus
Exports to
Kazakh-stan
01 Live animals 100.0 20.9 71.3 23.7 33.3
02 Meat and edible meat offal 100.0 14.1 26.6 1.7 23.9
03 Fish and crustaceans, molluscs and other aquatic invertebrates
100.0 77.2 2.9 1.7 0.7
04 Dairy products; birds’ eggs; natural honey; edible products of animal origin, not elsewhere specified or included
100.0 2.8 93.0 11.1 49.5
05 Products of animal origin, not elsewhere specified or included
100.0 43.7 6.8 5.5 0.2
06 Live trees and other plants; bulbs, roots and the like; cut flowers and ornamental foliage
100.0 24.3 55.7 0.4 32.0
07 Edible vegetables and certain roots and tubers
100.0 17.2 33.7 5.3 13.2
08 Edible fruit and nuts; peel of citrus fruit or melons
100.0 13.8 46.8 1.5 39.7
09 Coffee, tea, mate and spices 100.0 0.8 92.7 33.5 12.4
10 Cereals 100.0 60.7 5.5 0.4 0.6
11 Products of the milling industry; malt; starches; inulin; wheat gluten
100.0 13.2 56.1 20.3 9.1
12 Oil seeds and oleaginous fruits; miscellaneous grains, seeds and fruit; industrial or medicinal plants; straw and fodder
100.0 11.6 18.6 10.6 6.0
13 Lac; gums, resins and other vegetable saps and extracts
100.0 8.9 85.1 48.8 30.7
14 Vegetable plaiting materials; vegetable products not elsewhere specified or included
100.0 7.2 1.1 1.1 0.1
15 Animal or vegetable fats and oils and their derived products; prepared edible fats; animal or vegetable waxes
100.0 18.5 42.9 6.2 12.5
16 Preparations of meat, of fish or of crustaceans, molluscs or other aquatic invertebrates
100.0 1.9 89.4 10.7 51.9
17 Sugars and sugar confectionery 100.0 10.6 75.9 7.7 25.8
18 Cocoa and cocoa preparations 100.0 4.9 81.7 11.3 23.0
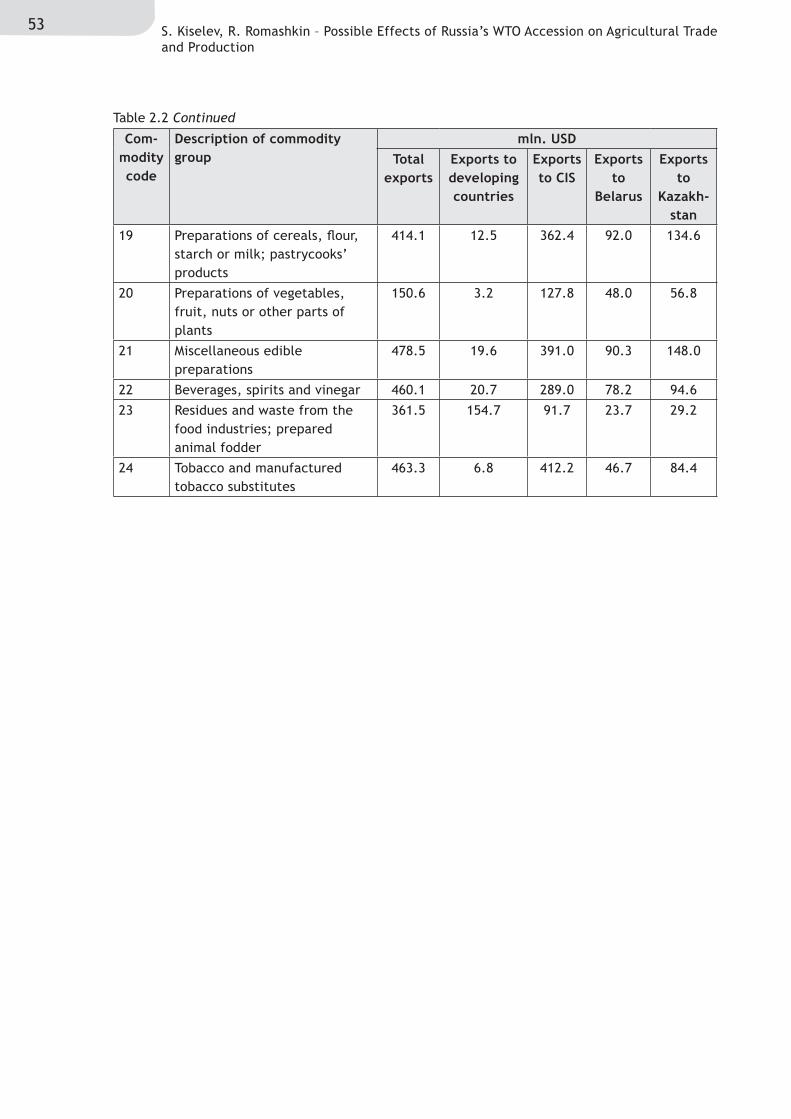
53 S. Kiselev, R. Romashkin – Possible Effects of Russia’s WTO Accession on Agricultural Trade and Production
Table 2.2 Continued
Com-modity code
Description of commodity group
mln. USDTotal
exportsExports to developing countries
Exports to CIS
Exports to
Belarus
Exports to
Kazakh-stan
19 Preparations of cereals, flour, starch or milk; pastrycooks’ products
414.1 12.5 362.4 92.0 134.6
20 Preparations of vegetables, fruit, nuts or other parts of plants
150.6 3.2 127.8 48.0 56.8
21 Miscellaneous edible preparations
478.5 19.6 391.0 90.3 148.0
22 Beverages, spirits and vinegar 460.1 20.7 289.0 78.2 94.6
23 Residues and waste from the food industries; prepared animal fodder
361.5 154.7 91.7 23.7 29.2
24 Tobacco and manufactured tobacco substitutes
463.3 6.8 412.2 46.7 84.4
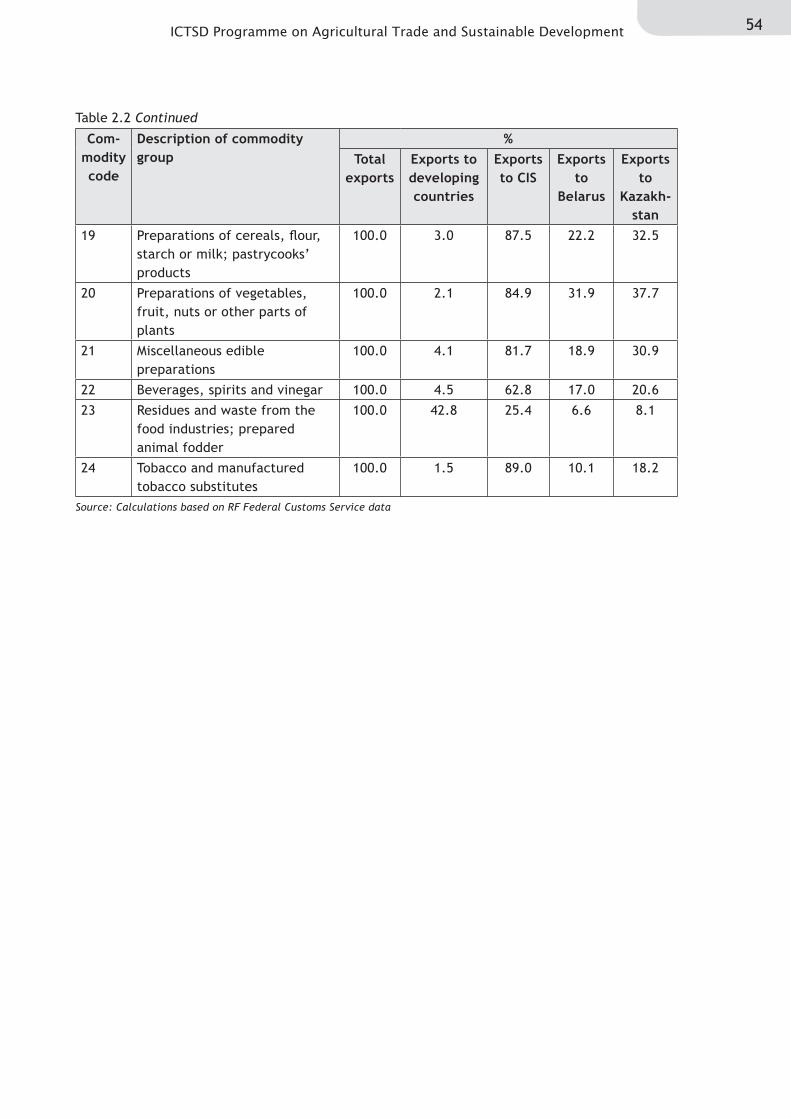
54ICTSD Programme on Agricultural Trade and Sustainable Development
Table 2.2 Continued
Com-modity code
Description of commodity group
%Total
exportsExports to developing countries
Exports to CIS
Exports to
Belarus
Exports to
Kazakh-stan
19 Preparations of cereals, flour, starch or milk; pastrycooks’ products
100.0 3.0 87.5 22.2 32.5
20 Preparations of vegetables, fruit, nuts or other parts of plants
100.0 2.1 84.9 31.9 37.7
21 Miscellaneous edible preparations
100.0 4.1 81.7 18.9 30.9
22 Beverages, spirits and vinegar 100.0 4.5 62.8 17.0 20.6
23 Residues and waste from the food industries; prepared animal fodder
100.0 42.8 25.4 6.6 8.1
24 Tobacco and manufactured tobacco substitutes
100.0 1.5 89.0 10.1 18.2
Source: Calculations based on RF Federal Customs Service data
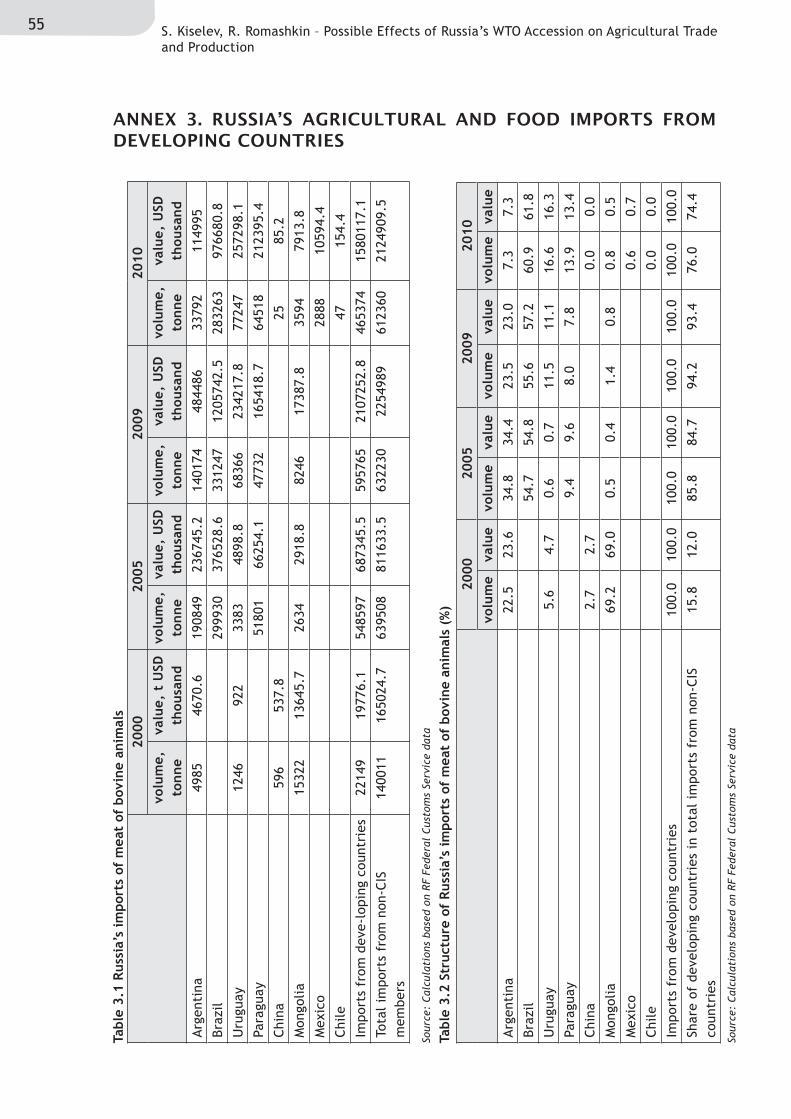
55 S. Kiselev, R. Romashkin – Possible Effects of Russia’s WTO Accession on Agricultural Trade and Production
ANNEX 3. RUSSIA’S AGRICULTURAL AND FOOD IMPORTS FROM DEVELOPING COUNTRIES
Tabl
e 3.
1 Ru
ssia
’s im
port
s of
mea
t of
bov
ine
anim
als
Tabl
e 3.
2 St
ruct
ure
of R
ussi
a’s
impo
rts
of m
eat
of b
ovin
e an
imal
s (%
)
2000
2005
2009
2010
volu
me,
to
nne
valu
e, t
USD
th
ousa
ndvo
lum
e,
tonn
eva
lue,
USD
th
ousa
ndvo
lum
e,
tonn
eva
lue,
USD
th
ousa
ndvo
lum
e,
tonn
eva
lue,
USD
th
ousa
ndArg
enti
na49
8546
70.6
1908
4923
6745
.214
0174
4844
8633
792
1149
95
Braz
il29
9930
3765
28.6
3312
4712
0574
2.5
2832
6397
6680
.8
Uru
guay
1246
922
3383
4898
.868
366
2342
17.8
7724
725
7298
.1
Para
guay
5180
166
254.
147
732
1654
18.7
6451
821
2395
.4
Chi
na59
653
7.8
2585
.2
Mon
golia
1532
213
645.
726
3429
18.8
8246
1738
7.8
3594
7913
.8
Mex
ico
2888
1059
4.4
Chi
le47
154.
4
Impo
rts
from
dev
e-lo
ping
cou
ntri
es22
149
1977
6.1
5485
9768
7345
.559
5765
2107
252.
846
5374
1580
117.
1
Tota
l im
port
s fr
om n
on-C
IS
mem
bers
1400
1116
5024
.763
9508
8116
33.5
6322
3022
5498
961
2360
2124
909.
5
Sour
ce:
Cal
cula
tion
s ba
sed
on R
F Fe
dera
l C
usto
ms
Serv
ice
data
Sour
ce:
Cal
cula
tion
s ba
sed
on R
F Fe
dera
l C
usto
ms
Serv
ice
data
2000
2005
2009
2010
volu
me
valu
evo
lum
eva
lue
volu
me
valu
evo
lum
eva
lue
Arg
enti
na22
.523
.634
.834
.423
.523
.07.
37.
3
Braz
il54
.754
.855
.657
.260
.961
.8
Uru
guay
5.6
4.7
0.6
0.7
11.5
11.1
16.6
16.3
Para
guay
9.4
9.6
8.0
7.8
13.9
13.4
Chi
na2.
72.
70.
00.
0
Mon
golia
69.2
69.0
0.5
0.4
1.4
0.8
0.8
0.5
Mex
ico
0.6
0.7
Chi
le0.
00.
0
Impo
rts
from
dev
elop
ing
coun
trie
s10
0.0
100.
010
0.0
100.
010
0.0
100.
010
0.0
100.
0
Shar
e of
dev
elop
ing
coun
trie
s in
tot
al i
mpo
rts
from
non
-CIS
co
untr
ies
15.8
12.0
85.8
84.7
94.2
93.4
76.0
74.4
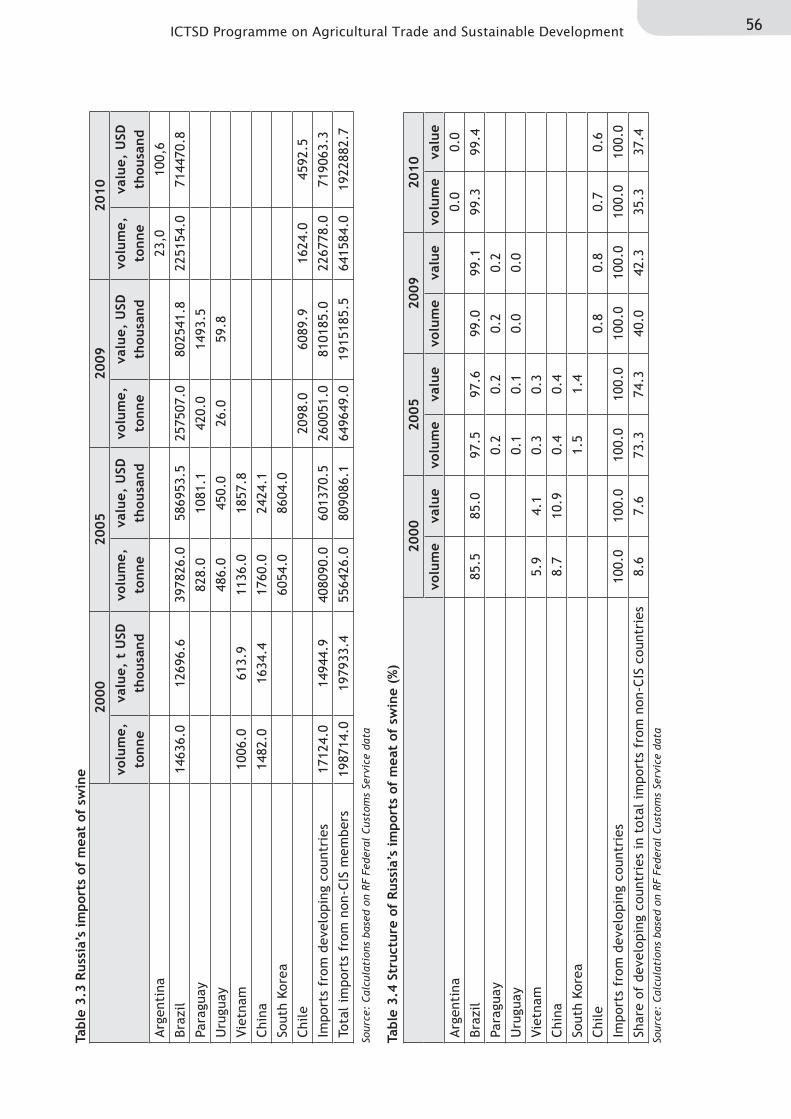
56ICTSD Programme on Agricultural Trade and Sustainable Development
Tabl
e 3.
3 Ru
ssia
’s im
port
s of
mea
t of
sw
ine
Tabl
e 3.
4 St
ruct
ure
of R
ussi
a’s
impo
rts
of m
eat
of s
win
e (%
)
2000
2005
2009
2010
volu
me,
to
nne
valu
e, t
USD
th
ousa
ndvo
lum
e,
tonn
eva
lue,
USD
th
ousa
ndvo
lum
e,
tonn
eva
lue,
USD
th
ousa
ndvo
lum
e,
tonn
eva
lue,
USD
th
ousa
ndArg
enti
na23
,010
0,6
Braz
il14
636.
012
696.
639
7826
.058
6953
.525
7507
.080
2541
.822
5154
.071
4470
.8
Para
guay
828.
010
81.1
420.
014
93.5
Uru
guay
486.
045
0.0
26.0
59.8
Viet
nam
1006
.061
3.9
1136
.018
57.8
Chi
na14
82.0
1634
.417
60.0
2424
.1
Sout
h Ko
rea
6054
.086
04.0
Chi
le20
98.0
6089
.916
24.0
4592
.5
Impo
rts
from
dev
elop
ing
coun
trie
s17
124.
014
944.
940
8090
.060
1370
.526
0051
.081
0185
.022
6778
.071
9063
.3
Tota
l im
port
s fr
om n
on-C
IS m
embe
rs19
8714
.019
7933
.455
6426
.080
9086
.164
9649
.019
1518
5.5
6415
84.0
1922
882.
7
Sour
ce:
Cal
cula
tion
s ba
sed
on R
F Fe
dera
l C
usto
ms
Serv
ice
data
Sour
ce:
Cal
cula
tion
s ba
sed
on R
F Fe
dera
l C
usto
ms
Serv
ice
data
2000
2005
2009
2010
volu
me
valu
evo
lum
eva
lue
volu
me
valu
evo
lum
eva
lue
Arg
enti
na0.
00.
0
Braz
il85
.585
.097
.597
.699
.099
.199
.399
.4
Para
guay
0.2
0.2
0.2
0.2
Uru
guay
0.1
0.1
0.0
0.0
Viet
nam
5.9
4.1
0.3
0.3
Chi
na8.
710
.90.
40.
4
Sout
h Ko
rea
1.5
1.4
Chi
le0.
80.
80.
70.
6
Impo
rts
from
dev
elop
ing
coun
trie
s10
0.0
100.
010
0.0
100.
010
0.0
100.
010
0.0
100.
0
Shar
e of
dev
elop
ing
coun
trie
s in
tot
al i
mpo
rts
from
non
-CIS
cou
ntri
es8.
67.
673
.374
.340
.042
.335
.337
.4
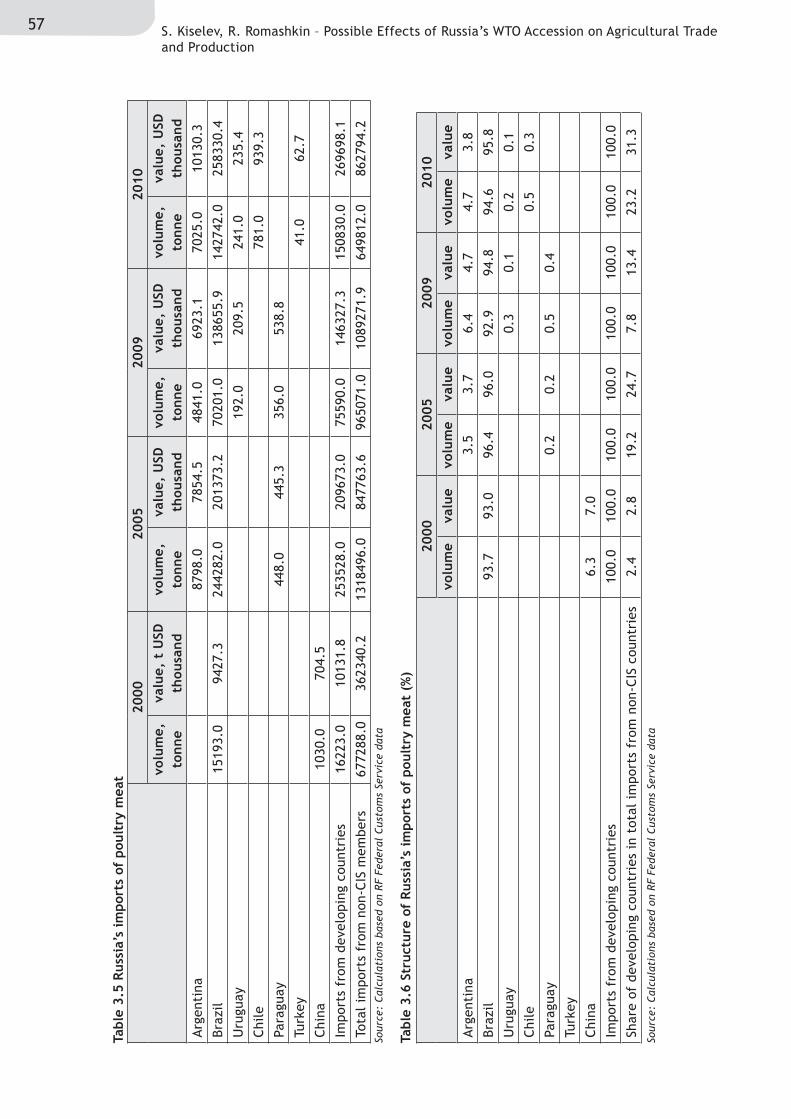
57 S. Kiselev, R. Romashkin – Possible Effects of Russia’s WTO Accession on Agricultural Trade and Production
Tabl
e 3.
5 Ru
ssia
’s im
port
s of
pou
ltry
mea
t
Tabl
e 3.
6 St
ruct
ure
of R
ussi
a’s
impo
rts
of p
oult
ry m
eat
(%)
2000
2005
2009
2010
volu
me,
to
nne
valu
e, t
USD
th
ousa
ndvo
lum
e,
tonn
eva
lue,
USD
th
ousa
ndvo
lum
e,
tonn
eva
lue,
USD
th
ousa
ndvo
lum
e,
tonn
eva
lue,
USD
th
ousa
ndArg
enti
na87
98.0
7854
.548
41.0
6923
.170
25.0
1013
0.3
Braz
il15
193.
094
27.3
2442
82.0
2013
73.2
7020
1.0
1386
55.9
1427
42.0
2583
30.4
Uru
guay
192.
020
9.5
241.
023
5.4
Chi
le78
1.0
939.
3
Para
guay
448.
044
5.3
356.
053
8.8
Turk
ey41
.062
.7
Chi
na10
30.0
704.
5
Impo
rts
from
dev
elop
ing
coun
trie
s16
223.
010
131.
825
3528
.020
9673
.075
590.
014
6327
.315
0830
.026
9698
.1
Tota
l im
port
s fr
om n
on-C
IS m
embe
rs67
7288
.036
2340
.213
1849
6.0
8477
63.6
9650
71.0
1089
271.
964
9812
.086
2794
.2So
urce
: C
alcu
lati
ons
base
d on
RF
Fede
ral
Cus
tom
s Se
rvic
e da
ta
Sour
ce:
Cal
cula
tion
s ba
sed
on R
F Fe
dera
l C
usto
ms
Serv
ice
data
2000
2005
2009
2010
volu
me
valu
evo
lum
eva
lue
volu
me
valu
evo
lum
eva
lue
Arg
enti
na3.
53.
76.
44.
74.
73.
8
Braz
il93
.793
.096
.496
.092
.994
.894
.695
.8
Uru
guay
0.3
0.1
0.2
0.1
Chi
le0.
50.
3
Para
guay
0.2
0.2
0.5
0.4
Turk
ey
Chi
na6.
37.
0
Impo
rts
from
dev
elop
ing
coun
trie
s10
0.0
100.
010
0.0
100.
010
0.0
100.
010
0.0
100.
0
Shar
e of
dev
elop
ing
coun
trie
s in
tot
al i
mpo
rts
from
non
-CIS
cou
ntri
es2.
42.
819
.224
.77.
813
.423
.231
.3
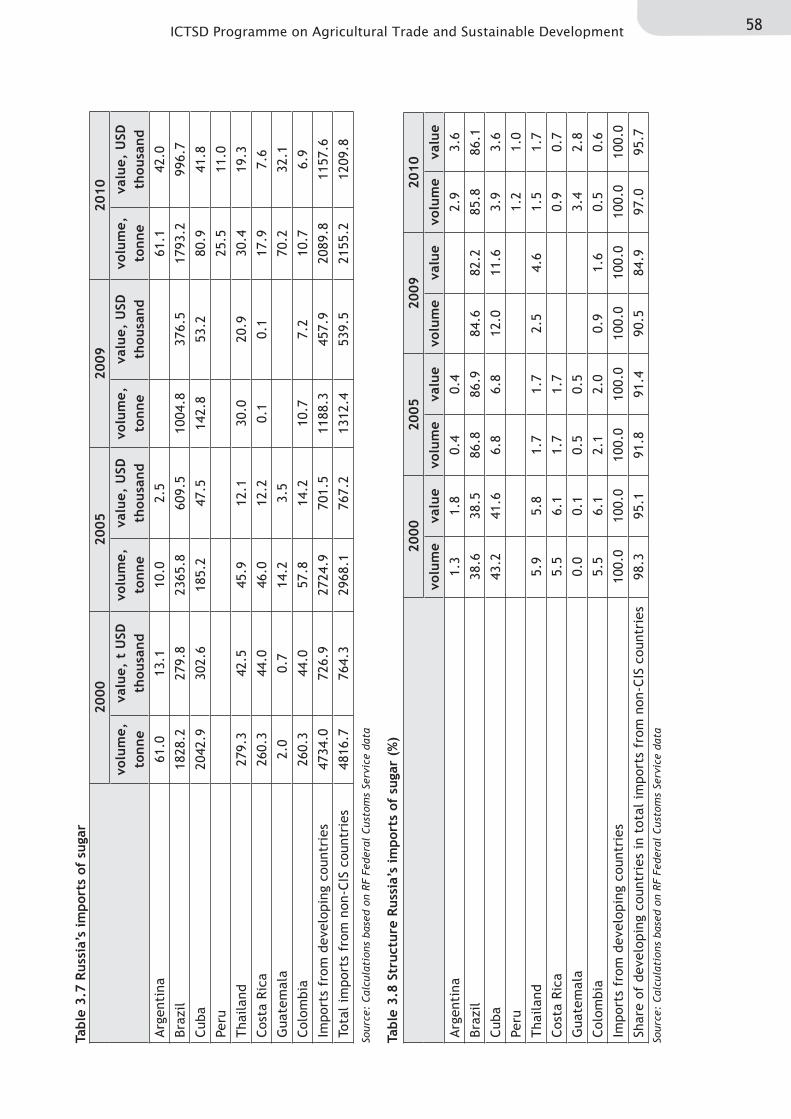
58ICTSD Programme on Agricultural Trade and Sustainable Development
Tabl
e 3.
7 Ru
ssia
’s im
port
s of
sug
ar
Tabl
e 3.
8 St
ruct
ure
Russ
ia’s
impo
rts
of s
ugar
(%
)
2000
2005
2009
2010
volu
me,
to
nne
valu
e, t
USD
th
ousa
ndvo
lum
e,
tonn
eva
lue,
USD
th
ousa
ndvo
lum
e,
tonn
eva
lue,
USD
th
ousa
ndvo
lum
e,
tonn
eva
lue,
USD
th
ousa
ndArg
enti
na61
.013
.110
.02.
561
.142
.0
Braz
il18
28.2
279.
823
65.8
609.
510
04.8
376.
517
93.2
996.
7
Cub
a20
42.9
302.
618
5.2
47.5
142.
853
.280
.941
.8
Peru
25.5
11.0
Tha
ilan
d27
9.3
42.5
45.9
12.1
30.0
20.9
30.4
19.3
Cos
ta R
ica
260.
344
.046
.012
.20.
10.
117
.97.
6
Gua
tem
ala
2.0
0.7
14.2
3.5
70.2
32.1
Col
ombi
a26
0.3
44.0
57.8
14.2
10.7
7.2
10.7
6.9
Impo
rts
from
dev
elop
ing
coun
trie
s47
34.0
726.
927
24.9
701.
511
88.3
457.
920
89.8
1157
.6
Tota
l im
port
s fr
om n
on-C
IS c
ount
ries
4816
.776
4.3
2968
.176
7.2
1312
.453
9.5
2155
.212
09.8
Sour
ce:
Cal
cula
tion
s ba
sed
on R
F Fe
dera
l C
usto
ms
Serv
ice
data
Sour
ce:
Cal
cula
tion
s ba
sed
on R
F Fe
dera
l C
usto
ms
Serv
ice
data
2000
2005
2009
2010
volu
me
valu
evo
lum
eva
lue
volu
me
valu
evo
lum
eva
lue
Arg
enti
na1.
31.
80.
40.
42.
93.
6
Braz
il38
.638
.586
.886
.984
.682
.285
.886
.1
Cub
a43
.241
.66.
86.
812
.011
.63.
93.
6
Peru
1.2
1.0
Tha
ilan
d5.
95.
81.
71.
72.
54.
61.
51.
7
Cos
ta R
ica
5.5
6.1
1.7
1.7
0.9
0.7
Gua
tem
ala
0.0
0.1
0.5
0.5
3.4
2.8
Col
ombi
a5.
56.
12.
12.
00.
91.
60.
50.
6
Impo
rts
from
dev
elop
ing
coun
trie
s10
0.0
100.
010
0.0
100.
010
0.0
100.
010
0.0
100.
0
Shar
e of
dev
elop
ing
coun
trie
s in
tot
al i
mpo
rts
from
non
-CIS
cou
ntri
es98
.395
.191
.891
.490
.584
.997
.095
.7
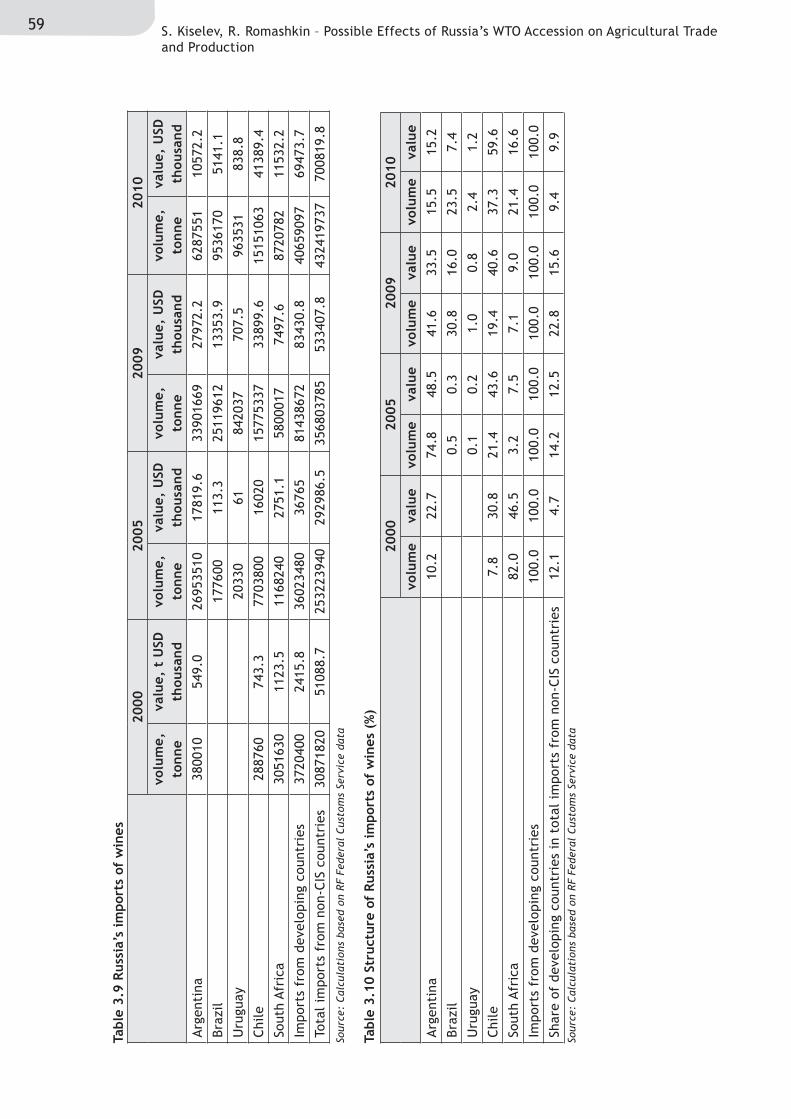
59 S. Kiselev, R. Romashkin – Possible Effects of Russia’s WTO Accession on Agricultural Trade and Production
Tabl
e 3.
9 Ru
ssia
’s im
port
s of
win
es
Tabl
e 3.
10 S
truc
ture
of
Russ
ia’s
impo
rts
of w
ines
(%
)
2000
2005
2009
2010
volu
me,
to
nne
valu
e, t
USD
th
ousa
ndvo
lum
e,
tonn
eva
lue,
USD
th
ousa
ndvo
lum
e,
tonn
eva
lue,
USD
th
ousa
ndvo
lum
e,
tonn
eva
lue,
USD
th
ousa
ndArg
enti
na38
0010
549.
026
9535
1017
819.
633
9016
6927
972.
262
8755
110
572.
2
Braz
il17
7600
113.
325
1196
1213
353.
995
3617
051
41.1
Uru
guay
2033
061
8420
3770
7.5
9635
3183
8.8
Chi
le28
8760
743.
377
0380
016
020
1577
5337
3389
9.6
1515
1063
4138
9.4
Sout
h Afr
ica
3051
630
1123
.511
6824
027
51.1
5800
017
7497
.687
2078
211
532.
2
Impo
rts
from
dev
elop
ing
coun
trie
s37
2040
024
15.8
3602
3480
3676
581
4386
7283
430.
840
6590
9769
473.
7
Tota
l im
port
s fr
om n
on-C
IS c
ount
ries
3087
1820
5108
8.7
2532
2394
029
2986
.535
6803
785
5334
07.8
4324
1973
770
0819
.8So
urce
: C
alcu
lati
ons
base
d on
RF
Fede
ral
Cus
tom
s Se
rvic
e da
ta
Sour
ce:
Cal
cula
tion
s ba
sed
on R
F Fe
dera
l C
usto
ms
Serv
ice
data
2000
2005
2009
2010
volu
me
valu
evo
lum
eva
lue
volu
me
valu
evo
lum
eva
lue
Arg
enti
na10
.222
.774
.848
.541
.633
.515
.515
.2
Braz
il0.
50.
330
.816
.023
.57.
4
Uru
guay
0.1
0.2
1.0
0.8
2.4
1.2
Chi
le7.
830
.821
.443
.619
.440
.637
.359
.6
Sout
h Afr
ica
82.0
46.5
3.2
7.5
7.1
9.0
21.4
16.6
Impo
rts
from
dev
elop
ing
coun
trie
s10
0.0
100.
010
0.0
100.
010
0.0
100.
010
0.0
100.
0
Shar
e of
dev
elop
ing
coun
trie
s in
tot
al i
mpo
rts
from
non
-CIS
cou
ntri
es12
.14.
714
.212
.522
.815
.69.
49.
9
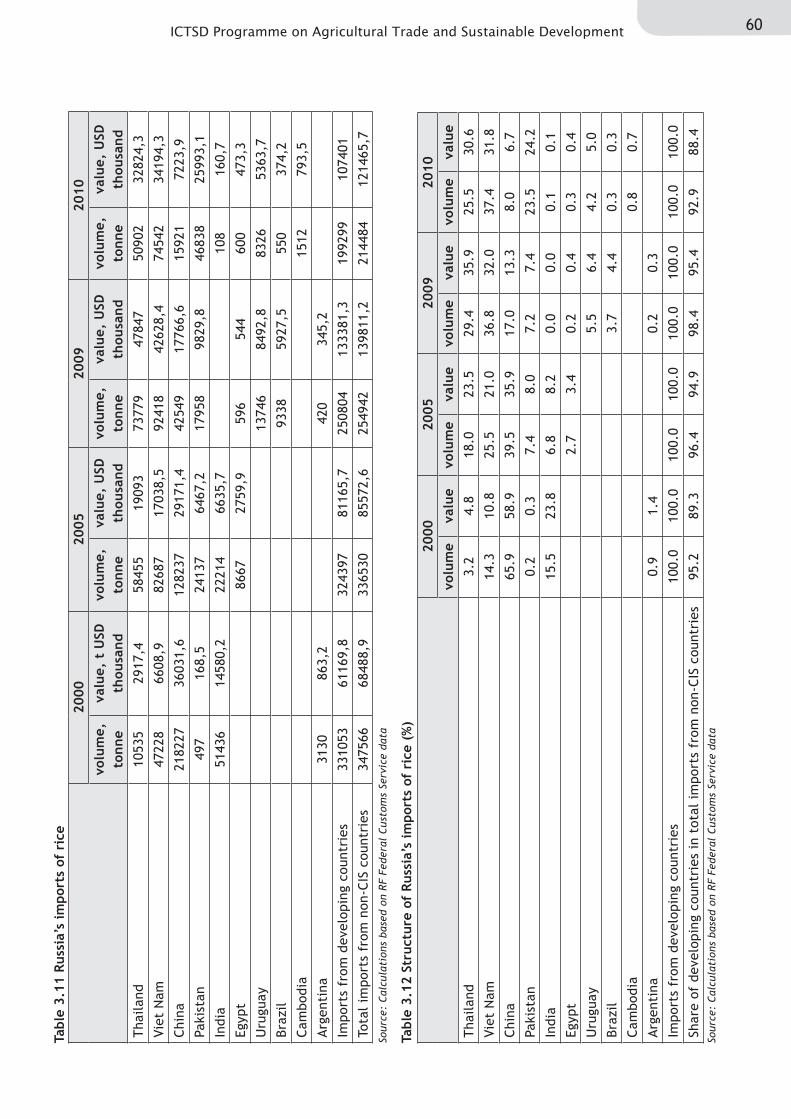
60ICTSD Programme on Agricultural Trade and Sustainable Development
Tabl
e 3.
11 R
ussi
a’s
impo
rts
of r
ice
Tabl
e 3.
12 S
truc
ture
of
Russ
ia’s
impo
rts
of r
ice
(%)
2000
2005
2009
2010
volu
me,
to
nne
valu
e, t
USD
th
ousa
ndvo
lum
e,
tonn
eva
lue,
USD
th
ousa
ndvo
lum
e,
tonn
eva
lue,
USD
th
ousa
ndvo
lum
e,
tonn
eva
lue,
USD
th
ousa
ndTha
ilan
d10
535
2917
,458
455
1909
373
779
4784
750
902
3282
4,3
Viet
Nam
4722
866
08,9
8268
717
038,
592
418
4262
8,4
7454
234
194,
3
Chi
na21
8227
3603
1,6
1282
3729
171,
442
549
1776
6,6
1592
172
23,9
Paki
stan
497
168,
524
137
6467
,217
958
9829
,846
838
2599
3,1
Indi
a51
436
1458
0,2
2221
466
35,7
108
160,
7
Egyp
t86
6727
59,9
596
544
600
473,
3
Uru
guay
1374
684
92,8
8326
5363
,7
Braz
il93
3859
27,5
550
374,
2
Cam
bodi
a15
1279
3,5
Arg
enti
na31
3086
3,2
420
345,
2
Impo
rts
from
dev
elop
ing
coun
trie
s33
1053
6116
9,8
3243
9781
165,
725
0804
1333
81,3
1992
9910
7401
Tota
l im
port
s fr
om n
on-C
IS c
ount
ries
3475
6668
488,
933
6530
8557
2,6
2549
4213
9811
,221
4484
1214
65,7
Sour
ce:
Cal
cula
tion
s ba
sed
on R
F Fe
dera
l C
usto
ms
Serv
ice
data
Sour
ce:
Cal
cula
tion
s ba
sed
on R
F Fe
dera
l C
usto
ms
Serv
ice
data
2000
2005
2009
2010
volu
me
valu
evo
lum
eva
lue
volu
me
valu
evo
lum
eva
lue
Tha
ilan
d3.
24.
818
.023
.529
.435
.925
.530
.6
Viet
Nam
14.3
10.8
25.5
21.0
36.8
32.0
37.4
31.8
Chi
na65
.958
.939
.535
.917
.013
.38.
06.
7
Paki
stan
0.2
0.3
7.4
8.0
7.2
7.4
23.5
24.2
Indi
a15
.523
.86.
88.
20.
00.
00.
10.
1
Egyp
t2.
73.
40.
20.
40.
30.
4
Uru
guay
5.5
6.4
4.2
5.0
Braz
il3.
74.
40.
30.
3
Cam
bodi
a0.
80.
7
Arg
enti
na0.
91.
40.
20.
3
Impo
rts
from
dev
elop
ing
coun
trie
s10
0.0
100.
010
0.0
100.
010
0.0
100.
010
0.0
100.
0
Shar
e of
dev
elop
ing
coun
trie
s in
tot
al i
mpo
rts
from
non
-CIS
cou
ntri
es95
.289
.396
.494
.998
.495
.492
.988
.4
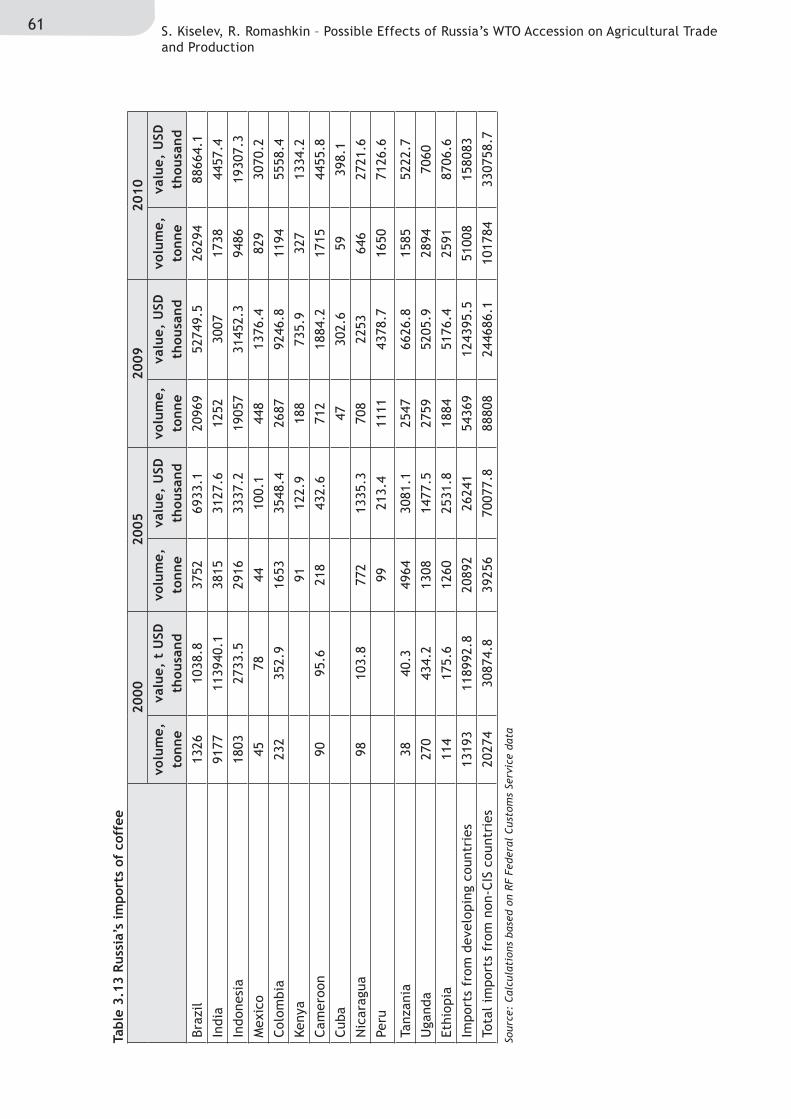
61 S. Kiselev, R. Romashkin – Possible Effects of Russia’s WTO Accession on Agricultural Trade and Production
Tabl
e 3.
13 R
ussi
a’s
impo
rts
of c
offe
e20
0020
0520
0920
10vo
lum
e,
tonn
eva
lue,
t U
SD
thou
sand
volu
me,
to
nne
valu
e, U
SD
thou
sand
volu
me,
to
nne
valu
e, U
SD
thou
sand
volu
me,
to
nne
valu
e, U
SD
thou
sand
Braz
il13
2610
38.8
3752
6933
.120
969
5274
9.5
2629
488
664.
1
Indi
a91
7711
3940
.138
1531
27.6
1252
3007
1738
4457
.4
Indo
nesi
a18
0327
33.5
2916
3337
.219
057
3145
2.3
9486
1930
7.3
Mex
ico
4578
4410
0.1
448
1376
.482
930
70.2
Col
ombi
a23
235
2.9
1653
3548
.426
8792
46.8
1194
5558
.4
Keny
a91
122.
918
873
5.9
327
1334
.2
Cam
eroo
n90
95.6
218
432.
671
218
84.2
1715
4455
.8
Cub
a47
302.
659
398.
1
Nic
arag
ua98
103.
877
213
35.3
708
2253
646
2721
.6
Peru
9921
3.4
1111
4378
.716
5071
26.6
Tanz
ania
3840
.349
6430
81.1
2547
6626
.815
8552
22.7
Uga
nda
270
434.
213
0814
77.5
2759
5205
.928
9470
60
Ethi
opia
114
175.
612
6025
31.8
1884
5176
.425
9187
06.6
Impo
rts
from
dev
elop
ing
coun
trie
s13
193
1189
92.8
2089
226
241
5436
912
4395
.551
008
1580
83
Tota
l im
port
s fr
om n
on-C
IS c
ount
ries
2027
430
874.
839
256
7007
7.8
8880
824
4686
.110
1784
3307
58.7
Sour
ce:
Cal
cula
tion
s ba
sed
on R
F Fe
dera
l C
usto
ms
Serv
ice
data
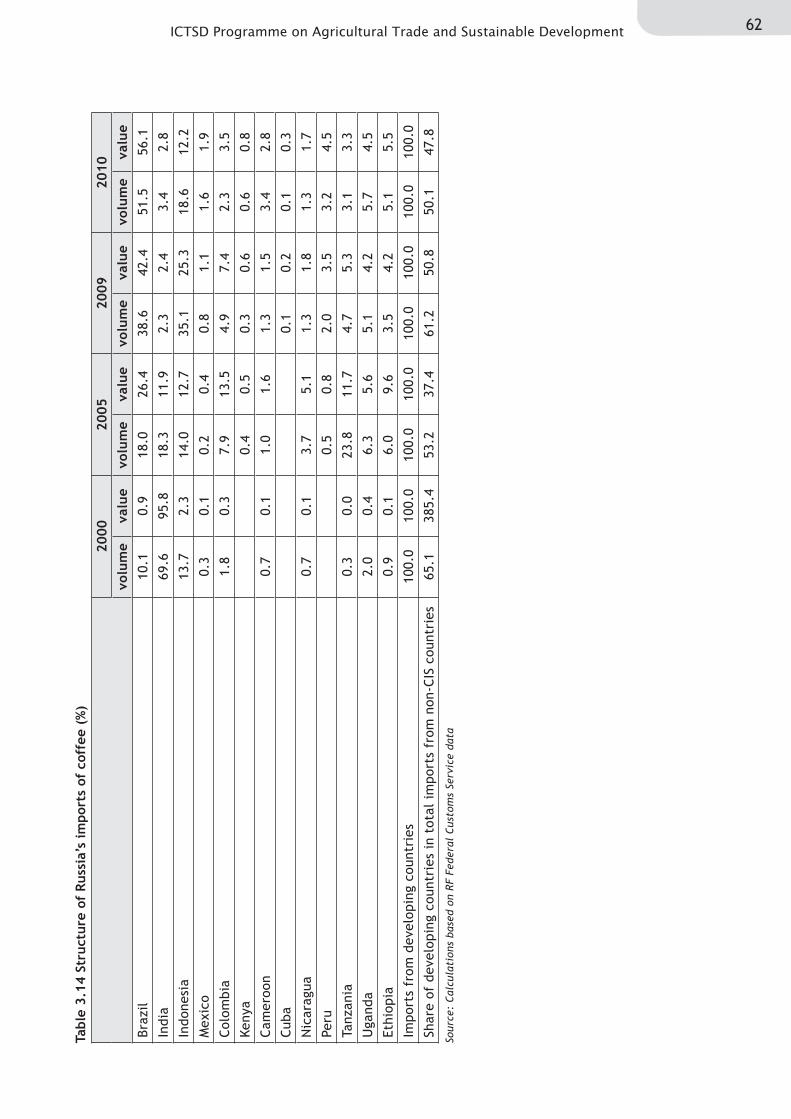
62ICTSD Programme on Agricultural Trade and Sustainable Development
Tabl
e 3.
14 S
truc
ture
of
Russ
ia’s
impo
rts
of c
offe
e (%
)
Sour
ce:
Cal
cula
tion
s ba
sed
on R
F Fe
dera
l C
usto
ms
Serv
ice
data
2000
2005
2009
2010
volu
me
valu
evo
lum
eva
lue
volu
me
valu
evo
lum
eva
lue
Braz
il10
.10.
918
.026
.438
.642
.451
.556
.1
Indi
a69
.695
.818
.311
.92.
32.
43.
42.
8
Indo
nesi
a13
.72.
314
.012
.735
.125
.318
.612
.2
Mex
ico
0.3
0.1
0.2
0.4
0.8
1.1
1.6
1.9
Col
ombi
a1.
80.
37.
913
.54.
97.
42.
33.
5
Keny
a0.
40.
50.
30.
60.
60.
8
Cam
eroo
n0.
70.
11.
01.
61.
31.
53.
42.
8
Cub
a0.
10.
20.
10.
3
Nic
arag
ua0.
70.
13.
75.
11.
31.
81.
31.
7
Peru
0.5
0.8
2.0
3.5
3.2
4.5
Tanz
ania
0.3
0.0
23.8
11.7
4.7
5.3
3.1
3.3
Uga
nda
2.0
0.4
6.3
5.6
5.1
4.2
5.7
4.5
Ethi
opia
0.9
0.1
6.0
9.6
3.5
4.2
5.1
5.5
Impo
rts
from
dev
elop
ing
coun
trie
s10
0.0
100.
010
0.0
100.
010
0.0
100.
010
0.0
100.
0
Shar
e of
dev
elop
ing
coun
trie
s in
tot
al i
mpo
rts
from
non
-CIS
cou
ntri
es65
.138
5.4
53.2
37.4
61.2
50.8
50.1
47.8
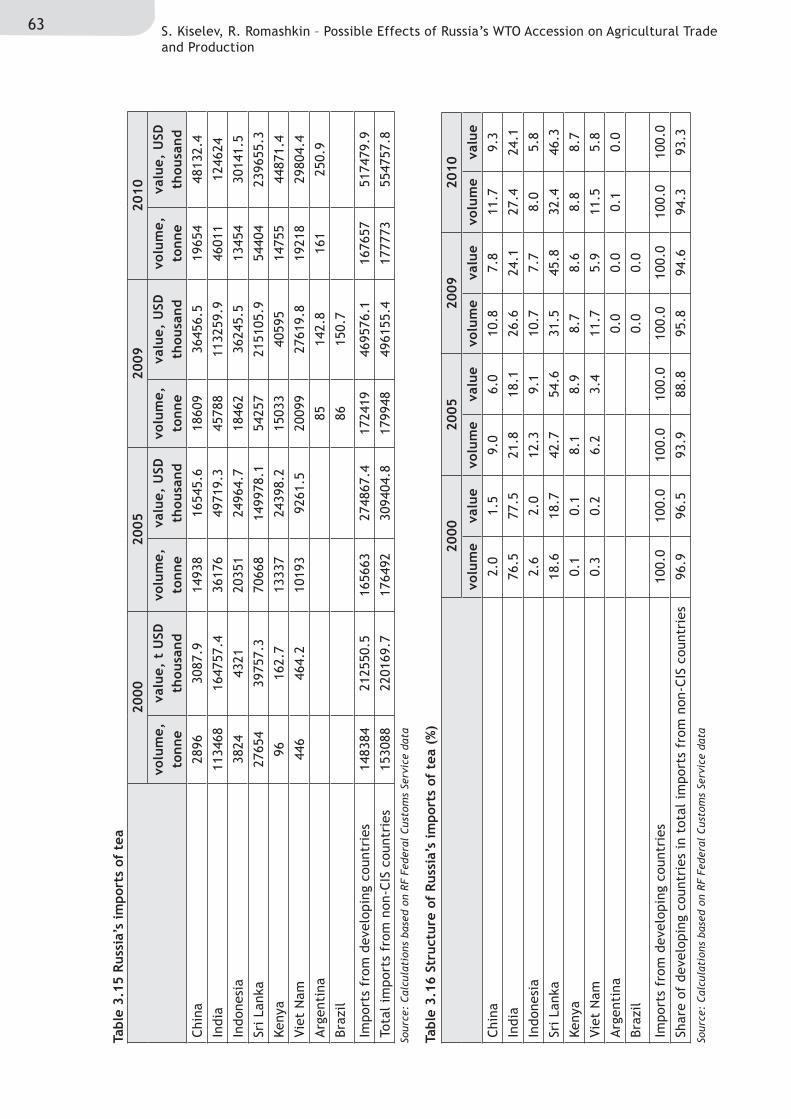
63 S. Kiselev, R. Romashkin – Possible Effects of Russia’s WTO Accession on Agricultural Trade and Production
Tabl
e 3.
15 R
ussi
a’s
impo
rts
of t
ea
Tabl
e 3.
16 S
truc
ture
of
Russ
ia’s
impo
rts
of t
ea (
%)
2000
2005
2009
2010
volu
me,
to
nne
valu
e, t
USD
th
ousa
ndvo
lum
e,
tonn
eva
lue,
USD
th
ousa
ndvo
lum
e,
tonn
eva
lue,
USD
th
ousa
ndvo
lum
e,
tonn
eva
lue,
USD
th
ousa
ndC
hina
2896
3087
.914
938
1654
5.6
1860
936
456.
519
654
4813
2.4
Indi
a11
3468
1647
57.4
3617
649
719.
345
788
1132
59.9
4601
112
4624
Indo
nesi
a38
2443
2120
351
2496
4.7
1846
236
245.
513
454
3014
1.5
Sri
Lank
a27
654
3975
7.3
7066
814
9978
.154
257
2151
05.9
5440
423
9655
.3
Keny
a96
162.
713
337
2439
8.2
1503
340
595
1475
544
871.
4
Viet
Nam
446
464.
210
193
9261
.520
099
2761
9.8
1921
829
804.
4
Arg
enti
na85
142.
816
125
0.9
Braz
il86
150.
7
Impo
rts
from
dev
elop
ing
coun
trie
s14
8384
2125
50.5
1656
6327
4867
.417
2419
4695
76.1
1676
5751
7479
.9
Tota
l im
port
s fr
om n
on-C
IS c
ount
ries
1530
8822
0169
.717
6492
3094
04.8
1799
4849
6155
.417
7773
5547
57.8
Sour
ce:
Cal
cula
tion
s ba
sed
on R
F Fe
dera
l C
usto
ms
Serv
ice
data
Sour
ce:
Cal
cula
tion
s ba
sed
on R
F Fe
dera
l C
usto
ms
Serv
ice
data
2000
2005
2009
2010
volu
me
valu
evo
lum
eva
lue
volu
me
valu
evo
lum
eva
lue
Chi
na2.
01.
59.
06.
010
.87.
811
.79.
3
Indi
a76
.577
.521
.818
.126
.624
.127
.424
.1
Indo
nesi
a2.
62.
012
.39.
110
.77.
78.
05.
8
Sri
Lank
a18
.618
.742
.754
.631
.545
.832
.446
.3
Keny
a0.
10.
18.
18.
98.
78.
68.
88.
7
Viet
Nam
0.3
0.2
6.2
3.4
11.7
5.9
11.5
5.8
Arg
enti
na0.
00.
00.
10.
0
Braz
il0.
00.
0
Impo
rts
from
dev
elop
ing
coun
trie
s10
0.0
100.
010
0.0
100.
010
0.0
100.
010
0.0
100.
0
Shar
e of
dev
elop
ing
coun
trie
s in
tot
al i
mpo
rts
from
non
-CIS
cou
ntri
es96
.996
.593
.988
.895
.894
.694
.393
.3
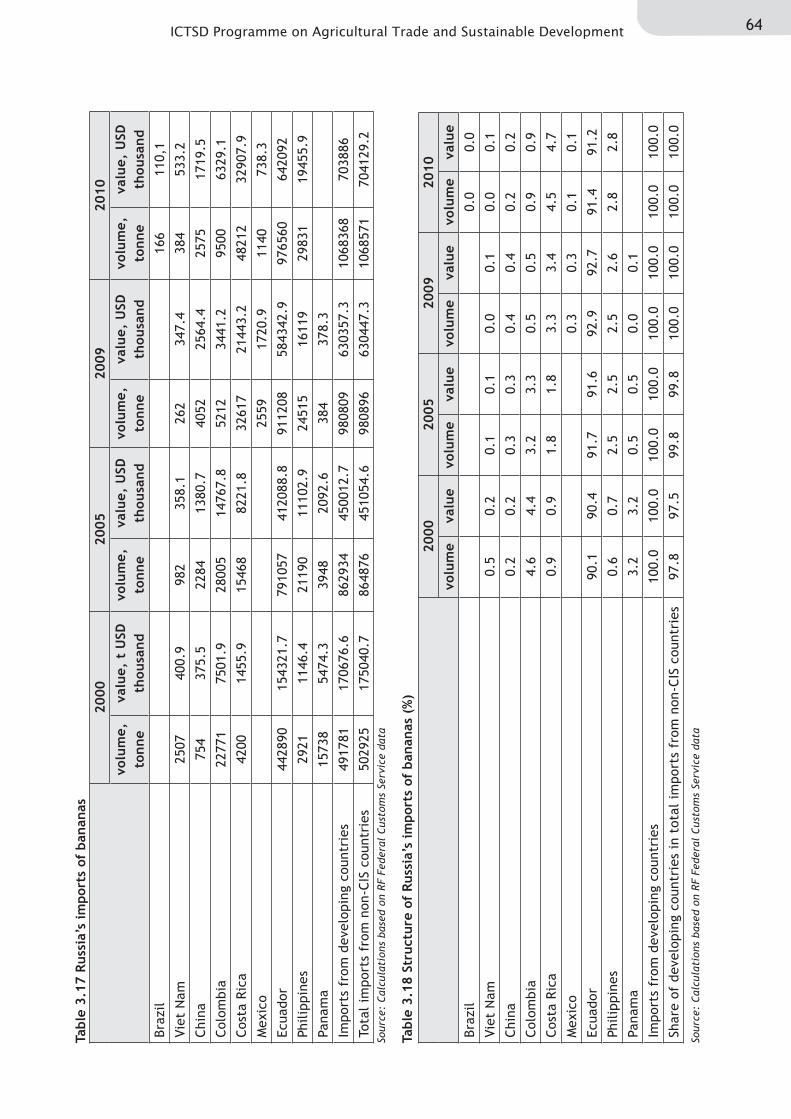
64ICTSD Programme on Agricultural Trade and Sustainable Development
Tabl
e 3.
17 R
ussi
a’s
impo
rts
of b
anan
as
Tabl
e 3.
18 S
truc
ture
of
Russ
ia’s
impo
rts
of b
anan
as (
%)
2000
2005
2009
2010
volu
me,
to
nne
valu
e, t
USD
th
ousa
ndvo
lum
e,
tonn
eva
lue,
USD
th
ousa
ndvo
lum
e,
tonn
eva
lue,
USD
th
ousa
ndvo
lum
e,
tonn
eva
lue,
USD
th
ousa
ndBr
azil
166
110,
1
Viet
Nam
2507
400.
998
235
8.1
262
347.
438
453
3.2
Chi
na75
437
5.5
2284
1380
.740
5225
64.4
2575
1719
.5
Col
ombi
a22
771
7501
.928
005
1476
7.8
5212
3441
.295
0063
29.1
Cos
ta R
ica
4200
1455
.915
468
8221
.832
617
2144
3.2
4821
232
907.
9
Mex
ico
2559
1720
.911
4073
8.3
Ecua
dor
4428
9015
4321
.779
1057
4120
88.8
9112
0858
4342
.997
6560
6420
92
Philip
pine
s29
2111
46.4
2119
011
102.
924
515
1611
929
831
1945
5.9
Pana
ma
1573
854
74.3
3948
2092
.638
437
8.3
Impo
rts
from
dev
elop
ing
coun
trie
s49
1781
1706
76.6
8629
3445
0012
.798
0809
6303
57.3
1068
368
7038
86
Tota
l im
port
s fr
om n
on-C
IS c
ount
ries
5029
2517
5040
.786
4876
4510
54.6
9808
9663
0447
.310
6857
170
4129
.2So
urce
: C
alcu
lati
ons
base
d on
RF
Fede
ral
Cus
tom
s Se
rvic
e da
ta
Sour
ce:
Cal
cula
tion
s ba
sed
on R
F Fe
dera
l C
usto
ms
Serv
ice
data
2000
2005
2009
2010
volu
me
valu
evo
lum
eva
lue
volu
me
valu
evo
lum
eva
lue
Braz
il0.
00.
0
Viet
Nam
0.5
0.2
0.1
0.1
0.0
0.1
0.0
0.1
Chi
na0.
20.
20.
30.
30.
40.
40.
20.
2
Col
ombi
a4.
64.
43.
23.
30.
50.
50.
90.
9
Cos
ta R
ica
0.9
0.9
1.8
1.8
3.3
3.4
4.5
4.7
Mex
ico
0.3
0.3
0.1
0.1
Ecua
dor
90.1
90.4
91.7
91.6
92.9
92.7
91.4
91.2
Philip
pine
s0.
60.
72.
52.
52.
52.
62.
82.
8
Pana
ma
3.2
3.2
0.5
0.5
0.0
0.1
Impo
rts
from
dev
elop
ing
coun
trie
s10
0.0
100.
010
0.0
100.
010
0.0
100.
010
0.0
100.
0
Shar
e of
dev
elop
ing
coun
trie
s in
tot
al i
mpo
rts
from
non
-CIS
cou
ntri
es97
.897
.599
.899
.810
0.0
100.
010
0.0
100.
0
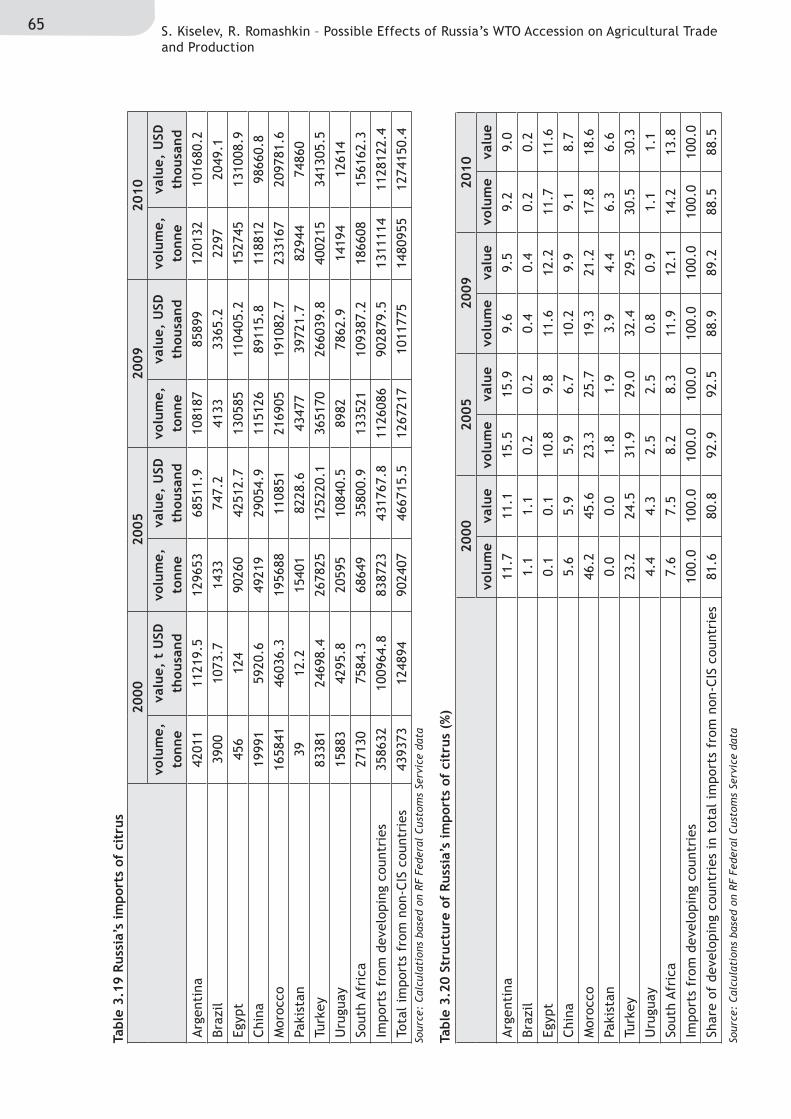
65 S. Kiselev, R. Romashkin – Possible Effects of Russia’s WTO Accession on Agricultural Trade and Production
Tabl
e 3.
19 R
ussi
a’s
impo
rts
of c
itru
s
Tabl
e 3.
20 S
truc
ture
of
Russ
ia’s
impo
rts
of c
itru
s (%
)2000
2005
2009
2010
volu
me,
to
nne
valu
e, t
USD
th
ousa
ndvo
lum
e,
tonn
eva
lue,
USD
th
ousa
ndvo
lum
e,
tonn
eva
lue,
USD
th
ousa
ndvo
lum
e,
tonn
eva
lue,
USD
th
ousa
ndArg
enti
na42
011
1121
9.5
1296
5368
511.
910
8187
8589
912
0132
1016
80.2
Braz
il39
0010
73.7
1433
747.
241
3333
65.2
2297
2049
.1
Egyp
t45
612
490
260
4251
2.7
1305
8511
0405
.215
2745
1310
08.9
Chi
na19
991
5920
.649
219
2905
4.9
1151
2689
115.
811
8812
9866
0.8
Mor
occo
1658
4146
036.
319
5688
1108
5121
6905
1910
82.7
2331
6720
9781
.6
Paki
stan
3912
.215
401
8228
.643
477
3972
1.7
8294
474
860
Turk
ey83
381
2469
8.4
2678
2512
5220
.136
5170
2660
39.8
4002
1534
1305
.5
Uru
guay
1588
342
95.8
2059
510
840.
589
8278
62.9
1419
412
614
Sout
h Afr
ica
2713
075
84.3
6864
935
800.
913
3521
1093
87.2
1866
0815
6162
.3
Impo
rts
from
dev
elop
ing
coun
trie
s35
8632
1009
64.8
8387
2343
1767
.811
2608
690
2879
.513
1111
411
2812
2.4
Tota
l im
port
s fr
om n
on-C
IS c
ount
ries
4393
7312
4894
9024
0746
6715
.512
6721
710
1177
514
8095
512
7415
0.4
Sour
ce:
Cal
cula
tion
s ba
sed
on R
F Fe
dera
l C
usto
ms
Serv
ice
data
Sour
ce:
Cal
cula
tion
s ba
sed
on R
F Fe
dera
l C
usto
ms
Serv
ice
data
2000
2005
2009
2010
volu
me
valu
evo
lum
eva
lue
volu
me
valu
evo
lum
eva
lue
Arg
enti
na11
.711
.115
.515
.99.
69.
59.
29.
0
Braz
il1.
11.
10.
20.
20.
40.
40.
20.
2
Egyp
t0.
10.
110
.89.
811
.612
.211
.711
.6
Chi
na5.
65.
95.
96.
710
.29.
99.
18.
7
Mor
occo
46.2
45.6
23.3
25.7
19.3
21.2
17.8
18.6
Paki
stan
0.0
0.0
1.8
1.9
3.9
4.4
6.3
6.6
Turk
ey23
.224
.531
.929
.032
.429
.530
.530
.3
Uru
guay
4.4
4.3
2.5
2.5
0.8
0.9
1.1
1.1
Sout
h Afr
ica
7.6
7.5
8.2
8.3
11.9
12.1
14.2
13.8
Impo
rts
from
dev
elop
ing
coun
trie
s10
0.0
100.
010
0.0
100.
010
0.0
100.
010
0.0
100.
0
Shar
e of
dev
elop
ing
coun
trie
s in
tot
al i
mpo
rts
from
non
-CIS
cou
ntri
es81
.680
.892
.992
.588
.989
.288
.588
.5
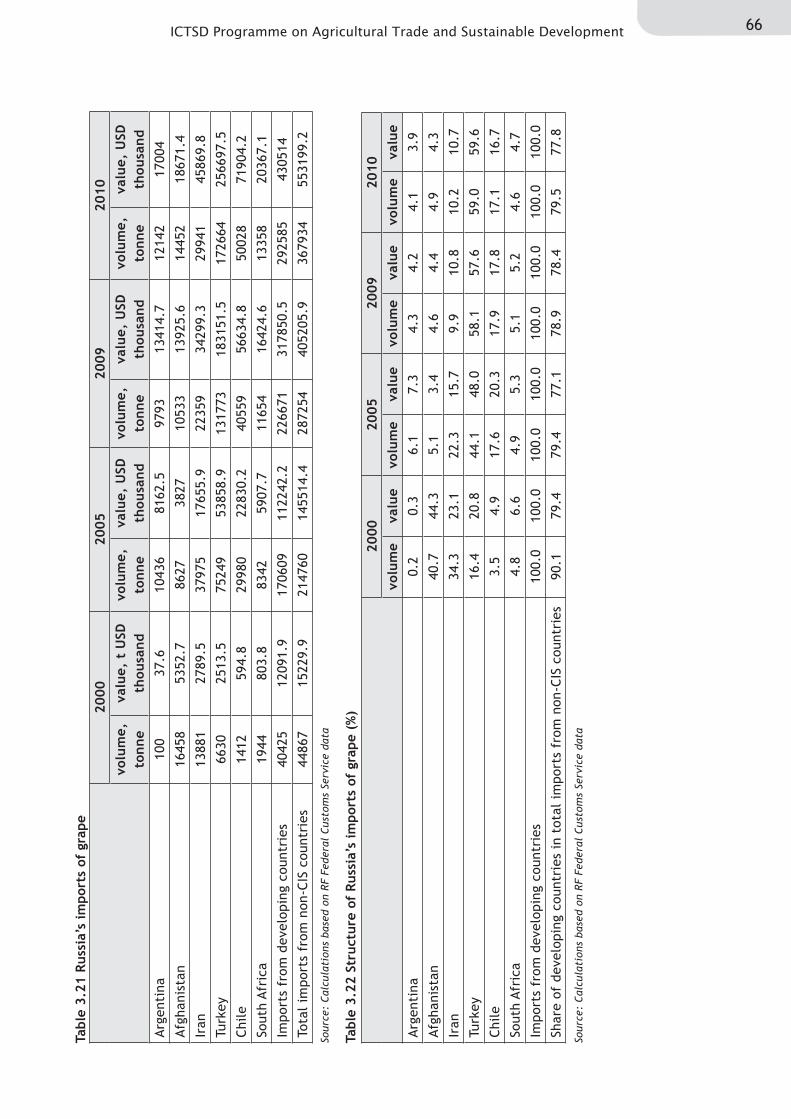
66ICTSD Programme on Agricultural Trade and Sustainable Development
Tabl
e 3.
21 R
ussi
a’s
impo
rts
of g
rape
Tabl
e 3.
22 S
truc
ture
of
Russ
ia’s
impo
rts
of g
rape
(%
)2000
2005
2009
2010
volu
me,
to
nne
valu
e, t
USD
th
ousa
ndvo
lum
e,
tonn
eva
lue,
USD
th
ousa
ndvo
lum
e,
tonn
eva
lue,
USD
th
ousa
ndvo
lum
e,
tonn
eva
lue,
USD
th
ousa
ndArg
enti
na10
037
.610
436
8162
.597
9313
414.
712
142
1700
4
Afg
hani
stan
1645
853
52.7
8627
3827
1053
313
925.
614
452
1867
1.4
Iran
1388
127
89.5
3797
517
655.
922
359
3429
9.3
2994
145
869.
8
Turk
ey66
3025
13.5
7524
953
858.
913
1773
1831
51.5
1726
6425
6697
.5
Chi
le14
1259
4.8
2998
022
830.
240
559
5663
4.8
5002
871
904.
2
Sout
h Afr
ica
1944
803.
883
4259
07.7
1165
416
424.
613
358
2036
7.1
Impo
rts
from
dev
elop
ing
coun
trie
s40
425
1209
1.9
1706
0911
2242
.222
6671
3178
50.5
2925
8543
0514
Tota
l im
port
s fr
om n
on-C
IS c
ount
ries
4486
715
229.
921
4760
1455
14.4
2872
5440
5205
.936
7934
5531
99.2
Sour
ce:
Cal
cula
tion
s ba
sed
on R
F Fe
dera
l C
usto
ms
Serv
ice
data
Sour
ce:
Cal
cula
tion
s ba
sed
on R
F Fe
dera
l C
usto
ms
Serv
ice
data
2000
2005
2009
2010
volu
me
valu
evo
lum
eva
lue
volu
me
valu
evo
lum
eva
lue
Arg
enti
na0.
20.
36.
17.
34.
34.
24.
13.
9
Afg
hani
stan
40.7
44.3
5.1
3.4
4.6
4.4
4.9
4.3
Iran
34.3
23.1
22.3
15.7
9.9
10.8
10.2
10.7
Turk
ey16
.420
.844
.148
.058
.157
.659
.059
.6
Chi
le3.
54.
917
.620
.317
.917
.817
.116
.7
Sout
h Afr
ica
4.8
6.6
4.9
5.3
5.1
5.2
4.6
4.7
Impo
rts
from
dev
elop
ing
coun
trie
s10
0.0
100.
010
0.0
100.
010
0.0
100.
010
0.0
100.
0
Shar
e of
dev
elop
ing
coun
trie
s in
tot
al i
mpo
rts
from
non
-CIS
cou
ntri
es90
.179
.479
.477
.178
.978
.479
.577
.8
SELECTED ICTSD ISSUE PAPERS Agriculture Trade and Sustainable Development The Impact of US Biofuel Policies on Agricultural Price Levels and Volatility. By Bruce Babcock. Issue Paper No. 35, 2011.Risk Management in Agriculture and the Future of the EUʼs Common Agricultural Policy. By Stefan Tangermann. Issue Paper No. 34, 2011.Policy Solutions To Agricultural Market Volatility: A Synthesis. By Stefan Tangermann. Issue Paper No. 33, 2011.Composite Index of Market Access for the Export of Rice from the United States. By Eric Wailes. Issue Paper No. 32, 2011.Composite Index of Market Access for the Export of Rice from Thailand. By T. Dechachete. Issue Paper No. 31, 2011.Composite Index of Market Access for the Export of Poultry from Brazil. By H. L. Burnquist, C. C. da Costa, M. J. P. de Souza, L. M. Fassarella. Issue Paper No. 30, 2011.How Might the EUʼs Common Agricultural Policy Affect Trade and Development After 2013? By A. Matthews. Issue Paper No. 29, 2010.Food Security, Price Volatility and Trade: Some Reflections for Developing Countries. By Eugenio Díaz-Bonilla and Juan Francisco Ron. Issue Paper No. 28, 2010.Composite Index of Market Access for the Export of Rice from Uruguay. By Carlos Perez Del Castillo and Daniela Alfaro. Issue Paper No. 27, 2010.How Would A Trade Deal On Cotton Affect Exporting And Importing Countries? By Mario Jales. Issue Paper No. 26, 2010.Simulations on the Special Safeguard Mechanism: A Look at the December Draft Agriculture Modalities. By Raul Montemayor. Issue Paper No. 25, 2010.Competitiveness and Sustainable DevelopmentThe Role of International Trade, Technology and Structural Change in Shifting Labour Demands in South Africa. By H. Bhorat, C. van der Westhuizen and S.Goga. Issue Paper No. 17, 2010.Trade Integration and Labour Market Trends in India: an Unresolved Unemployment Problem. By C.P. Chandrasekhar. Issue Paper No. 16, 2010.The Impact of Trade Liberalization and the Global Economic Crisis on the Productive Sectors, Employment and Incomes in Mexico. By A. Puyana. Issue Paper No. 15, 2010.Globalization in Chile: A Positive Sum of Winners and Losers. By V. E. Tokman. Issue Paper No. 14, 2010.Practical Aspects of Border Carbon Adjustment Measures – Using a Trade Facilitation Perspective to Assess Trade Costs. By Sofia Persson. Issue Paper No.13, 2010.Trade, Economic Vulnerability, Resilience and the Implications of Climate Change in Small Island and Littoral Developing Economies. By Robert Read. Issue Paper No.12, 2010.The Potential Role of Non Traditional Donors ʻAid in Africa. By Peter Kragelund. Issue Paper No.11, 2010.Aid for Trade and Climate Change Financing Mechanisms: Best Practices and Lessons Learned for LDCs and SVEs in Africa. By Vinaye Dey Ancharaz. Issue Paper No.10, 2010.Resilience Amidst Rising Tides: An Issue Paper on Trade, Climate Change and Competitiveness in the Tourism Sector in the Caribbean. By Keron Niles. Issue Paper No. 9, 2010.Dispute Settlement and Legal Aspects of International TradeConflicting Rules and Clashing Courts. The Case of Multilateral Environmental Agreements, Free Trade Agreements and the WTO. By Pieter Jan Kuijper. Issue Paper No.10, 2010.Burden of Proof in WTO Dispute Settlement: Contemplating Preponderance of the Evidence. By James Headen Pfitzer and Sheila Sabune. Issue Paper No. 9, 2009.Suspension of Concessions in the Services Sector: Legal, Technical and Economic Problems. By Arthur E. Appleton. Issue Paper No. 7, 2009.Trading Profiles and Developing Country Participation in the WTO Dispute Settlement System. By Henrik Horn, Joseph Francois and Niklas Kaunitz. Issue Paper No. 6, 2009.Fisheries, International Trade and Sustainable DevelopmentThe Importance of Sanitary and Phytosanitary Measures to Fisheries Negotiations in Economic Partnership Agreements. By Martin Doherty. Issue Paper No. 7, 2008.Fisheries, Aspects of ACP-EU Interim Economic Partnership Agreements: Trade and Sustainable Development Implications. By Liam Campling. Issue Paper No. 6, 2008.Fisheries, International Trade and Sustainable Development. By ICTSD. Policy Discussion Paper, 2006.Innovation, Technology and Intellectual PropertyThe Influence of Preferential Trade Agreements on the Implementation of Intellectual Property Rights in Developing Countries. By Ermias Tekeste Biadgleng and Jean-Christophe Maur. Issue Paper No. 33, 2011. Intellectual Property Rights and International Technology Transfer to Address Climate Change: Risks, Opportunities and Policy Options. By K. E. Maskus and R. L. Okediji. Issue Paper No. 32, 2010Intellectual Property Training and Education: A Development Perspective. By Jeremy de Beer and Chidi Oguamanam. Issue Paper No. 31, 2010.An International Legal Framework for the Sharing of Pathogens: Issues and Challenges. By Frederick M. Abbott. Issue Paper No. 30, 2010.Sustainable Development In International Intellectual Property Law – New Approaches From EU Economic Partnership Agreements? By Henning GrosseRuse – Khan. Issue Paper No. 29, 2010.Trade in Services and Sustainable DevelopmentFacilitating Temporary Labour Mobility in African Least-Developed Countries: Addressing Mode 4 Supply-Side Constraints. By Sabrina Varma. Issue Paper No.10, 2009.Advancing Services Export Interests of Least-Developed Countries: Towards GATS Commitments on the Temporary Movement of natural Persons for the Supply of Low-Skilled and Semi-Skilled Services. By Daniel Crosby, Issue Paper No. 9, 2009.Maritime Transport and Related Logistics Services in Egypt. By Ahmed F. Ghoneim, and Omneia A. Helmy. Issue Paper No. 8, 2007.Environmental Goods and Services ProgrammeHarmonising Energy Efficiency Requirements – Building Foundations for Co-operative Action. By Rod Janssen. Issue Paper No. 14, 2010Climate-related single-use environmental goods. By Rene Vossenaar. Issue Paper No.13, 2010.Technology Mapping of the Renewable Energy, Buildings, and transport Sectors: Policy Drivers and International Trade Aspects: An ICTSD Synthesis Paper. By Renee Vossenaar and Veena Jha. Issue Paper No.12, 2010.Trade and Sustainable EnergyInternational Transport, Climate Change and Trade: What are the Options for Regulating Emissions from Aviation and Shipping and what will be their Impact on Trade? By Joachim Monkelbaan. Background Paper, 2010.Climate Change and Trade on the Road to Copenhagen. Policy Discussion Paper, 2009.Trade, Climate Change and Global Competitiveness: Opportunities and Challenge for Sustainable Development in China and Beyond. By ICTSD. Selected Issue Briefs No. 3, 2008.Intellectual Property and Access to Clean Energy Technologies in Developing Countries: An Analysis of Solar Photovoltaic, Biofuel and Wind Technologies. By John H. Barton. Issue Paper No. 2, 2007.Regionalism and EPAsQuestions Juridiques et Systémiques Dans les Accords de Partenariat économique : Quelle Voie Suivre à Présent ? By Cosmas Milton Obote Ochieng. Issue Paper No. 8, 2010.Rules of Origin in EU-ACP Economic Partnership Agreements. By Eckart Naumann. Issue Paper No. 7, 2010SPS and TBT in the EPAs between the EU and the ACP Countries. By Denise Prévost. Issue Paper No. 6, 2010.Los acuerdos comerciales y su relación con las normas laborales: Estado actual del arte. By Pablo Lazo Grandi. Issue Paper No. 5, 2010.Revisiting Regional Trade Agreements and their Impact on Services and Trade. By Mario Marconini. Issue Paper No. 4, 2010.Trade Agreements and their Relation to Labour Standards: The Current Situation. By Pablo Lazo Grandi. Issue Paper No. 3, 2009.Global Economic Policy and InstitutionsThe Microcosm of Climate Change Negotiations: What Can the World Learn from the European Union? By Håkan Nordström, Issue Paper No. 1, 2009.
These and other ICTSD resources are available at http://www.ictsd.org
ICTSD’s Programme on Agricultural Trade and Sustainable Development aims to promote food security, equity and environmental sustainability in agricultural trade. Publications include:
• Post-2013 EU Common Agricultural Policy, Trade and Development: A Review of Legislative Proposals. By Alan Matthews. Issue paper No. 39, 2011.
• Improving the International Governance of Food Security and Trade. By Manzoor Ahmad. Issue Paper No. 38, 2011.
• Food Reserves in Developing Countries: Trade Policy Options for Improved Food Security. By C. L. Gilbert, Issue Paper No. 37, 2011.
• Global Food Stamps: An Idea Worth Considering? By Tim Josling, Issue Paper No. 36, 2011.
• Risk Management in Agriculture and the Future of the EU’s Common Agricultural Policy. By Stefan Tangermann, Issue Paper No. 34, 2011.
• Policy Solutions To Agricultural Market Volatility: A Synthesis. By Stefan Tangermann, Issue Paper No. 33, 2011.
• Composite Index of Market Access for the Export of Rice from the United States. By Eric Wailes. Issue Paper No. 32, 2011.
• Composite Index of Market Access for the Export of Rice from Thailand. By T. Dechachete. Issue Paper No. 31, 2011.
• Composite Index of Market Access for the Export of Poultry from Brazil. By H. L. Burnquist, C. C. da Costa, M. J. P. de Souza, L. M. Fassarella. Issue Paper No. 30, 2011.
• How Might the EU’s Common Agricultural Policy Affect Trade and Development After 2013? An Analysis of the European Commission’s November 2010 Communication. By Alan Matthews. Issue Paper No. 29, 2010.
• Food Security, Price Volatility and Trade: Some Reflections for Developing Countries. By Eugenio Díaz-Bonilla and Juan Francisco Ron. Issue Paper No. 28, 2010.
• Composite Index of Market Access for the Export of Rice from Uruguay. By Carlos Perez Del Castillo and Daniela Alfaro. Issue Paper No. 27, 2010.
• How Would A Trade Deal On Cotton Affect Exporting And Importing Countries? By Mario Jales. Issue Paper No. 26, 2010.
• Simulations on the Special Safeguard Mechanism: A Look at the December 2008 Draft Agriculture Modalities. By Raul Montemayor. Issue Paper No. 25, 2010.
• How Would a Trade Deal on Sugar Affect Exporting and Importing Countries? By Amani Elobeid. Issue Paper No. 24, 2009.
• Constructing a Composite Index of Market Acess. By Tim Josling. Issue Paper No. 23, 2009.
• Comparing safeguard measures in regional and bilateral agreements. By Paul Kruger, Willemien Denner and JB Cronje. Issue Paper No. 22, 2009.
• How would a WTO agreement on bananas affect exporting and importing countries? By Giovanni Anania. Issue Paper No. 21, 2009.
• Biofuels Subsidies and the Law of the World Trade Organisation. By Toni Harmer. Issue Paper No. 20, 2009.
• Biofuels Certification and the Law of the World Trade Organisation. By Marsha A. Echols. Issue Paper No. 19, 2009.
About the International Centre for Trade and Sustainable Development, www.ictsd.org Founded in 1996, the International Centre for Trade and Sustainable Development (ICTSD) is an independent think-and-do-tank based in Geneva, Switzerland and with operations throughout the world. Out-posted staff in Brazil, Mexico, Costa Rica, Senegal, Canada, Russia, and China. By enabling stakeholders in trade policy through information, networking, dialogue, well-targeted research and capacity-building, ICTSD aims to influence the international trade system so that it advances the goal of sustainable development. ICTSD co-implements all of its programme through partners and a global network of hundreds of scholars, researchers, NGOs, policy-makers and think-tanks around the world.
www.ictsd.org


![Accession to the WTO - WHO · © WTO - OMC 2004 Accession to the WTO ... WORLD TRADE ORGANIZATION ... Microsoft PowerPoint - WHOpres.ppt [Read-Only] Author:](https://img.pdfslide.us/doc/110x75/5aea95b97f8b9a90318bd175/accession-to-the-wto-wto-omc-2004-accession-to-the-wto-world-trade-organization.jpg)