Embed Size (px)
Citation preview
WP/04/36
China: International Trade and WTO Accession
Thomas Rumbaugh and Nicolas Blancher
- 2 -
Contents Page I. Overview ............................................................................................................................ 3 II. China’s Trade: Growth and Diversification ...................................................................... 3
A. Increasing Role in World Trade.................................................................................... 3 B. Changes in Composition of Trade................................................................................. 4 C. Changes in Regional Pattern of Trade........................................................................... 6
III. WTO Accession: Commitments, Opportunities, and Risks............................................. 7
A. China’s Commitments................................................................................................... 7 B. Implementation.............................................................................................................. 9 C. Market Access Prospects............................................................................................. 10 D. Potential Implications of China’s Increased Role in World Trade ............................. 12
References............................................................................................................................ 23 Boxes 1. Some Historical Perspectives on Growth in China’s Trade.............................................. 5 2. Selected Aspects of China’s WTO Accession .................................................................. 8 3. China’s WTO Accession and Its Trade in Textiles and Clothing................................... 11 4. International Impact of China’s WTO Accession.................................................................13 Tables 1. Share in World Exports ....................................................................................................15 2. Market Share in Major Export Markets ............................................................................15 3. Sources of Imports ............................................................................................................15 4. Exports of Selected Countries to China ............................................................................16 5. Indicators of Export Dispersion ........................................................................................16 6. Indicators of Export Dispersion to the United States........................................................17 7. China: Bilateral Trade Balances with Selected Countries ................................................18 8. China: Tariffs, 1982–2002................................................................................................18 Figures 1. Growth in Trade, 1970–2002............................................................................................19 2. Trade in East Asian Region ..............................................................................................20 3. Trade in Electronic Products.............................................................................................21 4. United States: Imports of Manufactured Goods from Selected Asian Countries .............22
- 3 -
I. OVERVIEW
China’s integration with the global economy has contributed to sustained growth in international trade. Both its exports and imports have grown faster than world trade for more than twenty years. Although dramatic, these growth rate are not unprecedented, and are similar to those seen earlier during the integration of other rapidly developing economies into the global trading system. As China’s trade with the rest of the world has deepened, its composition and geographical pattern have also shifted. Its overall share of exports to industrial economies has increased and become more diversified. China has also become increasingly important within the Asian regional economy. Vertical specialization of production within Asia has led to an increasing share of China’s imports coming from within the region, and China is now among the most important export destinations for other Asian countries.
Trade reforms and commitments made as part of China’s accession to the World Trade Organization (WTO) have been crucial in promoting its integration with the global trading system. These reforms, which took place over a 15-year period, have included substantial tariff reductions and the dismantling of most nontariff barriers (NTBs). Improved market access following WTO accession has also been important. Continued implementation of WTO commitments in the coming years will further facilitate China’s ongoing integration with the global economy and generate benefits for most partner countries. However, it may also pose significant challenges for the authorities; and the extensive safeguard provisions under the WTO agreement represent a downside risk that could constrain China’s export growth in the future.
II. CHINA’S TRADE: GROWTH AND DIVERSIFICATION
A. Increasing Role in World Trade
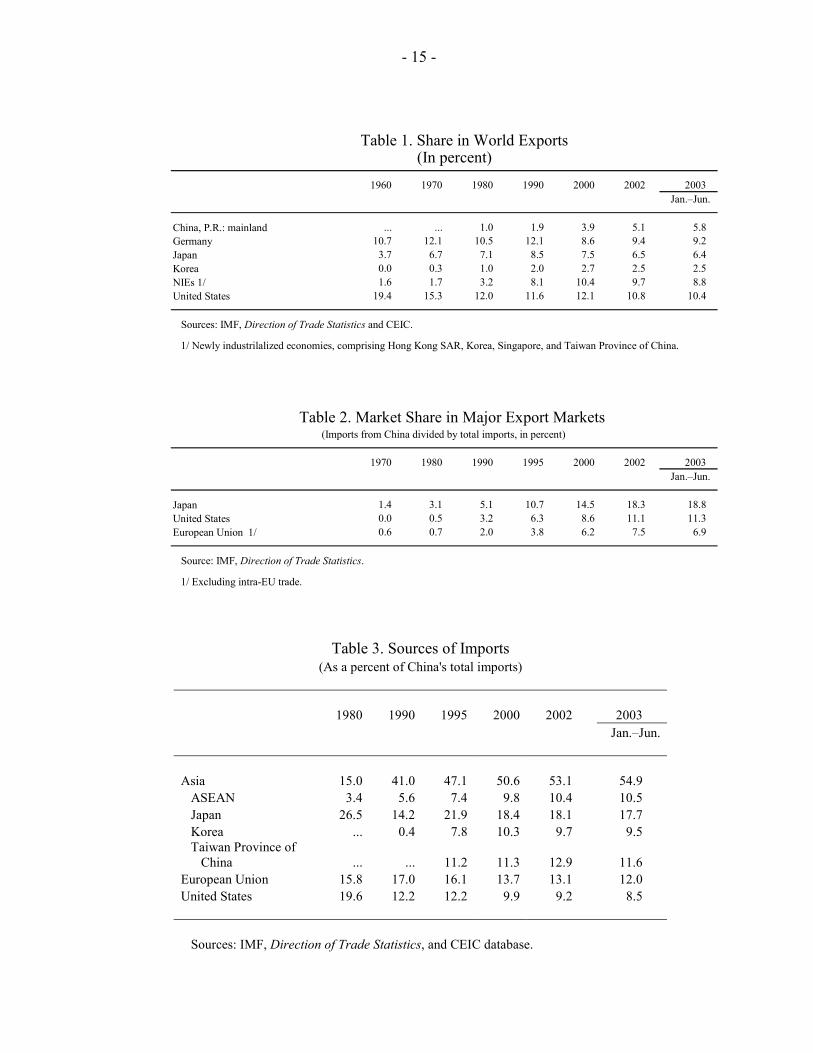
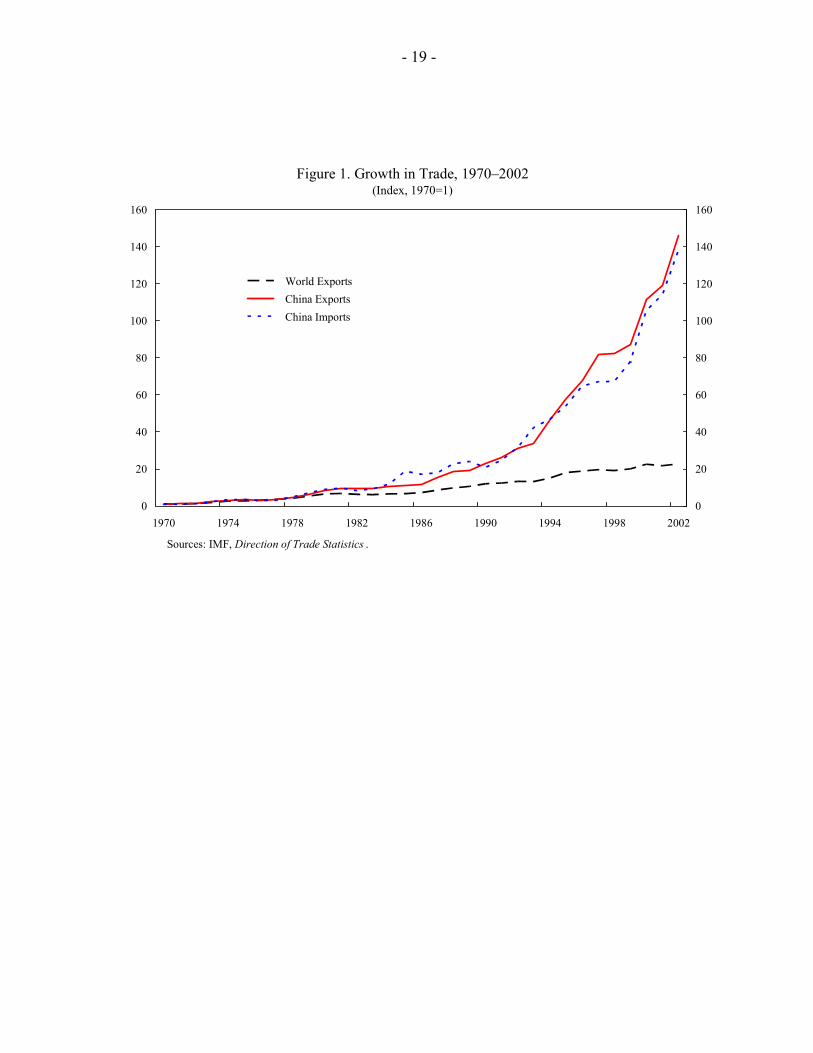
China’s international trade has expanded steadily since the opening of the economy in 1979. Exports and imports have grown faster than world trade for more than 20 years and China’s share in global trade has increased steadily since 1979 (Table 1 and Figure 1). This process began relatively slowly in the 1980s after the relaxation of pervasive and complex import and export controls, but accelerated in the 1990s with broader trade reforms, including significant tariff reductions.
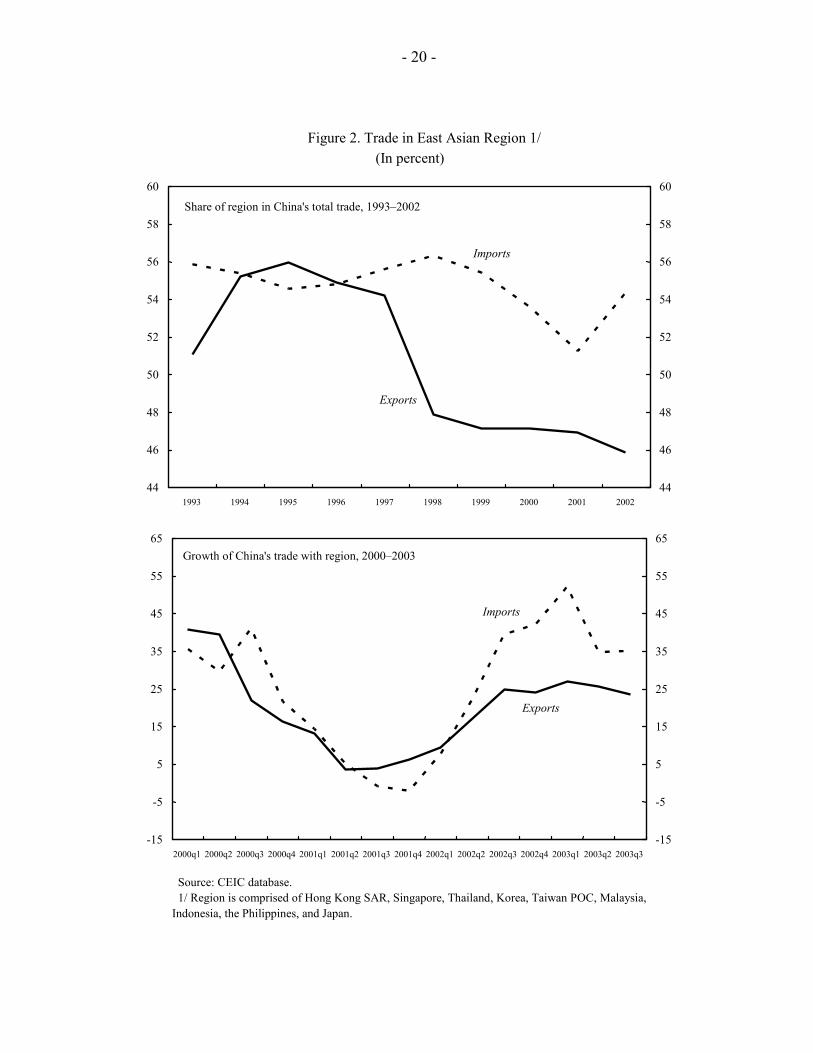
China has increased its penetration into advanced country markets, and has simultaneously become a more important export destination, especially for regional economies. The share of advanced country imports accounted for by China has risen over the last two decades, with particularly sharp increases since the early 1990s in Japan, the United States, and the European Union (Table 2). China’s role in Asian regional trade has also become increasingly important. A rising share of its imports come from within the region, and China is now among the most important export destinations for other Asian countries (Table 3 and Figure 2). For example, China now accounts for over 11 percent of Japan’s exports, up from only 2 percent in 1990. While most of the dramatic increases in exports to China have occurred from within the Asian region, the share of exports from the
- 4 -
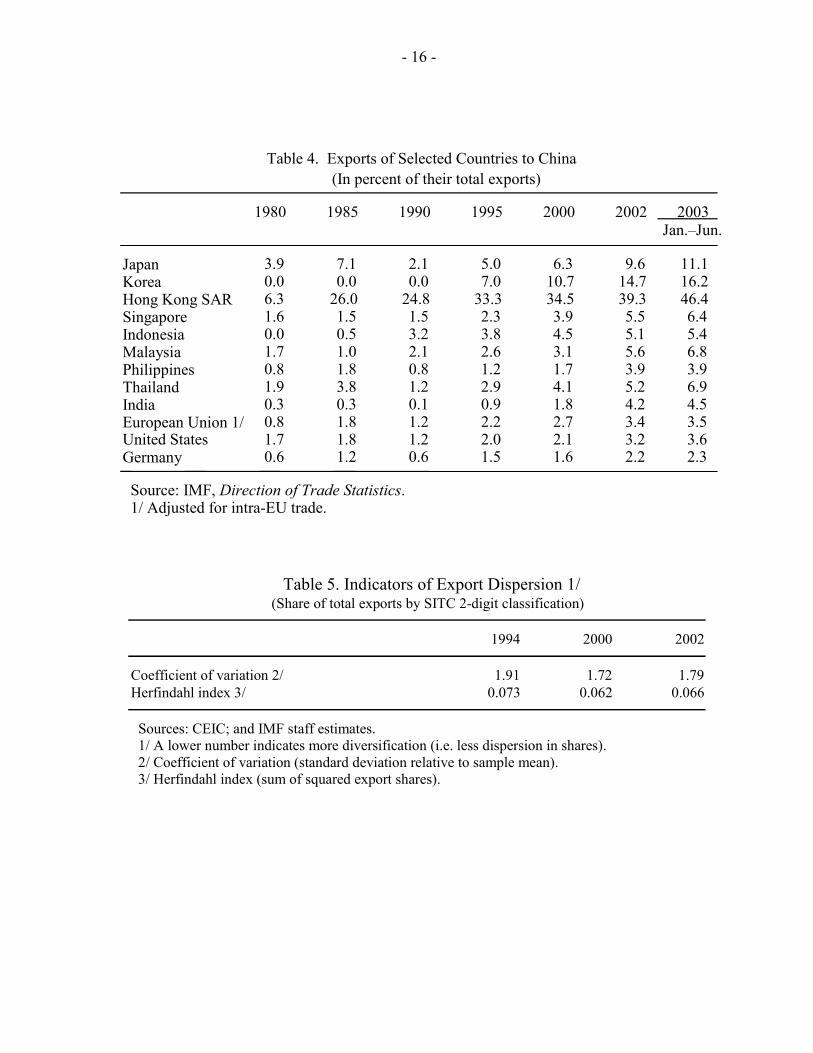
United States and the European Union that go to China have also increased, from 1 percent in 1990 to 3½ in 2002 (Table 4).
China’s integration with the world economy is a landmark event with implications for both the global and regional economies. However, it is not unprecedented in either its scope or speed. The earlier experiences of Japan and the newly industrializing economies (NIEs) of Asia were similar in terms of their rate of growth of exports as well as with respect to their increasing share in world exports over an extended period (see Box 1). This historical evidence, together with the still substantial development potential of the country, suggests that China could maintain relatively strong export growth for a number of years going forward, provided that its growth momentum is not upset by the prevailing economic and political vulnerabilities.
B. Changes in Composition of Trade
China’s export base has diversified from an initial heavy reliance on textiles and other light manufacturing. In the early 1990s, light manufacturing accounted for more than 40 percent of China’s exports. These products largely consisted of footwear, clothing, toys, and other miscellaneous manufactured articles. A large part of the remaining exports was accounted for by manufactured goods (mostly textiles) and machinery and transport (small electronics). In recent years, China has made substantial gains in other export categories including more sophisticated electronics (office machines and automated data processing equipment, telecommunications and sound equipment, and electrical machinery), furniture, travel goods, and industrial supplies. For example, the proportion of China’s exports represented by machinery and transport (which includes electronics) increased from 17 percent in 1993 to 41 percent in 2003, while the share of miscellaneous manufacturing declined from 42 percent to 28 percent.
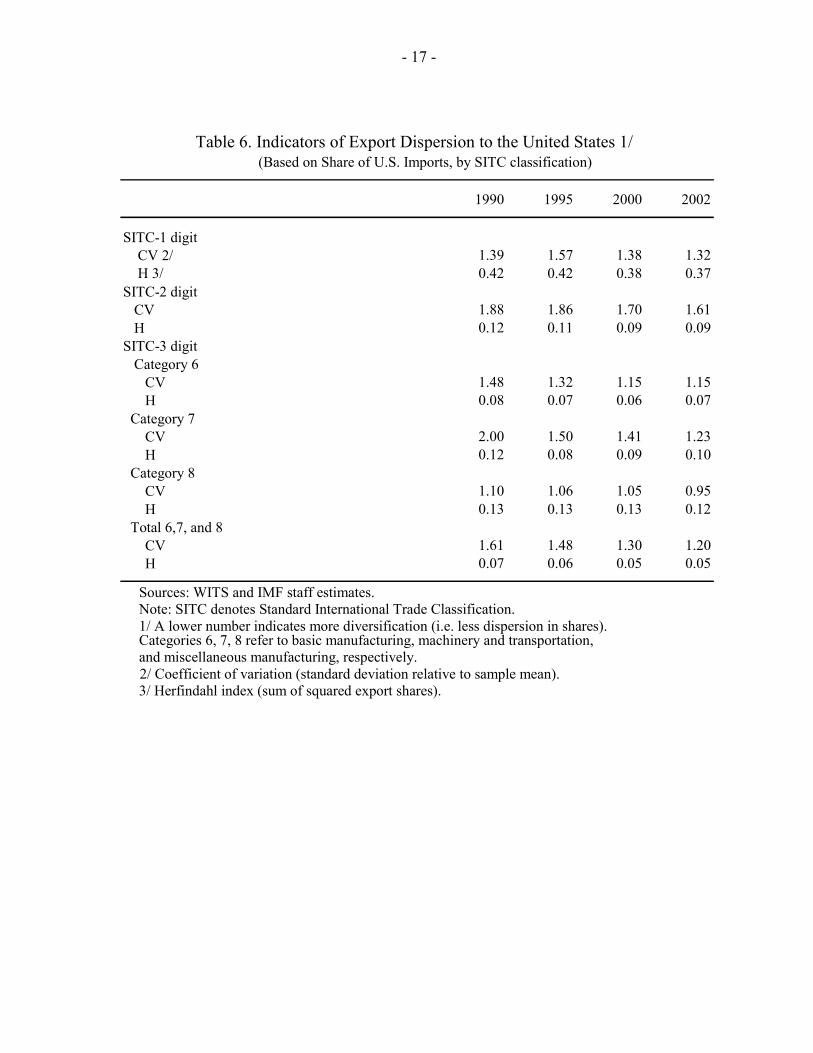
Statistical indicators of dispersion illustrate the increase in overall export diversification. Detailed data on China’s exports at the 2-digit Standard International Trade Classification (SITC) level are available only from 1994. The Herfindahl index and the coefficient of variation (which measure changes in the dispersion of export shares across categories) both indicate a significant increase in diversification between 1994 and 2000, while there was little change or even a marginal reversal during 2000–02 (Table 5). More extensive information available also indicate increased diversification of exports to the United States, the European Union, and Japan. For example, detailed U.S. import data show that based on changes in the share of U.S. imports accounted for by China, there was a significant increase in diversification between 1990 and 2000 at both the 2-digit and 3-digit levels (Table 6).
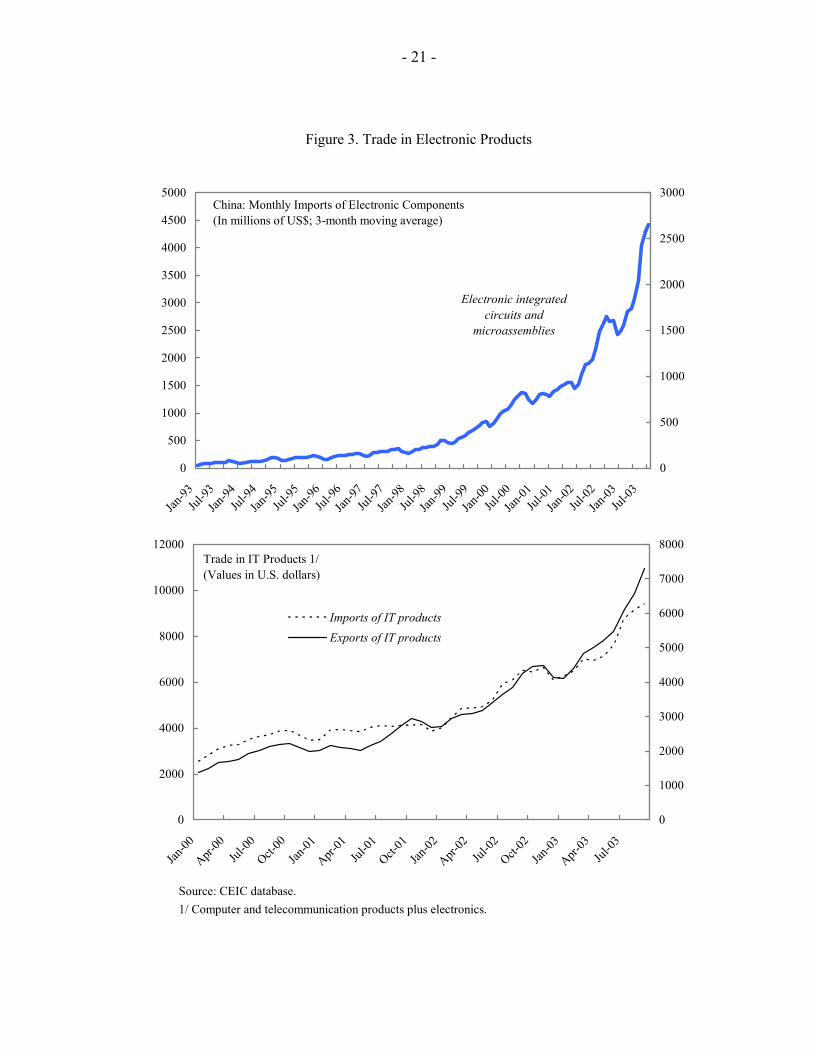
The composition of imports reflects the high degree of vertical specialization of production within the Asia region. This can be seen from several indicators. First, a high share of imports for processing is embodied in China’s exports. This ratio increased from about 35 percent of all imports in the early 1990s to about 50 percent by 1997 and has remained at about that level since then. Similarly, imports for processing are estimated to be embodied in over 40 percent of China’s exports. The impact of increased vertical
- 5 -
Box 1. Some Historical Perspectives on Growth in China’s Trade
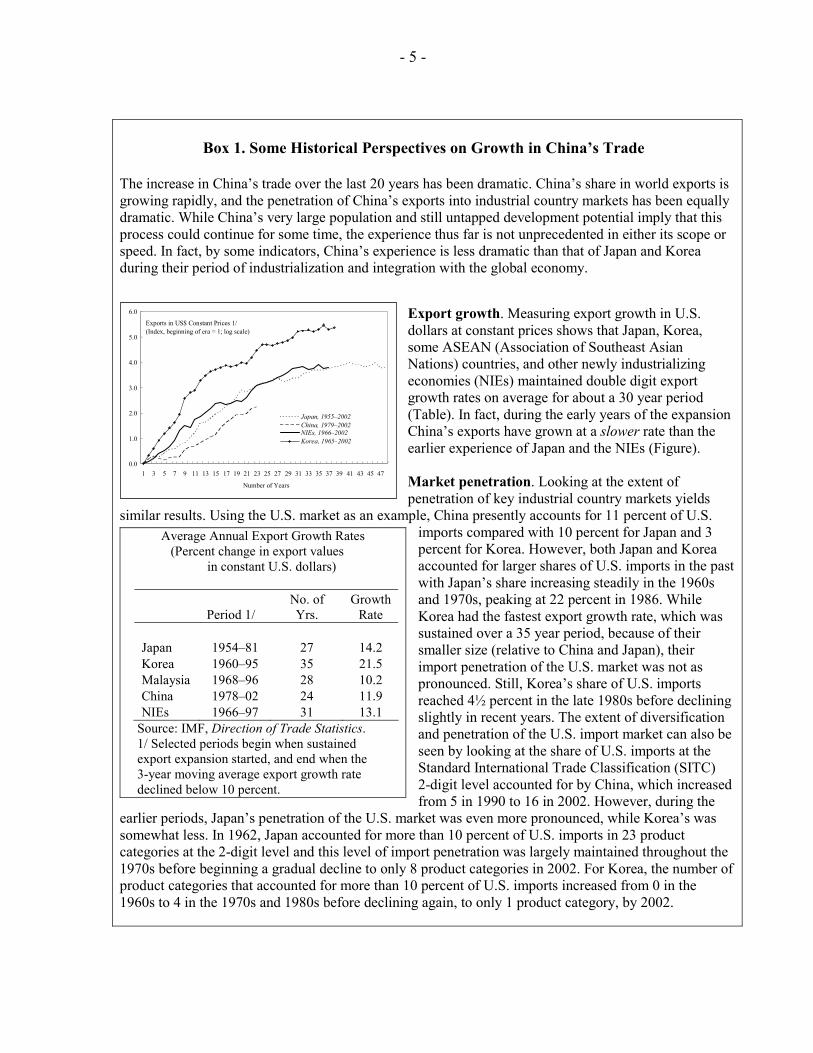
The increase in China’s trade over the last 20 years has been dramatic. China’s share in world exports is growing rapidly, and the penetration of China’s exports into industrial country markets has been equally dramatic. While China’s very large population and still untapped development potential imply that this process could continue for some time, the experience thus far is not unprecedented in either its scope or speed. In fact, by some indicators, China’s experience is less dramatic than that of Japan and Korea during their period of industrialization and integration with the global economy.
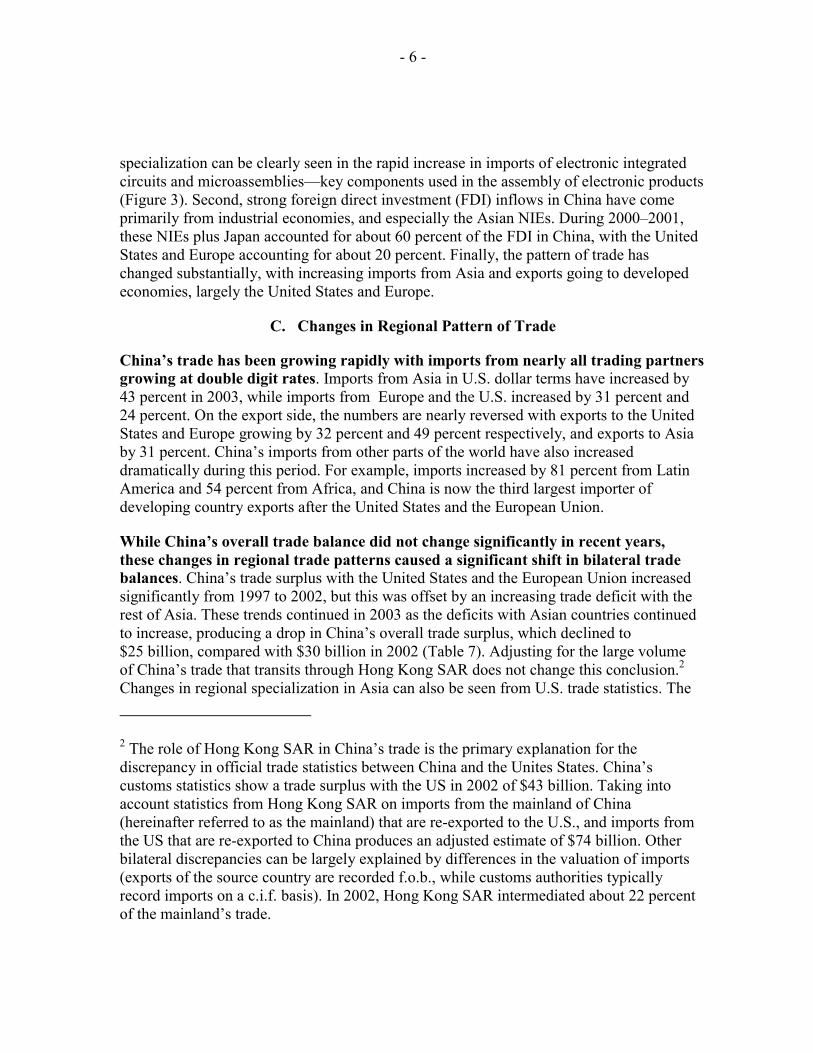
Export growth. Measuring export growth in U.S. dollars at constant prices shows that Japan, Korea, some ASEAN (Association of Southeast Asian Nations) countries, and other newly industrializing economies (NIEs) maintained double digit export growth rates on average for about a 30 year period (Table). In fact, during the early years of the expansion China’s exports have grown at a slower rate than the earlier experience of Japan and the NIEs (Figure). Market penetration. Looking at the extent of penetration of key industrial country markets yields
similar results. Using the U.S. market as an example, China presently accounts for 11 percent of U.S. imports compared with 10 percent for Japan and 3 percent for Korea. However, both Japan and Korea accounted for larger shares of U.S. imports in the past with Japan’s share increasing steadily in the 1960s and 1970s, peaking at 22 percent in 1986. While Korea had the fastest export growth rate, which was sustained over a 35 year period, because of their smaller size (relative to China and Japan), their import penetration of the U.S. market was not as pronounced. Still, Korea’s share of U.S. imports reached 4½ percent in the late 1980s before declining slightly in recent years. The extent of diversification and penetration of the U.S. import market can also be seen by looking at the share of U.S. imports at the Standard International Trade Classification (SITC) 2-digit level accounted for by China, which increased from 5 in 1990 to 16 in 2002. However, during the
earlier periods, Japan’s penetration of the U.S. market was even more pronounced, while Korea’s was somewhat less. In 1962, Japan accounted for more than 10 percent of U.S. imports in 23 product categories at the 2-digit level and this level of import penetration was largely maintained throughout the 1970s before beginning a gradual decline to only 8 product categories in 2002. For Korea, the number of product categories that accounted for more than 10 percent of U.S. imports increased from 0 in the 1960s to 4 in the 1970s and 1980s before declining again, to only 1 product category, by 2002.
Average Annual Export Growth Rates (Percent change in export values in constant U.S. dollars)
Period 1/ No. of Yrs.
Growth Rate
Japan 1954–81 27 14.2 Korea 1960–95 35 21.5 Malaysia 1968–96 28 10.2 China 1978–02 24 11.9 NIEs 1966–97 31 13.1
Source: IMF, Direction of Trade Statistics. 1/ Selected periods begin when sustained export expansion started, and end when the 3-year moving average export growth rate declined below 10 percent.
Exports in US$ Constant Prices 1/ (Index, beginning of era = 1; log scale)
0.0 1.0 2.0 3.0 4.0 5.0 6.0
1 3 5 7 9 11 13 15 17 19 21 23 25 27 29 31 33 35 37 39 41 43 45 47
Number of Years
Japan, 1955–2002China, 1979–2002NIEs, 1966–2002Korea, 1965–2002
- 6 -
specialization can be clearly seen in the rapid increase in imports of electronic integrated circuits and microassemblies—key components used in the assembly of electronic products (Figure 3). Second, strong foreign direct investment (FDI) inflows in China have come primarily from industrial economies, and especially the Asian NIEs. During 2000–2001, these NIEs plus Japan accounted for about 60 percent of the FDI in China, with the United States and Europe accounting for about 20 percent. Finally, the pattern of trade has changed substantially, with increasing imports from Asia and exports going to developed economies, largely the United States and Europe.
C. Changes in Regional Pattern of Trade
China’s trade has been growing rapidly with imports from nearly all trading partners growing at double digit rates. Imports from Asia in U.S. dollar terms have increased by 43 percent in 2003, while imports from Europe and the U.S. increased by 31 percent and 24 percent. On the export side, the numbers are nearly reversed with exports to the United States and Europe growing by 32 percent and 49 percent respectively, and exports to Asia by 31 percent. China’s imports from other parts of the world have also increased dramatically during this period. For example, imports increased by 81 percent from Latin America and 54 percent from Africa, and China is now the third largest importer of developing country exports after the United States and the European Union.
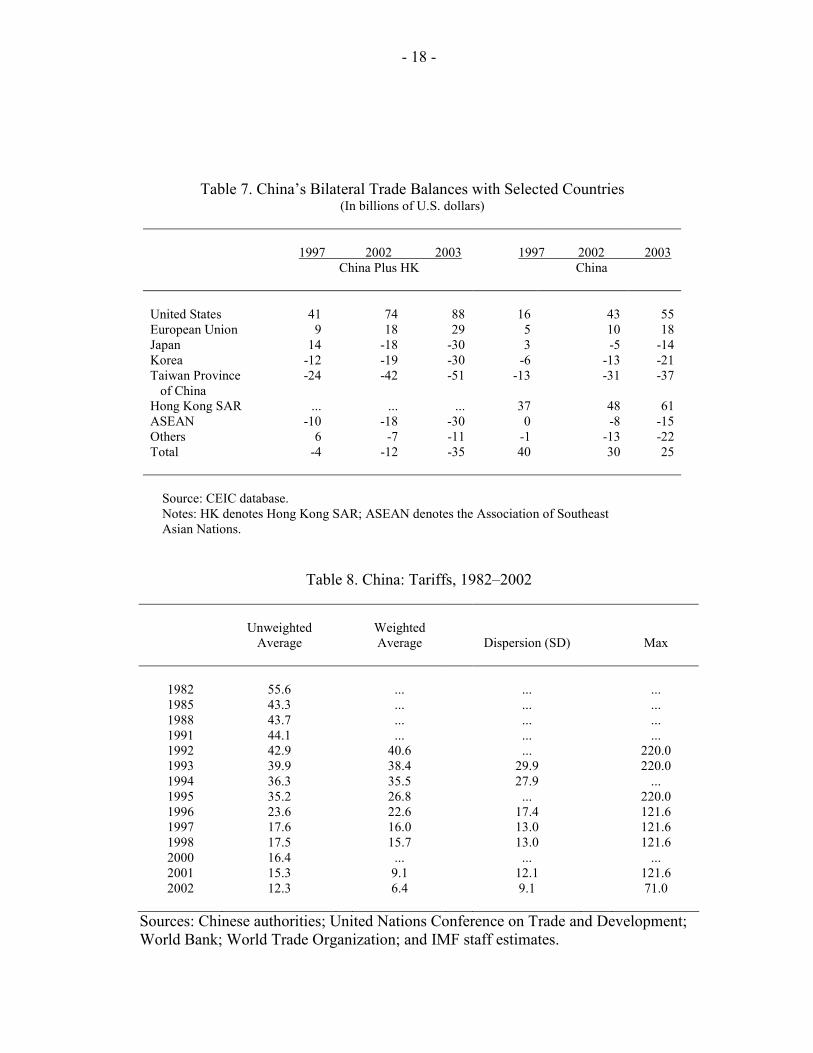
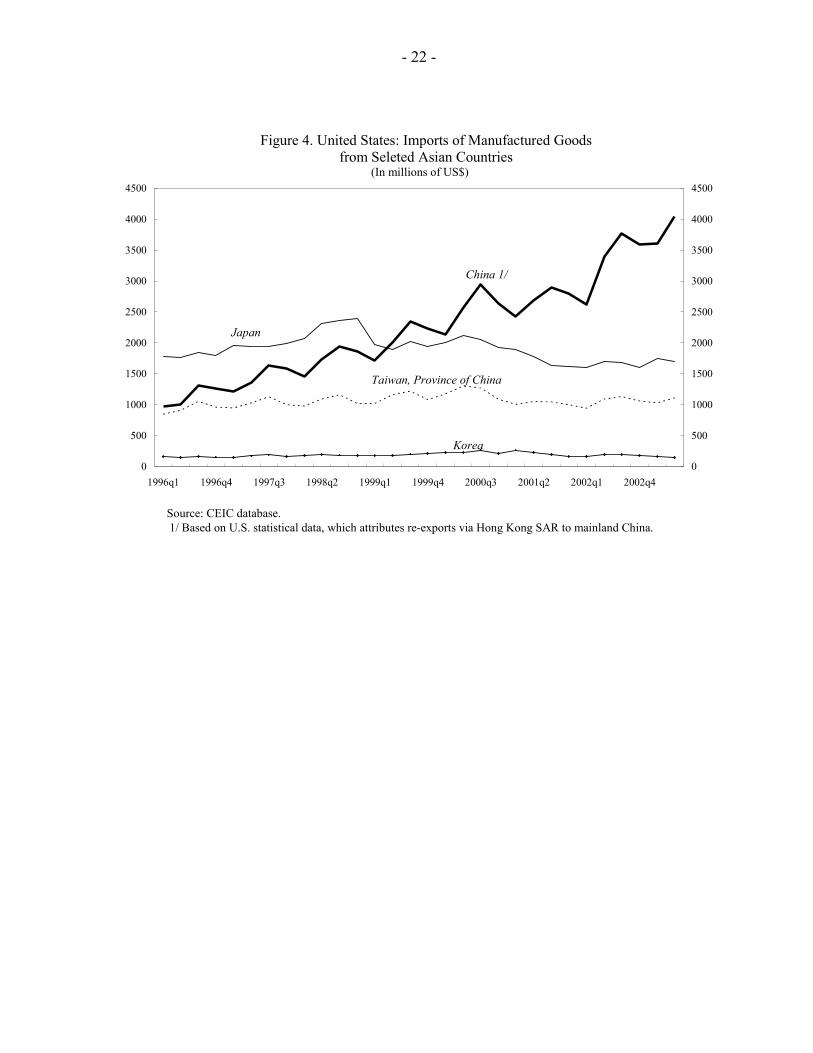
While China’s overall trade balance did not change significantly in recent years, these changes in regional trade patterns caused a significant shift in bilateral trade balances. China’s trade surplus with the United States and the European Union increased significantly from 1997 to 2002, but this was offset by an increasing trade deficit with the rest of Asia. These trends continued in 2003 as the deficits with Asian countries continued to increase, producing a drop in China’s overall trade surplus, which declined to $25 billion, compared with $30 billion in 2002 (Table 7). Adjusting for the large volume of China’s trade that transits through Hong Kong SAR does not change this conclusion.2 Changes in regional specialization in Asia can also be seen from U.S. trade statistics. The
2 The role of Hong Kong SAR in China’s trade is the primary explanation for the discrepancy in official trade statistics between China and the Unites States. China’s customs statistics show a trade surplus with the US in 2002 of $43 billion. Taking into account statistics from Hong Kong SAR on imports from the mainland of China (hereinafter referred to as the mainland) that are re-exported to the U.S., and imports from the US that are re-exported to China produces an adjusted estimate of $74 billion. Other bilateral discrepancies can be largely explained by differences in the valuation of imports (exports of the source country are recorded f.o.b., while customs authorities typically record imports on a c.i.f. basis). In 2002, Hong Kong SAR intermediated about 22 percent of the mainland’s trade.
- 7 -
U.S. trade deficit with China increased substantially over the last two years but the overall U.S. trade deficit with the Asian region increased by a smaller amount. For example, while U.S. imports of manufactured goods from China have increased substantially, this has been partly offset by declining imports from other Asian countries (Figure 4).
While the Asian region still remains dependent on exports to Group of Seven (G-7) markets, increasing specialization, as well as China’s own increased domestic consumption, are providing substantial benefits to the region.3 The countries likely to benefit the most from China’s increased integration into the global economy appear to be Asian exporters of capital- and resource-intensive products. These potential impacts are discussed further in the next section.
III. WTO ACCESSION: COMMITMENTS, OPPORTUNITIES, AND RISKS
A. China’s Commitments4
The tariff reductions planned by China in the context of its WTO accession are the continuation of a longstanding trend. This trend is reflected in the decreasing level and dispersion of tariffs and the continued reduction in NTBs, especially since the early 1990s (Table 7).5 Past reforms also introduced widespread import tariff exemptions, especially for processing trade and foreign investment, and therefore a majority of China’s imports were in effect not subject to any tariffs in 2000. As a result of the above reforms, as well as continued domestic price liberalization, domestic prices of most traded goods had largely converged with international prices by the mid-1990s.
Under its WTO commitments, China will further reduce its average tariff rate to 10 percent by 2005. On January 1, 2004, China lowered its average tariff rate by 0.6 percentage points to 10.4 percent. The overall trade regime will be increasingly tariff-based as China agreed to eliminate import quotas, licenses, designated trading practices and other non-tariff barriers. The substitution of import quotas with tariff-rate quotas (TRQs) for some agricultural commodities should also help strengthen the transparency of the trade regime.
3 While dependence on G-7 markets is still strong, it is diminishing in the face of increasing regional trade (see for example, Zebregs (2004)).
4 The accession agreement was concluded on December 11, 2002. Box 2 summarizes China’s main WTO commitments.
5 For example, while import tariffs were over 50 percent in the early 1980s, they averaged 12 percent in 2002, less than Mexico’s and less than half of India’s.
- 8 -
Box 2. Selected Aspects of China’s WTO Accession/
Trade in goods—all tariffs on imported goods are to be eliminated or reduced, mostly by 2004. Tariffs on industrial goods will be reduced to an average of 9 percent, and import quotas will be removed by 2005. Tariffs on agricultural goods will be lowered to an average of 15 percent.
Trade in services—foreign access is to be ensured through transparent and automatic licensing procedures in various sectors, including banking and insurance, legal and other professional services, telecommunications, and tourism. Specifically:
• Right to Trade and Distribution—within two years (by end-2003) foreign service suppliers will be permitted to engage in the retailing of all products; within three years (by end-2004) all firms will have the right to import and export all goods except those subject to state trading monopolies (e.g., oil or fertilizers); within five years (by end-2006), foreign firms will be allowed to distribute virtually all goods domestically.
• Banking—foreign financial institutions will be permitted to provide services without client restrictions for foreign currency business upon accession; local currency services to Chinese companies within two years (by December 2003); and services to all Chinese clients within five years (by December 2006).
Trading and investment regimes.
• National treatment/non-discrimination—Measures and practices that discriminate against imported products or foreign companies will be removed.
• Export subsidies—Upon accession, all forms of export subsidies inconsistent with WTO rules, including grants and tax breaks linked to export performance, were eliminated.
• Trade-Related Investment Measures (TRIMs)—Foreign investment approvals will no longer be subject to mandatory requirements (e.g., technology transfer or local content requirements).
• Trade-Related Aspects of Intellectual Property Rights (TRIPs)—China will enforce the rights protecting intellectual property within China.
• Agricultural subsidies—China has agreed to limit domestic agricultural subsidies to 8.5 percent of the value of production (i.e. less than the 10 percent limit allowed for developing countries under the WTO Agreement on Agriculture), and to eliminate all agricultural export subsidies upon WTO entry.
Trading partner safeguards.
• Transitional product-specific safeguard mechanism—As provided under the WTO Agreement on Safeguards, a country may impose restrictions on imports if it can demonstrate that they cause or threaten to cause serious injury to domestic firms producing similar products.
• Special safeguard mechanism for China’s textile and clothing exports (see Box 3).
• Anti-dumping. Under WTO agreement, other members can invoke “non-market economy” provisions to determine dumping cases for 15 years following accession. Non-market economy provisions imply that domestic prices cannot be used as a reference point and make it much easier to reach a positive finding in an antidumping investigation.
______________ 1/ A more complete description of the terms of China’s WTO accession is available at http://www.wto.org/english/news_e/pres01_e/pr252_e.htm.
- 9 -
In contrast with the continuity in tariff reductions, China’s commitments on trade in services represent a milestone.6 Plans include the opening of key services sectors where foreign participation was previously nonexistent or marginal, notably telecommunications, financial services and insurance. In those sectors, full access will eventually be guaranteed to foreign providers through transparent and automatic licensing procedures. China will also remove restrictions on trading and domestic distribution for most products.7
Apart from market access, the accession protocol lays out China’s major commitments on trade-related activities, such as the national treatment and non discrimination principles, and as provided under the Trade-Related Investment Measures (TRIMs) and Trade-Related Aspects of Intellectual Property Rights (TRIPs) which China has agreed to implement in full upon accession. Compliance with such commitments is likely to have far-reaching implications domestically, including by encouraging greater internal integration of domestic markets (through the removal of inter-provincial barriers), as well as by enhancing the predictability of the business environment.
B. Implementation
A special WTO procedure, the Transitional Review Mechanism (TRM), was established to review China’s compliance with the WTO agreement. China’s Protocol of Accession provides that the TRM will review China’s compliance on an annual basis in the first eight years of WTO membership. Reviews are conducted separately by sixteen WTO sectoral councils.8 Rather than simple “pass or fail” tests, these reviews are opportunities for stock-taking on past progress and areas for further efforts.
No major source of contention has emerged with regard to China’s early implementation of its commitments. Concerns have been expressed by some of China’s trade partners in certain specific areas (e.g., within the agricultural or financial sectors, or with regard to intellectual property), related in particular to delays in implementation, or to transparency of the legal framework and enforcement issues. However, as of end 2003, no formal complaint within the WTO had been filed against China, and a widely-shared
6 Indeed, some observers have argued that they represent the most radical services reform program negotiated in the WTO to date (Mattoo, 2002).
7 According to its WTO accession protocol, China will maintain (i) import state trading for wheat, corn, rice, vegetable oils, sugar, tobacco, crude and processed oils, chemical fertilizers and cotton; and, (ii) export state trading for tea, rice, corn, soybeans, coal, crude and processed oils, silk and unbleached silk, a variety of cotton products, and several kinds of tungsten and ammonium products.
8 E.g., on agriculture, trade in services, technical barriers to trade or trade-related aspects of intellectual property rights (TRIPS) (see documents available at www.wto.org).
- 10 -
assessment is that the above problems reflect primarily technical difficulties, and not a broad pattern of non-compliance.
While key changes have indeed already been implemented since China’s WTO accession, compliance will be continually tested in the period ahead. Tariff reductions have taken effect as scheduled and the elimination of non-tariff barriers (especially in the agricultural sector) is proceeding. A number of fundamental changes to China’s legal and regulatory frameworks at the central government level have been made to comply with WTO principles. For example, eextensive upgrading of the foreign direct investment regime has been implemented, with the elimination of requirements related to foreign currency financing, local content or export performance. Nevertheless, China’s commitments imply a need to ensure adequate enforcement of new rules at all levels, especially the provincial and municipal levels, where administrative and judicial capacity constraints, as well as the potential role of vested interests, may hamper progress (e.g., in eliminating restrictive practices such as the pervasive inter-provincial taxes, fees and other non-tariff obstacles).
C. Market Access Prospects
Increased market access overseas is the most immediate benefit from WTO accession for China. China is permanently granted most-favored-nation (MFN) treatment by other WTO members, a significant step toward normalizing its trade relations.9 Also, upon accession, several trading partners have eliminated many of their restrictions on imports from China. Easier access to foreign markets is likely to boost China’s labor-intensive exports in a number of sectors, including electronics. In particular, China’s WTO accession will lead to the removal of quotas against its textiles and clothing exports. While it is expected that this removal will generate a significant boost to China’s exports, its timing remains uncertain as a result of the specific safeguards provisions incorporated in China’s accession protocol (Box 3).
China will also benefit from the treatment of future trade conflicts within the multilateral dispute settlement procedures under the WTO. This should help China better promote its trade interests, benefit from greater reciprocity in trade conflict resolution, and limit the scope for other WTO members to unilaterally impose antidumping protections against its products.
9 The impact of this change might appear limited since many countries had already granted MFN access to China before its WTO accession. However, in practice, the fact that the U.S. will no longer subject such treatment to annual reviews by the U.S. Congress may substantially improve investor confidence on future export prospects.
- 11 -
Box 3. China’s WTO Accession and Its Trade in Textiles and Clothing
The phasing out of quotas on textile and clothing exports from developing countries under the Uruguay Round Agreement on Textiles and Clothing (ATC) will change the competitive position of textile and clothing exporters. These quotas are bilateral and the extent of their restrictiveness vary from country to country. Countries that have been facing more stringent quota restrictions will become more competitive after the quotas are phased out under the ATC, while those that have been less restricted by quotas may find it difficult to maintain their market share. Since most of the quotas are now likely to be removed only at the end of the ten-year transition period in 2005, what could have been a gradual adjustment process may turn into a shock after 2005 (see IMF and World Bank, 2002).
As a consequence of its WTO accession, China has formally been included in the ATC and will eventually obtain unrestricted access to textile and clothing export markets. However, the existence of a special safeguard mechanism within China’s WTO accession protocol is likely to extend this effect over a number of years. Since China was not part of the ATC which took effect in 1995, its exports have remained subject to sharp restrictions. With formal inclusion in the ATC, eventual removal of these restrictions will most likely allow China to significantly increase its world export market share.
Several indicators already point to the potential for a substantial increase in China’s exports when quota restrictions are lifted. The rapid increase in China’s footwear exports, which are not subject to quota restrictions, provides an indication of the potential impact of China’s inclusion in the ATC. While China’s world export market shares in textile and clothing products remained at about 15 percent from 1990 to 2002, its market share in footwear increased from 7.3 percent in 1990 to 28.4 percent in 2000. Also, China has already dramatically increased its exports to the United States of textile and clothing products for which quotas were eliminated at the beginning of 2002 (the so-called “third-phase quota integration”, which covered approximately 15 percent of restrictive quotas), while many other developing countries saw their exports decline sharply. These effects are likely to be considerably larger still if the remaining textile and clothing quotas—which constitute the vast majority of quotas originally in place and are the most restrictive—are removed at the beginning of 2005.
- 12 -
However, China’s accession protocol incorporates provisions that could constrain its export market gains in the coming years, including with respect to textiles and clothing. While such provisions reflect WTO principles, they are widely seen in the case of China as going beyond usual practice in recent WTO accession cases (see for example Lardy 2002). In particular, they include a concept of “market disruption” under the product-specific safeguard mechanism which provides relatively low requirements for safeguard actions against Chinese exports; China-specific features, while WTO safeguard actions are generally to be implemented on a non-discriminatory basis; and “non-market economy” treatment of China for determining anti-dumping and countervailing cases for 15 years.10
D. Potential Implications of China’s Increased Role in World Trade
Analytical work shows that, overall, the international welfare effects of China’s WTO accession will be positive. Such effects have been the subject of increasing research in the late 1990s (Box 4). Most models show that the overall welfare effects of WTO-induced tariff changes in China (compared with a baseline scenario) are not sizable, since, as noted, China’s tariffs have already been lowered substantially. These studies also generally concur on the following key results:
• Over the long term, China will benefit from its WTO accession. Many observers have judged that a key objective of China in joining the WTO was to benefit from increased competitive pressure as an external impetus to domestic reforms. Most analyses, indeed, point to a positive net impact for China in the long run through efficiency gains and direct benefits for Chinese consumers.
• China’s sustained growth, to which its WTO accession will contribute, should provide benefits to most of its trading partners. China has agreed to open sectors that are crucial to its partners, such as the agricultural and services sectors. Continued improvements in China’s business environment (e.g., its predictability and transparency) should remove key obstacles that have long weakened foreign investor confidence. Finally, increased tourism will also benefit partner countries.11
10 This provision states that in the case of imports from countries with state trading monopolies or domestic prices fixed by the state, a strict comparison with domestic prices may not be appropriate. In practice, this criteria may dispense countries from having to show that China is exporting goods at less than their “normal value”.
11 Although China’s outbound tourism is still relatively small, it is growing rapidly. (The number of outbound tourists increased by 37 percent in 2002, to 16.6 million.)
- 13 -
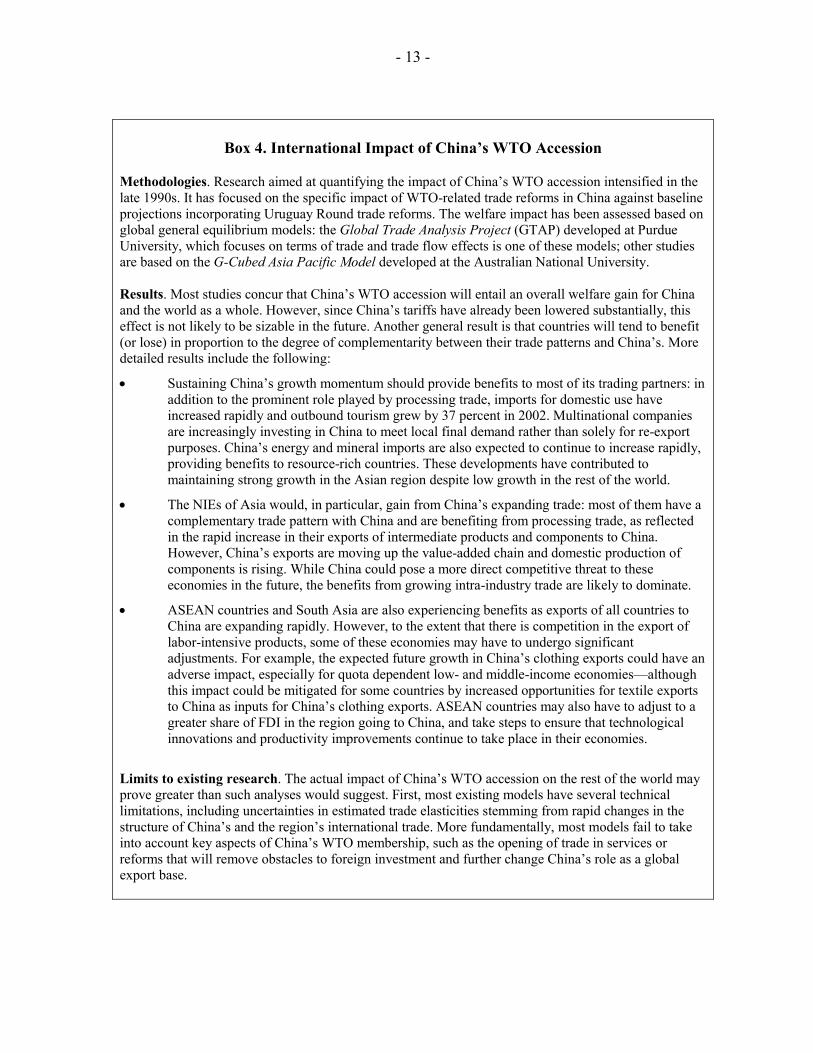
Box 4. International Impact of China’s WTO Accession
Methodologies. Research aimed at quantifying the impact of China’s WTO accession intensified in the late 1990s. It has focused on the specific impact of WTO-related trade reforms in China against baseline projections incorporating Uruguay Round trade reforms. The welfare impact has been assessed based on global general equilibrium models: the Global Trade Analysis Project (GTAP) developed at Purdue University, which focuses on terms of trade and trade flow effects is one of these models; other studies are based on the G-Cubed Asia Pacific Model developed at the Australian National University. Results. Most studies concur that China’s WTO accession will entail an overall welfare gain for China and the world as a whole. However, since China’s tariffs have already been lowered substantially, this effect is not likely to be sizable in the future. Another general result is that countries will tend to benefit (or lose) in proportion to the degree of complementarity between their trade patterns and China’s. More detailed results include the following:
• Sustaining China’s growth momentum should provide benefits to most of its trading partners: in addition to the prominent role played by processing trade, imports for domestic use have increased rapidly and outbound tourism grew by 37 percent in 2002. Multinational companies are increasingly investing in China to meet local final demand rather than solely for re-export purposes. China’s energy and mineral imports are also expected to continue to increase rapidly, providing benefits to resource-rich countries. These developments have contributed to maintaining strong growth in the Asian region despite low growth in the rest of the world.
• The NIEs of Asia would, in particular, gain from China’s expanding trade: most of them have a complementary trade pattern with China and are benefiting from processing trade, as reflected in the rapid increase in their exports of intermediate products and components to China. However, China’s exports are moving up the value-added chain and domestic production of components is rising. While China could pose a more direct competitive threat to these economies in the future, the benefits from growing intra-industry trade are likely to dominate.
• ASEAN countries and South Asia are also experiencing benefits as exports of all countries to China are expanding rapidly. However, to the extent that there is competition in the export of labor-intensive products, some of these economies may have to undergo significant adjustments. For example, the expected future growth in China’s clothing exports could have an adverse impact, especially for quota dependent low- and middle-income economies—although this impact could be mitigated for some countries by increased opportunities for textile exports to China as inputs for China’s clothing exports. ASEAN countries may also have to adjust to a greater share of FDI in the region going to China, and take steps to ensure that technological innovations and productivity improvements continue to take place in their economies.
Limits to existing research. The actual impact of China’s WTO accession on the rest of the world may prove greater than such analyses would suggest. First, most existing models have several technical limitations, including uncertainties in estimated trade elasticities stemming from rapid changes in the structure of China’s and the region’s international trade. More fundamentally, most models fail to take into account key aspects of China’s WTO membership, such as the opening of trade in services or reforms that will remove obstacles to foreign investment and further change China’s role as a global export base.
- 14 -
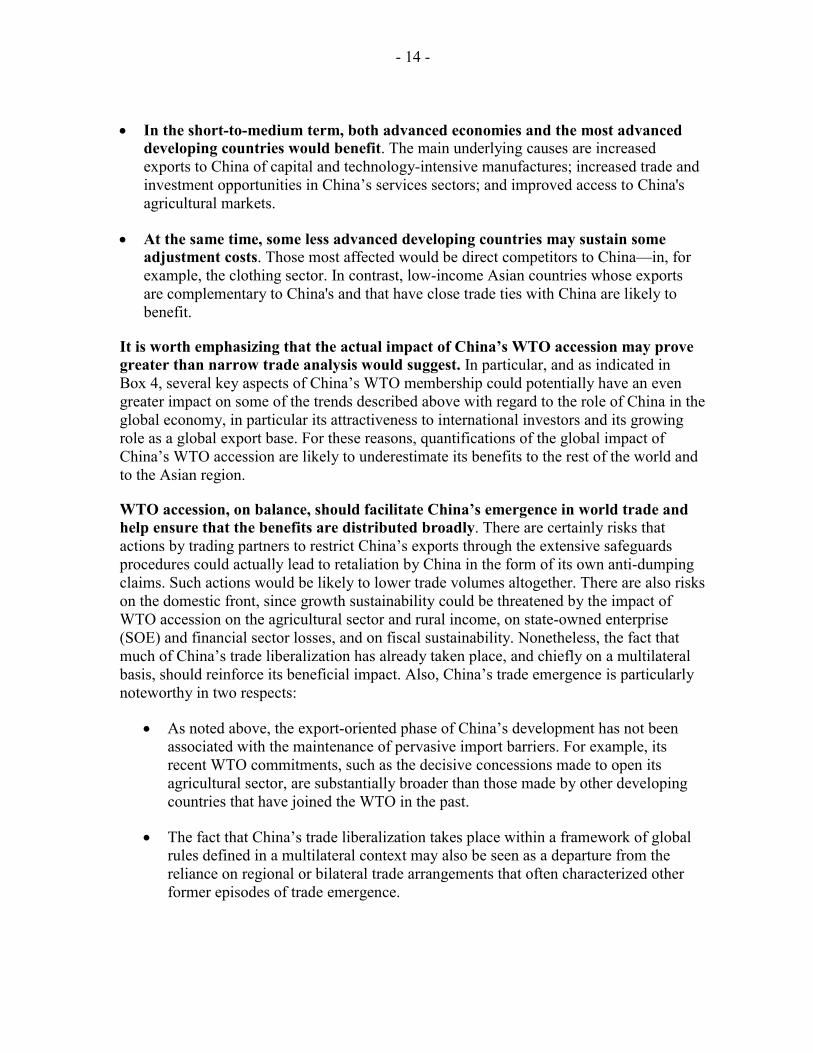
• In the short-to-medium term, both advanced economies and the most advanced developing countries would benefit. The main underlying causes are increased exports to China of capital and technology-intensive manufactures; increased trade and investment opportunities in China’s services sectors; and improved access to China's agricultural markets.
• At the same time, some less advanced developing countries may sustain some adjustment costs. Those most affected would be direct competitors to China—in, for example, the clothing sector. In contrast, low-income Asian countries whose exports are complementary to China's and that have close trade ties with China are likely to benefit.
It is worth emphasizing that the actual impact of China’s WTO accession may prove greater than narrow trade analysis would suggest. In particular, and as indicated in Box 4, several key aspects of China’s WTO membership could potentially have an even greater impact on some of the trends described above with regard to the role of China in the global economy, in particular its attractiveness to international investors and its growing role as a global export base. For these reasons, quantifications of the global impact of China’s WTO accession are likely to underestimate its benefits to the rest of the world and to the Asian region.
WTO accession, on balance, should facilitate China’s emergence in world trade and help ensure that the benefits are distributed broadly. There are certainly risks that actions by trading partners to restrict China’s exports through the extensive safeguards procedures could actually lead to retaliation by China in the form of its own anti-dumping claims. Such actions would be likely to lower trade volumes altogether. There are also risks on the domestic front, since growth sustainability could be threatened by the impact of WTO accession on the agricultural sector and rural income, on state-owned enterprise (SOE) and financial sector losses, and on fiscal sustainability. Nonetheless, the fact that much of China’s trade liberalization has already taken place, and chiefly on a multilateral basis, should reinforce its beneficial impact. Also, China’s trade emergence is particularly noteworthy in two respects:
• As noted above, the export-oriented phase of China’s development has not been associated with the maintenance of pervasive import barriers. For example, its recent WTO commitments, such as the decisive concessions made to open its agricultural sector, are substantially broader than those made by other developing countries that have joined the WTO in the past.
• The fact that China’s trade liberalization takes place within a framework of global rules defined in a multilateral context may also be seen as a departure from the reliance on regional or bilateral trade arrangements that often characterized other former episodes of trade emergence.
- 15 -
Table 3. Sources of Imports (As a percent of China's total imports)
1980 1990 1995 2000 2002 2003 Jan.–Jun. Asia 15.0 41.0 47.1 50.6 53.1 54.9 ASEAN 3.4 5.6 7.4 9.8 10.4 10.5 Japan 26.5 14.2 21.9 18.4 18.1 17.7 Korea ... 0.4 7.8 10.3 9.7 9.5 Taiwan Province of China ... ... 11.2 11.3 12.9 11.6 European Union 15.8 17.0 16.1 13.7 13.1 12.0 United States 19.6 12.2 12.2 9.9 9.2 8.5 Sources: IMF, Direction of Trade Statistics, and CEIC database.
1960 1970 1980 1990 2000 2002 2003
China, P.R.: mainland ... ... 1.0 1.9 3.9 5.1 5.8Germany 10.7 12.1 10.5 12.1 8.6 9.4 9.2Japan 3.7 6.7 7.1 8.5 7.5 6.5 6.4Korea 0.0 0.3 1.0 2.0 2.7 2.5 2.5NIEs 1/ 1.6 1.7 3.2 8.1 10.4 9.7 8.8United States 19.4 15.3 12.0 11.6 12.1 10.8 10.4
Sources: IMF, Direction of Trade Statistics and CEIC.
1/ Newly industrilalized economies, comprising Hong Kong SAR, Korea, Singapore, and Taiwan Province of China.
1970 1980 1990 1995 2000 2002 2003
Japan 1.4 3.1 5.1 10.7 14.5 18.3 18.8United States 0.0 0.5 3.2 6.3 8.6 11.1 11.3European Union 1/ 0.6 0.7 2.0 3.8 6.2 7.5 6.9
Source: IMF, Direction of Trade Statistics.
1/ Excluding intra-EU trade.
(Imports from China divided by total imports, in percent)
Jan.–Jun.
Table 1. Share in World Exports (In percent)
Jan.–Jun.
Table 2. Market Share in Major Export Markets
- 16 -
1994 2000 2002
Coefficient of variation 2/ 1.91 1.72 1.79Herfindahl index 3/
0.073 0.062 0.066
Sources: CEIC; and IMF staff estimates. 1/ A lower number indicates more diversification (i.e. less dispersion in shares). 2/ Coefficient of variation (standard deviation relative to sample mean). 3/ Herfindahl index (sum of squared export shares).
Table 5. Indicators of Export Dispersion 1/ (Share of total exports by SITC 2-digit classification)
1980 1985 1990 1995 2000 2002 2003
Japan 3.9 7.1 2.1 5.0 6.3 9.6 11.1Korea 0.0 0.0 0.0 7.0 10.7 14.7 16.2Hong Kong SAR 6.3 26.0 24.8 33.3 34.5 39.3 46.4Singapore 1.6 1.5 1.5 2.3 3.9 5.5 6.4Indonesia 0.0 0.5 3.2 3.8 4.5 5.1 5.4Malaysia 1.7 1.0 2.1 2.6 3.1 5.6 6.8Philippines 0.8 1.8 0.8 1.2 1.7 3.9 3.9Thailand 1.9 3.8 1.2 2.9 4.1 5.2 6.9India 0.3 0.3 0.1 0.9 1.8 4.2 4.5European Union 1/ 0.8 1.8 1.2 2.2 2.7 3.4 3.5United States
1.7 1.8 1.2 2.0 2.1 3.2 3.6Germany 0.6 1.2 0.6 1.5 1.6 2.2 2.3
Source: IMF, Direction of Trade Statistics. 1/ Adjusted for intra-EU trade.
Jan.–Jun.
Table 4. Exports of Selected Countries to China (In percent of their total exports)
- 17 -
1990 1995 2000 2002
SITC-1 digit CV 2/ 1.39 1.57 1.38 1.32 H 3/ 0.42 0.42 0.38 0.37SITC-2 digit CV 1.88 1.86 1.70 1.61 H 0.12 0.11 0.09 0.09SITC-3 digit Category 6 CV 1.48 1.32 1.15 1.15 H 0.08 0.07 0.06 0.07 Category 7 CV 2.00 1.50 1.41 1.23 H 0.12 0.08 0.09 0.10 Category 8 CV 1.10 1.06 1.05 0.95 H 0.13 0.13 0.13 0.12 Total 6,7, and 8 CV 1.61 1.48 1.30 1.20 H 0.07 0.06 0.05 0.05
Sources: WITS and IMF staff estimates. Note: SITC denotes Standard International Trade Classification. 1/ A lower number indicates more diversification (i.e. less dispersion in shares). Categories 6, 7, 8 refer to basic manufacturing, machinery and transportation, and miscellaneous manufacturing, respectively. 2/ Coefficient of variation (standard deviation relative to sample mean). 3/ Herfindahl index (sum of squared export shares).
Table 6. Indicators of Export Dispersion to the United States 1/ (Based on Share of U.S. Imports, by SITC classification)
- 18 -
Table 8. China: Tariffs, 1982–2002
Unweighted
Average Weighted
Average
Dispersion (SD)
Max
1982 55.6 ... ... ... 1985 43.3 ... ... ... 1988 43.7 ... ... ... 1991 44.1 ... ... ... 1992 42.9 40.6 ... 220.0 1993 39.9 38.4 29.9 220.0 1994 36.3 35.5 27.9 ... 1995 35.2 26.8 ... 220.0 1996 23.6 22.6 17.4 121.6 1997 17.6 16.0 13.0 121.6 1998 17.5 15.7 13.0 121.6 2000 16.4 ... ... ... 2001 15.3 9.1 12.1 121.6 2002 12.3 6.4 9.1 71.0
Sources: Chinese authorities; United Nations Conference on Trade and Development; World Bank; World Trade Organization; and IMF staff estimates.
Table 7. China’s Bilateral Trade Balances with Selected Countries
(In billions of U.S. dollars)
1997 2002 2003 1997 2002 2003 China Plus HK China United States 41 74 88 16 43 55 European Union 9 18 29 5 10 18 Japan 14 -18 -30 3 -5 -14 Korea -12 -19 -30 -6 -13 -21 Taiwan Province of China
-24 -42 -51 -13 -31 -37
Hong Kong SAR ... ... ... 37 48 61 ASEAN -10 -18 -30 0 -8 -15 Others 6 -7 -11 -1 -13 -22 Total -4 -12 -35 40 30 25
Source: CEIC database. Notes: HK denotes Hong Kong SAR; ASEAN denotes the Association of Southeast Asian Nations.
- 19 -
0
20
40
60
80
100
120
140
160
1970 1974 1978 1982 1986 1990 1994 1998 20020
20
40
60
80
100
120
140
160
World Exports China Exports China Imports
Figure 1. Growth in Trade, 1970–2002(Index, 1970=1)
Sources: IMF, Direction of Trade Statistics .
- 20 -
(In percent)
Source: CEIC database. 1/ Region is comprised of Hong Kong SAR, Singapore, Thailand, Korea, Taiwan POC, Malaysia, Indonesia, the Philippines, and Japan.
Share of region in China's total trade, 1993–2002
44
46
48
50
52
54
56
58
60
1993 1994 1995 1996 1997 1998 1999 2000 2001 2002 44
46
48
50
52
54
56
58
60
Exports
Imports
Growth of China's trade with region, 2000–2003
-15
-5
5
15
25
35
45
55
65
2000q1 2000q2 2000q3 2000q4 2001q1 2001q2 2001q3 2001q4 2002q1 2002q2 2002q3 2002q4 2003q1 2003q2 2003q3 -15
-5
5
15
25
35
45
55
65
Exports
Imports
Figure 2. Trade in East Asian Region 1/
- 21 -
Figure 3. Trade in Electronic Products
Source: CEIC database. 1/ Computer and telecommunication products plus electronics.
China: Monthly Imports of Electronic Components(In millions of US$; 3-month moving average)
0
500
1000
1500
2000
2500
3000
3500
4000
4500
5000
Jan-93
Jul-93
Jan-94
Jul-94
Jan-95
Jul-95
Jan-96
Jul-96
Jan-97
Jul-97
Jan-98
Jul-98
Jan-99
Jul-99
Jan-00
Jul-00
Jan-01
Jul-01
Jan-02
Jul-02
Jan-03
Jul-03
0
500
1000
1500
2000
2500
3000
Electronic integrated circuits and
microassemblies
Trade in IT Products 1/(Values in U.S. dollars)
0
2000
4000
6000
8000
10000
12000
Jan-00
Apr-00
Jul-00
Oct-00
Jan-01
Apr-01
Jul-01
Oct-01
Jan-02
Apr-02
Jul-02
Oct-02
Jan-03
Apr-03
Jul-03
0
1000
2000
3000
4000
5000
6000
7000
8000
Imports of IT productsExports of IT products
- 22 -
0
500
1000
1500
2000
2500
3000
3500
4000
4500
1996q1 1996q4 1997q3 1998q2 1999q1 1999q4 2000q3 2001q2 2002q1 2002q40
500
1000
1500
2000
2500
3000
3500
4000
4500
China 1/
Japan
Korea
Taiwan, Province of China
(In millions of US$)
Source: CEIC database. 1/ Based on U.S. statistical data, which attributes re-exports via Hong Kong SAR to mainland China.
Figure 4. United States: Imports of Manufactured Goods from Seleted Asian Countries
- 23 -
REFERENCES
Adhikari, Ramesh, and Yongzheng Yang, 2002, What Will WTO Membership Mean for China and Its Trading Partners?, Finance & Development, September (Washington: International Monetary Fund).
Cerra, Valerie, and Sweta Chaman Saxena, 2002, “An Empirical Analysis of China’s Export
Behavior,” IMF Working Paper 02/200, November (Washington: International Monetary Fund).
Gertler, Jeffrey L., 2002, What China’s WTO Accession is All About, WTO Secretariat,
December. Hertel, Thomas and Terrie Walmsley, 2000, China's Accession to the WTO: Timing is
Everything, Center for Global Trade Analysis, Purdue University, September. Ianchovichina, Elena, and Will Martin, 2002, “Economic Impacts of China’s Accession to
the WTO,” World Bank Policy Research Working Paper, December (Washington: World Bank).
International Monetary Fund and World Bank, 2002, Market Access for Developing Country
Exports—Selected Issues, September (http://www.imf.org/external/np/pdr/ma/2002/eng/092602.htm).
Lardy, Nicholas R., 2002, Integrating China into the Global Economy, Brookings Institution,
January. Mattoo, Aaditya, 2002, “China’s Accession to the WTO: The Services Dimension,” World
Bank Policy Research Working Paper, December. Organization for Economic Co-operation and Development, 2002, China in the World
Economy: The Domestic Policy Challenges, OECD. ———2003, “China’s Tariff Regime, Center for Cooperation with Non-Members,” Trade
Directorate, March. Panitchpakdi, Supachai, and Mark L. Clifford, 2002, China and the WTO—Changing China,
Changing World Trade, John Wiley & Sons (Asia). Prasad, Eswar, and Thomas Rumbaugh, 2003, “Beyond the Great Wall: Why China’s
Integration into the Global Trading System is Seen as a Competitive Threat by Some but as a Boon by Others,” Finance and Development, December (Washington: International Monetary Fund).
- 24 -
Roland-Holst, David, Iwan Azis, and Li-Gang Lui, 2003, Regionalism and Globalism: East and Southeast Asian Trade Relations in the Wake of China’s WTO Accession, ADB Institute, Draft Discussion Paper, January.
Tongzon, Jose L., 2001, China’s Membership in the World Trade Organization and the
Exports of the Developing Economies of East Asia: A Computable General Equilibrium Approach, Applied Economics, 33.
Tseng, Wanda, and Markus Rodlauer, Eds., 2003, China: Competing in the Global Economy,
(Washington: International Monetary Fund). United States, General Accounting Office, 2002, World Trade Organization—Analysis of
China’s Commitments to Other Members, Report to Congressional Committees, Washington DC, October (available at http://www.gao.gov/new.items/d034.pdf).
United States Trade Representative, 2002, 2002 Report to Congress on China’s WTO
Compliance, December. Wang, Zhi, 2003, “The impact of China's WTO Accession on Patterns of World Trade,”
Journal of Policy Modeling, Volume 25, Issue 1, January. Yang, Yongzheng, 2003, “China’s Integration into the World Economy: Implications for
Developing Countries,” IMF Working Paper 03/245 (Washington: International Monetary Fund).
Yi, Kei-Mu, 2003, “Can Vertical Specialization Explain the Growth of World Trade?,”
Journal of Political Economy, Volume III, No. 1. Zebregs, Harm, forthcoming, Intraregional Trade in Asia, IMF Policy Discussion Paper.