Embed Size (px)
Citation preview

Cleared, SAF/PA, Case # 2017-0339, 4 Aug 2017. 1
Integrity Service Excellence
Possible Cellular Explanation for
MRI Changes Following Hypobaric
Exposure
Stephen McGuire, MD
Paul Sherman, MD
14 Sept 2017

Cleared, SAF/PA, Case # 2017-0339, 4 Aug 2017. 2
Disclaimer
The views expressed are those of the author and do not
necessarily reflect the official policy or position of the Air Force,
the Department of Defense, or the U.S. Government.
No relevant financial disclosures.

Cleared, SAF/PA, Case # 2017-0339, 4 Aug 2017. 3
What We Think We Know
(Human)
Recurrent exposure to nonhypoxic extreme hypobaria incites:
• Focal punctate subcortical white matter hyperintensities
(WMH) on MRI
• Diffuse decrement in axonal integrity on MRI
• Acquired neurocognitive decline as measured on CBT
• Clinical neurological decompression sickness is not a
prerequisite for abnormalities
Single exposure to extreme hypobaria/hypoxia (routine
occupational aircrew training) incites:
• Increase in white matter followed by gray matter cerebral
blood flow that persists at 72 hours post-exposure on MRI
• Consistent with increased cerebral metabolic demand
Quantitative serial MRI highly reproducible
McGuire et al. Neurol 2013;81:729-735
McGuire et al. Ann Neurol 2014;76:719-726
McGuire et al. Neurol 2014;83:638-645
McGuire et al. Aerosp Med Hum Perform 2016;87:983-988
McGuire et al. Brain Behav 2017;e00759 (https://doi.org/10.1002/brb3.759)

Cleared, SAF/PA, Case # 2017-0339, 4 Aug 2017. 4
Phase 2 Single Exposure
MR Spectroscopy Reproducibility
Reproducibility of measurement of multiple neurometabolites
with MR spectroscopy (TE30) in frontal (white matter) and
anterior cingulate (mixture of white and gray matter)• Glu=glutamate
• tCho=choline
• tNAA=n-acetylasparate
• mI=myo-inositol
• tCr=creatine
• Glu+Gln=glutamate + glutamine
• GSH=glutathione
tNAA reflects neurons
mI reflects glia
GSH reflects oxidative stress
tCr reflects energy
Rating reflects # of subjs needed:
• High = 1-20
• Moderate = 21-40
• Low > 40
Metabolite ICC Rating (3%) Rating (10%)
TE30 frontal lobes WM
Frontal Mean Glu 0.816 N = 141(Low) N = 14(High)
Frontal Mean tCho 0.886 N = 91(Low) N = 9(High)
Frontal Mean tNAA 0.694 N = 51(Low) N = 6(High)
Frontal Mean mI 0.745 N = 155(Low) N = 15(High)
Frontal Mean tCr 0.565 N = 84(Low) N = 9(High)
Frontal Mean Glu+Gln 0.818 N = 119(Low) N = 12
Frontal Mean GSH 0.696 N = 281(Low) N = 26(Mod)
TE30 AC GM
AC Glu 0.763 N = 43(Low) N = 5(High)
AC GSH 0.798 N = 87(Low) N = 9(High)
AC tCho 0.879 N = 52(Low) N = 6(High)
AC tNAA 0.787 N = 15(High) N = 3(High)
AC mI 0.781 N = 44(Low) N = 6(High)
AC tCr 0.667 N = 21(Mod) N = 3(High)
AC Glu+Gln 0.765 (Low) N = 4(High)
McGuire et al. Brain Behav 2017;e00759 (https://doi.org/10.1002/brb3.759)

Cleared, SAF/PA, Case # 2017-0339, 4 Aug 2017. 5
Phase 2 Single Exposure
MRS – Single Factor
In addition to ASL see difference
in serial MRI measurement
response to exposure by Group
• Suggests some metabolites
are altered by exposure
• Raises possibility that
response to exposure might be
predicted based on baseline
vlaues
gam (factor ~ s(MRINum,k=3) +
MRINum:Group + Group +
Age*Group:MRINum + Age +
Sex*Group:MRINum + Sex; AFCNOR)
• Utilizing Generalized Additive Model
Factor
Group:MRINum
(p-value)
AvgGMASL 0.048
AvgWMASL 0.001
LNFLAIR 0.007
AvgFA 0.496
AvgGluFront30 0.368
AvgChoFront30 0.587
AvgNAAFront30 0.219
AvgMIFront30 0.151
AvgCrFront30 0.158
AvgGluGlnFront30 0.124
AvgGSHFront30 0.029
GluAC30 0.017
GSHAC30 0.090
ChoAC30 0.010
NAAAC30 0.023
MIACC30 0.039
CrACC30 0.008
GluGlnACC30 0.004

Cleared, SAF/PA, Case # 2017-0339, 4 Aug 2017. 6
Phase 2 Single Exposure
MRS – Correlation with ASL
Cerebral blood flow appears driven
by cellular metabolite changes
with MRI factor value different
between groups
gam (ASL ~ s(MRINum,k=3) + factor*Group
+ MRINum:Group + Group +
Age*Group:MRINum + Age +
Sex*Group:MRINum + Sex; AFCNOR)
• Using Generalized Additive Model
FactorGMASL
(p-value)
WMASL
(p-value)
AvgGluFront30 0.058 0.004
AvgChoFront30 0.043 <0.001
AvgNAAFront30 0.028 0.001
AvgMIFront30 0.021 <0.001
AvgCrFront30 0.039 0.001
AvgGluGlnFront30 0.054 0.004
AvgGSHFront30 0.043 0.001
GluAC30 0.014 <0.001
GSHAC30 0.013 <0.001
ChoAC30 0.036 <0.001
NAAAC30 0.014 <0.001
MIACC30 0.051 0.001
CrACC30 0.021 <0.001

Cleared, SAF/PA, Case # 2017-0339, 4 Aug 2017. 7
Phase 2 Single Exposure
MR Spectroscopy myo-Inositol
Difference in myo-Inositol by
group after exposure
Single factor analysis:
• Frontal WM p=0.151
• Ant Cing GM p=0.039
ASL value prediction (mI)
adding mI as an independent
variable:• Frontal WM
• WM-ASL p<0.001
• GM-ASL p<0.001
• ACC GM
• WM-ASL p=0.790
• GM-ASL p=0.153gam (ASL ~ s(MRINum,k=3) +
factor*Group + MRINum:Group +
Group + Age*Group:MRINum + Age
+ Sex*Group:MRINum + Sex;
AFCNOR)
Cleared, SAF/PA, Case # 2017-0339, 4 Aug 2017. 8
Phase 2 Single Exposure
MR Spectroscopy myo-Inositol
Baseline mI level suggests a difference in ASL response in AFC

Cleared, SAF/PA, Case # 2017-0339, 4 Aug 2017. 9
Phase 2 Single Exposure
MR Spectroscopy Creatine
Difference in creatine by
group after exposure
• Frontal WM p=0.158
• Ant Cing GM p=0.008
ASL value prediction (Cr)
adding Cr as an independent
variable:
• Cr : Group ASL prediction• Frontal WM
• WM-ASL p<0.001
• GM-ASL p=006
• ACC GM
• WM-ASL p=0.836
• GM-ASL p=0.701gam (ASL ~ s(MRINum,k=3) +
factor*Group + MRINum:Group +
Group + Age*Group:MRINum + Age
+ Sex*Group:MRINum + Sex;
AFCNOR)

Cleared, SAF/PA, Case # 2017-0339, 4 Aug 2017. 10
Phase 2 Single Exposure
MR Spectroscopy Creatine
Baseline Cr level suggests a difference in ASL response in AFC
Cleared, SAF/PA, Case # 2017-0339, 4 Aug 2017. 11
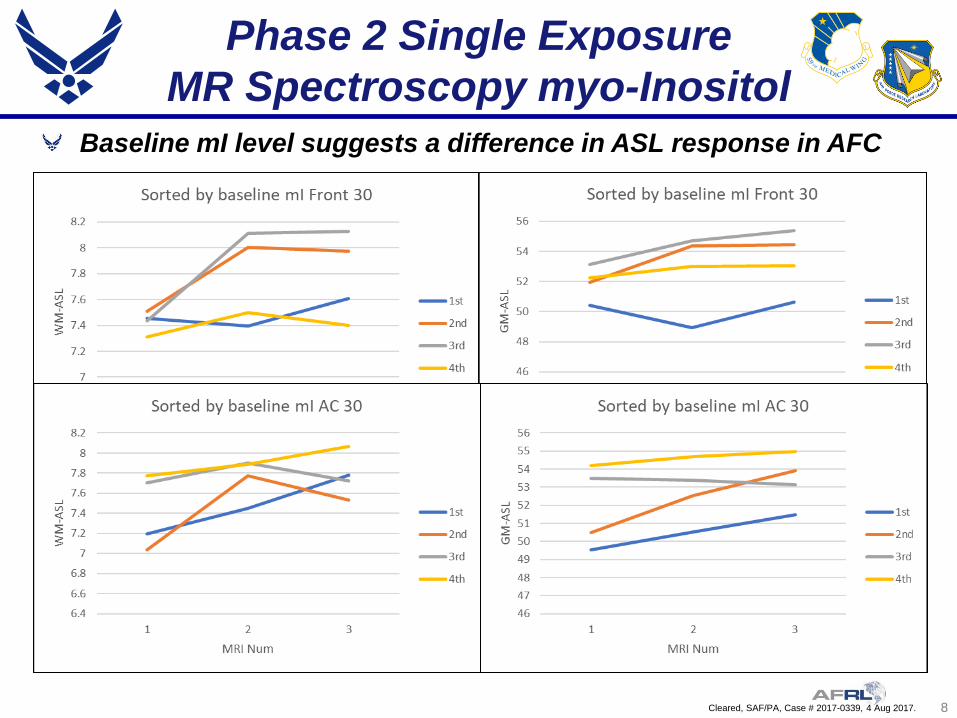
Phase 2 Single Exposure
MR Spectroscopy NAADifference in NAA by group
after exposure
• Frontal WM p=0.219
• Ant Cing GM p=0.0323
ASL value prediction (NAA)
adding NAA as an independent
variable:
• NAA : Group ASL prediction• Frontal WM
• WM-ASL p=0.687
• GM-ASL p=0.616
• ACC GM
• WM-ASL p=0.274
• GM-ASL p=0.132gam (ASL ~ s(MRINum,k=3) +
factor*Group + MRINum:Group +
Group + Age*Group:MRINum + Age +
Sex*Group:MRINum + Sex; AFCNOR)

Cleared, SAF/PA, Case # 2017-0339, 4 Aug 2017. 12
Phase 2 Single Exposure
MR Spectroscopy NAA
Baseline NAA level suggests a difference in ASL response in AFC

Cleared, SAF/PA, Case # 2017-0339, 4 Aug 2017. 13
Phase 2 Single Exposure
MR FLAIR Total WMH Burden
Cerebral blood flow appears
to be associated with the
pre-existing FLAIR WMH
burden
Higher WMH baseline
predicts greater WM-ASL
response to stress
LNFLAIR: Group
• GM ASL (p=0.628)
• WM ASL (p=0.073)
gam (ASL~s(MRINum,k=3) +
factor*Group + MRINum:Group +
Group + Age*Group:MRINum + Age
+Sex*Group:MRINum + Sex;
AFCNOR)

Cleared, SAF/PA, Case # 2017-0339, 4 Aug 2017. 14
What We Think This Means
(Human)
Single occupational exposure to a hypobaric/hypoxic
environment is associated with an increase in CBF
• CBF tightly regulated by cerebral metabolic demands
• Chamber exposure to 25k feet ~ 30 minutes
• Hypoxic portion ~ 2-4 minutes historically correlating with a
PaO2Sat ~ 65-75%
The degree of ASL change appears related to baseline
neurocellular metabolites
The degree of ASL change appears related to baseline Total
FLAIR burden
• Suggests inherent predisposition for injury with subsequent
elevated ASL

Cleared, SAF/PA, Case # 2017-0339, 4 Aug 2017. 15
Swine Model
Model 1 failed 2° to
complications from
anesthesia and/or DCS
Phase 2 well tolerated by
swine

Cleared, SAF/PA, Case # 2017-0339, 4 Aug 2017. 16
Swine Model Phase 2
Nonsedated
Phase 2 model to mimic U-2 pilot experience
• Nonsedated subjects with 1-hour prebreathe, 30-minute
ascent to 30k, 8 hours at altitude, 30-minute descent
• Behavioral observation during flights
• MRI and inflammatory/genomic/proteomic markers to
measure injury
• Subsequent tissue examination and live-cell
neurophysiological studies
• Study commenced 1/2016
Three limbs
• 30k feet altitude/95+% O2
• 5k feet altitude/room air
• 785 feet altitude/95+% O2
Cleared, SAF/PA, Case # 2017-0339, 4 Aug 2017. 17
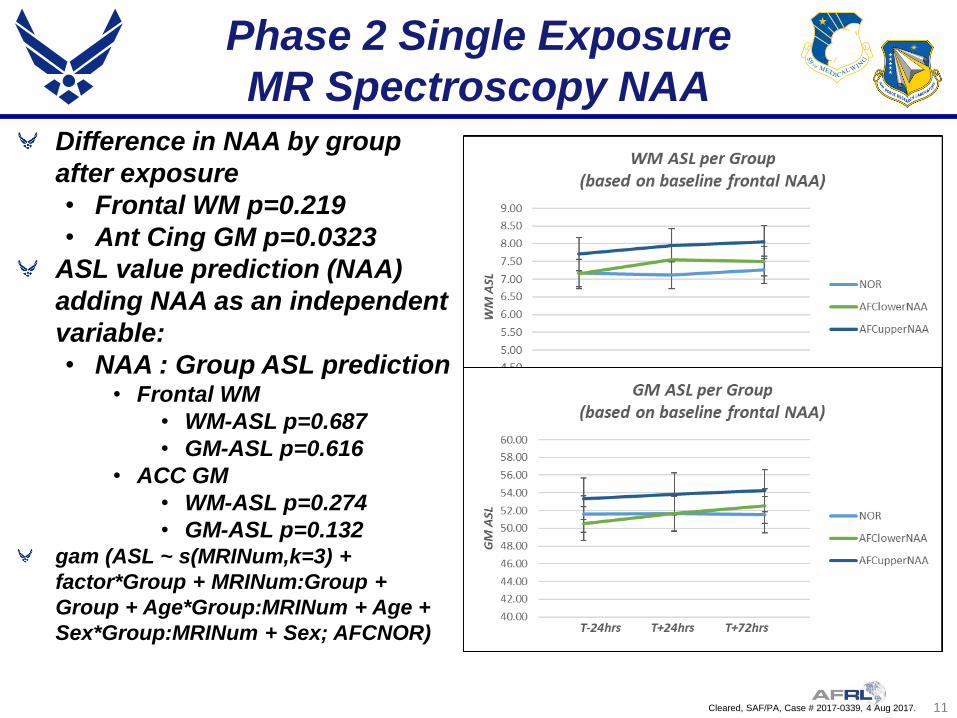
Kurtosis Diffusion
Swine Model Phase 2Significant increase in exposed population kurtosis MRI#2 with return to
baseline MRI#3 (p<0.001)
• GLM (with age as a covariable) & repeat measure linear model (rANOVA)
Decrease in axonal water fraction MRI#2 with return to baseline MRI#3
Consistent with increase in interstitial water (edema) with axonal injury and
increased blood flow related to hypobaric exposure
Preliminary path data normative (n=2; axonal stains pending)

Cleared, SAF/PA, Case # 2017-0339, 4 Aug 2017. 18
NDCS Hypothesis
Hypothesis: N2 gas bubble release associated with decrease in
ambient pressure initial inciting event (decompressive stress)
Transient increase in CBF that persists at 72 hours post-
exposure
• Neurochemical metabolite change suggests neuronal and
glial cell injury
Possibly the pre-existing levels of neurometabolites suggest an
underlying susceptibility to injury
Recurrent exposure leads to proton (H2O) increase
• Hypothesize that sufficient stress leads to discrete WMH
burden and diffuse axonal decrement
Associated neurocognitive changes reflect the diffuse axonal
degradation
Possibly certain individuals are more susceptible
• Potentially may be able to identify those that are more
susceptible.

Cleared, SAF/PA, Case # 2017-0339, 4 Aug 2017. 19
Questions ?

![Cellular Magnetic Resonance Imaging: In Vivo Imaging of … · 2016. 12. 19. · nance imaging (MRI) [19]. High-resolution MRI provides an exceptional imaging modality for studying](https://img.pdfslide.us/doc/110x75/60c0ae91ec310e1ce84f128d/cellular-magnetic-resonance-imaging-in-vivo-imaging-of-2016-12-19-nance-imaging.jpg)