Embed Size (px)
Citation preview
POSITRON IMPACT IONIZATION PROCESSES IN GASES
A thesis submitted to the University of London for the degree of Doctor of Philosopy
Geraint Owain Jones Department of Physics and Astronomy
University College London
September 1991

ProQuest Number: 10611133
All rights reserved
INFORMATION TO ALL USERS The quality of this reproduction is dependent upon the quality of the copy submitted.
In the unlikely event that the author did not send a com p le te manuscript and there are missing pages, these will be noted. Also, if material had to be removed,
a note will indicate the deletion.
uestProQuest 10611133
Published by ProQuest LLC(2017). Copyright of the Dissertation is held by the Author.
All rights reserved.This work is protected against unauthorized copying under Title 17, United States C ode
Microform Edition © ProQuest LLC.
ProQuest LLC.789 East Eisenhower Parkway
P.O. Box 1346 Ann Arbor, Ml 48106- 1346
ABSTRACT
The two experiments that are discussed in this work are both studies of ionization
phenomena in gases.
The main body of the work involved the development of an experiment to measure
the positron impact ionization cross-section of atomic hydrogen. This experiment
utilizes the crossed-beam method wherein a magnetically guided positron beam
crosses a diverging jet of highly dissociated hydrogen gas. The suitability of this
system to measure relative ionization cross-sections with both positrons and electrons
has been demonstrated by measuring the impact ionization cross-sections of
molecular hydrogen. Results obtained agree with previously published data to within
experimental error.
Preliminary studies have also been made with the atomic hydrogen source in
operation and these revealed that high fluxes of photons, protons and electrons are
emitted from the gas discharge and detected. These would make it impossible to
detect ions at the considerably lower count-rates that are anticipated and their effects
have had to be circumvented. This has been done successfully and it is concluded
that the measurement of the positron impact ionization cross-section of atomic
hydrogen seems possible with this apparatus.
The second experiment has been a study of the times-of-flight of electrons emitted
in positron impact ionization of Argon. The purpose of the experiment is to assess
the significance of electron capture to the continuum (ECC) as a possible outcome
of the ionizing collisions of positrons. Electrons which have been captured into a
continuum state of a positron are expected to have a velocity vector equal to that of
the positron, one would therefore expect them to have a particular time-of-flight to
a detector. A broad peak was observed around the characteristic flight time at all
energies indicating that ECC does occur in positron-Ar collisions but quantitative
estimates of its likelihood were not possible.
TABLE OF CONTENTS
Abstract 2Table of Contents 3Figure Captions 5Table Captions 13Acknowledgements 14
CHAPTER 1 INTRODUCTION
1.1 Historical Background 161.2 Basic Properties of the Positron and Positronium 181.3 The Development of Slow Positron Beams 221.4 The Measurement of Slow Positron Scattering
Cross-Sections 331.5 The Measurement of Positron Impact Ionization
Cross-Sections 461.5.1 Scattering Cell Experiments 481.5.2 Crossed-Beam Experiments 56
1.6 Motivation for this Work 65
CHAPTER 2 THE THEORETICAL CALCULATION OF THE TOTALPOSITRON IMPACT IONIZATION CROSS-SECTION OFATOMIC HYDROGEN
2.1 Introduction 672.2 Classical Calculations 672.3 Quantum Mechanical Calculations 74
2.3.1 High Energy Approximations 762.3.1.1 The Bom Approximation 762.3.2.2 The Glauber Approximation 81
2.3.2 Distorted Wave Calculations 852.4 Summary 93
CHAPTER 3 THE DETERMINATION OF THE TOTAL POSITRONIMPACT IONIZATION CROSS-SECTION OF ATOMICHYDROGEN - EXPERIMENT
3.1 General Layout and Principles of Operation 943.2 Slow Positron Production and Transport 953.3 The Atomic Hydrogen Source 101
3.3.1 The Gas Handling System 1013.3.2 The Radio-Frequency Discharge 104
3.4 The Ion Extraction System 1103.5 Timing Electronics 114
CHAPTER 4 POSITRON AND ELECTRON IMPACT IONIZATION OF ATOMICAND MOLECULAR HYDROGEN
4.1 Preliminary Remarks 1184.2 Results for Molecular Hydrogen 118
4.2.1 Positron Impact Ionization 1194.2.2 Electron Impact Ionization 129
4.3 Preliminary Studies with Atomic Hydrogen 1294.3.1 Positron Impact Ionization 1314.3.2 Electron Impact Ionization 135
4.4 Summary 136
CHAPTER 5 ELECTRON CAPTURE TO THE CONTINUUM INPOSITRON-ARGON COLLISIONS
5.1 Introduction 1365.2 Electron Capture to the Continuum in Positron
Impact Ionization 1415.2.1 Quantum Mechanical Theory 1415.2.2 Classical Theory 1425.2.3 Experimental Studies of Capture to the
Continuum after Positron Impact 1445.3 An Experiment to Study the Times of Flight of
Electrons Ejected Following Positron ImpactIonization of Argon 1455.3.1 The Primary Positron Beam 1475.3.2 The Interaction Region and Timing System 1505.3.3 Experimental Procedure 1565.3.4 Results and Discussion 156
CHAPTER 6 CONCLUSION 162
References 167
4

FIGURE CAPTIONS
The Feynman diagrams for annihilation into one, two, three and four photons and for radiationless annihilation.
The potential energy encountered by a positron at the surface of a metal.
Slow positron yield as a function of the positron work function for Cu (Murray and Mills, 1980).
Source-moderator geometries: (a) Backscattering; (b) Vanes; (c) Mesh; (d) Cup; (e) Transmission
The total cross-section for positrons incident on Helium for energies below 20eV.
The total cross-section for positrons incident on Helium for energies above 20eV.
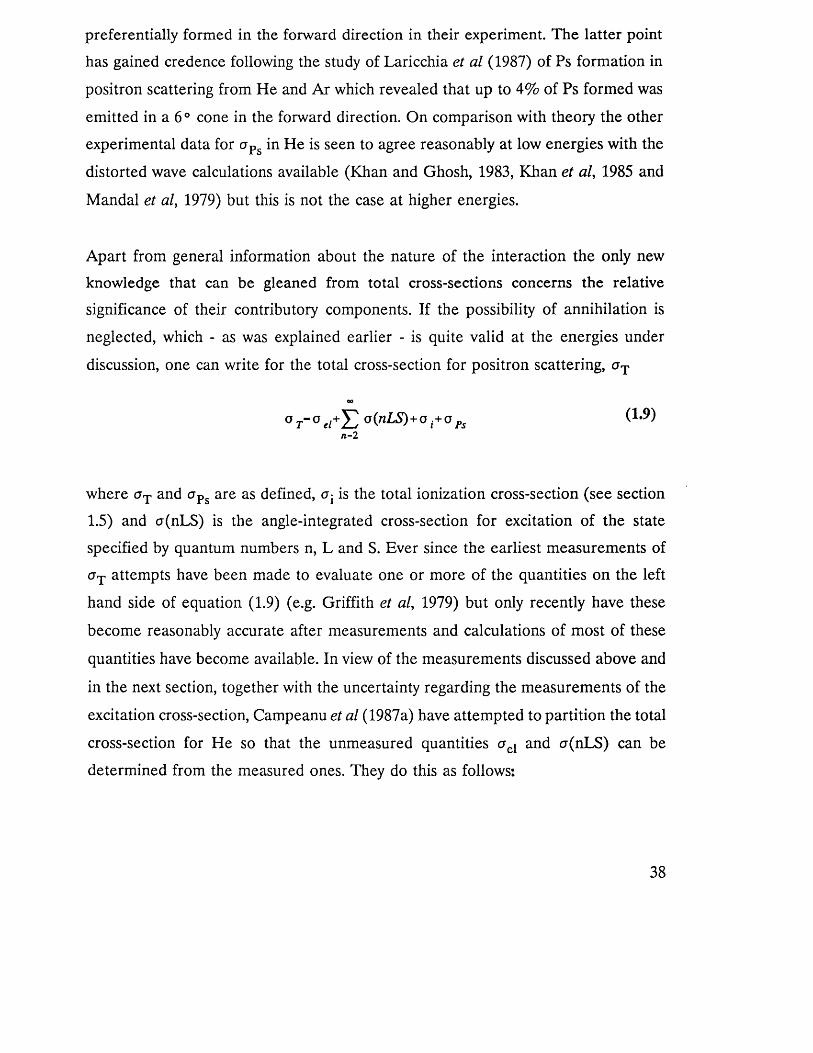
The excitation cross-section of positrons incident on Helium.
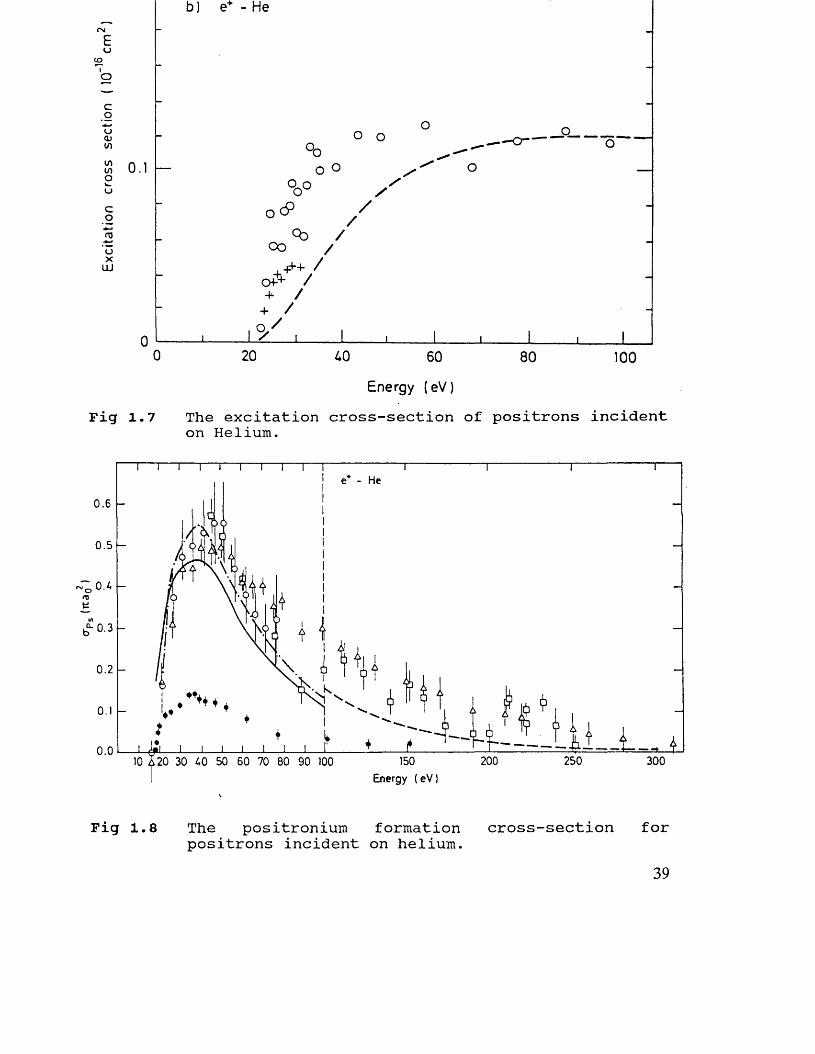
The positronium formation cross-section for positrons incident on helium.
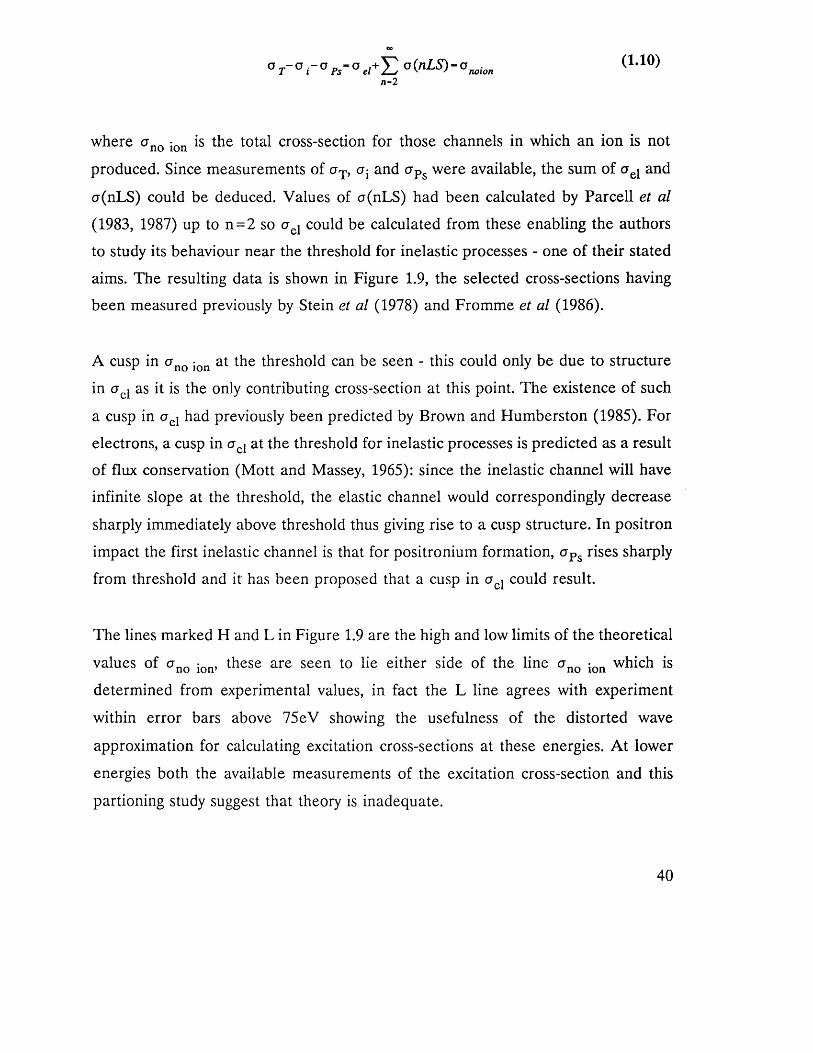
The total cross-section excluding ionization for positrons incident on helium showing contributions from individual channels (Campeanu et al, 1987).
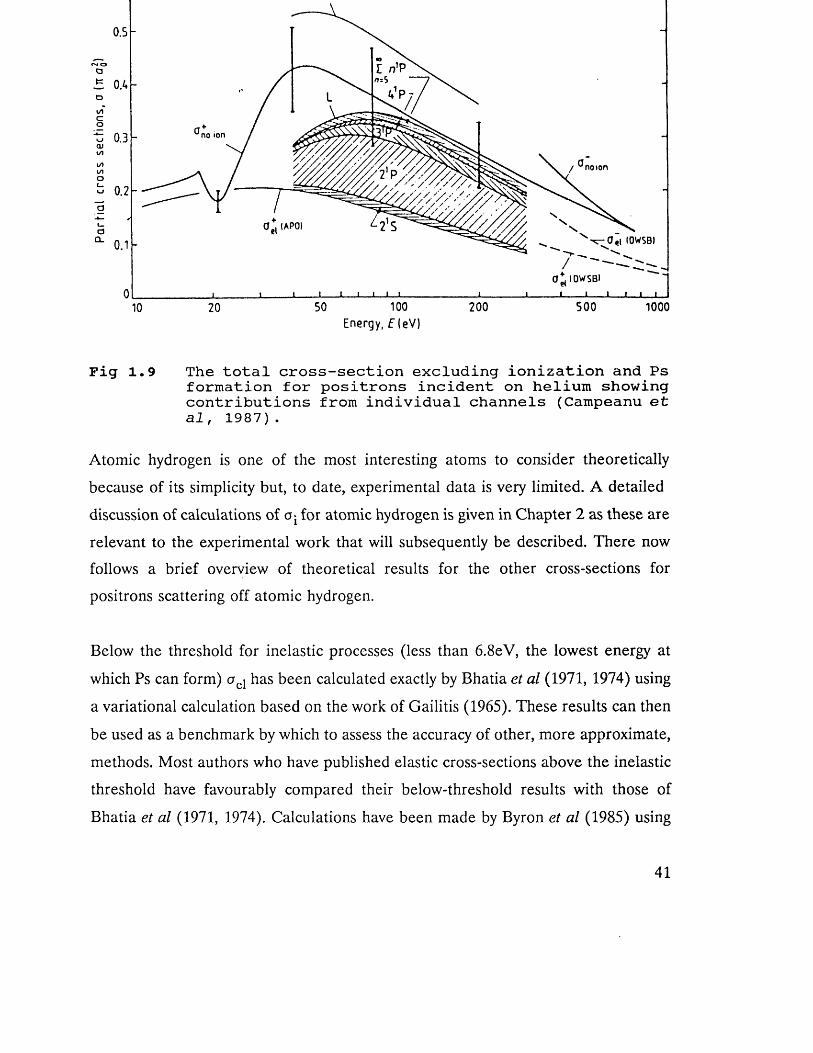
The calculated elastic cross-section of positrons incident on atomic hydrogen.
1.11
1.12
1.13
1.14
1.15
1.16
1.17
1.18
1.19
1.20
The positronium formation cross-section of positrons 44 incident on atomic hydrogen (a) up to 14eV, (b) at higher energies.
The cross-sections for excitation of atomic hydrogen by 45positron impact from its ground state into (a) the 2S level and (b) the 2P level.
Calculated total, elastic, excitation and positronium 47formation cross-sections for e +-H scattering. Also shown is the sum of the individual cross-sections for these channels.
The positron impact ionization cross-section of atomic 47hydrogen determined from partitioning the total cross- section. Directly calculated and measured results are shown for comparison.
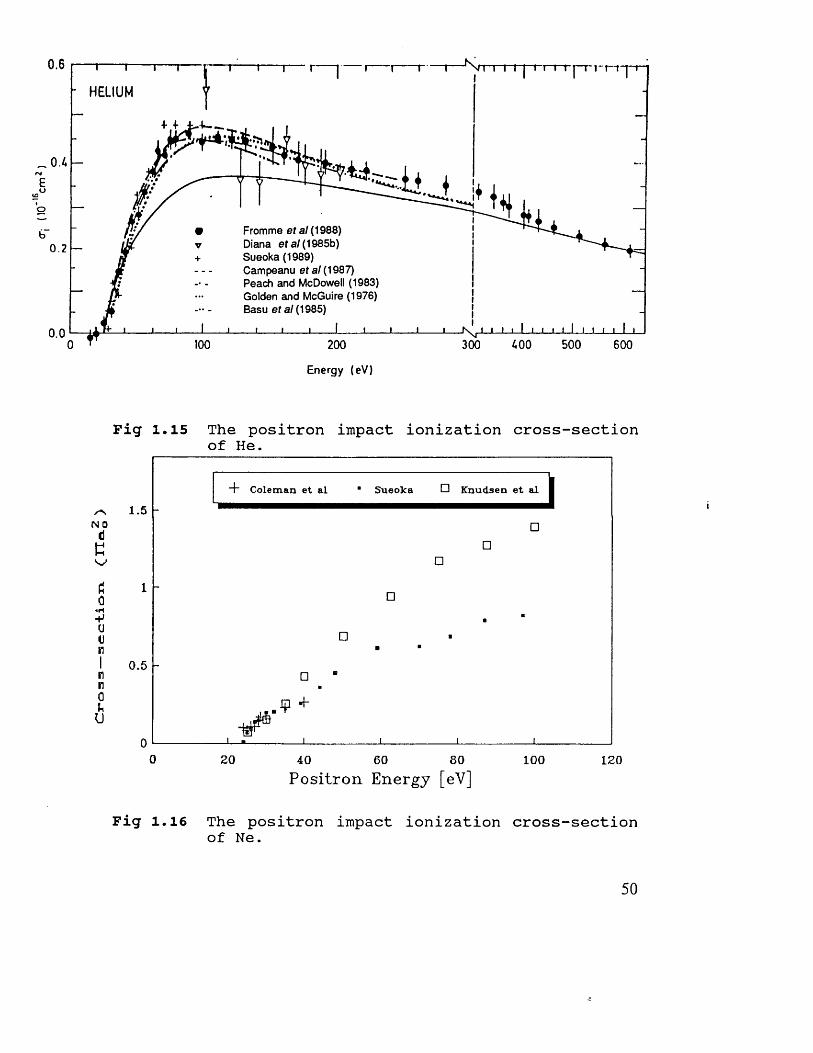
The positron impact ionization cross-section of He. 50
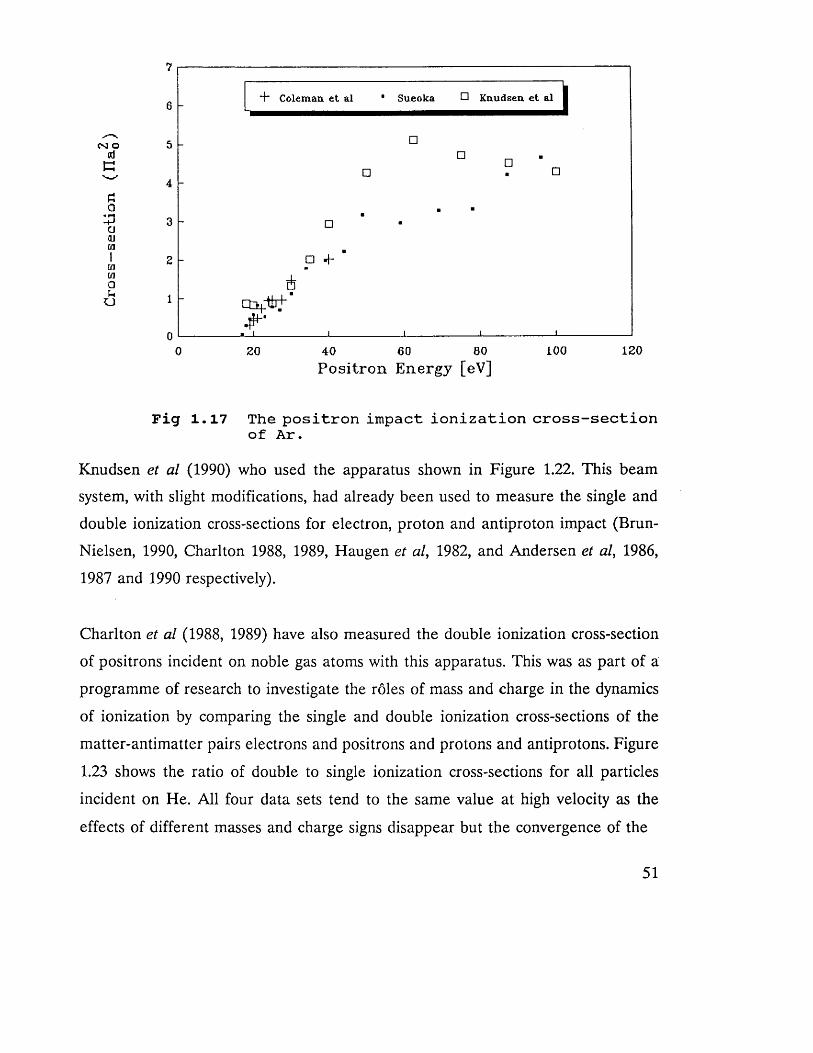
The positron impact ionization cross-section of Ne. 50
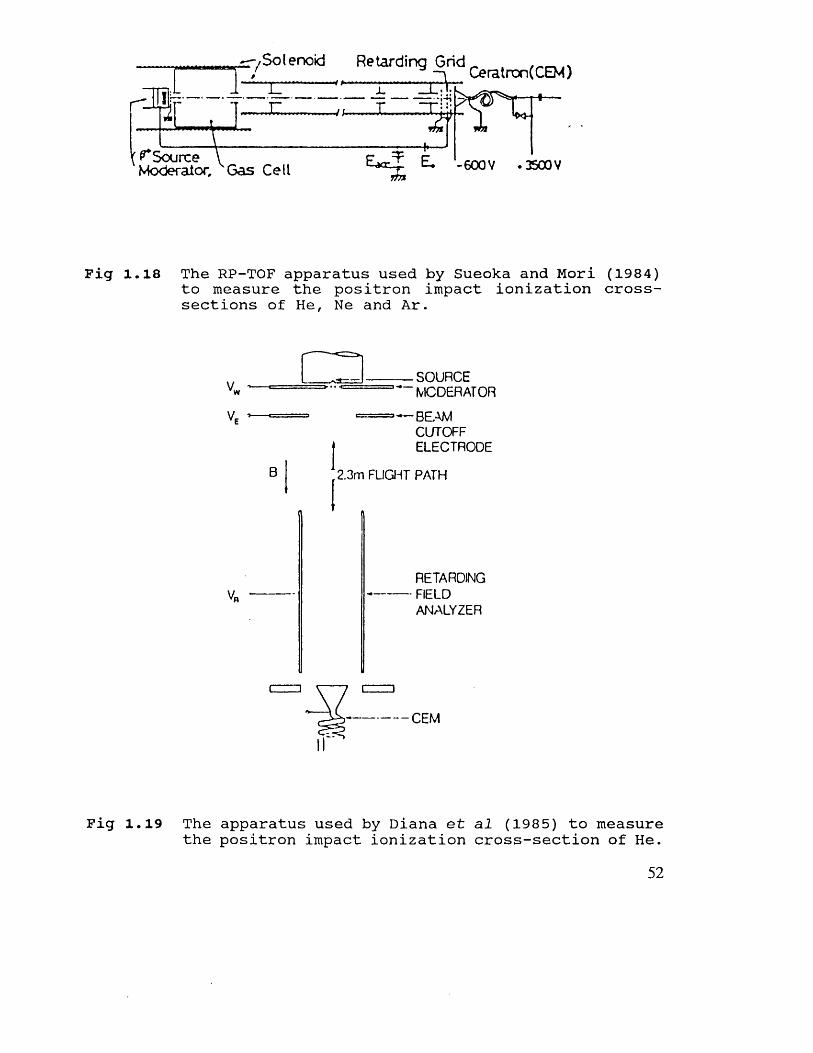
The positron impact ionization cross-section of Ar. 51
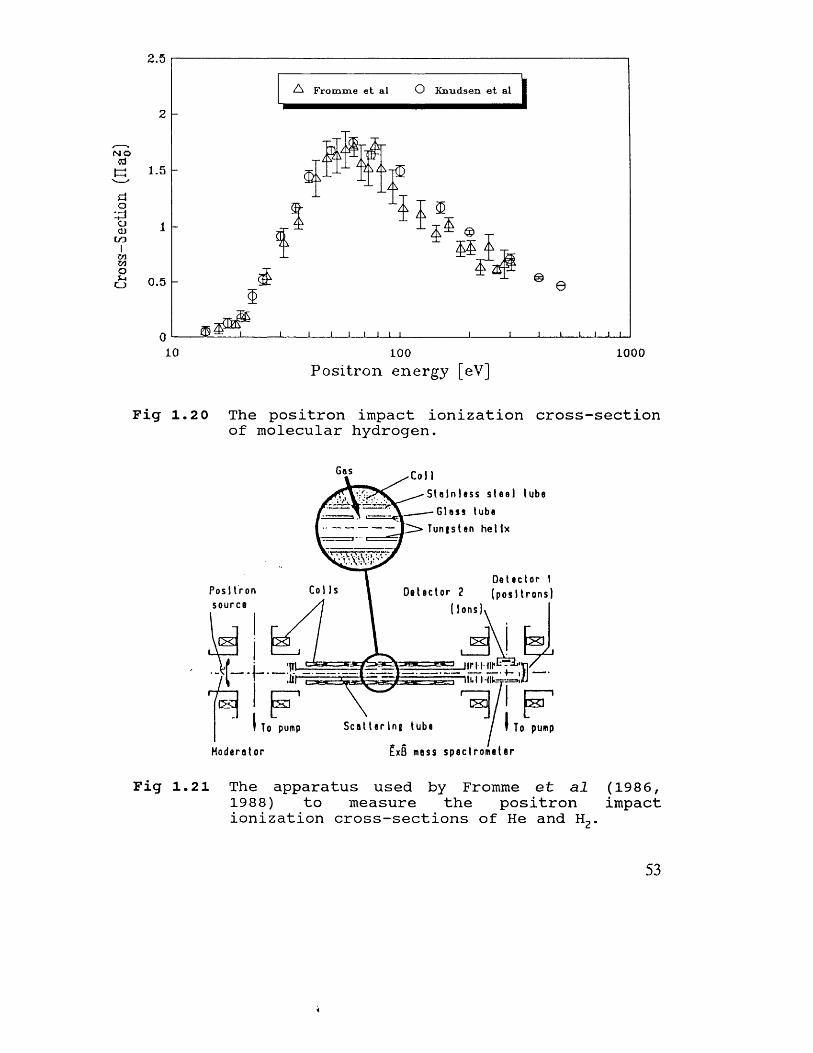
The RP-TOF apparatus used by Sueoka and Mori (1984) 52to measure the positron impact ionization cross-sections of He, Ne and Ar.
The apparatus used by Diana et al (1985) to measure the 52positron impact ionization cross-section of He.
The positron impact ionization cross-section of 53 molecular hydrogen.
6
The apparatus used by Fromme et al (1986, 1988) to measure the positron impact ionization cross-sections of He and H2.
The apparatus used by Knudsen et al (1990) to measure the positron mpact ionization cross-sections of He,Ne, Ar and H2.
The ratio of double-to-single ionization cross-sections of He for e', e +, p and p (from the data of Charlton et al, 1988, 1989 and Andersen et al, 1987).
A block diagram of a typical crossed-beam experiment to measure the ionization cross-sections of gases showing the quantities in equations (1.16) and (1.17).
A schematic diagram of the apparatus used by Fite and Brackmann (1958) to measure the electron impact ionization cross-section of atomic hydrogen.
The measured electron impact ionization cross-sections of atomic hydrogen.
A schematic diagram of the apparatus used by Shah et al (1987) to measure the electron impact ionization cross-section of atomic hydrogen.
A diagram of the apparatus used by Spicher et al (1990) to measure the positron impact ionization cross-section.
The measured ionization cross-sections of Spicher et al (1990) for (a)
Electron impact ionization cross-sections of atomic hydrogen calculated using the Binary Encounter Approximation.
A diagram showing the notation that is employed in the discussion of classical calculations in the text.
2.3 Positron impact ionization cross-sections of atomic 72hydrogen calculated using the Classical Trajectory MonteCarlo (CTMC) method.
2.4 The notation used in the present discussion of quantum 76mechanical systems for (a) the pre- and (b) post-collision systems.
2.5 Electron impact ionization cross-sections calculated using 80the first Born approximation which are suitable for consideration in positron scattering (see text).
2.6 The electron impact ionization cross-section of atomic 84hydrogen calculated using the Glauber approximationbut allowing for the possibility of exchange.
2.7 The positron impact ionization cross-section calculated 88using the indicated models (see text) by Ghosh et al (1985).
2.8 The positron impact ionization cross-section of atomic 88hydrogen calculated using different models (for detailssee text) by Mukherjee et al (1987).
2.9 The results of distorted wave calculations of the positron 91impact ionization cross-section of atomic hydrogen using different forms of the polarization potential V POL, seetext for details.
2.10 The positron impact ionization cross-section of atomic 91hydrogen calculated using different models incorporatingfinal state correlation by Campeanu (1990).
3.1 A cut-away diagram of the source/moderator holder 96showing the brass plug on which the source is held andthe W moderator meshes.
3.2 A schematic diagram of the evacuated positron beam 98system.
The acceptance angle (see text for definition) of the positron beam transport system over a range of positron energies.
A schematic diagram of the microchannel plates used for positron detection in this experiment.
(a) A schematic diagram of the Pd-Ag hydrogen gas leak valve.(b) A graph showing the variation of hydrogen pressure in the gas handling system with current passing through the Pd-Ag leak valve.
A schematic diagram of the radio-frequency discharge tube used in this experiment.
A diagram of the resonator cavity cut away to show the helical inner conductor.
A schematic diagram of the electrostatic ion extraction system used in this experiment, the nozzle of the RF discharge tube is located centrally between the ion extraction plates.
A diagram of the trajectories of H + ions after extraction from different parts of the interaction region, showing the spatial focusing properties of the extraction optics.
A block diagram of the timing electronics.
A circuit diagram of the pulser unit that applies ± 100V pulses to the ion extraction plates on the input of a shaped output pulse from the positron detector.
4.2 The measured ion yield as a function of gas pressure at 121different positron energies (a) below 150eV, (b) above200eV.
4.3 A plot of the measured ion yield against positron energy, 123having normalized all points to the data of Knudsen etal (1990) at lOOeV which is shown smoothed (—).
4.4 The ion yield shown as a function of extra delay 123added to the onset time of the extraction pulse.
4.5 The H 2 ion yield shown at diiferent energies as a 126function of the potential applied to the positron extraction tube.
4.6 The H 2 ion yield plotted over a range of energies 126having normalized it to the data of Knudsen et al (1990)at lOOeV, this being shown smoothed (----- ).
4.7 The H 2 ion yield plotted against electron beam intensity 127for an electron energy of 300eV.
4.8 Ion yields measured over a range of energies with an 128electron beam, the data has been normalized to the corrected data of Rapp and Englander-Golden (see text)which is shown smoothed (-----).
4.9 A coincidence spectrum taken with the discharge on and 132a lOOeV positron beam showing the peaks due to H +ions and, at longer time, H^.
4.10 The H + ion yield plotted as a function of the magnitude 134of the dc offset potential applied to the ion extractionplates.
5.1 The calculated doubly differential cross-section for 137electron emission of Macek (1970) for 300 keV protons incident on He. The experimental data of Rudd et al (1966) is shown for comparison.
10
The reduced cross-section o c for capture to a continuum state of Rodbro and Andersen (1979) compared with reduced cross-sections for capture to bound states derived from literature.
The energy distribution of electrons emitted at 0° in positron impact ionization of H at lOOeV as calculated by Mandal et al (1986).
The energy distribution of electrons emitted at 0° in the ionization of H atoms by IkeV positrons, as calculated by Brauner and Briggs (1986).
The energy distribution of electrons emitted in the ionization of H by lOOeV positrons, calculated at various angles by Schultz and Reinhold (1990). Also shown are the scaled 0° results of Mandal et al (1986).
The emitted electron count versus retarding potential reported by Coleman (1986) for positron impact ionization of Helium.
Electron count versus retarding potential for positron impact ionization of neon reported by Charlton et al (1987) ( • ) shown with the integrated results of Brauner and Briggs’ (1986) (□).
A cut-away diagram of the source region
A schematic diagram of the experimental apparatus showing the primary positron beam transport and electron collection and detection systems.
A graph showing the acceptance angle of the electron detection system used in this experiment for both magnetic field strengths (a) 15 Gauss and (b) 25 Gauss.
A schematic diagram of the interaction region.
A schematic diagram of the timing electronics.
The time-of-flight spectra of electrons detected after the ionization of Argon atoms by lOOeV positrons in magnetic fields of (a) 15 Gauss and (b) 25 Gauss
(a) A plot of the observed positions of the peaks in the electron energy distributions against those values of electron energy expected from theory at 15 Gauss.(b) A plot of the observed positions of the peaks in the electron energy distributions against those electron energies expected from theory at 25 Gauss.
Curves drawn through the relative positron (----- ) andelectron (—) ionization cross-sections of H2 measured in this experiment to illustrate comparisons made in the
TableTABLE CAPTIONS
Page
1.1 Developments in slow positron moderators. 24
1.2 A table showing the possible reactions in e+-H scattering 65which give rise to ions and the notation that is used for the cross-section of each.
5.1 A table showing the potentials that are applied to parts of 153the CEMA2 assembly when detecting e' or e+.
13

ACKNOWLEDGEMENTS
I would like to express my gratitude to those who have supported, encouraged and
helped me over the course of my postgraduate work.
For their supervision and tuition I would like to thank Drs Mike Charlton and Nella
Laricchia and Prof Ceiri Griffith.
For their invaluable technical assistance I must thank Ivan Rangue, Ted Oldfield,
Brian Humm, Bill Lenihan and Niall Murphy.
I should also acknowledge the advice given on particular aspects of the work by Prof
J A Slevin, Drs A C H Smith, D L Moores and A Kover.
Neither can I overlook the contributions of the following to my general welfare over
the last few years: Zoe, Bing, Dave, Flowel, Nevs, Dave, Annette, Jon, Mogens,
Jeremy, Iain, Nazrene (especially for joggling my thesis so expertly) and Sfle.
Finally and foremost I wish to thank my parents Beryl and John Jones without whose
ceaseless encouragement and support throughout the course of this work and before,
it would never have been accomplished.
14

I Mam, Dad a Nain
ag er cof am Taid
15
CHAPTER 1
INTRODUCTION
1.1 Historical Background
The existence of antimatter was first predicted by Dirac (1930a) when proposing a
physical interpretation of solutions to his relativistic wave equation requiring
electrons to have negative total energies. Dirac formulated his model by considering
Einstein’s relation between the energy E of a particle of rest mass mQ and its
momentum p, with c being the speed of light in vacuo
E2- m y + p 2c2 ( l . «
One can then assume that all energy states below -m0c2 (-m0c2>E>-°o) are filled with
electrons. The Pauli exclusion principle then forbids the transition of free electrons
from the positive states to the occupied negative states. However, if an electron in
the negative levels gains enough energy it can go to a positive level leaving a hole
in the negative "sea of electrons". This hole will behave as a positive particle. Dirac’s
reluctance to propose the existence of a new particle led to his suggestion that these
holes corresponded to protons but Weyl (1931) showed that the new particle had to
have the same mass as an electron. The particle became known as the positron, e +.
Experimental confirmation of its existence was subsequently obtained by Anderson
(1932) in cloud chamber studies of cosmic ray showers. His results were subsequently
corroborated in an experiment by Blackett and Occhialini (1933).
Initially, considerable interest was shown in positrons as the only available example
of antimatter. Although this has paled somewhat with the discovery of other
16
antiparticles the ready availability of positrons from radio-isotopes has ensured their
rapid development as probes of atomic interactions in gases and of the bulk and
surface properties of condensed matter. The complementarity of these investigations
to those employing electrons is a consequence of the different charge signs but equal
masses of the particles. This leads to the distinguishability of projectile positrons from
target atom electrons unlike the electron case where exchange effects must be taken
into account.
Another difference is the possibility of annihilation with one of the electrons in the
target with the emission of y-rays. Observation of this phenomenon in swarm
experiments involving positrons allows the determination of the momentum
distributions of electrons in solids and the study of the interaction mechanisms of
positrons with gas atoms. Reviews of such experimental work for gases can be found
in Griffith and Heyland (1978) and Charlton (1985) and for solids in Schultz and
Lynn (1988).
Of great importance is the attractive nature of the positron-electron Coulomb
interaction. This can lead to a high degree of correlation between the particles if they
are free with the possible outcome of forming a quasi-stable bound state-positronium,
Ps. Its existence was predicted by Mohorovicic (1934) and confirmed experimentally
by Deutsch (1951). The simplicity and purely leptonic nature of this system has led
to extensive theoretical treatments with a view to testing the accuracy of the bound
state aspects of Quantum Electrodynamics (QED) (e.g. Wheeler, 1946 and Fulton
and Martin, 1954).
Another bound state system involving a positron whose synthesis would be of great
value is antihydrogen (H). This bound state of two antiparticles, the positron and
antiproton, would again be a candidate on which stringent tests of QED could be
performed. Its study would also allow the most accurate tests of CPT invariance to
date, this is the symmetry that states that the laws of physics are the same for matter
17
and antimatter and is integral to gauge field theories. Current experimental efforts
to produce antihydrogen are discussed in detail by Charlton (1989) and Poth (1989).
The study of positron scattering processes developed significantly in the late 1960s
with the advent of slow positron beams. On the implantation of fast (3+ particles
certain solids were found to emit positrons with energies of a few eV. Their
subsequent acceleration and collimation allows the energy dependence of individual
atomic scattering processes to be ascertained. The main body of this work will detail
such a study.
1.2 Basic Properties of the Positron and Positronium
The mutual annihilation of positrons and electrons is likely to result in the emission
of a number of y-ray photons. If both are at rest their total energy will be the sum
of their rest mass energies, 1.022MeV. Conservation of charge parity, Pc determines
the number of photons, ny that are emitted. Since a single photon has Pc=-1, a
system of ny photons will have
/>c- ( - l ) nt (1-1)
Using symmetry arguments Yang (1950) has showed that, in positron-electron
annihilation
Pc- ( - l ) L+s (x-3)
where L is the total angular momentum and S is the total spin of the system. The
detection of annihilation radiation therefore yields information on the relative states
of the annihilating pair.
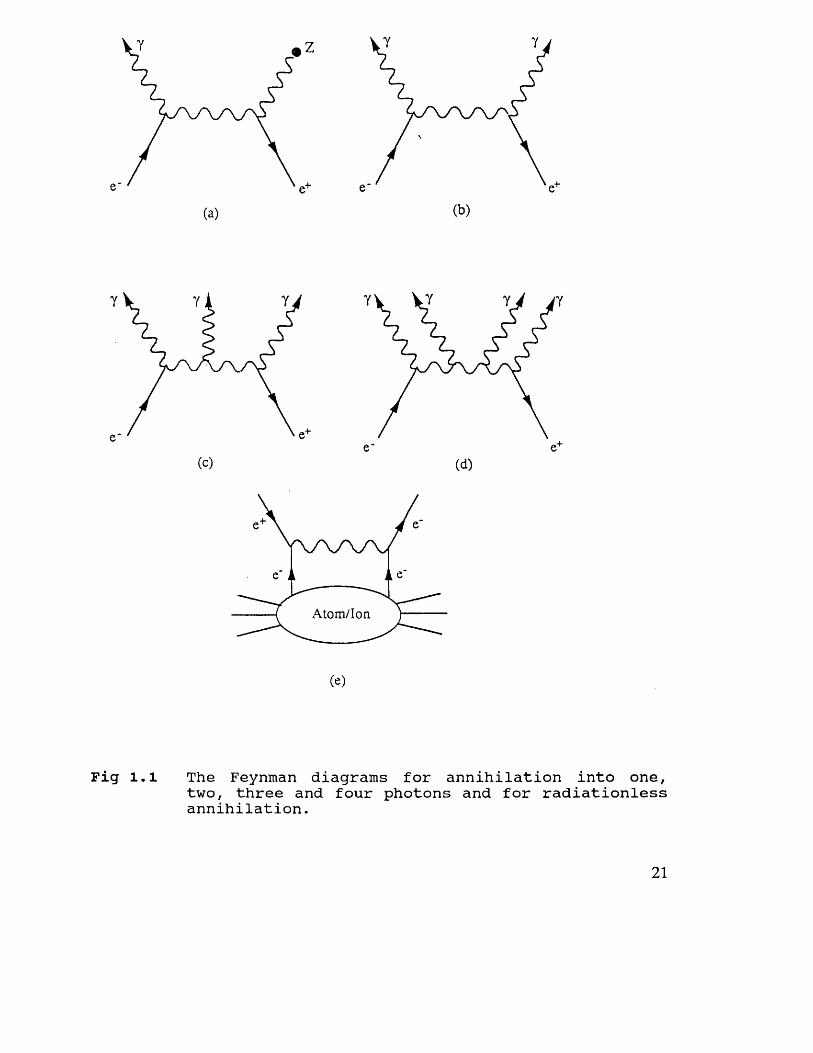
The probability of any given number of photons being emitted can be deduced from
the Feynman diagrams for the interaction. Figure 1.1 shows the diagrams for
18
annihilation into zero, one, two, three and four photons. The probability of an
interaction occurring is given approximately by am where a is the fine structure
constant (a « l/1 3 7 ) and m is the number of vertices on the Feynman diagram i.e. the
number of points where photons interact with other particles. Both cases (a) and (c)
in Fig. 1.1, for annihilation into one and three photons respectively have m =3 but
the required presence of a third body in case (a) to conserve momentum makes case
(a) less likely to occur by a factor a3. Of cases (a) to (c) case (b) is therefore the
most likely, followed by case (c). Case (d)-annihilation into four photons-with four
vertices is less likely still but, nevertheless, has been observed recently (Adachi et al,
1990). Radiationless annihilation, depicted in case (e), was first proposed by Brunings
(1934). Here a positron annihilates with a bound electron and the energy liberated
releases another electron from the atom. Its branching ratio was subsequently
calculated more accurately by Massey and Burhop (1938) and their conclusion was
that, although rare compared to the other annihilation modes, it should still be
observable. It is clear from these considerations that annihilation into two y-rays is
the most probable, in fact Ore and Powell (1949) have calculated that the ratio of
the cross-section for annihilation into two y-rays to that into three y-rays is 1:372 for
free positrons.
Dirac (1930b) derived the following expression for the cross-section for the
annihilation into two y-rays of a non-relativistic positron with a free electron, a2y
CT (1-4)2Y
o owhere v is the positron velocity and r0 = e /47re0m0c is the classical electron radius
with e0 being the permittivity of free space, m0 being the electronic mass. If there
is a number density, ne of electrons present one can write from (1.4) for the observed
rate of annihilation of positrons into two y-rays, X2y
19
X^-Tzrlcri' (1.5)
In a gas of number density, p this can be written
A.2T-* r02cZ„/v)p (1-6)
where Z eff is the effective number of electrons per atom seen by a positron of
velocity v. It differs from the atomic number, Z because of the polarization of the
atom by the approaching positron. As this is only significant at low positron energies
Zeff approaches Z at energies commonly encountered in positron beam experiments.
At these energies it has been shown that a2y is ~ 10_26cm'2 so the likelihood of
positron annihilation is negligible compared to that of the other scattering channels
that are investigated in beam experiments.
An alternative reaction to annihilation in which the positron can participate is the
formation of Ps given by the reaction
e '+ X -P s+ X *
where X is any atom or molecule. The threshold energy for this reaction, EPs is given
by
EPs-(Er 6. S)eV (1*7)
with the binding energy of ground state Ps being 6.8eV, half that of hydrogen with
the Bohr radius being correspondingly double (1.05A). Ps has a finite lifetime
depending on the relative spins of its component particles, this is again governed by
equation (1.3). If the particles’ spins are parallel ortho-positronium (o-Ps) is formed,
this state has L + S = 1 and has therefore three magnetic substates. Equation (1.3) then
predicts that it will annihilate with the emission of an odd number of photons, three
20
(a) (b)
Y
e
(c)
Y
»+e e'(d)
Atom/Ion
(e)
Fig 1.1 The Feynman diagrams for annihilation into one, two, three and four photons and for radiationless annihilation.
21
being the most likely. This gives it a longer lifetime than the singlet state (L +S = 0)
para-positronium (p-Ps) which is most likely to emit two colinear photons.
Calculations have borne this out with Harris and Brown (1957) finding the self-
annihilation rate of p-Ps to be 0A.p_ps=7.9852ns'1 compared to Caswell and Lepage’s
(1979) result for o-Ps of 0^o.ps = (7.0386 ± 0.0002)jus"1. The short lifetime of p-Ps
makes the experimental determination of its decay rate difficult but Gidley et al
(1982) employed the Zeeman effect to mix it with the m = 0 substate of o-Ps in a
magnetic field and obtained a result in accordance with theory. The most accurate
measurement to date for o-Ps is however (7.0482± 0.0016)m s_1 by Nico et al ( 1991)
which is significantly different to theory*,, the authors cannot ascribe this discrepancy
to systematic effects but suggest that the calculation may be inadequate and
suggested the need for higher order corrections.
1.3 The Development of Slow Positron Beams
In this section the development over the last forty years of increasingly efficient
sources of slow positrons shall be reviewed. The milestones in this field are
summarized for convenience in Table 1.1.
Although early positron swarm experiments proved valuable in the discovery of
positronium, Ps (Deutsch, 1951) and as probes of gaseous and solid media the
limitations imposed on the amount of information derivable by the broad positron
energy distribution became apparent. A technique involving positrons that was
analogous to the widely used electron beams was required hence the need for a
variable energy, monochromatic positron beam. The possibility that positrons with
thermal energies could be obtained on implanting fast p + particles from a
radioactive source into a solid and allowing them to diffuse back to the surface was
first suggested by Madansky and Rasetti (1950). They correctly predicted that the
efficiency of such a "moderator" of the positrons’ energies was given by the ratio of
the diffusion length of the positrons to the implantation depth in the solid. This they
22
calculated to be ~ 10"3 for their experiment in which samples of various materials
were irradiated by a 64Cu source. Positron detection was to be by means of y-ray
detectors observing the annihilation of positrons on an Al plate 80 cm away from the
moderator sample in an axial magnetic field. They obtained a null result for each
sample which is now thought to be due to the poor resolution of the experiment and
the quality of the samples although at the time it was claimed that it was due to Ps
formation and e + trapping in bulk defects and at the surface-two phenomena that
are now known to be of great significance.
The first observation of slow positron production in this manner was from a Cr
covered mica surface by Cherry (1958). In this experiment the positrons were
extracted electrostatically and the moderation efficiency, e was measured to be 3x10'
8. The significance of this work was not realized until Madey (1969) performed a
similar experiment with a polyethylene sample and Groce et al (1968) used gold.
Greater understanding of the process of positron moderation was abetted by the
study of Costello et al (1972a) of the energy distribution of positrons emitted from
gold. The experiment involved producing fast positrons by pair production from
bremsstrahlung y-rays emitted on the slowing down of 55MeV electrons from a linear
accelerator (LINAC). These positrons were implanted into gold coated mica and
CsBr crystals. This work revealed that the positron work function, 0 + for Au was
negative. This concurs with the theoretically determined result of Tong (1972) who
postulated that positrons would be ejected from metals with a negative positron work
function and would have an energy 0 + . Tong also predicted negative values of 0 +
for Al, Mg and Cu. Although subsequent experimental work has shown that this
model is valid, Lynn (1980, unpublished) has measured 0 + for Au to be positive
suggesting that the results of Costello et al (1972a) cannot be explained by this
mechanism. Possible explanations are that these positrons may not have thermalized
in the sample or that surface impurities made 0 + negative.
23
Moderator ExperimentalArrangement
Efficiencye
AE[eV]
Reference
Pt, K, Ga Transmission 0 - Madanski & Rasetti (1950)
Cr/Mica Transmission 3xl0"8 - Cherry (1958)
Au/Mica Transmission I-* o I •v
j
2 Costello et al (1972)
MgO coated Au Backscattering/Vanes
3xl0'5 2.3 Canter et al (1972)
B Self-moderator 10'7 0.15 Stein et al (1974)
Al(100) Backscattering 3xl0'5 0.1 Mills et al (1978)
C u (lll) + S Backscattering 9xl0‘4 0.3 Mills (1979)
W Backscattering/Vanes
7xl0'4 1.3 Dale et al (1980)
W(110) Backscattering 3xl0"3 0.7 Vehanen et al (1983)
W(100) Transmission, High vacuum
6xl0"4 3 Lynn et al (1985)
Ne Transmission 7xl0'3 0.58Mills &Gullikson (1986)
W(100)Transmission, High vacuum
5.9xl0‘4
- Gramsch et al (1987)
Ni(100) 6.6xl0'4
Mo 7.5xl0'5
W(100) Transmission, Low vacuum annealing
8.8xl0’4 1.7Zafar (1990)
Ni(100) 6.5xl0'4 0.3
Mo Transmission/ Low vacuum annealing
4xl0’4 0.8 Andrikoupoulos, Avdi & Laricchia (1991)
Diamond Field assisted/ Backscattering 7xl0’3
Brandes et al (1991)
Table 1.1 Developments in slow positron moderators.
24
A far more efficient positron moderator was discovered by Canter et al (1972). An
efficiency of 3xl0"5 was achieved using MgO coated gold vanes-this then prompted
the increasing use of positron beams to measure total cross-sections (see section 1.4).
The model of Tong (1972) could not however explain the effectiveness of this
moderator. It was suggested that slow positron production from this moderator was
an indirect process in which a positron formed excited positronium, Ps* which
subsequently broke up. Field ionization in a charge layer at the non-conducting
surface due to liberated electrons was proposed as the mechanism for Ps break-up
(Griffith et al, 1978). Jacobs (1951) had previously postulated that such a charge layer
was responsible for an observed enhancement in secondary electron emission from
oxide layers upon electron bombardment-a concept which was supported by later
experimental results. There have been subsequent studies of other non-conducting
moderators, most notably solid rare gases by Gullikson and Mills (1986). These
moderators have yielded results which are not in accordance with this model and are
discussed fully below.
A new development in moderator technology came in 1974 when Stein et al used a
self-moderating source. Here, a boron target was bombarded with 4.75 MeV protons
from a Van de Graaf generator to produce n C by the reaction
6Lc“ 15l f J + e * + v s
The fast positrons produced here are moderated in the bulk of the B and are emitted# n
with a very low energy spread (~0 .1eV ) and an efficiency of 10 . By virtue of this
Kauppila et al (1976) observed a Ramsauer-Townsend minimum in the e +-Ar total
cross-section using this source-moderator arrangement.
While these different types of moderators were being developed, metallic moderators
25
were still under investigation. Pendyala et al (1976) studied the emission properties
of various polycrystalline samples and achieved their maximum efficiency with Cu.
But this work did not add greatly to the understanding of moderators and the
moderation process because the structure and purity of the samples were not known.
This situation was rectified by Mills et al (1978) who investigated the moderating
properties of various pure well-characterized samples. These included Al(100), Cr
and Si(100), where the numbers denote the orientation of the crystal face.
Efficiencies of 3xl0'5 were achieved. Following this study, the authors deduced the
mechanism of slow positron emission from metals, a brief discussion of which now
follows.
On implantation in the bulk of the moderator material a fast p + particle loses energy
to electrons in the solid. It loses energy via processes such as plasmon emission and
electron-hole pair creation. Whilst thermalizing, a fast positron can diffuse towards
the surface of the moderator but for stopping distances that are typical for high
energy p + particles most thermalize before reaching the surface. Therefore those
which do diffuse to the surface before annihilating will arrive there thermalized.
Thermal positrons at the surface of a solid can undergo one of four processes: Ps
formation, trapping in a surface state, reflection or ejection into the vacuum. The
latter process which is that of slow positron emission from solids requires the
material to have a negative positron work function. The work function of any
material is defined as the minimum energy necessary to remove a particle from a
point just inside to one just outside the surface. For electrons it was defined by Lang
and Kohn (1971) as the difference between the surface dipole barrier, <5 and the bulk
chemical potential, /x_
4> - 6 - p (1*7)
26
Tong (1972) analogously expressed the positron work function as
<j>+--6-[i+ (1.8)
where fi + is the bulk chemical potential for a positron. The potentials that a positron
encounters at the surface of a solid are shown in Figure 1.2. Tong (1972) represented
the contribution of ion cores in the bulk to the potential a particle experiences at the
surface with "jellium": an uniform positive background which is calculated as the
mean potential a particle feels at an interstitial site in the lattice from the ion cores.
The bulk chemical potential, /x ± is the sum of this and the potential of the uniform
electron gas in the bulk. The electron gas "spills out" into the vacuum at the surface
and gives rise to a negative charge just outside the interface. This forms a dipole with
the positive charge inside whose electrostatic interaction with a particle is expressed
as S as shown in Figure 1.2. This helps bind electrons to the solid but because of
their opposite charge sign it tends to eject positrons from the material as it can
cancel out m+ in equation (1.8) and even make 0 + negative. In adiabatic conditions
the maximum energy an emitted positron can then have is <p + . In practice the
thermal motion of surface atoms gives rise to a small energy spread around in the
emitted positron energy distribution. Murray and Mills (1980) have investigated the
dependence of moderation efficiency on <p+. They did this for Cu and Al samples by
changing the crystal orientation, changing the amount of surface coverage by sulphur
and heating the sample. Their results are shown in Figure 1.3 and show a clear
increase as 0 + is made more negative thus lending support to the above model of
slow positron emission from metals.
Dale et al (1980) then studied the dependence of moderation efficiency on the
structural characteristics of the moderator. A variety of metal samples were treated
in different ways prior to installation in an electrostatic positron beam system. The
best yield obtained was 7xl0'4 from an arrangement of W vanes. These had
previously been etched chemically and annealed by resistive heating to 2200 °C. On
27
(P+= - G - M+
J e l l iu m
V a c u u m Level
T ota l P o t e n t i a l
C o n d u c t io nE le c t r o n s
m e t a l \ v a c u u m
Fig 1.2 The potential energy encountered by a positron at the surface of a metal.
0.6
1.20.80 0.4
Fig 1.3 Slow positron yield as a function of the positron work function for Cu (Murray and Mills, 1980).
28
further investigation it transpired that the annealing process was a far more
significant process in increasing the yield than the removal of surface contaminants
by chemical etching. This was because, on heating, the lattice structure of the W
relaxed and then recrystallized as it cooled. Defects in the crystalline structure are
thus removed and there being fewer sites for diffusing positrons to be trapped, the
diffusion length, and hence the moderator efficiency, is increased.
It was also discovered in the study of Dale et al (1980) that the annealing of W
removes all adsorbed O from its surface. During subsequent exposure to air the
extent of adsorption will not exceed about two monolayers of O - it was concluded
that this inertness made W a very useful positron moderator especially when working
in non-UHV conditions. Using a single crystal sample instead of the polycrystalline
W used above Vehanen et al (1983) obtained an efficiency of 3xl0"3, close to the
maximum expected efficiency for W of 4xl0'3 calculated by Vehanen and Makinen
(1985).
The extraction of slow positrons from the source-moderator arrangement is clearly
highly dependent on its geometry. All the systems described thus far have employed
backscattering or vane geometries for the moderator, these are depicted in Figure
1.4 (a) and (b) respectively. Another widely used arrangement is the mesh moderator
- this is shown in Figure 1.4 (c). In cases (b) and (c) the dimensions of the source are
unimportant but in case (a) this is not so because the source obscures part of the
moderator and therefore intercepts some of the re-emitted positrons. The size of the
source must therefore be kept to a minimum when using the backscattering geometry
so radioactive isotopes with a high specific activity (activity per unit mass) such as
58Co must be used to maintain a high flux of (3+ particles. When this is not a
consideration 22Na with a lower specific activity but a conveniently long half-life of
2.6 years (more than 13 times that of 58Co) is normally used.
Figure 1.4 (d) shows the cup geometry onto which Mills and Gullikson (1986)
29
(a)
(c)
(e)
(d)
Fig 1.4 Source-moderator geometries: (a) Backscattering;(b) Vanes; (c) Mesh; (d) Cup; (e) Transmission
30
condensed the rare gases Ne, Ar, Kr and Xe to make the first solid rare gas
moderators. The maximum efficiency achieved was (7.0±0.2)xl0 with a layer of
solid Ne deposited on the cup. This was the most efficient slow positron moderator
then produced. The authors explain their results in terms of the "hot positron" model
which assumes that the positrons are not thermalized prior to emission. They
postulate that implanted positrons will lose energy by making inelastic collisions
involving electronic transitions until their energy falls below the threshold for these
processes. Subsequent energy loss will be via phonon emission but since the
maximum phonon energy is small (e.g. 8.3meV for Ar) positrons diffuse a long
distance before thermalizing (~5000A in Ar) and some are likely to reach the
surface and be emitted if their energies are greater than the positron work function
0 + (0+ >0 for rare gas solids). On measuring the slow positron yield over a range
of implantation energies the authors deduced the variation of yield with positron
implantation depth. Extrapolation of this yield to zero implantation depth revealed
that slow positron emission was considerably more probable than the formation of
Ps at the surface-this contradicts the field-ionization model of Griffith et al (1978).
Figure 1.4 (e) shows the transmission geometry as first used by Chen et al (1985).
This has the advantage over the other geometries of a smaller energy spread for the
emitted positrons as with the backscattering case but without the associated problem
of source shadowing. In the study of Chen et al (1985) single crystal W(100) films of
varying thicknesses were grown epitaxially on a M gO/M o substrate which was
subsequently removed by chemical etching. These films were then annealed in situ
to remove defects and surface contaminants. The FWHM of the emitted positron
energy distribution was found to be less than half an eV. In a later study Lynn et al
(1985) report an efficiency of 4xl0'4 for a W(100) film prepared in this manner.
These results encouraged further investigation of the properties of thin film
transmission moderators. Samples which have been studied and were demonstrated
31
to be potentially useful moderators include W, Ni and Mo. Specific references and
results are cited in Table 1.1 but it is of interest to note the recent work of
Andrikoupolos, Avdi and Laricchia (1991) with single crystal Mo in which it was
ascertained that half of the observed energy spread of ~800m eV arises from the
wide angular distribution of emitted positrons. This complements the study of
Gullikson et al (1985) which revealed a similar effect for W(110) and Ni(100) except
that in the U H V conditions used and accordingly less surface contamination the
observed energy spread was almost entirely the result of the angular distribution of
positrons. These experiments therefore support the theory that positron emission
from metals is an elastic process which, in adiabatic conditions, would produce mono-
energetic positrons with energy <p +.
Although these developments are leading to more well-defined positron beams their
spatial spreads are still too broad for many applications e.g. some surface studies
such as low energy positron diffraction. Focussing on its own cannot overcome these
difficulties since, as pointed out by Mills (1980), Liouville’s theorem states that in a
conservative field the volume occupied by a swarm of particles in phase space
remains constant. This implies the constancy of the quantity d2Esin20 for a beam of
particles of energy E which has a minimum diameter d and angular divergence 0. If
the beam is of intensity I one can define the brightness per unit energy as
£(£)- - . L (1.10)d 2Esin2Q
Focussing would therefore improve one or more of d,0 or E at the expense of
worsening others. Mills (1980) went on to suggest that the non-conservative process ry
of moderation might produce a brighter flux without diminishing d or 0 but with,
of course, a decrease in I. This, he suggested, could be achieved by focussing high
energy positrons onto smaller areas on successive re-moderators thus increasing B(E)
by several orders of magnitude. The first experimental demonstration of this process,
32
brightness enhancement, was by Frieze et al (1985) but a more recent experiment by
Brandes et al (1988) increases B(E) by a factor of 500. Such work aids the
development of positrons as probes of surfaces and bulk media, a purpose for which
they are potentially valuable sources of information.
1.4 The Measurement of Slow Positron Scattering Cross-Sections
The first positron scattering cross-section to be measured was the total cross-section
of H e by Costello et al (1972b) but this data is now known to be inaccurate. As
sources of slow positrons became more efficient several other groups measured total
cross-sections for various gases. Experiments to measure the total cross-section for
scattering processes in gases generally involve observing the attenuation of a beam
of particles through an extended region in which the gas is confined. In these
circumstances the total cross-section ctt can be defined
/ - / 0exp(- p/a r) (1.9)
where I0 is the intensity of a beam entering a gas column of length 1 and number
density p and I is the intensity of the beam leaving the scattering region. The gas
density, n can be related to the measurable quantities pressure and temperature by
simple relations deriving from kinetic theory. In total cross-section measurements
with positrons the attenuation was either observed directly or inferred from time-of-
flight spectra with and without gas present.
Shown in Figure 1.5 are the low energy total cross-sections measured for He by
Canter et al (1972), Stein et al (1978), Coleman et al (1979), Mizogawa et al (1985)
and Wilson (1978), the latter being corrected by Sinapius et al (1980). It is notable
that the narrow energy spread of the positron beam (< O.leV) of Stein et al permitted
33
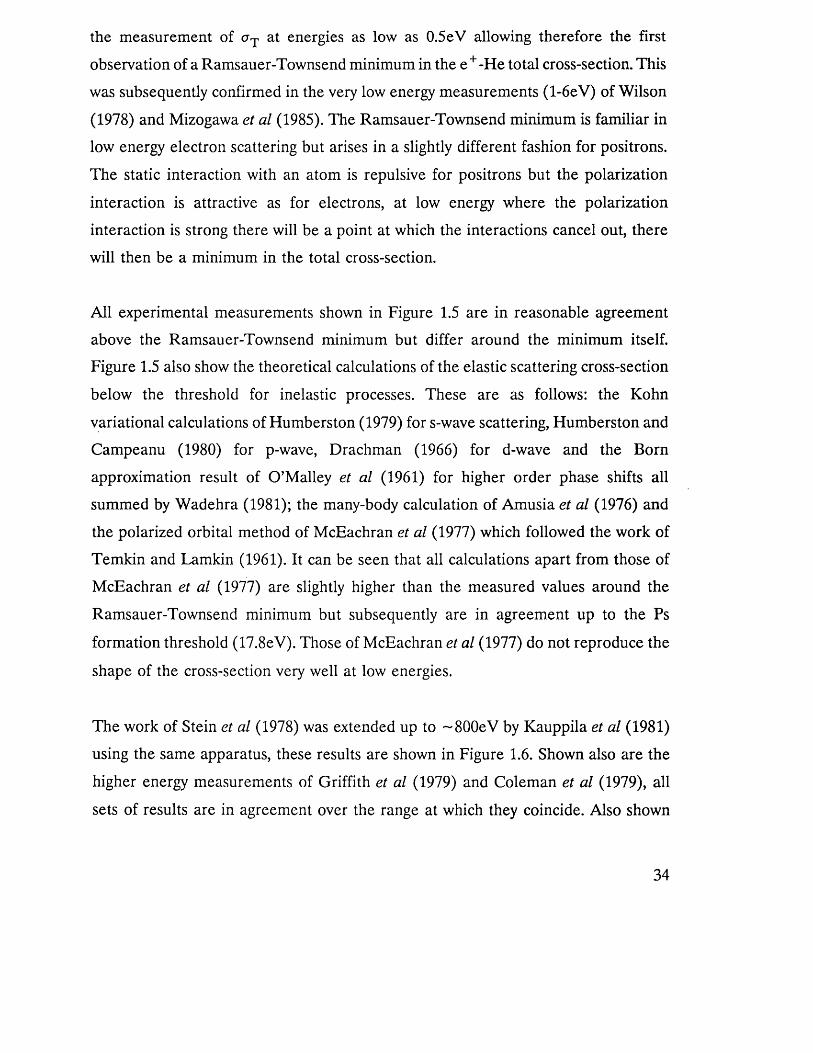
the measurement of crT at energies as low as 0.5eV allowing therefore the first
observation of a Ramsauer-Townsend minimum in the e +-He total cross-section. This
was subsequently confirmed in the very low energy measurements (l-6eV ) of Wilson
(1978) and Mizogawa et al (1985). The Ramsauer-Townsend minimum is familiar in
low energy electron scattering but arises in a slightly different fashion for positrons.
The static interaction with an atom is repulsive for positrons but the polarization
interaction is attractive as for electrons, at low energy where the polarization
interaction is strong there will be a point at which the interactions cancel out, there
will then be a minimum in the total cross-section.
All experimental measurements shown in Figure 1.5 are in reasonable agreement
above the Ramsauer-Townsend minimum but differ around the minimum itself.
Figure 1.5 also show the theoretical calculations of the elastic scattering cross-section
below the threshold for inelastic processes. These are as follows: the Kohn
variational calculations of Humberston (1979) for s-wave scattering, Humberston and
Campeanu (1980) for p-wave, Drachman (1966) for d-wave and the Born
approximation result of O’Malley et al (1961) for higher order phase shifts all
summed by Wadehra (1981); the many-body calculation of Amusia et al (1976) and
the polarized orbital method of McEachran et al (1977) which followed the work of
Temkin and Lamkin (1961). It can be seen that all calculations apart from those of
McEachran et al (1977) are slightly higher than the measured values around the
Ramsauer-Townsend minimum but subsequently are in agreement up to the Ps
formation threshold (17.8eV). Those of McEachran et al (1977) do not reproduce the
shape of the cross-section very well at low energies.
The work of Stein et al (1978) was extended up to ~800eV by Kauppila et al (1981)
using the same apparatus, these results are shown in Figure 1.6. Shown also are the
higher energy measurements of Griffith et al (1979) and Coleman et al (1979), all
sets of results are in agreement over the range at which they coincide. Also shown
34
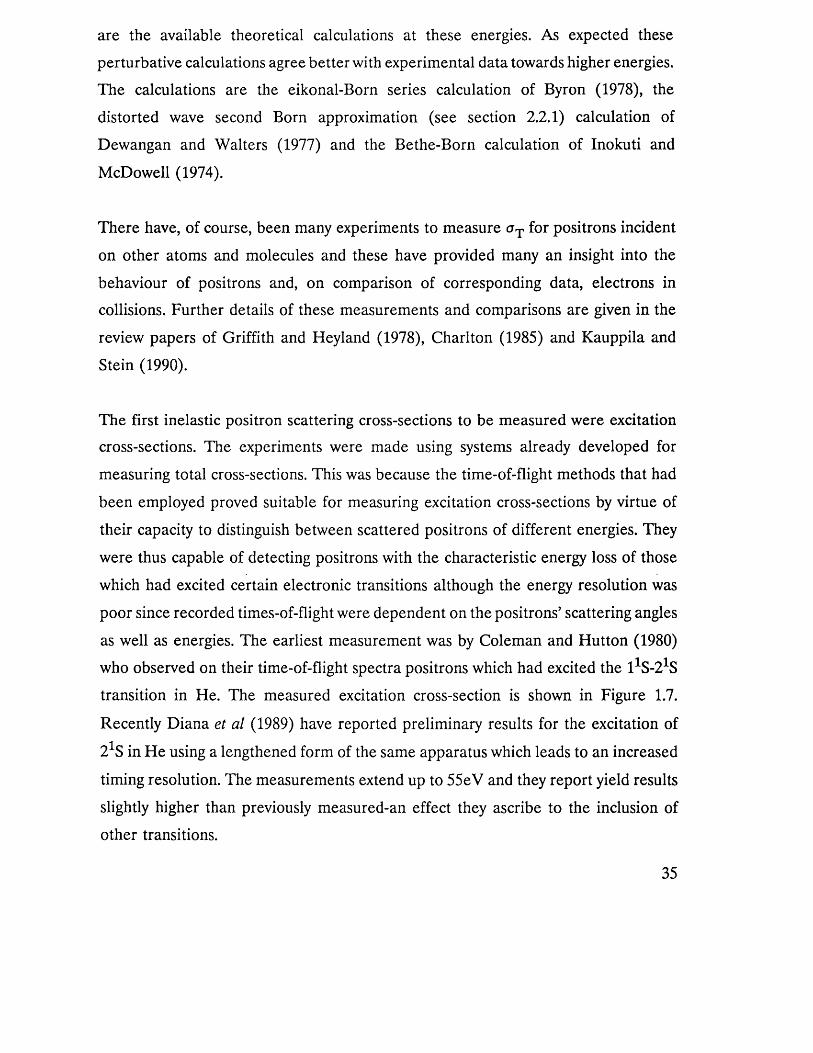
are the available theoretical calculations at these energies. As expected these
perturbative calculations agree better with experimental data towards higher energies.
The calculations are the eikonal-Born series calculation of Byron (1978), the
distorted wave second Born approximation (see section 2.2.1) calculation of
Dewangan and Walters (1977) and the Bethe-Born calculation of Inokuti and
McDowell (1974).
There have, of course, been many experiments to measure aT for positrons incident
on other atoms and molecules and these have provided many an insight into the
behaviour of positrons and, on comparison of corresponding data, electrons in
collisions. Further details of these measurements and comparisons are given in the
review papers of Griffith and Heyland (1978), Charlton (1985) and Kauppila and
Stein (1990).
The first inelastic positron scattering cross-sections to be measured were excitation
cross-sections. The experiments were made using systems already developed for
measuring total cross-sections. This was because the time-of-flight methods that had
been employed proved suitable for measuring excitation cross-sections by virtue of
their capacity to distinguish between scattered positrons of different energies. They
were thus capable of detecting positrons with the characteristic energy loss of those
which had excited certain electronic transitions although the energy resolution was
poor since recorded times-of-flight were dependent on the positrons’ scattering angles
as well as energies. The earliest measurement was by Coleman and Hutton (1980)
who observed on their time-of-flight spectra positrons which had excited the l^-S^S
transition in He. The measured excitation cross-section is shown in Figure 1.7.
Recently Diana et al (1989) have reported preliminary results for the excitation of
21S in He using a lengthened form of the same apparatus which leads to an increased
timing resolution. The measurements extend up to 55eV and they report yield results
slightly higher than previously measured-an effect they ascribe to the inclusion of
other transitions.
35
0.4Btcin e t *1 Canter e t al X Coleman e t al □ Sinapiua e t e l
------ e t el ■ — Amueie <t e l ....... U cEadirut...
0+
Q 0.2
CJUm
0 . 1 - AU1[flQU
U0
0 2 4 8 8 10 IZ 14 18 18 80
P o s itr o n e n e r g y [eV]
Fig 1.5 The total cross-section for positrons incident on Helium for energies below 20eV.
"4“ Kauppila...
Inokuti...
C olem an... Deirangan...
0 Griffith..M O
<rtG
Byron...
a
aaj
0 0in 0.5mQu
a
20 120 220 320 420 520 620 720P o s itr o n E n erg y [eV]
Fig 1.6 The total cross-section for positrons incident on Helium for energies above 2 0eV.
36
The other apparatus that has been used to measure positron excitation cross-sections
is the Retarding Potential-Time of Flight (RP-TOF) system of Sueoka (1982) that is
shown in Figure 1.18 and discussed below. To observe excitation it was modified to
account for positrons which had scattered more than once and consequently had
times-of-flight indistinguishable from those which had lost energy on excitation
(Sueoka, 1989). Results have been reported for the lowest transition in H e up to
120eV. Comparison is made with the summed theoretical result of Parcell et al (1983,
1987) whose calculations used a distorted wave approximation and reasonable
agreement is obtained although the experimental results are generally higher.
Considerable interest has also been shown in positronium formation as this reaction
occurs exclusively for positrons and can therefore yield information on positron
scattering mechanisms. Initially, the positronium formation cross-section crPs was
determined below the excitation threshold by assuming the shape of the elastic cross-
section and subtracting it from the total cross-section. Clearly though this procedure
was unsatisfactory and direct measurements of crPs were required. The first
measurements for He were made by Charlton et al (1980) but only up to 12eV above
threshold; they were subsequently extended to 150eV by Charlton et al (1983) and
results are shown in Figure 1.8. The other sets of measurements of aPs for H e have
been made by Fornari et al (1983) using a time-of-flight technique at low energies;
Diana et al (1985a) with the same apparatus but a different technique and Fromme
et al (1986). All these measurements were made on systems with which
measurements of the total ionization cross-section, <?i were made and the experiments
are discussed in detail in section 1.4.
The results of all experiments, shown in Figure 1.8, show clearly the disagreement
of the data of Charlton et al (1980, 1983) with other experimental data. The authors
(Charlton, 1985) have suggested that this discrepancy may arise from quenching
collisions of ortho-positronium on the cell walls or that positronium was
37
preferentially formed in the forward direction in their experiment. The latter point
has gained credence following the study of Laricchia et al (1987) of Ps formation in
positron scattering from He and Ar which revealed that up to 4% of Ps formed was
emitted in a 6 ° cone in the forward direction. On comparison with theory the other
experimental data for crPs in He is seen to agree reasonably at low energies with the
distorted wave calculations available (Khan and Ghosh, 1983, Khan et al, 1985 and
Mandal et al, 1979) but this is not the case at higher energies.
Apart from general information about the nature of the interaction the only new
knowledge that can be gleaned from total cross-sections concerns the relative
significance of their contributory components. If the possibility of annihilation is
neglected, which - as was explained earlier - is quite valid at the energies under
discussion, one can write for the total cross-section for positron scattering, aT
co
o T- o el+^2 o(nLS)+o t+o Ps (1*9)n-2
where crT and aPs are as defined, cq is the total ionization cross-section (see section
1.5) and cr(nLS) is the angle-integrated cross-section for excitation of the state
specified by quantum numbers n, L and S. Ever since the earliest measurements of
crT attempts have been made to evaluate one or more of the quantities on the left
hand side of equation (1.9) (e.g. Griffith et al, 1979) but only recently have these
become reasonably accurate after measurements and calculations of most of these
quantities have become available. In view of the measurements discussed above and
in the next section, together with the uncertainty regarding the measurements of the
excitation cross-section, Campeanu et al (1987a) have attempted to partition the total
cross-section for He so that the unmeasured quantities crel and cr(nLS) can be
determined from the measured ones. They do this as follows:
38
conjux
UJ
e+ - He
0. 1
Co
00 20 40 60 80 100
Fig 1.7Energy ( eV)
The excitation cross-section of positrons incident on Helium.
e* - He
0.5
0.3
0.0 250200 300150Energy ( e V)
Fig 1.8 The positronium formation positrons incident on helium.
cross-section for
39
° T ~ ° r ° ps~° ei+Y l °(nLS)-on-2
(1.10)
where crno ion is the total cross-section for those channels in which an ion is not
produced. Since measurements of crT, cq and crps were available, the sum of a el and
a(nLS) could be deduced. Values of cr(nLS) had been calculated by Parcell et al
(1983, 1987) up to n =2 so crel could be calculated from these enabling the authors
to study its behaviour near the threshold for inelastic processes - one of their stated
aims. The resulting data is shown in Figure 1.9, the selected cross-sections having
been measured previously by Stein et al (1978) and Fromme et al (1986).
A cusp in ono ion at the threshold can be seen - this could only be due to structure
in a el as it is the only contributing cross-section at this point. The existence of such
a cusp in crel had previously been predicted by Brown and Humberston (1985). For
electrons, a cusp in crcj at the threshold for inelastic processes is predicted as a result
of flux conservation (Mott and Massey, 1965): since the inelastic channel will have
infinite slope at the threshold, the elastic channel would correspondingly decrease
sharply immediately above threshold thus giving rise to a cusp structure. In positron
impact the first inelastic channel is that for positronium formation, crPs rises sharply
from threshold and it has been proposed that a cusp in acl could result.
The lines marked H and L in Figure 1.9 are the high and low limits of the theoretical
values of a no ion, these are seen to lie either side of the line a no ion which is
determined from experimental values, in fact the L line agrees with experiment
within error bars above 75eV showing the usefulness of the distorted wave
approximation for calculating excitation cross-sections at these energies. At lower
energies both the available measurements of the excitation cross-section and this
partioning study suggest that theory is inadequate.
40
no ion
0 a. IAP0IOe| I0WSBICL
50010050 200 100010 20Energy, E(eV)
Fig 1.9 The total cross-section excluding ionization and Ps formation for positrons incident on helium showing contributions from individual channels (Campeanu et a l , 1 9 8 7 ) .
Atomic hydrogen is one of the most interesting atoms to consider theoretically
because of its simplicity but, to date, experimental data is very limited. A detailed
discussion of calculations of a f o r atomic hydrogen is given in Chapter 2 as these are
relevant to the experimental work that will subsequently be described. There now
follows a brief overview of theoretical results for the other cross-sections for
positrons scattering off atomic hydrogen.
Below the threshold for inelastic processes (less than 6.8eV, the lowest energy at
which Ps can form) crcj has been calculated exactly by Bhatia et al (1971, 1974) using
a variational calculation based on the work of Gailitis (1965). These results can then
be used as a benchmark by which to assess the accuracy of other, more approximate,
methods. Most authors who have published elastic cross-sections above the inelastic
threshold have favourably compared their below-threshold results with those of
Bhatia et al (1971, 1974). Calculations have been made by Byron et al (1985) using
41
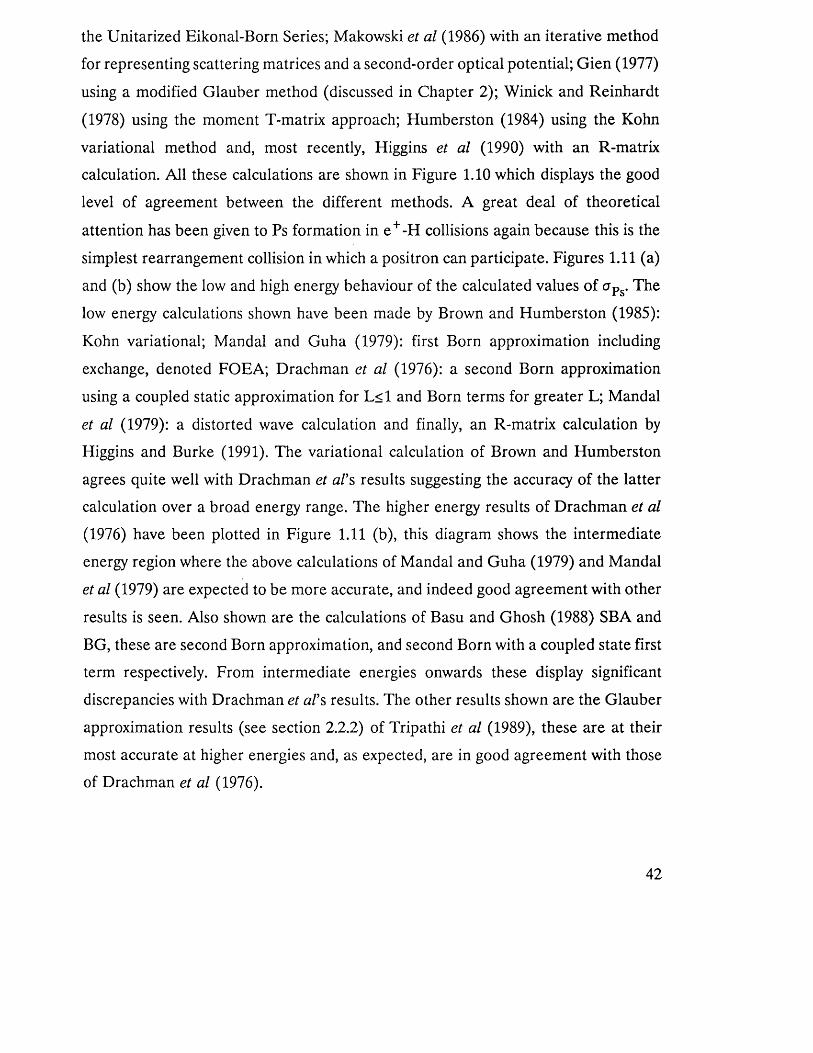
the Unitarized Eikonal-Born Series; Makowski et al (1986) with an iterative method
for representing scattering matrices and a second-order optical potential; Gien (1977)
using a modified Glauber method (discussed in Chapter 2); Winick and Reinhardt
(1978) using the moment T-matrix approach; Humberston (1984) using the Kohn
variational method and, most recently, Higgins et al (1990) with an R-matrix
calculation. All these calculations are shown in Figure 1.10 which displays the good
level of agreement between the different methods. A great deal of theoretical
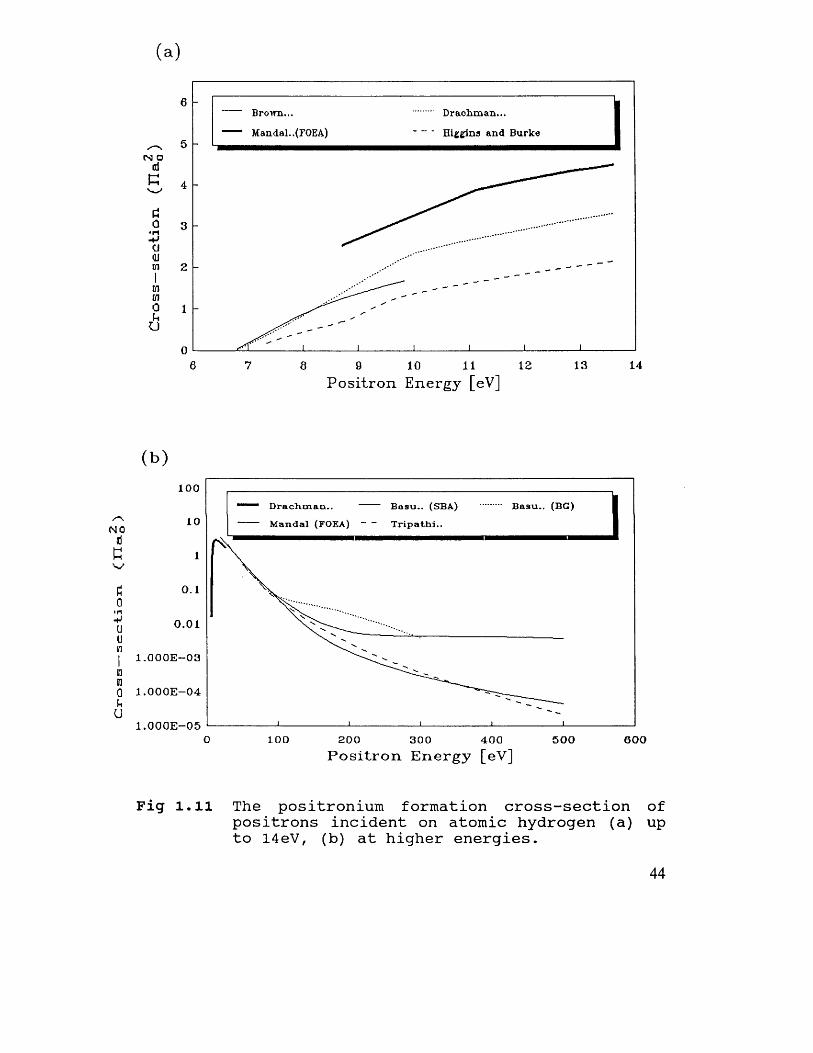
attention has been given to Ps formation in e +-H collisions again because this is the
simplest rearrangement collision in which a positron can participate. Figures 1.11 (a)
and (b) show the low and high energy behaviour of the calculated values of a Ps. The
low energy calculations shown have been made by Brown and Humberston (1985):
Kohn variational; Mandal and Guha (1979): first Born approximation including
exchange, denoted FOEA; Drachman et al (1976): a second Born approximation
using a coupled static approximation for L<1 and Born terms for greater L; Mandal
et al (1979): a distorted wave calculation and finally, an R-matrix calculation by
Higgins and Burke (1991). The variational calculation of Brown and Humberston
agrees quite well with Drachman et a/’s results suggesting the accuracy of the latter
calculation over a broad energy range. The higher energy results of Drachman et al
(1976) have been plotted in Figure 1.11 (b), this diagram shows the intermediate
energy region where the above calculations of Mandal and Guha (1979) and Mandal
et al (1979) are expected to be more accurate, and indeed good agreement with other
results is seen. Also shown are the calculations of Basu and Ghosh (1988) SBA and
BG, these are second Born approximation, and second Born with a coupled state first
term respectively. From intermediate energies onwards these display significant
discrepancies with Drachman et a/’s results. The other results shown are the Glauber
approximation results (see section 2.2.2) of Tripathi et al (1989), these are at their
most accurate at higher energies and, as expected, are in good agreement with those
of Drachman et al (1976).
42
2 .5
GLenH iggin s..
H u m b ersto n H” B h a tiaB yron ..
1 .5
0 .5
0.1 1 10 100 1000 Positron. Energy [eV]
Fig 1.10 The calculated elastic cross-section of positrons incident on atomic hydrogen.
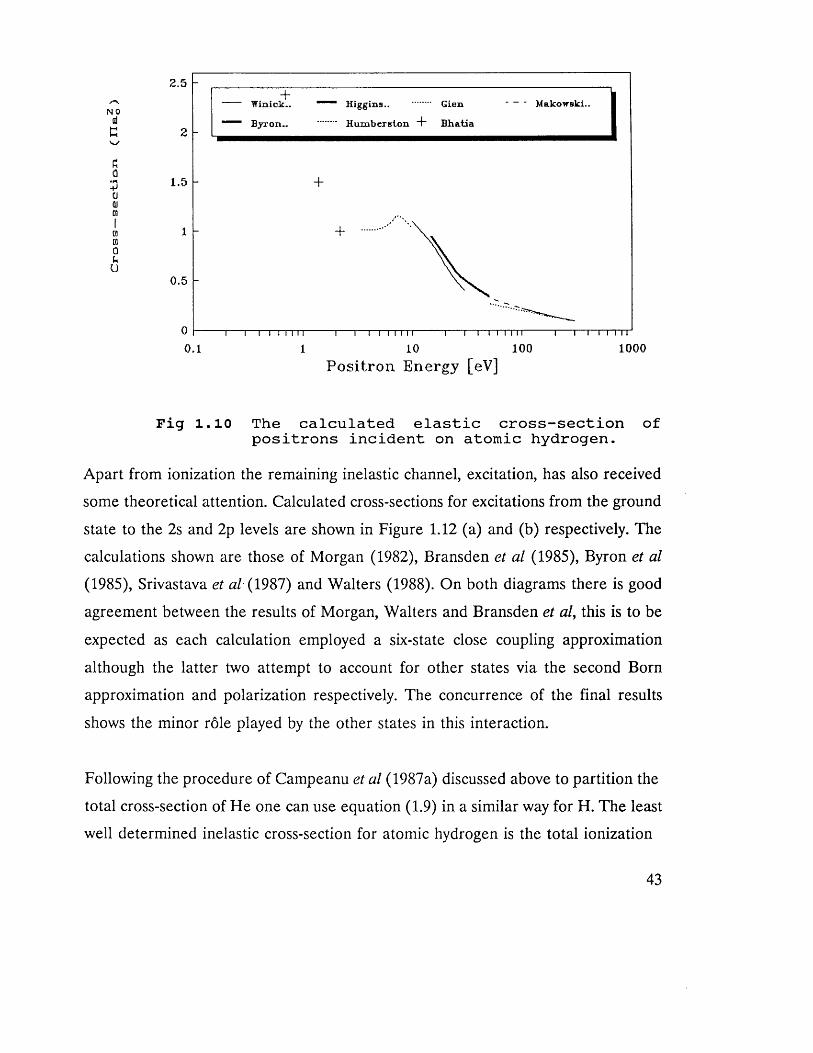
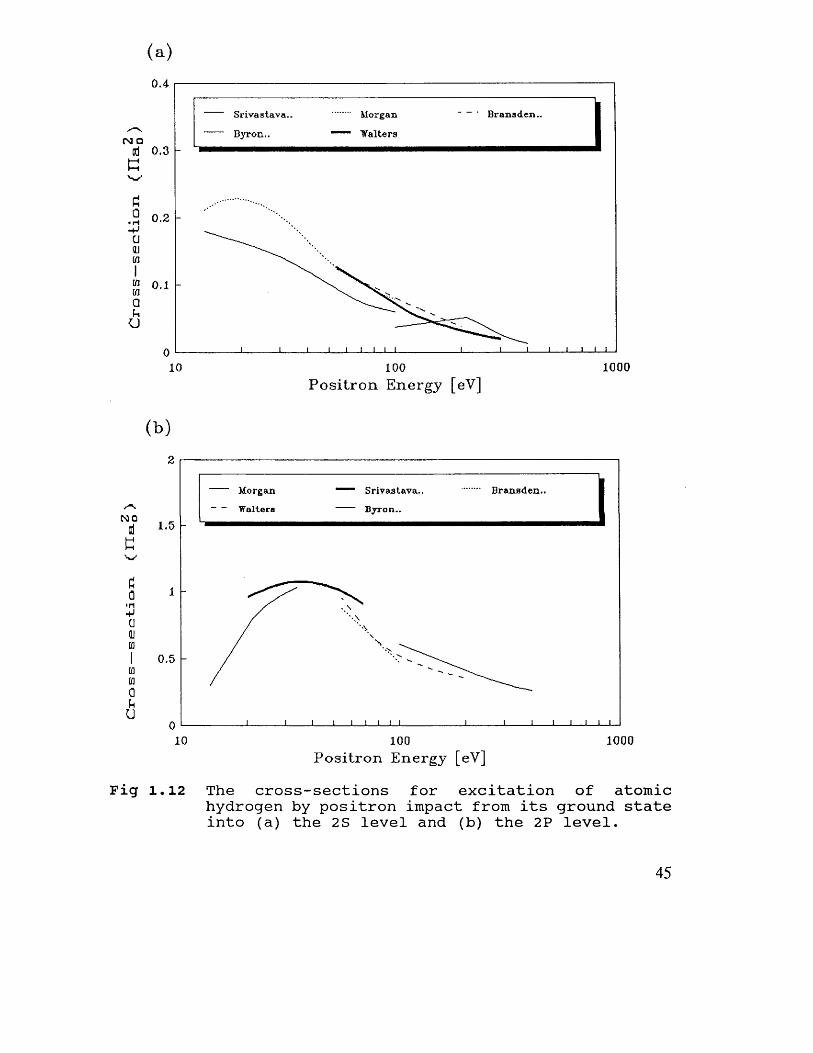
Apart from ionization the remaining inelastic channel, excitation, has also received
some theoretical attention. Calculated cross-sections for excitations from the ground
state to the 2s and 2p levels are shown in Figure 1.12 (a) and (b) respectively. The
calculations shown are those of Morgan (1982), Bransden et al (1985), Byron et al
(1985), Srivastava et a/ (1987) and Walters (1988). On both diagrams there is good
agreement between the results of Morgan, Walters and Bransden et al, this is to be
expected as each calculation employed a six-state close coupling approximation
although the latter two attempt to account for other states via the second Born
approximation and polarization respectively. The concurrence of the final results
shows the minor role played by the other states in this interaction.
Following the procedure of Campeanu et al (1987a) discussed above to partition the
total cross-section of He one can use equation (1.9) in a similar way for H. The least
well determined inelastic cross-section for atomic hydrogen is the total ionization
43
( a )
6Drachm an..
Higgins and Burke5
4
3
2
1
01 3 1 46 7 10 128 0 11
P o sitro n Energy [eV]
(b)100
B a s u .. (SBA)
T r ip a th i..
D r a c h m a n ..
10 M an d al (FOEA)
1
0 .1
0 .01
1 . 0 0 0 E - 0 3
Q 1 . 0 0 0 E - 0 4
1 . 0 0 0 E - 0 50 1 0 0 2 0 0 3 0 0 4 0 0 5 0 0 6 0 0
P o s itr o n E n erg y [eV]
Fig 1.11 The positronium formation cross-section of positrons incident on atomic hydrogen (a) up to 14eV, (b) at higher energies.
44
Cro
ss
se
cti
on
. (I
Ta.0
) C
ro
ss—
secti
on
(I
Ta.
(a)
0.4B ra n sd en ..S r iv a sta v a .. Morgan
WaltersByron..
0.3
0.2
100010 100P ositron Energy [eV]
Ob)
Morgan
Waltera
Srivastava..
1.5
0.5
100010 100P ositron Energy [eV]
Fig 1.12 The cross-sections for excitation of atomic hydrogen by positron impact from its ground state into (a) the 2S level and (b) the 2P level.
45
cross-section, this will be discussed in detail in Chapter 2. However, one can estimate
it by considering all the other cross-sections as follows. For each of the above cross-
sections, the sets of calculated values which are believed to be most accurate and
appear to be consistent over different energy ranges are combined. These are plotted
in Figure 1.13; the calculations used were those of Bhatia et al (1971, 1974), Brown
and Humberston (1985), Higgins et al (1990) and Makowski et al (1986) for Gcl;
Drachman et al (1976) and Basu and Ghosh (1988) for GPs and the 2s and 2p
excitation cross-sections of Morgan (1982), Walters (1988), Srivastava (1988) and
Byron (1981). By summing these cross-sections a cross-section for all channels bar
ionization is obtained, this is labelled Gt.jon in Figure 1.13. Also shown in Figure 1.13
is the total cross-section those authors who calculated the elastic cross-section
evaluated from their elastic phase-shifts using the optical theorem. If one then
subtracts Gt.ion from this calculated total cross-section the total ionization cross-section
can be estimated. This can be seen clearly by rearranging equation (1.9). A
comparison of the ionization cross-section determined in this way with experimental
measurements and with the best direct calculation of Gion to date (Campeanu, 1990 -
see section 2.2.2) gives an indication of the accuracy of the various calculations of
inelastic cross-sections. Such a comparison is made in Figure 1.14 and the accuracy
of these calculations is clearly called into questin at intermediate energies.
1.5 The Measurement of Impact Ionization Cross-Sections
In the last decade it has become increasingly apparent that studying the ionization of
atoms by positron impact can yield valuable information on the interactions of light
charged particles and on the mechanism of ionization itself. Further insights into the
respective roles of mass and charge are gained by comparing the ionizing collisions
of the singly charged particles and antiparticles e+, e \ p and p (e.g. the reviews by
Charlton, 1990 and Schultz et al, 1991). These considerations have prompted the
measurement of several single and double ionization cross-sections
46
N 0idE
£03auin1nn0Uu
E lastic P o sitro n iu mE x c ita tio n
T otal (ca lc )™™ T otal—Ion6
4
2
00.1
Fig
N 0id
E
£0■•H+1(j41m1nmQUU
Fig
1 10 100 P ositron energy [eV]
1000
1.13 Calculated elastic, excitation and positronium formation cross-sections for e+-H scattering and their sum (denoted Total-Ion) Also shown is the calculated total cross-section.
2 .5
“ S p ich er e t al (1990) Ion iza tion c .s . C am peanu (1990)
2
1.5
1
0 .5
00 20 4 0 6 0 8 0 100 120 140 160
Energy [eV]
1.14 The positron impact ionization cross-section of atomic hydrogen determined from partitioning the total cross-section. Directly calculated and measured results are shown for comparison.
47
with positrons which will be reviewed in this section.
The reaction which will be discussed here can be written
e*+ X -e*+ ke~ + X k*
where X is the target atom or molecule, k denotes the degree of ionization of X:
single or double. The cross-section for this reaction can then be calculated from
I (E)- L y - . p i ^ k o t m - p i o ^ E ) ( l . i D
where Ii(E) is the ion current; Ip(E) is the projectile current, in this case, positrons;
p is the number density of the target gas and 1 is the path length of the positrons
through the gas. The total ionization cross-section a j is here expressed as the sum of
the individual cross-sections for ionization of n electrons, a k.
Broadly speaking, experimental work on this reaction can be divided into two groups-
those which have employed gas scattering cells and those of the crossed-beam type.
These will now be discussed in detail.
1.5.1 Scattering Cell Experiments
The combined cross-section for excitation and ionization of He, Ne and Ar was
measured by Coleman et al (1982) and the ionization cross-sections determined
therefrom are shown in Figures 1.15-1.17. The first direct determination of a positron
ionization cross-section though was by Sueoka et al (1982) who used the RP-TOF
system shown in Figure 1.18 to measure that of He. By retarding positrons of a given
energy before they reached the detector those which have ionized atoms were
distinguished from those which had excited them. Using the same method the
48
ionization cross-sections of Ne and Ar were also measured by Mori and Sueoka
(1984). However these results were prone to errors arising from the multiple
scattering of positrons as discussed above for excitation so the experiment was
repeated with a different apparatus (Sueoka, 1989). These later results are shown in
Figures 1.15-1.17.
Using the apparatus with which they determined positronium formation cross-sections
(Fornari et al, 1983 and Diana et al, 1985a ) Diana et al (1985b, 1989) have measured
the ionization cross-section for He, their later work was performed with a longer
beam giving improved timing resolution. The apparatus shown in Figure 1.19 was
filled with gas and a positron beam passed axially through it. The number of
positrons undergoing any scattering process, F is deduced by counting those which
scatter out of the primary beam and suffer a reduction in their transverse velocity
and the number which form ions, f is calculated from the observed electron count-
rates with and without gas present and with and without the positron beam. a ion is
then determined from
Ionization cross-sections have also been measured by Fromme et al (1986, 1988) for
H e and H 2, these are also shown in Figures 1.15 and 1.20. The apparatus used is that
shown in Figure 1.21. The combined cross-section for ionization and positronium
formation was determined by detecting all ions produced. By recording the ions’
times-of-flight starting from the detection of a positron the number of ions resulting
from impact ionization was derived, in this way the cross-section for ionization could
be measured individually and crPs separated from the sum c7ion+ a Ps; the ctPs values
are discussed above.
The most recent measurements of positron ionization cross-sections have been by
49
HELIUM
o
Fromme e ta l (1988)Diana ef a/ (1985b)Sueoka (1989)Campeanu ef al (1987) Peach and McDowell (1983) Golden and McGuire (1976) Basu e t a l (1985)
n h -3000.0200 500100 600
Energy (eV)
Fig 1.15 The positron impact ionization cross-section of He.
“i C olem an e t a l Cl K nudsen e t a lS u eok a
1.5NO
0.5
0 20 40 60 80 100 120
P o s itr o n E n ergy [eV]
Fig 1.16 The positron impact ionization cross-section of Ne.
50
74" Coleman, e t al 1 Sueoka □ Knud sen. e t al
□
□
□ 4- ’
4Qidid""# - •
jU__________I__________I__________1__________I---------------0 20 40 00 80 100 120
P o sitro n Energy [eV]
Fig 1.17 The positron impact ionization cross-section of Ar.
Knudsen et al (1990) who used the apparatus shown in Figure 1.22. This beam
system, with slight modifications, had already been used to measure the single and
double ionization cross-sections for electron, proton and antiproton impact (Brun-
Nielsen, 1990, Charlton 1988, 1989, Haugen et al, 1982, and Andersen et al, 1986,
1987 and 1990 respectively).
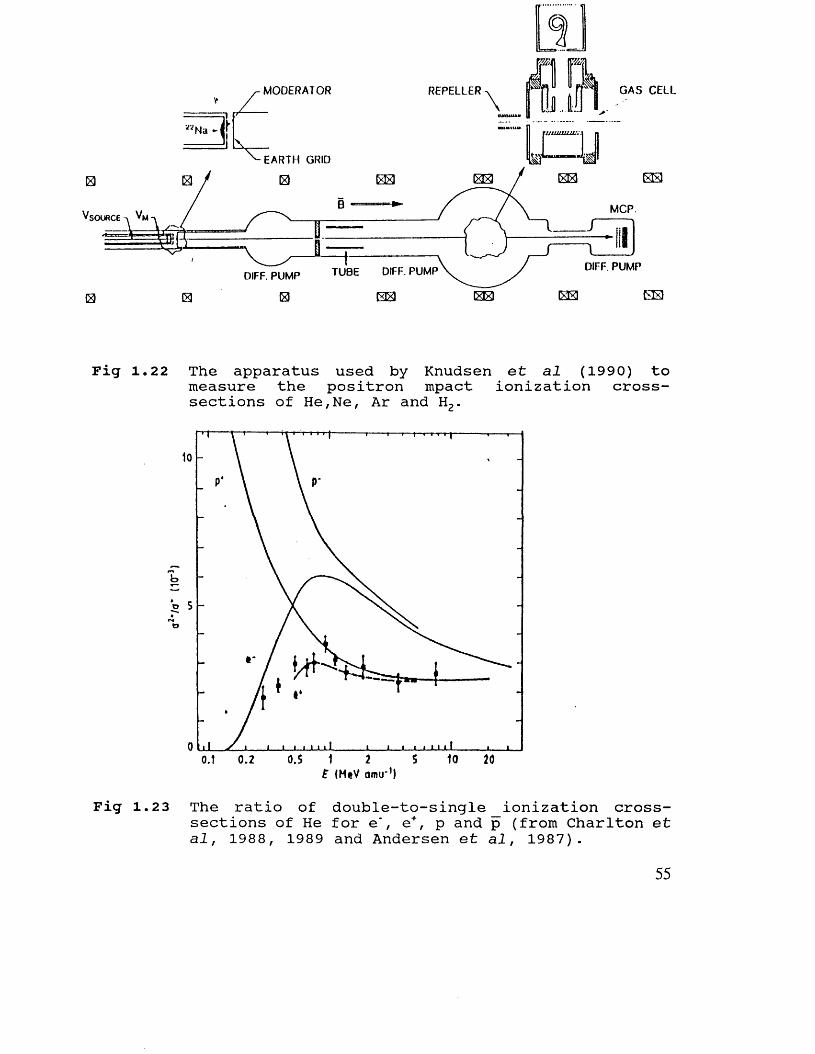
Charlton et al (1988, 1989) have also measured the double ionization cross-section
of positrons incident on noble gas atoms with this apparatus. This was as part of a
programme of research to investigate the roles of mass and charge in the dynamics
of ionization by comparing the single and double ionization cross-sections of the
matter-antimatter pairs electrons and positrons and protons and antiprotons. Figure
1.23 shows the ratio of double to single ionization cross-sections for all particles
incident on He. All four data sets tend to the same value at high velocity as the
effects of different masses and charge signs disappear but the convergence of the
ocdG
G0Ip□
OJHIw[/]QChrj
51
7 Solenoid
r:XL
Retarding Grid
AX.
2 f( P*Source Moderator, vGas Cell e.
Tt7t
Ceratron(CEM) 1 —
-600V .3500V
Fig 1.18 The RP-TOF apparatus used by Sueoka and Mori (1984) to measure the positron impact ionization cross- sections of He, Ne and Ar.
SOURCEMODERATOR
BEAMCUTOFFELECTRODE
B 2.3m FLIGHT PATH
RETARDINGFIELDANALYZER
CEM
Fig 1.19 The apparatus used by Diana et a l (1985) to measure the positron impact ionization cross-section of He.
52
Cro
ss-S
ectio
n (II
aj)
2. 5
1.5
0. 5
^ Fro m in e e t a l O K n u d sen e t a l
7K -L *,-L
J_____ I___ I__ 1__I_I_I_1_L
¥ <
J_____ I
©
10 100
P o s itr o n e n erg y [eV]
Fig 1.2 0 The positron impact ionization cross- of molecular hydrogen.
Gas
— Glass tuba Tunfsten helix
Poslt ron source
De tec tor 2 pos I tronsIons
To pumpTo pump£x§ moss s p e ct rom ete rMo der ato r
Fig 1.21 The apparatus used by Fromme et al 1988) to measure the positron ionization cross-sections of He and
i
1000
section
(1986,impact
53
positron and proton data and, separately, the electron and antiproton data shows the
dominance of charge effects at intermediate velocities. At low velocity the lower
kinetic energy possessed by the lighter particles causes a decrease in their ratios
relative to the heavier projectiles. Modifications made to the apparatus when
measuring the positron single ionization cross-section will be highlighted below.
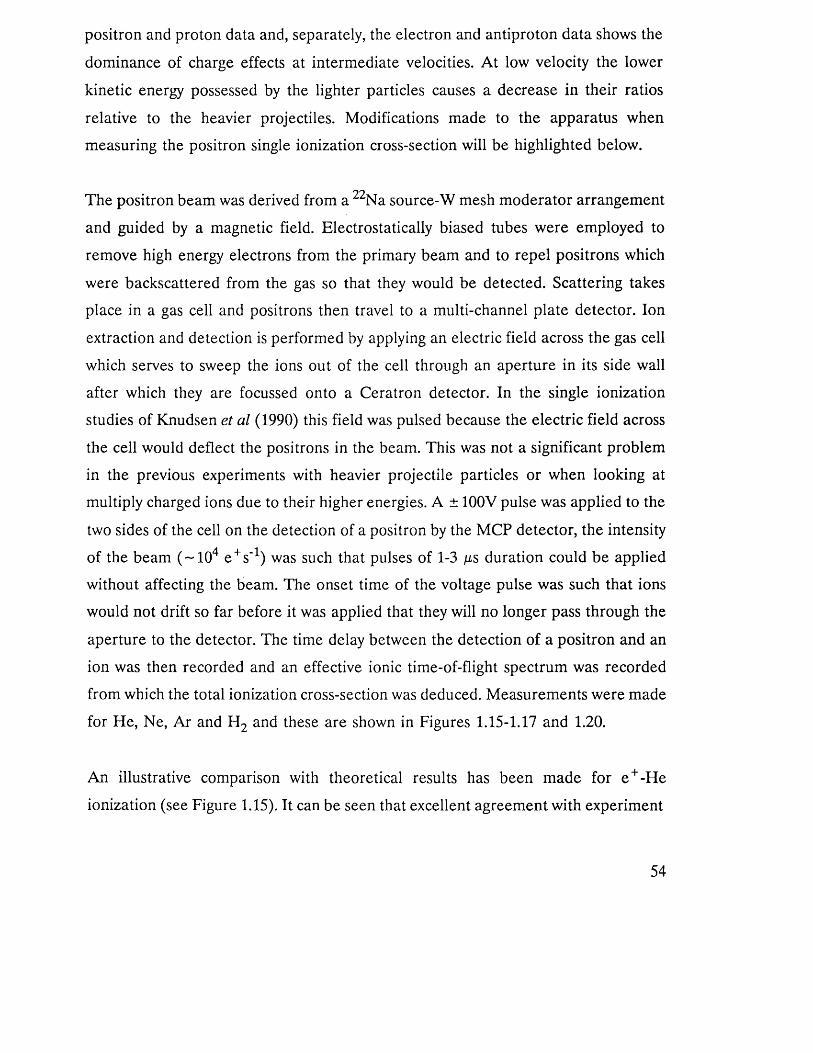
00The positron beam was derived from a Na source-W mesh moderator arrangement
and guided by a magnetic field. Electrostatically biased tubes were employed to
remove high energy electrons from the primary beam and to repel positrons which
were backscattered from the gas so that they would be detected. Scattering takes
place in a gas cell and positrons then travel to a multi-channel plate detector. Ion
extraction and detection is performed by applying an electric field across the gas cell
which serves to sweep the ions out of the cell through an aperture in its side wall
after which they are focussed onto a Ceratron detector. In the single ionization
studies of Knudsen et al (1990) this field was pulsed because the electric field across
the cell would deflect the positrons in the beam. This was not a significant problem
in the previous experiments with heavier projectile particles or when looking at
multiply charged ions due to their higher energies. A ± 100V pulse was applied to the
two sides of the cell on the detection of a positron by the MCP detector, the intensity
of the beam ( ~1 0 4 e + s_1) was such that pulses of 1-3 /xs duration could be applied
without affecting the beam. The onset time of the voltage pulse was such that ions
would not drift so far before it was applied that they will no longer pass through the
aperture to the detector. The time delay between the detection of a positron and an
ion was then recorded and an effective ionic time-of-flight spectrum was recorded
from which the total ionization cross-section was deduced. Measurements were made
for He, Ne, Ar and H2 and these are shown in Figures 1.15-1.17 and 1.20.
An illustrative comparison with theoretical results has been made for e +-He
ionization (see Figure 1.15). It can be seen that excellent agreement with experiment
54
MODERATOR REPELLER
'N a 3\
\EARTH GRID
G A S CELL
M CP.
DIFF. PUMPDIFF. PUMPTUBEDIFF. PUMP
Fig 1.22 The apparatus used by Knudsen et a l (1990) to measure the positron mpact ionization cross- sections of He,Ne, Ar and H2.
lo
bo 5
b
o10 200.S 520.1 0.2
£ (M tV a m u '1)
Fig 1.23 The ratio of double-to-single ionization cross- sections of He for e*, e+, p and p (from Charlton et a l , 1988, 1989 and Andersen et a l , 1987).
55
is achieved for the CTMC results of Peach and McDowell (1983) and Schultz and
Olson (1988) and the distorted wave calculations of Basu et al (1985) and Campeanu
et al (1987b).
1.5.2 Crossed-Beam Experiments
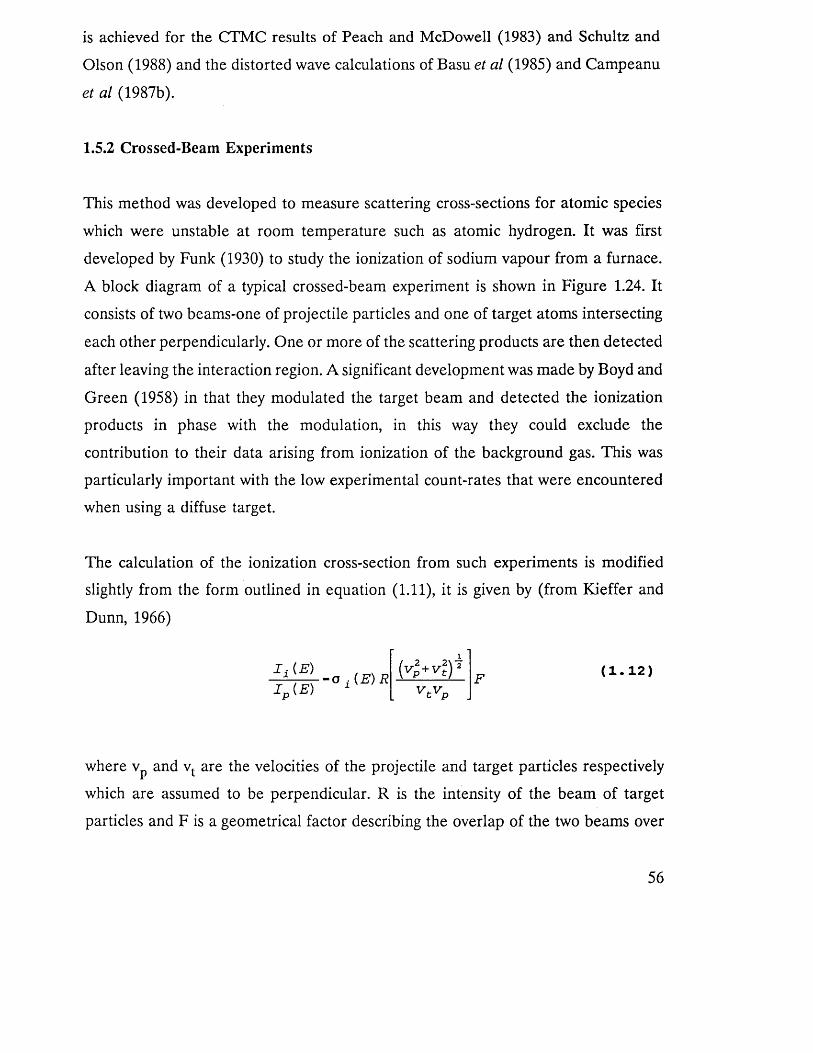
This method was developed to measure scattering cross-sections for atomic species
which were unstable at room temperature such as atomic hydrogen. It was first
developed by Funk (1930) to study the ionization of sodium vapour from a furnace.
A block diagram of a typical crossed-beam experiment is shown in Figure 1.24. It
consists of two beams-one of projectile particles and one of target atoms intersecting
each other perpendicularly. One or more of the scattering products are then detected
after leaving the interaction region. A significant development was made by Boyd and
Green (1958) in that they modulated the target beam and detected the ionization
products in phase with the modulation, in this way they could exclude the
contribution to their data arising from ionization of the background gas. This was
particularly important with the low experimental count-rates that were encountered
when using a diffuse target.
The calculation of the ionization cross-section from such experiments is modified
slightly from the form outlined in equation (1.11), it is given by (from Kieffer and
Dunn, 1966)
I i ( E ) Tp (■£’)
i ( E) R (Vp + O 1v t v P
( 1 . 12 )
where vp and vt are the velocities of the projectile and target particles respectively
which are assumed to be perpendicular. R is the intensity of the beam of target
particles and F is a geometrical factor describing the overlap of the two beams over
56
the interaction region and is given by
J t (^) dz— J—E.--------_------------- d . i 3 )f j t (z) d z j j p (z) dz
where jp(z) and jt(z) are the spatial distributions of the projectile and the target over
the region of overlap of the beams, z is the distance along the axis perpendicular to
both beams. The difficulty in calculating cq from equation (1.13) arises from
problems in determining F, it is also common in crossed-beam experiments not to
measure R directly thus creating further complications. Methods by which this has
been averted are discussed below in the context of individual experiments.
The first measurement of the electron impact ionization cross-section for atomic
hydrogen was by Fite and Brackmann (1958). The method which they used was
essentially that developed by Boyd and Green (1958) in which the atomic beam was
modulated to remove the spurious counts from ionization of the background gas. The
apparatus is shown in Figure 1.25. Molecular hydrogen was dissociated in a W
furnace from which a mixed atomic and molecular beam was derived. This was then
crossed with an electron beam formed in an electron gun. The target beam then
entered a curved electrostatic mass spectrometer which was pulsed at the beam
modulation frequency s o H j ions from the background gas could be accounted for.
H + ions were then distinguished from Ff2 ions using the mass spectrometer. Two
types of cross-section were measured: these were termed relative and absolute. For
the relative cross-sections experimental data was normalized to cross-sections
calculated with the Born approximation at high energies and the low energy results
were then evaluated. The absolute cross-sections were determined by knowing the
dissociation fraction of the gas precisely through measuring the ion currents with the
furnace on and off and then normalizing to previously measured H2 cross-sections.
The normalization procedures employed here obviated the need to calculate the
57
ProjectileBeam
Detector
Ion Signal Detector
Ii/ Target Phase
Target y ' Detector .y \ SensitiveBeam k. X k . X J Am plifier/
Source
X
T
i , t ^ Counter
Pro] eo tile Projectile Phase Reference
Ion Phase Reference
Fig 1.2 4 A block diagram of a typical crossed-beam experiment to measure the ionization cross-sections of gases showing the quantities in equations (1.16) and (1.17).
Chof>pf» y - l_igM orxf phofoc*!!
n in r r tr r n
shilUr
j v
Fig 1.2 5 A schematic diagram of the apparatus used by Fite and Brackmann (1958) to measure the electron impact ionization cross-section of atomic hydrogen.
58
overlap factor, F given in equation (1.13), since it was assumed to be equal for both
H and H2. Figure 1.26 shows the good agreement that was found between both these
sets of results.
In a similar experiment, using the apparatus of Boyd and Green (1958) in which
atomic hydrogen was produced by dissociation in a radio-frequency discharge, the
electron impact ionization cross-section of H was measured by Boksenberg (1961).
Again these results were normalized to Born approximation data at high energies and
lower energy cross-sections were interpolated from these. Figure 1.26 shows the
agreement that was obtained with the previous results, the small discrepancy probably
arises from the different efficiencies of collection of thermal ions in these
experiments. Rothe et al (1962) also measured the ionization cross-section of atomic
hydrogen. Molecular hydrogen was dissociated in a radio-frequency discharge and ion
collection was by means of a mass spectrometer which was again modulated.
Absolute cross-sections were obtained by measuring the dissociation fraction and
normalizing to H2 results, these are also shown in Figure 1.26. This data had to be
corrected for H + ions arising from dissociative ionization of H 2 since the
experimental geometry allowed these to be collected efficiently. A more recent
measurement of the electron impact ionization cross-section of atomic hydrogen was
made by Shah et al (1987). The system shown in Figure 1.27 was used. H atoms were
produced in a W furnace and were crossed by a beam of electrons from an electron
gun. The main difference in this experiment from earlier work is that the electron
beam is now pulsed. Ions were extracted from the interaction region electrostatically
and perpendicularly to the two beams with the extraction field being applied
immediately after the passage of a pulse of electrons through the interaction region.
Atomic and molecular ions were then distinguished by their different times of flight
in an electric field to a detector, i.e. by their charge to mass ratios. The pulsed field
ensured that no field effects were present to influence the scattering process or to
change the overlap of the beams in any unquantifiable way. Since the system was
originally developed for proton scattering experiments the substitution of a proton
59
Cro
ss-S
ectio
n (I
Ia§)
1.2
A R o th e e t a lX F k B re l
Q B oksenberg Shah, e t al
0.8
0.6
0 . 4
0.2
10 100 1000E lec tro n E nergy [eV]
Fig 1.2 6 The measured electron impact ionization cross- sections of atomic hydrogen.
preTlamp
AmpSlopU J
Opticalcoupler Disc
- -3S00 V— -4000 V r -loo v
♦sv
CPO
D elay MCA
D elay
Delay
Microcomputer
Main p ulse gen erator
V oltage to frequency converter
e -b ea mpulsegenerator
E xtractionpulsegenerator
-100 V - ‘ -Vr500 ns —
------------v _ r £ n 1 = ^ ;— > - -------------------------0 - -
Fig 1.2 7 A schematic diagram of the apparatus used by Shah e t a l (1987) to measure the electron impact ionization cross-section of atomic hydrogen.
60
beam for the electron beam presented no great experimental difficulties and the
electron results were therefore normalized to proton data using previously measured
proton ionization cross-sections. The results are also shown in Figure 1.26.
Remarkable agreement is found for all sets of data although the most recently
measured cross-sections (Shah et al, 1987) are believed to be the most accurate
because of the extensive precautions that were taken to minimize systematic effects.
The only crossed-beam experiment to measure the ionization cross-section of an
unstable species on positron impact has been performed recently by Spicher et al
(1990). To measure the ionization cross-section of positrons incident on atomic
hydrogen the experimental apparatus shown in Figure 1.28. was used. A beam of
positrons was produced by moderating fast B emitted from a Na radioactive
source with W mesh. The positrons are deflected through 90° in an electrostatic
analyzer and are then transported by electrostatic lenses to the interaction region.
Here, they cross a beam of atomic and molecular hydrogen effusing from a capillary
at the end of discharge tube. The plasma in which molecular hydrogen is dissociated
is sustained by the input of radio-frequency power. Such a source of atomic hydrogen
was developed by Slevin and Stirling (1981) and will be described fully in section
3.3.2. Positrons which are scattered by the gas up to angles of 30° are focussed and
detected with a channeltron. Ions are allowed to drift slightly in the gas beam and
are then extracted electrostatically on an axis perpendicular to the gas and deflected
through 90° to another channeltron detector. Atomic and molecular ions are
distinguished by their times of flight to this detector with the starting pulse being
derived from the detection of a positron. The ion detector is not on a line-of-sight
to the discharge tube as the contribution to the background in the time-of-flight
spectrum from light would be too great. This has been further reduced by coating all
reflective surfaces inside the system with carbon.
The reactions which produce ions are listed in Table 1.2. Since the object was to
measure cq all the other listed processes had to be accounted for or eliminated. All
61
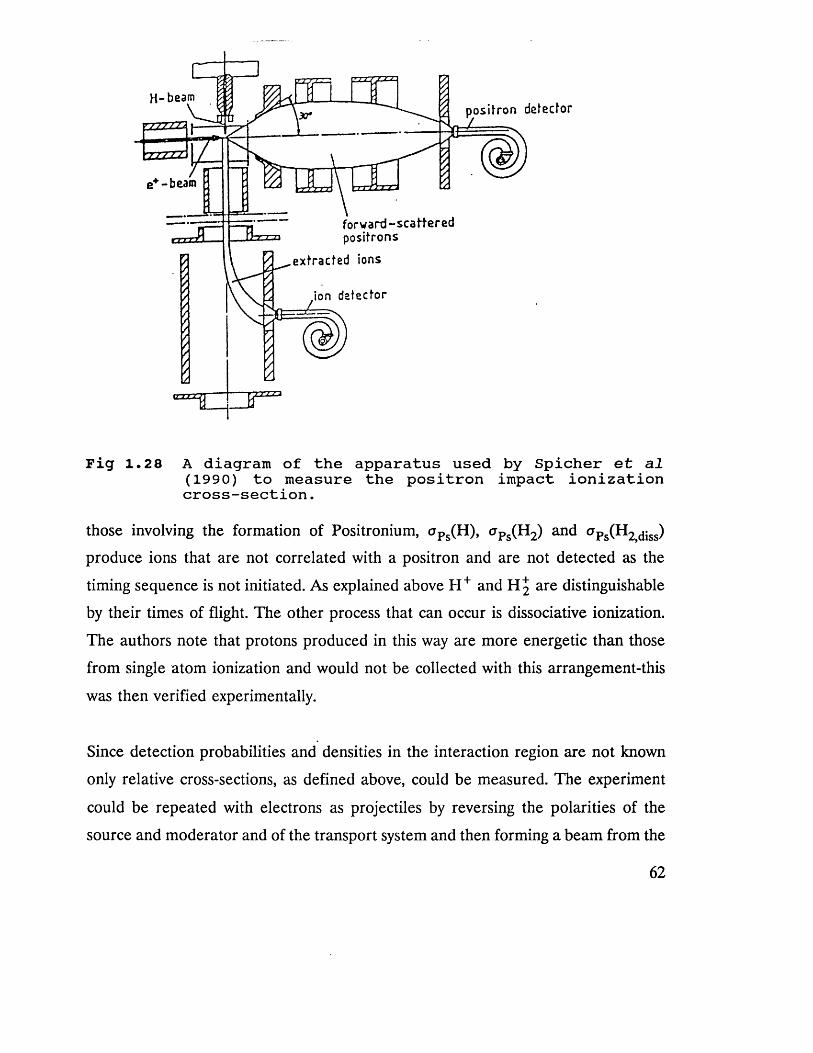
H -beam
zzzzz
f o r w a r d - s c a t t e r e d p o s i t ro n s
e x t r a c te d ions
ion d e te c to r
Fig 1.28 A diagram of the apparatus used by Spicher et a l (1990) to measure the positron impact ionization cross-section.
those involving the formation of Positronium, a Ps(H), c7Ps(H2) and ^ps(H2>diss)
produce ions that are not correlated with a positron and are not detected as the
timing sequence is not initiated. As explained above H + and H 2 are distinguishable
by their times of flight. The other process that can occur is dissociative ionization.
The authors note that protons produced in this way are more energetic than those
from single atom ionization and would not be collected with this arrangement-this
was then verified experimentally.
Since detection probabilities and densities in the interaction region are not known
only relative cross-sections, as defined above, could be measured. The experiment
could be repeated with electrons as projectiles by reversing the polarities of the
source and moderator and of the transport system and then forming a beam from the
62
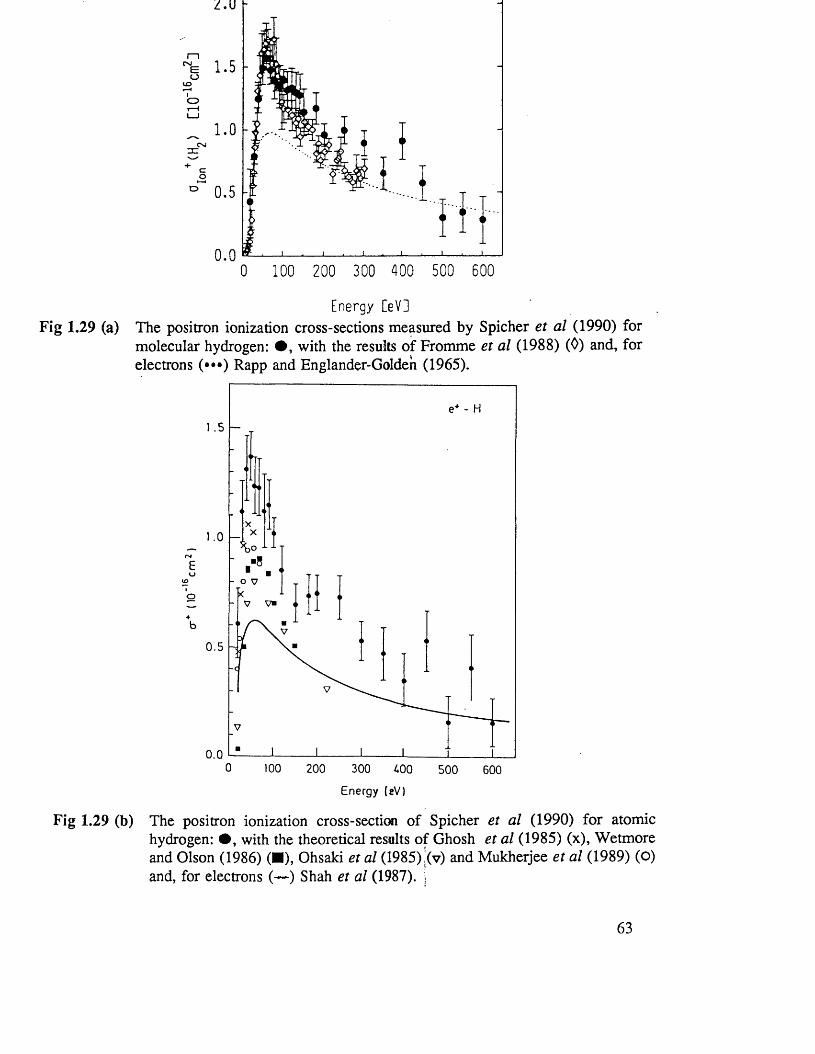
2.U h
1.5
1.0
0.5
0.00 100 200 300 400 500 600
Energy [ e V ]Fig 1.29 (a) The positron ionization cross-sections measured by Spicher et al (1990) for
molecular hydrogen: # , with the results of Fromme et al (1988) (0) and, for electrons (•••) Rapp and Englander-Golden (1965).
1 .5
1.0
o V
0 .5
0.00 100 200 500 600
Fig 1.29 (b)
Energy (eV)
The positron ionization cross-section of Spicher et al (1990) for atomic hydrogen: # , with the theoretical results of Ghosh et al (1985) (x), Wetmore and Olson (1986) (■), Ohsaki et al (1985) !(v) and Mukherjee et al (1989) (O) and, for electrons (—) Shah et al (1987). j
63
secondary electrons produced when B+ particles strike the moderator. Data obtained
with electrons was then normalized to previously measured cross-sections and the
normalization factors thus deduced were applied to positron results yielding the cross-
sections shown in Figure 1.29 (a) and (b).
To assess the validity of their normalization procedure one must consider their
measured impact ionization cross-sections of H2, these are shown in Figure 1.29.
Reasonable agreement is obtained with previous data taken by the same group on a
different apparatus (Fromme et al, 1988) except at energies above about 150eV where
the newer results seem to be slightly higher. As is shown in the following discussion
this may be a consequence of the limited angular acceptance of the beam detector.
In applying the same normalization procedure to electrons and positrons the angular
distribution of the scattered projectiles are assumed to be identical for both particles.
It is claimed that this is valid over the energy range where the normalization is done
(200-600eV) as the first Born approximation which does not differentiate between
particles of different charge-sign is thought to apply. It will be demonstrated in section
2.3.1.1 that this is not the case.
The slight discrepancy between the measured electron data and previous experimental
results in the energy range 50-100eV shown in Figure 1.29 may indicate that the
electron cross-section is underestimated at high energies in the H data. A possible
explanation for the observed results is that erroneously low results were normalized
to accurate data at high energies resulting in the low energy values being shifted
above this data. As a result of normalizing in the same way for both incident particles
the positron data is then too high at higher energy hence the discrepancy between the
different results seen in Figure 1.29.
64
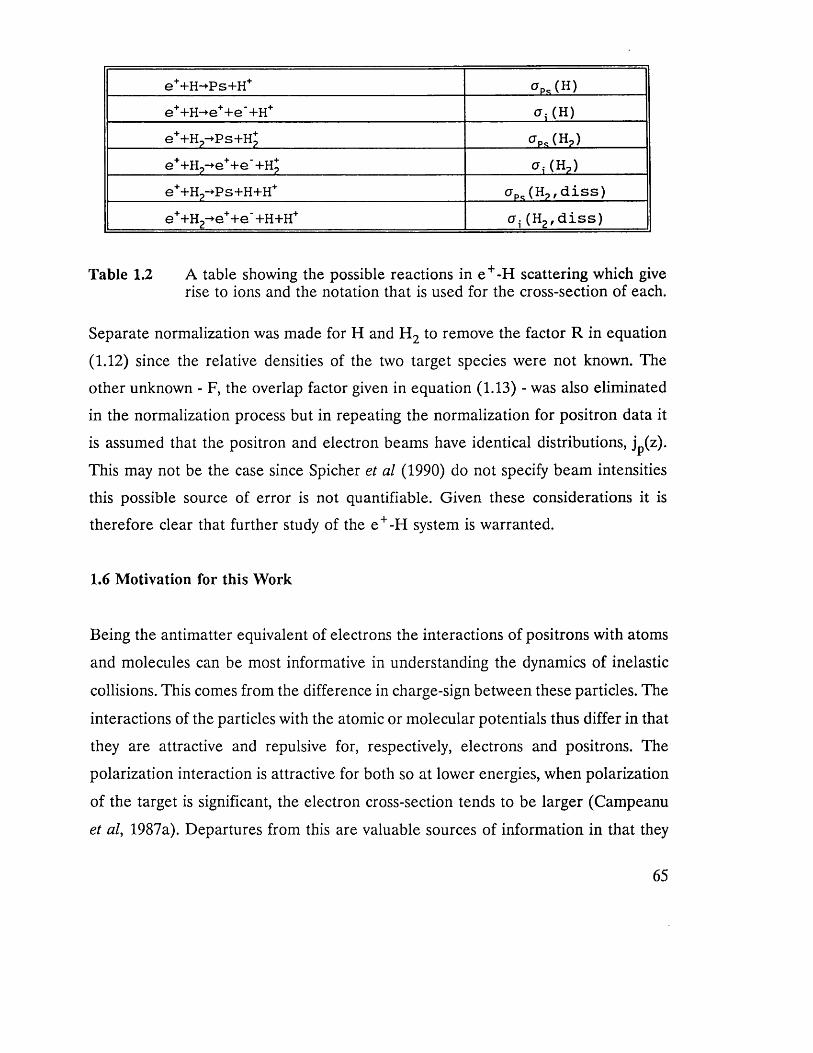
e++H-*Ps+H+e++H-^e++e'+H+ M H)e++H? Ps+H* Op* (H?)e++H?-+e++e +H2 M HP)e++H?-Ps+H+H+ tfpc (Hp, diss)e++H2-*-e++e* +H+H+ o- (H2, diss)
Table 1.2 A table showing the possible reactions in e + -H scattering which give rise to ions and the notation that is used for the cross-section of each.
Separate normalization was made for H and H2 to remove the factor R in equation
(1.12) since the relative densities of the two target species were not known. The
other unknown - F, the overlap factor given in equation (1.13) - was also eliminated
in the normalization process but in repeating the normalization for positron data it
is assumed that the positron and electron beams have identical distributions, jp(z).
This may not be the case since Spicher et al (1990) do not specify beam intensities
this possible source of error is not quantifiable. Given these considerations it is
therefore clear that further study of the e +-H system is warranted.
1.6 Motivation for this Work
Being the antimatter equivalent of electrons the interactions of positrons with atoms
and molecules can be most informative in understanding the dynamics of inelastic
collisions. This comes from the difference in charge-sign between these particles. The
interactions of the particles with the atomic or molecular potentials thus differ in that
they are attractive and repulsive for, respectively, electrons and positrons. The
polarization interaction is attractive for both so at lower energies, when polarization
of the target is significant, the electron cross-section tends to be larger (Campeanu
et al, 1987a). Departures from this are valuable sources of information in that they
65
shed light on the influence of the projectiles’ properties on reactions.
A case in point is ionization at higher energies where the positron cross-section
exceeds that for electrons up to the point at which they converge according to the
Born approximation. It has been postulated that this is due to the positive positron
presenting an attractive potential which produces a region of reduced binding to the
atom (Schultz et al, 1991). The ionization of hydrogen is thus of great interest as it
is the simplest atom and interactions with it are three-body problems for which
confident theoretical predictions can be made. In this way physical models and
approximations based on them can be tested for their accuracy in depicting actual
processes.
The only experimental work on the e +-H system to date has been described above
(Spicher et al, 1990) and its possible sources of inaccuracy have been outlined. The
experiment that will be discussed in the following three chapters addresses the same
interaction but is inherently different in that what may be limitations to the earlier
work are not considerations here.
Also discussed is a complementary experiment in which the final state interaction
between a scattered positron and an ionized electron in e + -Ar collisions is studied.
Although strong interactions have been predicted and observed in ionization by other
positively charged particles different calculations conflict as to its significance in
positron collisions. The experiment that will be described in Chapter 5 has yielded
preliminary results which may resolve this disagreement.
The aim of the two pieces of experimental work that will be described in detail in
the following chapters is therefore to add to an increasing body of knowledge
concerning the exact nature of three body interactions between light particles. This
will aid our understanding of some of the most fundamental processes in physics.
6 6
CHAPTER 2
THE THEORETICAL CALCULATION OF
THE TOTAL POSITRON IMPACT
IONIZATION CROSS-SECTION OF
ATOMIC HYDROGEN
2.1 Introduction
In this chapter the general theories, both classical and quantum mechanical, which
have been applied to impact ionization by charged particles will be reviewed. Special
emphasis will be given to their use in calculating the total ionization cross-section of
positrons incident on atomic hydrogen. Comparison with experimental data is made
to determine the accuracy of the calculations and the validity of any approximations
made.
Atomic units will be used throughout, i.e. e = h = 1. Cross-sections will be expressed
in 7raQ where a0 is the Bohr radius. Energy will be quoted in electron-volts (eV).
2.2 Classical Calculations
The first calculation of impact ionization cross-sections was by Thomson (1912). This
treatment was classical in that all the particles involved were considered to be
obeying the Newtonian laws of motion. Thomson simplified the problem by
neglecting the interactions of particles other than the projectile and the atomic
electron. This binary encounter approximation therefore reduces impact ionization
to a two body Coulomb scattering problem for which the Rutherford formula is valid.
67
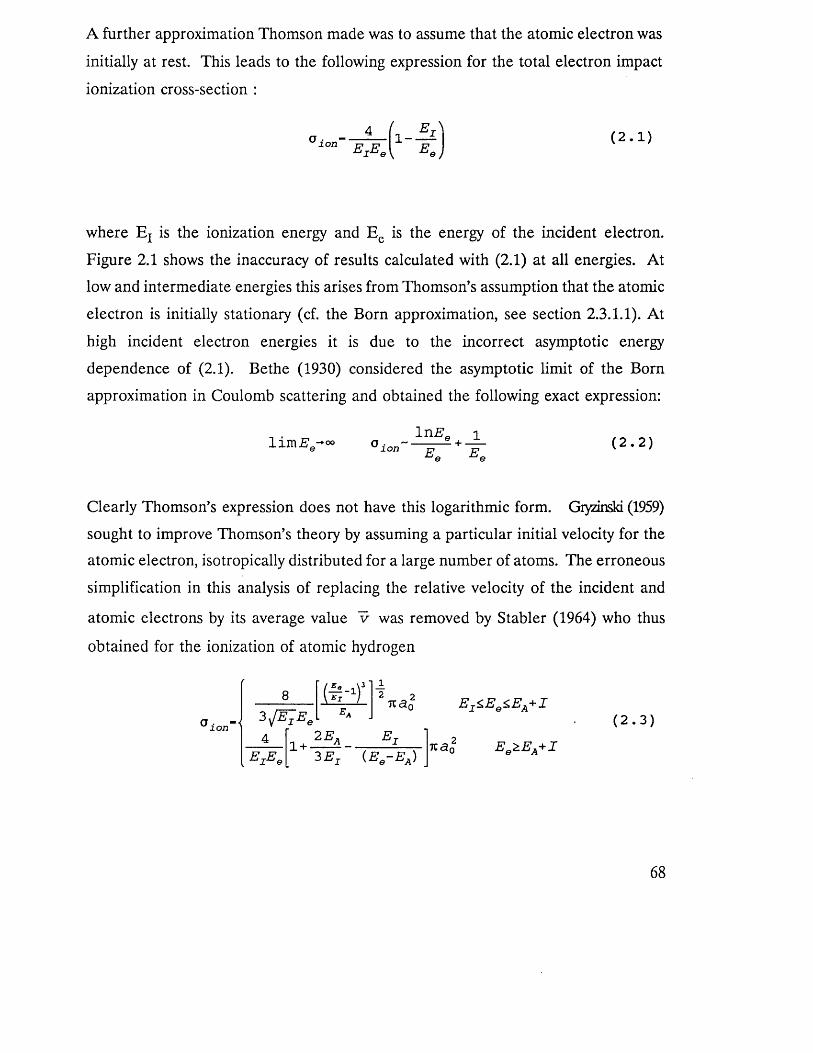
A further approximation Thomson made was to assume that the atomic electron was
initially at rest. This leads to the following expression for the total electron impact
ionization cross-section :
0 i°n~ 1 - (2 . 1 )
where Ej is the ionization energy and Ee is the energy of the incident electron.
Figure 2.1 shows the inaccuracy of results calculated with (2.1) at all energies. At
low and intermediate energies this arises from Thomson’s assumption that the atomic
electron is initially stationary (cf. the Born approximation, see section 2.3.1.1). At
high incident electron energies it is due to the incorrect asymptotic energy
dependence of (2.1). Bethe (1930) considered the asymptotic limit of the Born
approximation in Coulomb scattering and obtained the following exact expression:
1 tlE *1lim Ee-°> a .gn- ——s. + — (2.2)
Clearly Thomson’s expression does not have this logarithmic form. Giyzinski (1959)
sought to improve Thomson’s theory by assuming a particular initial velocity for the
atomic electron, isotropically distributed for a large number of atoms. The erroneous
simplification in this analysis of replacing the relative velocity of the incident and
atomic electrons by its average value v- was removed by Stabler (1964) who thus
obtained for the ionization of atomic hydrogen
® ionT*
8
3 v / ^ , 4
l i H
EjEb1+
2 E,
_i2 2 na.0
Et
Ej£Ee£EA+1(2.3)
3 Er <30
68
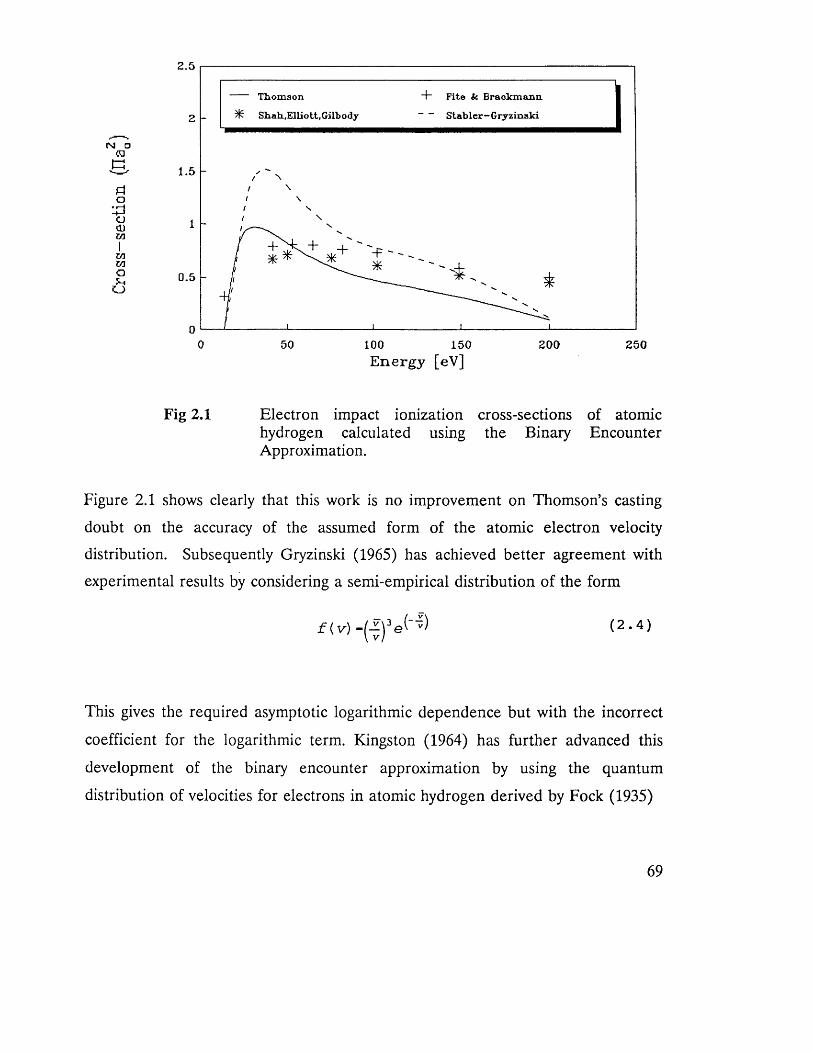
2.5
Thomson
% Shah,Elliott,Gilbody
“i- Fit© I t Brackm&nn
Stabler-G ryzinaki
(si □
3
d0-.aadJM
1MMO
1 .5
0.5
/ N / \
5 0 1 0 0 1 5 0
Energy [eV]200 2 5 0
Fig 2.1 Electron impact ionization cross-sections of atomic hydrogen calculated using the Binary Encounter Approximation.
Figure 2.1 shows clearly that this work is no improvement on Thomson’s casting
doubt on the accuracy of the assumed form of the atomic electron velocity
distribution. Subsequently Gryzinski (1965) has achieved better agreement with
experimental results by considering a semi-empirical distribution of the form
f ( v) ( 2 • 4 )
This gives the required asymptotic logarithmic dependence but with the incorrect
coefficient for the logarithmic term. Kingston (1964) has further advanced this
development of the binary encounter approximation by using the quantum
distribution of velocities for electrons in atomic hydrogen derived by Fock (1935)
69
4 7 1
n2J;m\KiJp)\2v2dV- 32 v*v2dv
n (v 2 + Vn) 4( 2 . 5 )
for the momentum wave functions with principal quantum number n and angular
momentum quantum numbers 1 and m. The atomic velocity, vn is
v ( 2 . 6 )n rih
Even with this exact formulation for the velocity distribution the binary encounter
approximation still lacks sufficient precision due to its very two-body nature. This
limitation prompted Abrines and Percival (1966a) to discard this approximation and
integrate the classical equations of motion exactly. They showed (concurrently with
Mapleton, 1966) that a distribution of velocities with an identical form to (2.5) could
be derived from the classical microcanonical distribution (Landau and Lifshitz, 1958)
for a system of particles each with total energy -E0 in the phase space defined by the
position vector r and momentum vector p which is expressed
p (r,p) - 6 (H+E0) ( 2 . 7 )
where H is the classical Hamiltonian which can be written for a particle in the
Coulomb field of a charge Z as
( 2 . 8 )2 m r
It was also shown that this distribution was uniform in the square of the angular
momentum given by
J 2- ( r x p ) 2 ( 2 . 9 )
70
between its limits of zero, which in classical mechanics corresponds to the harmonic
motion of the atomic electron in a straight line, through elliptical orbits of decreasing
eccentricity to its maximum value which gives a circular orbit. Random sampling
over this distribution was used to obtain the initial position and momentum co
ordinates for the atomic electron.
From (2.8) the Hamiltonian for the three body system shown in Figure 2.2 can be
written
H - l 1mc ( P i+P2+P3) + -|- m, mn+m,
/ 2 2 2 \
(p4 +P5 +P6 )( 2 . 1 0 )
ZAZB ^ J.+ ----------- - r ------------ + -------------RAB RBC RCA
where the subscripts (1,2,3) denote the Cartesian co-ordinates of projectile C with
respect to B and (4,5,6) are the Cartesian co-ordinates of A with respect to the
centre of mass of the atomic system (B,C). Following from (2.10) one can write
Hamilton’s equations for this system as
d t m, m,
dgj.3 _
dt1
m
dPj_dt
m.ZaZb
Rlc ™b+™c
A *l‘B
m
ma+m, Pj +3
mB+rncZbZc
RAB( 2 . 11 )
Z CZ A mz
R2ca mB+mcmB
■Gj -Gj+3
dPj + 3 _ ZaZb dt R■AB
mcmB+mc V j+Vj+3
ZaZb
R 3ca
mbmB+mc 3
71
T rajec to ry o f A
Modified im pact Param eter b7
ABImpact
Param eter
BC
Centre of Mass of (B,C)
Fig 2.2 A diagram showing the notation that is employed in the discussion of classical calculations in the text.
N 0d
K
AQ
-irt4 Ju■un
mmau
u
2 .5
Spicher e t al (1900)
Oh8a i l et al
Percival t t Valentine
Wetmore & Olson
1 .5
0 .5
/■i
1 401200 10020 4 0 60 60
Energy [eV]
Fig 2.3 Positron impact ionization cross-sections of atomic hydrogen calculated using the Classical Trajectory Monte Carlo (CTMC) method.
72
In their method, Abrines and Percival solve these equations for proton impact
ionization of atomic hydrogen for a random sample of the square of the modified
impact parameter b ' (shown in Figure 2.2) from a distribution uniform up to a limit
bmax. Beyond this limit the cross-section for the relevant process is negligible.
After collision the relative positions of the three particles reveal which of the
possible reactions occurred: elastic scattering, ionization or charge exchange. For N
collisions the cross-section for process x is given by
where Nx is the number of collisions that involved process x.
The encouraging similarity of the results of these calculations to experimental data
led Percival and Valentine (1967) to apply the same method to positron impact
ionization yielding the results shown in Figure 2.3. Their disagreement with the
measured cross-sections cannot be ascribed to the simplification of considering the
modified impact parameter b ' rather than the conventional impact parameter b
shown in Figure 2.2. This simplification, intended to ease the calculation, essentially
reduces the problem to a two-body collision and one would therefore expect it to be
less accurate at low energies. Due to this, the same calculation repeated without
simplification by Ohsaki et al (1985) and Wetmore and Olson (1986) gives results
with slightly different energy dependencies below 50eV (see Figure 2.3). These later
calculations agree to within reported statistical errors but differ considerably from
experimental data.
It is interesting to note the reasonably good agreement of cross-sections calculated
with this method for electron and proton impact ionization of atomic hydrogen (see
73
Rudge, 1968 and Abrines and Percival, 1966b), in contrast to the positron case. This
can be explained by an inherent limitation of calculations in the classical domain.
Classical mechanics can be considered to be the limit of quantum mechanics as h—►().
This removal of Heisenberg’s uncertainty principle leads to a limit on the validity of
classical mechanics which can be expressed for particles of momentum p being
scattered through an angle 0 (from Bransden and Joachain, 1983, pp534)
0 k 0 e - — ( 2 . 1 3 )P
Below the critical angle 0C, the validity of a classical calculation is thus precluded.
0C will be small for relatively massive projectiles such as protons and one would
expect classical mechanics to yield reasonably accurate results even at low energies -
this is indeed observed to be the case for ionization of atomic hydrogen. For lighter
particles though 0C is large enough for classical mechanics to fail to describe the
motion of a significant number of scattered projectiles. This explains the inaccuracy
of the calculated ionization cross-sections for both electrons and positrons below
~60eV . At higher energies the CTMC method suffers from predicting the incorrect
asymptotic energy dependence as did the binary encounter approximation. This is
by virtue of their being purely classical treatments which neglect long distance
interactions between the three charged particles. The fact that the electron data
exhibits good agreement with experimental results at high energies implies that this
interaction may be quite weak in this case. This would not seem to be the case for
protons and positrons.
2.3 Quantum Mechanical Calculations
As for all other scattering processes the total cross-section for ionization is evaluated
74
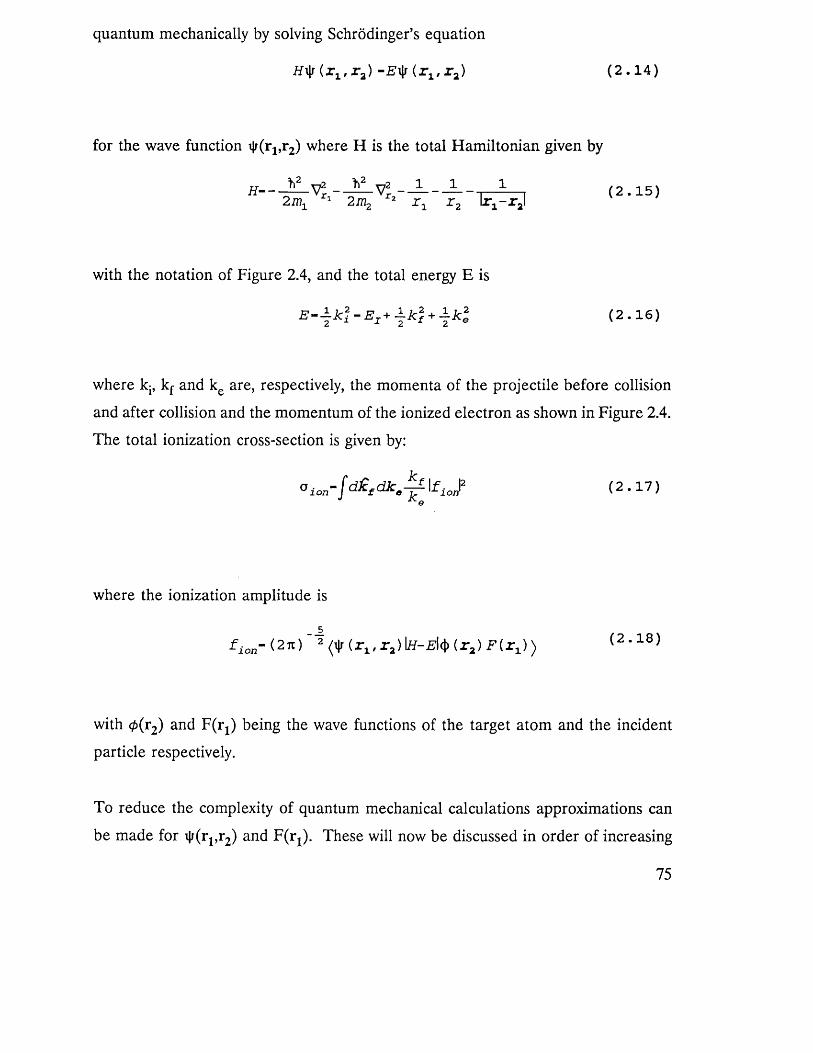
quantum mechanically by solving Schrodinger’s equation
Hty (r l fr2) -Evlr (r l fr2) ( 2 . 1 4 )
for the wave function where H is the total Hamiltonian given by
f)2 x-,2 h2H Z L _ V j — -n— -— - (2.15)2m1 1 2m2 2 r 2 \r±-r2\
with the notation of Figure 2.4, and the total energy E is
E - ± k l - E t + ± k 2f + -licj (2.16)2 1 2 2
where kj, kf and ke are, respectively, the momenta of the projectile before collision
and after collision and the momentum of the ionized electron as shown in Figure 2.4.
The total ionization cross-section is given by:
(2.17)
where the ionization amplitude is
5f ion-(,2%)~2 (2.18)
with 0(r2) and F(r1) being the wave functions of the target atom and the incident
particle respectively.
To reduce the complexity of quantum mechanical calculations approximations can
be made for \J/(r1,r2) and F(rx). These will now be discussed in order of increasing
75
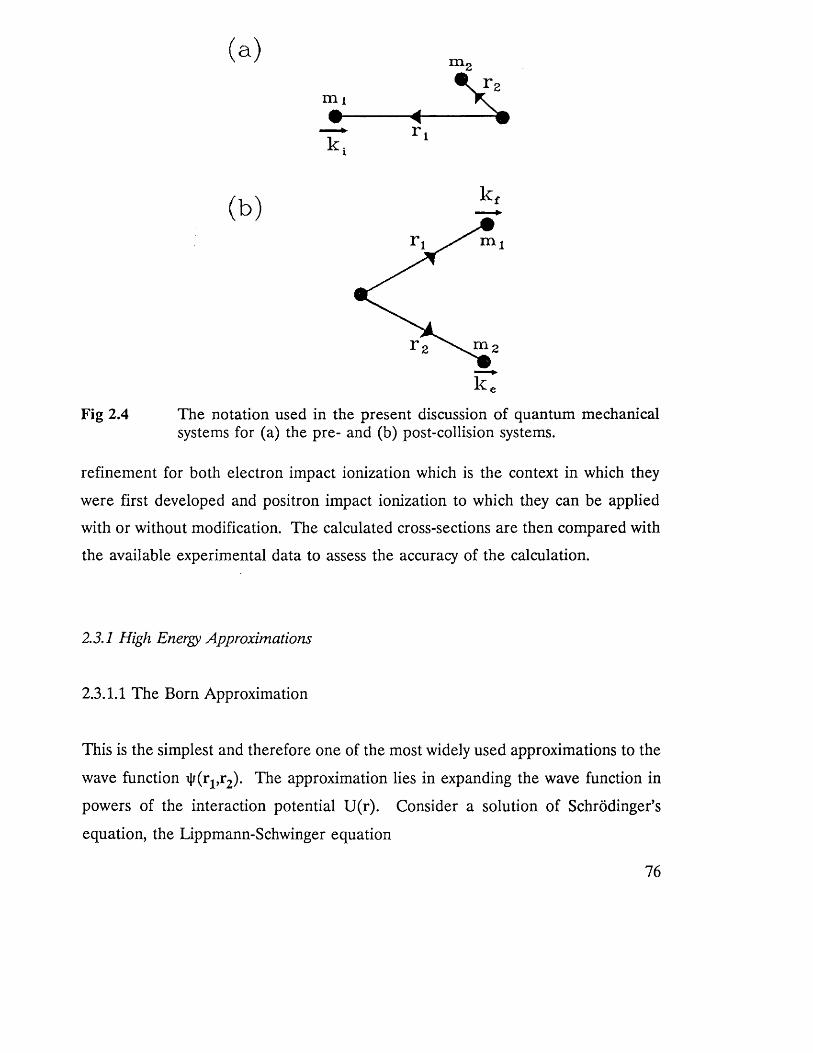
(a) m 2
m i<r
(b)
Fig 2.4 The notation used in the present discussion of quantum mechanical systems for (a) the pre- and (b) post-collision systems.
refinement for both electron impact ionization which is the context in which they
with or without modification. The calculated cross-sections are then compared with
the available experimental data to assess the accuracy of the calculation.
2.3.1 High Energy Approximations
2.3.1.1 The Born Approximation
This is the simplest and therefore one of the most widely used approximations to the
wave function il/(rl5r2). The approximation lies in expanding the wave function in
powers of the interaction potential U(r). Consider a solution of Schrodinger’s
equation, the Lippmann-Schwinger equation
were first developed and positron impact ionization to which they can be applied
76
(r) -4)^ (r) + JG0(+) (r, r 7) G(r7) y ki (r7) dr7 ( 2 . 1 9 )
where G0 +^r,r#) is the outgoing Green’s function, and 0jci(r) incident plane
wave.
If this is solved by iteration one obtains the sequence of functions
* M r ) -4>*i (*)y\r1 ( r ) ~4>k ( r ) + fG 0(+) U ( r / ) (J)*. ( r ) d r 7
: *: ( 2 . 2 0 )
i|r ( r ) -<J> ( r ) + JG0(+> ( r , r 7) U(r') ( r ) d r 7
which can be substituted for ^/(rj,^) in the integral expression for the scattering
amplitude (2.18) to give the functions
£bi~ z ^ kt\u\^k)
f a l — 2x2<4) IC7lt1> (2 . 2 1 )
which are truncations to one and two terms respectively of the Born series for the
scattering amplitude. The simplicity of the first term, fBl has led to its wide use as
an expression for the scattering amplitude. This is the first Born approximation as
originally derived by Born (1926). The limit of its validity can be assessed by
considering the convergence of the Born series, this depends on the strength of the
scattering potential U and the time a /v the incident particle of velocity v spends
within the potential. Rapid convergence requires "weak" scattering i.e. the passage
time of the particle must be much less than the time h /U required for the potential
to significantly influence the particle:
77
( 2 . 2 2 )
For electron or positron scattering off a screened Coulomb potential of atomic
dimensions the Born approximation is therefore valid only for incident particles with
a kinetic energy greater than ~500eV.
All the theoretical treatments of impact ionization which have employed the first
Born approximation have considered electrons as the incident particle. From (2.18)
it is clear that the Born scattering amplitude will have a different sign (when the sign
of the potential is reversed) for positron impact ionization but the cross-section a ion
given by (2.17) will be identical since it depends on the square of the amplitude.
However, in an attempt to refine the Born approximation most authors who have
used it in electron impact ionization have also included the possibility of exchange
between the incident and atomic electrons in their calculations. The exact form of
their expressions for the ionization amplitude must therefore be considered before
their numerical results can be used for positron impact ionization.
Exchange effects in ionization were first considered in the derivation of the
asymptotic forms of the wave function by Peterkop (1960) and Rudge and Seaton
(1964). These are
78
These expressions allow for excitation to a bound state a of the atom as well as
ionization into the continuum. The amplitudes f(kf,ke) and g(kpke) are known as the
"direct" and "exchange" ionization amplitudes respectively and it has been shown by
Peterkop (1961) that
f ( k f rk e) - g ( k e, k f ) (2.24)
The scattering amplitude from which the cross-section is calculated then reduces
from
\fioi}2- \ f ( k f , k e)\2+\g(kf , k e)\2+Re [ f (kf f k 0) g* (kf , k e) ] (2.25)
to
\fioJ*- \ f (kf f k e)\2+\ f (ke, k f ) \2+ R e [ f ( k ff k e) f* (ke, k f ) ] (2.26)
The cross-section is obtained by integrating this over kf, ke and k|. To obtain results
which can also be considered as positron impact ionization cross-sections one must
neglect exchange i.e. the exchange amplitude and interference terms in (2.25).
Rudge (1968) has pointed out that many authors only leave out the interference term
in (2.25) and to correctly neglect exchange they must then only integrate to E /2 as
the first two terms in (2.25) are equal and the integral is symmetric with respect to
substituting k | for k£. Thus, for a calculation to be suitable for the case of positrons
being incident on a target it must neglect the interference term and integrate to E
since there is no exchange amplitude when the projectile is distinguishable from the
atomic electron. This discussion will therefore be restricted to calculations which
have the following form for the ionization cross-section
f \ f ( k f , k e)\2d£f d£0 (2.27)
19
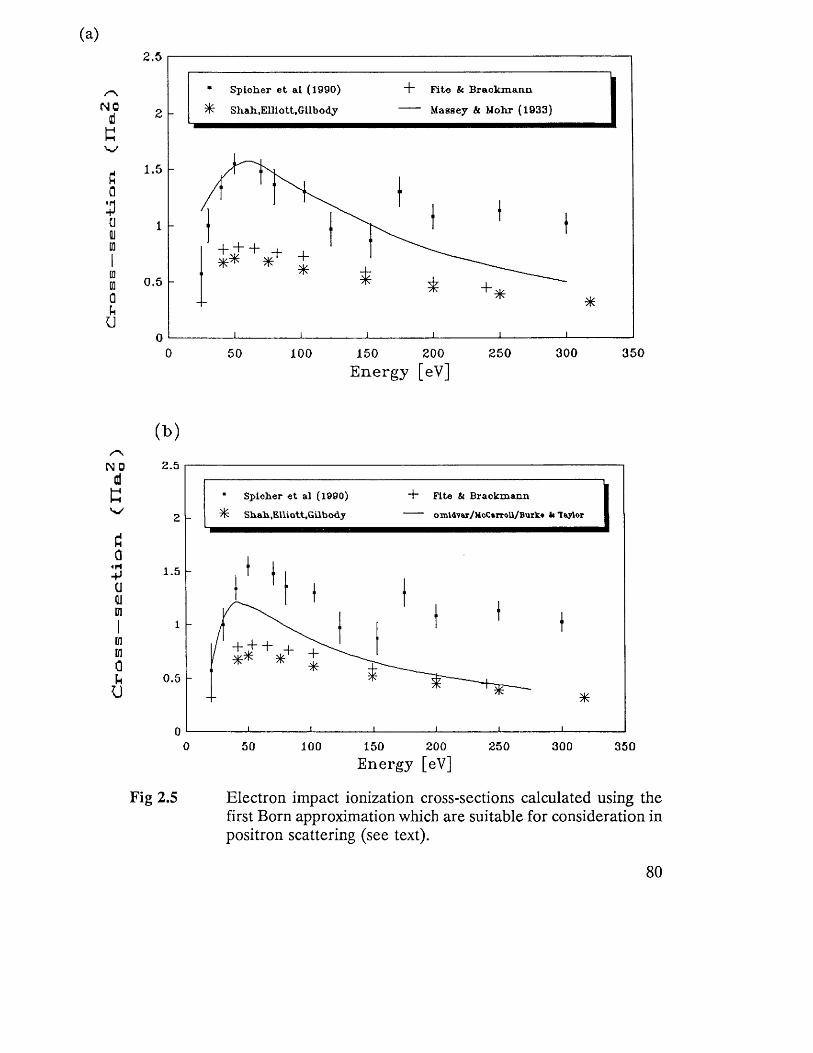
(a)
NOd
c
Q3CJUgoIto0]QU
C
2.5
4" F ite S i B ra ck m a n n
M assey & Mohr (19 3 3 )
■ S p ich er e t a l (1990)
% S h ah ,E llio tt.G ilb ody
1.5
0.5
50 100 150 200E n ergy [eV]
250 300 350
0>)
N 0 2 .5d
G
6Q
■+J
CJCJCT
□nQU 0.5
U
00 50 100 150 200 250 300 350
Energy [eV]
Fig 2.5 Electron impact ionization cross-sections calculated using the first Born approximation which are suitable for consideration in positron scattering (see text).
4“ Fite St Brackm ann
omYdvar/HoCurroU/Burlw b Taylor
■ Spicher e t al (1990)
Shah .Elliott,Gilbody
+ J" "b 4-
80
The first attempt to calculate the electron impact ionization cross-section of atomic
hydrogen using the first Born approximation was by Massey and Mohr (1933) who
used the following form for the ionization amplitude
( 2 - 28)
where <p0 is the target ground state wave function and 0 k is an exact wave function
for the electron in the Coulomb field of the H + ion derived by Sommerfeld (1931).
These authors then integrated (2.27) numerically to obtain the total ionization cross-
section a ion. McCarroll (1957) and Omidvar (1965) have since repeated this
calculation with greater accuracy. Burke and Taylor (1965) adopted a slightly
different approach in that they took 0 k in (2.28) to be a superposition of a Coulomb
modified plane wave and an outgoing distorted spherical wave. They then considered
a partial wave analysis of 0 k and summed the contributions to the cross-section from
different angular momenta to get the total cross-section. All these theoretical results
are shown in Figure 2.5 (a) and (b) together with the measured electron impact
ionization cross-sections of Fite and Brackmann (1958) and Shah et al (1987) and the
measured positron impact ionization cross-section of Spicher et al (1990). It is clear
that the most recent theoretical calculations based on the Born approximation are
in agreement but are significantly different to the results of Massey and Mohr thus
casting some doubt on the accuracy of this earlier work. Within the range of validity
of the approximation - above 500eV - the later results are also in accordance with
the experimental data for both electrons and positrons. At lower incident energies
though, one can see that the positron data doesn’t converge with the Born
approximation until a much higher energy than the electron data: this may indicate
that a stronger interaction exists in positron scattering than in the electron case.
2.3.2.2 The Glauber Approximation
This is based on a method of approximation developed in optics and first employed
in quantum theory by Moliere (1947). It was extended to high energy scattering off
81
atoms by Glauber (1959). One can write for the Hamiltonian, H in Schrodinger’s
equation (2.14)
H— ±Vl+h(r2)--±- +r 1 (2.29)
where
h ( r 2) - - ± V 22- ± - WA X-> (2.30)
is the two-body Coulomb Hamiltonian for energy W. Glauber then takes the
following form for the solution
(2.31)
where <p is a function which varies slowly over a particle wavelength. Approximating
to first order Schrodinger’s equation then takes the form
i k i ldz ” ^(2.32)
where
V— (2.33)1 2
A further approximation is to disregard h which represents the energy of the ejected
electron in ionizing collisions i.e. it is assumed that these electrons have very little
kinetic energy. The solution of (2.32) is then
<J> ( z ) - e x p f V(z') dz' (2.34)
82
and is now given by
( r 1# r 2) -<1> ( r 2) e lk*Zlef V(r2,I>+JEI z / ) d z /kt J ( 2 . 3 5 )
where the following substitution has been made
r x-b+ iz1z 1 (2.36)
with b being the impact parameter. From the integral expression (2.18) one obtains
for the Glauber scattering amplitude after McGuire et al (1973)
where q = k-kj- is the momentum transfer, 0 o(r2) groun^ state hydrogenic wave
function and x(r2) is the radial Coulomb wave function for an electron in the field
of the H + ion which satisfies
The ionization cross-section is then calculated from (2.17)
To satisfy the approximations made in this method two conditions must be met. The
energy of the incident particle must greatly exceed the magnitude of the scattering
potential to justify the neglect of h(r2). Also the particle wavelength must be smaller
than the range a of the potential in order to approximate to first order in (2.32)
(Glauber, 1959). These conditions can also be written:
i c a » l (2.39)
83
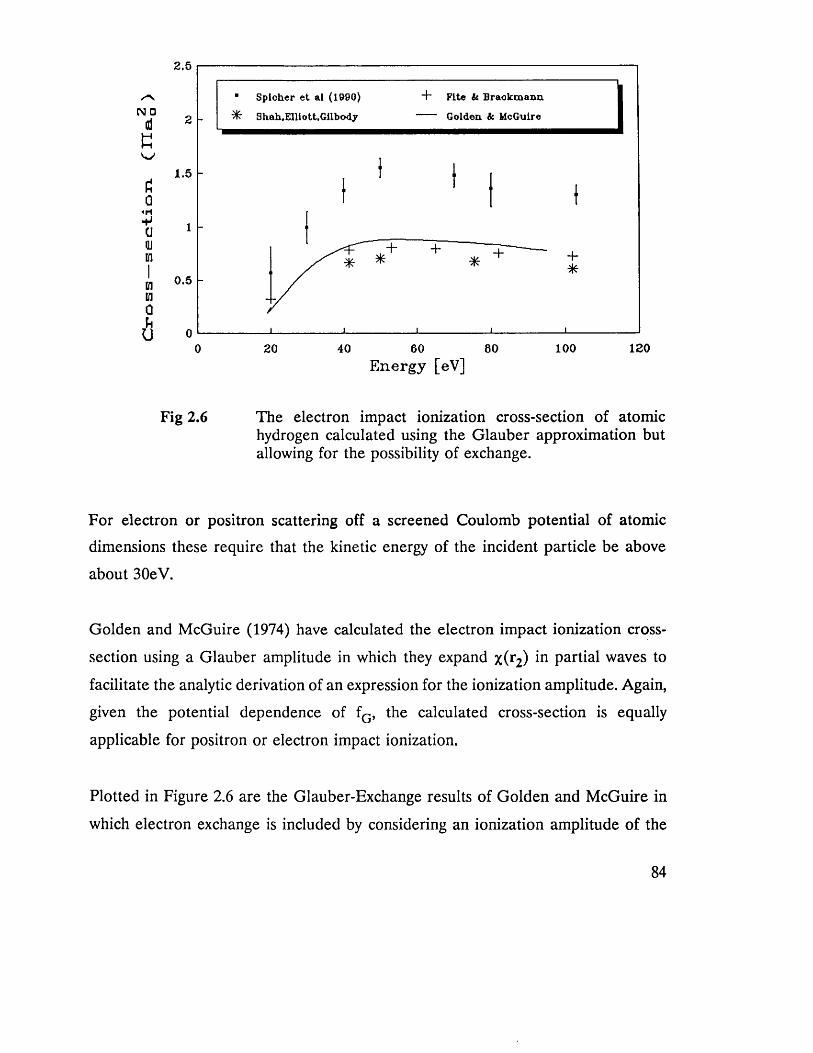
2.5
"t" Fite i t Braokmann.
Golden. St McGuire
■ Spicher e t al (1990)
X Shah.Elliott.G ilbodj
/AN □
dc
1.5
h °-5□Qb
U o1201000 60 8020 40
Energy [eV]
Fig 2.6 The electron impact ionization cross-section of atomic hydrogen calculated using the Glauber approximation but allowing for the possibility of exchange.
For electron or positron scattering off a screened Coulomb potential of atomic
dimensions these require that the kinetic energy of the incident particle be above
about 30eV.
Golden and McGuire (1974) have calculated the electron impact ionization cross-
section using a Glauber amplitude in which they expand x(r2) in partial waves to
facilitate the analytic derivation of an expression for the ionization amplitude. Again,
given the potential dependence of fG, the calculated cross-section is equally
applicable for positron or electron impact ionization.
Plotted in Figure 2.6 are the Glauber-Exchange results of Golden and McGuire in
which electron exchange is included by considering an ionization amplitude of the
84
form (2.25) in which both f(k^ke) and g(kf>ke) are calculated by the Glauber method.
The experimentally determined cross-sections of Fite and Brackmann (1958) and
Shah et al (1987) for electrons and of Spicher et al (1990) for positrons have been
shown for comparison. It is clear from the diagram that the Glauber-Exchange
calculation gives reasonable agreement with the experimental electron data in the
energy range over which the approximation is valid. However, the basic Glauber
results, excluding exchange, differ considerably from the positron data, being smaller
at all energies. This discrepancy could well be explained by the assumption that the
ejected electron has little relative momentum compared to the ion being erroneous.
If this were the case the electron would completely screen the bare ionic nucleus
from the positron and would not interact with the positron either. Recent theoretical
work (Campeanu, 1990 - see section 2.3.2) indicates that this is not correct and thus
casts doubt on the suitability of the Glauber approximation for calculations on
positron impact ionization of atomic hydrogen.
2.3.2 Distorted Wave Calculations
It is apparent from the preceding discussion that there are serious deficiencies in the
high energy approximations at the incident energies where the total ionization cross-
section shows most structure (below ~150eV). Thus in order to simulate the
collision dynamics accurately more complex models for the potential in which the
particles move have been tested. In this section these calculations will be reviewed
with occasional reference to systems other than e +-H if it aids the elucidation of the
underlying principles.
Since, after ionization, the scattered positron and the ionized electron will be moving
in the Coulomb field of the remaining proton one can represent the final state wave
function iKri,r2) as a product of two Coulomb waves each associated with one of the
85
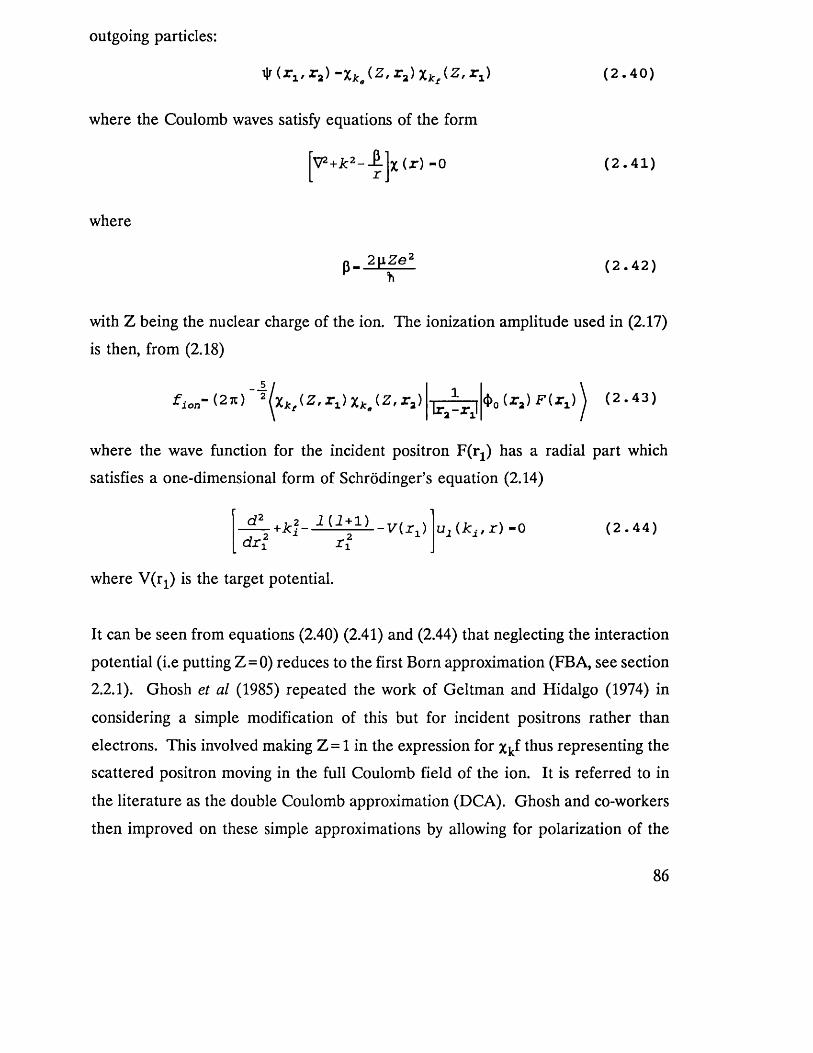
outgoing particles:
i|f (rx,r2) -xk9(Z, r a) %kt{Z, rx) ( 2 . 4 0 )
where the Coulomb waves satisfy equations of the form
V2+Jc ‘- 1 X ( ? ) “ 0 ( 2 . 4 1 )
where
o_ 2 \ iZ e : P" *
( 2 . 4 2 )
with Z being the nuclear charge of the ion. The ionization amplitude used in (2.17)
is then, from (2.18)
4>0 ( T j ) F ( r i ) ) ( 2 . 4 3 )
where the wave function for the incident positron F(r1) has a radial part which
satisfies a one-dimensional form of Schrodinger’s equation (2.14)
d 2d r }
I L - v u jrl
Uj (k i t r ) -0 ( 2 . 4 4 )
where V(rx) is the target potential.
It can be seen from equations (2.40) (2.41) and (2.44) that neglecting the interaction
potential (i.e putting Z = 0) reduces to the first Born approximation (FBA, see section
2.2.1). Ghosh et al (1985) repeated the work of Geltman and Hidalgo (1974) in
considering a simple modification of this but for incident positrons rather than
electrons. This involved making Z = 1 in the expression for x^f thus representing the
scattered positron moving in the full Coulomb field of the ion. It is referred to in
the literature as the double Coulomb approximation (DCA). Ghosh and co-workers
then improved on these simple approximations by allowing for polarization of the
8 6
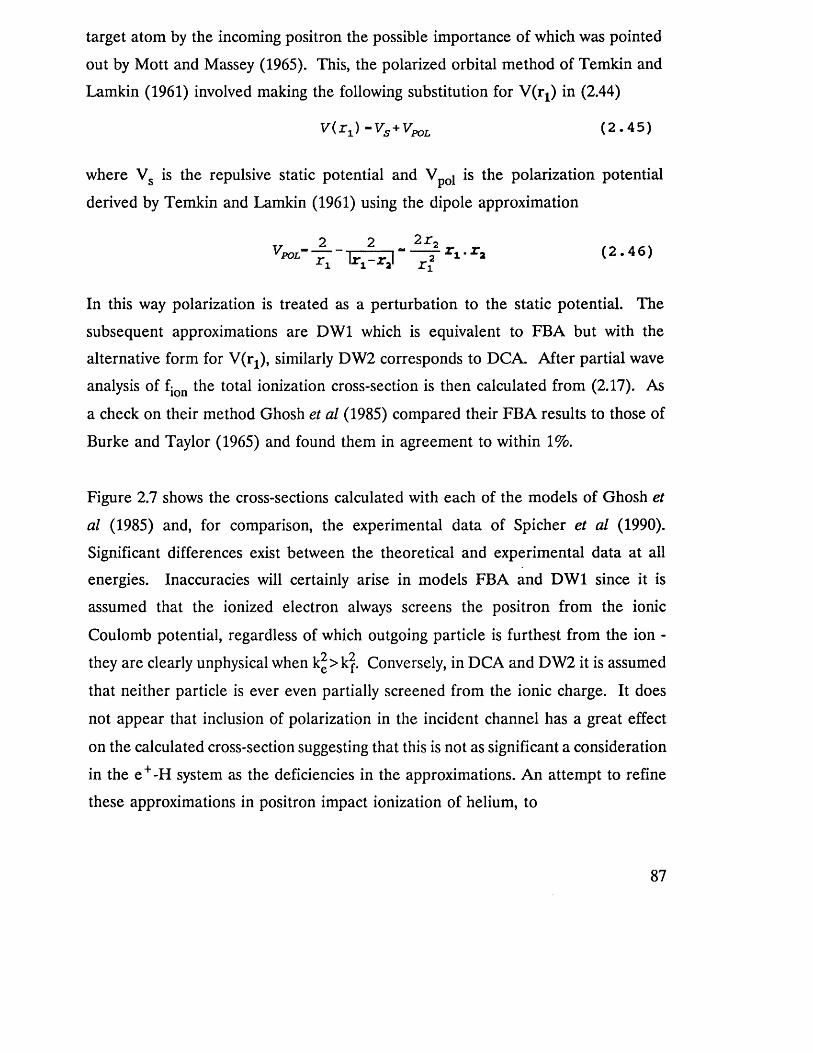
target atom by the incoming positron the possible importance of which was pointed
out by Mott and Massey (1965). This, the polarized orbital method of Temkin and
Lamkin (1961) involved making the following substitution for V(rj) in (2.44)
V i r J - V s + V m (2.45)
where Vs is the repulsive static potential and V pol is the polarization potential
derived by Temkin and Lamkin (1961) using the dipole approximation
In this way polarization is treated as a perturbation to the static potential. The
subsequent approximations are DW1 which is equivalent to FBA but with the
alternative form for V(r1), similarly DW 2 corresponds to DCA. After partial wave
analysis of fj the total ionization cross-section is then calculated from (2.17). As
a check on their method Ghosh et al (1985) compared their FBA results to those of
Burke and Taylor (1965) and found them in agreement to within 1%.
Figure 2.7 shows the cross-sections calculated with each of the models of Ghosh et
al (1985) and, for comparison, the experimental data of Spicher et al (1990).
Significant differences exist between the theoretical and experimental data at all
energies. Inaccuracies will certainly arise in models FBA and DW1 since it is
assumed that the ionized electron always screens the positron from the ionic
Coulomb potential, regardless of which outgoing particle is furthest from the ion -
they are clearly unphysical when k£>kj. Conversely, in DCA and DW2 it is assumed
that neither particle is ever even partially screened from the ionic charge. It does
not appear that inclusion of polarization in the incident channel has a great effect
on the calculated cross-section suggesting that this is not as significant a consideration
in the e +-H system as the deficiencies in the approximations. An attempt to refine
these approximations in positron impact ionization of helium, to
87
N 0d
E
6 a
«rlfJ(J<U
ImH0u
U
2.5
DCA/DW2Spicher e t «l (1990) ~ " DW1FBA
1.5
0.5
55 6015 20 25 35 40 45 5030Energy [eV]
Fig 2.7 The positron impact ionization cross-section calculated using the indicated models (see text) by Ghosh et al (1985).
2.5N O
dK
* S p ich er e t al (1990) CPT CPE/DCPT - “ DCPE
Aa+>auD1
1.5
in□QU
U
0.5
15 20 25 7030 35 40 45 50 55 60 65Energy [eV]
Fig 2.8 The positron impact ionization cross-section of atomic hydrogen calculated using different models (for details see text) by Mukherjee et al (1989).
8 8
which they had also been applied (Basu et al, 1985) was made by Campeanu et al
(1987). Their models CPA and CCA correspond to DW1 and DW2 of Ghosh et al
(1985) apart from the following form for Vpol in (2.45) (Schrader, 1979)
- a2 r i
r i * r o(2.47)
r >r4 X1 X 02 r :
where a is the dipole polarizability of helium and rQ is a cut-off parameter
(r0 = 1.774a0 was assumed, after Schrader, 1979). To prevent the occurrence of the
unphysical situation discussed earlier, the CPT model limits the integration in (2.43)
to k^<kf but is otherwise equivalent to CPA. The CPE model integrates fully over
dke but, in the region k^>k|, considers the ejected electron to be moving in the
"double" Coulomb potential of the ion together with the positron, which is in the
unscreened ionic field. For He these latter two models provided excellent agreement
with the experimental data of Fromme et al (1986) - see section 1.5.1 for
experimental details.
Mukherjee et al (1989) extended this work to positron impact ionization of atomic
hydrogen but based their CPT and CPE models on the DW1 model of Ghosh et al
(1985) rather than the CPA model of Campeanu et al i.e. they took the Temkin-
Lamkin form (2.46) for the dipole polarization potential. They also consider the
effects of the distortion due to dipole polarization on the final state wave functions:
the DCPT model differs only from CPT in that the scattered positron wave function
Xkf is calculated using the potential V (r^ from (2.46) and DCPE differs from CPE
in using the potential (2.46) to calculate the wave function of the ionized electron Xfce
in the momentum range k^<kf. In DCPT the scattered positron is considered to be
moving in the polarized potential of the hydrogen atom, this is a reasonable
assumption for high kf since the proton-electron separation, r2 will then be small
compared to the positron distance, rx and the potential of the proton and electron
89
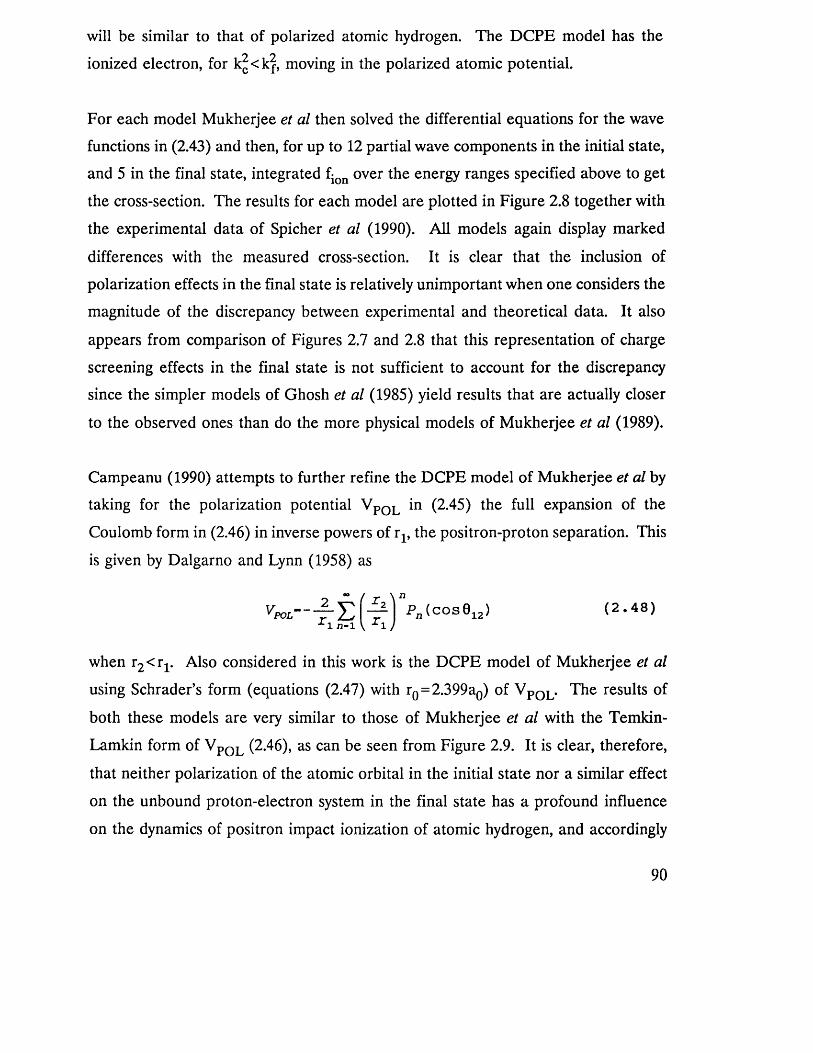
will be similar to that of polarized atomic hydrogen. The DCPE model has the
ionized electron, for k£<kj, moving in the polarized atomic potential.
For each model Mukherjee et al then solved the differential equations for the wave
functions in (2.43) and then, for up to 12 partial wave components in the initial state,
and 5 in the final state, integrated fion over the energy ranges specified above to get
the cross-section. The results for each model are plotted in Figure 2.8 together with
the experimental data of Spicher et al (1990). All models again display marked
differences with the measured cross-section. It is clear that the inclusion of
polarization effects in the final state is relatively unimportant when one considers the
magnitude of the discrepancy between experimental and theoretical data. It also
appears from comparison of Figures 2.7 and 2.8 that this representation of charge
screening effects in the final state is not sufficient to account for the discrepancy
since the simpler models of Ghosh et al (1985) yield results that are actually closer
to the observed ones than do the more physical models of Mukherjee et al (1989).
Campeanu (1990) attempts to further refine the DCPE model of Mukherjee et al by
taking for the polarization potential V pOL in (2.45) the full expansion of the
Coulomb form in (2.46) in inverse powers of rx, the positron-proton separation. This
is given by Dalgarno and Lynn (1958) as
f - E1 l n - l— | Pn(cos012) (2.48)■Z* 1
when r2 <r1. Also considered in this work is the DCPE model of Mukherjee et al
using Schrader’s form (equations (2.47) with r0 = 2.399a0) of V poL. The results of
both these models are very similar to those of Mukherjee et al with the Temkin-
Lamkin form of VpoL (2.46), as can be seen from Figure 2.9. It is clear, therefore,
that neither polarization of the atomic orbital in the initial state nor a similar effect
on the unbound proton-electron system in the final state has a profound influence
on the dynamics of positron impact ionization of atomic hydrogen, and accordingly
90
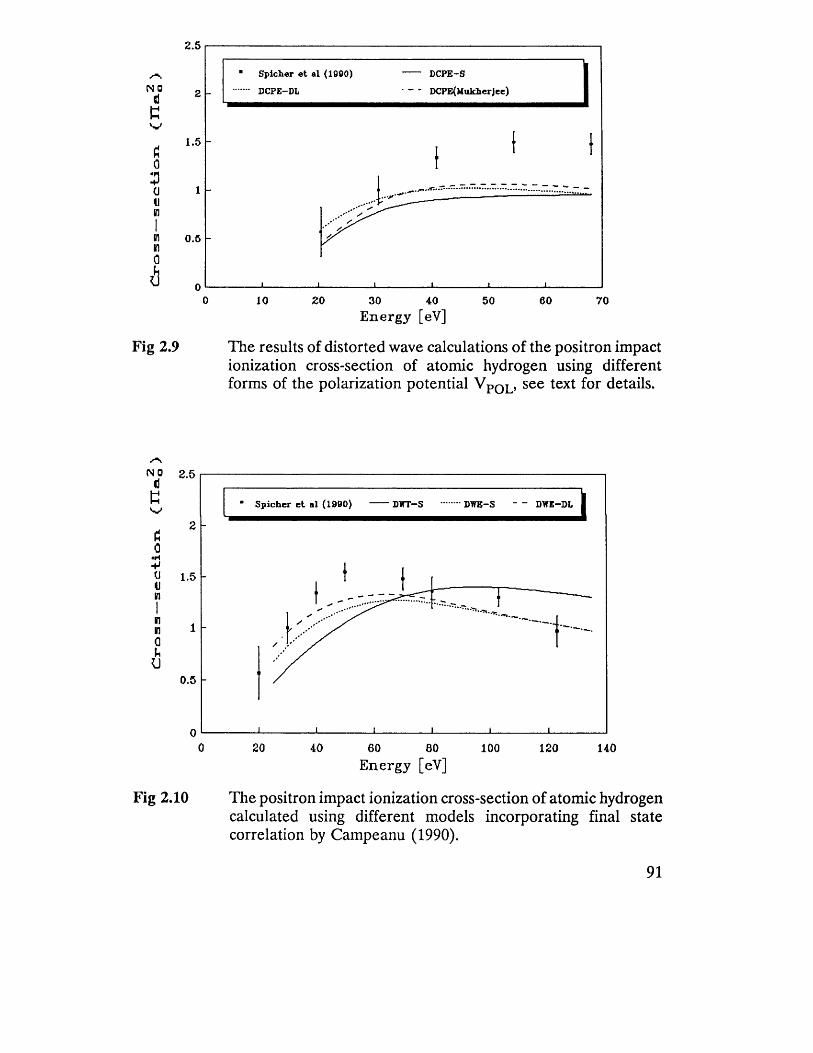
2.5
NO(jE
d03aun1nn0
b
Fig 2.9
1.5
0.5
Spicher e t al (1800)
DCPE-DL
DCPE—S
DCPE{Mukherjee)
j . xx10 20 3 0 4 0
E n ergy [eV]5 0 6 0 7 0
The results of distorted wave calculations of the positron impact ionization cross-section of atomic hydrogen using different forms of the polarization potential V POL, see text for details.
dE
d0«H+»(jtiin1mn0UU
Fig 2.10
2 .5
• Spicher e t al (1990) DTTT-S DWE-S
2
1.5
1
0.5
0
0 20 40 60 8 0 100 120 140
Energy [eV]
The positron impact ionization cross-section of atomic hydrogen calculated using different models incorporating final state correlation by Campeanu (1990).
91
does not affect the value of the total ionization cross-section significantly.
Following similar work by Rudge and Seaton (1965) who consider the interaction
between the two final state electrons in electron impact ionization of atomic
hydrogen, Campeanu has attempted to include the effects of correlation between the
scattered positron and ionized electron in the DCPE model. An indication of the
possible importance of this effect can be seen in the results of Rudge and Seaton.
Using a simple plane incident wave reasonable agreement with experimental data at
low energies is obtained by inclusion of final state correlation. They consider each
outgoing electron to be in the Coulomb potential of an effective charge given by
j - e ' f < 2 - 4 9 )
This accounts for the partial screening of the ionic charge by the slower of the
outgoing particles and the Coulomb interaction between the particles. Ghosh et al
(1984) used a similar model to calculate the triple differential cross-section for
positron impact ionization of atomic hydrogen and obtained results qualitatively
different from their FBA and DCA models (see above). This prompted Campeanu
(1990) to incorporate correlation effects into the much more refined DCPE model
by calculating both final state wave Coulomb wave functions, Xke anc* Xkf usin 8 ionic
charges given by (2.49) for all energies of the ejected electron. The ionization
amplitude fion is calculated from (2.43) as prescribed by this model for both the
Schrader (2.47) and Dalgarno-Lynn (2.48) forms of the polarization potential. The
cross-sections obtained after partial wave decomposition and subsequent integration
of fion in (2.17) are shown in Figure 2.10 together with the experimental results of
Spicher et al (1990). These theoretical results show reasonable agreement with
experimental data - a marked improvement on other models which signifies the
strength of the correlation between the scattered positron and the ionized electron.
It appears, therefore, that the DCPE model using the Dalgarno-Lynn polarization
92
potential (2.48) and allowing for a final state interaction between the outgoing
particles via expression (2.49) provides a more complete representation of positron
impact ionization of atomic hydrogen than has been achieved previously.
2.4 Summary
The development of a mathematical model which can accurately predict observables
such as the impact ionization cross-section yields valuable information about the
dynamics of the system in question. From the attempts to form such a model for
positron impact ionization of atomic hydrogen one can reach several conclusions
about the nature of the interaction:
• Long-range polarization of the atomic orbital by the incident positron and the
analogous final state case for the unbound electron and proton is insignificant
compared to the three body Coulomb interaction.
• The attractive nature of the positron-electron interaction leads to a
correlation between the particles for a long distance beyond the collision
region.
To ensure that the collision dynamics in positron impact ionization of atomic
hydrogen are fully understood it is therefore important to measure the total
ionization cross-section accurately. The completeness of our understanding of this
problem can then be determined.
93
CHAPTER 3
THE DETERMINATION OF THE TOTAL POSITRON
IMPACT IONIZATION CROSS-SECTION OF
ATOMIC HYDROGEN-EXPERIMENT
3.1 General Layout and Principles of Operation
The total ionization cross-section of positrons incident on hydrogen atoms is to be
measured here in a crossed-beam experiment of the type described earlier (see section
1.5.2). A magnetically transported mono-energetic positron beam crosses a highly
dissociated jet of hydrogen gas effusing from a radio-frequency powered atomic
hydrogen source normally to the axis of symmetry of the diverging atomic beam.
On the detection of a positron after its traversal of the scattering region an electric
field perpendicular to the axes of both the positron beam and the atomic source is
applied momentarily across this region. It serves to extract positive ions created on
positron impact ionization thus enabling their detection. The time of flight of ions to
the detector in this applied field identifies ions of different charge-to-mass ratios.
Three separate pieces of experimental apparatus-the positron beam, the atomic
hydrogen source and the ion extraction system-have therefore been interfaced to
facilitate the measurement of the total positron impact ionization cross-section of
atomic hydrogen. Each of these will now be discussed in detail as will the procedures
utilized for the collection and analysis of experimental data.
3.2 Slow Positron Production and Transport
As discussed earlier (section 1.3) slow positrons are obtained by moderating the
94
energies of fast p+ particles emitted in the decay of certain radio-nuclides. In this
experiment a 22Na p+-source supplied by Amersham International was used. Its activity
at the time the experiment was performed was 800p,Ci. It takes the form of a 4mm
diameter deposit of 22Na on a platinum disc 4mm thick with a diameter of 18mm
sealed with a lOjim titanium window. A central M2 threaded hole in the platinum disc
enabled it to be mounted onto a brass plug externally threaded with a diameter of
20mm. This plug is then to be screwed into a cylindrical PTFE block (as shown in
Figure 3.1) which is mounted via two threaded stainless steel rods onto a 70mm
diameter stainless steel flange. A PTFE washer with an internal diameter of 10mm
isolates the source from two brass washers of similar dimensions between which the
moderator is held, these again are held in place by the two threaded rods. The
moderator consists of four superimposed 15mm square annealed pieces of 60%
transmission W mesh - the number, determined empirically by Zafar (1990), which
gives the optimum slow positron yield. The annealing procedure involves heating the
pieces of mesh resisitively in a W foil oven in a vacuum of ~5xl O' 2 Torr. Heating is
done in bursts of approximately 5 seconds so as to avoid evaporating any
contaminants present on the electrode assembly. This also ensures that the pressure
does not increase above 10' 1 Torr so there is no possibility of electrical breakdown
occurring. Annealing is deemed to be complete when a temperature of 2000°C can be
reached without a significant pressure increase occurring. The brass washers holding
the moderator are isolated by a PTFE washer from another pair of brass washers
which hold another 60% transmission W mesh. Earthing this mesh and holding the
moderator at a positive potential Vmod relative to it leads to the extraction of slow
positrons with kinetic energy E given by
£=eKmod+A£ (3.1)
where AE is the energy with which a positron leaves the moderator. AE can have any
value between zero and the positron work function d>+ and is dependent on the extent
of inelastic processes the positron undergoes at the surface of the moderator. The
energy spread of the positron beam is thus determined by d>+ which for clean W is
approximately 2.8eV (Jacobsen et al, 1990). To maximize the yield of slow positrons
the source and brass plug are biased to a slightly more positive potential than the
95
Annealed W mesh
modNa P source on Pt disc
Brass PTFE
Fig 3.1 A cut-away diagram of the source/moderator holder showing the brassplug on which the source is held and the W moderator meshes.
moderator - this will cause backscattered positrons to return through the moderator.
The source-moderator assembly is bolted onto a 125mm long stainless steel tube of
internal diameter 37mm which is bolted via a 114mm adaptor flange onto a 300mm
long stainless steel tube of internal diameter 50mm. The small dimensions of the
vacuum system where the source and moderator are housed allows for the adequate
Pb shielding of annihilation y-rays from this region.
Beam guidance is by means of an axial magnetic field. This is produced by a series
of Helmholtz coils of mean diameter 26.5cm which ensure the uniformity of the field
as shown in Figure 3.2, and is 40Gauss at the source-moderator end increasing to 50
Gauss along the beam-line. The field increase after the moderator reduces the
transverse spatial spread of the beam. Another consequence of using a mesh moderator
is that many fast (3+ particles will be transmitted or will be scattered off the mesh
96
wires into the beam. These and their associated annihilation y-rays must be separated
from the slow positrons hence the use of the stainless steel and Pb plugs shown in
Figure 3.2. The diversion of slow positrons of the required energy through the aperture
in the Pb is achieved with parallel electrostatic plates situated 0.7m from the source.
Such plates provide an electric field perpendicular to the axial magnetic field and the
resulting force on a charged particle between them will deflect the particle a distance
proportional to the magnitude of its component of velocity parallel to the magnetic
field. In this way a mono-energetic slow positron beam is obtained. Planar ExB plates
have been widely used for this purpose (e.g. Mills, 1980) but, following Hutchins et
al (1986) who demonstrated the distortion in beam cross-section that occurs on
deflection with planar plates, part-cylindrical plates have been employed in this
experiment. These plates, 0.3m long with radii 58mm and 83mm, are held at
approximately numerically equal positive and negative potentials respectively. This
ensures that the positron beam moves in a region of zero potential and thus acquires
no additional kinetic energy during its traversal of the plates. The ExB plates and
subsequent Pb plug are both placed axially in a 500m long brass tube of internal
diameter 95mm. It was anticipated that the extensive aperturing of the beam discussed
above would impede the flow of gas along the beam line during pumping from
atmospheric pressure so an Edwards E02 oil vapour diffusion pump coupled to an
Edwards ED35 rotary pump was situated approximately halfway along the beam-line.
This was attached to a stainless steel four-way of internal diameter 50mm and length
203mm along the beam axis which was placed between the stainless steel and brass
tubes mentioned above.
The axes of the beam, the atomic hydrogen source and the ion extraction system
intersect 1.35m from the end of the source-moderator assembly. To locate the beam
centrally on this point of intersection and to limit its width an 8 mm aperture is placed
30mm before this, the centre of the scattering region. Initial beam alignment is made
with another, removable, 8 mm aperture situated a similar distance after this point. It
is placed in the beam axis by moving the linear manipulator on which it is mounted
in and out. As this aperture might restrict the maximum angle at which particles can
scatter and still be detected it is removed before commencing an experimental
97
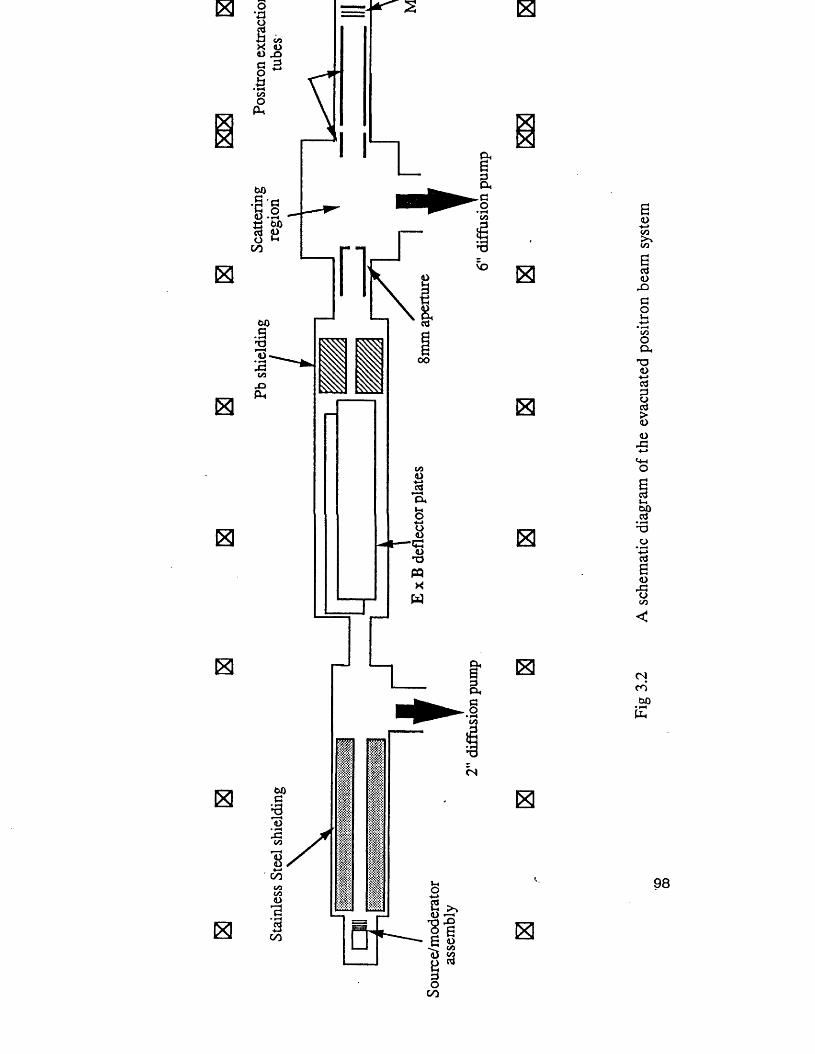
Fig
3.2
A sc
hem
atic
dia
gram
of
the
evac
uate
d po
sitro
n be
am
syst
em
measurement. The chamber in which the interaction takes place is a 152mm cubic Al
block machined to an internal diameter of 127mm. Its dimensions preclude placing the
coils adjacent to it at the required Helmholtz separation. However, the consequent
weakening of the magnetic field is avoided by placing two coils immediately after the
chamber - this ensures that the field is uniform throughout the scattering region with
the resulting retention in the beam of positrons scattered through angles of up to 2n
at certain incident energies. This is demonstrated in a plot of the calculated acceptance
angle as a function of positron energy shown in Figure 3.3. For a given transverse
momentum transfer on collision this is defined as the maximum angle a particle can
scatter at and still move in a path with a helical radius small enough to allow it to
impinge on the detector. Details of the method by which it is calculated are given in
section 5.3.1. The maximum radius for the helical paths of positrons was taken to be
4mm, the distance between the edge of the region of overlap of beam and gas and an
ion extraction plate (see section 3.4). Obviously not all positrons will scatter from this
part of the interaction region so the acceptance angle plotted in Figure 3.3 is an
underestimate for most scattered positrons.
With no gas input through the atomic hydrogen source a pressure of <5x1 O' 6 Torr is
maintained in the scattering region with an Edwards E06 oil vapour diffusion pump,
coupled to an Edwards ED500 rotary pump, attached to the base of the scattering
chamber. This pressure is measured with a Vacuum Generators IGC11 naked Bayard-
Alpert ionization gauge-if this measures a pressure higher than ~10 ' 5 Torr all detector
potential supplies are switched off automatically to protect the detectors. The pressures
in the backing lines of both diffusion pumps are monitored with Pirani pressure
gauges and if either exceeds approximately 0.1 Torr the diffusion pumps are shut off
and magnetic valves on the backing lines close to prevent oil backstreaming into the
system.
Positron detection is by means of two Varian VUW8920ZS microchannel plates which
99
provide a signal through the multiplication of secondary electrons liberated by positron
impact and collected on an earthed Cu screen - these are shown schematically in
Figure 3.4. They are 50mm discs of 0.42mm thickness made of Pb glass and
consisting of an array of 9.8|im diameter cylindrical channels coated internally with
a semiconducting material capable of high secondary electron emission. To ensure that
an incident positron does strike the inner surface of a channel the channels are
inclined at 40° to the normal to the plate surface. The reported gain of one such plate
with a potential difference of lkV across it to accelerate the secondary electrons is
~4xl04. The potentials applied to the plates are shown in Figure 3.4, -2.2kV is applied
to the front so that all positrons, including those which have lost energy, are detected
with the same efficiency. With this configuration ~10mV pulses were obtained, the
gain being maximized by orienting the plates at 180° to each other so that positive
ions created at the rear plate output do not reach the front plate - the so-called chevron
arrangement. The plates are situated 0.45m from the centre of the scattering region in
a ceramic washer of internal diameter 50mm and thickness 3mm. They are held in
place between two stainless steel washers of internal diameter 44mm by three leaf
springs attached to one washer which rest on the outer non-detecting part of the front
plate. This arrangement also provides noise-free electrical contacts to the back and
front of the plates. Contact between the plates is by means of a thin insulating ceramic
washer whose internal edge lies just outside the circumference of the plates’ active
area coated on either side with Cu up to a diameter of 50mm. Separate potentials can
then be applied to the back surface of the front plate and the front surface of the back
plate, in this experiment they are equal. This configuration allows the strip current
through each plate to be monitored individually and swift remedial action to be taken
if either exceeds ~25|iA. Positron detection efficiency is increased by their
acceleration by the two 90% transmission Cu meshes shown in Figure 3.4. This entire
assembly is held by three M3 threaded stainless steel rods on a 152mm diameter A1
flange. The flange is mounted on an A1 tube of internal diameter 95mm which is
connected by an A1 adaptor flange onto a stainless steel T-piece of internal diameter
60mm which is fixed via a brass connecting tube (internal diameter 75mm) to the
scattering chamber.
100
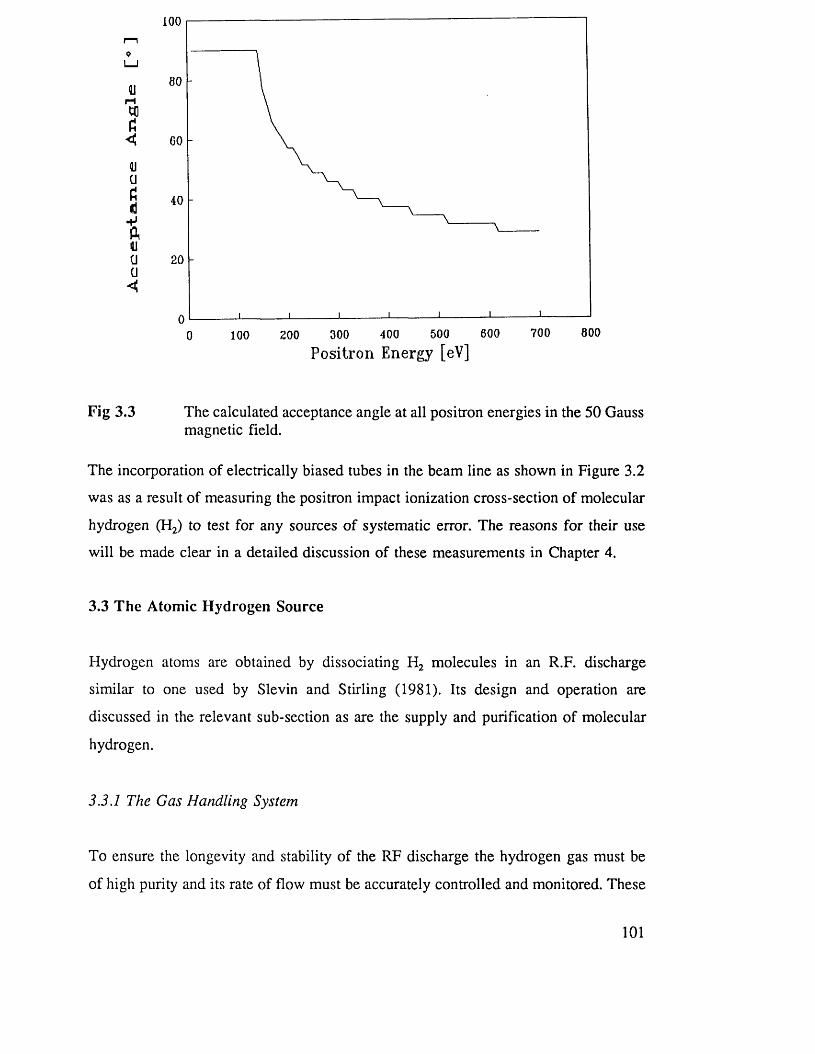
100
I_I
MtoA<•uaC«d
ftuaa<
0007006005004003002001000
Positron Energy [eV]
Fig 3.3 The calculated acceptance angle at all positron energies in the 50 Gauss magnetic field.
The incorporation of electrically biased tubes in the beam line as shown in Figure 3.2
was as a result of measuring the positron impact ionization cross-section of molecular
hydrogen (H2) to test for any sources of systematic error. The reasons for their use
will be made clear in a detailed discussion of these measurements in Chapter 4.
3.3 The Atomic Hydrogen Source
Hydrogen atoms are obtained by dissociating H2 molecules in an R.F. discharge
similar to one used by Slevin and Stirling (1981). Its design and operation are
discussed in the relevant sub-section as are the supply and purification of molecular
hydrogen.
3.3.1 The Gas Handling System
To ensure the longevity and stability of the RF discharge the hydrogen gas must be
of high purity and its rate of flow must be accurately controlled and monitored. These
101
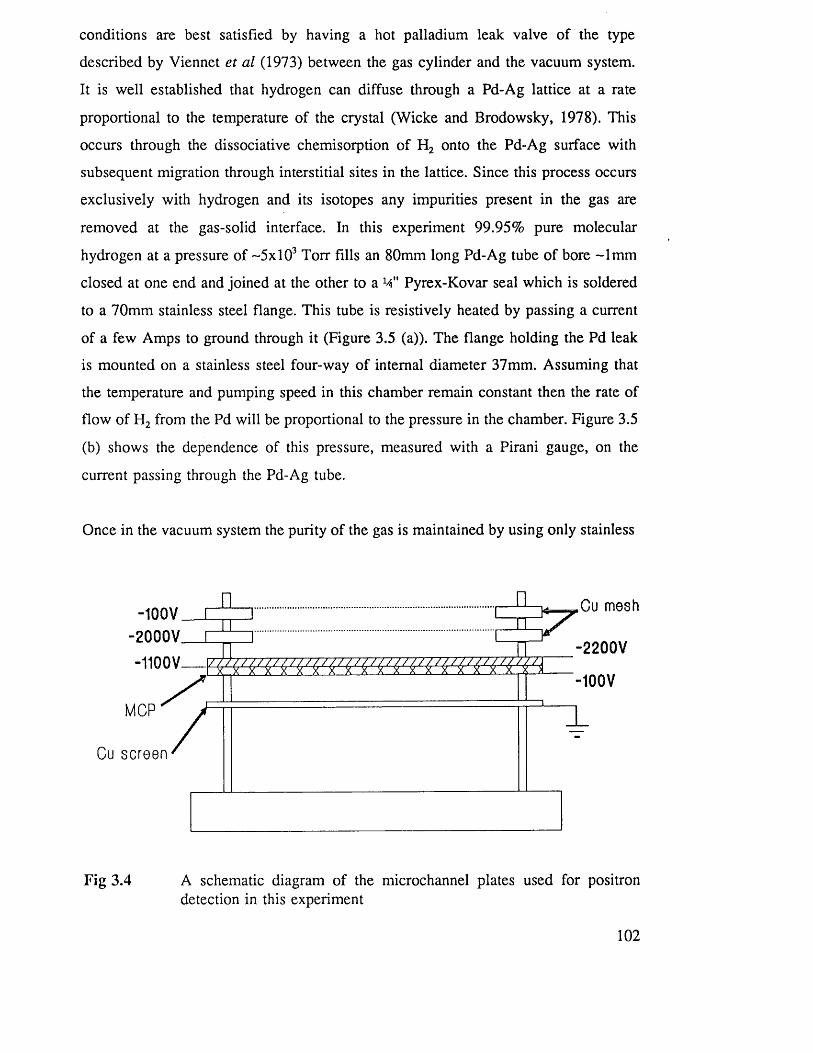
conditions are best satisfied by having a hot palladium leak valve of the type
described by Viennet et al (1973) between the gas cylinder and the vacuum system.
It is well established that hydrogen can diffuse through a Pd-Ag lattice at a rate
proportional to the temperature of the crystal (Wicke and Brodowsky, 1978). This
occurs through the dissociative chemisorption of H2 onto the Pd-Ag surface with
subsequent migration through interstitial sites in the lattice. Since this process occurs
exclusively with hydrogen and its isotopes any impurities present in the gas are
removed at the gas-solid interface. In this experiment 99.95% pure molecular
hydrogen at a pressure of ~5xl0 3 Torr fills an 80mm long Pd-Ag tube of bore -1mm
closed at one end and joined at the other to a W Pyrex-Kovar seal which is soldered
to a 70mm stainless steel flange. This tube is resistively heated by passing a current
of a few Amps to ground through it (Figure 3.5 (a)). The flange holding the Pd leak
is mounted on a stainless steel four-way of internal diameter 37mm. Assuming that
the temperature and pumping speed in this chamber remain constant then the rate of
flow of H2 from the Pd will be proportional to the pressure in the chamber. Figure 3.5
(b) shows the dependence of this pressure, measured with a Pirani gauge, on the
current passing through the Pd-Ag tube.
Once in the vacuum system the purity of the gas is maintained by using only stainless
Cu mesh-100 V -2000V -1100V
-2200V
-100VMCP
Cu screen
Fig 3.4 A schematic diagram of the microchannel plates used for positron detection in this experiment
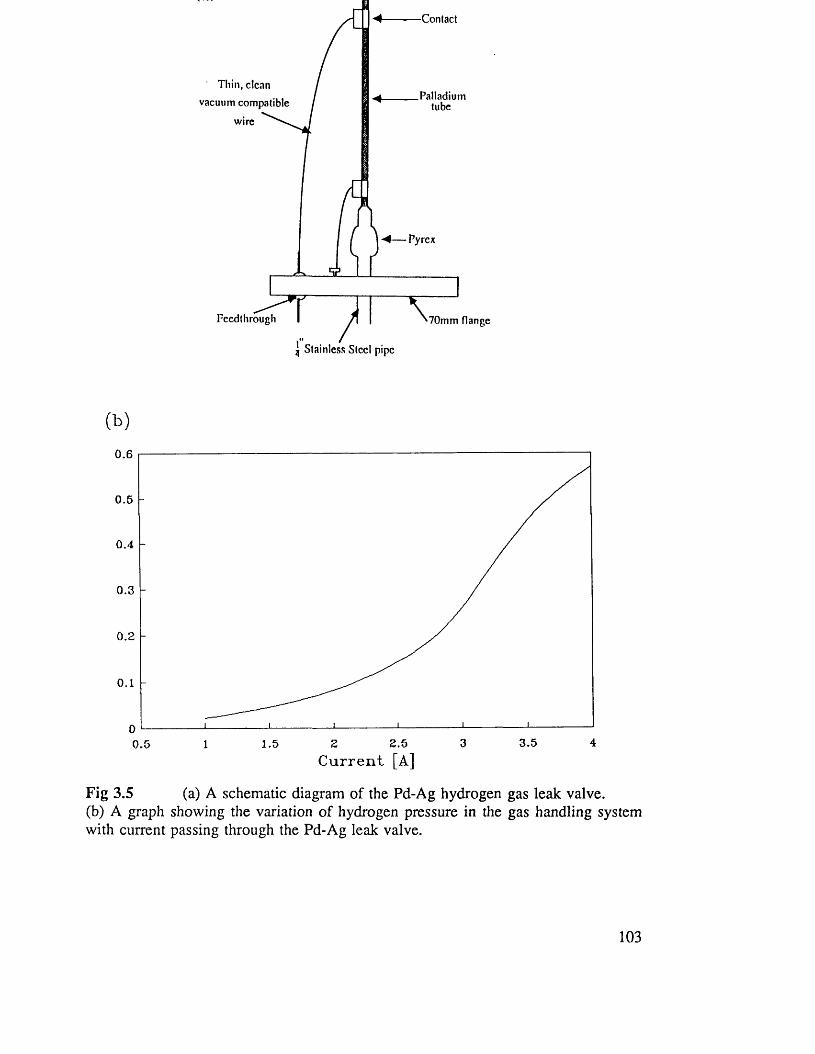
■Contact
Thin, clean
vacuum compatible
wire
Palladiumtube
-4 — Pyrcx
ough IFeedthrough 70mm flange
Stainless Steel pipe
(b)
0.6
0 .5
0 .4
0 .3
0.2
43 .532 .521 .50 .5 1
C u rren t [A]
Fig 3.5 (a) A schematic diagram of the Pd-Ag hydrogen gas leak valve.(b) A graph showing the variation of hydrogen pressure in the gas handling system with current passing through the Pd-Ag leak valve.
steel tubes and fittings whose inner surfaces are thoroughly cleaned with solvent and
dried before installation. When letting the system up to atmospheric pressure the
condensation on all surfaces of water and of hydrocarbons from the vacuum pumps
must be minimized. This is done by filling the system to one atmosphere with dry N2
through a M" tube soldered to another 70mm flange on the four-way and then through
the discharge tube. Thus it is ensured that this part of the vacuum system is always
at an equal or higher pressure than the remainder of the system and therefore no
backstreaming of impurities into this section of the apparatus occurs.
The gas handling system employed here therefore permits the regulation and
monitoring of hydrogen flow at a level of accuracy sufficient for the prolonged
operation of a stable gas discharge. It is also important to take the above precautions
in maintaining the purity of the gas to maximize the degree of molecular dissociation
in the discharge.
3.3.2 The Radio-Frequency Discharge
Hydrogen atoms can be produced on the dissociation of H2 molecules on electron
collision i.e. by the reaction
e-+H2->e-+H+H
In a gas discharge this process can occur often enough for statistically accurate
experiments to be performed with the extracted atoms in a reasonably short time. For
this reason gas discharges powered by either continuous (e.g. Wood, 1920 and Schwab
et al, 1987) or alternating (e.g Ding et al, 1977 and Spicher et ah 1990) electric fields
have been employed in many experimental studies of atomic species. When, as in this
experiment, the atomic hydrogen source is to be interfaced with a conventional
magnetic transport positron beam system it has to fulfill certain requirements in its
stability and produced atom concentration because of the moderate intensity of the e+
beam. This, and design considerations, prompted the use here of a radio-frequency
hydrogen discharge tube of the type described by Slevin and Stirling (1981). There
104
follows a brief description of the relevant atomic interactions that occur in a gas
plasma in an alternating field and a more detailed discussion on the discharge tube
employed in this experiment.
An electron in a vacuum will, on average, gain no energy from a high frequency
alternating field. Also the maximum kinetic energy an electron will have during on
oscillation of the field will be, typically, of the order of meV; which is obviously
insufficient for any inelastic atomic processes to occur if a gas is present. The
presence of a gas will however perturb the motion of an electron through collisions
with molecules. Such damping of its oscillatory motion allows an electron to absorb
a mean power from the field eventually enabling it to make inelastic collisions with
gas molecules. Initially the most important process will be ionization since this
produces ion pairs and electron multiplication takes place. When this is occurring at
a rate far in excess of the rate of removal of electrons through ionic recombination,
attachment or diffusion the conductivity of the gas will increase sharply and a net
current will flow through it-the gas is said to have broken down. For molecular
hydrogen the threshold energy for ionization is 15.6 eV. After breakdown there is a
sufficient number density of electrons in the gas for other collisional inelastic
processes to take place at a significant rate, these include molecular dissociation. In
hydrogen there are two mechanisms by which this can occur, one is excitation to the
repulsive 3 E* triplet state which will result in immediate dissociation into two neutral
H atoms-this requires an incident electron energy of 8 . 8 eV. The main process is
excitation to the stable 3E* triplet state requiring electrons to have 11.8 eV energy, this
then radiatively decays to 32 which again immediately dissociates. A continuum of
radiation from this transition has been observed in hydrogen discharges.
The discharge tube used in this experiment is shown in Figure 3.6 and is 225mm long
with a 20mm inside diameter. At either end there are 20mm long capillaries of 3mm
bore to confine the discharge. There is a "kink" in the exit capillary which ensures that
there is no direct path for atoms, particles or light out of the discharge tube. This kink
is inside the water-cooled jacket to reduce the likelihood of H atoms impinging on its
walls recombining. The tube is made of Pyrex and is cooled by the flow of water
105
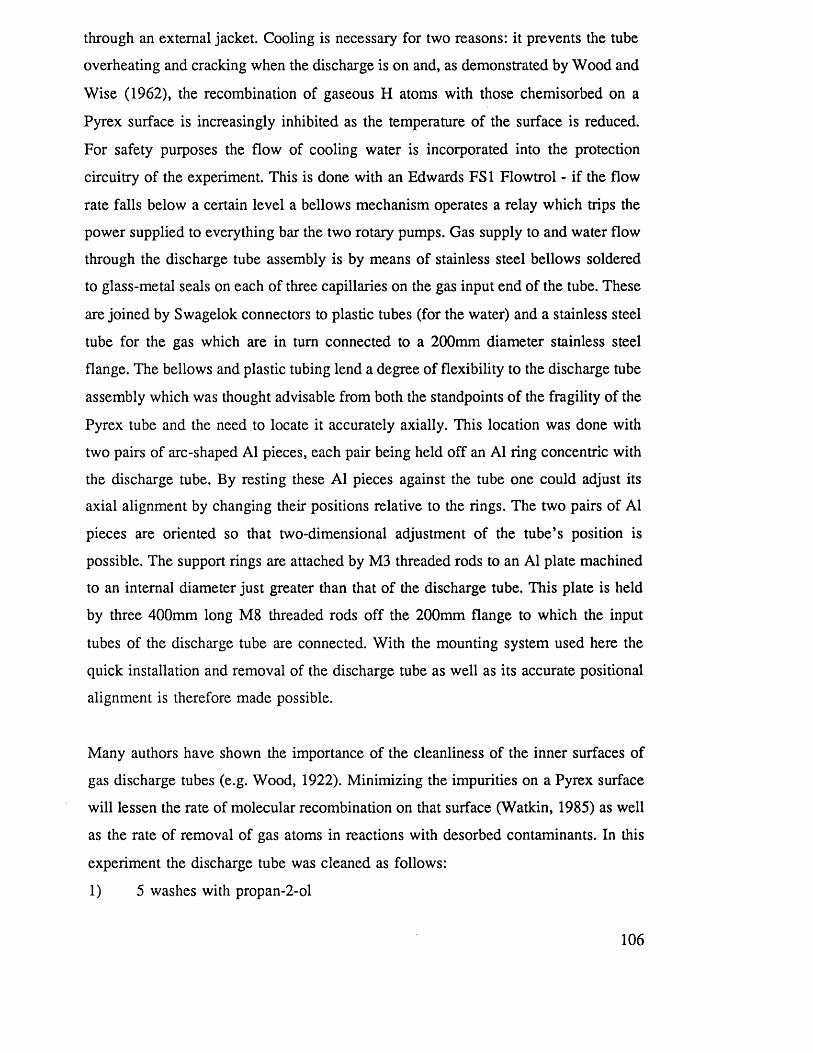
through an external jacket. Cooling is necessary for two reasons: it prevents the tube
overheating and cracking when the discharge is on and, as demonstrated by Wood and
Wise (1962), the recombination of gaseous H atoms with those chemisorbed on a
Pyrex surface is increasingly inhibited as the temperature of the surface is reduced.
For safety purposes the flow of cooling water is incorporated into the protection
circuitry of the experiment. This is done with an Edwards FS1 Flowtrol - if the flow
rate falls below a certain level a bellows mechanism operates a relay which trips the
power supplied to everything bar the two rotary pumps. Gas supply to and water flow
through the discharge tube assembly is by means of stainless steel bellows soldered
to glass-metal seals on each of three capillaries on the gas input end of the tube. These
are joined by Swagelok connectors to plastic tubes (for the water) and a stainless steel
tube for the gas which are in turn connected to a 2 0 0 mm diameter stainless steel
flange. The bellows and plastic tubing lend a degree of flexibility to the discharge tube
assembly which was thought advisable from both the standpoints of the fragility of the
Pyrex tube and the need to locate it accurately axially. This location was done with
two pairs of arc-shaped Al pieces, each pair being held off an Al ring concentric with
the discharge tube. By resting these Al pieces against the tube one could adjust its
axial alignment by changing their positions relative to the rings. The two pairs of Al
pieces are oriented so that two-dimensional adjustment of the tube’s position is
possible. The support rings are attached by M3 threaded rods to an Al plate machined
to an internal diameter just greater than that of the discharge tube. This plate is held
by three 400mm long M 8 threaded rods off the 200mm flange to which the input
tubes of the discharge tube are connected. With the mounting system used here the
quick installation and removal of the discharge tube as well as its accurate positional
alignment is therefore made possible.
Many authors have shown the importance of the cleanliness of the inner surfaces of
gas discharge tubes (e.g. Wood, 1922). Minimizing the impurities on a Pyrex surface
will lessen the rate of molecular recombination on that surface (Watkin, 1985) as well
as the rate of removal of gas atoms in reactions with desorbed contaminants. In this
experiment the discharge tube was cleaned as follows:
1) 5 washes with propan-2-ol
106
H ATOM BEAM
V
R .F . CAVITY
H D I S C H A R G E
Fig 3.6 A schematic diagram of the radio-frequency discharge tube used in thisexperiment.
107
2 ) 1 0 washes with distilled water
3) 1 wash with 10% solution hydrofluoric acid (HF)-ensuring that it does not
come into contact with the metal bellows
4) 10 washes with distilled water
5) 1 wash overnight with 20% solution ortho-phosphoric acid (H3P 0 4) following
the procedure of Donnelly (1991)
6 ) 1 0 washes with distilled water
The discharge tube was filled with solvent by mounting the tube vertically with the
end of the exit nozzle in a trough containing the solvent and then drawing the solvent
into the discharge tube with a Venturi pump attached to the gas input. After cleaning
it was transferred as quickly as possible into the vacuum system, the precautions taken
to maintain its cleanliness subsequently have been described in the previous section.
The entire assembly is held off one 200mm flange which is mounted on a stainless
steel six-way cross of internal diameter 150mm, connected to this is a 165mm long
stainless steel tube of the same internal diameter which is mounted on the scattering
chamber via an adaptor flange. The end of the discharge tube is then ~5mm from the
centre of the scattering region. Because of its proximity to the positron beam this end
of the discharge tube has been coated with graphite and earthed to prevent possible
charge-up by incident positrons.
The radio-frequency alternating electric field that is required to sustain the discharge
is produced by an R.F. generator that is coupled to a cylindrical helical resonator of
the type discussed by MacAlpine and Schildknecht (1959). The discharge tube passes
axially through the resonator cavity (see Figure 3.7). The generator effectively consists
of a heterodyne oscillator and a power amplifier. It produces a 35MHz output of up
to 30W amplitude, variability of ±0.1 MHz is provided for fine adjustment of the
frequency. Its power output can be monitored directly with a meter as can the Voltage
Standing Wave Ratio (VSWR) on the coaxial cable to the resonator. This is given by
108
V +F VSWR— — &
V - Vfor r«f
(3.2)
where Vfor is the amplitude of the generator output and Vref is the amplitude of the
reflected wave. Reflection occurs as a result of an impedance mismatch with the
resonator and Vref will be dependent on the magnitude of this mismatch. The VSWR
is therefore an indication of the power that is absorbed by the resonator and the gas
plasma in the discharge tube which is a constituent part of it. Clearly the power input
to the gas discharge must be maximized, this is achieved with a VSWR close to unity
which is only attainable when reflection is minimized. Low reflection occurs when the
resonator is tuned accurately to the output frequency of the oscillator. This resonator
resembles an ordinary tuned circuit in that its operation can be described in terms of
its distributed inductance, capacitance and resistance. As shown in Figure 3.7 it
consists of a helical conductor (13 turns of 37mm diameter) inside a cylindrical OFHC
Cu shield that is closed at both ends. The shield is 80mm in diameter and 100mm
long, in each face there is a hole of a diameter just sufficient for the discharge tube
to go through. It is held centrally in an Al cup of internal diameter 80mm by a PTFE
locating ring, the cup being held on threaded rods screwed to the adaptor flange on
the scattering chamber. McAlpine and Shildknecht demonstrated that the ratio of
energy storage to energy dissipation, the Q-factor of the circuit, can be very high for
such a compact system. The input power is coupled to the helical conductor by means
of a tap coupling from a one-turn coil connected to a BNC connector mounted on the
Cu shield. Rough frequency tuning can be done by adjusting the length of the helical
conductor to minimize the reflected power input from a signal generator tuned to
35±0.1 MHz- more accurate tuning is done with the discharge tube in place by means
of the trimming capacitor shown in Figure 3.7. A VSWR of -1 .7 was achieved
following this impedance matching process indicating that about 75% of the input
power was being absorbed; this enabled the continuous running of the discharge with
a generator power as low as 12W (for a gas pressure of 0.6 Torr in the gas handling
system). Typical operational values for the power and pressure were 15W and 0.5 Torr
respectively. Power transmission was by means of a 50f2 coaxial cable, the vacuum
109
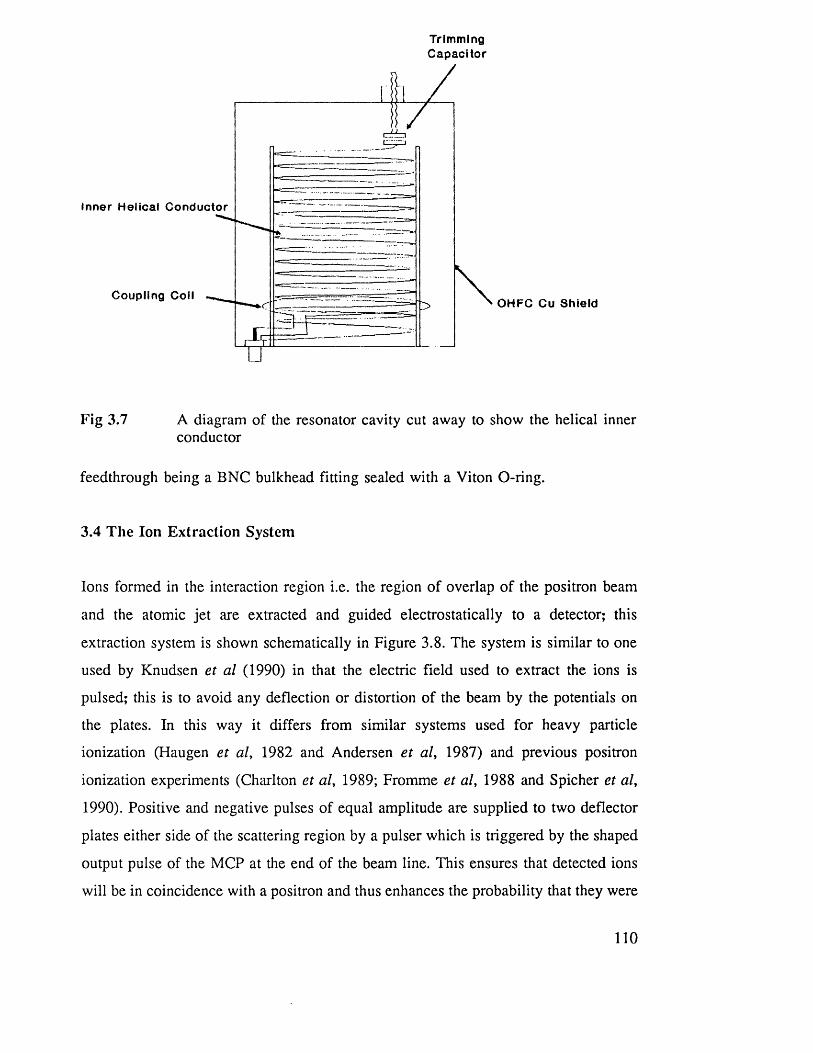
TrimmingCapacitor
Inner Helical Conductor
Coupling CoilOHFC Cu Shield
Fig 3.7 A diagram of the resonator cavity cut away to show the helical innerconductor
feedthrough being a BNC bulkhead fitting sealed with a Viton O-ring.
3.4 The Ion Extraction System
Ions formed in the interaction region i.e. the region of overlap of the positron beam
and the atomic jet are extracted and guided electrostatically to a detector; this
extraction system is shown schematically in Figure 3.8. The system is similar to one
used by Knudsen et al (1990) in that the electric field used to extract the ions is
pulsed; this is to avoid any deflection or distortion of the beam by the potentials on
the plates. In this way it differs from similar systems used for heavy particle
ionization (Haugen et al, 1982 and Andersen et al, 1987) and previous positron
ionization experiments (Charlton et al, 1989; Fromme et al, 1988 and Spicher et al,
1990). Positive and negative pulses of equal amplitude are supplied to two deflector
plates either side of the scattering region by a pulser which is triggered by the shaped
output pulse of the MCP at the end of the beam line. This ensures that detected ions
will be in coincidence with a positron and thus enhances the probability that they were
110
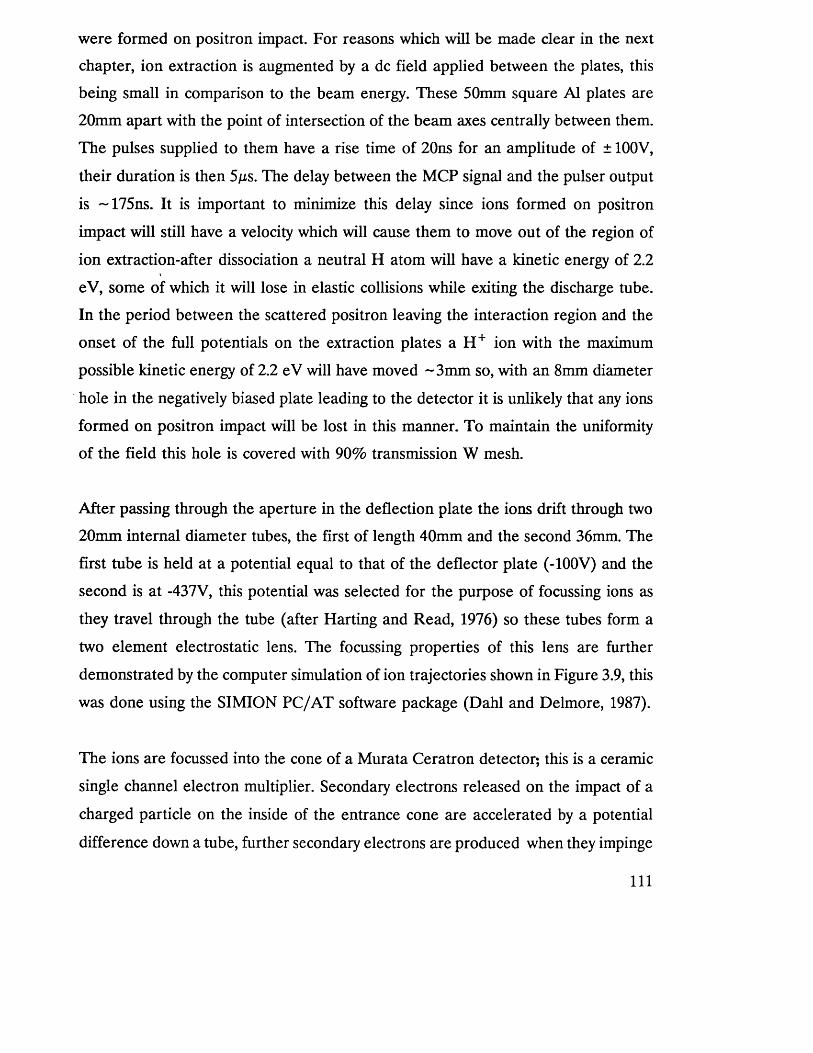
were formed on positron impact. For reasons which will be made clear in the next
chapter, ion extraction is augmented by a dc field applied between the plates, this
being small in comparison to the beam energy. These 50mm square Al plates are
2 0 mm apart with the point of intersection of the beam axes centrally between them.
The pulses supplied to them have a rise time of 20ns for an amplitude of ± 100V,
their duration is then 5/xs. The delay between the MCP signal and the pulser output
is ~ 175ns. It is important to minimize this delay since ions formed on positron
impact will still have a velocity which will cause them to move out of the region of
ion extraction-after dissociation a neutral H atom will have a kinetic energy of 2.2
eV, some of which it will lose in elastic collisions while exiting the discharge tube.
In the period between the scattered positron leaving the interaction region and the
onset of the full potentials on the extraction plates a H + ion with the maximum
possible kinetic energy of 2 . 2 eV will have moved ~3m m so, with an 8 mm diameter
hole in the negatively biased plate leading to the detector it is unlikely that any ions
formed on positron impact will be lost in this manner. To maintain the uniformity
of the field this hole is covered with 90% transmission W mesh.
After passing through the aperture in the deflection plate the ions drift through two
20mm internal diameter tubes, the first of length 40mm and the second 36mm. The
first tube is held at a potential equal to that of the deflector plate (-1 0 0 V) and the
second is at -437V, this potential was selected for the purpose of focussing ions as
they travel through the tube (after Harting and Read, 1976) so these tubes form a
two element electrostatic lens. The focussing properties of this lens are further
demonstrated by the computer simulation of ion trajectories shown in Figure 3.9, this
was done using the SIMION PC/AT software package (Dahl and Delmore, 1987).
The ions are focussed into the cone of a Murata Ceratron detector; this is a ceramic
single channel electron multiplier. Secondary electrons released on the impact of a
charged particle on the inside of the entrance cone are accelerated by a potential
difference down a tube, further secondary electrons are produced when they impinge
111
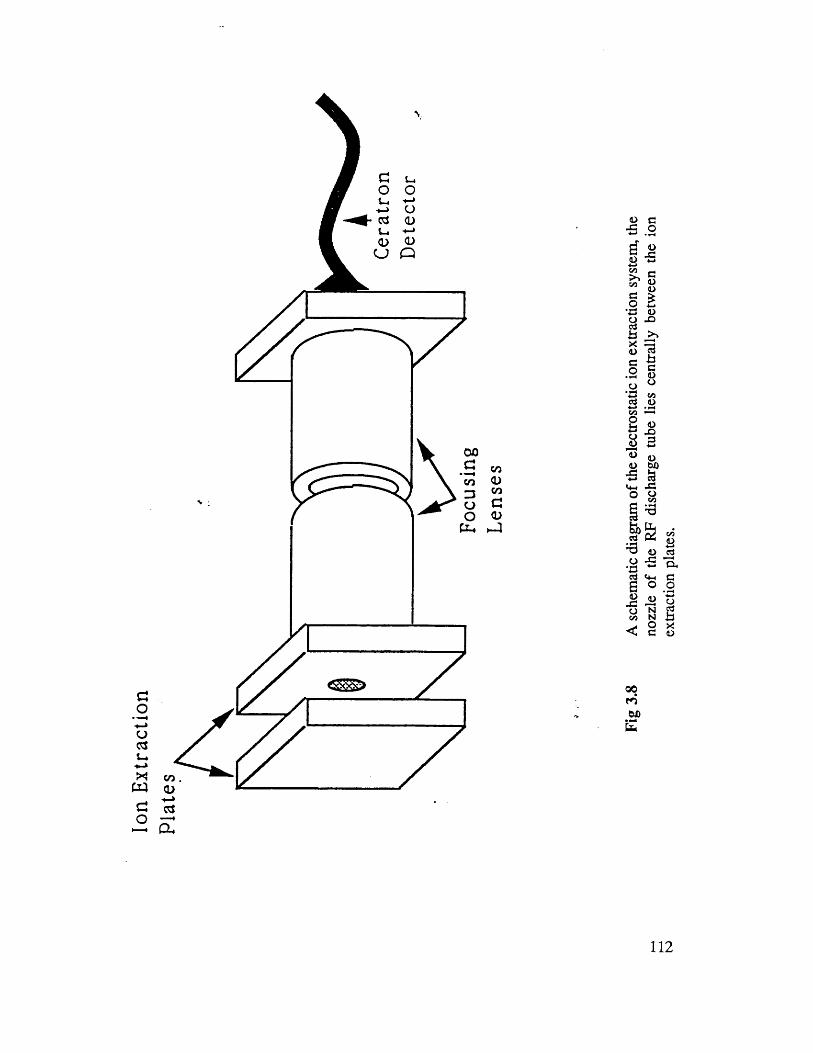
uo3
xWCJo
00oo <U ooc<L>
P-. ■—I
0 G XS OW . h
fM-ww00
£ S1 O C > O 5
\G O
33£ 13 c b o c• 3 O O ° ‘w oo rt O
O§ X)O 3
. 9 3 *3 0O bX)■5 S3V4-1 x s
2 a § ^& & -
' S o r t o x : 7 7 • £h <-» ex,rt tM C3S ° 9
■ 8 ~ 3O N g co n a^ 9 *<- c o
00
ME
03s
112
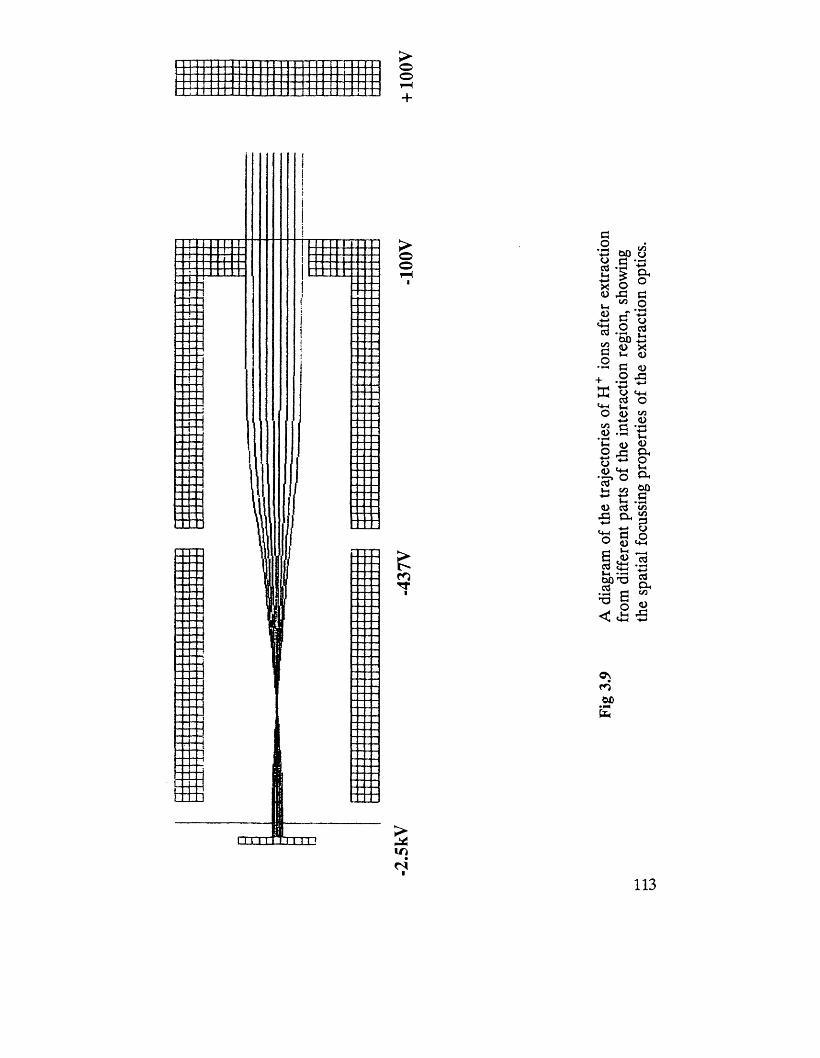
>oo
Go+-»oV i
X4>Vi4)<+iGinGO
+ffi
O.G
rr
6ctfV i0 0G
C\roOX)• p*fc<
S£uic4
113
from
diffe
rent
pa
rts
of the
in
tera
ctio
n re
gion
, sh
owin
g the
sp
atia
l fo
cuss
ing
prop
ertie
s of
the
extr
actio
n op
tics.
on the inner surface of the tube producing a cascade effect. All electrons are then
collected on a metal plate at the end of the tube. The potentials that are applied to
the Ceratron in this experiment are: -2.5kV to the cone, +500V to the back end of
the tube and +800V to the collecting plate. This configuration produces a gain
approxiamtely double that of an ordinary channeltron ( ~ 6 x l 0 9) and yields pulses of
~30m V. Such a detector was selected because its high gain allowed the setting of
discriminator levels so that pulses that were being picked up on the detector when
voltage pulses were applied to the deflection plate could be discriminated against.
The entire assembly was mounted by M3 threaded rods off a 90mm diameter brass
flange and contained in a 150mm brass tube of internal diameter 75mm which was
mounted on the Al scattering chamber.
3.5 Timing Electronics
A block diagram of the electronic units that record the time-of-flight spectra of ions
and initiate the application of the ion extraction voltage pulse is given in Figure 3.10.
Positron detection pulses from the MCP detector are decoupled from the dc
potential on the MCP collector by a 470pF capacitor and amplified lOx with an Ortec
474 Timing Filter Amplifier. The amplified pulses are then fed into an Ortec 473
Constant Fraction Discriminator. Pick-up from the RF generator is reduced to such
a level that it can be discriminated against with a notch filter-this consists of a length
of screened 50n cable which is left open-ended to absorb RF standing waves, to do
this efficiently its length must be exactly a quarter of the wavelength of the pick-up
that is to be absorbed. The negative TTL pulses from the discriminator are then used
to monitor the beam with a ratemeter or scalar counter and are input into an Ortec
437A Time-to-Amplitude Converter as the start signal. The output pulse of the
discriminator is also
114
T i m i n gM CP
F r a c t i o nF i l t e r( p o s i t r o n s ) D l s c r l m I n a t o rA m p l i f i e r
T i m ePulse C o l n o l d e n o e
PuiserA m p l i t u d eWidener Veto
C o n v e r t e r
T i m i n g C o n s t a n tCeratron
F r a c t i o nF i l t e r( I o n s )
D / a o r l m l n a t o rA m p l i f i e rc h a n n e l
A n a l y s e r
Fig 3.9 A block diagram of the timing electronics.
115
—VDC(190V m ax)
5. IK1/IF
lOOQIRF610
3.3nF
-V ,
10 OK 200V1.3K 100K
+Vnc(190V m ax)
5 . IK1/IF
560O
2 4 0
10K 200VIC HEX INVERTER S N 7406
100K
Fig 3.10 The electronic circuit of the pulser unit that applied ±100V pulses to the ion extraction plates on the input of a shaped output pulse from the positron detector. 116
widened in a pulse widener and is used to trigger the pulser circuit shown in Figure
3.11, this circuit feeds pulses of ±Vex to the two plates either side of the interaction
region. As discussed above Vex=100V in this experiment. The trigger pulses for the
circuit need to be positive and of height 2.5 V with a duration greater than IOjis. These
conditions are met by widening and inverting the discriminator output.
Pulses from the discriminator are also used in a coincidence veto circuit, this consists
of an Ortec T105N discriminator which widens the output of the previous
discriminator which is delayed and fed into the veto input of an Ortec C104A/N
coincidence unit. Also input into this unit are the output pulses of the Ceratron
detector which have again been amplified (by 2 0 x) and discriminated by similar units
to those described above. The veto pulses are delayed so that they coincide with
pulses the Ceratron has "picked-up" on the application of the extraction voltage to the
plates thus not allowing their being input into the time-to-amplitude converter as a
stop signal and halting the timing sequence at a time zero before ions can be counted.
The discriminator level for the amplified Ceratron pulses is set so that most pick-up
from the pulser and all RF pick-up does not contribute to the timing, anomalously
large pulser pick-up is vetoed by the circuit described above.
The output signal of the time-to-amplitude converter is then collected by an Ortec
580-1 General Interface/ Controller for an MCA programme for the BBC
Microcomputer.
117
CHAPTER 4
POSITRON AND ELECTRON IMPACT
IONIZATION OF ATOMIC AND
MOLECULAR HYDROGEN
4.1 Preliminary Remarks
The experiments which have been performed on the system described in Chapter 3
to measure ionization cross-sections will be discussed now. Modifications which have
been made to the apparatus discussed above will be considered in the context of
those experimental results which prompted them.
Initial experimentation was done with the radio-frequency discharge tube not in
operation, the target was thus entirely molecular. This was for the purpose of
checking measured cross-sections against previously published values thus allowing
sources of error inherent in the experiment to be identified and eliminated.
4.2 Results for Molecular Hydrogen
4.2.1 Positron Impact Ionization
Experimental runs using the apparatus described in Chapter 3 involved the collection
of data in the form of 512 or 1024 channel time of flight spectra. These spectra were
histograms of pulses of different heights - their heights being dependent on the time
interval between the output pulses of the positron and ion detectors.
Time-of-flight spectrum for positron impact ionization of H 2 were similar to that
shown for ionization of H and H 2 in Figure 4.8 with a peak around channel number
118
287 due to the coincidental detection of a positron and a H 2 ion. The peak at
channel 209 was however absent as this corresponds to the charge-to-mass ratio of
H +. Its absence in the H 2 should be noted as it is indicative of the paucity of
dissociative ionization. This is significant when the ionization cross-section of atomic
hydrogen is being measured by observing the ionic fragments of an incompletely
dissociated target as dissociative ionization of H 2 would be a source of spurious H +
ions. Due to the width of the H 2 peak a "region-of-interest" of 40 channels centered
on channel 287 was chosen to integrate over to obtain the total number of H 2 ions,
NH*. To allow comparison between different experimental runs the total number of
ions detected in each run was normalized to positron beam intensity and target gas
pressure, p. Due to the possibility of fluctuations in the beam intensity over a period
of time the total number of positrons that were detected by the end detector,Ne+
was used in the normalization. The resulting yield of H 2 ions is then defined
Nh+Ion Yield — (4*1)
pNe*
To assess systematic effects this quantity has been measured as a function of various
parameters, these measurements are discussed below.
Initially measurements of the ion yield, as defined in equation (4.1), were made at
different pressures of H 2 gas to investigate the dependence, if any, of the yield on
target pressure. Such a dependence could be indicative of a changing gas distribution
or of multiple collisions since normalizing the total ion count to target pressure in
(4.1) removes the simple proportionality of yield to target number density. The
dependence of ion yield on target pressure was investigated at different incident
positron beam energies. Marked differences in the variation of yield with pressure
at different beam energies would require taking several measurements at the same
energy and different pressures and then extrapolating these results to zero pressure
119
for each energy before drawing valid conclusions about the energy dependence of the
ion yield.
Ion yields measured at different pressures and energies are shown in Figures 4.1 (a)
and (b). The error bars shown are the square-root standard deviation of a random
sample, errors quoted on ion yields throughout this work have been calculated in this
manner. It is clear from the graphs that a straight line with a small slope can be
drawn through the sets of data points at each energy. The slopes of these lines are
similar (typically -0 .4 5 arbitrary units/torr) so it can be assumed that although the
ion yield has a pressure dependence it is not variable with energy. At a fixed pressure
the ion yield is therefore proportional to the ionization cross-section if the efficiency
of detection of ions is also independent of energy.
The pressure was therefore kept constant by maintaining a reading of 1.5 Torr on an
MKS Baratron Capacitance Manometer attached to the gas handling system and the
ion yield was measured at various incident positron beam energies. The beam
intensity was approximately 5xl02 e +s_1 and run times were between 1 and 3 hours
so as to obtain a statistical accuracy of —7%. The results of these measurements are
shown in Figure 4.2 having been normalized at lOOeV to the ionization cross-sections
measured by Knudsen et al (1990). The smoothed results of Knudsen et al are shown
for comparison. It can be seen that the present results were significantly lower than
the published data for positron energies below 80eV. This was thought to be due to
a change in the efficiency of detection of ions with energy possibly resulting from the
drift of ions out of the field-of-view of the detector.
The potential pulse that extracts ions is triggered by the detection of a positron at
the end detector as discussed earlier (see section 3.3), and is delayed in the
electronics used to shape the trigger pulse by - 100ns. A further delay before the
onset of this extraction pulse arises from the flight time of the positron from the
scattering region to the detector - clearly this is dependent on the kinetic energy of
120
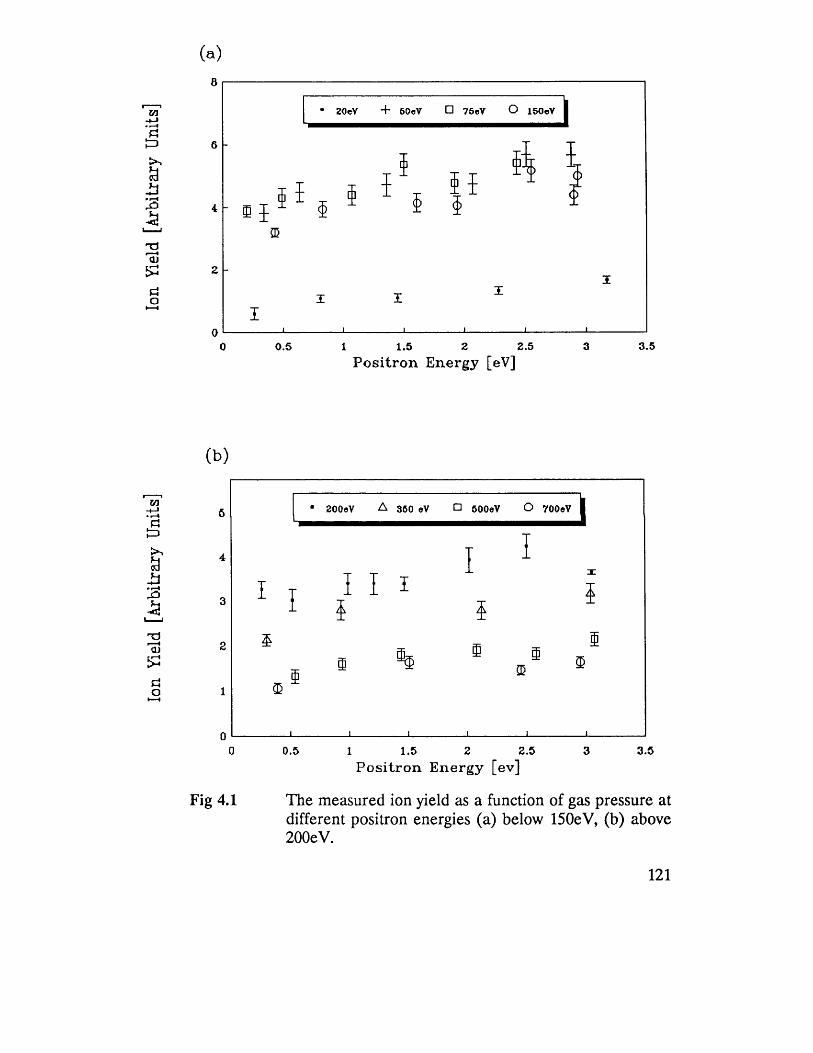
Ion
Yield
[A
rbitr
ary
Uni
ts]
Ion
Yield
[A
rbitr
ary
Uni
ts]
(a)
■ 20 eV + 50«V □ 75oV O 150cV
i $
0.5 1 1.5 2 2.5Positron Energy [eV]
3.5
(b )
200eV A 360 eV □ BOOeV O 700«V
i
Fig 4.1
1 1.5 2 2.5P o s itr o n E n e r g y [ev ]
3.5
The measured ion yield as a function of gas pressure at different positron energies (a) below 150eV, (b) above 200eV.
121
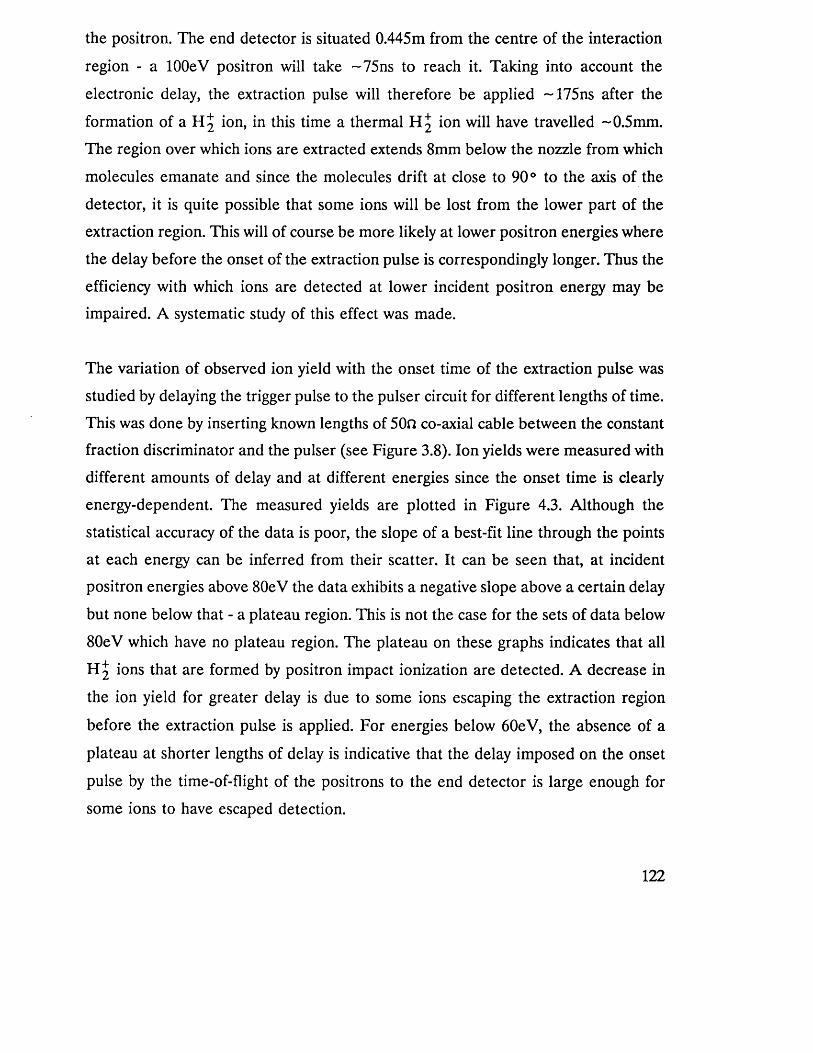
the positron. The end detector is situated 0.445m from the centre of the interaction
region - a lOOeV positron will take ~75ns to reach it. Taking into account the
electronic delay, the extraction pulse will therefore be applied - 175ns after the
formation of a H 2 ion, in this time a thermal H 2 ion will have travelled ~0.5mm.
The region over which ions are extracted extends 8mm below the nozzle from which
molecules emanate and since the molecules drift at close to 90° to the axis of the
detector, it is quite possible that some ions will be lost from the lower part of the
extraction region. This will of course be more likely at lower positron energies where
the delay before the onset of the extraction pulse is correspondingly longer. Thus the
efficiency with which ions are detected at lower incident positron energy may be
impaired. A systematic study of this effect was made.
The variation of observed ion yield with the onset time of the extraction pulse was
studied by delaying the trigger pulse to the pulser circuit for different lengths of time.
This was done by inserting known lengths of 50fl co-axial cable between the constant
fraction discriminator and the pulser (see Figure 3.8). Ion yields were measured with
different amounts of delay and at different energies since the onset time is clearly
energy-dependent. The measured yields are plotted in Figure 4.3. Although the
statistical accuracy of the data is poor, the slope of a best-fit line through the points
at each energy can be inferred from their scatter. It can be seen that, at incident
positron energies above 80eV the data exhibits a negative slope above a certain delay
but none below that - a plateau region. This is not the case for the sets of data below
80eV which have no plateau region. The plateau on these graphs indicates that all
H j ions that are formed by positron impact ionization are detected. A decrease in
the ion yield for greater delay is due to some ions escaping the extraction region
before the extraction pulse is applied. For energies below 60eV, the absence of a
plateau at shorter lengths of delay is indicative that the delay imposed on the onset
pulse by the time-of-flight of the positrons to the end detector is large enough for
some ions to have escaped detection.
122
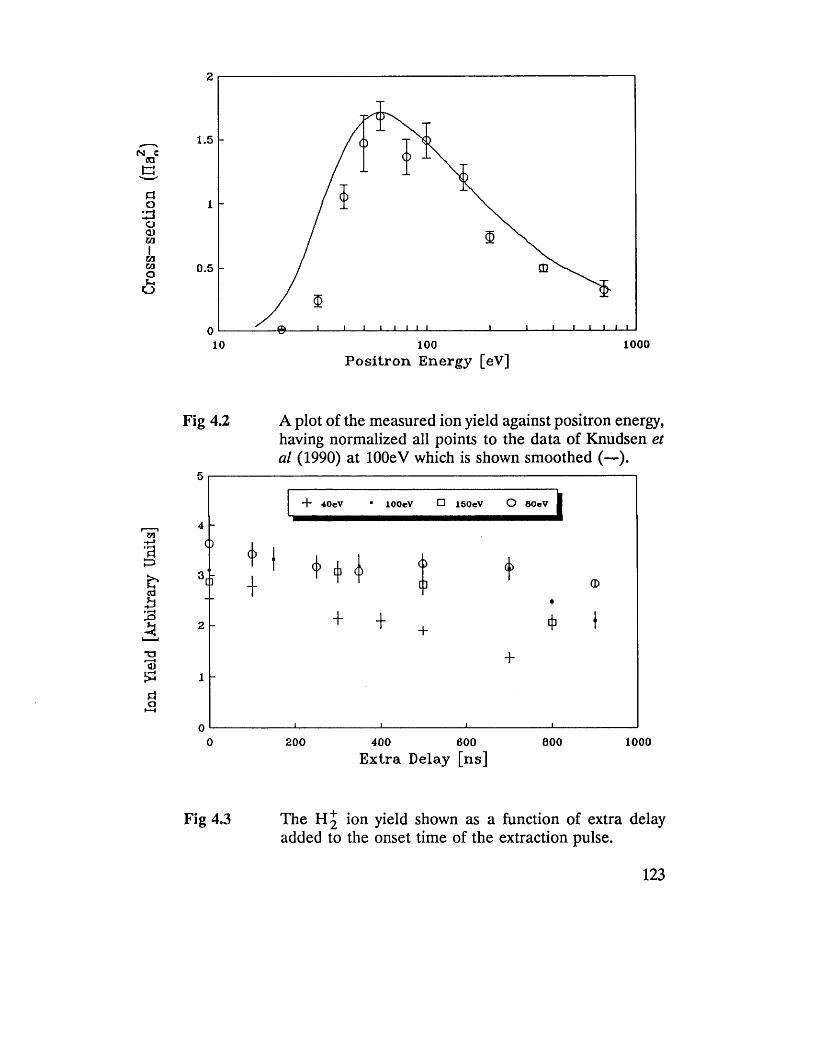
Ion
Yield
[A
rbitr
ary
Uni
ts]
Cro
ss-s
ecti
on
(fla
*)
2
1.5
1
0.5
0100010010
Positron Energy [eV]
Fig 4.2 A plot of the measured ion yield against positron energy, having normalized all points to the data of Knudsen et al (1990) at lOOeV which is shown smoothed (—).
+ 40eV ■ lOOeV □ 150eV O 60eV
I <{.
£ I
4 0 0 6 0 0Extra Delay [ns]
1000
Fig 4.3 The ion yield shown as a function of extra delay added to the onset time of the extraction pulse.
123
To obtain meaningful results at low incident positron energy it had to be ensured
that the flight time of all positrons, regardless of their energy, was such that the
number of ions that drifted out of the extraction region was negligible. This was done
by electrostatically accelerating positrons between the interaction region and the end
detector: two brass tubes of internal diameter 40mm were inserted in the beam tube
as shown in Figure 3.2. Both were isolated from the chamber but the one
immediately after the interaction region (of length 80mm) was earthed to the system,
the second (of length 300mm) was connected to a BNC vacuum feedthrough on the
end flange. The negative potential applied to the second extraction tube served to
accelerate positrons to the end detector thus reducing their flight times and
consequently the delay before the application of the ion extraction pulse. The ion
yield was measured at different values of this potential so as to determine a single
value which was sufficient for all ions to be detected. This was done for a range of
energies and the results are shown in Figure 4.4. At a positron energy of lOOeV it
can be seen that the yield does not vary greatly with increasing positron extraction
potential, this is as expected since all ions were being detected without any reduction
of the onset time of the ion extraction pulse. At lower energies though the ion yield
is seen to increase to a constant value with increasing potential - the lower the
positron energy the greater the potential needed to attain a constant value of the ion
yield. When the ion yield becomes constant all ions formed by positron impact
ionization are being detected - the number of ions lost before extraction increases
with decreasing positron extraction potential as the delay in their extraction increases.
To ensure the detection of all ions at all positron energies a positron extraction
potential of -100V was selected since no further increase in ion yield was obtained
in increasing extraction potentials beyond this at any positron energy. Ion yields were
then measured with this positron extraction potential and normalized at 500eV to the
results of Knudsen et al (1990); these are plotted in Figure 4.5.
124
4.2.2 Electron Impact Ionization
To confidently measure the positron impact ionization cross-section of atomic
hydrogen with this apparatus it was important to be able to compare other measured
ionization cross-sections with published values. Other cross-sections that could be
measured included the electron impact ionization cross-sections of both atomic and
molecular hydrogen. If previously measured values which are generally accepted as
accurate could be reproduced with this system then one could give greater credence
to the positron cross-sections that are also determined.
An electron beam was derived by reversing the polarities on the source and
moderator. This served to extract those secondary electrons that were produced in
the impact of (3 + particles on the moderator. They would be of low energy and could
be accelerated to the required energy as with positrons. However, a problem with
using an electron beam was that one could no longer be certain that all particles
detected with the MCP beam detector were actually projectile particles. Secondary
electrons could be emitted in all collisions of beam electrons with the internal
surfaces of the apparatus (e.g. meshes, apertures etc.). Modifications had to be made
to the system to overcome this - the grids in front of the MCP assembly were
removed and the apertures on which they were mounted were used to retard and
accelerate the projectile particles as before. The beam locating aperture before the
interaction region was replaced with three successive apertures, the second two being
of a slightly larger diameter than the first. The central one was held at a negative
potential small compared to the beam energy to repel any secondary electrons
coming from the narrower aperture and passing through the gas target and possibly
causing ionization. The possible effects of the major sources of secondary electrons
in the system were thus reduced. The beam intensity attainable with electrons was
much greater than with positrons because of the low efficiency of positron
moderation. Intensities of over 105 were possible with electrons; clearly it would have
been desirable to use as high an intensity as possible if another problem had not
125
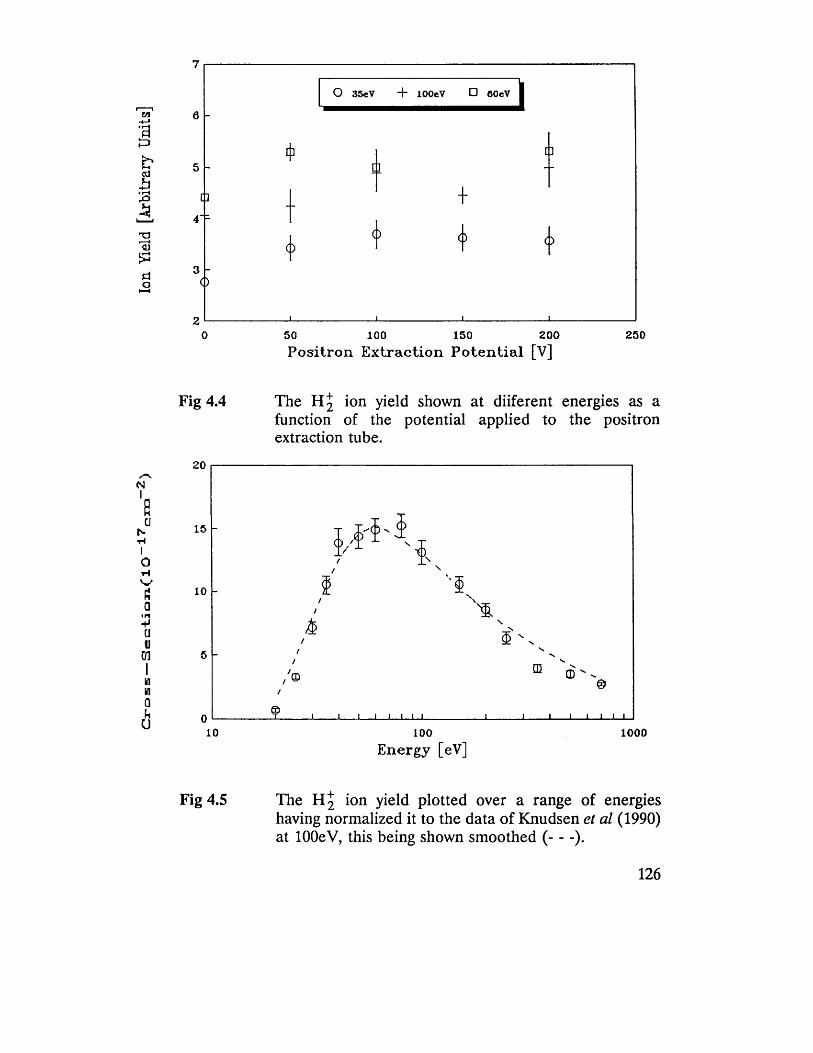
Cro
ss—
Se
cti
on
(io
_17c
m 2)
Ion
Yield
[A
rbitr
ary
Uni
ts]
7
□
0
O 35eV + lOOeV □ 60eV
□
()O
+
o
t]
O
5 0 1 0 0 1 5 0 2 0 0Positron Extraction P oten tia l [V]
2 5 0
Fig 4.4 The H 2 ion yield shown at diiferent energies as a function of the potential applied to the positron extraction tube.
2 0
1 5
/
1 0
1 0 1 0 0 01 0 0
Energy [eV]
Fig 4.5 The H 2 ion yield plotted over a range of energies having normalized it to the data of Knudsen et al (1990) at lOOeV, this being shown smoothed (----- ).
126
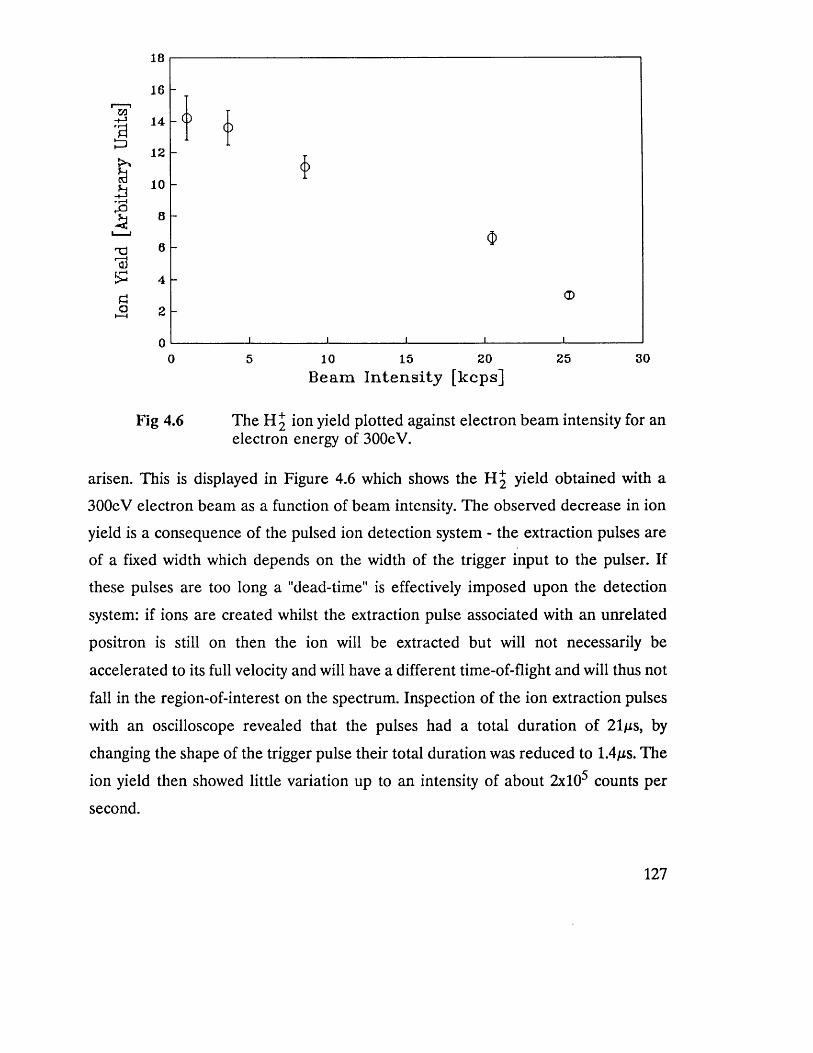
8
w-t-j•a
>,a
nm p~lr£>
"aJ£(=Ja
- O()
<s>
<D
10 15 20B eam I n te n s ity [k c p s]
25 30
Fig 4.6 The H 2 ion yield plotted against electron beam intensity for an electron energy of 300eV.
arisen. This is displayed in Figure 4.6 which shows the H 2 yield obtained with a
300eV electron beam as a function of beam intensity. The observed decrease in ion
yield is a consequence of the pulsed ion detection system - the extraction pulses are
of a fixed width which depends on the width of the trigger input to the pulser. If
these pulses are too long a "dead-time" is effectively imposed upon the detection
system: if ions are created whilst the extraction pulse associated with an unrelated
positron is still on then the ion will be extracted but will not necessarily be
accelerated to its full velocity and will have a different time-of-flight and will thus not
fall in the region-of-interest on the spectrum. Inspection of the ion extraction pulses
with an oscilloscope revealed that the pulses had a total duration of 21/xs, by
changing the shape of the trigger pulse their total duration was reduced to 1.4/xs. The
ion yield then showed little variation up to an intensity of about 2xl05 counts per
second.
127
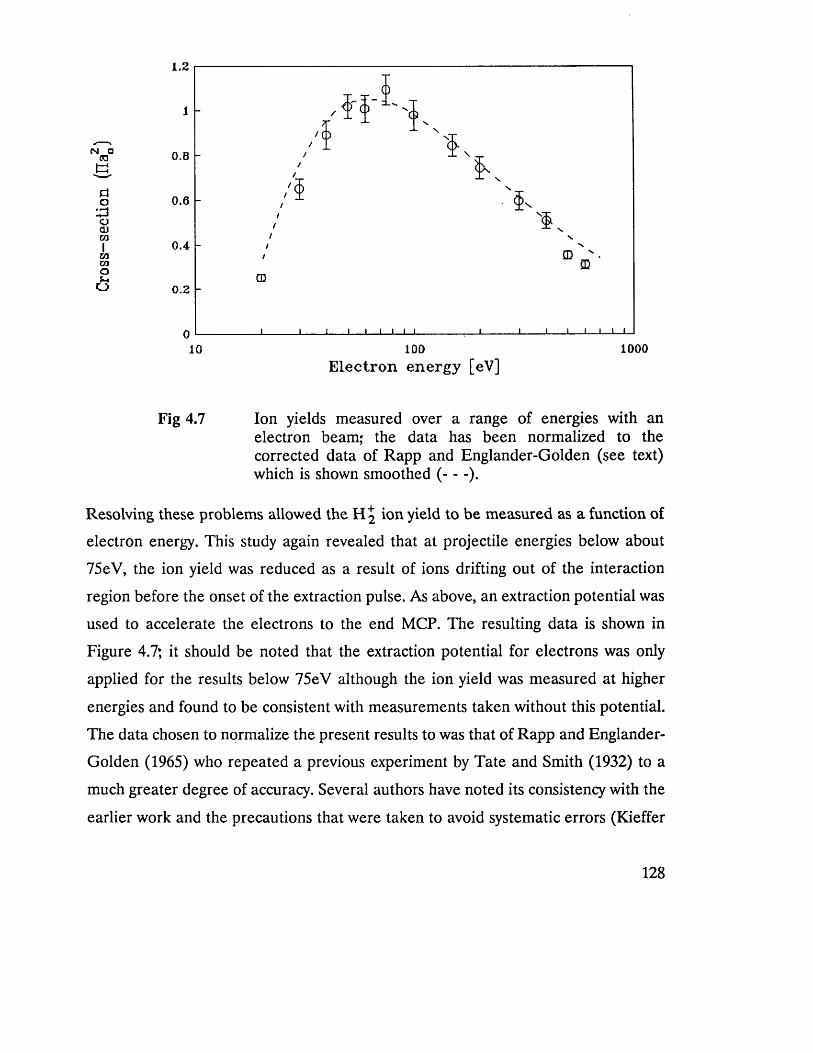
CM Ocnt2ao0CDm1mtaO
O
1.2
0.8
0.6
0.4
0.2
100010010E lectron en ergy [eV]
Fig 4.7 Ion yields measured over a range of energies with an electron beam; the data has been normalized to the corrected data of Rapp and Englander-Golden (see text) which is shown smoothed (----- ).
Resolving these problems allowed the H 2 ion yield to be measured as a function of
electron energy. This study again revealed that at projectile energies below about
75eV, the ion yield was reduced as a result of ions drifting out of the interaction
region before the onset of the extraction pulse. As above, an extraction potential was
used to accelerate the electrons to the end MCP. The resulting data is shown in
Figure 4.7; it should be noted that the extraction potential for electrons was only
applied for the results below 75eV although the ion yield was measured at higher
energies and found to be consistent with measurements taken without this potential.
The data chosen to normalize the present results to was that of Rapp and Englander-
Golden (1965) who repeated a previous experiment by Tate and Smith (1932) to a
much greater degree of accuracy. Several authors have noted its consistency with the
earlier work and the precautions that were taken to avoid systematic errors (Kieffer
128
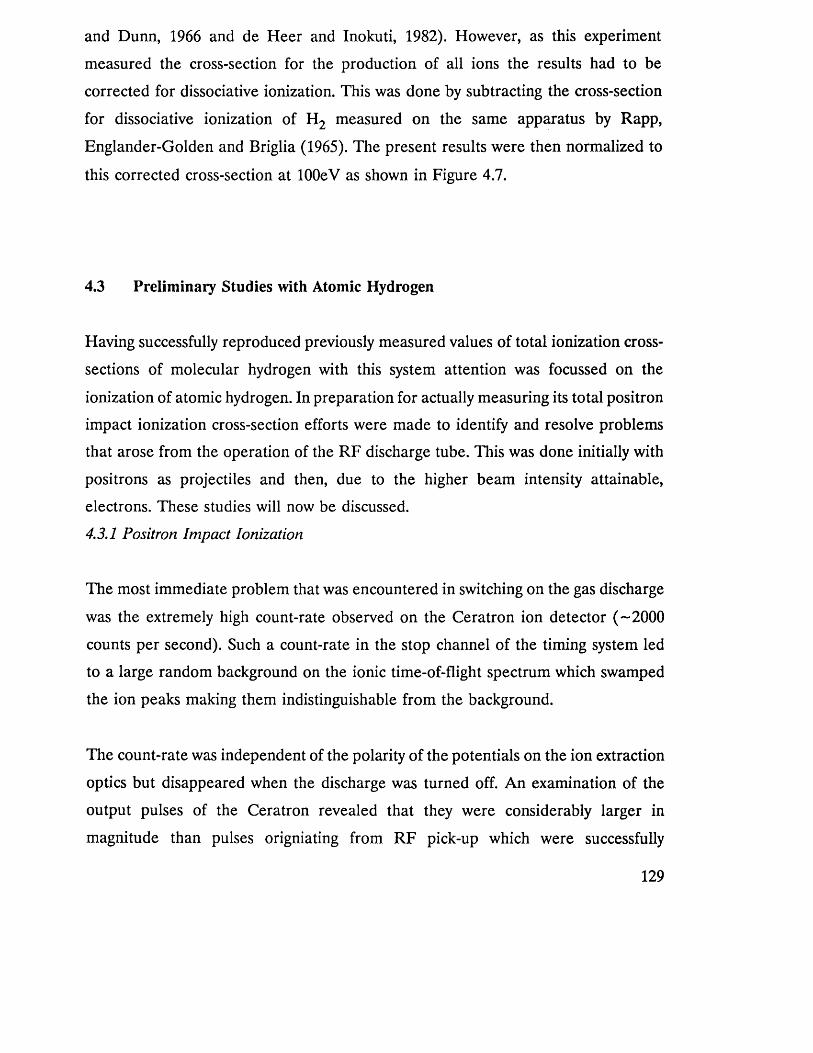
and Dunn, 1966 and de Heer and Inokuti, 1982). However, as this experiment
measured the cross-section for the production of all ions the results had to be
corrected for dissociative ionization. This was done by subtracting the cross-section
for dissociative ionization of H2 measured on the same apparatus by Rapp,
Englander-Golden and Briglia (1965). The present results were then normalized to
this corrected cross-section at lOOeV as shown in Figure 4.7.
4.3 Preliminary Studies with Atomic Hydrogen
Having successfully reproduced previously measured values of total ionization cross-
sections of molecular hydrogen with this system attention was focussed on the
ionization of atomic hydrogen. In preparation for actually measuring its total positron
impact ionization cross-section efforts were made to identify and resolve problems
that arose from the operation of the RF discharge tube. This was done initially with
positrons as projectiles and then, due to the higher beam intensity attainable,
electrons. These studies will now be discussed.
4.3.1 Positron Impact Ionization
The most immediate problem that was encountered in switching on the gas discharge
was the extremely high count-rate observed on the Ceratron ion detector (-2 0 0 0
counts per second). Such a count-rate in the stop channel of the timing system led
to a large random background on the ionic time-of-flight spectrum which swamped
the ion peaks making them indistinguishable from the background.
The count-rate was independent of the polarity of the potentials on the ion extraction
optics but disappeared when the discharge was turned off. An examination of the
output pulses of the Ceratron revealed that they were considerably larger in
magnitude than pulses origniating from RF pick-up which were successfully
129
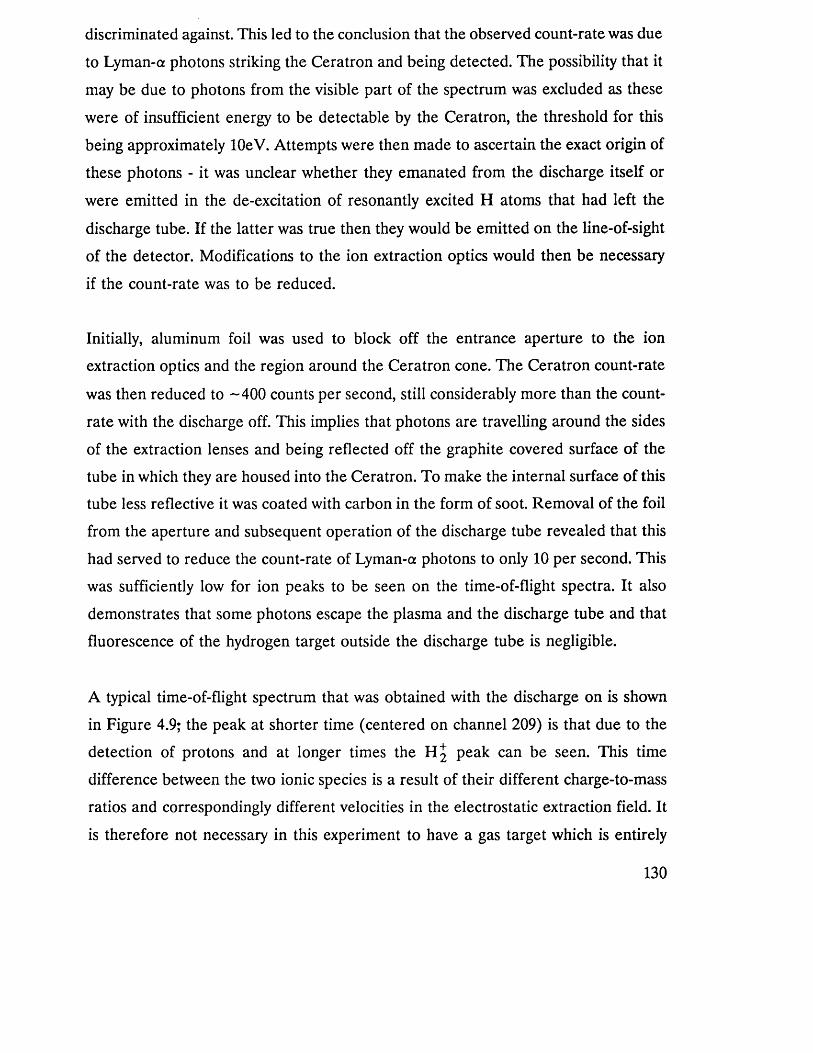
discriminated against. This led to the conclusion that the observed count-rate was due
to Lyman-a photons striking the Ceratron and being detected. The possibility that it
may be due to photons from the visible part of the spectrum was excluded as these
were of insufficient energy to be detectable by the Ceratron, the threshold for this
being approximately lOeV. Attempts were then made to ascertain the exact origin of
these photons - it was unclear whether they emanated from the discharge itself or
were emitted in the de-excitation of resonantly excited H atoms that had left the
discharge tube. If the latter was true then they would be emitted on the line-of-sight
of the detector. Modifications to the ion extraction optics would then be necessary
if the count-rate was to be reduced.
Initially, aluminum foil was used to block off the entrance aperture to the ion
extraction optics and the region around the Ceratron cone. The Ceratron count-rate
was then reduced to -4 0 0 counts per second, still considerably more than the count-
rate with the discharge off. This implies that photons are travelling around the sides
of the extraction lenses and being reflected off the graphite covered surface of the
tube in which they are housed into the Ceratron. To make the internal surface of this
tube less reflective it was coated with carbon in the form of soot. Removal of the foil
from the aperture and subsequent operation of the discharge tube revealed that this
had served to reduce the count-rate of Lyman-a photons to only 10 per second. This
was sufficiently low for ion peaks to be seen on the time-of-flight spectra. It also
demonstrates that some photons escape the plasma and the discharge tube and that
fluorescence of the hydrogen target outside the discharge tube is negligible.
A typical time-of-flight spectrum that was obtained with the discharge on is shown
in Figure 4.9; the peak at shorter time (centered on channel 209) is that due to the
detection of protons and at longer times the H 2 peak can be seen. This time
difference between the two ionic species is a result of their different charge-to-mass
ratios and correspondingly different velocities in the electrostatic extraction field. It
is therefore not necessary in this experiment to have a gas target which is entirely
130
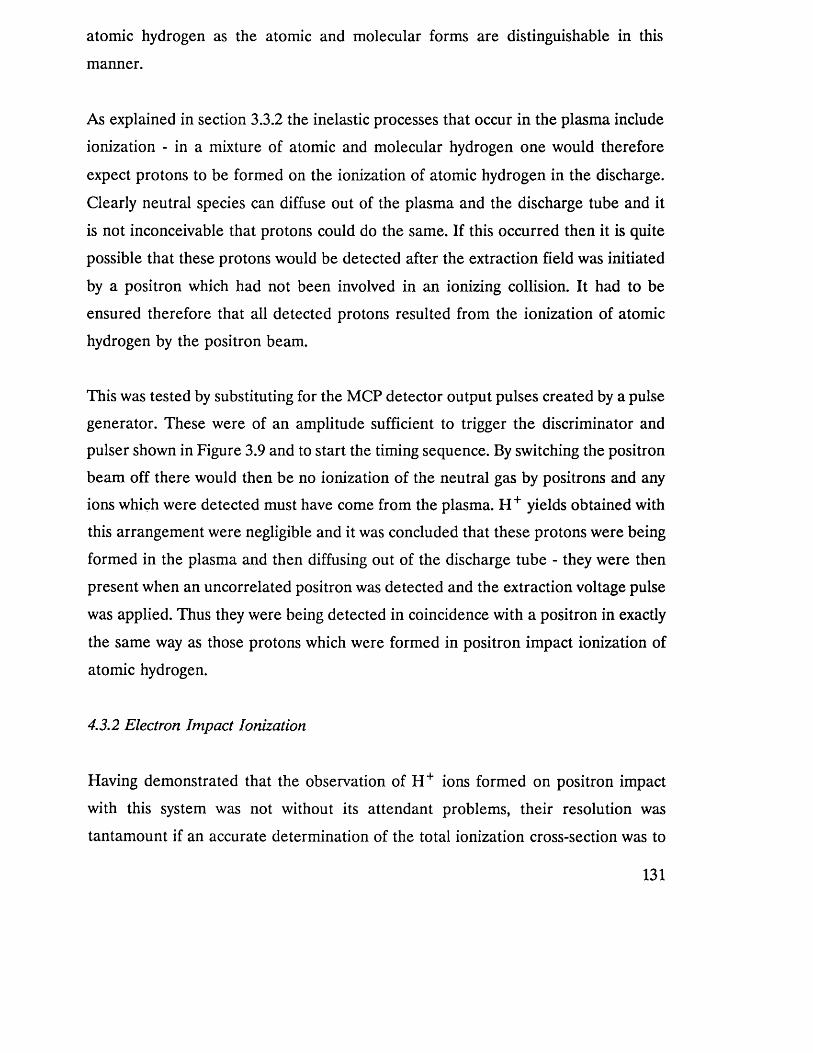
atomic hydrogen as the atomic and molecular forms are distinguishable in this
manner.
As explained in section 3.3.2 the inelastic processes that occur in the plasma include
ionization - in a mixture of atomic and molecular hydrogen one would therefore
expect protons to be formed on the ionization of atomic hydrogen in the discharge.
Clearly neutral species can diffuse out of the plasma and the discharge tube and it
is not inconceivable that protons could do the same. If this occurred then it is quite
possible that these protons would be detected after the extraction field was initiated
by a positron which had not been involved in an ionizing collision. It had to be
ensured therefore that all detected protons resulted from the ionization of atomic
hydrogen by the positron beam.
This was tested by substituting for the MCP detector output pulses created by a pulse
generator. These were of an amplitude sufficient to trigger the discriminator and
pulser shown in Figure 3.9 and to start the timing sequence. By switching the positron
beam off there would then be no ionization of the neutral gas by positrons and any
ions which were detected must have come from the plasma. H + yields obtained with
this arrangement were negligible and it was concluded that these protons were being
formed in the plasma and then diffusing out of the discharge tube - they were then
present when an uncorrelated positron was detected and the extraction voltage pulse
was applied. Thus they were being detected in coincidence with a positron in exactly
the same way as those protons which were formed in positron impact ionization of
atomic hydrogen.
4.3.2 Electron Impact Ionization
Having demonstrated that the observation of H + ions formed on positron impact
with this system was not without its attendant problems, their resolution was
tantamount if an accurate determination of the total ionization cross-section was to
131
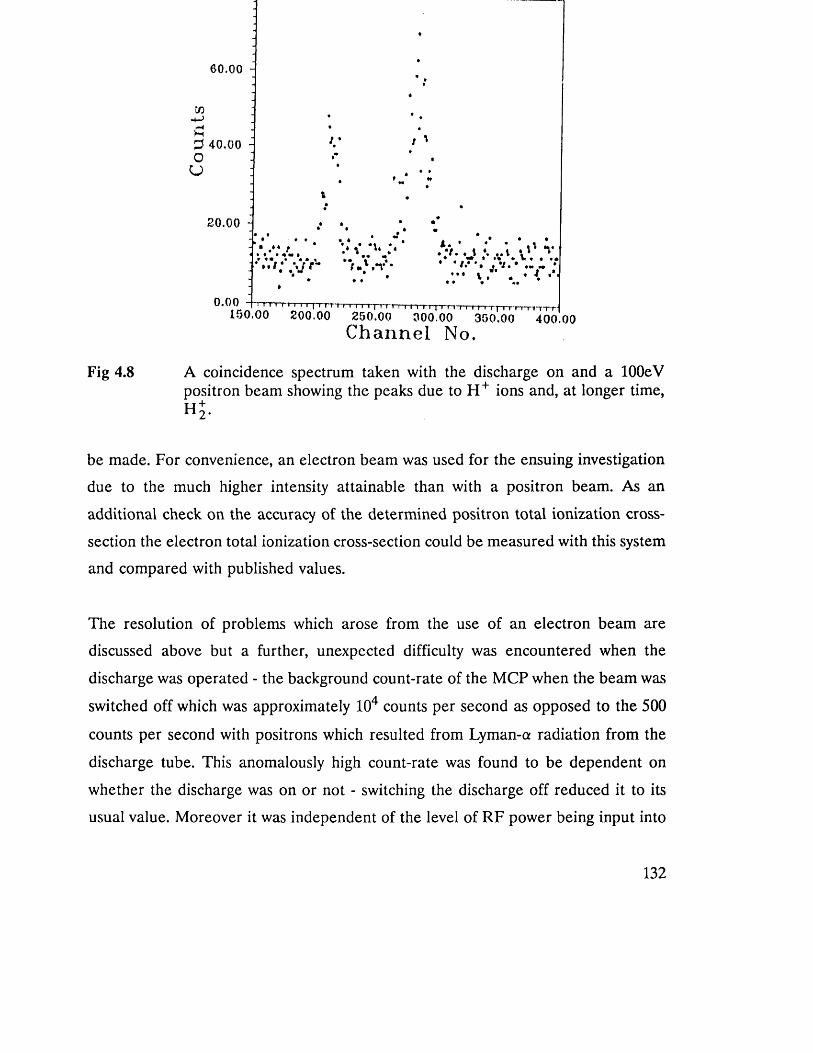
Fig 4.8
. _ ' n 1 ' 1 1 "r 1 1 1 * ' ( ' r r - r T i i i T f - r i i i i n r r150.00 200.00 250.00 300.00 350.00 400.00C han n e l No.
A coincidence spectrum taken with the discharge on and a lOOeV positron beam showing the peaks due to H + ions and, at longer time,HJ-
be made. For convenience, an electron beam was used for the ensuing investigation
due to the much higher intensity attainable than with a positron beam. As an
additional check on the accuracy of the determined positron total ionization cross-
section the electron total ionization cross-section could be measured with this system
and compared with published values.
The resolution of problems which arose from the use of an electron beam are
discussed above but a further, unexpected difficulty was encountered when the
discharge was operated - the background count-rate of the MCP when the beam was
switched off which was approximately 104 counts per second as opposed to the 500
counts per second with positrons which resulted from Lyman-a radiation from the
discharge tube. This anomalously high count-rate was found to be dependent on
whether the discharge was on or not - switching the discharge off reduced it to its
usual value. Moreover it was independent of the level of RF power being input into
the resonator cavity be it zero or at its maximum, noting that at zero power the
discharge was extinguished and the count-rate thus reduced. This implied that the
count-rate was actually due to the detection of a large number of particles, the
polarity of the plates requiring they be negatively charged or neutral. Their charge
sign was determined by changing the polarity of the first aperture on the MCP
assembly (the grid shown in Figure 3.3). The count-rate was observed to reduce to
-5 0 0 per second when a negative potential was applied to this grid even for as low
a potential as -20V. It was concluded that these particles were negatively charged and
came from the plasma - electrons were escaping the discharge. All measurements
with electrons and the discharge on were therefore made with a potential of -20V on
this grid.
The next investigations made with an electron beam were in order to resolve the
problem of protons coming out of the discharge tube. Precautions had to be taken
that protons which had not originated in impact ionization by the projectile were not
detected in coincidence with an electron. This was achieved by applying a small dc
potential to both ion extraction plates. With a negative field gradient towards the ion
detector protons coming from the discharge tube would then be extracted and
detected independently of the detection of an electron. They would therefore not
appear on the time-of-flight spectrum, if such a proton was to be detected
coincidentally with an electron then it would only appear on the spectrum as part of
the random background. Furthermore, if the magnitude of the dc potential was kept
as low as possible in comparison to the beam energy then the spatial displacement
of the beam in the ExB field that results would be negligible. Different magnitudes
of the potential gradient across the interaction region were used at a beam energy
of 400eV to test for any effects on the beam - these would then change the gas
overlap and the proton yield would change. The results of this investigation are
shown in Figure 4.9; the increase in the proton yield on the initial application of a
potential difference indicates that H + ions are detected more efficiently when a small
potential difference is applied. This is a result of ions which have a component of
133
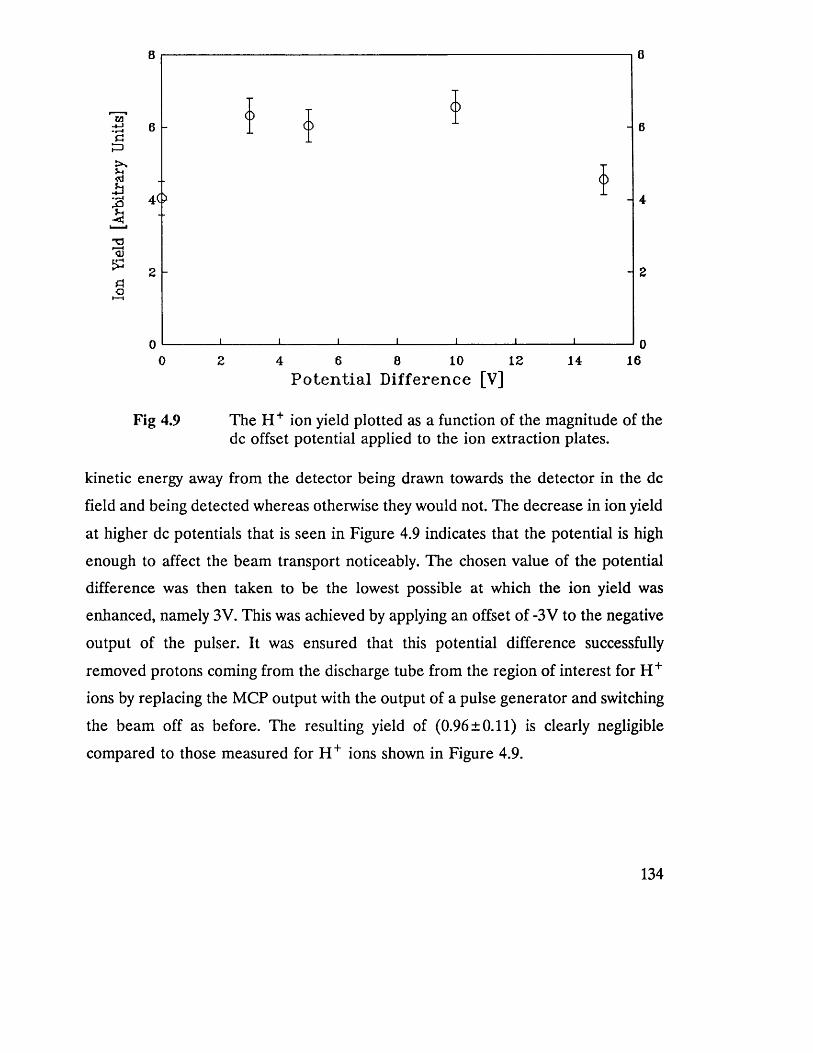
-4-1»r^
73
oI—I
166 8 10 12 140 2 4P o te n t ia l D if feren ce [V]
Fig 4.9 The H + ion yield plotted as a function of the magnitude of the dc offset potential applied to the ion extraction plates.
kinetic energy away from the detector being drawn towards the detector in the dc
field and being detected whereas otherwise they would not. The decrease in ion yield
at higher dc potentials that is seen in Figure 4.9 indicates that the potential is high
enough to affect the beam transport noticeably. The chosen value of the potential
difference was then taken to be the lowest possible at which the ion yield was
enhanced, namely 3V. This was achieved by applying an offset of -3V to the negative
output of the pulser. It was ensured that this potential difference successfully
removed protons coming from the discharge tube from the region of interest for H +
ions by replacing the MCP output with the output of a pulse generator and switching
the beam off as before. The resulting yield of (0.96 ±0.11) is clearly negligible
compared to those measured for H + ions shown in Figure 4.9.
134
4.4 Summary
The experimental studies discussed in this chapter were carried out as tests
preliminary to measuring the positron impact ionization cross-section of atomic
hydrogen. It has been demonstrated that after slight modifications the apparatus
described in Chapter 3 is suitable for measuring ionization cross-sections with
positrons and electrons. To this end these cross-sections for molecular hydrogen have
been measured and, as shown in Figures 4.5 and 4.7, agree well with the most
accurate results that were previously obtained.
Measuring the ionization cross-section of atomic hydrogen with either particle has
revealed several unexpected difficulties arising from the operation of the discharge
tube in a magnetic field. It seems however that the effects of electrons and protons
coming out of the discharge tube and being trapped in the magnetic field and then
detected have been successfully negated. This in combination with the successful
reproduction of previously obtained results discussed above indicates that the
determination of the desired cross-sections for atomic hydrogen is possible with this
apparatus.
135
CHAPTER 5
ELECTRON CAPTURE TO THE CONTINUUM IN POSITRON-
ARGON COLLISIONS
5.1 Introduction
The ionization of gas atoms by positively charged particles takes different forms
characterized by the fate of the ejected atomic electron. If, in the final state, the
electron is free then the process is called direct ionization. However, if it is bound
to the projectile charge transfer will have taken place for proton or heavy ion
collisions and positronium formation for positron impact.
Classically, impact ionization can be viewed as an energy transfer from the
projectile to the atomic electron sufficient to raise it from a potential well of
depth Ej, the ionization potential, to the continuum. If the energy gained by the
atomic electron is slightly less than Ej then ionization will not have taken place
and the atom will be in a highly excited state. If the energy gained is slightly
greater Ej though then the electron will be ejected with a very low kinetic energy.
It follows therefore that direct ionization with the ejection of a slow electron is
merely a natural continuation of excitation to a state with a high principal
quantum number. One can view charge transfer to a highly excited state of the
projectile in a similar fashion: the same reaction will extend beyond the ionization
limit giving electrons with very low kinetic energy in the rest frame of the
projectile. In the laboratory frame their velocity vectors will be almost equal and
their relative motion will indicate a high degree of correlation between the
particles. Such a reaction is referred to as electron capture to a continuum state
of the projectile. In their study of the velocity and angular distributions of
electrons ejected in proton impact ionization of hydrogen and helium Rudd et al
(1966) observed that the distributions were distinctly peaked at 0° to the incident
proton beam and at a velocity equal to that of the scattered proton. Following
136
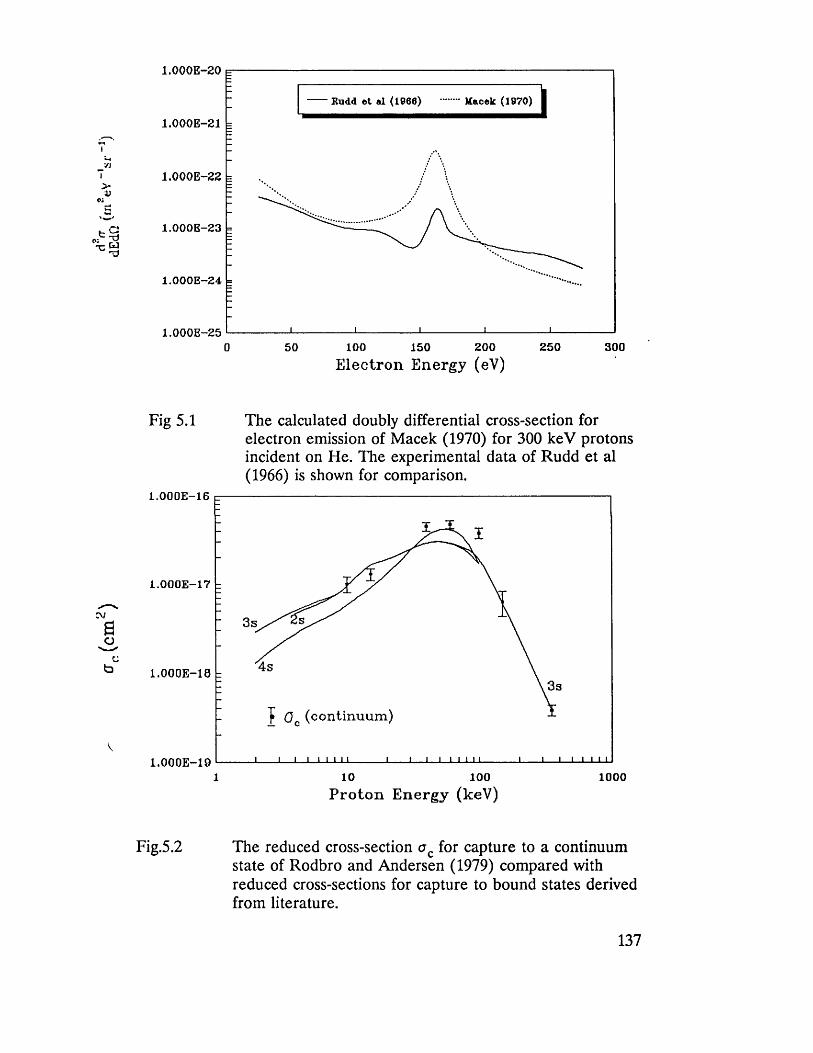
Budd e t al (1968)
1 . 0 0 0 E - 2 1
1 . 0 0 0 E - 2 2
1 . 0 0 0 E - 2 3
l . O O O E — 2 4
l . O O O E — 2 52 5 0 3 0 00 5 0 100 1 5 0 200
Electron Energy (eV)
Fig 5.1 The calculated doubly differential cross-section forelectron emission of Macek (1970) for 300 keV protons incident on He. The experimental data of Rudd et al (1966) is shown for comparison.
1 . 0 0 0 E - 1 6
l . O O O E — 1 7
3s
4 s1 . 0 0 0 E - 1 83s
"F Oc (con tin u u m )
1 . 0 0 0 E - 1 91 10 100 1000
P roton Energy (keV)
Fig.5.2 The reduced cross-section o Q for capture to a continuum state of Rodbro and Andersen (1979) compared with reduced cross-sections for capture to bound states derived from literature.
137
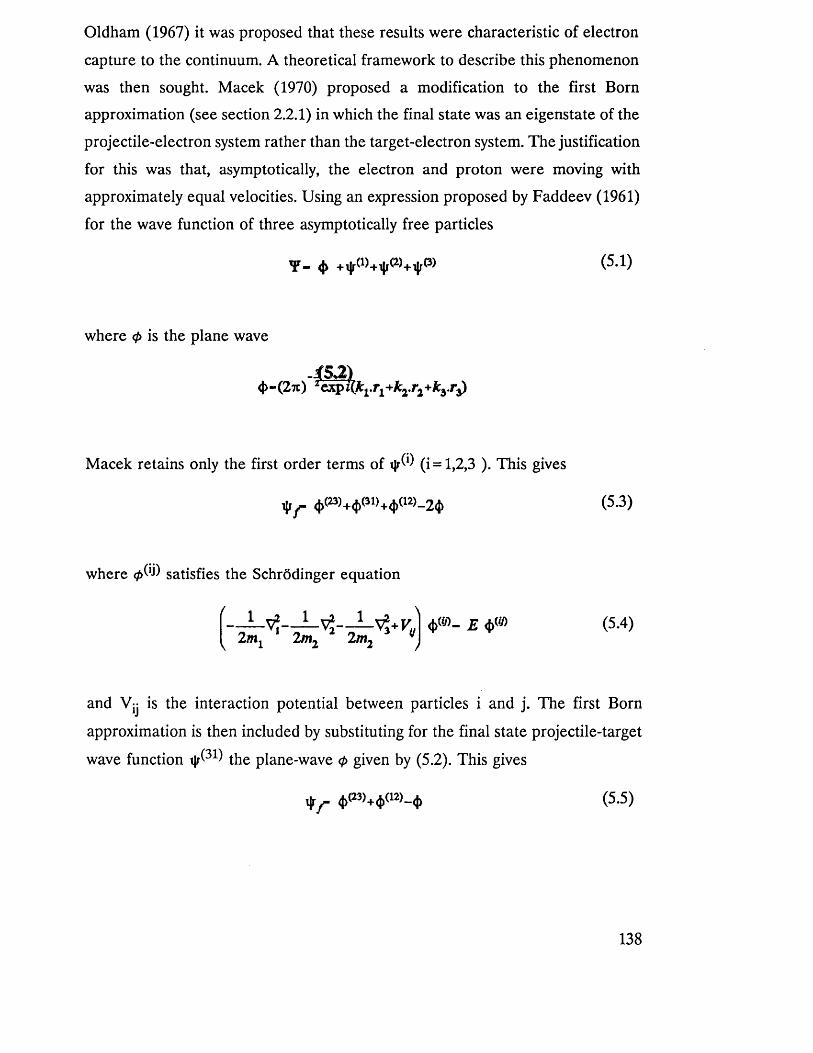
Oldham (1967) it was proposed that these results were characteristic of electron
capture to the continuum. A theoretical framework to describe this phenomenon
was then sought. Macek (1970) proposed a modification to the first Born
approximation (see section 2.2.1) in which the final state was an eigenstate of the
projectile-electron system rather than the target-electron system. The justification
for this was that, asymptotically, the electron and proton were moving with
approximately equal velocities. Using an expression proposed by Faddeev (1961)
for the wave function of three asymptotically free particles
Y - 4> +i|r(1)+1jr(2)+1|r(3) (5.1)
where <f> is the plane wave
Macek retains only the first order terms of iJrW (i = 1,2,3 ). This gives
i|jr <i>( +<f><31>+<j><i2>-2<l> (5.3)
where satisfies the Schrodinger equation
(5.4)
and V ” is the interaction potential between particles i and j. The first Born
approximation is then included by substituting for the final state projectile-target
wave function the plane-wave <f> given by (5.2). This gives
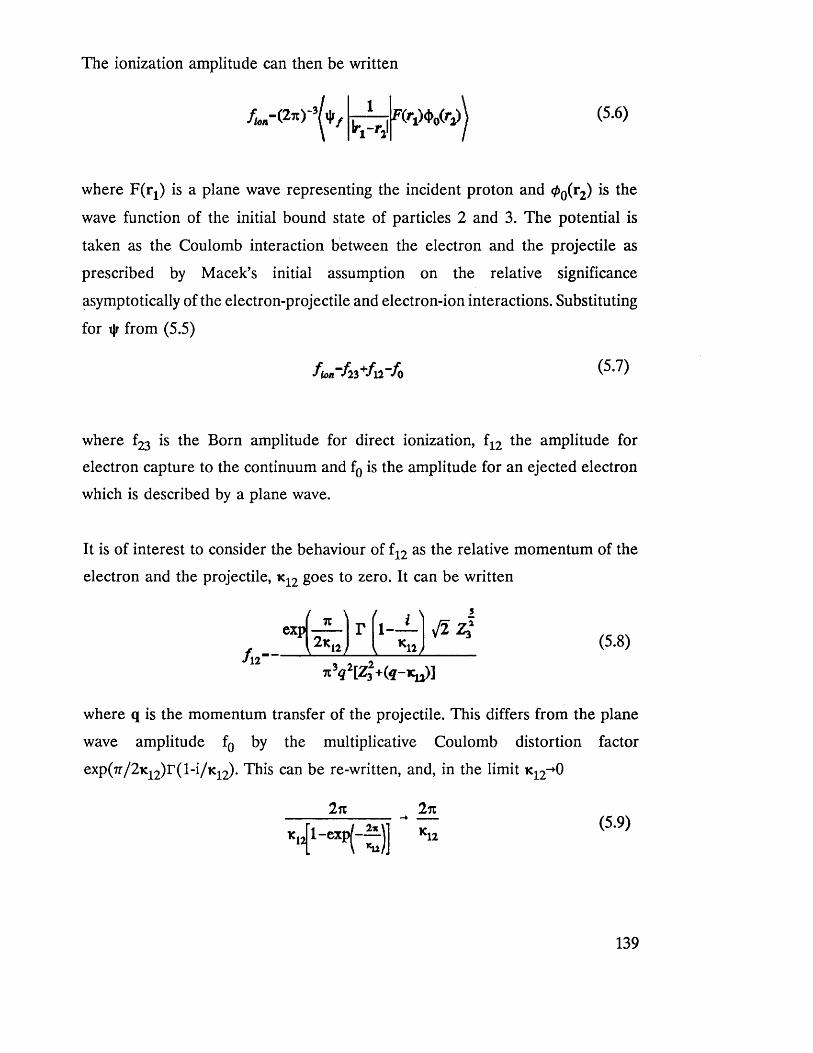
The ionization amplitude can then be written
w , ) (5.6)
where F(rj) is a plane wave representing the incident proton and 0 o(r2) *s
wave function of the initial bound state of particles 2 and 3. The potential is
taken as the Coulomb interaction between the electron and the projectile as
prescribed by Macek’s initial assumption on the relative significance
asymptotically of the electron-projectile and electron-ion interactions. Substituting
for tjr from (5.5)
flo n ~ f2 3 +f l 2 f o (5.7)
where f2 3 is the Born amplitude for direct ionization, f1 2 amplitude for
electron capture to the continuum and f0 is the amplitude for an ejected electron
which is described by a plane wave.
It is of interest to consider the behaviour of f1 2 as the relative momentum of the
electron and the projectile, k 12 goes to zero. It can be written
1 -k12 (5.8)
ji y t z £ + ( « —*t})]
where q is the momentum transfer of the projectile. This differs from the plane
wave amplitude f0 by the multiplicative Coulomb distortion factor
exp(7r /2 K1 2 )r (l-i/K 12). This can be re-written, and, in the limit k12-*0
2n 2%
K12(5.9)
139
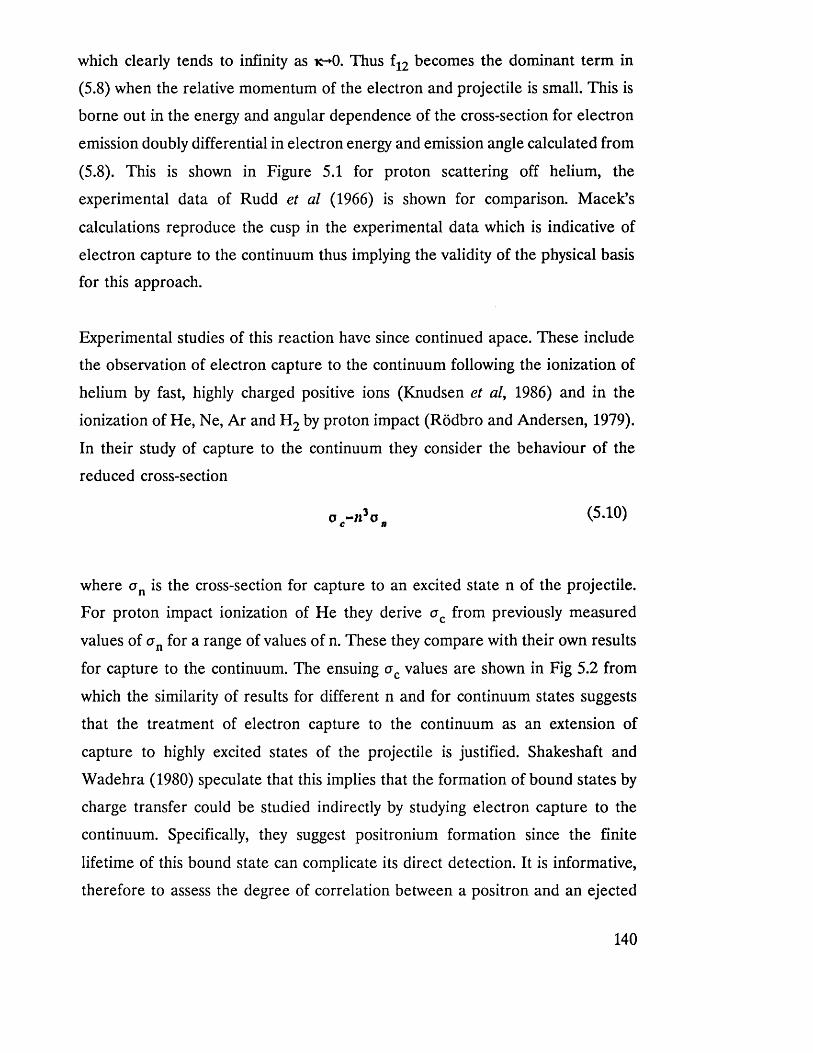
which clearly tends to infinity as k-*0. Thus f12 becomes the dominant term in
(5.8) when the relative momentum of the electron and projectile is small. This is
borne out in the energy and angular dependence of the cross-section for electron
emission doubly differential in electron energy and emission angle calculated from
(5.8). This is shown in Figure 5.1 for proton scattering off helium, the
experimental data of Rudd et al (1966) is shown for comparison. Macek’s
calculations reproduce the cusp in the experimental data which is indicative of
electron capture to the continuum thus implying the validity of the physical basis
for this approach.
Experimental studies of this reaction have since continued apace. These include
the observation of electron capture to the continuum following the ionization of
helium by fast, highly charged positive ions (Knudsen et al, 1986) and in the
ionization of He, Ne, Ar and H2 by proton impact (Rodbro and Andersen, 1979).
In their study of capture to the continuum they consider the behaviour of the
reduced cross-section
o -n3o (5.10)C ft
where a n is the cross-section for capture to an excited state n of the projectile.
For proton impact ionization of He they derive o c from previously measured
values of crn for a range of values of n. These they compare with their own results
for capture to the continuum. The ensuing o c values are shown in Fig 5.2 from
which the similarity of results for different n and for continuum states suggests
that the treatment of electron capture to the continuum as an extension of
capture to highly excited states of the projectile is justified. Shakeshaft and
Wadehra (1980) speculate that this implies that the formation of bound states by
charge transfer could be studied indirectly by studying electron capture to the
continuum. Specifically, they suggest positronium formation since the finite
lifetime of this bound state can complicate its direct detection. It is informative,
therefore to assess the degree of correlation between a positron and an ejected
140
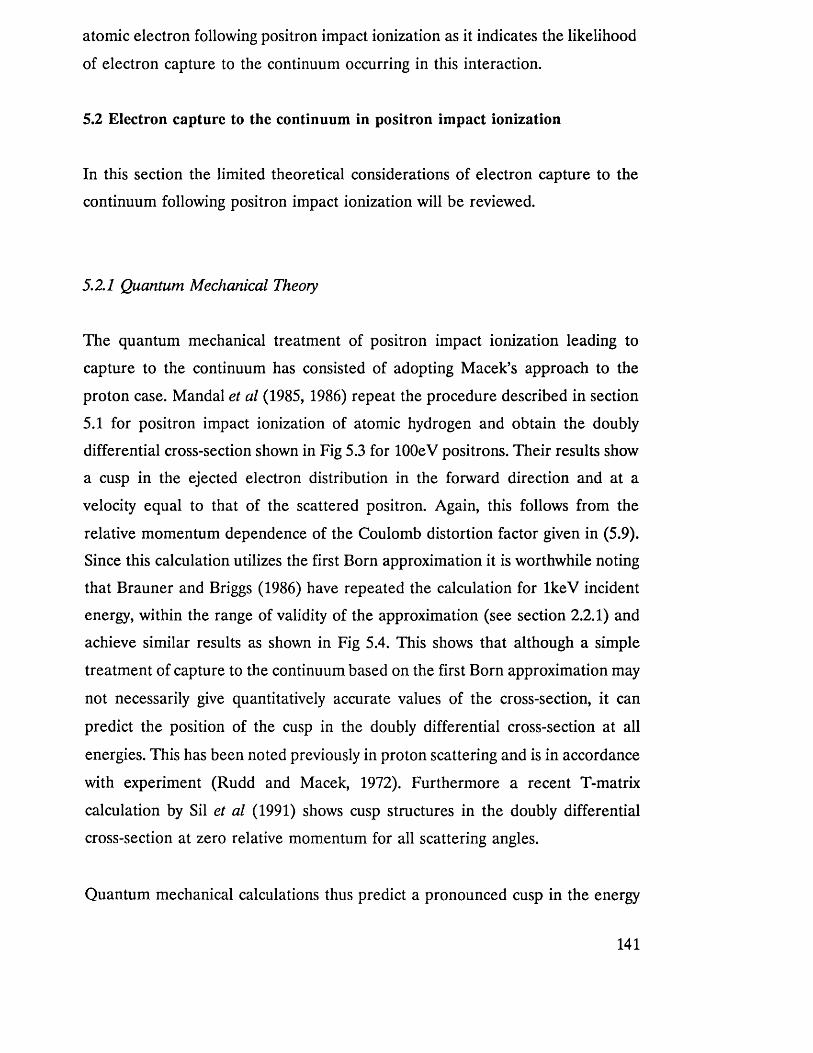
atomic electron following positron impact ionization as it indicates the likelihood
of electron capture to the continuum occurring in this interaction.
5.2 Electron capture to the continuum in positron impact ionization
In this section the limited theoretical considerations of electron capture to the
continuum following positron impact ionization will be reviewed.
5.2.1 Quantum Mechanical Theory
The quantum mechanical treatment of positron impact ionization leading to
capture to the continuum has consisted of adopting Macek’s approach to the
proton case. Mandal et al (1985, 1986) repeat the procedure described in section
5.1 for positron impact ionization of atomic hydrogen and obtain the doubly
differential cross-section shown in Fig 5.3 for lOOeV positrons. Their results show
a cusp in the ejected electron distribution in the forward direction and at a
velocity equal to that of the scattered positron. Again, this follows from the
relative momentum dependence of the Coulomb distortion factor given in (5.9).
Since this calculation utilizes the first Born approximation it is worthwhile noting
that Brauner and Briggs (1986) have repeated the calculation for IkeV incident
energy, within the range of validity of the approximation (see section 2.2.1) and
achieve similar results as shown in Fig 5.4. This shows that although a simple
treatment of capture to the continuum based on the first Born approximation may
not necessarily give quantitatively accurate values of the cross-section, it can
predict the position of the cusp in the doubly differential cross-section at all
energies. This has been noted previously in proton scattering and is in accordance
with experiment (Rudd and Macek, 1972). Furthermore a recent T-matrix
calculation by Sil et al (1991) shows cusp structures in the doubly differential
cross-section at zero relative momentum for all scattering angles.
Quantum mechanical calculations thus predict a pronounced cusp in the energy
141
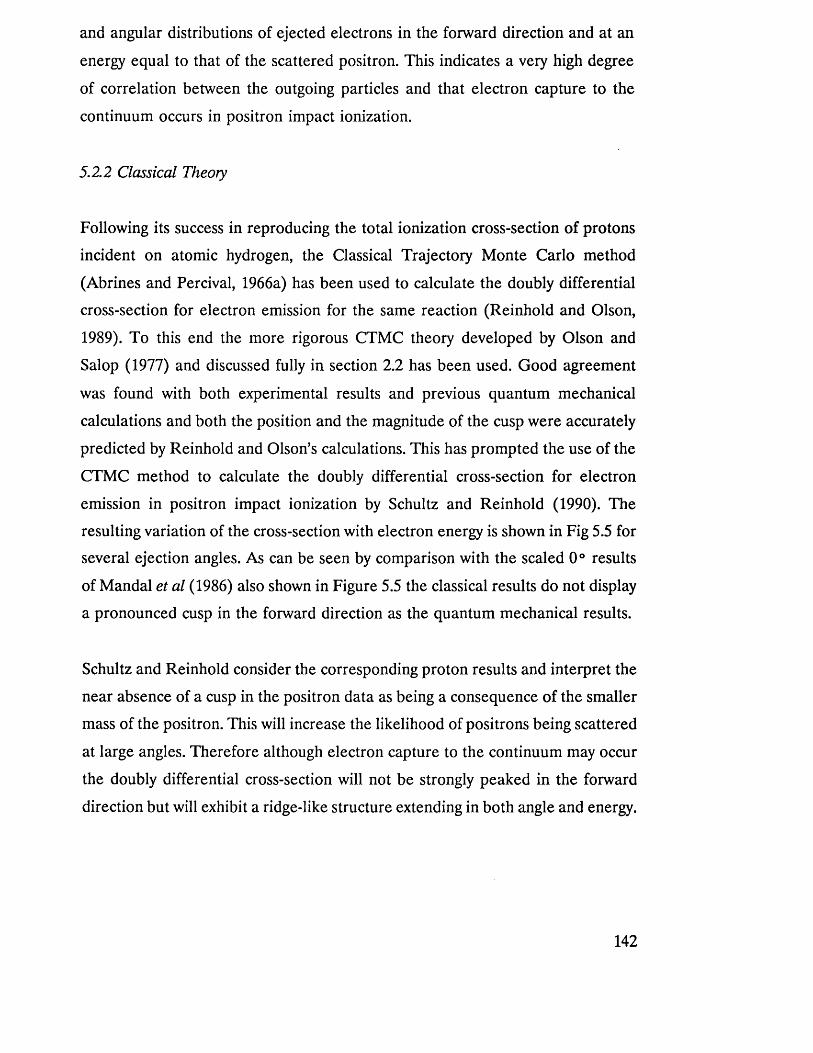
and angular distributions of ejected electrons in the forward direction and at an
energy equal to that of the scattered positron. This indicates a very high degree
of correlation between the outgoing particles and that electron capture to the
continuum occurs in positron impact ionization.
5.2.2 Classical Theory
Following its success in reproducing the total ionization cross-section of protons
incident on atomic hydrogen, the Classical Trajectory Monte Carlo method
(Abrines and Percival, 1966a) has been used to calculate the doubly differential
cross-section for electron emission for the same reaction (Reinhold and Olson,
1989). To this end the more rigorous CTMC theory developed by Olson and
Salop (1977) and discussed fully in section 2.2 has been used. Good agreement
was found with both experimental results and previous quantum mechanical
calculations and both the position and the magnitude of the cusp were accurately
predicted by Reinhold and Olson’s calculations. This has prompted the use of the
CTMC method to calculate the doubly differential cross-section for electron
emission in positron impact ionization by Schultz and Reinhold (1990). The
resulting variation of the cross-section with electron energy is shown in Fig 5.5 for
several ejection angles. As can be seen by comparison with the scaled 0° results
of Mandal et al (1986) also shown in Figure 5.5 the classical results do not display
a pronounced cusp in the forward direction as the quantum mechanical results.
Schultz and Reinhold consider the corresponding proton results and interpret the
near absence of a cusp in the positron data as being a consequence of the smaller
mass of the positron. This will increase the likelihood of positrons being scattered
at large angles. Therefore although electron capture to the continuum may occur
the doubly differential cross-section will not be strongly peaked in the forward
direction but will exhibit a ridge-like structure extending in both angle and energy.
142
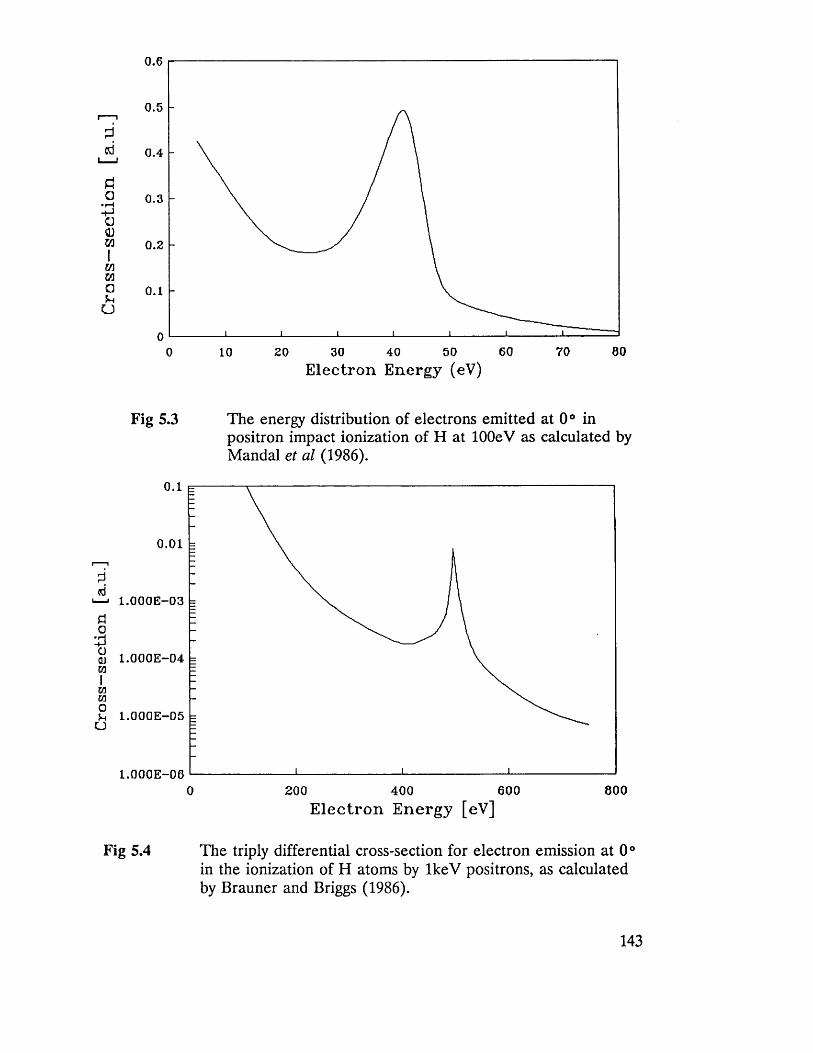
0.6
0.5
0.4L—-I
Pia 0.3
0.2UimaPi
uo.i
0060 70500 20 30 4010Electron Energy (eV)
Fig 5.3 The energy distribution of electrons emitted at 0° inpositron impact ionization of H at lOOeV as calculated by Mandal et al (1986).
o.oi
1.000E—03
5 1.000E-D4
>h l.OOOE—05
1.000E-D68006000 200 400
E lec tron Energy [eV]
Fig 5.4 The triply differential cross-section for electron emission at 0° in the ionization of H atoms by IkeV positrons, as calculated by Brauner and Briggs (1986).
143
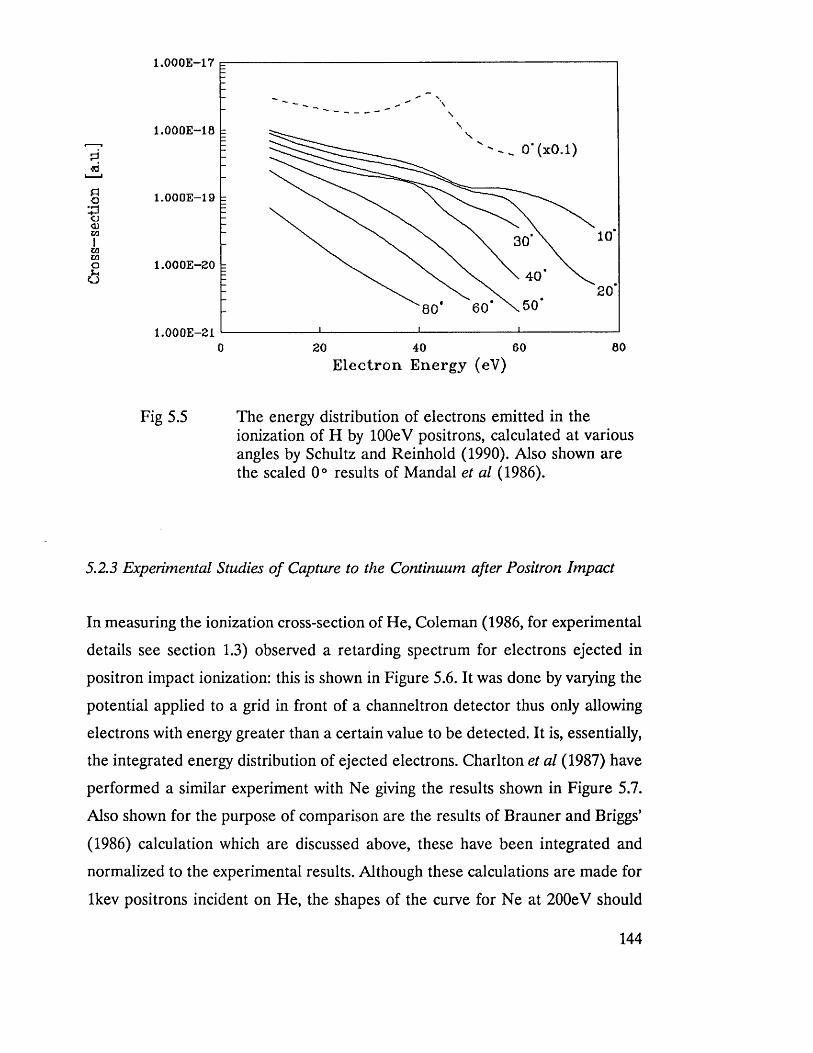
l.OOOE—17
2d#=l0'-2CJOJin1
zaIToO
l.OOOE—IB
l.OOOE—19
l.OOOE—20
l.OOOE—2120 40 60
Electron Energy (eV)80
Fig 5.5 The energy distribution of electrons emitted in theionization of H by lOOeV positrons, calculated at various angles by Schultz and Reinhold (1990). Also shown are the scaled 0° results of Mandal et al (1986).
5.2.3 Experimental Studies o f Capture to the Continuum after Positron Impact
In measuring the ionization cross-section of He, Coleman (1986, for experimental
details see section 1.3) observed a retarding spectrum for electrons ejected in
positron impact ionization: this is shown in Figure 5.6. It was done by varying the
potential applied to a grid in front of a channeltron detector thus only allowing
electrons with energy greater than a certain value to be detected. It is, essentially,
the integrated energy distribution of ejected electrons. Charlton et al (1987) have
performed a similar experiment with Ne giving the results shown in Figure 5.7.
Also shown for the purpose of comparison are the results of Brauner and Briggs’
(1986) calculation which are discussed above, these have been integrated and
normalized to the experimental results. Although these calculations are made for
lkev positrons incident on He, the shapes of the curve for Ne at 200eV should
144
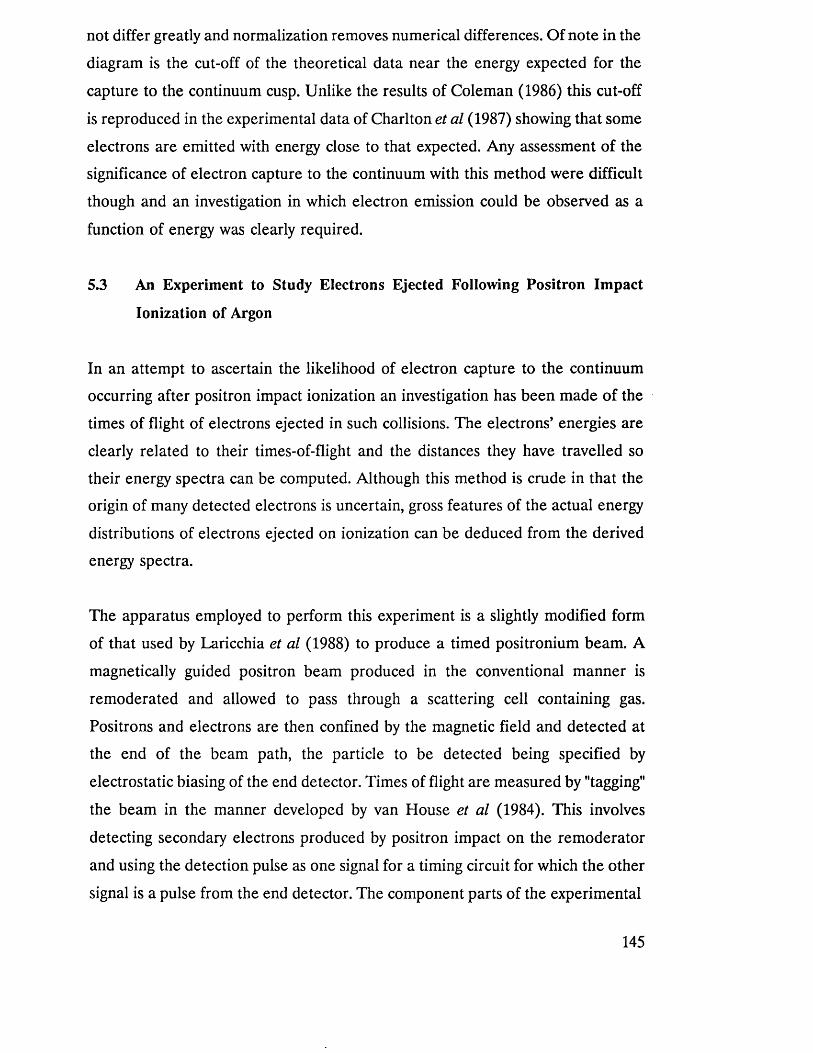
not differ greatly and normalization removes numerical differences. Of note in the
diagram is the cut-off of the theoretical data near the energy expected for the
capture to the continuum cusp. Unlike the results of Coleman (1986) this cut-off
is reproduced in the experimental data of Charlton et al (1987) showing that some
electrons are emitted with energy close to that expected. Any assessment of the
significance of electron capture to the continuum with this method were difficult
though and an investigation in which electron emission could be observed as a
function of energy was clearly required.
5.3 An Experiment to Study Electrons Ejected Following Positron Impact
Ionization of Argon
In an attempt to ascertain the likelihood of electron capture to the continuum
occurring after positron impact ionization an investigation has been made of the
times of flight of electrons ejected in such collisions. The electrons* energies are
clearly related to their times-of-flight and the distances they have travelled so
their energy spectra can be computed. Although this method is crude in that the
origin of many detected electrons is uncertain, gross features of the actual energy
distributions of electrons ejected on ionization can be deduced from the derived
energy spectra.
The apparatus employed to perform this experiment is a slightly modified form
of that used by Laricchia et al (1988) to produce a timed positronium beam. A
magnetically guided positron beam produced in the conventional manner is
remoderated and allowed to pass through a scattering cell containing gas.
Positrons and electrons are then confined by the magnetic field and detected at
the end of the beam path, the particle to be detected being specified by
electrostatic biasing of the end detector. Times of flight are measured by "tagging"
the beam in the manner developed by van House et al (1984). This involves
detecting secondary electrons produced by positron impact on the remoderator
and using the detection pulse as one signal for a timing circuit for which the other
signal is a pulse from the end detector. The component parts of the experimental
145
I
II
Fig 5.6
Fig 5.7
10
e * - He a t 201 .3 eV8
6
2
0
Re ta rd in g p o t e n t i a l ( - V)
The emitted electron count versus retarding potential reported by Coleman (1986) for positron impact ionization of Helium.
c3
Co
Ui
0.2 0 .3 0 4 3
R e c c e d retarding voltage (ret. volts/incident energy m eV|
Electron count versus retarding potential for positron impact ionization of neon reported by Charlton et al (1987) ( # ) shown with the integrated results of Brauner and Briggs’ (1986) (□).
146
apparatus will now be considered in more detail.
5.3.1 The Primary Positron Beam
As discussed in section 1.3 a slow positron beam was produced by the moderation
of fast B+ particles from a 22Na source. The source, described in section 3.2, was
mounted on a mobile shaft via a stainless steel jig. The shaft could be moved
linearly through a 70mm flange mounted on a cylindrical vacuum chamber
partially filled with Pb. The source can then be moved up to the moderator
assembly and retracted to safety when access to this region is necessary.
The moderator comprises of four layers of annealed 90% transmission W mesh
of 13mm diameter, the annealing procedure being that described in section 3.2.
These meshes were held in a recessed PTFE ring by a push-fit brass ring to which
the moderator potential was applied. An unnannealed 90% transmission W mesh
was held 1mm away from the moderator in a similar mounting, this was earthed
to extract positrons. Another annealed mesh, again in a similar mounting, was
placed between the moderator and the source. A potential slightly more positive
than that applied to the moderator was applied to this mesh to turn back those
slow positrons emitted towards the source-this results in a doubling of the beam
intensity. The ensemble of mesh mountings was inserted into a 9mm long brass
cylinder of outer diameter 20mm, they were insulated from each other by PTFE
washers. This cylinder was mounted on the base of a Pb plug attached to a flange
removable for the purpose of installing the moderator. The chamber which
housed this assembly was evacuated by an Edwards E02 diffusion pump backed
by an Edwards ED35 rotary pump. A diagram of the source area is shown in
Figure 5.8.
The moderator is held at a potential so that 400eV positrons emerge from the
source region, these are then transported along the beam line, shown
schematically in Figure 5.9, and are constrained to move axially along it by a
series of Helmholtz coils. A curved solenoid transports positrons through an angle
147
CYLINDER
REMOVABLE LEAD PLUG
PARTIALLY LEAD F ILLE D
Fig 5.8 A cut-away d iagram of the source region
of 15° a nd causes the removal f rom the b e a m of many of its fast c o m p o n e n t s
such as high energy posi t rons and electrons. This b e nd in the b e a m line, toge the r
with the Pb co l l imators shown in F igure 5.9 also p reven t ann ih i la t ion y-rays from
the sou rce reg ion passing th rough the in te rac t ion reg ion to the de tec to rs . T h e
m agne t ic field s t rength a long the b e a m varied from approx im ate ly 100 G a u s s ne a r
the source to a bou t 20 G auss in the in te rac t ion region. T h e p u r p o s e o f this
dec re a se was twofold - the reduc t ion in the field s t rength will cause the pi tch of
the pos i t rons ’ helical pa ths to increase and the b e a m will thus be "paralle lized"
on r each in g the scat ter ing region s ince their veloci ties will be p red o m in an t ly
longitudinal . It also serves to r educe the accep tance angle of the de tec t ion system-
148
INTERACTION
REGION
Ou ui
GO
<N
l/J
g* c .5 o £ ~ o %1/3 .—Ig 8+-* r-«
S O g £3Cu (_>cx oG <uG TD
GGG 0)
G t: ♦r o ocx gX G <L> 2 <D ^x: c •*-> 5
G GG Ot>02'Oo ■*—< G
1/3ODm
G'■'O TOE G
_c ’c o CX1/3 <u G<
On
.2°tG
149
and
dete
ctio
n sy
stem
s.
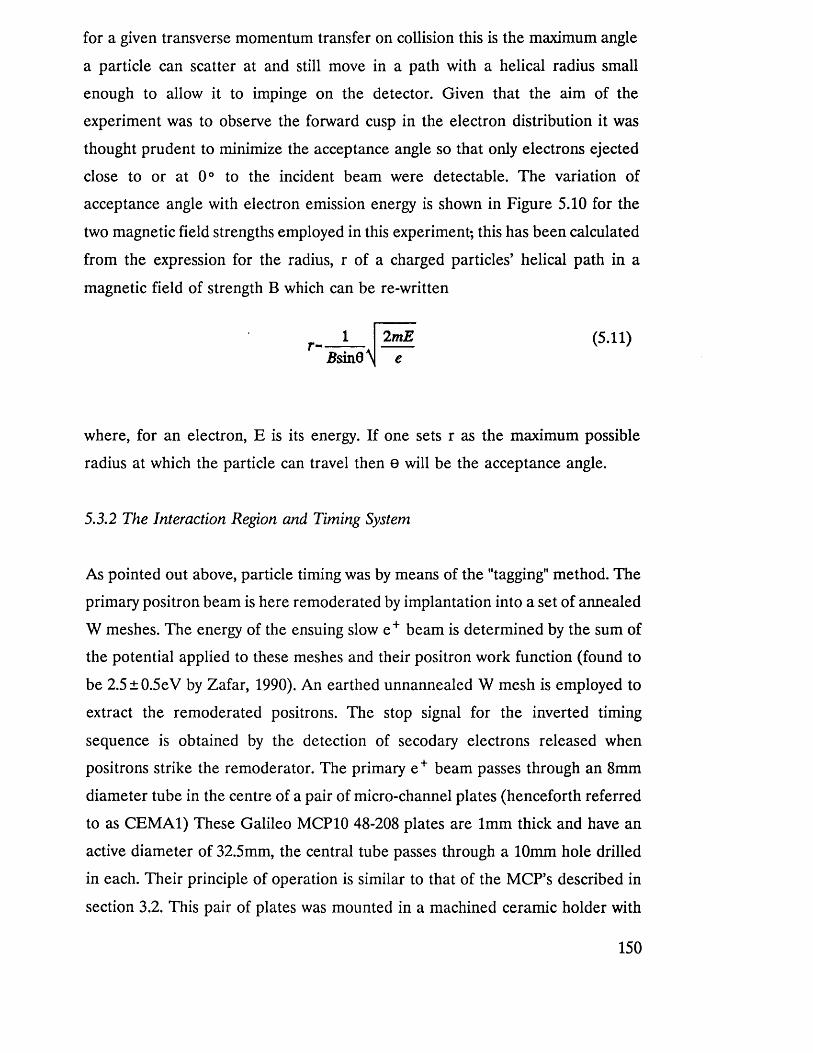
for a given transverse momentum transfer on collision this is the maximum angle
a particle can scatter at and still move in a path with a helical radius small
enough to allow it to impinge on the detector. Given that the aim of the
experiment was to observe the forward cusp in the electron distribution it was
thought prudent to minimize the acceptance angle so that only electrons ejected
close to or at 0° to the incident beam were detectable. The variation of
acceptance angle with electron emission energy is shown in Figure 5.10 for the
two magnetic field strengths employed in this experiment; this has been calculated
from the expression for the radius, r of a charged particles’ helical path in a
magnetic field of strength B which can be re-written
r L _ 2mE (5.11)UsinO'N e
where, for an electron, E is its energy. If one sets r as the maximum possible
radius at which the particle can travel then e will be the acceptance angle.
5.3.2 The Interaction Region and Timing System
As pointed out above, particle timing was by means of the "tagging" method. The
primary positron beam is here remoderated by implantation into a set of annealed
W meshes. The energy of the ensuing slow e + beam is determined by the sum of
the potential applied to these meshes and their positron work function (found to
be 2.5 ± 0.5eV by Zafar, 1990). An earthed unnannealed W mesh is employed to
extract the remoderated positrons. The stop signal for the inverted timing
sequence is obtained by the detection of secodary electrons released when
positrons strike the remoderator. The primary e + beam passes through an 8mm
diameter tube in the centre of a pair of micro-channel plates (henceforth referred
to as CEMA1) These Galileo MCP10 48-208 plates are 1mm thick and have an
active diameter of 32.5mm, the central tube passes through a 10mm hole drilled
in each. Their principle of operation is similar to that of the MCP’s described in
section 3.2. This pair of plates was mounted in a machined ceramic holder with
150
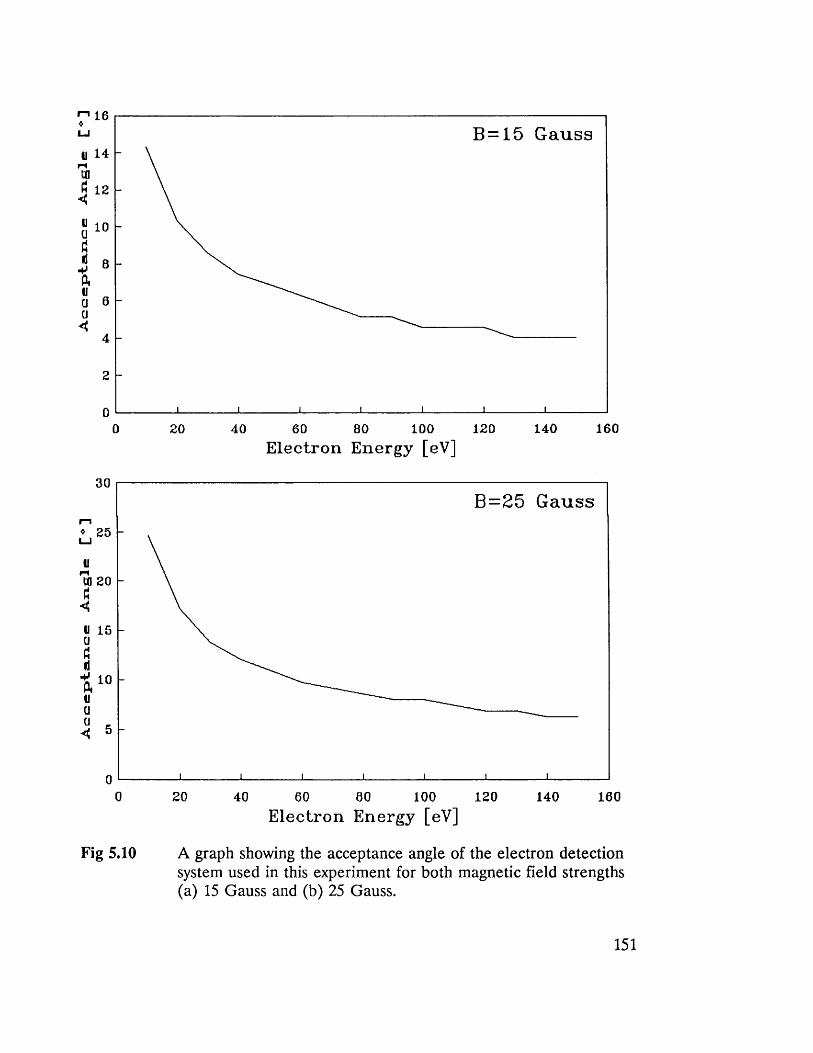
Accep
tan
ce
Angle
£ ° D
Accep
tan
ce
An
gle
14
12
10
8
0
4
2
00 20 40 60 80 100 120 140 160
E le c tr o n E n erg y [eV]
30
25
20
15
10
5
00 20 40 60 80 100 120 140 160
Electron Energy [eV]
Fig 5.10 A graph showing the acceptance angle of the electron detection system used in this experiment for both magnetic field strengths (a) 15 Gauss and (b) 25 Gauss.
B=25 Gauss
J____________ I____________ I____________ 1____________ I____________ L
B = 15 Gauss
J____________ I____________ I____________ I____________ I____________ I____________ L
151
<
to
E l
£ £ P *6
o o>(X p<
13
1 3C3O
13
1 3
CX CL,
rsCQO
I—
13
3
3
ao • OX)<Dt-iCO • '♦—» CJcdV-ia)■t—>
<u
o6cdOX)cd
• t~4XJo
•Wcde<uj=:o(/3
tnOX)£
152
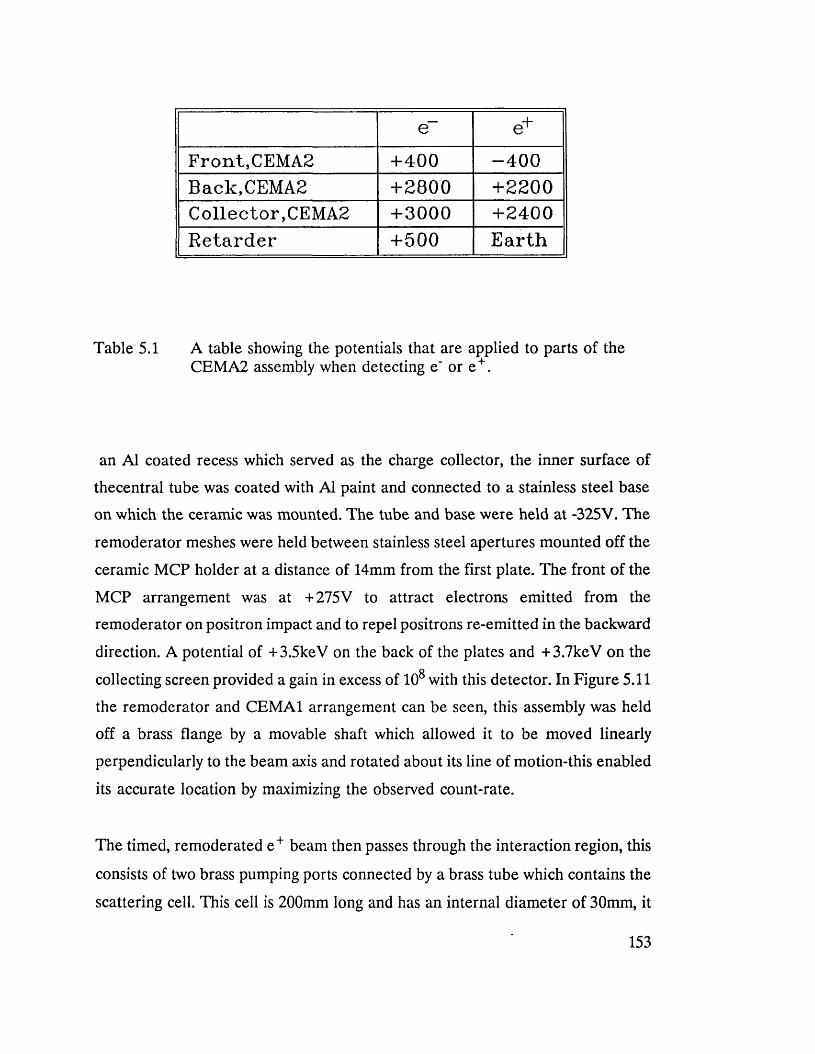
e e+Front,CEMA2 +400 -4 0 0Back,CEMA2 +2800 +2200Collector, CEMA2 +3000 +2400R e ta rd e r +500 E a r th
Table 5.1 A table showing the potentials that are applied to parts of the CEMA2 assembly when detecting e' or e +.
an A1 coated recess which served as the charge collector, the inner surface of
thecentral tube was coated with A1 paint and connected to a stainless steel base
on which the ceramic was mounted. The tube and base were held at -325V. The
remoderator meshes were held between stainless steel apertures mounted off the
ceramic MCP holder at a distance of 14mm from the first plate. The front of the
MCP arrangement was at +275V to attract electrons emitted from the
remoderator on positron impact and to repel positrons re-emitted in the backward
direction. A potential of +3.5keV on the back of the plates and + 3.7keV on the
collecting screen provided a gain in excess of 108 with this detector. In Figure 5.11
the remoderator and CEMA1 arrangement can be seen, this assembly was held
off a brass flange by a movable shaft which allowed it to be moved linearly
perpendicularly to the beam axis and rotated about its line of motion-this enabled
its accurate location by maximizing the observed count-rate.
The timed, remoderated e + beam then passes through the interaction region, this
consists of two brass pumping ports connected by a brass tube which contains the
scattering cell. This cell is 200mm long and has an internal diameter of 30mm, it
153
is held on the axis of the beam by two V4" Cu pipes screwed into the body of the
cell and soldered onto the external brass tube. Gas is admitted into the cell via
one of these tubes, its flow being controlled with an Edwards LV5 leak valve and
the pressure being monitored with an MKS 220-1 Baratron capacitance
manometer attached to the other tube. To reduce the conductance of the
entrance and exit apertures of the cell and thus maintain a fairly high number
density of gas atoms within the cell, two cylindrical brass tubes of diameter 7mm
and length 11.8mm were placed at the apertures. This region of the vacuum
system was evacuated with Edwards E04 diffusion pumps backed with Edwards
ED250 rotary pumps attached to both pumping ports. The interaction region is
shown schematically in Figure 5.11. Charged particles emanating from the gas cell,
be they scattered positrons or electrons ejected in ionizing collisions, are confined
by the axial magnetic field and travel towards another MCP detector (CEMA2)
placed 0.3826m from the centre of the cell. CEMA2 consisted of three Varian
VUW8926 MCP’s of 25mm active diameter, again their operation is fully
described in section 3.2. An arrangement of three W grids placed in front of these
plates was incorporated, following Zafar (1990), to electrostatically retard
unwanted particles and prevent them reaching the detector and to return to the
detector secondary electrons released by particles incident on a non-active part
of the plate surface (e.g. between channels) thus increasing the detection
efficiency. This was achieved by earthing the front grid, applying to the second
grid a potential sufficient and of the correct polarity to retard those particles that
are not required for detection and applying to the third grid -520V. The plate
potentials for positron or electron detection are shown in Table 5.1. The grids
were mounted directly on the CEMA2 assembly which itself was attached to a
linear shaft mounted on a brass flange.
The timing sequence employed was inverted in that the start signal was taken as
the output pulse of CEMA2 with the stop signal being the delayed output pulse
of CEMA1. This system was used because the higher count rate of CEMA1
(~104) compared to CEMA2 (<102) could lead to pulses from CEMA2 being lost
due to the dead time of the Time to Amplitude Converter. A block diagram of
154
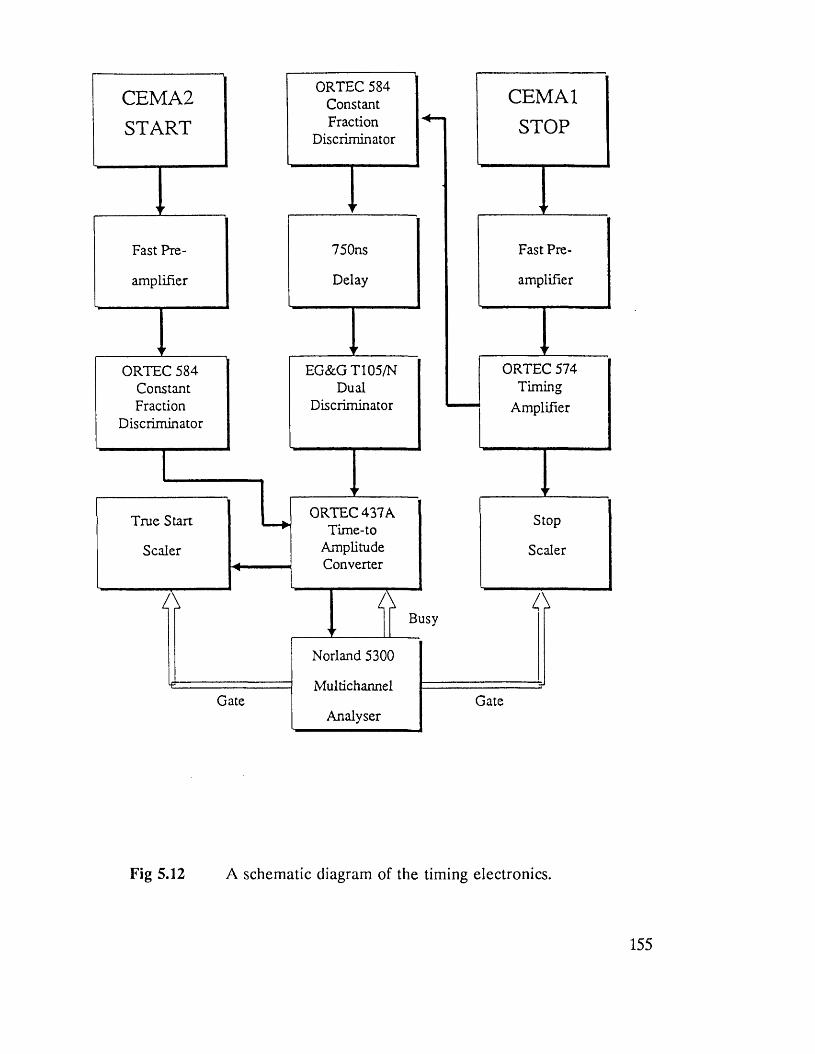
Busy
Gate Gate
ORTEC 4 3 7 A. Time-to
Amplitude Converter
Norland 5300
Multichannel
Analyser
Scaler
Stop
amplifier
Fast Pre-750ns
Delay
EG & G T105/NDual
Discriminator
ORTEC 574 Timing
Amplifier
ORTEC 584 Constant Fraction
Discriminator
True Start
Scaler
CEMAlSTOP
amplifier
Fast Pre-
ORTEC 584 Constant Fraction
Discriminator
CEMA2START
Fig 5.12 A schematic diagram of the timing electronics.
the timing electronics is given in Figure 5.12.
5.3.3 Experimental Procedure
Measurements were made over a positron energy range of 10-150 eV and at two
magnetic field strengths 15 Gauss and 25 Gauss. At each energy the same
procedure of beam optimization, experimental runs and beam checking was
carried out. Beam optimization was done, with suitable potentials on CEMA2, by
adjusting the positions of the Helmholtz coils so that the count-rate of timed
positrons going into a peak on their time-of-flight spectrum was at its maximum.
The potentials on CEMA2 were then changed so that electrons could be
observed. As has been stated, one of the main sources of uncertainty in this
experiment is the exact origin of the electrons that are detected - some will be
produced in the impact ionization of Ar by positrons but many will arise from
positron impact on metal surfaces in the interaction region. To eradicate this
problem as well as accounting for any remnants of the primary or remoderated
positron beam being detectable two experimental runs were made at each energy
- one with gas in the scattering cell and one without. Random coincidences
produced an uniform background in each spectrum which was acsertained by
averaging over 50 channels in a flat part of the spectrum, this was then subtracted
from the signal in each channel. Channel numbers were converted to times-of-
flight using values for the time-per-channel (1.15ns) and the zero time channel
(number 689) that were previously determined for the same system by Zafar
(1990). The time-of-flight spectrum obtained in the vacuum run was then
subtracted from that obtained in the gas run to get an ejected electron time-of-
flight spectrum. Examples of the spectra obtained in this way are shown in Fig
5.11 for both magnetic field strengths used, these will be discussed in more detail
in the following section.
5.4.4 Results and Discussion
The time-of-flight spectra obtained by the method described above all exhibited
156
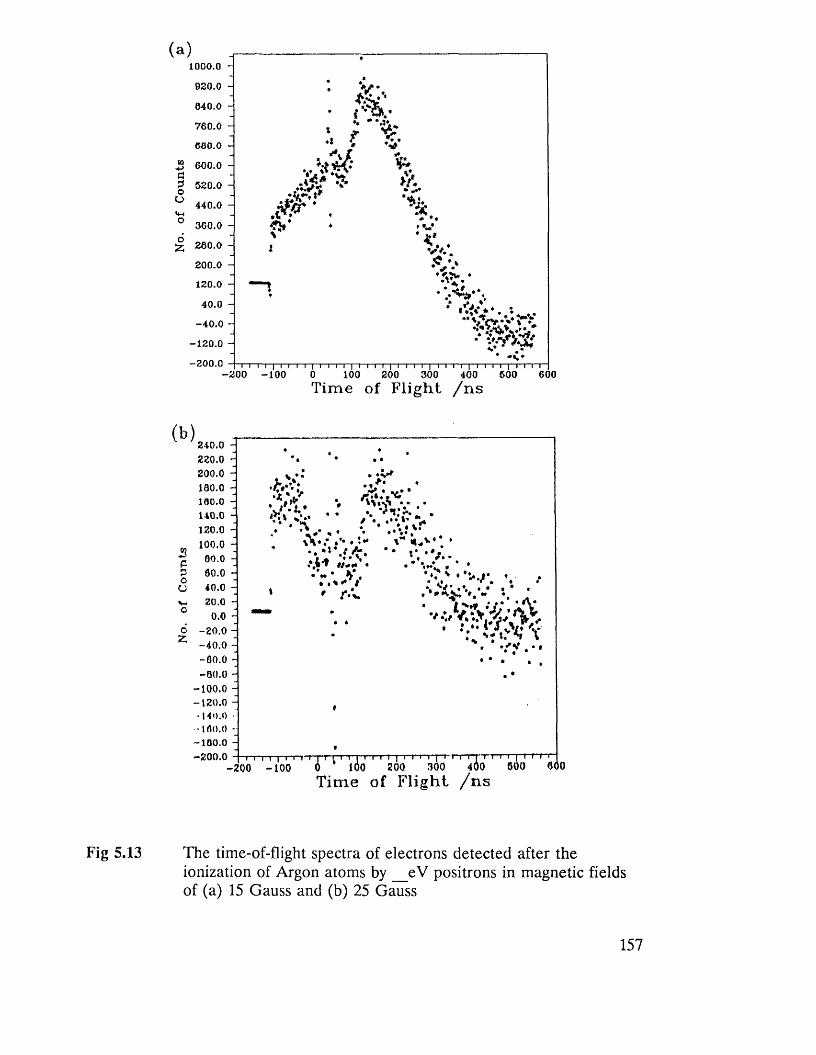
1000.0
920.0 -
840.0 -
760.0 -
680.0 -
n- 600.0 -+->Pi3©O
520.0 -
440.0 -VhO 360.0 -
£ 280.0 -
200.0 -
120 .0 -
40.0 -
-4 0 .0 -
- 120.0 -
- 200 .0-2 0 0 -1 0 0 600100 300 400 500200
Tim e of F lig h t / n s
(b )210.0 220.0 200.0 180.0 lao.o140.0120.0 100.0
00.0 60.040.020.0
0.0- 20.0 -
-4 0 .0 - -00.0 - -8 0 .0 -
-100.0 - 120.0 -
• 140.0 •100.0 - -180.0 H - 200.0
*A,VV -t*
*
’A 1-* '
% .O w V .t*
•v* v .* r-v.
1 *0 * * • / • ••• 1* w*. • * ir
‘ i v y -
...* V t. ** 4
I I I i t t i I t 11 ~i" i " I i i i T-f r i T ' r p I " I T T T 1 i r | - T - r - r - T-1 0 0 0 100 200 300 400 000 (000
T im e o f F l ig h t / n s
Fig 5.13 The time-of-flight spectra of electrons detected after theionization of Argon atoms b y eV positrons in magnetic fieldsof (a) 15 Gauss and (b) 25 Gauss
157
peaks similar to those in Figure 5.11. The peak at negative time in Figure 5.11 (a)
is due to the coincidental detection of electrons by CEMA2 and electrons
liberated at CEMA2 travelling down the flight tube to CEMA1. The structure
which shows a sharp maximum and a sharp minimum adjacent to each other at
a small positive time are as a result of incorrect matching of the zero time
channels of the vacuum and gas spectra resulting in the peaks for energetic
positrons in the two spectra not cancelling out exactly. It can be seen from the
spectra that negative values are obtained at long flight times - this is because,
when gas is present, many slow electrons will scatter off the atoms at angles
greater than the acceptance angle of the system and will thus not be detected.
Since these electrons will be unscattered in the vacuum run they will appear at
their proper times-of-flight therefore on subtraction of the spectra negative values
will be obtained.
The broad peak at a larger positive time is taken to be that due to electrons
originating in the ionizing collisions of positrons on Ar atoms. This being the case,
one can then deduce the electrons’ time of flight from
r - v + v (5.12)
where T is the measured time of flight, te+ is the time of flight of the positron
from the remoderator to the mid-point of the scattering cell and te_ is the time
of flight an electron ejected on ionization from the mid-point of the scattering cell
to the CEMA2 detector. The positrons’ flight times can be calculated from a
knowledge of their energies’ and distance travelled. Equation (5.11) can then be
written
where le+ is the distance from the remoderator to the mid-point of the scattering
cell and E e+ is the positrons’ energy set with the remoderator. le+ was measured
to be 0.1328m.
Having calculated te_ from equation (5.12) the electrons’ energy can be obtained
from the relation
* 2
(I \2(5.14)
where lc_ is the distance from the mid-point of the scattering cell to the CEMA2
detector and is 0.4296m in this experiment. Thus the energy of electrons which
contribute to the peaks in the time of flight spectra can be determined if one
assumes that the acceptance angle of the detection system is small so that more
energetic electrons which scatter at small angles are not detected with the same
flight time as those travelling on axis. The energy which corresponds to the
position of the peak was then calculated for each spectrum taken. The peak
position was simply taken as the channel with the maximum number of counts.
The error bars assigned to this value were derived by considering the standard
deviation of a number of random counts for a number N) for the peak
number and finding the extreme channels either side whose similarly derived
errors overlap with those of the peak value.
After making the assumptions listed above it can be inferred that these energies
are those of electrons which have been ejected on ionization and travel in the
forward direction (i.e. at 0° to the path of the incident positron). If such electrons
exhibit a high degree of correlation with the scattered positron quantum
calculations predict that they will have the same energy as the positron (see
previous scetion). The energy of each outgoing particle is then given by
159
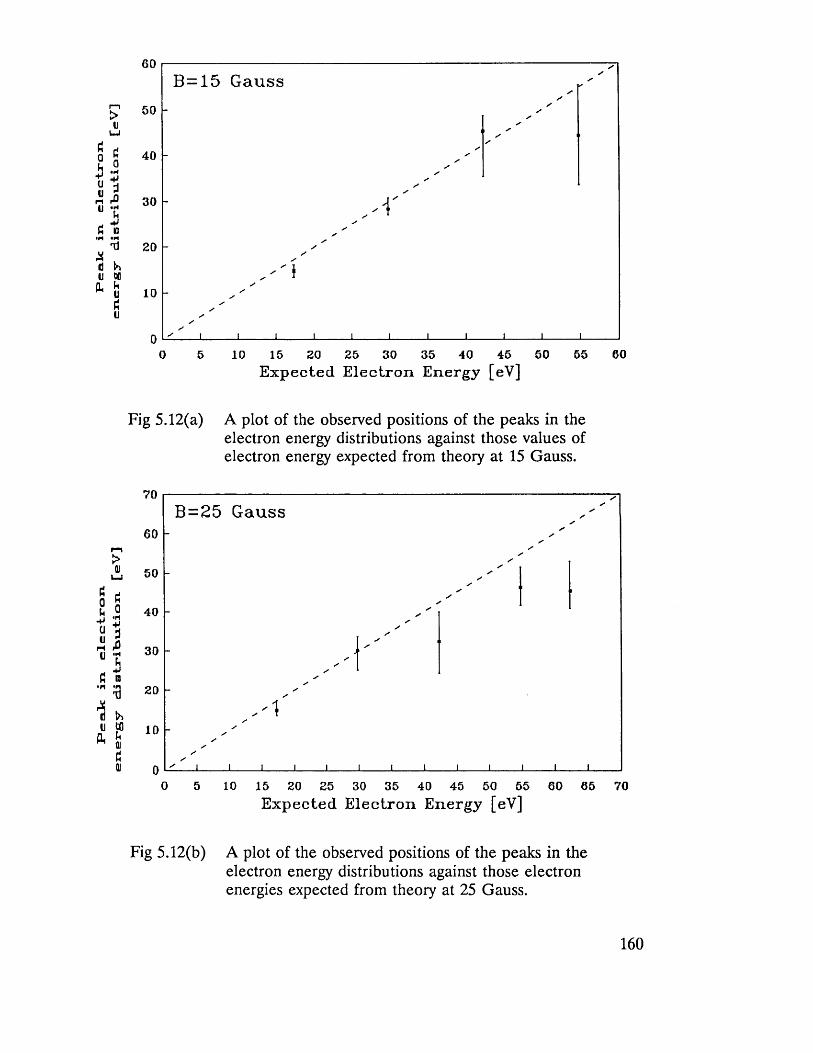
Peak
in ele
ctr
on
Pea
k
in ele
ctro
n
energy
dis
trib
uti
on
[e
V]
energy
d.iotr
i'bu.tio
n
C«=
V]
60B=15 Gauss
50
40
20
10
45 50 55 600 10 15 25 30 35 405 20E xp ected E lec tro n Energy [eV]
Fig 5.12(a) A plot of the observed positions of the peaks in the electron energy distributions against those values of electron energy expected from theory at 15 Gauss.
70B=25 Gauss
60
50
o 5 10 15 20 25 30 35 40 45 50 55 60 65 70E xp ected E lec tro n E nergy [eV]
Fig 5.12(b) A plot of the observed positions of the peaks in the electron energy distributions against those electron energies expected from theory at 25 Gauss.
160
where Ej is the energy required for ionization of the target gas (Ej = 15.4eV for
Ar). This has been calculated for each positron energy and Fig 5.12 shows the
observed position of the peak in the electron energy spectrum plotted against this
expected energy for both magnetic field strengths used. The broken line on each
graph indicates the positions of the points that would be expected from theory.
It can be seen there is slightly better agreement with theoretical predictions for
data taken at 15 Gauss than at 25 Gauss. The data taken at the higher field
strengths tends to fall below the line but this can be understood if one considers
the generally larger acceptance angle at the higher field. This would result in the
collection of more electrons which are travelling near to but not on axis. Their
longer flight path would lead to their having longer flight times-they would then
appear to have less energy than expected even if they did have this energy.
Given the sources of error inherent in this experiment and the reusultingly large
error bars in the graphs in Figure 5.12 one cannot make any quantitative
conclusions about the post-collision dynamics of the system under study. The
broad agreement of the experimentally determined electron energies with the
theoretically predicted data does however suggest that the number of electrons
ejected with energies characteristic of those captured into continuum states is not
negligible. Some enhancement of the doubly differential cross-section for electron
ejection in positron-Ar ionization might therefore be expected at these energies.
This preliminary work therefore lends some support to the premisses of the
quantum calculations which emphasise the importance of the Coulomb interaction
between the ejected electron and the scattered positron.
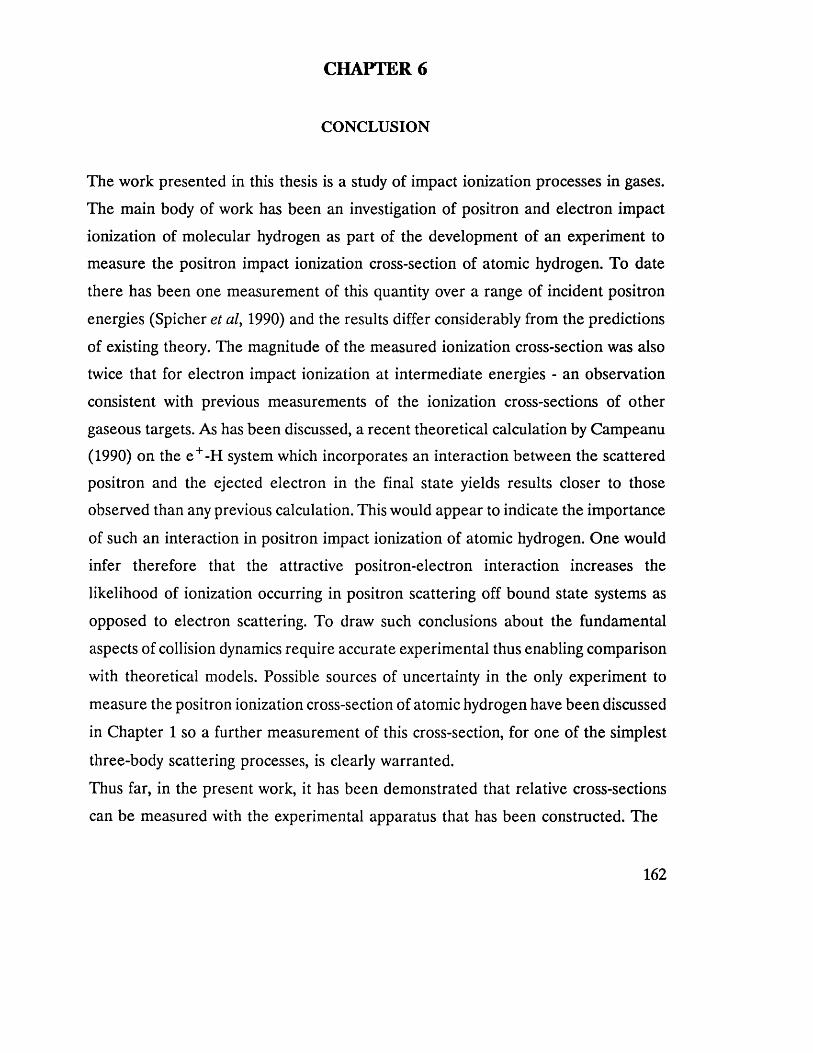
CHAPTER 6
CONCLUSION
The work presented in this thesis is a study of impact ionization processes in gases.
The main body of work has been an investigation of positron and electron impact
ionization of molecular hydrogen as part of the development of an experiment to
measure the positron impact ionization cross-section of atomic hydrogen. To date
there has been one measurement of this quantity over a range of incident positron
energies (Spicher et al, 1990) and the results differ considerably from the predictions
of existing theory. The magnitude of the measured ionization cross-section was also
twice that for electron impact ionization at intermediate energies - an observation
consistent with previous measurements of the ionization cross-sections of other
gaseous targets. As has been discussed, a recent theoretical calculation by Campeanu
(1990) on the e +-H system which incorporates an interaction between the scattered
positron and the ejected electron in the final state yields results closer to those
observed than any previous calculation. This would appear to indicate the importance
of such an interaction in positron impact ionization of atomic hydrogen. One would
infer therefore that the attractive positron-electron interaction increases the
likelihood of ionization occurring in positron scattering off bound state systems as
opposed to electron scattering. To draw such conclusions about the fundamental
aspects of collision dynamics require accurate experimental thus enabling comparison
with theoretical models. Possible sources of uncertainty in the only experiment to
measure the positron ionization cross-section of atomic hydrogen have been discussed
in Chapter 1 so a further measurement of this cross-section, for one of the simplest
three-body scattering processes, is clearly warranted.
Thus far, in the present work, it has been demonstrated that relative cross-sections
can be measured with the experimental apparatus that has been constructed. The
162
2
1.5CM OCJ3
o<J■ajoytO
0 . 5
. J - H
I I I I I I I L J I I I I I L
10 100E nergy [eV]
1000
Fig 6.1 Curves drawn through the relative positron (-----) and electron(—) ionization cross-sections of H2 measured in this experiment to illustrate comparisons made in the text.
ionization cross-sections of positrons and electrons incident on molecular hydrogen
have been measured and are in agreement with the results of the experiments of
Fromme et al (1988) and Knudsen et al (1990) for positrons and Rapp and
Englander-Golden (1965) for electrons, the latter having been corrected for
dissociative ionization. Their observations are consistent with the present data as
illustrated in Figure 6.1 which shows curves drawn through the data points obtained
in this experiment for both electrons and positrons. At intermediate energies the
positron ionization cross-section exceeds that for electrons; several contributory
effects have been postulated to explain this. These include the reduction of the
electron cross-section due to the possibility of exchange as was demonstrated by
Peterkop (1962); polarization of the target charge cloud which can increase the
positron cross-section and decrease the electron cross-section and, finally, saddle-
163
point ionization which can only occur for positive particles and has been predicted
for protons (Pieksma et al, 1991) and would serve to increase the positron ionization
cross-section should it occur. Within about lOeV of the ionization threshold the
opposite case occurs and the electron ionization cross-section exceeds that for
positrons, this is an energy range where the positronium formation cross-section is
still significant so this process will compete with ionization for positrons with the
possible consequence of a reduction in the ionization cross-section. At high energies
(greater than about 600eV) the cross-sections are seen to merge as expected from
the Born approximation (see section 2.3.1.1).
Preliminary studies with the atomic hydrogen source in operation have revealed
several unforeseen difficulties arising from its use, these have included photons,
electrons and protons being emitted from the discharge tube in fluxes sufficient to
make it impossible to detect H + ions. Coating the inside of the system with a non-
reflective substance (soot) and using electrostatic fields to prevent the charged
particles from being detected has allowed protons created on positron impact to be
detected. The next investigation that will be made with this apparatus is of the energy
dependence of the yield of H + ions (as defined in section 4.2.1) using an electron
beam. This can then be compared with the well-known electron impact ionization
cross-section of atomic hydrogen as a further test on the suitability of this
experimental arrangement to determine the positron ionization cross-section. If, as
anticipated, no insoluble systematic sources of error are discovered then the positron
impact ionization cross-section of atomic hydrogen can be measured.
In the second part of this work another ionization process was studied - electron
capture to the continuum (ECC). This is complementary to the other experimental
work as its presence indicates a high degree of correlation between the scattered
positron and ejected electron, which is thought to be the case in positron-atomic
hydrogen ionization (Campeanu, 1990). The experimental work involved studying the
energy distributions of electrons ejected in positron impact ionization of Argon, the
164
distributions being derived from the electrons’ time-of-flight spectra. Electrons which
are captured to the continuum states of projectiles will have identical velocity vectors
to the projectile and, in the case of positron scattering, each outgoing particle will
share equally the residual kinetic of the projectile after ionization. The energy
distributions of these electrons are therefore indicative of the extent of ECC. Given
the uncertainty surrounding the origin, and therefore energy, of many detected
electrons, conclusions drawn from the results of this experiment can at best be
tentative. It is certain however that a large number of electrons have velocities close
to that expected for those which are in continuum states of the scattered positron.
This does imply that ECC is a process which occurs to some extent in positron
ionization but to what degree, which is the contentious issue that has arisen from
different methods of calculation, is difficult is assess. This is because of the ambiguity
surrounding the cause of the peaks being quite broad around the expected velocities
in the time-of-flight spectra. The peaks are broadened in this manner either because
they reflect a broad structure in the energy dependence of the doubly differential
cross-section (as predicted by Schultz and Reinhold’s CTMC calculation, 1989) or are
due to the detection of equivelocity electrons emitted over a wide range of angles
because of the finite magnetic field present. This therefore does not rule out the
possibility that the recent calculation of Sil et al (1991), which predicts cusps in
energy in the doubly differential cross-section at all energies, is accurate. Recent
results from a modified form of the same apparatus (Moxom et al, 1991) which
support the classical results are not entirely free of this ambiguity either and a
proposed study of this process with an electrostatic system (Kover, 1991) is awaited
to resolve this.
Both pieces of experimental work discussed in this thesis therefore study the post
collision dynamics of the outgoing particles in positron impact ionization. The
experiment with atomic hydrogen, which appears to be nearing completion, will give
an indication of the degree of correlation between the scattered positron and ejected
electron in positron impact ionization of atomic hydrogen - one of the most
165
fundamental collision systems. These results may then give an indication of the
significance of ECC in positron impact ionization of heavier atoms, as was studied
in the second experiment.
166
REFERENCES
Abrines R and Percival I C (1966a) Proc Phys Soc 88, 861
(1966b) Proc Phys soc 88, 873
Adachi S, Chiba M, Hirose T, Nagayama S, Nakamitsu Y, Sato T and Yamada T,
(1990) Phys Rev A65, 2634
Amusia M Ya, Cherepkov N A, Chernysheva L V and Shapiro S G, (1976) J Phys B
9, L531
Andersen L H, Hvelplund P, Knudsen H, Moller S P, Elsener K, Rensfelt K G and
Uggerhoj E, (1986) Phys Rev Lett 57, 2147
Andersen L H, Hvelplund P, Knudsen H, Mpller S P, Sprensen A H, Elsener K,
Rensfelt K G and Uggerhoj E, (1987) Phys Rev A36, 3612
Andersen L H, Hvelplund P, Knudsen H, Moller S P, Pedersen J O P, Tang-Petersen
S, Uggerhoj E, Elsener K and Morenzoni E, (1990) Phys Rev A71, 6536
Anderson C D, (1932) Phys Rev 41, 405
Andrikoupoulos K, Avdi E and Laricchia G, (1991) Private Communication
Basu M, Mazumdar P S and Ghosh A S, (1985) J Phys B 18, 369
Basu M and Ghosh A S, (1988) J Phys B 21, 3439
Bethe H A, (1930) Ann Physik 5, 325
Bhatia A K, Temkin A, Drachman R J and Eiserike H, (1971) Phys Rev A3, 1328
Bhatia A K, Temkin A and Eiserike H, (1974) Phys Rev A9, 219
Blackett P M S and Occhialini G P S , (1933) Proc Roy Soc A139, 699
Bom M, (1926) Z fur Physik 38, 803
Boyd R L F and Boksenberg A, (1961) in "Proceedings o f the Fourth International
Conference on Ionization Phenomena in Gases" (North Holland, 1960) p.253
Boyd R L F and Green G W, (1958) Proc Phys Soc 71, 351
Brandes G R, Canter K F, Horsky T N, Lippel P H and Mills A P, (1988) Rev Sci
Instrum 59, 228
Brandes G R, Mills A P and Zuckerman D M, (1991) in "Book of Abstracts, 9th
International Conference on Positron Anninilation", p.K5
Bransden B H and Joachain C J, (1983) "Physics of Atoms and Molecules"
Bransden B H, McCarthy I E and Stelbovics A T, (1985) J Phys B 18 823
166
Brauner M and Briggs J S, (1986) J Phys B 19, L325
Brown C J and Humberston J W, (1985) J Phys B 18, L401
Bran-Nielsen L, (1990) Masters Thesis, Aarhus University
Brunings J, (1934) Physica 1, 996
Burke P G and Taylor A J, (1965) Proc Roy Soc A287, 105
Byron F W, (1978) Phys Rev A17, 170
Byron F W, Joachain C J and Potvliege R M, (1981) J Phys B 14, L609
(1985) J Phys B 18, 1637
Campeanu R I, (1990) Private Communication
Campeanu R I, Fromme D, Kruse G, McEachran R P, Parcell L A, Raith W,
Sinapius G and Stauffer A D, (1987a) J Phys B 20, 3557
Campeanu R I, McEachran R P and Stauffer A D, (1987b) J Phys B 20, 1635
Canter K F, Coleman P G, Griffith T C and Heyland G R, (1972) J Phys B 5, L167
Caswell W E and Lepage G P, (1979) Phys Rev A20, 36
Charlton M, (1985) Rep Prog Phys 48, 737
(1989) in "Positron Annihilation" (World Scientific, 1989) eds Dorikens-
Vanpraet L, Dorikens M and Segers D, pl81
(1990) Physica Scripta 42, 464
Charlton M, Clark G, Griffith T C and Heyland G R, (1983) J Phys B 16, L465
Charlton M, Griffith T C, Heyland G R and Twomey T R, (1980) J Phys B 13, L239
Charlton M, Laricchia G, Zafar N and Jacobsen F M, (1987) in "Atomic Physics with
Positrons" eds Humberston J W and Armour E A G (Plenum, 1987) p. 15
Charlton M, Andersen L H, Bran-Nielsen L, Deutch B I, Hvelplund P, Jacobsen F M,
Knudsen H, Laricchia G, Poulsen M R and Pedersen J O, (1988) J Phys B 21, L545
Charlton M, Bran-Nielsen L, Deutch B I, Hvelplund P, Jacobsen F M, Knudsen K,
Laricchia G and Poulsen M R, (1989) J Phys B 22, 2779
Chen D M, Lynn K G, Pareja R and Nielsen B, (1985) Phys Rev B31, 4123
Cherry W, (1958) PhD Thesis, Princeton University
Coleman P G, (1986) in "Proceedings of the 3rd International Workshop on Positron
(Electron)-Gas Scattering (World Scientific, 1986) eds Kauppila W E, Stein T
S and Wadehra J M, p.25
Coleman P G and Hutton J T, (1980) Phys Rev Lett 45, 2017
167
Coleman P G, McNutt J D, Diana L M and Burciaga J R, (1979) Phys Rev A20, 145
Coleman P G, Hutton J T, Cook D R and Chandler C A, (1982) Can J Phys 60, 584
Coleman P G and McNutt J D, (1979) Phys Rev Lett 42, 1130
Costello D G, Groce D E, Herring D F and McGowan J W,
(1972a) Phys Rev B5, 1433
(1972b) Can J Phys 50, 23
Dahl D A and Delmore J E, (1988) "The SIMION PC/PS2 User’s Manual" (Idaho
National Engineering Laboratory, 1988)
Dale J M, Hulett L D and Pendyala S, (1980) Surf Int Anal 2, 199
Dalgamo A and Lynn N, (1958) Proc Phys Soc 223, 223
de Heer F J and Inokuti M, (1982) in "Electron Impact Ionization" eds Mark T D d
Dunn G H, (Springer-Verlag, 1982) p.232
Deutsch M, (1951) Phys Rev 82, 455
Dewangan D P and Walters H R J, (1977) J Phys B, 10, 637
Diana L M, Fomari L S, Sharma S C, Pendleton P K and Coleman P G, (1985a) in
"Positron Annihilation" (World Scientific, 1985) eds Jain P C, Singru R M d
Gopinathan K P, p 342
Diana L M, Sharma S C, Fomari L S, Coleman P G, Pendleton P K, Brooks D L and
Seay B E, (1985b) in "Positron Annihilation" (World Scientific, 1985) eds h
P C, Singru R M and Gopinathan K P, p 428
Diana L M, Chaplin R L, Brooks D L, Coleman P G and Howell J P, (1989) in
"Positron Annihilation" (World Scientific, 1989) eds Dorikens-Vanpraet L,
Dorikens M and Segers D, p308
Ding A, Karlan J and Weise J, (1977) Rev Sci Instrum 48, 1002
Dirac P A M , (1930a) Proc Roy Soc A126, 360
(1930b) Proc Camb Phil Soc 26, 361
Donnelly A, (1991) Private Communication
Drachman R J, (1966) Phys Rev 144, 25
Drachman R J, Omidvar K and McGuire J H, (1976) Phys Rev A14, 100
Faddeev L D, (1961) Zh Eksperim i Teor Fiz, 39, 1459
Fite W L and Brackmann R T, (1958) Phys Rev 112, 1141
Fock V, (1935) Z Physik 98, 145
168
Fomari L S, Diana L M and Coleman P G, (1983) Phys Rev Lett 51, 2276
Frieze W E, Gidley D W and Lynn K G, (1985) Phys Rev B31, 5628
Fromme D, Kruse G, Raith W and Sinapius G, (1986) Phys Rev Lett 57, 3031
Fromme D, Kruse G, Raith W and Sinapius G, (1988) J Phys B 21, L261
Fulton T and Martin P C, (1954) Phys Rev 95, 811
Funk H, (1930) Ann Physik 4, 149
Gailitis M, (1965) Sov Phys JETP 20, 107
Geltman S and Hidalgo M B, (1974) J Phys B 7, 831
Ghosh A S, Majumdar P S and Basu M, (1985) Can J Phys 63, 621
Gidley D W, Rich A, Sweetman E and West D, (1982) Phys Rev Lett 49, 525
Gien T T, (1977) Phys Rev A16, 1736
Glauber R J, (1959) Lee Notes in Th Phys 1, 315
Golden J E and McGuire J H, (1974) Phys Rev Lett 32, 1218
Griffith T C and Heyland G R, (1978) Phys Rep 39C, 169
Griffith T C, Heyland G R, Lines K S and Twomey T R, (1979) App Phys 19, 431
Griffith T C and Heyland G R, (1978) Phys Rep 39C, 169
Groce D E, Costello D G, McGowan J W and Herring W F, (1968) Bull Am Phys Soc
13, 1397
Gryzinski M, (1959) Phys Rev 115, 374
(1965) Phys Rev A138, 305
Gullikson E M and Mills A P, (1986) Phys Rev Lett 57, 376
Gullikson E M, Mills A P, Crane W S and Brown B L, (1985) Phys Rev B32, 5484
Harris I and Brown L, (1957) Phys Rev 105, 1656
Halting E and Read F H, (1976) "Electrostatic Lenses" (Elsevier Scientific
Publishing, 1976) p.A 1.7 j
Haugen H K, Andersen L H, Hvelplund P and Knudsen H, (1982) Phys Rev A26,
1962
Higgins K, Burke P G and Walters H R J, (1990) J Phys B 23, 1345
Higgins K and Burke P G, (1991) in "Abstracts of Contributed Papers, 17th
International Conference on the Physics of Electronic and Atomic Collisions"
eds McCarthy I E, MacGillivray W R and Standage M C, p347
Humberston J W, (1979) in "Advances in Atomic and Molecular Physics" eds Bates
169
DR and Bederson B (Academic Press, New York) 15, 101
Humberston J W, (1984) J Phys B 17, 2353
Humberston J W and Campeanu R I, (1980) J Phys B 13, 4907
Hutchins S M, Coleman P G, Stone R J and West R N, (1986) J Phys E 19, 282
Inokuti M and McDowell M R C, (1974) J Phys B 7, 2382
Jacobs S, (1951) Phys Rev 84, 877
Jacobsen F M, Charlton M, Chevallier J, Deutch B I, Laricchia G and Poulsen M R,
(1990) J App Phys 67, 575
Kauppila W E and Stein T S, (1990) Adv At Mol Phys 26, 1
Kauppila W E, Stein T S, Smart J H, Dababneh M S, Ho Y K, Downing J P and
Pol V, (1981) Phys Rev A21, 725
Kauppila W E, Stein T S and Jeison G, (1976) Phys Rev Lett 36, 580
Khan P and Ghosh A S, (1983) Phys Rev A28, 2181
Khan P, Mazumdar P S and Ghosh A S, (1985) Phys Rev A31, 1405
Kieffer L J and Dunn G H, (1966) Rev Mod Phys 38, 1
Kingston A E, (1964) Phys Rev A135, 1537
Kover A, (1991) in "Book of Abstracts, 9th International Conference on Positron
Annihilation", p.E24 '
Knudsen H, Andersen L H and Jensen K E, (1986) J Phys B 19, 3341
Knudsen H, Brun-Nielsen L, Charlton M and Poulsen M R, (1990) J Phys B 23, 3955
Landau L D and Lifshitz E M, (1959) "Statistical Physics", (Pergamon Press, 1959)
p . l l
Lang N D and Kohn W, (1971) Phys Rev B3, 1215
Laricchia G, Davies S A, Charlton M and Griffith T C, (1988) J Phys E 21, 886
Laricchia G, Charlton M, Davies S A, Beling C D and Griffith T C, (1987) J Phys B
20, L99
Lynn K G, (1980) Unpublished, taken from Schultz and Lynn, 1988
Lynn K G, Nielsen B and Quateman J H, (1985) Appl Phys Lett 47, 239
MacAlpine W W and Schildknecht R O, (1959) Proc I R E , Dec 1959, 2099
Macek J M, (1970) Phys Rev A l, 235
Madansky L and Rasetti F, (1950) Phys Rev 79, 397
Madey J M J, (1969) Phys Rev Lett 22, 784
170
Makowski A J, Raczynski A and Staszewska G, (1986) J Phys b 19, 3367
Mandal P and Guha S, (1979) J Phys B 12, 1603
Mandal P, Guha S and Sil N C, (1979) J Phys B 12, 2913
Mandal P, Roy K and Sil N C, (1985) in "Positron Annihilation" eds Jain P C, Sgp
R M and Gopinathan K P (World Scientific, 1985) p.395
(1986) Phys Rev A33, 756
Mandal P, Guha S and Sil N C, (1979) J Phys B 12, 2913
Mapleton R A, (1966) Proc Phys Soc 87, 219
Massey H S W and Mohr C B O, (1933) Proc Roy soc A140, 613
Massey H S W and Burhop E H S, (1938) Proc Roy soc A167, 53
McCarroll R, (1957) Proc Phys Soc A70, 460
McEachran R P, Morgan D L, Ryman A G and Stauffer A D, (1977) J Phys B 10,
663
McGuire J H, Hidalgo M B, Doolen G D and Nuttall J, (1973) Phys Rev A7, 973
Mills A P, (1980) App Phys 23, 189
Mills A P, Platzman P M and Brown B L, (1978) Phys Rev Lett 41, 1076
Mizogawa T, Nakayama Y, Kawaratani T and Tosaki M, (1985) Phys Rev A31, 593
Mohorovicic S, (1934) Astron Nachr 235, 94
Moliere G, (1947) Z fur Naturforschung 2A, 133
Morgan L A, (1982) J Phys B 15, L25
Mori S and Sueoka O, (1984) At Col Res Jpn 12, 8
Mott N F and Massey H S W, (1965) "The Theory of Atomic Collisions" 3rd ed.,
p.380
Moxom J, Jones G O, Kov6r A, Laricchia G and Charlton M, (1991) in "Abstracts of
Contributed Papers, 17th International Conference on the Physics of Electronic
and Atomic Collisions" eds McCarthy I E, MacGillivray W R and Standage
M C, p330
Mukherjee K K, Ranjit Singh N and Mazumdar P S, (1989) J Phys B 22, 99
Murray C A and Mills A P, (1980) Solid State Comm 34, 789
Nico J S, Gidley D W, Skalsey M and Zitzewitz P W, (1991) in "Book of Abstracts,
9th International Conference on Positron Anninilation", p.I32
O’Malley T F, Spruch L and Rosenberg L, (1961) J Math Phys 2, 491
171
Ohsaki A, Watanabe T, Nakanishi K and Iguchi K, (1985) Phys Rev A32, 2640
Oldham W J, (1967) Phys Rev 161, 1
Olson R E and Salop A, (1977) Phys Rev A16, 531
Omidvar K, (1965) Phys Rev 140, A26
Ore A and Powell J L, (1949) Phys Rev 75, 1696
Parcell L A, McEachran R P and Stauffer A D, (1983) J Phys B 16, 4249
(1987) J Phys B 20, 2307
Peach G and McDowell M R C, (1983) Unpublished
Pendyala S, Bartell D, Girouard F E and McGowan J W, (1976) Can J Phys 54, W
Percival I C and Valentine N, (1967) in "Abstracts of the Fifth International
Conference on the Physics of Electronic and Atomic Collisions, Leningrad eds
Flaks IP and Solovyov E S, p. 121
Peterkop R K, (1961) Proc Phys Soc 77, 1220
(1962) Sov Phys JETP 14, 1377
Poth H, (1989) Comments At Mol Phys 22, 211
Rapp D and Englander-Golden P, (1965) J ChemPhys 43, 1464
Rapp D, Englander-Golden P and Briglia D D, (1965) J Chem Phys 42, 4081
Reinhold C O and Olson R E, (1989) Phys Rev A39, 3861
Rodbro M and Andersen F D, (1979) J Phys B 12, 2883
Rothe E W, Marino L L, Neynaber R H and Trujillo S M, (1962) Phys Rev 125, 582
Rudd M E and Macek J H, (1972) Case Studies in Atom Phys 3, 47
Rudd M E, Sautter C A and Bailey C L, (1966) Phys Rev 151, 20
Rudge M R H and Seaton M J, (1964) Proc Phys Soc A283, 262
Rudge M R H, (1968) Rev Mod Phys 40, 564
Schrader D M, (1979) Phys Rev A20, 918
Schultz D R and Olson R E, (1988) Phys Rev A38, 1866
Schultz P J and Lynn K G, (1988) Rev Mod Phys 60, 701
Schultz D R and Reinhold C O, (1990) J Phys B 23, L9
Schultz D R, Olson R E and Reinhold C O, (1991) J Phys B 24, 521
Shah M B, Elliott D S and Gilbody H B, (1987) J Phys B 20, 3501
Shakeshaft R and Wadehra J M, (1980) Phys Rev A22, 968
Sil N C, Roy K and Mandal P, (1991) in "Abstracts of Contributed Papers, 17th
172
International Conference on the Physics of Electronic and Atomic Collisions"
eds McCarthy I E, MacGillivray W R and Standage M C, p354
Sinapius G, Raith W and Wilson W G (1980) J Phys B 13, 4079
Slevin J A and Stirling W, (1981) Rev Sci Inst 52, 1780
Sommerfeld (1931) Ann der Physik 11, 257
Spicher G, Olsson B, Raith W, Sinapius G and Sperber W, (1990) Phys Rev Lett 64,
1019
Srivastava R, Katiyar A K and Khurana I, (1987) J Phys B 20, 1853
Stabler R C, (1964) Phys Rev A133, 1268
Stein T S, Kauppila W E, Pol V, Smart J H and Jeison G, (1978) Phys Rev A17, 0
Stein T S, Kauppila W E and Roellig L O, (1974) Rev Sci Inst 45, 951
Sueoka O, (1989) Private Communication
(1982) J Phys Soc Jpn 51, 3757
Tate J T and Smith P T, (1932) Phys Rev 39, 270
Temkin A and Lamkin J C, (1961) Phys Rev 121, 788
Thomson J J, (1912) Phil Mag 23, 449
Tong B Y, (1972) Phys Rev B5, 1436
Tripathi S, Sinha C and Sil N C, (1989) Phys Rev A39, 2924
van House J, Rich A and Zitzewitz P W, (1984) Origins of Life 14, 413
Vehanen A, Lynn K G, Schultz P J and Eldrup M, (1983) App Phys A32, 163
Vehanen A and Makinen J, (1985) App Phys A36, 97
Viennet J, Petit P and Audoin C, (1973) J Phys E 6, 257
Vogt H, Schuch R, Justinianio E, Schulz M and Schwab W, (1987) Phys Rev Lett 57,
2256
Wadehra J M, Stein T S and Kauppila W E, (1981) J Phys B 14, L783
Walters H R J, (1988) J Phys B 21, 1893
Watkin S, (1985) PhD Thesis, Stirling University
Westbrook C I, Gidley D W, Conti R S and Rich A, (1987) Phys Rev Lett 58, 1328
Wetmore A E and Olson R E, (1986) Phys Rev A34, 2822
Weyl H, (1931) "Gruppentheorie und Quantenmechanik" 2nd ed., p234
Wheeler J A, (1946) Ann N Y Acad Sci 48, 219
Wicke E and Brodowsky H, (1978) in "Hydrogen in Metals II: Application Oriented
173
Properties" (Springer-Verlag, 1978) eds Alefeld G and Volkl J, p l39
Wilson W G, (1978) J Phys B 11, L629
Winick J R and Reinhardt W P, (1978) Phys Rev A18, 925
Wood R W, (1922) Proc Roy Soc A102, 1
Wood B J and Wise H, (1962) J Phys Chem 66, 1049
Yang C N, (1950) Phys Rev 77, 242
Zafar N, (1990) PhD Thesis, University of London
ERRATA
Page 22, Line 16: ’shall’ should be ’will’
Page 32, Line 22: ’without’ should be ’by’
Page 33, Line 7: ’this’ should be ’these’
Page 33, Line 15: ’n’ should be ’p’
Page 38, Line 16: ’left’ should be ’right’
Page 39, Figure 1.8: The legend caption should also include
_ . _ Mandal et al (1979)
Sum of n=l Khan and Ghosh (1983) and n=2 Khan et al (1985)
Roy et al (1984) ,
Page 40, Line 23: ’pardoning* should be ’partitioning’
Page 46, Line 19: ’questin’ should be ’question’
Page 48, Line 15: ’1.15’ should be ’1.16’
Page 57, Line 4: ’1.13’ should be ’1.12’
Page 64, Line 2: ’was’ should be ’were’
Page 64, Line 18: ’shown in Figure 1.29’ should be deleted
Page 77, Line 1: ’Gj+)r,r’)’ should be ’Gj+)(r,r’)
Page 86, Line 1: ’2.2.1’ should be ’2.3.1.1’
Page 86, Line 13: ’%kf’ should be ’Xu
Page 97, Line 16: ’500m’ should be ’500mm’
Page 103, Figure 3.5 (b): Ordinate axis should be labelled ’Pressure (mbar)’
Page 105, Line 5: ’on’ should be ’one’
Page 110, Figure 3.7: ’OHFC’ should be ’OFHC’
Page 114, Line 5: ’approxiametaly’ should be ’approximately’
Page 114, Line 23: ’scalar’ should be ’scaler’
Page 115: ’3.9’ should be ’3.10’
Page 116: ’3.10’ should be ’3.11’
Page 118, Line 16: ’spectrum’ should be ’spectra’
Page 119, Line 3: ’H2’ should be ’H2 spectrum’
Page 122, Line 15: ’3.8’ should be ’3.11’
Page 129, Line 24: ’origniating’ should be ’originating’
Page 130, Line 24: ’4.9’ should be ’4.8’

Page 131, Line 13: ’3.9’ should be *3.11’
Page 131, Line 26: ’tantamount’ should be ’paramount’
Page 131, Line 16: ’negligible’ should be ’not negligible’
Page 133, Line 7: ’3.3’ should be ’3.4’
Page 136, Line 11: ’greater’ should be ’greater than’
Page 138, Line 4: ’2.2.1’ should be ’2.3.1.1’
Page 141, Line 17: ’2.2.1’ should be ’2.3.1.1’
Page 150, Line 20: ’secodary’ should be ’secondary’
Page 161, Line 13: ’reusultingly’ should be ’resultingly’
Page 162, Line 20: ’experimental’ should be ’experimental results’
Page 165, Line 20: ’energies’ should be ’angles’
Page 167 should include Boksenberg A, (1961) PhD Thesis, University of London
Page 175 should include Peterkop R K, (1960) Sov Phys JETP 14, 1377