Embed Size (px)
Citation preview

POSCO2017 Earnings Release
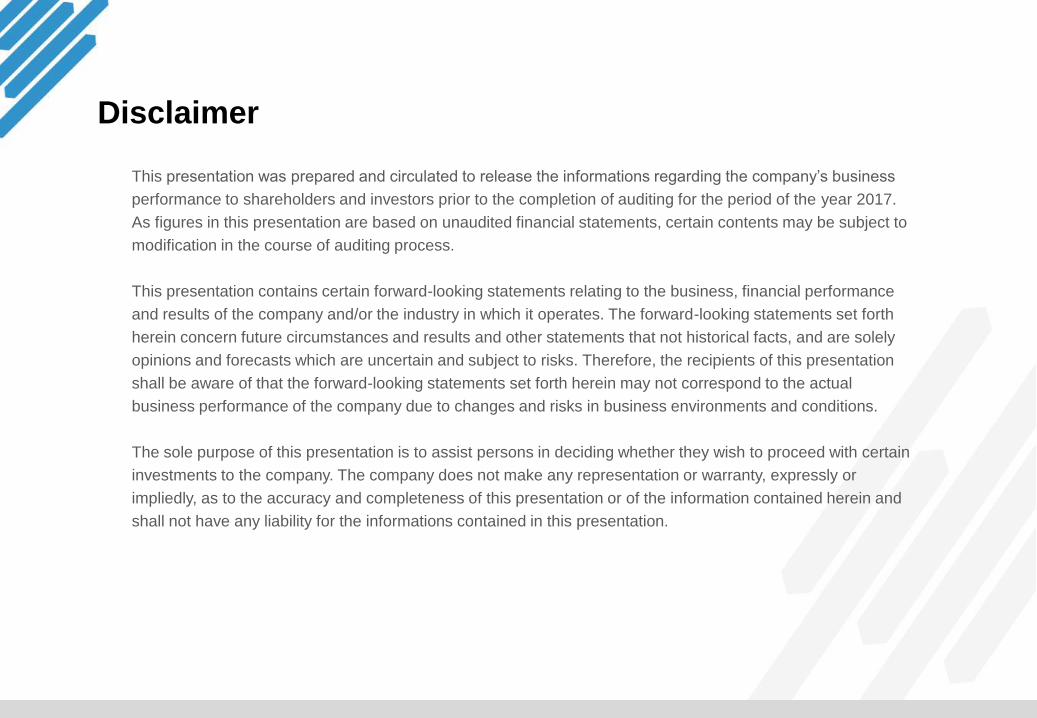
Disclaimer
This presentation was prepared and circulated to release the informations regarding the company’s business
performance to shareholders and investors prior to the completion of auditing for the period of the year 2017.
As figures in this presentation are based on unaudited financial statements, certain contents may be subject to
modification in the course of auditing process.
This presentation contains certain forward-looking statements relating to the business, financial performance
and results of the company and/or the industry in which it operates. The forward-looking statements set forth
herein concern future circumstances and results and other statements that not historical facts, and are solely
opinions and forecasts which are uncertain and subject to risks. Therefore, the recipients of this presentation
shall be aware of that the forward-looking statements set forth herein may not correspond to the actual
business performance of the company due to changes and risks in business environments and conditions.
The sole purpose of this presentation is to assist persons in deciding whether they wish to proceed with certain
investments to the company. The company does not make any representation or warranty, expressly or
impliedly, as to the accuracy and completeness of this presentation or of the information contained herein and
shall not have any liability for the informations contained in this presentation.
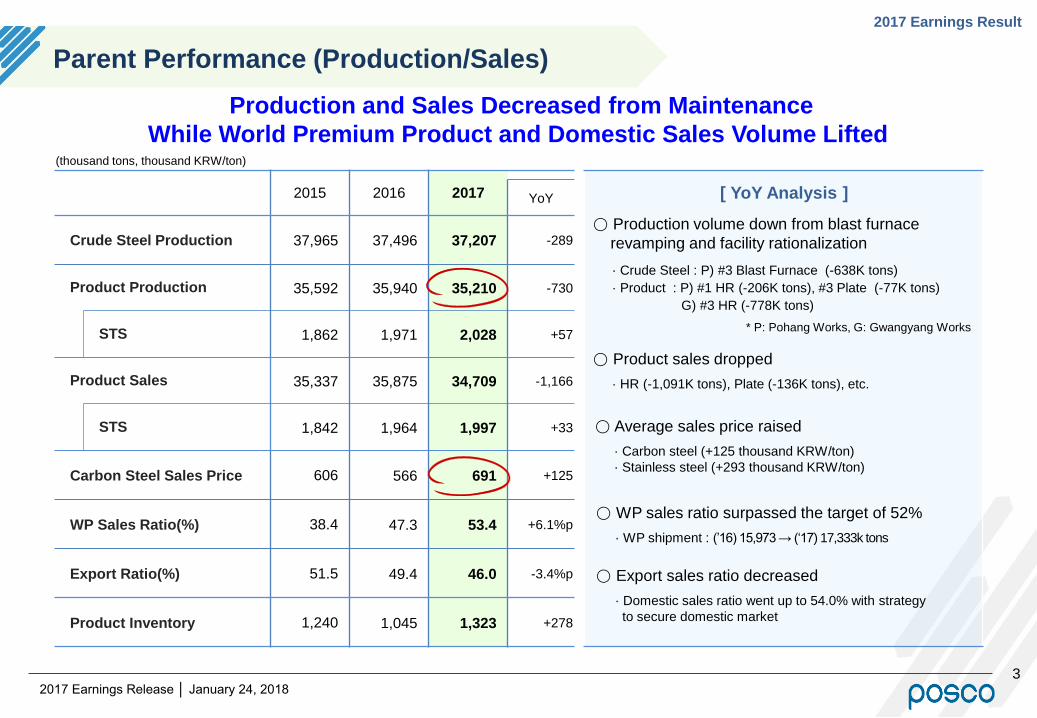
Parent Performance (Production/Sales)
32017 Earnings Release │ January 24, 2018
2015 2016 2017 YoY
Crude Steel Production 37,965 37,496 37,207 -289
Product Production 35,592 35,940 35,210 -730
STS 1,862 1,971 2,028 +57
Product Sales 35,337 35,875 34,709 -1,166
STS 1,842 1,964 1,997 +33
Carbon Steel Sales Price 606 566 691 +125
WP Sales Ratio(%) 38.4 47.3 53.4 +6.1%p
Export Ratio(%) 51.5 49.4 46.0 -3.4%p
Product Inventory 1,240 1,045 1,323 +278
(thousand tons, thousand KRW/ton)
Production and Sales Decreased from Maintenance
While World Premium Product and Domestic Sales Volume Lifted
· Crude Steel : P) #3 Blast Furnace (-638K tons)
· Product : P) #1 HR (-206K tons), #3 Plate (-77K tons)
G) #3 HR (-778K tons)
2017 Earnings Result
[ YoY Analysis ]
○ Production volume down from blast furnace
revamping and facility rationalization
* P: Pohang Works, G: Gwangyang Works
○ Product sales dropped
· HR (-1,091K tons), Plate (-136K tons), etc.
○ Average sales price raised
· Carbon steel (+125 thousand KRW/ton)
· Stainless steel (+293 thousand KRW/ton)
○ WP sales ratio surpassed the target of 52%
· WP shipment : (’16) 15,973 → (‘17) 17,333k tons
○ Export sales ratio decreased
· Domestic sales ratio went up to 54.0% with strategy
to secure domestic market
Parent Performance
42017 Earnings Release │ January 24, 2018
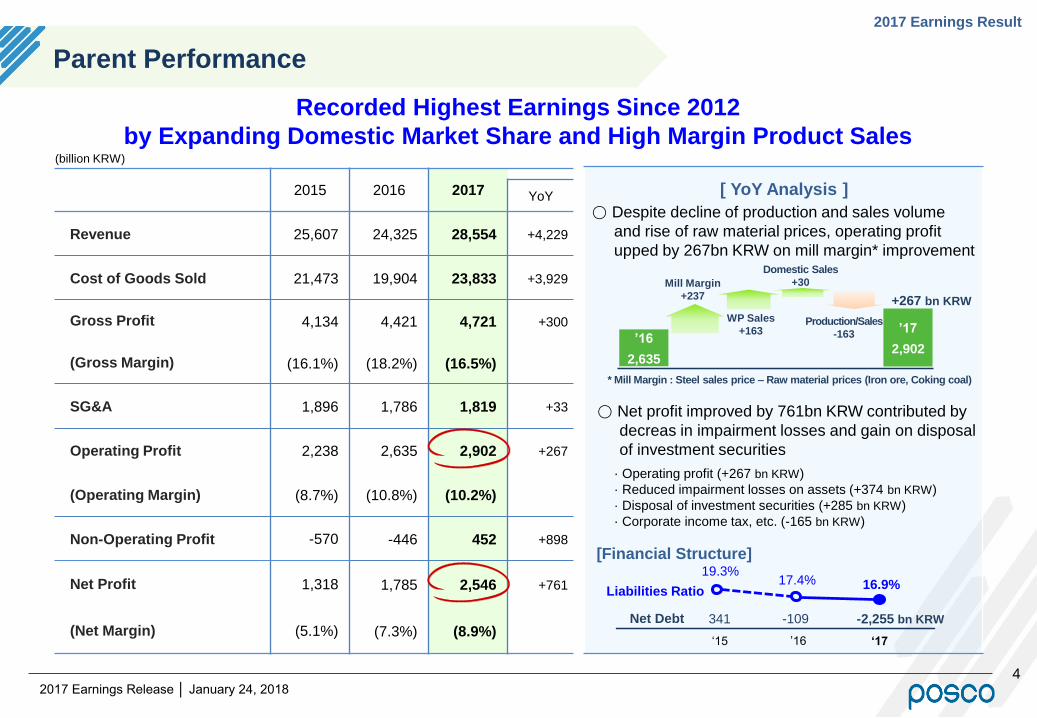
2015 2016 2017 YoY
Revenue 25,607 24,325 28,554 +4,229
Cost of Goods Sold 21,473 19,904 23,833 +3,929
Gross Profit 4,134 4,421 4,721 +300
(Gross Margin) (16.1%) (18.2%) (16.5%)
SG&A 1,896 1,786 1,819 +33
Operating Profit 2,238 2,635 2,902 +267
(Operating Margin) (8.7%) (10.8%) (10.2%)
Non-Operating Profit -570 -446 452 +898
Net Profit 1,318 1,785 2,546 +761
(Net Margin) (5.1%) (7.3%) (8.9%)
(billion KRW)
·Operating profit (+267 bn KRW)
· Reduced impairment losses on assets (+374 bn KRW)
·Disposal of investment securities (+285 bn KRW)
·Corporate income tax, etc. (-165 bn KRW)
[ YoY Analysis ]
Recorded Highest Earnings Since 2012
by Expanding Domestic Market Share and High Margin Product Sales
341
Liabilities Ratio
19.3%17.4% 16.9%
Net Debt -2,255 bn KRW-109
‘15 ‘17’16
[Financial Structure]
’16
2,635
’17
2,902
Mill Margin
+237
Domestic Sales
+30
Production/Sales
-163
+267 bn KRW
WP Sales
+163
* Mill Margin : Steel sales price – Raw material prices (Iron ore, Coking coal)
2017 Earnings Result
○ Despite decline of production and sales volume
and rise of raw material prices, operating profit
upped by 267bn KRW on mill margin* improvement
○ Net profit improved by 761bn KRW contributed by
decreas in impairment losses and gain on disposal
of investment securities
52017 Earnings Release │ January 24, 2018
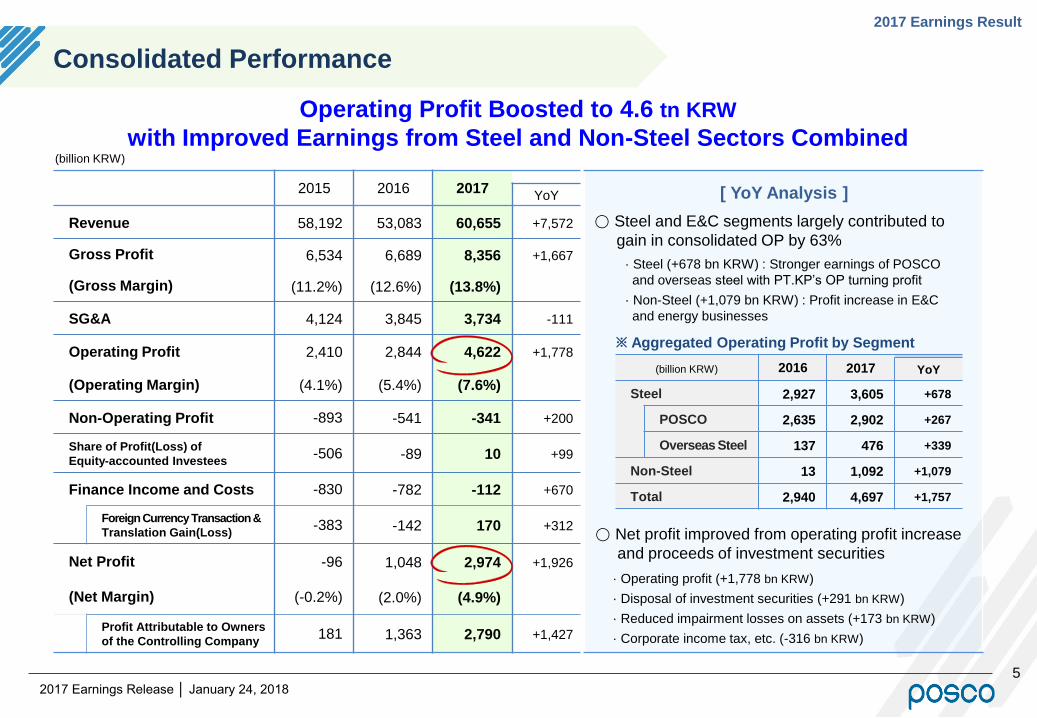
2016 2017 YoY
Steel 2,927 3,605 +678
POSCO 2,635 2,902 +267
Overseas Steel 137 476 +339
Non-Steel 13 1,092 +1,079
Total 2,940 4,697 +1,757
※ Aggregated Operating Profit by Segment
2015 2016 2017YoY
Revenue 58,192 53,083 60,655 +7,572
Gross Profit 6,534 6,689 8,356 +1,667
(Gross Margin) (11.2%) (12.6%) (13.8%)
SG&A 4,124 3,845 3,734 -111
Operating Profit 2,410 2,844 4,622 +1,778
(Operating Margin) (4.1%) (5.4%) (7.6%)
Non-Operating Profit -893 -541 -341 +200
Share of Profit(Loss) of
Equity-accounted Investees-506 -89 10 +99
Finance Income and Costs -830 -782 -112 +670
Foreign Currency Transaction &
Translation Gain(Loss)-383 -142 170 +312
Net Profit -96 1,048 2,974 +1,926
(Net Margin) (-0.2%) (2.0%) (4.9%)
Profit Attributable to Owners
of the Controlling Company181 1,363 2,790 +1,427
Consolidated Performance
2017 Earnings Result
[ YoY Analysis ]
(billion KRW)
Operating Profit Boosted to 4.6 tn KRW
with Improved Earnings from Steel and Non-Steel Sectors Combined
·Operating profit (+1,778 bn KRW)
·Disposal of investment securities (+291 bn KRW)
· Reduced impairment losses on assets (+173 bn KRW)
·Corporate income tax, etc. (-316 bn KRW)
○ Net profit improved from operating profit increase
and proceeds of investment securities
○ Steel and E&C segments largely contributed to
gain in consolidated OP by 63%
· Steel (+678 bn KRW) : Stronger earnings of POSCO
and overseas steel with PT.KP’s OP turning profit
· Non-Steel (+1,079 bn KRW) : Profit increase in E&C
and energy businesses
(billion KRW)
62017 Earnings Release │ January 24, 2018
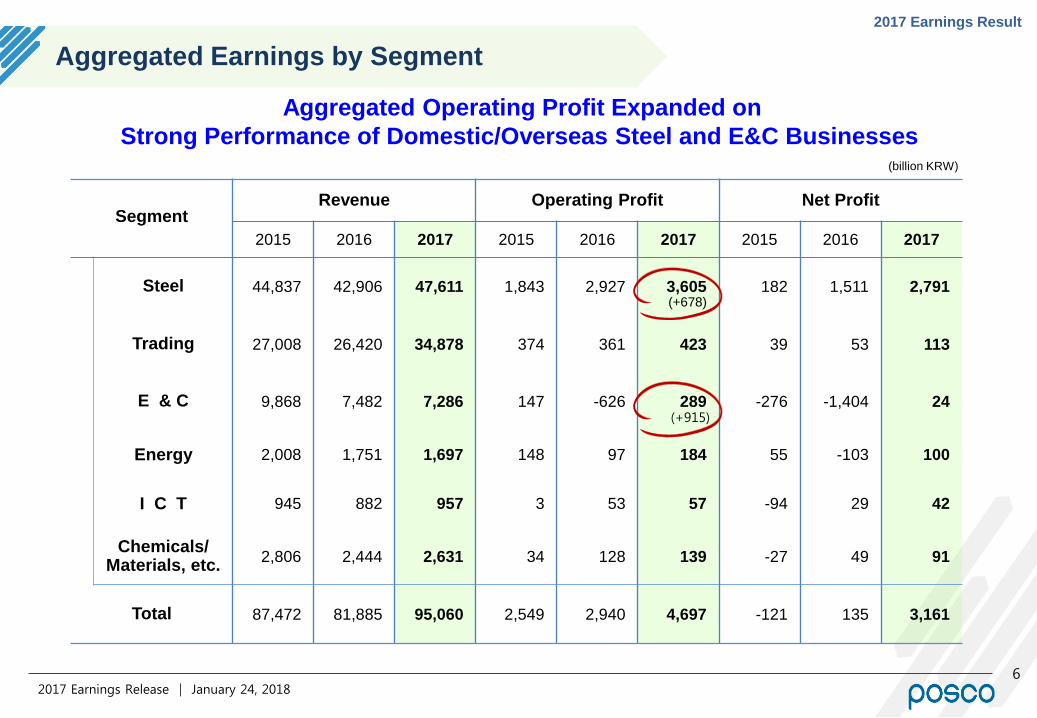
Aggregated Earnings by Segment
SegmentRevenue Operating Profit Net Profit
2015 2016 2017 2015 2016 2017 2015 2016 2017
Steel 44,837 42,906 47,611 1,843 2,927 3,605 182 1,511 2,791
Trading 27,008 26,420 34,878 374 361 423 39 53 113
E & C 9,868 7,482 7,286 147 -626 289 -276 -1,404 24
Energy 2,008 1,751 1,697 148 97 184 55 -103 100
I C T 945 882 957 3 53 57 -94 29 42
Chemicals/Materials, etc.
2,806 2,444 2,631 34 128 139 -27 49 91
Total 87,472 81,885 95,060 2,549 2,940 4,697 -121 135 3,161
(+915)
(+678)
2017 Earnings Result
(billion KRW)
Aggregated Operating Profit Expanded on
Strong Performance of Domestic/Overseas Steel and E&C Businesses
72017 Earnings Release │ January 24, 2018
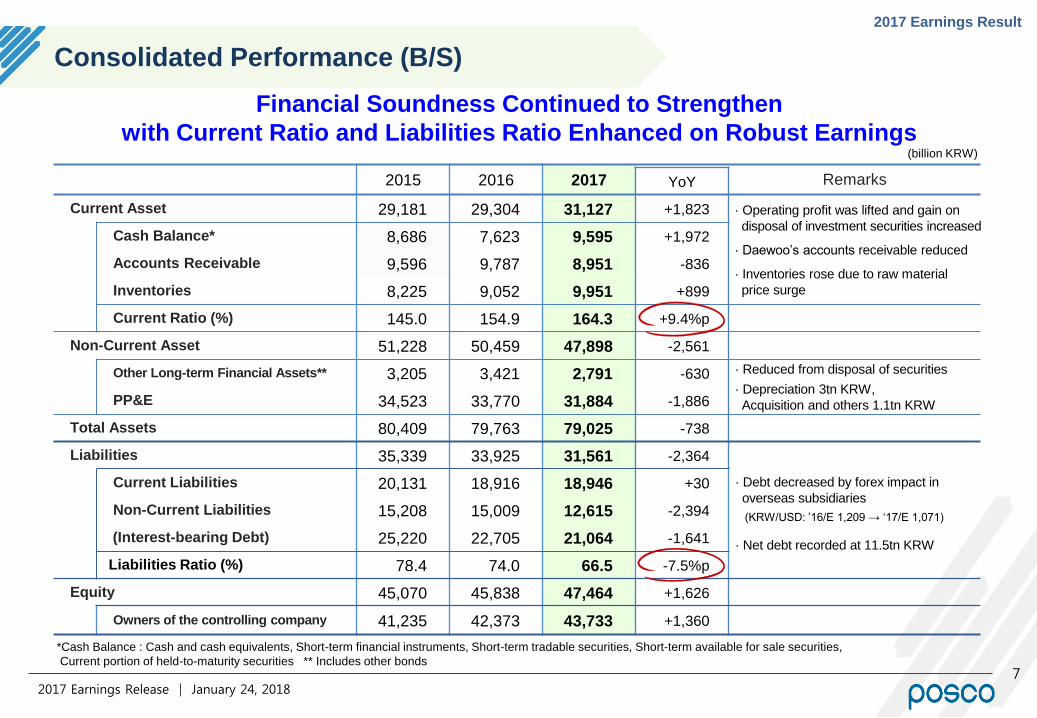
2015 2016 2017 RemarksYoY
Current Asset 29,181 29,304 31,127 +1,823
Cash Balance* 8,686 7,623 9,595 +1,972
Accounts Receivable 9,596 9,787 8,951 -836
Inventories 8,225 9,052 9,951 +899
Current Ratio (%) 145.0 154.9 164.3 +9.4%p
Non-Current Asset 51,228 50,459 47,898 -2,561
Other Long-term Financial Assets** 3,205 3,421 2,791 -630
PP&E 34,523 33,770 31,884 -1,886
Total Assets 80,409 79,763 79,025 -738
Liabilities 35,339 33,925 31,561 -2,364
Current Liabilities 20,131 18,916 18,946 +30
Non-Current Liabilities 15,208 15,009 12,615 -2,394
(Interest-bearing Debt) 25,220 22,705 21,064 -1,641
Liabilities Ratio (%) 78.4 74.0 66.5 -7.5%p
Equity 45,070 45,838 47,464 +1,626
Owners of the controlling company 41,235 42,373 43,733 +1,360
Consolidated Performance (B/S)
2017 Earnings Result
*Cash Balance : Cash and cash equivalents, Short-term financial instruments, Short-term tradable securities, Short-term available for sale securities,
Current portion of held-to-maturity securities ** Includes other bonds
(billion KRW)
Financial Soundness Continued to Strengthen
with Current Ratio and Liabilities Ratio Enhanced on Robust Earnings
· Reduced from disposal of securities
· Depreciation 3tn KRW,
Acquisition and others 1.1tn KRW
· Operating profit was lifted and gain on
disposal of investment securities increased
· Daewoo’s accounts receivable reduced
· Inventories rose due to raw material
price surge
· Debt decreased by forex impact in
overseas subsidiaries
(KRW/USD: ’16/E 1,209 → ‘17/E 1,071)
· Net debt recorded at 11.5tn KRW
POSCO C&C
POSCO Energy
POSCO Chemtech
82017 Earnings Release │ January 24, 2018
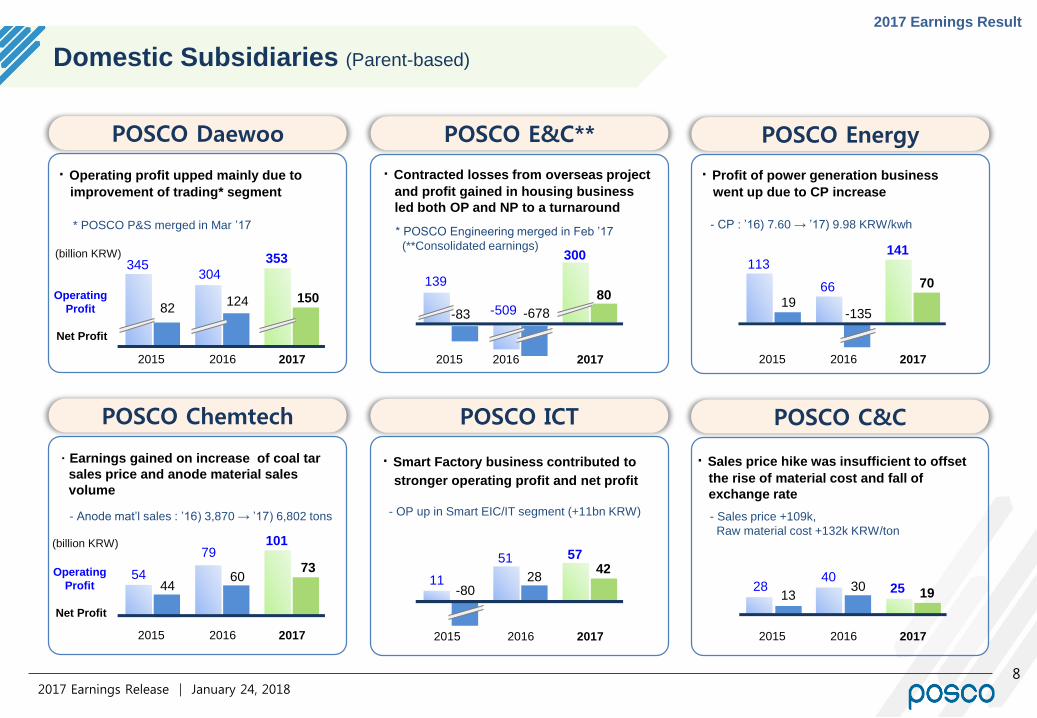
· Operating profit upped mainly due to
improvement of trading* segment
(billion KRW)
2015 2016 2017
304
353345
82124 150
· Earnings gained on increase of coal tar
sales price and anode material sales
volume
2015 2016 2017
79101
5444
6073
· Contracted losses from overseas project
and profit gained in housing business
led both OP and NP to a turnaround
· Smart Factory business contributed to
stronger operating profit and net profit
2016 2017
51 57
11-80
2842
· Profit of power generation business
went up due to CP increase
2015 2016 2017
66
141113
19-135
70
· Sales price hike was insufficient to offset
the rise of material cost and fall of
exchange rate
2015 2016 2017
402528
1330
19
2015
POSCO Daewoo
POSCO ICT
POSCO E&C**
2015 2017
-509
300
-83
80
2016
-678
139
* POSCO Engineering merged in Feb ’17
(**Consolidated earnings)
* POSCO P&S merged in Mar ’17 - CP : ’16) 7.60 → ’17) 9.98 KRW/kwh
- Anode mat’l sales : ’16) 3,870 → ’17) 6,802 tons - Sales price +109k,
Raw material cost +132k KRW/ton
- OP up in Smart EIC/IT segment (+11bn KRW)
Domestic Subsidiaries (Parent-based)
2017 Earnings Result
(billion KRW)
Net Profit
Operating
Profit
Net Profit
Operating
Profit
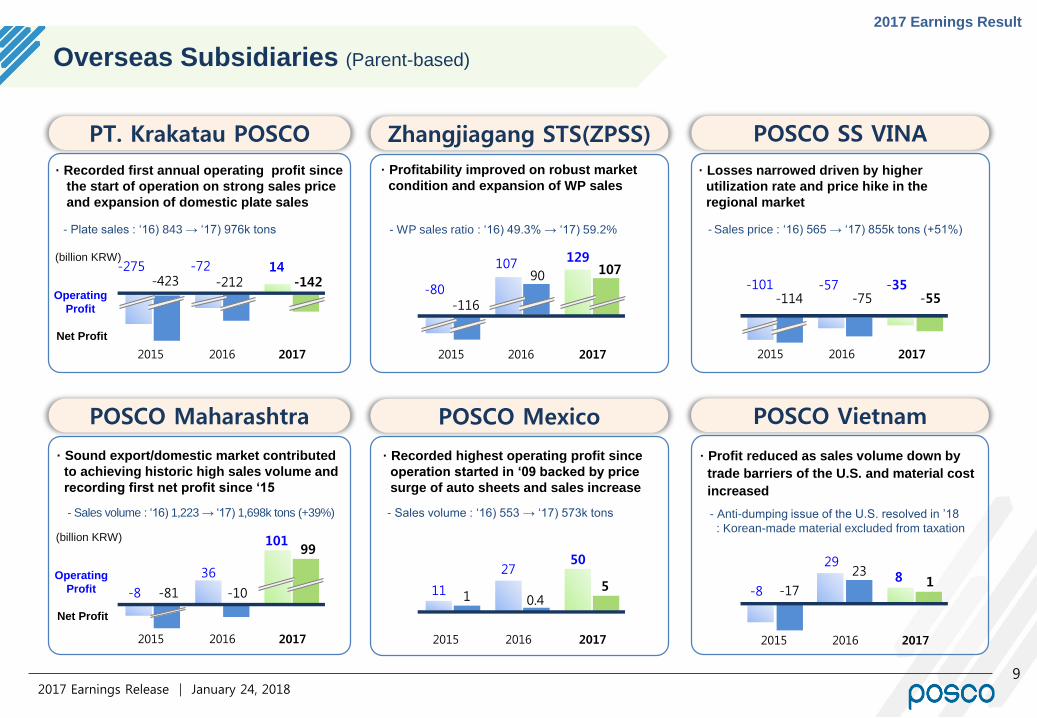
POSCO Maharashtra
PT. Krakatau POSCO
92017 Earnings Release │ January 24, 2018
· Recorded first annual operating profit since
the start of operation on strong sales price
and expansion of domestic plate sales
2015 2016 2017
-72 14-275-423 -212 -142
· Sound export/domestic market contributed
to achieving historic high sales volume and
recording first net profit since ‘15
2016 2017
36
101
-8 -81 -10
99
· Profitability improved on robust market
condition and expansion of WP sales
2015 2017
107 129
-80-116
107
· Recorded highest operating profit since
operation started in ‘09 backed by price
surge of auto sheets and sales increase
2016 2017
2750
11 1 0.45
· Losses narrowed driven by higher
utilization rate and price hike in the
regional market
2015 2016 2017
-57 -35-101-114 -75 -55
· Profit reduced as sales volume down by
trade barriers of the U.S. and material cost
increased
2016 2017
298
-8 -17
231
2016
90
20152015 2015
POSCO Mexico
Zhangjiagang STS(ZPSS)
POSCO Vietnam
POSCO SS VINA
- Anti-dumping issue of the U.S. resolved in ’18
: Korean-made material excluded from taxation
- Plate sales : ‘16) 843 → ‘17) 976k tons - WP sales ratio : ‘16) 49.3% → ‘17) 59.2% - Sales price : ‘16) 565 → ‘17) 855k tons (+51%)
- Sales volume : ‘16) 1,223 → ‘17) 1,698k tons (+39%) - Sales volume : ‘16) 553 → ‘17) 573k tons
Overseas Subsidiaries (Parent-based)
2017 Earnings Result
(billion KRW)
Net Profit
Operating
Profit
(billion KRW)
Net Profit
Operating
Profit
``
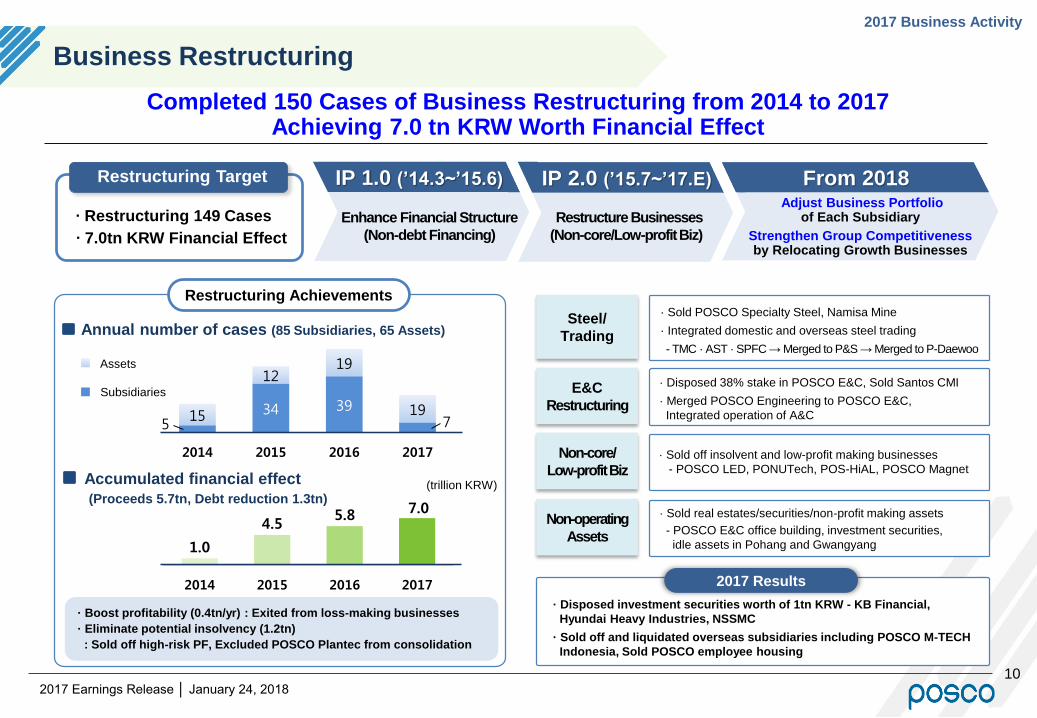
Business Restructuring
· Boost profitability (0.4tn/yr) : Exited from loss-making businesses
· Eliminate potential insolvency (1.2tn)
: Sold off high-risk PF, Excluded POSCO Plantec from consolidation
2017 Earnings Release │ January 24, 2018
Completed 150 Cases of Business Restructuring from 2014 to 2017 Achieving 7.0 tn KRW Worth Financial Effect
IP 2.0 (’15.7~’17.E)
Restructure Businesses
(Non-core/Low-profit Biz)
From 2018Adjust Business Portfolio
of Each Subsidiary
Strengthen Group Competitiveness by Relocating Growth Businesses
Accumulated financial effect
(Proceeds 5.7tn, Debt reduction 1.3tn)(trillion KRW)
`· Disposed 38% stake in POSCO E&C, Sold Santos CMI
· Merged POSCO Engineering to POSCO E&C,
Integrated operation of A&C
`· Sold real estates/securities/non-profit making assets
- POSCO E&C office building, investment securities,
idle assets in Pohang and Gwangyang
`· Sold POSCO Specialty Steel, Namisa Mine
· Integrated domestic and overseas steel trading
- TMC · AST · SPFC → Merged to P&S → Merged to P-Daewoo
· Sold off insolvent and low-profit making businesses
- POSCO LED, PONUTech, POS-HiAL, POSCO Magnet
534 39
715
1219
19
2014 2015 2016 2017
자산
계열사
Annual number of cases (85 Subsidiaries, 65 Assets)
1.0
4.55.8 7.0
2014 2015 2016 2017
Restructuring Achievements
Steel/
Trading
E&C
Restructuring
Non-core/
Low-profit Biz
Non-operating
Assets
`
2017 Results
· Disposed investment securities worth of 1tn KRW - KB Financial,
Hyundai Heavy Industries, NSSMC
· Sold off and liquidated overseas subsidiaries including POSCO M-TECH
Indonesia, Sold POSCO employee housing
IP 1.0 (’14.3~’15.6)
Enhance Financial Structure
(Non-debt Financing)`∙ Restructuring 149 Cases
∙ 7.0tn KRW Financial Effect
Restructuring Target
10
2017 Business Activity
Assets
Subsidiaries
11
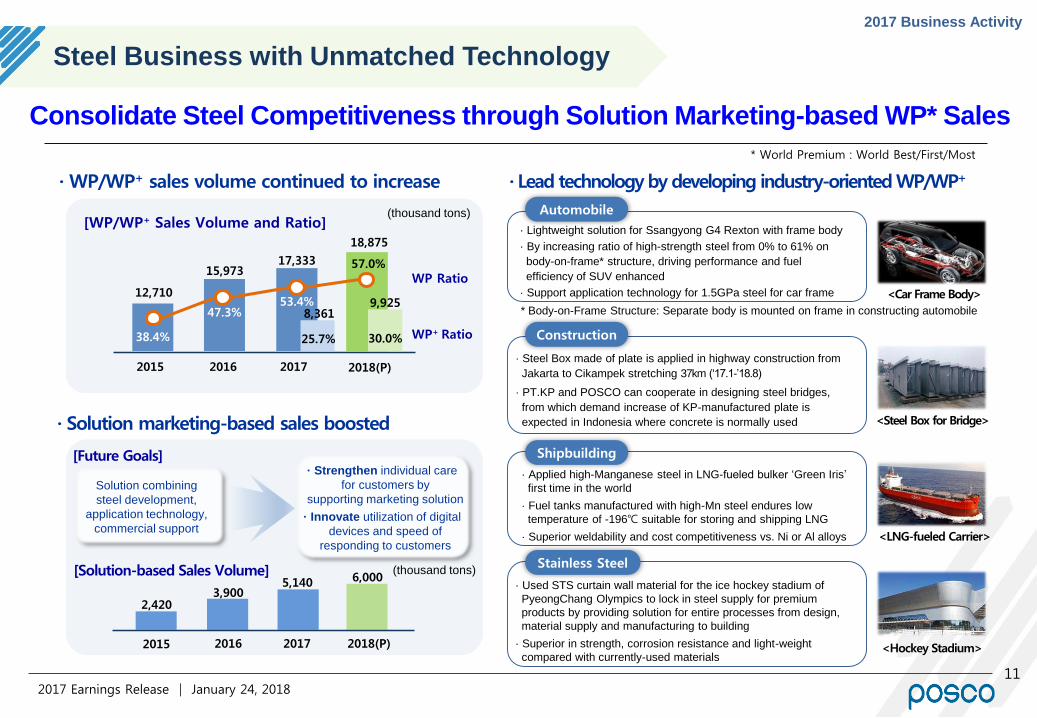
Steel Business with Unmatched Technology
* World Premium : World Best/First/Most
2017 Earnings Release │ January 24, 2018
· Lead technology by developing industry-oriented WP/WP+
· Applied high-Manganese steel in LNG-fueled bulker ‘Green Iris’
first time in the world
· Fuel tanks manufactured with high-Mn steel endures low
temperature of -196℃ suitable for storing and shipping LNG
· Superior weldability and cost competitiveness vs. Ni or Al alloys
· Solution marketing-based sales boosted
Stainless Steel
2016 2018(P)2017
12,710
15,97317,333
38.4%
47.3%53.4%
2015
[WP/WP+ Sales Volume and Ratio]
8,361
25.7% Construction
Shipbuilding
Automobile
· Lightweight solution for Ssangyong G4 Rexton with frame body
· By increasing ratio of high-strength steel from 0% to 61% on
body-on-frame* structure, driving performance and fuel
efficiency of SUV enhanced
· Support application technology for 1.5GPa steel for car frame
· Steel Box made of plate is applied in highway construction from
Jakarta to Cikampek stretching 37km (‘17.1-’18.8)
· PT.KP and POSCO can cooperate in designing steel bridges,
from which demand increase of KP-manufactured plate is
expected in Indonesia where concrete is normally used
<Hockey Stadium>
<LNG-fueled Carrier>
2016 2017 2018(P)
3,9005,140 6,000
2015
2,420
[Solution-based Sales Volume]
· WP/WP+ sales volume continued to increase
· Used STS curtain wall material for the ice hockey stadium of
PyeongChang Olympics to lock in steel supply for premium
products by providing solution for entire processes from design,
material supply and manufacturing to building
· Superior in strength, corrosion resistance and light-weight
compared with currently-used materials
<Steel Box for Bridge>
<Car Frame Body>
* Body-on-Frame Structure: Separate body is mounted on frame in constructing automobile
[Future Goals]
(thousand tons)
WP Ratio
18,875
9,925
57.0%
WP+ Ratio30.0%
Solution combining
steel development,
application technology,
commercial support
2017 Business Activity
Consolidate Steel Competitiveness through Solution Marketing-based WP* Sales
(thousand tons)
· Strengthen individual care
for customers by
supporting marketing solution
· Innovate utilization of digital
devices and speed of
responding to customers
12
Future Growth by Differentiated Capabilities
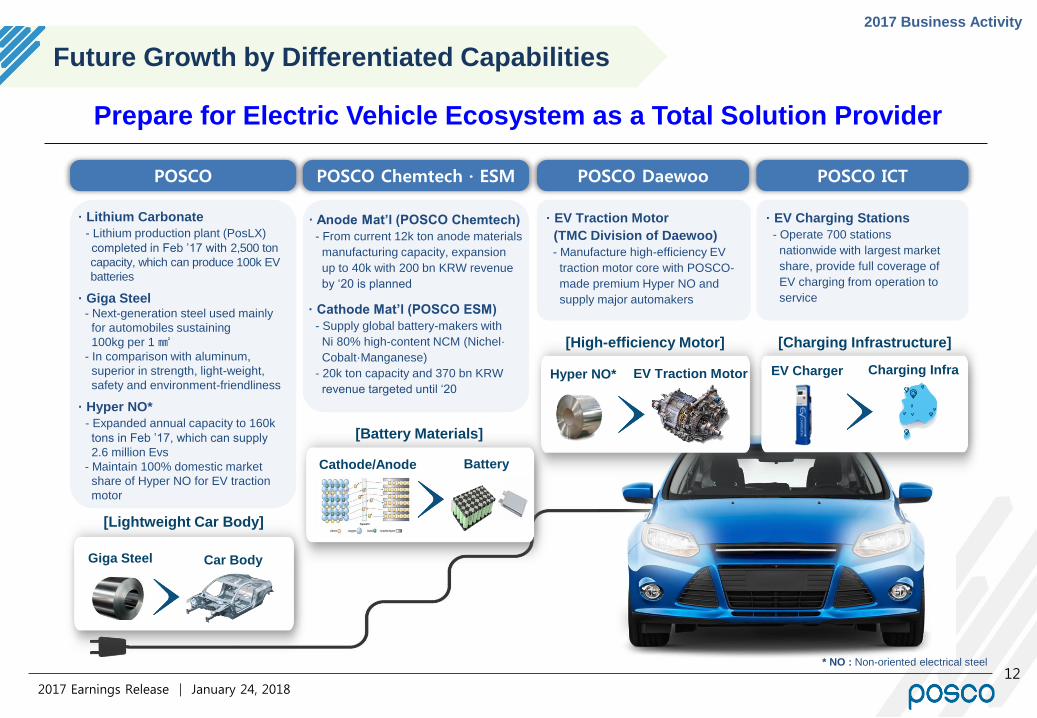
Prepare for Electric Vehicle Ecosystem as a Total Solution Provider
· Lithium Carbonate
- Lithium production plant (PosLX)
completed in Feb ’17 with 2,500 ton
capacity, which can produce 100k EV
batteries
· Giga Steel- Next-generation steel used mainly
for automobiles sustaining
100kg per 1 ㎟- In comparison with aluminum,
superior in strength, light-weight,
safety and environment-friendliness
· Hyper NO*
- Expanded annual capacity to 160k
tons in Feb ’17, which can supply
2.6 million Evs
- Maintain 100% domestic market
share of Hyper NO for EV traction
motor
· EV Traction Motor
(TMC Division of Daewoo)
- Manufacture high-efficiency EV
traction motor core with POSCO-
made premium Hyper NO and
supply major automakers
EV Charger Charging Infra
[Charging Infrastructure]
* NO : Non-oriented electrical steel
· EV Charging Stations
- Operate 700 stations
nationwide with largest market
share, provide full coverage of
EV charging from operation to
service
[High-efficiency Motor]
Hyper NO* EV Traction Motor
· Anode Mat’l (POSCO Chemtech)
- From current 12k ton anode materials
manufacturing capacity, expansion
up to 40k with 200 bn KRW revenue
by ‘20 is planned
· Cathode Mat’l (POSCO ESM)
- Supply global battery-makers with
Ni 80% high-content NCM (Nichel·
Cobalt·Manganese)
- 20k ton capacity and 370 bn KRW
revenue targeted until ‘20
BatteryCathode/Anode
[Battery Materials]
Car Body
[Lightweight Car Body]
Giga Steel
2017 Business Activity
2017 Earnings Release │ January 24, 2018
POSCO POSCO Chemtech · ESM POSCO Daewoo POSCO ICT
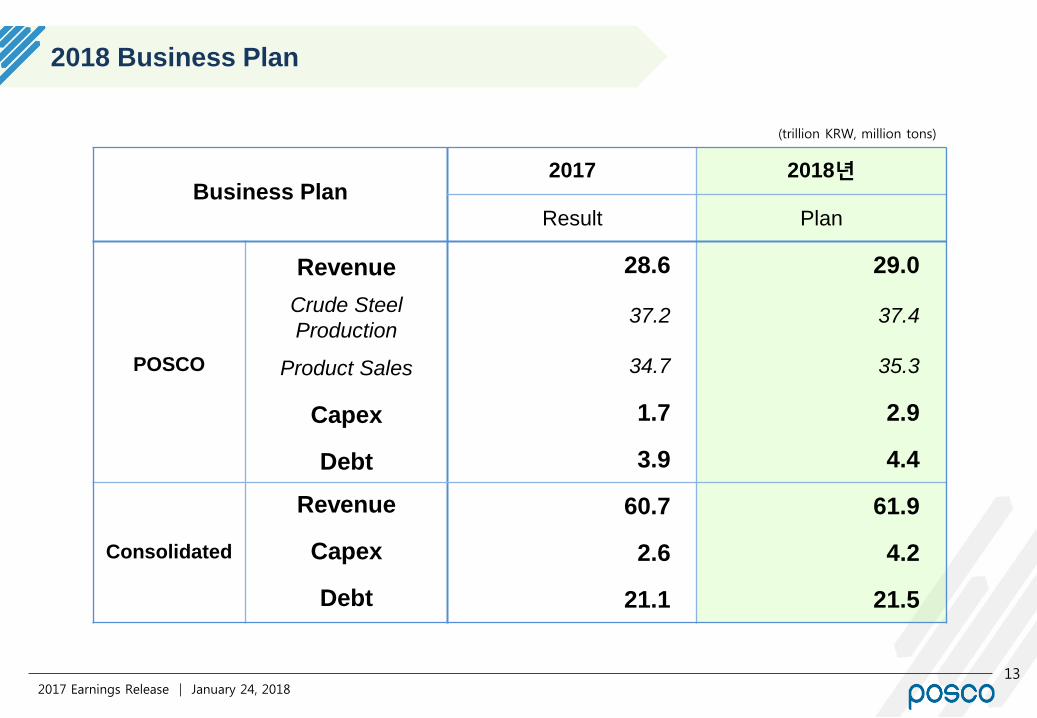
2018 Business Plan
132017 Earnings Release │ January 24, 2018
(trillion KRW, million tons)
Business Plan2017 2018년
Result Plan
POSCO
Revenue 28.6 29.0
Crude Steel
Production37.2 37.4
Product Sales 34.7 35.3
Capex 1.7 2.9
Debt 3.9 4.4
Consolidated
Revenue 60.7 61.9
Capex 2.6 4.2
Debt 21.1 21.5
142017 Earnings Release │ January 24, 2018
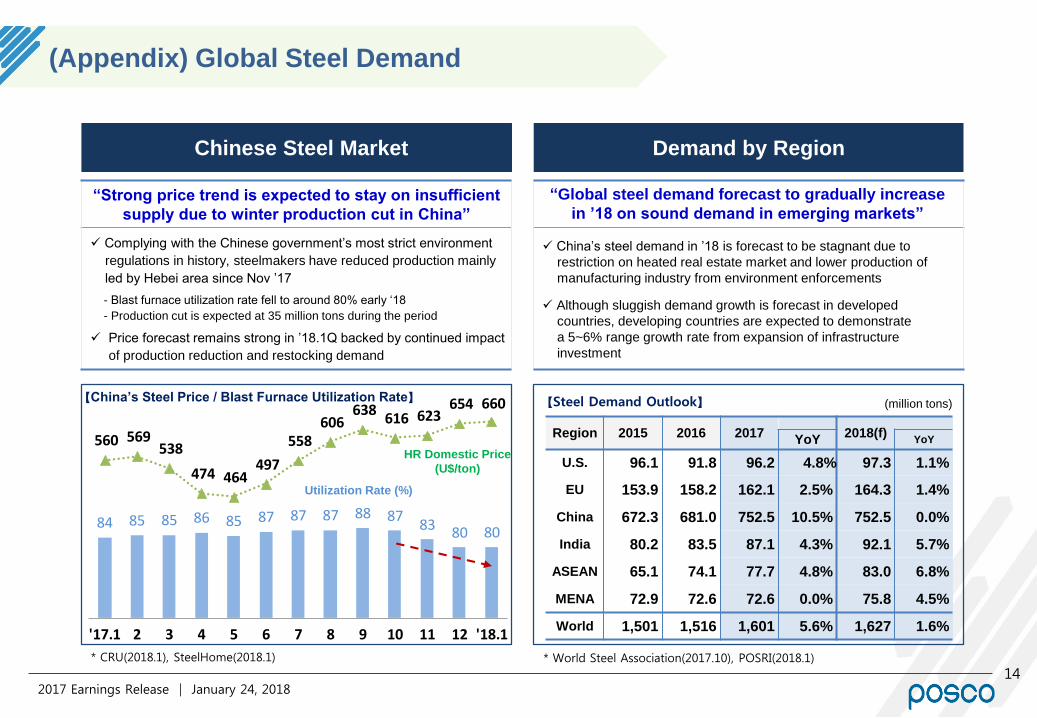
Chinese Steel Market Demand by Region
“Strong price trend is expected to stay on insufficient
supply due to winter production cut in China”
“Global steel demand forecast to gradually increase
in ’18 on sound demand in emerging markets”
* CRU(2018.1), SteelHome(2018.1)
(million tons)
* World Steel Association(2017.10), POSRI(2018.1)
Region 2015 2016 2017 2018(f)YoY YoY
U.S. 96.1 91.8 96.2 4.8% 97.3 1.1%
EU 153.9 158.2 162.1 2.5% 164.3 1.4%
China 672.3 681.0 752.5 10.5% 752.5 0.0%
India 80.2 83.5 87.1 4.3% 92.1 5.7%
ASEAN 65.1 74.1 77.7 4.8% 83.0 6.8%
MENA 72.9 72.6 72.6 0.0% 75.8 4.5%
World 1,501 1,516 1,601 5.6% 1,627 1.6%
【Steel Demand Outlook】
Complying with the Chinese government’s most strict environment
regulations in history, steelmakers have reduced production mainly
led by Hebei area since Nov ’17
- Blast furnace utilization rate fell to around 80% early ‘18
- Production cut is expected at 35 million tons during the period
Price forecast remains strong in ’18.1Q backed by continued impact
of production reduction and restocking demand
China’s steel demand in ’18 is forecast to be stagnant due to
restriction on heated real estate market and lower production of
manufacturing industry from environment enforcements
Although sluggish demand growth is forecast in developed
countries, developing countries are expected to demonstrate
a 5~6% range growth rate from expansion of infrastructure
investment
84 85 85 86 85 87 87 87 88 87 83 80 80
560 569 538
474 464 497
558 606
638 616 623
654 660
'17.1 2 3 4 5 6 7 8 9 10 11 12 '18.1
【China’s Steel Price / Blast Furnace Utilization Rate】
Utilization Rate (%)
HR Domestic Price
(U$/ton)
(Appendix) Global Steel Demand
152017 Earnings Release │ January 24, 2018
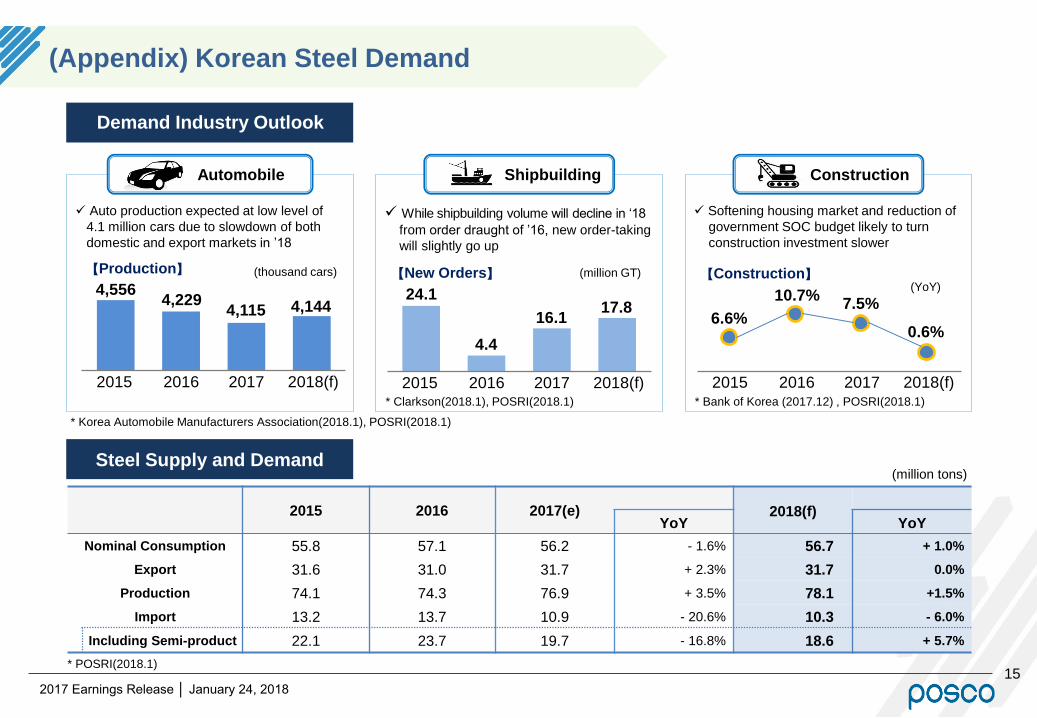
Demand Industry Outlook
Steel Supply and Demand(million tons)
Shipbuilding ConstructionAutomobile
Auto production expected at low level of
4.1 million cars due to slowdown of both
domestic and export markets in ’18
While shipbuilding volume will decline in ‘18
from order draught of ’16, new order-taking
will slightly go up
Softening housing market and reduction of
government SOC budget likely to turn
construction investment slower
4,5564,229
4,115 4,144
2015 2016 2017 2018(f)
【Production】 (thousand cars)
24.1
4.4
16.117.8
2015 2016 2017 2018(f)
【New Orders】 (million GT)
* Clarkson(2018.1), POSRI(2018.1) * Bank of Korea (2017.12) , POSRI(2018.1)
2015 2016 2017 2018(f)
6.6%
10.7%7.5%
0.6%
【Construction】(YoY)
2015 2016 2017(e) 2018(f)YoY YoY
Nominal Consumption 55.8 57.1 56.2 - 1.6% 56.7 + 1.0%
Export 31.6 31.0 31.7 + 2.3% 31.7 0.0%
Production 74.1 74.3 76.9 + 3.5% 78.1 +1.5%
Import 13.2 13.7 10.9 - 20.6% 10.3 - 6.0%
Including Semi-product 22.1 23.7 19.7 - 16.8% 18.6 + 5.7%
* POSRI(2018.1)
(Appendix) Korean Steel Demand
* Korea Automobile Manufacturers Association(2018.1), POSRI(2018.1)
162017 Earnings Release │ January 24, 2018
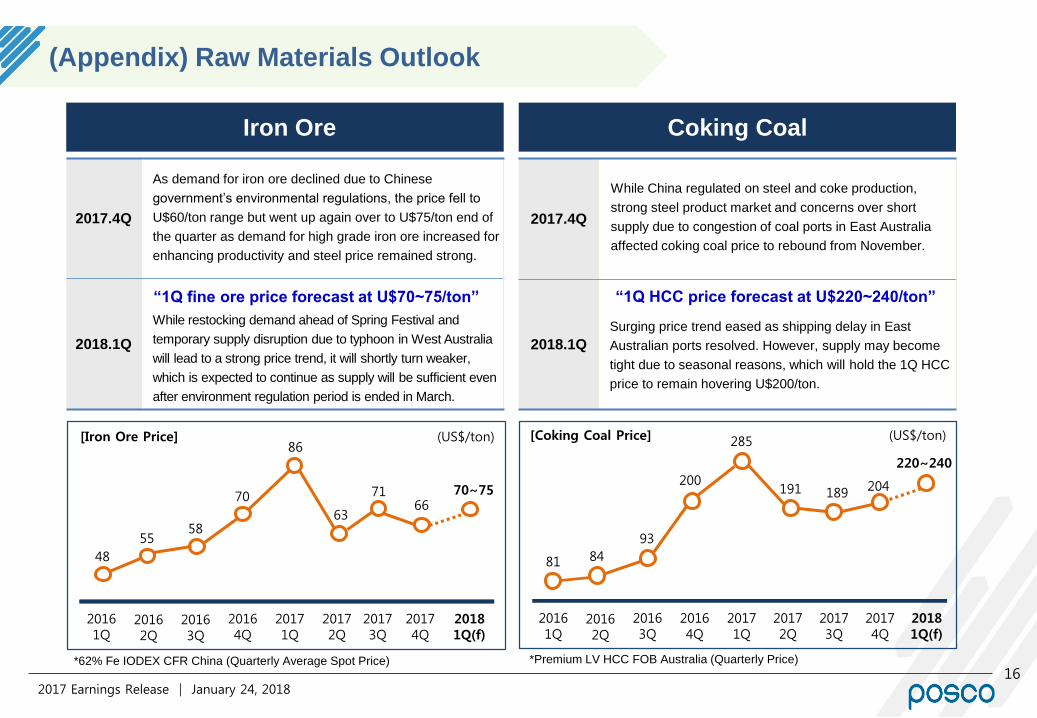
Coking Coal
2017.4Q
2018.1Q
(US$/ton)
20161Q
20162Q
20163Q
20164Q
20171Q
200
285
20172Q
191
20173Q
81 84
93
20174Q
204
“1Q HCC price forecast at U$220~240/ton”
189
While China regulated on steel and coke production,
strong steel product market and concerns over short
supply due to congestion of coal ports in East Australia
affected coking coal price to rebound from November.
Surging price trend eased as shipping delay in East
Australian ports resolved. However, supply may become
tight due to seasonal reasons, which will hold the 1Q HCC
price to remain hovering U$200/ton.
Iron Ore
2017.4Q
2018.1Q
(US$/ton)
20161Q
20162Q
20164Q
20171Q
20172Q
86
20163Q
63
20173Q
48
5558
70
20174Q
6671
20181Q(f)
70~75
20181Q(f)
220~240
As demand for iron ore declined due to Chinese
government’s environmental regulations, the price fell to
U$60/ton range but went up again over to U$75/ton end of
the quarter as demand for high grade iron ore increased for
enhancing productivity and steel price remained strong.
“1Q fine ore price forecast at U$70~75/ton”
While restocking demand ahead of Spring Festival and
temporary supply disruption due to typhoon in West Australia
will lead to a strong price trend, it will shortly turn weaker,
which is expected to continue as supply will be sufficient even
after environment regulation period is ended in March.
(Appendix) Raw Materials Outlook
*62% Fe IODEX CFR China (Quarterly Average Spot Price)
[Iron Ore Price] [Coking Coal Price]
*Premium LV HCC FOB Australia (Quarterly Price)