Embed Size (px)
Citation preview
Earnings Release - 3Q16
Earnings Release - 3Q16
1www.arezzoco.com.br
Earnings conference call:
Friday, November 4th, 2016
11h00 am (Brasília time)
Connection phone numbers:
Participants calling from Brazil and other
countries:
+55 11 2820-4001
Participants calling from USA:
+1 786-924-6977
Access code: Arezzo
Presentation of slides and connection via webcast
(via internet) will be available 30 minutes before
at: www.arezzoco.com.br
Investor Relations:
Thiago Borges
CFO and Investor Relations Officer
Paulo Ionescu
IR Manager
Lucas Pontes
IR Analyst
Contact:
E-mail: [email protected]
Tel: +55 11 2132-4300
HIGHLIGHTS
• Net revenue in 3Q16 reached R$346.9 million, a 10.1%
increase against 3Q15;
• In 3Q16, the Company’s gross profit totaled R$152.2 million,
with gross margin up by 43.9%, and growth of 14.4% against
3Q15;
• EBITDA for 3Q16 totaled R$55.9 million, with a margin of
16.1% and a 12.5% increase against 3Q15;
• In the quarter, net income was R$35.4 million with a margin
of 10.2%;
• Arezzo&Co ended 3Q16 with a growth of 6.4% in same-stores
sales, including owned stores, franchises and web-commerce
channels.
Belo Horizonte, November 3rd, 2016. Arezzo&Co (BM&FBOVESPA: ARZZ3), Brazil's women's footwear, handbags and accessories industry
leader, reports its earnings for the 3rd quarter of 2016. Unless otherwise indicated, data are based on consolidated numbers in thousands of
Brazilian reais and are compiled in accordance with International Financial Reporting Standards (IFRS). All comparisons relate to the same period
in 2015 (3Q15) unless otherwise stated.
Closing price of ARZZ3 in 11.02.16:Arezzo&Co network posted sell-out growth of 9.8% and
the company recorded an increase of 10.1% in Net
Revenue and 12.5% in EBITDA, against 3Q15.
R$28.90
Market Cap in 11.02.16:
R$ 2,567.4 milhões
Earnings Release - 3Q16
Summary of Results 3Q15 3Q16Δ
15 x 169M15 9M16
Δ
15 x 16
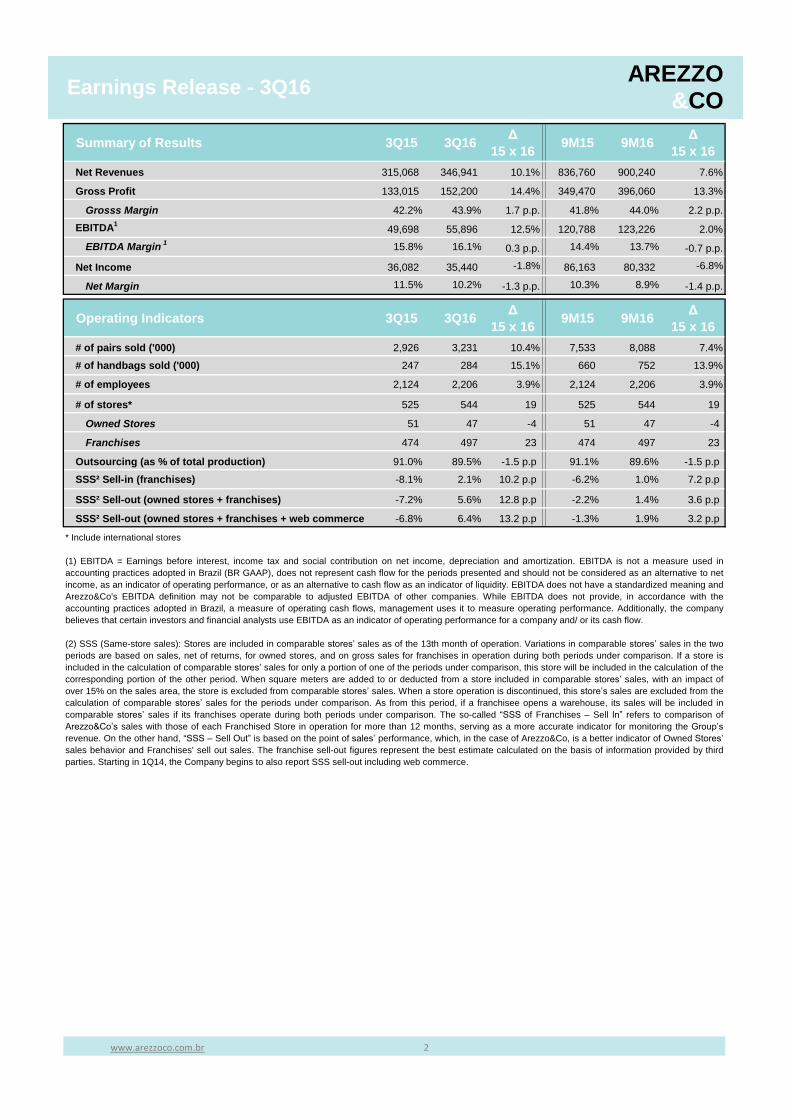
Net Revenues 315,068 346,941 10.1% 836,760 900,240 7.6%
Gross Profit 133,015 152,200 14.4% 349,470 396,060 13.3%
Grosss Margin 42.2% 43.9% 1.7 p.p. 41.8% 44.0% 2.2 p.p.
EBITDA1
49,698 55,896 12.5% 120,788 123,226 2.0%
EBITDA Margin1
15.8% 16.1% 0.3 p.p. 14.4% 13.7% -0.7 p.p.
Net Income 36,082 35,440 -1.8% 86,163 80,332 -6.8%
Net Margin 11.5% 10.2% -1.3 p.p. 10.3% 8.9% -1.4 p.p.
Operating Indicators 3Q15 3Q16Δ
15 x 169M15 9M16
Δ
15 x 16
# of pairs sold ('000) 2,926 3,231 10.4% 7,533 8,088 7.4%
# of handbags sold ('000) 247 284 15.1% 660 752 13.9% Headcount
# of employees 2,124 2,206 3.9% 2,124 2,206 3.9%
# of stores* 525 544 19 525 544 19
Owned Stores 51 47 -4 51 47 -4
Franchises 474 497 23 474 497 23
Outsourcing (as % of total production) 91.0% 89.5% -1.5 p.p 91.1% 89.6% -1.5 p.p
SSS² Sell-in (franchises) -8.1% 2.1% 10.2 p.p -6.2% 1.0% 7.2 p.p
SSS² Sell-out (owned stores + franchises) -7.2% 5.6% 12.8 p.p -2.2% 1.4% 3.6 p.p
SSS² Sell-out (owned stores + franchises + web commerce) -6.8% 6.4% 13.2 p.p -1.3% 1.9% 3.2 p.p
* Include international stores
(1) EBITDA = Earnings before interest, income tax and social contribution on net income, depreciation and amortization. EBITDA is not a measure used in
accounting practices adopted in Brazil (BR GAAP), does not represent cash flow for the periods presented and should not be considered as an alternative to net
income, as an indicator of operating performance, or as an alternative to cash flow as an indicator of liquidity. EBITDA does not have a standardized meaning and
Arezzo&Co's EBITDA definition may not be comparable to adjusted EBITDA of other companies. While EBITDA does not provide, in accordance with the
accounting practices adopted in Brazil, a measure of operating cash flows, management uses it to measure operating performance. Additionally, the company
believes that certain investors and financial analysts use EBITDA as an indicator of operating performance for a company and/ or its cash flow.
(2) SSS (Same-store sales): Stores are included in comparable stores’ sales as of the 13th month of operation. Variations in comparable stores’ sales in the two
periods are based on sales, net of returns, for owned stores, and on gross sales for franchises in operation during both periods under comparison. If a store is
included in the calculation of comparable stores’ sales for only a portion of one of the periods under comparison, this store will be included in the calculation of the
corresponding portion of the other period. When square meters are added to or deducted from a store included in comparable stores’ sales, with an impact of
over 15% on the sales area, the store is excluded from comparable stores’ sales. When a store operation is discontinued, this store’s sales are excluded from the
calculation of comparable stores’ sales for the periods under comparison. As from this period, if a franchisee opens a warehouse, its sales will be included in
comparable stores’ sales if its franchises operate during both periods under comparison. The so-called “SSS of Franchises – Sell In” refers to comparison of
Arezzo&Co’s sales with those of each Franchised Store in operation for more than 12 months, serving as a more accurate indicator for monitoring the Group’s
revenue. On the other hand, “SSS – Sell Out” is based on the point of sales’ performance, which, in the case of Arezzo&Co, is a better indicator of Owned Stores’
sales behavior and Franchises' sell out sales. The franchise sell-out figures represent the best estimate calculated on the basis of information provided by third
parties. Starting in 1Q14, the Company begins to also report SSS sell-out including web commerce.
www.arezzoco.com.br 2
AREZZO&CO
Earnings Release - 3Q16Análise de Sell Out
Gross Revenue 3Q15 Part% 3Q16 Part%Δ (%)
15 x 169M15 Part% 9M16 Part%
Δ (%)
15 x 16
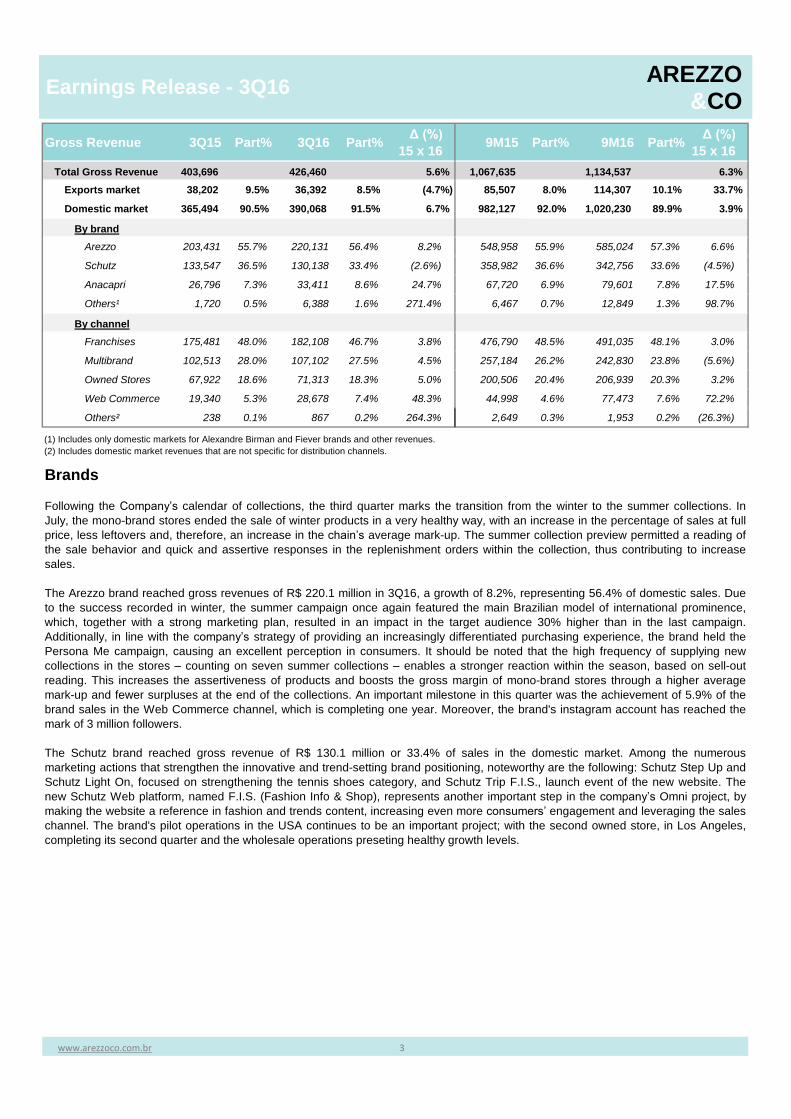
Total Gross Revenue 403,696 426,460 5.6% 1,067,635 1,134,537 6.3%
Exports market 38,202 9.5% 36,392 8.5% (4.7%) 85,507 8.0% 114,307 10.1% 33.7%
Domestic market 365,494 90.5% 390,068 91.5% 6.7% 982,127 92.0% 1,020,230 89.9% 3.9%
By brand
Arezzo 203,431 55.7% 220,131 56.4% 8.2% 548,958 55.9% 585,024 57.3% 6.6%
Schutz 133,547 36.5% 130,138 33.4% (2.6%) 358,982 36.6% 342,756 33.6% (4.5%)
Anacapri 26,796 7.3% 33,411 8.6% 24.7% 67,720 6.9% 79,601 7.8% 17.5%
Others¹ 1,720 0.5% 6,388 1.6% 271.4% 6,467 0.7% 12,849 1.3% 98.7%
By channel
Franchises 175,481 48.0% 182,108 46.7% 3.8% 476,790 48.5% 491,035 48.1% 3.0%
Multibrand 102,513 28.0% 107,102 27.5% 4.5% 257,184 26.2% 242,830 23.8% (5.6%)
Owned Stores 67,922 18.6% 71,313 18.3% 5.0% 200,506 20.4% 206,939 20.3% 3.2%
Web Commerce 19,340 5.3% 28,678 7.4% 48.3% 44,998 4.6% 77,473 7.6% 72.2%
Others² 238 0.1% 867 0.2% 264.3% 2,649 0.3% 1,953 0.2% (26.3%)
www.arezzoco.com.br 3
Brands
Following the Company’s calendar of collections, the third quarter marks the transition from the winter to the summer collections. In
July, the mono-brand stores ended the sale of winter products in a very healthy way, with an increase in the percentage of sales at full
price, less leftovers and, therefore, an increase in the chain’s average mark-up. The summer collection preview permitted a reading of
the sale behavior and quick and assertive responses in the replenishment orders within the collection, thus contributing to increase
sales.
The Arezzo brand reached gross revenues of R$ 220.1 million in 3Q16, a growth of 8.2%, representing 56.4% of domestic sales. Due
to the success recorded in winter, the summer campaign once again featured the main Brazilian model of international prominence,
which, together with a strong marketing plan, resulted in an impact in the target audience 30% higher than in the last campaign.
Additionally, in line with the company’s strategy of providing an increasingly differentiated purchasing experience, the brand held the
Persona Me campaign, causing an excellent perception in consumers. It should be noted that the high frequency of supplying new
collections in the stores – counting on seven summer collections – enables a stronger reaction within the season, based on sell-out
reading. This increases the assertiveness of products and boosts the gross margin of mono-brand stores through a higher average
mark-up and fewer surpluses at the end of the collections. An important milestone in this quarter was the achievement of 5.9% of the
brand sales in the Web Commerce channel, which is completing one year. Moreover, the brand's instagram account has reached the
mark of 3 million followers.
The Schutz brand reached gross revenue of R$ 130.1 million or 33.4% of sales in the domestic market. Among the numerous
marketing actions that strengthen the innovative and trend-setting brand positioning, noteworthy are the following: Schutz Step Up and
Schutz Light On, focused on strengthening the tennis shoes category, and Schutz Trip F.I.S., launch event of the new website. The
new Schutz Web platform, named F.I.S. (Fashion Info & Shop), represents another important step in the company’s Omni project, by
making the website a reference in fashion and trends content, increasing even more consumers’ engagement and leveraging the sales
channel. The brand's pilot operations in the USA continues to be an important project; with the second owned store, in Los Angeles,
completing its second quarter and the wholesale operations preseting healthy growth levels.
(1) Includes only domestic markets for Alexandre Birman and Fiever brands and other revenues.
(2) Includes domestic market revenues that are not specific for distribution channels.
AREZZO&CO
Earnings Release - 3Q16
The Anacapri brand posted sales of R$ 33.4 million in 3Q16, an increase of 24.7% on the same period of the previous year. The
good result is a consequence of a more assertive mix in the summer collection, alongside the consolidation of the brand's
positioning and boosted by greater marketing investments.
Alexandre Birman, through a continuous focus on boosting its international branding, saw its sales grow 22.6% against 3Q15. The
brand has strengthened its positioning through initiatives aimed at consumers, partnering with key US department stores and
obtaining major celebrity endorsements. In the opening ceremony of the Olympics, for instance, an internationally renowned model
wore a sandal by the brand.
The Fiever brand continues increasing its performance, tripling its revenue against 2T16. An important event in the quarter was the
launch of its online store, which in the first year of the brand reaches consumers throughout the nation.
Channels
Mono-brand – Franchises, Owned Stores and Web Commerce
Reflecting the company’s strategy of strengthening the mono-brand stores, the Arezzo&Co stores chain (owned stores +
franchises + web commerce) showed growth of 9.8% in sell-out sales in 3Q16 against 3Q15, particularly due to increased same-
store sales, and the launch of the Arezzo brand online store in August 2015. Mono-brand same-store sales showed an increase
was 6.4% in 3Q16. The stores sales area posted a 4.5% increase against the same quarter of 2015, excluding outlets.
The Company’s revenue from mono-brand stores in the domestic market, consisting of sell-in for franchises and sell-out for owned
stores and web commerce, showed growth of 7.4% in 3Q16 against 3Q15, mainly due to a 48.3% increase in the web commerce
channel. The mono-brand stores accounted for 72.3% of sales in the domestic market in 3Q16.
The franchise channel showed an increase of 3.8% in sell-in for the quarter, with 46.7% of domestic sales in 3Q16, boosted by the
opening of 23 franchises in the last 12 months, 5 of them for the Arezzo brand, 7 for Schutz, 11 for Anacapri, adding a total of
1,791 m² to the channel sales area, excluding outlets.
Sell-in sales, i.e., those made by Arezzo&Co to its franchisees, posted growth in same franchises (SSS – franchises) of 2.1% in
3Q16 against 3Q15. This growth is below the SSS sell-out for the quarter, which is consistent with the Company’s strategy of
keeping a healthy level of inventories with franchises and achieving better gross margins in the chain, with a higher average mark-
up and less leftovers at the end of the collections.
The sell-out channels on their own, revenue grew 14.6% in 3Q16. Although there were fewer owned stores in the domestic market,
the channel had a positive performance, growing 5.0% against 3Q15. Additionally, the Web Commerce channel, boosted by the
launch of the Arezzo online store – which is completing one year – and the increase in Anacapri sales, contributed to the increase
in sell-out.
The company ended 3Q16 with 537 mono-brand stores in Brazil and seven overseas. The numbers in Brazil are 380 for Arezzo,
78 for Schutz, 76 for Anacapri, two for Alexandre Birman and one for the Fiever brand.
Multi-brands
In 3Q16, sales in the multibrand channel were up by 4.5% against 3Q15, resuming growth. The channel’s good performance
reflects the combination of the Company’s effort to constantly increase the service level, a collection with the proper mix of
products and signs of recovery in confidence among storeowners. Noteworthy is the growth recorded by Anacapri, which captured
new customers in the period and increased sales by over 30% in the channel. Additionally, Fiever has also increased its
penetration among multi-brand customers.
As from 3Q15, the group’s four brands are distributed through 2,091 stores in 3Q16, 7.6% fewer than in 3Q15, and can be found in
1,200 cities.
www.arezzoco.com.br 4
AREZZO&CO
Earnings Release - 3Q16
3T15 4T15 1T16 2T16 3T16
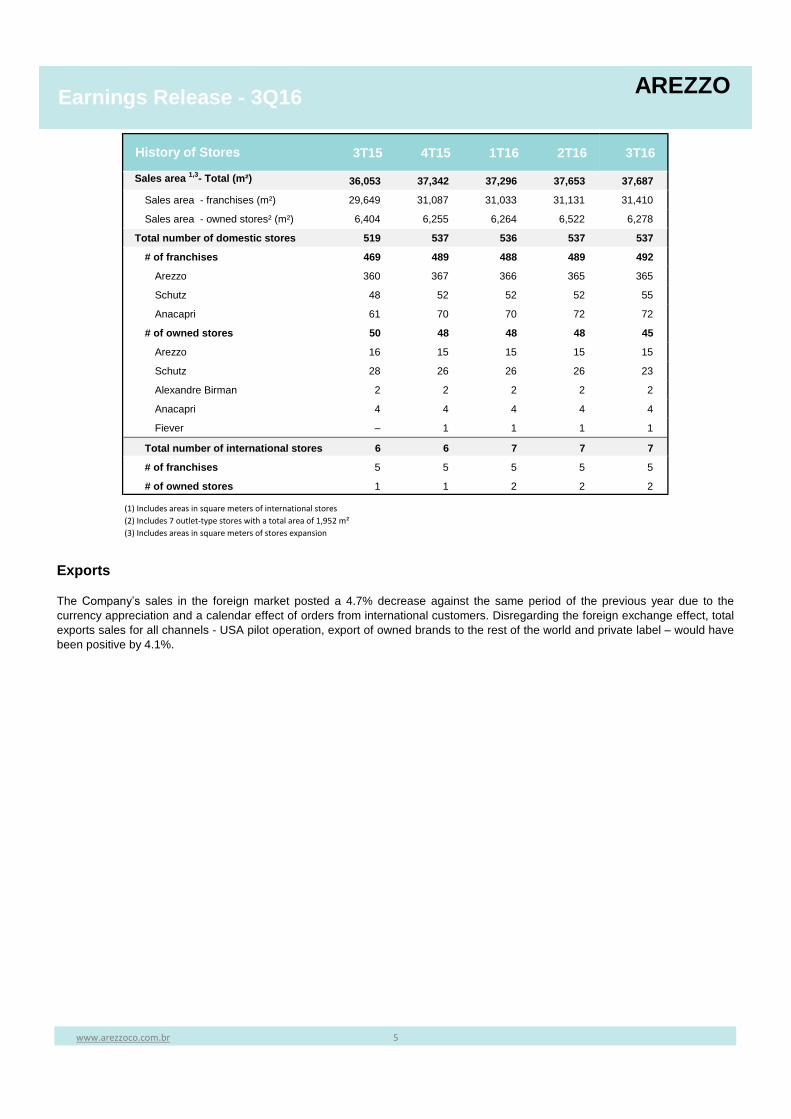
Sales area 1,3
- Total (m²) 36,053 37,342 37,296 37,653 37,687
Sales area - franchises (m²) 29,649 31,087 31,033 31,131 31,410
Sales area - owned stores² (m²) 6,404 6,255 6,264 6,522 6,278
Total number of domestic stores 519 537 536 537 537
# of franchises 469 489 488 489 492
Arezzo 360 367 366 365 365
Schutz 48 52 52 52 55
Anacapri 61 70 70 72 72
# of owned stores 50 48 48 48 45
Arezzo 16 15 15 15 15
Schutz 28 26 26 26 23
Alexandre Birman 2 2 2 2 2
Anacapri 4 4 4 4 4
Fiever – 1 1 1 1
Total number of international stores 6 6 7 7 7
# of franchises 5 5 5 5 5
# of owned stores 1 1 2 2 2
History of Stores
(1) Includes areas in square meters of international stores
(2) Includes 7 outlet-type stores with a total area of 1,952 m²
(3) Includes areas in square meters of stores expansion
www.arezzoco.com.br 5
Exports
The Company’s sales in the foreign market posted a 4.7% decrease against the same period of the previous year due to the
currency appreciation and a calendar effect of orders from international customers. Disregarding the foreign exchange effect, total
exports sales for all channels - USA pilot operation, export of owned brands to the rest of the world and private label – would have
been positive by 4.1%.
AREZZO
Earnings Release - 3Q16Receita Líquida
3Q15 3Q16Δ (%)
15 x 169M15 9M16
Δ (%)
15 x 16
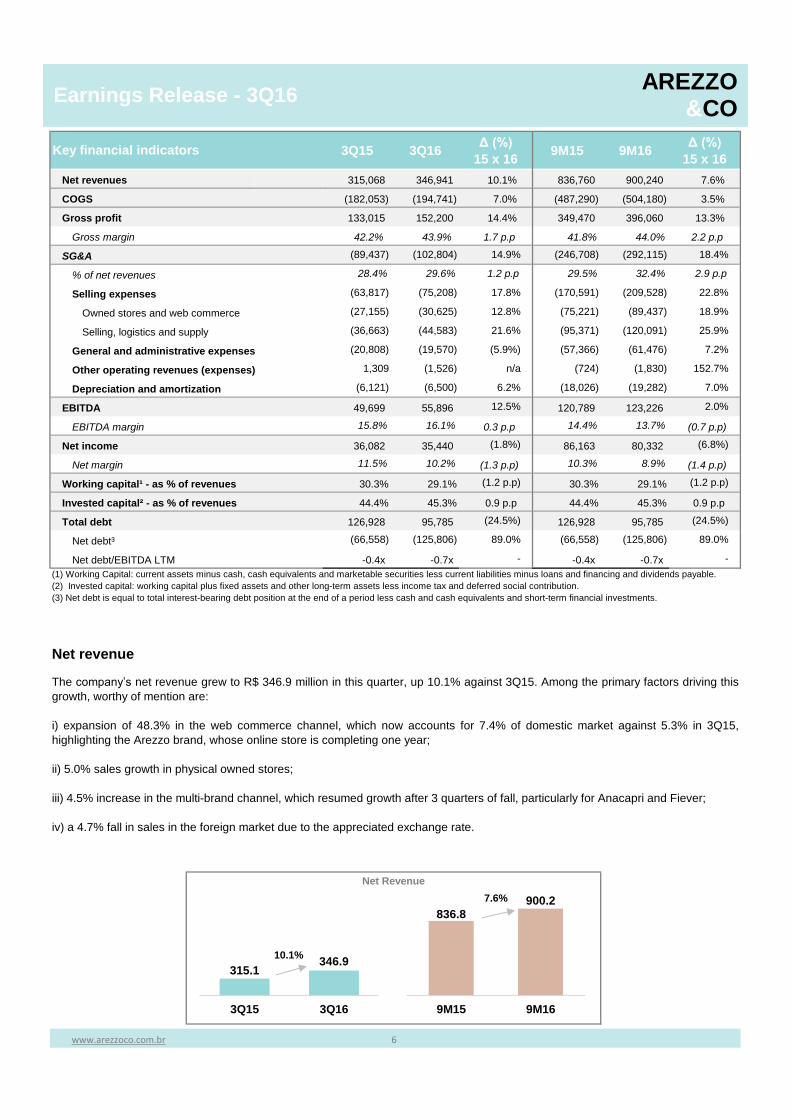
Net revenues 315,068 346,941 10.1% 836,760 900,240 7.6%
COGS (182,053) (194,741) 7.0% (487,290) (504,180) 3.5%
Gross profit 133,015 152,200 14.4% 349,470 396,060 13.3%
Gross margin 42.2% 43.9% 1.7 p.p 41.8% 44.0% 2.2 p.p
SG&A (89,437) (102,804) 14.9% (246,708) (292,115) 18.4%
% of net revenues 28.4% 29.6% 1.2 p.p 29.5% 32.4% 2.9 p.p
Selling expenses (63,817) (75,208) 17.8% (170,591) (209,528) 22.8%
Owned stores and web commerce (27,155) (30,625) 12.8% (75,221) (89,437) 18.9%
Selling, logistics and supply (36,663) (44,583) 21.6% (95,371) (120,091) 25.9%
General and administrative expenses (20,808) (19,570) (5.9%) (57,366) (61,476) 7.2%
Other operating revenues (expenses) 1,309 (1,526) n/a (724) (1,830) 152.7%
Depreciation and amortization (6,121) (6,500) 6.2% (18,026) (19,282) 7.0%
EBITDA 49,699 55,896 12.5% 120,789 123,226 2.0%
EBITDA margin 15.8% 16.1% 0.3 p.p 14.4% 13.7% (0.7 p.p)
Net income 36,082 35,440 (1.8%) 86,163 80,332 (6.8%)
Net margin 11.5% 10.2% (1.3 p.p) 10.3% 8.9% (1.4 p.p)
Working capital¹ - as % of revenues 30.3% 29.1% (1.2 p.p) 30.3% 29.1% (1.2 p.p)
Invested capital² - as % of revenues 44.4% 45.3% 0.9 p.p 44.4% 45.3% 0.9 p.p
Total debt 126,928 95,785 (24.5%) 126,928 95,785 (24.5%)
Net debt³ (66,558) (125,806) 89.0% (66,558) (125,806) 89.0%
Net debt/EBITDA LTM -0.4x -0.7x - -0.4x -0.7x -
7.6%
10.1% Gráfico ROL
Key financial indicators
www.arezzoco.com.br 6
Net revenue
The company’s net revenue grew to R$ 346.9 million in this quarter, up 10.1% against 3Q15. Among the primary factors driving this
growth, worthy of mention are:
i) expansion of 48.3% in the web commerce channel, which now accounts for 7.4% of domestic market against 5.3% in 3Q15,
highlighting the Arezzo brand, whose online store is completing one year;
ii) 5.0% sales growth in physical owned stores;
iii) 4.5% increase in the multi-brand channel, which resumed growth after 3 quarters of fall, particularly for Anacapri and Fiever;
iv) a 4.7% fall in sales in the foreign market due to the appreciated exchange rate.
Net Revenue
(1) Working Capital: current assets minus cash, cash equivalents and marketable securities less current liabilities minus loans and financing and dividends payable.
(2) Invested capital: working capital plus fixed assets and other long-term assets less income tax and deferred social contribution.
(3) Net debt is equal to total interest-bearing debt position at the end of a period less cash and cash equivalents and short-term financial investments.
315.1346.9
3Q15 3Q16
836.8900.2
9M15 9M16
AREZZO&CO
Earnings Release - 3Q16 Gráfico LB
Gross Profit Breakdown de Despesas
13.3%
14.4%
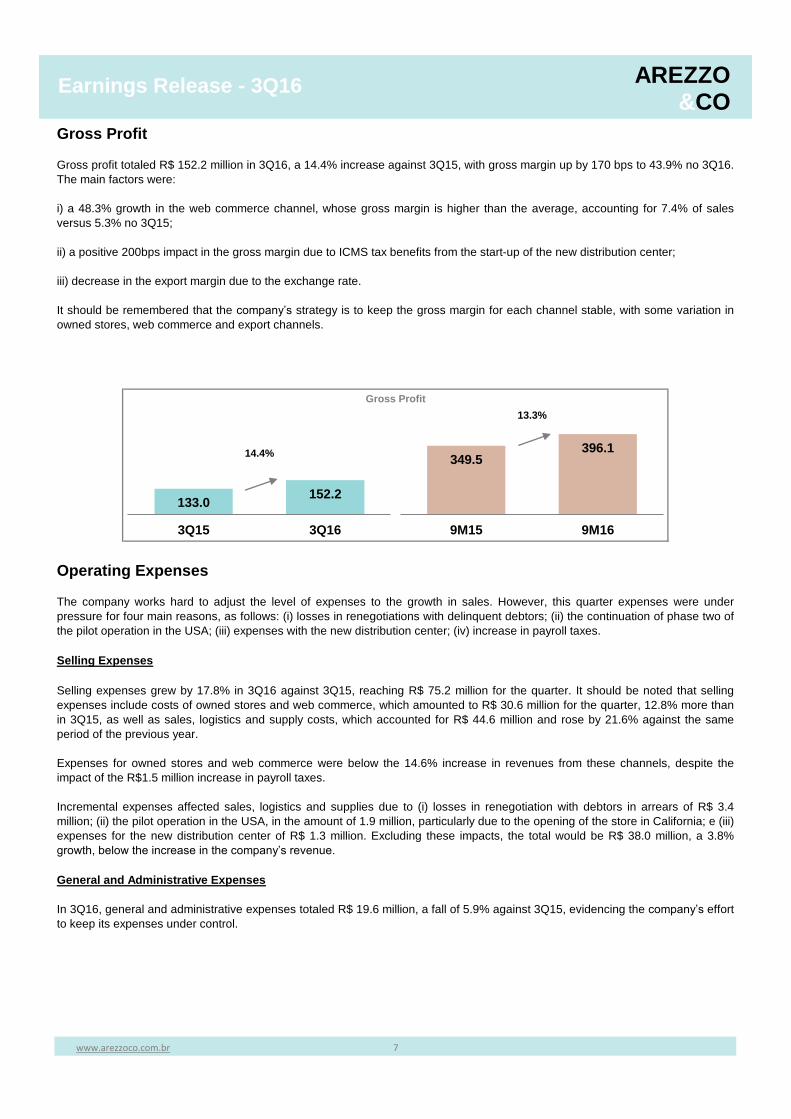
Gross Profit
Gross profit totaled R$ 152.2 million in 3Q16, a 14.4% increase against 3Q15, with gross margin up by 170 bps to 43.9% no 3Q16.
The main factors were:
i) a 48.3% growth in the web commerce channel, whose gross margin is higher than the average, accounting for 7.4% of sales
versus 5.3% no 3Q15;
ii) a positive 200bps impact in the gross margin due to ICMS tax benefits from the start-up of the new distribution center;
iii) decrease in the export margin due to the exchange rate.
It should be remembered that the company’s strategy is to keep the gross margin for each channel stable, with some variation in
owned stores, web commerce and export channels.
www.arezzoco.com.br 7
Operating Expenses
The company works hard to adjust the level of expenses to the growth in sales. However, this quarter expenses were under
pressure for four main reasons, as follows: (i) losses in renegotiations with delinquent debtors; (ii) the continuation of phase two of
the pilot operation in the USA; (iii) expenses with the new distribution center; (iv) increase in payroll taxes.
Selling Expenses
Selling expenses grew by 17.8% in 3Q16 against 3Q15, reaching R$ 75.2 million for the quarter. It should be noted that selling
expenses include costs of owned stores and web commerce, which amounted to R$ 30.6 million for the quarter, 12.8% more than
in 3Q15, as well as sales, logistics and supply costs, which accounted for R$ 44.6 million and rose by 21.6% against the same
period of the previous year.
Expenses for owned stores and web commerce were below the 14.6% increase in revenues from these channels, despite the
impact of the R$1.5 million increase in payroll taxes.
Incremental expenses affected sales, logistics and supplies due to (i) losses in renegotiation with debtors in arrears of R$ 3.4
million; (ii) the pilot operation in the USA, in the amount of 1.9 million, particularly due to the opening of the store in California; e (iii)
expenses for the new distribution center of R$ 1.3 million. Excluding these impacts, the total would be R$ 38.0 million, a 3.8%
growth, below the increase in the company’s revenue.
General and Administrative Expenses
In 3Q16, general and administrative expenses totaled R$ 19.6 million, a fall of 5.9% against 3Q15, evidencing the company’s effort
to keep its expenses under control.
133.0152.2
3Q15 3Q16
AREZZO&CO
349.5396.1
9M15 9M16
Earnings Release - 3Q16
Gráfico EBITDA
ARZZ x BR
EBITDA
2.0%
12.5%
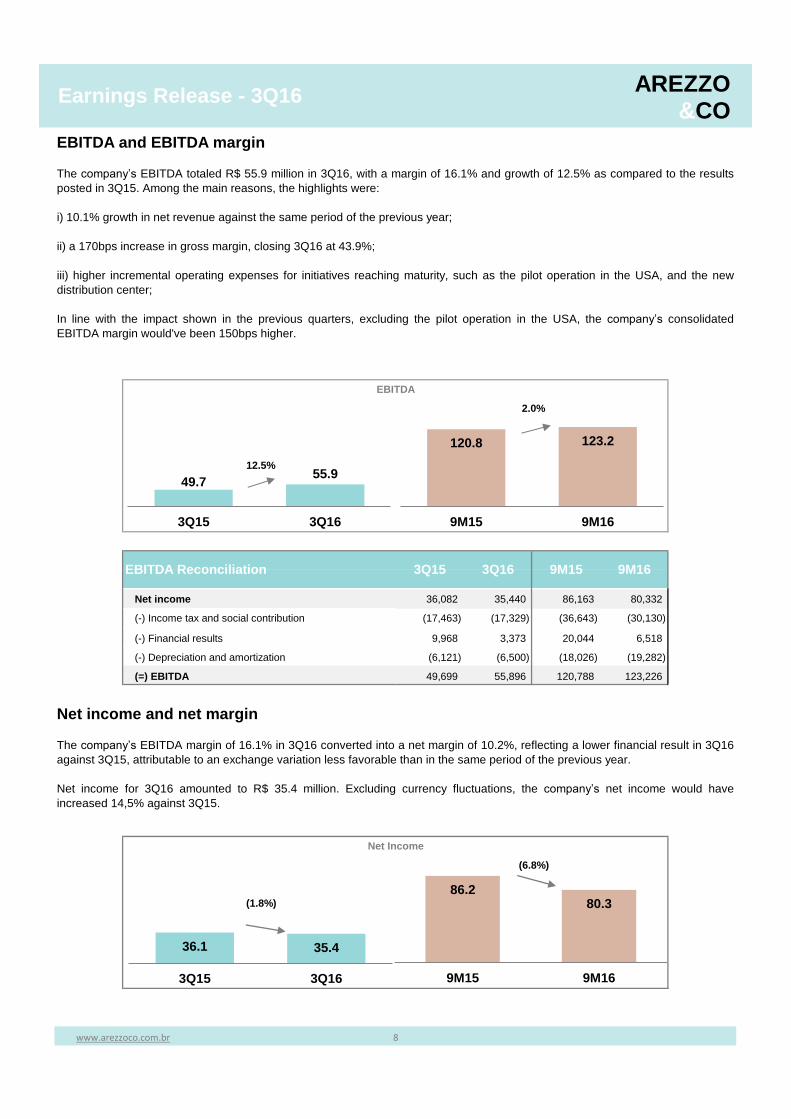
Net income 36,082 35,440 86,163 80,332 Gráfico LL
(-) Income tax and social contribution (17,463) (17,329) (36,643) (30,130)
(-) Financial results 9,968 3,373 20,044 6,518
(-) Depreciation and amortization (6,121) (6,500) (18,026) (19,282)
(=) EBITDA 49,699 55,896 120,788 123,226
Net Income
(6.8%)
(1.8%)
www.arezzoco.com.br 8
EBITDA and EBITDA margin
The company’s EBITDA totaled R$ 55.9 million in 3Q16, with a margin of 16.1% and growth of 12.5% as compared to the results
posted in 3Q15. Among the main reasons, the highlights were:
i) 10.1% growth in net revenue against the same period of the previous year;
ii) a 170bps increase in gross margin, closing 3Q16 at 43.9%;
iii) higher incremental operating expenses for initiatives reaching maturity, such as the pilot operation in the USA, and the new
distribution center;
In line with the impact shown in the previous quarters, excluding the pilot operation in the USA, the company’s consolidated
EBITDA margin would've been 150bps higher.
Net income and net margin
The company’s EBITDA margin of 16.1% in 3Q16 converted into a net margin of 10.2%, reflecting a lower financial result in 3Q16
against 3Q15, attributable to an exchange variation less favorable than in the same period of the previous year.
Net income for 3Q16 amounted to R$ 35.4 million. Excluding currency fluctuations, the company’s net income would have
increased 14,5% against 3Q15.
EBITDA Reconciliation 3Q15 3Q16 9M15 9M16
86.280.3
9M15 9M16
36.1 35.4
3Q15 3Q16
49.755.9
3Q15 3Q16
AREZZO&CO
120.8 123.2
9M15 9M16
Earnings Release - 3Q16
Operating Cash Flow 3Q15 3Q16 Δ 15 x 16
(R$)
Δ 15 x 16
(%) 9M15 9M16
Δ 15 x 16
(R$)
Δ 15 x 16
(%)
53,545 52,769 (776) (1.4%) 122,806 110,462 (12,344) (10.1%)
6,121 6,500 379 6.2% 18,026 19,282 1,256 7.0%
1,169 (880) (2,049) n/a (17) (22,555) (22,538) n/a
(46,494) (21,674) 24,820 (53.4%) (74,957) (31,950) 43,007 (57.4%)
(50,216) (50,634) (418) 0.8% (63,630) (53,991) 9,639 (15.1%)
(5,839) 3,741 9,580 n/a (25,442) (17,917) 7,525 (29.6%)
15,857 21,930 6,073 38.3% 31,428 38,169 6,741 21.4%
(6,296) 3,289 9,585 n/a (17,313) 1,789 19,102 n/a
(9,733) (10,672) (939) 9.6% (23,861) (19,209) 4,652 (19.5%)
4,608 26,043 21,435 465.2% 41,997 56,030 14,033 33.4%
Summary of investments 3Q15 3Q16 Δ 15 x 16
(%) 9M15 9M16
Δ 15 x 16
(%)
Total CAPEX 4,680 5,343 14.2% 20,763 20,783 0.1%
Stores - expansion and refurbishing 1,158 856 (26.0%) 3,197 5,801 81.4%
Corporate 3,241 3,174 (2.1%) 14,820 8,336 (43.8%)
Other 281 1,313 366.5% 2,746 6,646 142.0%
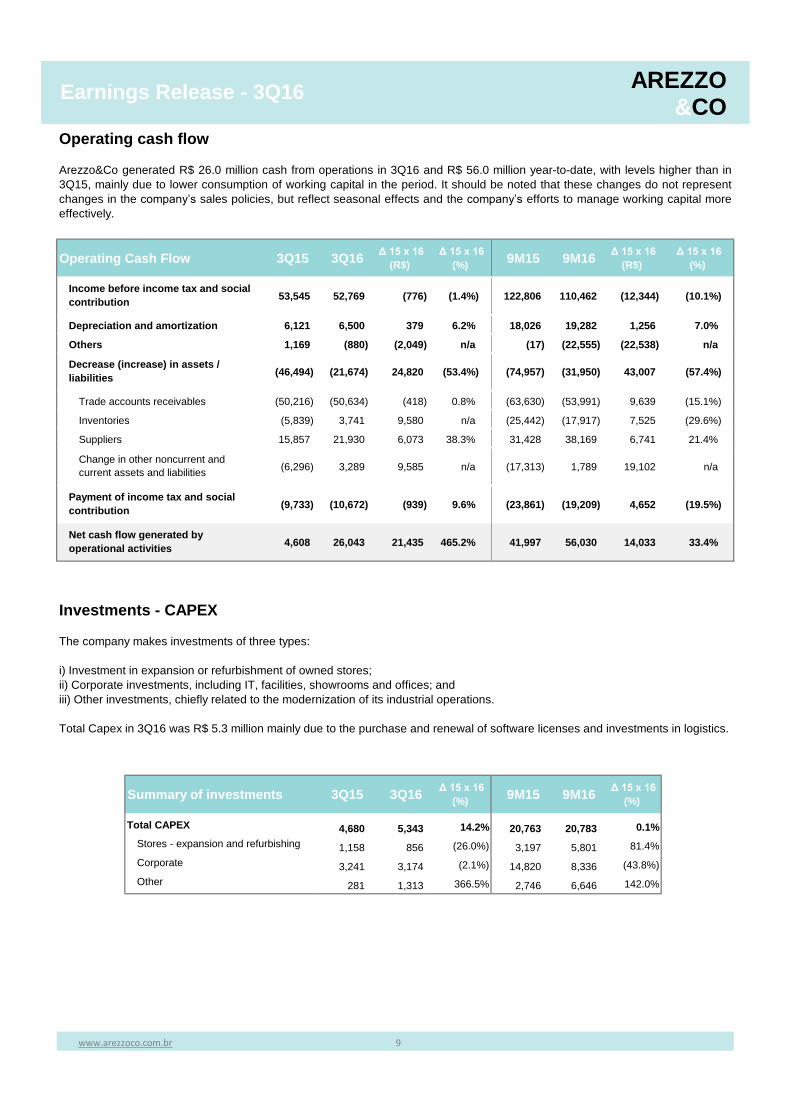
Operating cash flow
Arezzo&Co generated R$ 26.0 million cash from operations in 3Q16 and R$ 56.0 million year-to-date, with levels higher than in
3Q15, mainly due to lower consumption of working capital in the period. It should be noted that these changes do not represent
changes in the company’s sales policies, but reflect seasonal effects and the company’s efforts to manage working capital more
effectively.
Investments - CAPEX
The company makes investments of three types:
i) Investment in expansion or refurbishment of owned stores;
ii) Corporate investments, including IT, facilities, showrooms and offices; and
iii) Other investments, chiefly related to the modernization of its industrial operations.
Total Capex in 3Q16 was R$ 5.3 million mainly due to the purchase and renewal of software licenses and investments in logistics.
www.arezzoco.com.br 9
Income before income tax and social
contribution
Depreciation and amortization
Others
Payment of income tax and social
contribution
Net cash flow generated by
operational activities
Decrease (increase) in assets /
liabilities
Trade accounts receivables
Inventories
Suppliers
Change in other noncurrent and
current assets and liabilities
AREZZO&CO
Earnings Release - 3Q16
3Q15 2Q16 3Q16
Cash 193,486 223,764 221,591
Total debt 126,928 97,535 95,785
Short term 98,422 65,642 66,424
% total debt 77.5% 67.3% 69.3%
Long-term 28,506 31,893 29,361
% total debt 22.5% 32.7% 30.7%
Net debt (66,558) (126,229) (125,806)
3Q14 3Q15 3Q16Δ 15 x 16
(%)
151,794 145,373 142,470 (2.0%)
(50,070) (46,200) (38,381) (16.9%)
101,724 99,173 104,089 5.0%
302,987 341,839 344,943 0.9%
156,237 168,276 162,540 (3.4%)
8,107 23,276 31,450 35.1%
467,331 533,391 538,933 1.0%
500,361 536,162 7.2%
ROIC6
19.8% 19.4%
Average invested capital⁵
www.arezzoco.com.br 10
(1) Does not include a non-cash, non-recurring impact of R$8.7 million due to the implementation of the new ERP in 4Q14.
(2) An impact of R$2.8 million has been made to reflect the above-mentioned effect on EBIT for the last 12 months.
(3) Working Capital: current assets minus cash, cash equivalents and financial investments less current liabilities minus loans and
financing and dividends payable.
(4) Less deferred income tax and social contribution.
(5) Average invested capital in the period and same period previous year.
(6) ROIC: NOPAT for the last 12 months divided by average invested capital.
Working Capital³
Permanent assets
Invested capital⁴
Other long-term assets
+ IR and CS (LTM)²
NOPAT
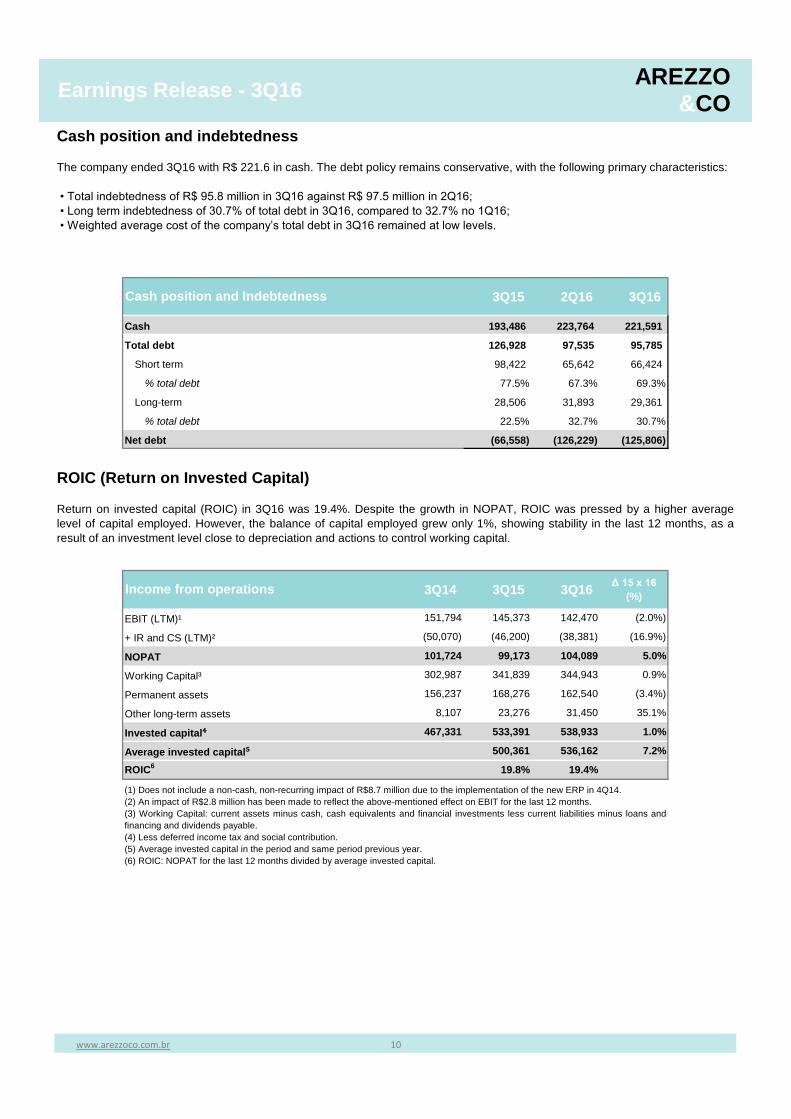
Cash position and indebtedness
The company ended 3Q16 with R$ 221.6 in cash. The debt policy remains conservative, with the following primary characteristics:
• Total indebtedness of R$ 95.8 million in 3Q16 against R$ 97.5 million in 2Q16;
• Long term indebtedness of 30.7% of total debt in 3Q16, compared to 32.7% no 1Q16;
• Weighted average cost of the company’s total debt in 3Q16 remained at low levels.
Cash position and Indebtedness
Income from operations
EBIT (LTM)¹
ROIC (Return on Invested Capital)
Return on invested capital (ROIC) in 3Q16 was 19.4%. Despite the growth in NOPAT, ROIC was pressed by a higher average
level of capital employed. However, the balance of capital employed grew only 1%, showing stability in the last 12 months, as a
result of an investment level close to depreciation and actions to control working capital.
AREZZO&CO
Earnings Release - 3Q16
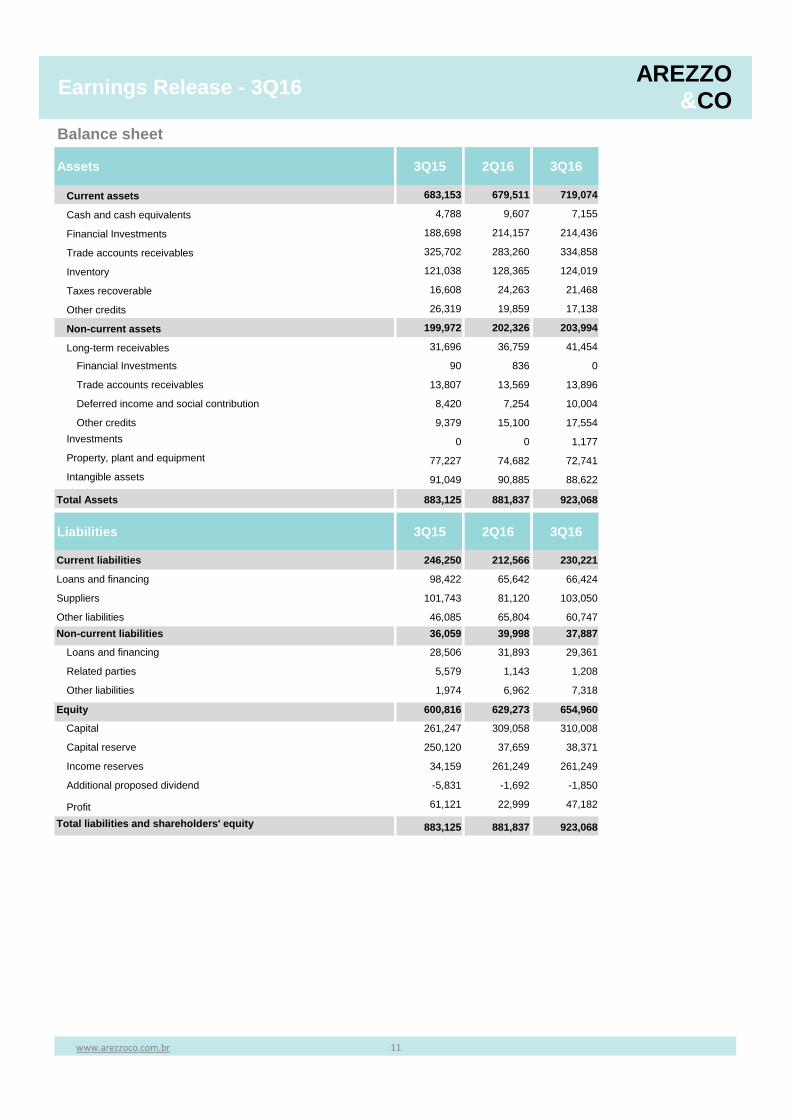
Balance sheet
Assets 3Q15 2Q16 3Q16
Current assets 683,153 679,511 719,074
Cash and cash equivalents 4,788 9,607 7,155
Financial Investments 188,698 214,157 214,436
Trade accounts receivables 325,702 283,260 334,858
Inventory 121,038 128,365 124,019
Taxes recoverable 16,608 24,263 21,468
Other credits 26,319 19,859 17,138
Non-current assets 199,972 202,326 203,994
Long-term receivables 31,696 36,759 41,454
Financial Investments 90 836 0
Trade accounts receivables 13,807 13,569 13,896
Deferred income and social contribution 8,420 7,254 10,004
Other credits 9,379 15,100 17,554
Investments 0 0 1,177
Property, plant and equipment 77,227 74,682 72,741
Intangible assets 91,049 90,885 88,622
Total Assets 883,125 881,837 923,068 0
Liabilities 3Q15 2Q16 3Q16
Current liabilities 246,250 212,566 230,221
Loans and financing 98,422 65,642 66,424
Suppliers 101,743 81,120 103,050
Other liabilities 46,085 65,804 60,747
Non-current liabilities 36,059 39,998 37,887
Loans and financing 28,506 31,893 29,361
Related parties 5,579 1,143 1,208
Other liabilities 1,974 6,962 7,318
Equity 600,816 629,273 654,960
Capital 261,247 309,058 310,008
Capital reserve 250,120 37,659 38,371
Income reserves 34,159 261,249 261,249
Additional proposed dividend -5,831 -1,692 -1,850
Profit 61,121 22,999 47,182
Total liabilities and shareholders' equity 883,125 881,837 923,068
www.arezzoco.com.br 11
AREZZO&CO
Earnings Release - 3Q16
Cash Flow - IFRS
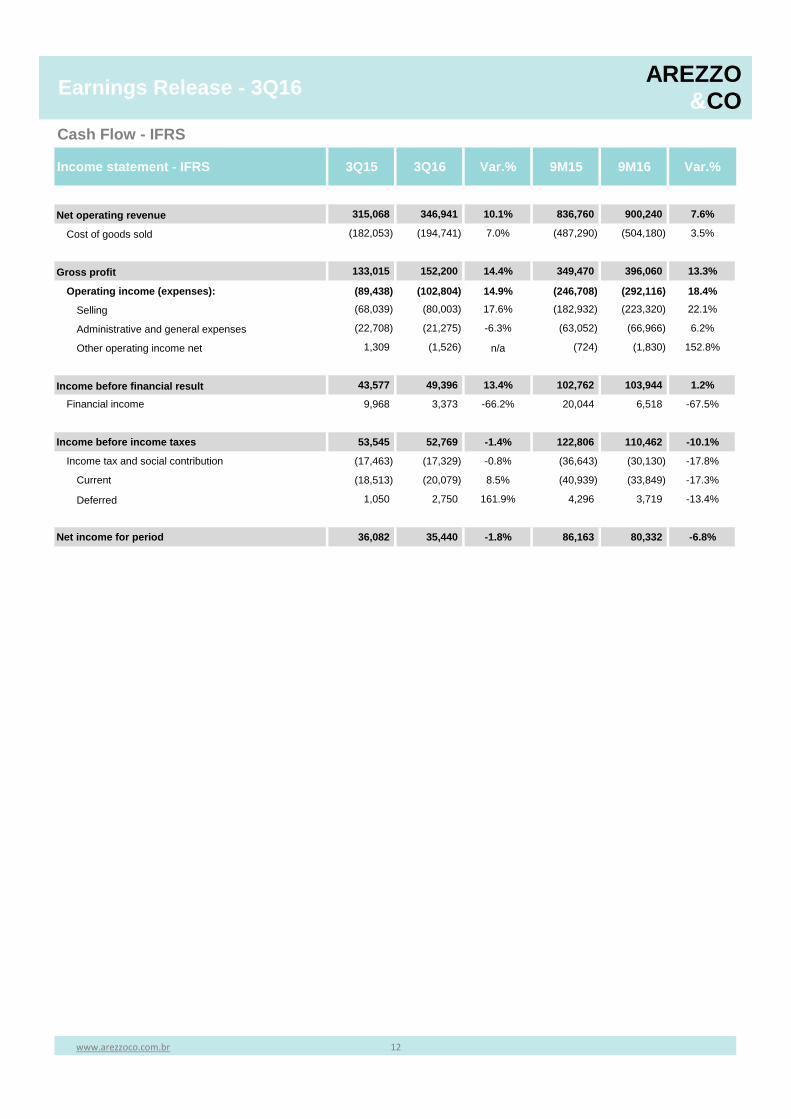
Income statement - IFRS 3Q15 3Q16 Var.% 9M15 9M16 Var.%
Net operating revenue 315,068 346,941 10.1% 836,760 900,240 7.6%
Cost of goods sold (182,053) (194,741) 7.0% (487,290) (504,180) 3.5%
Gross profit 133,015 152,200 14.4% 349,470 396,060 13.3%
Operating income (expenses): (89,438) (102,804) 14.9% (246,708) (292,116) 18.4%
Selling (68,039) (80,003) 17.6% (182,932) (223,320) 22.1%
Administrative and general expenses (22,708) (21,275) -6.3% (63,052) (66,966) 6.2%
Other operating income net 1,309 (1,526) n/a (724) (1,830) 152.8%
Income before financial result 43,577 49,396 13.4% 102,762 103,944 1.2%
Financial income 9,968 3,373 -66.2% 20,044 6,518 -67.5%
Income before income taxes 53,545 52,769 -1.4% 122,806 110,462 -10.1%
Income tax and social contribution (17,463) (17,329) -0.8% (36,643) (30,130) -17.8%
Current (18,513) (20,079) 8.5% (40,939) (33,849) -17.3%
Deferred 1,050 2,750 161.9% 4,296 3,719 -13.4%
Net income for period 36,082 35,440 -1.8% 86,163 80,332 -6.8%
www.arezzoco.com.br 12
AREZZO&CO
Earnings Release - 3Q16
Cash Flow - IFRS
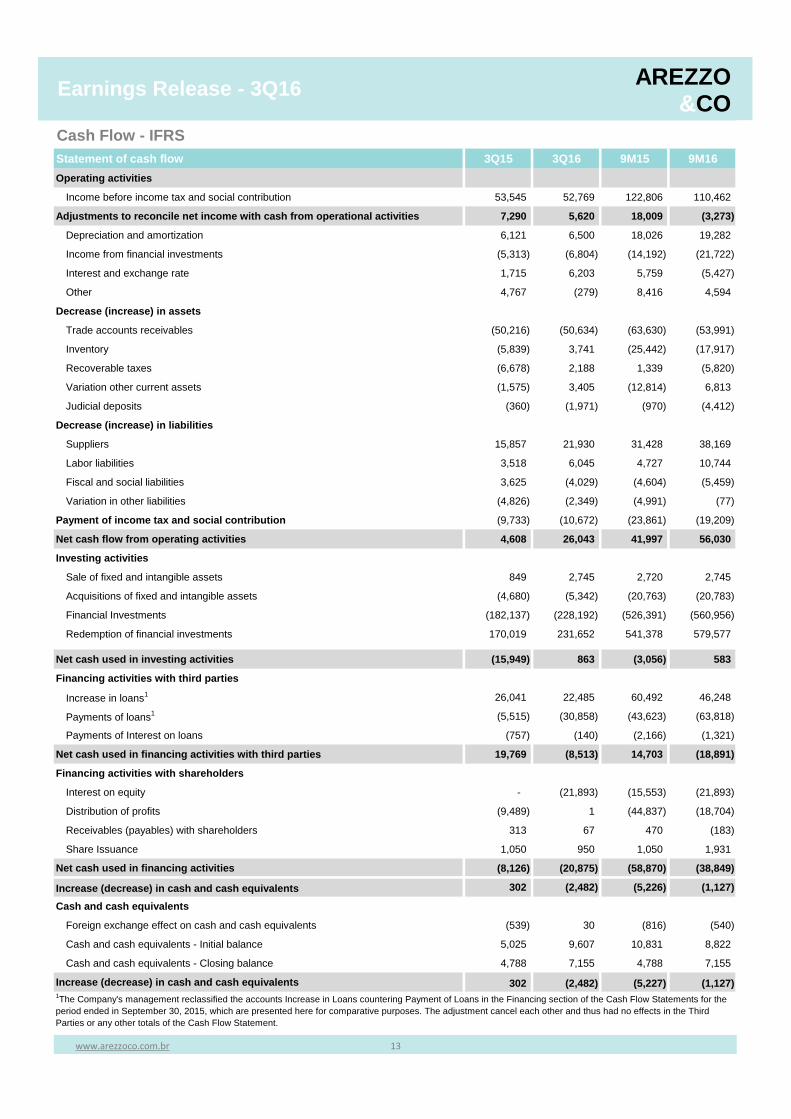
Statement of cash flow 3Q15 3Q16 9M15 9M16
Operating activities
Income before income tax and social contribution 53,545 52,769 122,806 110,462
Adjustments to reconcile net income with cash from operational activities 7,290 5,620 18,009 (3,273)
Depreciation and amortization 6,121 6,500 18,026 19,282
Income from financial investments (5,313) (6,804) (14,192) (21,722)
Interest and exchange rate 1,715 6,203 5,759 (5,427)
Other 4,767 (279) 8,416 4,594
Decrease (increase) in assets
Trade accounts receivables (50,216) (50,634) (63,630) (53,991)
Inventory (5,839) 3,741 (25,442) (17,917)
Recoverable taxes (6,678) 2,188 1,339 (5,820)
Variation other current assets (1,575) 3,405 (12,814) 6,813
Judicial deposits (360) (1,971) (970) (4,412)
Decrease (increase) in liabilities
Suppliers 15,857 21,930 31,428 38,169
Labor liabilities 3,518 6,045 4,727 10,744
Fiscal and social liabilities 3,625 (4,029) (4,604) (5,459)
Variation in other liabilities (4,826) (2,349) (4,991) (77)
Payment of income tax and social contribution (9,733) (10,672) (23,861) (19,209)
Net cash flow from operating activities 4,608 26,043 41,997 56,030
Investing activities
Sale of fixed and intangible assets 849 2,745 2,720 2,745
Acquisitions of fixed and intangible assets (4,680) (5,342) (20,763) (20,783)
Financial Investments (182,137) (228,192) (526,391) (560,956)
Redemption of financial investments 170,019 231,652 541,378 579,577
Net cash used in investing activities (15,949) 863 (3,056) 583
Financing activities with third parties
Increase in loans1 26,041 22,485 60,492 46,248
Payments of loans1 (5,515) (30,858) (43,623) (63,818)
Payments of Interest on loans (757) (140) (2,166) (1,321)
Net cash used in financing activities with third parties 19,769 (8,513) 14,703 (18,891)
Financing activities with shareholders
Interest on equity - (21,893) (15,553) (21,893)
Distribution of profits (9,489) 1 (44,837) (18,704)
Receivables (payables) with shareholders 313 67 470 (183)
Share Issuance 1,050 950 1,050 1,931
Net cash used in financing activities (8,126) (20,875) (58,870) (38,849)
Increase (decrease) in cash and cash equivalents 302 (2,482) (5,226) (1,127)
Cash and cash equivalents
Foreign exchange effect on cash and cash equivalents (539) 30 (816) (540)
Cash and cash equivalents - Initial balance 5,025 9,607 10,831 8,822
Cash and cash equivalents - Closing balance 4,788 7,155 4,788 7,155
Increase (decrease) in cash and cash equivalents 302 (2,482) (5,227) (1,127)
www.arezzoco.com.br 13
1The Company's management reclassified the accounts Increase in Loans countering Payment of Loans in the Financing section of the Cash Flow Statements for the
period ended in September 30, 2015, which are presented here for comparative purposes. The adjustment cancel each other and thus had no effects in the Third
Parties or any other totals of the Cash Flow Statement.
AREZZO&CO
Earnings Release - 3Q16
Importante Notice
Information contained herein may include forward-looking statements and reflects management's current view and estimates
concerning the evolution of the macro-economic environment, industry conditions, company performance, and financial results.
Any statements, expectations, capabilities, plans and assumptions contained in this document that do not describe historical facts,
such as statements regarding declaration or payment of dividends, the future course of operations, the implementation of material
operational and financial strategies, the investment program, and the factors or trends affecting financial condition, liquidity or
results from operations, are deemed forward-looking statements as defined in the U.S. Private Securities Litigation Reform Act of
1995 and involve a number of risks and uncertainties. There is no guarantee that these results will actually materialize. Statements
are based on many assumptions and factors, including economic and market conditions, industry conditions, and operating factors.
Any changes in such assumptions or factors could cause actual results to differ materially from current expectations. Arezzo&Co’s
consolidated financial information presented herein complies with International Financial Reporting Standards (IFRS) issued by the
International Accounting Standards Board (IASB), based on audited financial data. Non-financial and other operating information
has not been audited by independent auditors.
www.arezzoco.com.br 14
AREZZO&CO