Embed Size (px)
Citation preview
Adopted by the EQC 02/22/07 1
Portland-Vancouver Air Quality Maintenance Area
(Oregon Portion) and
Salem-Keizer Area Ozone Maintenance Plan
Oregon Department of Environmental Quality 811 SW Sixth Avenue Portland, OR 97204
Adopted by the Environmental Quality Commission
February 22, 2007
Adopted by the EQC 02/22/07 2
Oregon State Implementation Plan
Section 4.50
Portland-Vancouver AQMA (Oregon portion)
And Salem-Keizer Area
8-hour Ozone Maintenance Plan
Table of Contents
Section Subsection Section Heading Page Executive Summary 5
4.50.1 Background 6 4.50.1.1 • Portland-Vancouver AQMA (Oregon portion) 7 4.50.1.2 • Salem SKATS 8
4.50.2 Ozone Trends and Compliance with Standards 104.50.3 Attainment Inventory (2002) 124.50.4 Control Strategies 14
4.50.4.1 • Portland-Vancouver AQMA (Oregon portion) 14 4.50.4.2 • Salem SKATS 19
4.50.5 Maintenance Demonstration 20 4.50.5.1 • Ozone Modeling Study 20 4.50.5.2 • Growth Projections 21 4.50.5.3 • Forecast and Maintenance Inventory (2015) 22 4.50.5.4 • Maintenance Demonstration (2015) 26
4.50.6 Air Quality Monitoring 274.50.7 Contingency Plan 28
4.50.7.1 • Request to Remove 1-hour Contingency Plan 28 4.50.7.2 • Portland-Vancouver AQMA 28 4.50.7.3 • Salem SKATS 30
4.50.8 Verification of Continued Attainment 31 For more information If you have questions or would like more information, including a copy of the proposed rule revisions or appendices, please contact David Collier at DEQ’s Air Quality Division in Portland at (503) 229-5946, or [email protected].
Adopted by the EQC 02/22/07 3
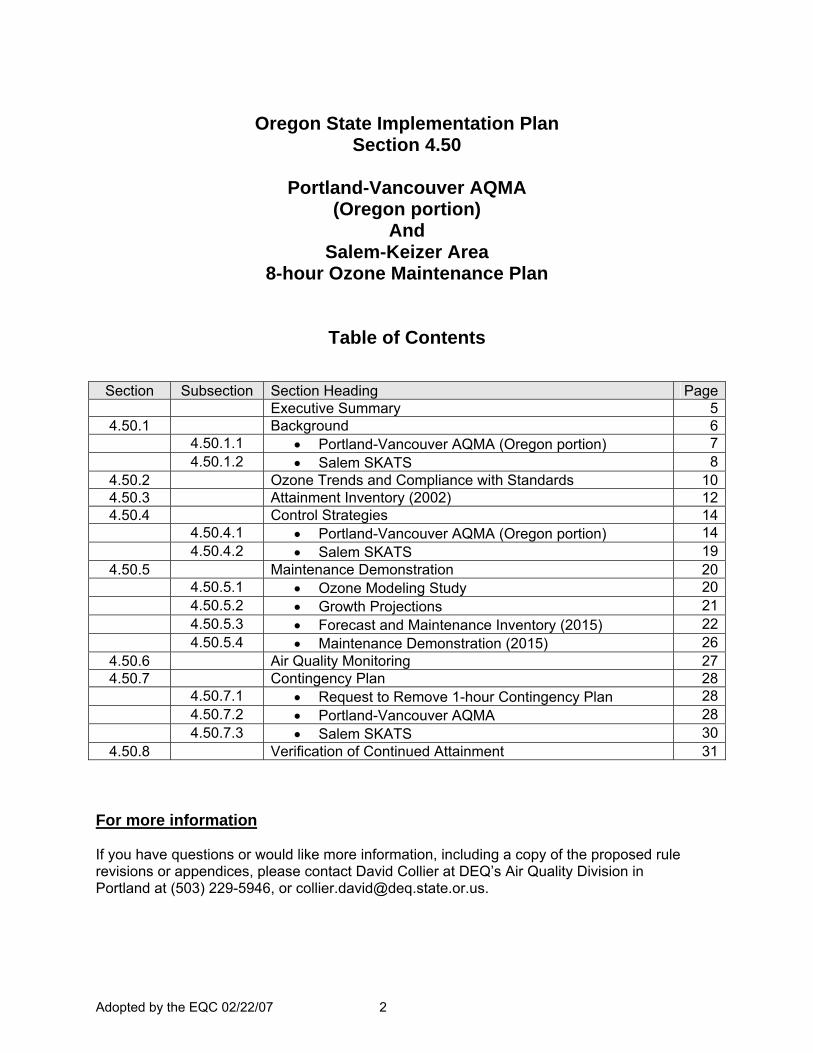
List of Tables Table No. Subject Page
1 8-hour Ozone, Maximum Values (1998, 2003-2005) 112 8-hour Ozone, Fourth High Design Values (1998, 2003-2005) 123 Portland and Salem 2002 Annual Emissions (tons/year) 134 Portland Area 2002 Attainment Inventories (lb/day) 135 Salem Area 2002 Attainment Inventories (lb/day) 146 Portland and Salem Area Population Projections 217 Portland-Area 2015 Maintenance Demonstration (lb/day, tons/year) 248 Portland Area VOC and NOx Emissions (lb/day), % Change 249 Salem-Area 2015 Maintenance Demonstration (lb/day) 25
10 Salem Area VOC and NOx Emissions (lb/day), % Change 2511 2015 Maintenance Demonstration (ozone values) 2712 Portland Area VOC and NOx and CO Emissions (tons/year) 4013 Salem Area VOC and NOx and CO Emissions (tons/year) 4014 2002 Emissions Inventory Grouped by Source Category Codes 4715 2015 Emissions Inventory Grouped by Source Category Codes 48
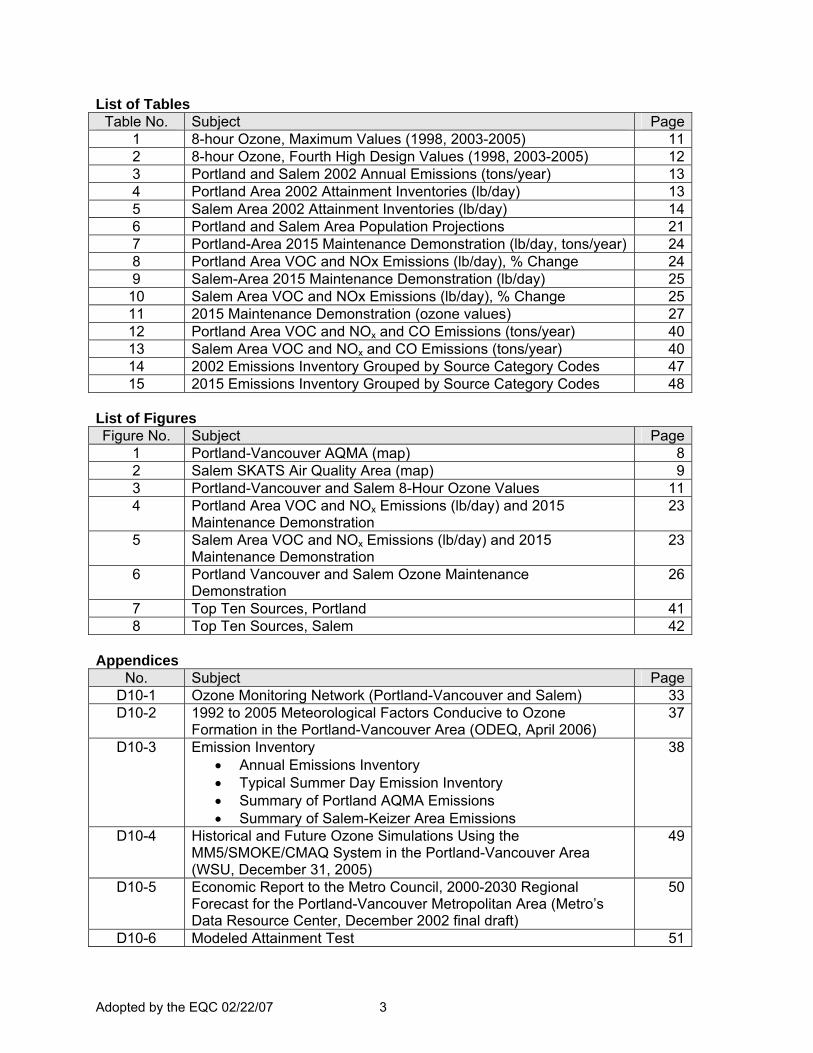
List of Figures Figure No. Subject Page
1 Portland-Vancouver AQMA (map) 82 Salem SKATS Air Quality Area (map) 93 Portland-Vancouver and Salem 8-Hour Ozone Values 114 Portland Area VOC and NOx Emissions (lb/day) and 2015
Maintenance Demonstration 23
5 Salem Area VOC and NOx Emissions (lb/day) and 2015 Maintenance Demonstration
23
6 Portland Vancouver and Salem Ozone Maintenance Demonstration
26
7 Top Ten Sources, Portland 418 Top Ten Sources, Salem 42
Appendices
No. Subject PageD10-1 Ozone Monitoring Network (Portland-Vancouver and Salem) 33D10-2 1992 to 2005 Meteorological Factors Conducive to Ozone
Formation in the Portland-Vancouver Area (ODEQ, April 2006) 37
D10-3 Emission Inventory • Annual Emissions Inventory • Typical Summer Day Emission Inventory • Summary of Portland AQMA Emissions • Summary of Salem-Keizer Area Emissions
38
D10-4 Historical and Future Ozone Simulations Using the MM5/SMOKE/CMAQ System in the Portland-Vancouver Area (WSU, December 31, 2005)
49
D10-5 Economic Report to the Metro Council, 2000-2030 Regional Forecast for the Portland-Vancouver Metropolitan Area (Metro’s Data Resource Center, December 2002 final draft)
50
D10-6 Modeled Attainment Test 51
Adopted by the EQC 02/22/07 4
4.50.0 Acknowledgement and Summary 4.50.0.1 Acknowledgements Without the efforts of numerous individuals in state and local governments who are dedicated to healthy air, this maintenance plan would not have been possible. Special appreciation goes to: Principal Authors: Marianne Fitzgerald and David Collier, DEQ Air Quality Planning Principal Contributors: Oregon Department of Environmental Quality Andy Ginsburg Division Administrator, Air Quality Dick Pedersen` Division Administrator, Northwest Region David Collier Manager, Air Quality Planning Cory Ann Wind Acting Manager, Northwest Region Air Quality Cheryll Hutchens Manager, Western Region Air Quality Gerry Preston Manager, Air Quality Technical Services Jeffrey Stocum Acting Manager, Air Quality Technical Services Wes Risher Air Quality Technical Services Svetlana Lazarev Air Quality Technical Services Chris Swab Air Quality Technical Services Phil Allen Air Quality Technical Services Susan Drake Northwest Region Air Quality Karen White-Fallon Western Region Air Quality Southwest Clean Air Agency Bob Elliott Executive Director Paul Mairose Chief Engineer Wade Strange Air Quality Engineer (former) Laurie Hulse-Moyer Air Quality Scientist Washington Department of Ecology Doug Schneider Air Quality Program, SIP Coordination Clint Bowman Air Quality Program, Meteorology Sally Otterson Air Quality Program, Emission Inventories Cristiana Figueroa-Kaminsky Air Quality Program (former) Metro Mark Turpel Pam Peck Andy Cotugno Salem-Keizer Area Transportation Study Mike Jaffe
Adopted by the EQC 02/22/07 5
4.50.0.2 Executive Summary The Portland area has violated federal clean air standards for ground level ozone (commonly known as smog) as recently as 1998. In 1996, the Oregon Department of Environmental Quality (DEQ) and the Southwest Clean Air Agency (SWCAA) developed Ozone Maintenance Plans for the Portland-Vancouver Air Quality Maintenance Area (AQMA) that included several strategies to reduce air pollutants and ensure compliance with the one-hour ozone standard. These strategies were successful in reducing smog forming emissions and no violations of the ozone standard have occurred in the Portland-Vancouver area since 1998. In 1997, the U. S. Environmental Protection Agency (EPA) revised the national ambient air quality standard (NAAQS) for ozone from a one-hour average of 0.12 parts per million (ppm) to an 8-hour average of 0.08 ppm, and in 2005 EPA revoked the one-hour ozone standard. This 2006 ozone maintenance plan is a revision to the 1996 maintenance plan for the Portland-Vancouver area, and ensures continued compliance with the new 8-hour ozone standard through at least 2015. The plan also includes an ozone maintenance plan for the Salem-Keizer Area Transportation Study (SKATS) air quality area. Both the Portland-Vancouver and Salem areas are included in the ozone modeling and maintenance analysis. An ozone maintenance plan update for the Vancouver portion of the Portland-Vancouver AQMA is being prepared by the Southwest Clean Air Agency in Vancouver, Washington. These plans are required by the federal Clean Air Act, federal regulations and EPA guidance. This 2006 maintenance plan continues the same strategies adopted for the Portland-Vancouver AQMA in 1996 to reduce and manage volatile organic compounds (VOC) and nitrogen oxide (NOx) emissions. Air quality data and projections show that ozone levels can still occasionally approach or exceed the 8-hour ozone standard in the Portland-Vancouver area, but that with the existing strategies in place, both the Portland and Salem areas will maintain compliance with the 8-hour ozone standard. The suite of strategies described below work together to protect air quality as growth and population pressures increase over the next ten years. Implementing this suite of strategies will also reduce emissions of air toxics and greenhouse gases that are important emerging issues of concern. The following strategies will remain in the Portland-Vancouver Ozone Maintenance Plan as they currently apply to sources in the Portland area:
• Motor Vehicle Inspection Program; • Emission Standards for Industrial Sources of VOC; • New Source Review Program for new and expanding major industrial facilities; • Voluntary Parking Ratio Rules; • Barge Loading Rules that control VOCs from gasoline delivery operations; • Aerosol Paint Rules that lower VOC content from spray paints sold in the Portland area; • Motor Vehicle Refinishing Rules that require low-emitting painting methods at autobody
repair shops; and • Public education and outreach that encourages people to voluntarily reduce emissions,
such as not mowing lawns and driving less on Clean Air Action Days (now called Air Pollution Advisories).
Strategies that have reduced VOC emissions in the Salem SKATS air quality area will also remain in place, including emission standards for existing industrial sources of VOC. The 2006 maintenance plan includes updates to several programs:

Adopted by the EQC 02/22/07 6
• Revised rules for Employee Commute Options in the Portland Area to reduce administrative burdens while maintaining alternative commute programs at larger employers;
• Updated rules for Industrial Emission Management in the Portland area, to reestablish the growth allowance for new and expanding major industrial sources and ensure that the ozone standard will not be violated even under conservative industrial growth assumptions;
• Designated Salem/SKATS as an ozone maintenance area under state rules; • Revised rules for new and expanding major industrial sources in the Salem area, to
remove the most stringent industrial emission control equipment requirements for sources in nonattainment areas, known as Lowest Achievable Emission Rate, and replace them with emission control requirements known as Best Achievable Control Technology that are consistent with what is required in Portland and continue to provide a high level of emission control; and
• Amended DEQ rules to reflect the new federal ozone air quality standard, from the old one-hour standard (which EPA has revoked) to the current federal 8-hour standard of 0.08 ppm, three year rolling average.
DEQ is tracking legal issues which may result in a need to amend the maintenance plan in the future. This maintenance plan was prepared under the guidance of EPA’s 2004 Final Rule to Implement the 8-Hour Ozone NAAQS-Phase 1 (69 FR 23951, 40 CFR 51.900). On December 22, 2006 the U.S. Court of Appeals released a decision to “vacate the 2004 rule and remand the matter to EPA” (South Coast Air Quality Management District v. EPA). In particular, the court ruled that certain requirements adopted for the 1-hour ozone standard, such as conformity and contingency plans, must be retained to prevent backsliding. Depending on how EPA interprets the court’s decision in new guidance and rules, this maintenance plan may need to be amended. In the interim, the existing 1-hour ozone maintenance plan requirements will remain federally enforceable until EPA approves this 8-hour ozone maintenance plan. 4.50.1 Background Ground level ozone, also known as smog, is an air pollutant formed in the atmosphere by a chemical reaction of volatile organic compounds (VOC) and oxides of nitrogen (NOx). This reaction is most intense on hot summer days with poor ventilation. Ozone is a strong respiratory system irritant that aggravates respiratory illnesses, impairs athletic performance, and can cause permanent respiratory system damage. Ozone can be especially harmful to older people and children, and can damage crops and other materials. In the past, motor vehicles and industrial operations have been the major sources of ozone precursors. Now, other sources such as household products, paints, construction equipment, watercraft and lawnmowers are major contributors to ozone formation. Historically, the Portland-Vancouver and Salem-Keizer areas violated the national ambient air quality standard (NAAQS) for ground level ozone1. The Portland-Vancouver Air Quality Maintenance Area (AQMA) and the Salem-Keizer Area Transportation Study (SKATS) areas were designated nonattainment for ozone on March 3, 1978 under the 1977 Clean Air Act Amendments. Plans were subsequently developed to reduce ozone precursor emissions of VOC and NOx, and bring the areas into compliance (attainment) with standards. Under the 1990 Clean Air Act Amendments, the Portland-Vancouver AQMA was designated a “marginal”
1 Ozone monitoring sites were established in Oregon beginning in the early 1970s (see Appendix D10-1).
Adopted by the EQC 02/22/07 7
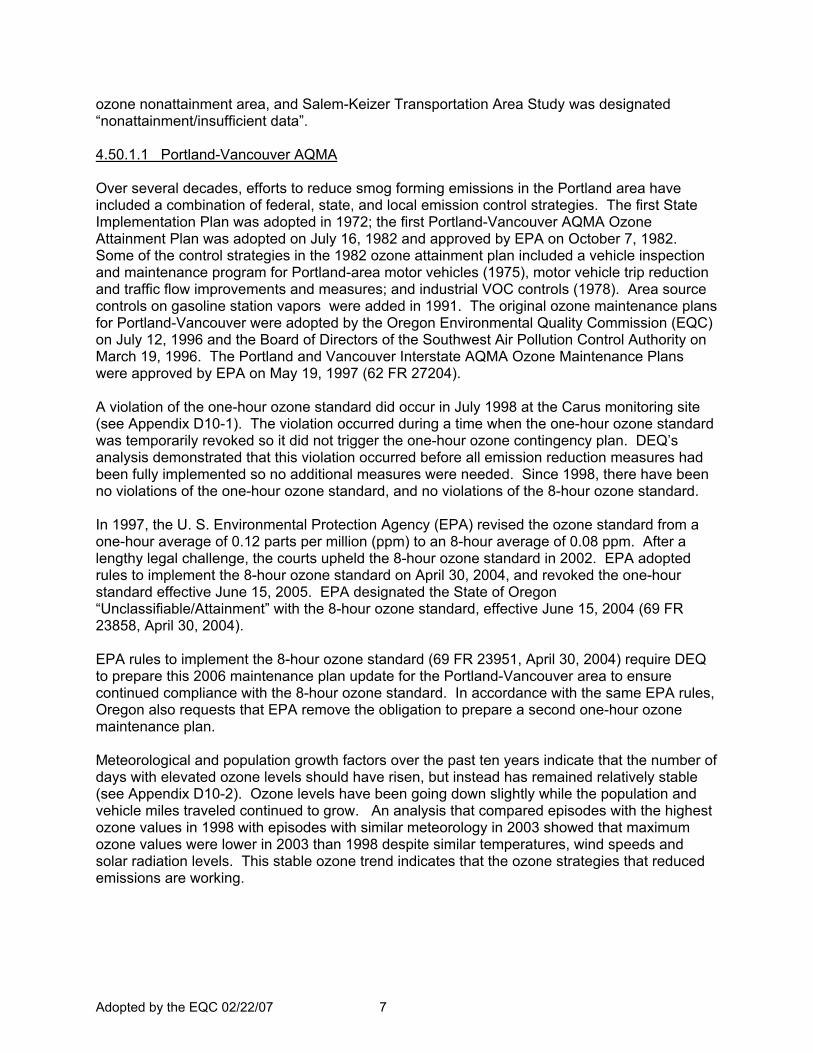
ozone nonattainment area, and Salem-Keizer Transportation Area Study was designated “nonattainment/insufficient data”. 4.50.1.1 Portland-Vancouver AQMA Over several decades, efforts to reduce smog forming emissions in the Portland area have included a combination of federal, state, and local emission control strategies. The first State Implementation Plan was adopted in 1972; the first Portland-Vancouver AQMA Ozone Attainment Plan was adopted on July 16, 1982 and approved by EPA on October 7, 1982. Some of the control strategies in the 1982 ozone attainment plan included a vehicle inspection and maintenance program for Portland-area motor vehicles (1975), motor vehicle trip reduction and traffic flow improvements and measures; and industrial VOC controls (1978). Area source controls on gasoline station vapors were added in 1991. The original ozone maintenance plans for Portland-Vancouver were adopted by the Oregon Environmental Quality Commission (EQC) on July 12, 1996 and the Board of Directors of the Southwest Air Pollution Control Authority on March 19, 1996. The Portland and Vancouver Interstate AQMA Ozone Maintenance Plans were approved by EPA on May 19, 1997 (62 FR 27204). A violation of the one-hour ozone standard did occur in July 1998 at the Carus monitoring site (see Appendix D10-1). The violation occurred during a time when the one-hour ozone standard was temporarily revoked so it did not trigger the one-hour ozone contingency plan. DEQ’s analysis demonstrated that this violation occurred before all emission reduction measures had been fully implemented so no additional measures were needed. Since 1998, there have been no violations of the one-hour ozone standard, and no violations of the 8-hour ozone standard. In 1997, the U. S. Environmental Protection Agency (EPA) revised the ozone standard from a one-hour average of 0.12 parts per million (ppm) to an 8-hour average of 0.08 ppm. After a lengthy legal challenge, the courts upheld the 8-hour ozone standard in 2002. EPA adopted rules to implement the 8-hour ozone standard on April 30, 2004, and revoked the one-hour standard effective June 15, 2005. EPA designated the State of Oregon “Unclassifiable/Attainment” with the 8-hour ozone standard, effective June 15, 2004 (69 FR 23858, April 30, 2004). EPA rules to implement the 8-hour ozone standard (69 FR 23951, April 30, 2004) require DEQ to prepare this 2006 maintenance plan update for the Portland-Vancouver area to ensure continued compliance with the 8-hour ozone standard. In accordance with the same EPA rules, Oregon also requests that EPA remove the obligation to prepare a second one-hour ozone maintenance plan. Meteorological and population growth factors over the past ten years indicate that the number of days with elevated ozone levels should have risen, but instead has remained relatively stable (see Appendix D10-2). Ozone levels have been going down slightly while the population and vehicle miles traveled continued to grow. An analysis that compared episodes with the highest ozone values in 1998 with episodes with similar meteorology in 2003 showed that maximum ozone values were lower in 2003 than 1998 despite similar temperatures, wind speeds and solar radiation levels. This stable ozone trend indicates that the ozone strategies that reduced emissions are working.
Adopted by the EQC 02/22/07 8
Figure 1: Portland-Vancouver Interstate Air Quality Maintenance Area
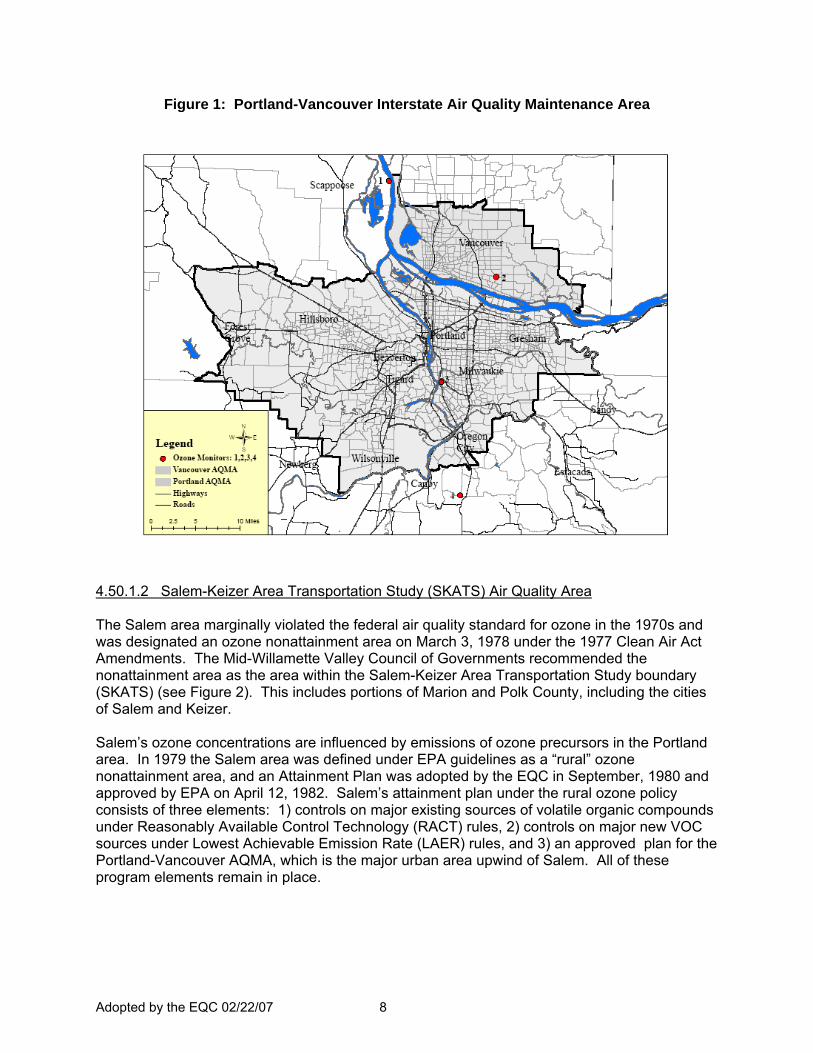
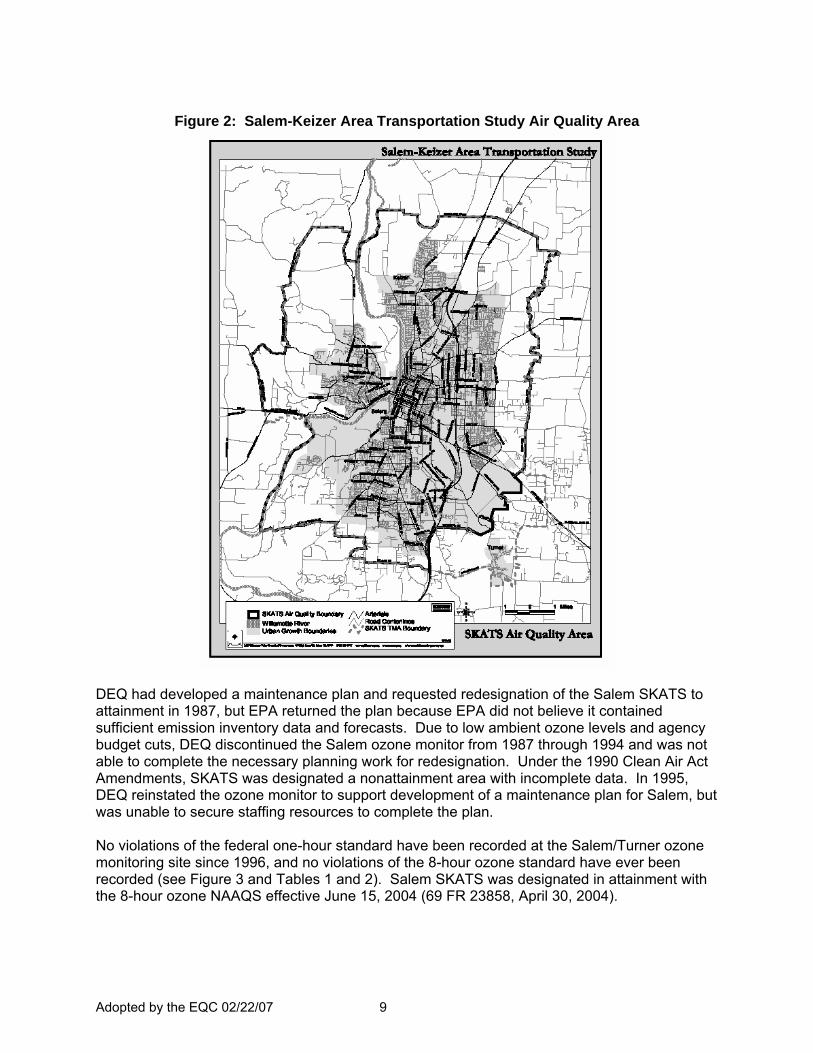
4.50.1.2 Salem-Keizer Area Transportation Study (SKATS) Air Quality Area The Salem area marginally violated the federal air quality standard for ozone in the 1970s and was designated an ozone nonattainment area on March 3, 1978 under the 1977 Clean Air Act Amendments. The Mid-Willamette Valley Council of Governments recommended the nonattainment area as the area within the Salem-Keizer Area Transportation Study boundary (SKATS) (see Figure 2). This includes portions of Marion and Polk County, including the cities of Salem and Keizer. Salem’s ozone concentrations are influenced by emissions of ozone precursors in the Portland area. In 1979 the Salem area was defined under EPA guidelines as a “rural” ozone nonattainment area, and an Attainment Plan was adopted by the EQC in September, 1980 and approved by EPA on April 12, 1982. Salem’s attainment plan under the rural ozone policy consists of three elements: 1) controls on major existing sources of volatile organic compounds under Reasonably Available Control Technology (RACT) rules, 2) controls on major new VOC sources under Lowest Achievable Emission Rate (LAER) rules, and 3) an approved plan for the Portland-Vancouver AQMA, which is the major urban area upwind of Salem. All of these program elements remain in place.
Adopted by the EQC 02/22/07 9
Figure 2: Salem-Keizer Area Transportation Study Air Quality Area
DEQ had developed a maintenance plan and requested redesignation of the Salem SKATS to attainment in 1987, but EPA returned the plan because EPA did not believe it contained sufficient emission inventory data and forecasts. Due to low ambient ozone levels and agency budget cuts, DEQ discontinued the Salem ozone monitor from 1987 through 1994 and was not able to complete the necessary planning work for redesignation. Under the 1990 Clean Air Act Amendments, SKATS was designated a nonattainment area with incomplete data. In 1995, DEQ reinstated the ozone monitor to support development of a maintenance plan for Salem, but was unable to secure staffing resources to complete the plan. No violations of the federal one-hour standard have been recorded at the Salem/Turner ozone monitoring site since 1996, and no violations of the 8-hour ozone standard have ever been recorded (see Figure 3 and Tables 1 and 2). Salem SKATS was designated in attainment with the 8-hour ozone NAAQS effective June 15, 2004 (69 FR 23858, April 30, 2004).
Adopted by the EQC 02/22/07 10
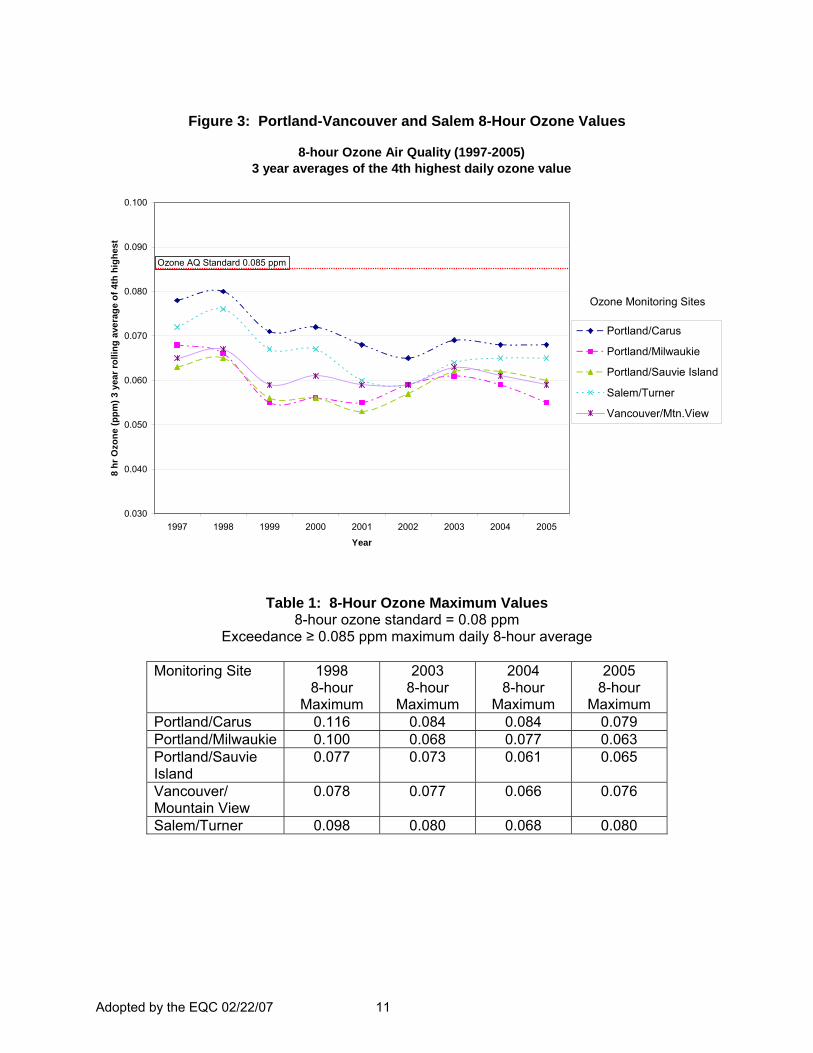
4.50.2 Ozone Trends and Compliance with Standards Figure 3 shows the ozone trends measured at monitoring sites for the Portland, Vancouver, and Salem areas for the period 1997 through 2005. Table 1 shows the highest maximum 8-hour average ozone concentrations measured for 19982, 2003, 2004, and 2005. While these peak values are important in assessing public health risk, they are not used to determine official compliance with the federal ozone standard. Compliance with the standard is based on a statistical method that looks at the three year average of the 4th highest (maximum 8-hr average) ozone value each year. If the three-year average of the 4th highest value at any monitoring site exceeds the standard, the area is in violation. Table 2 shows the rolling three-year average of 4th high values for 1998, 2003, 2004, and 2005. It is these “design values” that are compared to the 0.08 ppm ozone standard to determine compliance. Under EPA’s calculation convention, a value of 0.084 ppm would round down to 0.08 ppm (i.e. in compliance), while a value of 0.085 ppm or higher would be a violation. Key ozone monitoring sites include the “Carus” site in Portland, “Mountain View” site in Vancouver, and the “Turner” site in Salem (see Appendix D10-1). The values illustrated in Tables 1 and 2, together with the 2015 Maintenance Demonstration described in Section 4.50.5.4 show that ozone levels can still occasionally approach or exceed the 8-hour ozone standard in the Portland-Vancouver area, but that with the existing strategies in place, the region will maintain compliance with the 8-hour ozone standard. DEQ’s analysis in Section 4.50.5.4 suggests that there is not currently a need to add new ozone strategies for the Portland and Salem areas, but that existing emission reduction and growth management strategies should be continued with revisions described in Section 4.50.4.
2 1998 is included in the table because that year had the most recent violation of the 1-hour ozone standard in Portland and the July 1998 episode was used in the modeling analysis.
Adopted by the EQC 02/22/07 11
Figure 3: Portland-Vancouver and Salem 8-Hour Ozone Values
8-hour Ozone Air Quality (1997-2005)3 year averages of the 4th highest daily ozone value
0.030
0.040
0.050
0.060
0.070
0.080
0.090
0.100
1997 1998 1999 2000 2001 2002 2003 2004 2005
Year
8 hr
Ozo
ne (p
pm) 3
yea
r rol
ling
aver
age
of 4
th h
ighe
st
Portland/Carus
Portland/Milwaukie
Portland/Sauvie Island
Salem/Turner
Vancouver/Mtn.View
Ozone AQ Standard 0.085 ppm
Ozone Monitoring Sites
Table 1: 8-Hour Ozone Maximum Values 8-hour ozone standard = 0.08 ppm
Exceedance ≥ 0.085 ppm maximum daily 8-hour average
Monitoring Site 1998 8-hour
Maximum
2003 8-hour
Maximum
2004 8-hour
Maximum
2005 8-hour
Maximum Portland/Carus 0.116 0.084 0.084 0.079 Portland/Milwaukie 0.100 0.068 0.077 0.063 Portland/Sauvie Island
0.077 0.073 0.061 0.065
Vancouver/ Mountain View
0.078 0.077 0.066 0.076
Salem/Turner 0.098 0.080 0.068 0.080
Adopted by the EQC 02/22/07 12
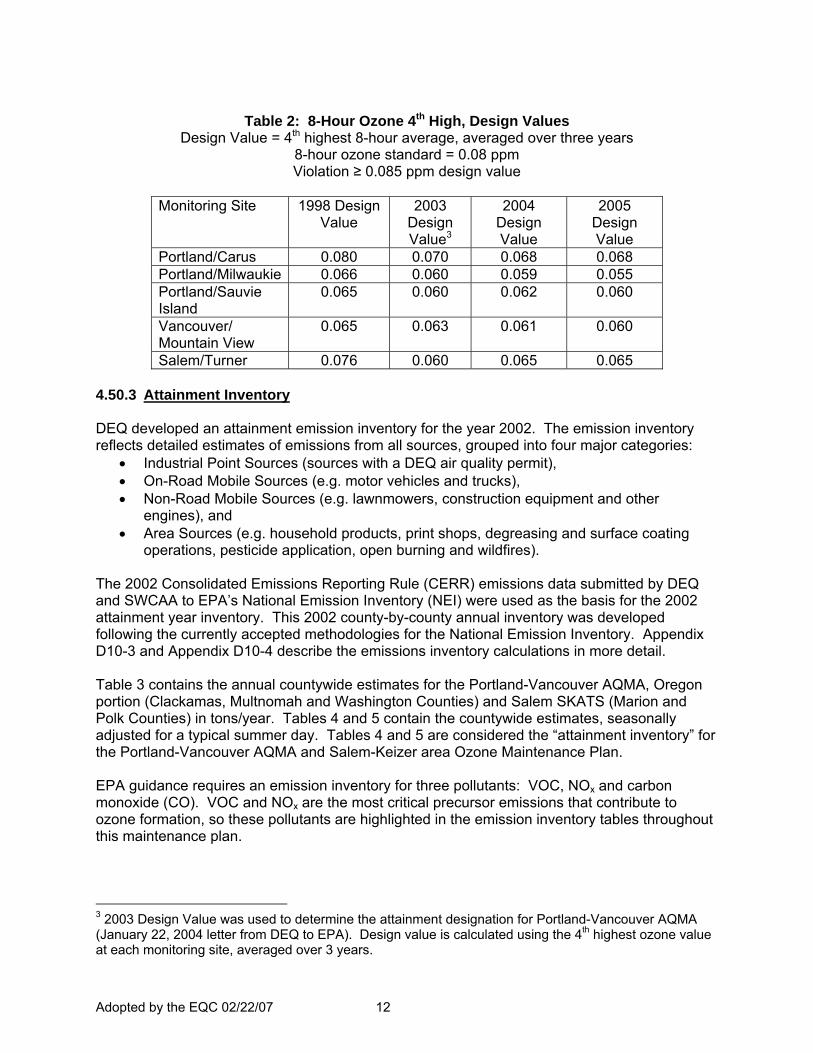
Table 2: 8-Hour Ozone 4th High, Design Values
Design Value = 4th highest 8-hour average, averaged over three years 8-hour ozone standard = 0.08 ppm Violation ≥ 0.085 ppm design value
Monitoring Site 1998 Design
Value 2003
Design Value3
2004 Design Value
2005 Design Value
Portland/Carus 0.080 0.070 0.068 0.068 Portland/Milwaukie 0.066 0.060 0.059 0.055 Portland/Sauvie Island
0.065 0.060 0.062 0.060
Vancouver/ Mountain View
0.065 0.063 0.061 0.060
Salem/Turner 0.076 0.060 0.065 0.065 4.50.3 Attainment Inventory DEQ developed an attainment emission inventory for the year 2002. The emission inventory reflects detailed estimates of emissions from all sources, grouped into four major categories:
• Industrial Point Sources (sources with a DEQ air quality permit), • On-Road Mobile Sources (e.g. motor vehicles and trucks), • Non-Road Mobile Sources (e.g. lawnmowers, construction equipment and other
engines), and • Area Sources (e.g. household products, print shops, degreasing and surface coating
operations, pesticide application, open burning and wildfires). The 2002 Consolidated Emissions Reporting Rule (CERR) emissions data submitted by DEQ and SWCAA to EPA’s National Emission Inventory (NEI) were used as the basis for the 2002 attainment year inventory. This 2002 county-by-county annual inventory was developed following the currently accepted methodologies for the National Emission Inventory. Appendix D10-3 and Appendix D10-4 describe the emissions inventory calculations in more detail. Table 3 contains the annual countywide estimates for the Portland-Vancouver AQMA, Oregon portion (Clackamas, Multnomah and Washington Counties) and Salem SKATS (Marion and Polk Counties) in tons/year. Tables 4 and 5 contain the countywide estimates, seasonally adjusted for a typical summer day. Tables 4 and 5 are considered the “attainment inventory” for the Portland-Vancouver AQMA and Salem-Keizer area Ozone Maintenance Plan. EPA guidance requires an emission inventory for three pollutants: VOC, NOx and carbon monoxide (CO). VOC and NOx are the most critical precursor emissions that contribute to ozone formation, so these pollutants are highlighted in the emission inventory tables throughout this maintenance plan.
3 2003 Design Value was used to determine the attainment designation for Portland-Vancouver AQMA (January 22, 2004 letter from DEQ to EPA). Design value is calculated using the 4th highest ozone value at each monitoring site, averaged over 3 years.
Adopted by the EQC 02/22/07 13
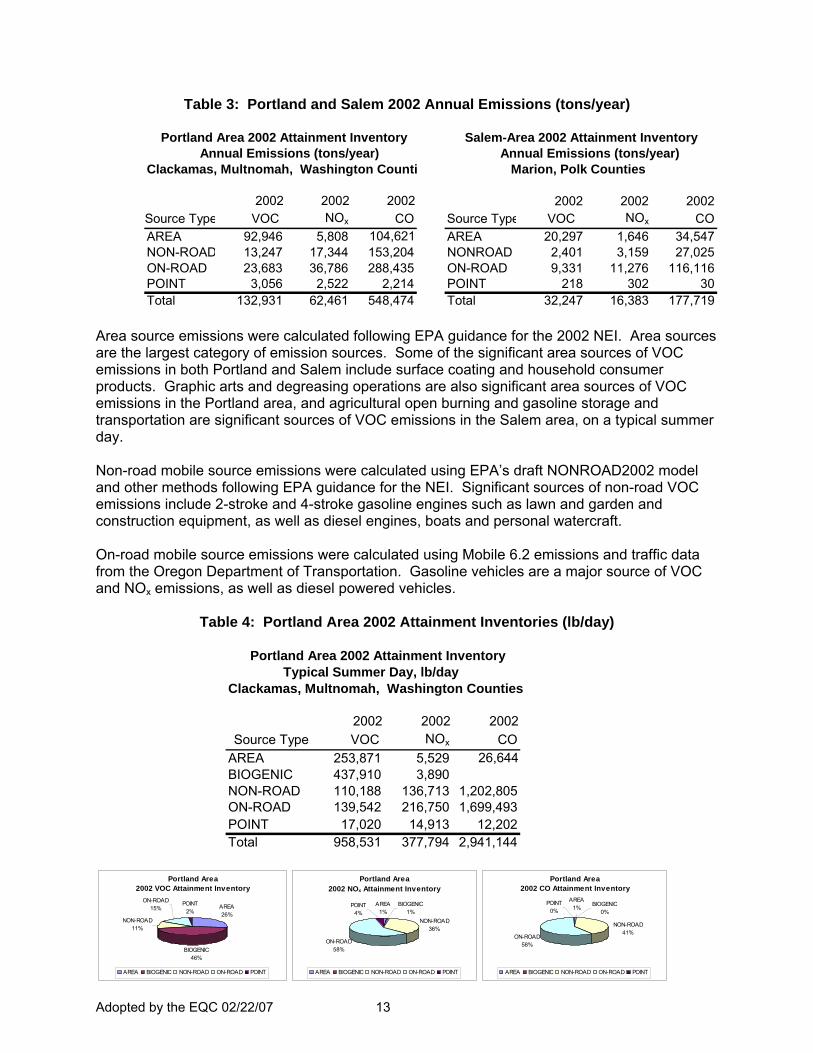
Table 3: Portland and Salem 2002 Annual Emissions (tons/year)
Portland Area 2002 Attainment Inventory Annual Emissions (tons/year)Clackamas, Multnomah, Washington Counti
2002 2002 2002Source Type VOC NOx COAREA 92,946 5,808 104,621NON-ROAD 13,247 17,344 153,204ON-ROAD 23,683 36,786 288,435POINT 3,056 2,522 2,214Total 132,931 62,461 548,474
Salem-Area 2002 Attainment Inventory Annual Emissions (tons/year) Marion, Polk Counties
2002 2002 2002Source Type VOC NOx COAREA 20,297 1,646 34,547NONROAD 2,401 3,159 27,025ON-ROAD 9,331 11,276 116,116POINT 218 302 30Total 32,247 16,383 177,719
Area source emissions were calculated following EPA guidance for the 2002 NEI. Area sources are the largest category of emission sources. Some of the significant area sources of VOC emissions in both Portland and Salem include surface coating and household consumer products. Graphic arts and degreasing operations are also significant area sources of VOC emissions in the Portland area, and agricultural open burning and gasoline storage and transportation are significant sources of VOC emissions in the Salem area, on a typical summer day. Non-road mobile source emissions were calculated using EPA’s draft NONROAD2002 model and other methods following EPA guidance for the NEI. Significant sources of non-road VOC emissions include 2-stroke and 4-stroke gasoline engines such as lawn and garden and construction equipment, as well as diesel engines, boats and personal watercraft. On-road mobile source emissions were calculated using Mobile 6.2 emissions and traffic data from the Oregon Department of Transportation. Gasoline vehicles are a major source of VOC and NOx emissions, as well as diesel powered vehicles.
Table 4: Portland Area 2002 Attainment Inventories (lb/day)
Portland Area 2002 Attainment Inventory Typical Summer Day, lb/dayClackamas, Multnomah, Washington Counties
2002 2002 2002Source Type VOC NOx CO
AREA 253,871 5,529 26,644BIOGENIC 437,910 3,890NON-ROAD 110,188 136,713 1,202,805ON-ROAD 139,542 216,750 1,699,493POINT 17,020 14,913 12,202Total 958,531 377,794 2,941,144
Portland Area 2002 NOx Attainment Inventory
ON-ROAD58%
POINT4%
BIOGENIC1%
AREA1%
NON-ROAD36%
AREA BIOGENIC NON-ROAD ON-ROAD POINT
Portland Area 2002 CO Attainment Inventory
ON-ROAD58%
BIOGENIC0%
AREA1%
POINT0%
NON-ROAD41%
AREA BIOGENIC NON-ROAD ON-ROAD POINT
Portland Area 2002 VOC Attainment Inventory
AREA26%
BIOGENIC46%
NON-ROAD11%
ON-ROAD15%
POINT2%
AREA BIOGENIC NON-ROAD ON-ROAD POINT
Adopted by the EQC 02/22/07 14
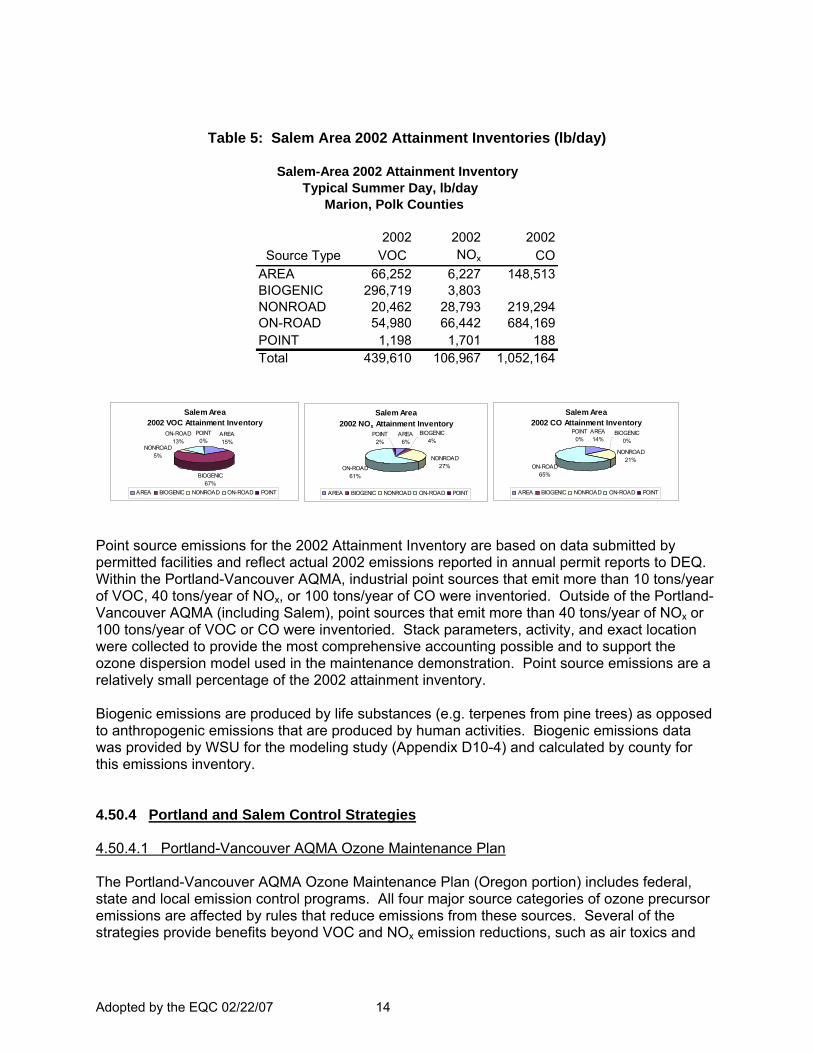
Table 5: Salem Area 2002 Attainment Inventories (lb/day)
Salem-Area 2002 Attainment Inventory Typical Summer Day, lb/day Marion, Polk Counties
2002 2002 2002 Source Type VOC NOx CO
AREA 66,252 6,227 148,513BIOGENIC 296,719 3,803NONROAD 20,462 28,793 219,294ON-ROAD 54,980 66,442 684,169POINT 1,198 1,701 188Total 439,610 106,967 1,052,164
Point source emissions for the 2002 Attainment Inventory are based on data submitted by permitted facilities and reflect actual 2002 emissions reported in annual permit reports to DEQ. Within the Portland-Vancouver AQMA, industrial point sources that emit more than 10 tons/year of VOC, 40 tons/year of NOx, or 100 tons/year of CO were inventoried. Outside of the Portland-Vancouver AQMA (including Salem), point sources that emit more than 40 tons/year of NOx or 100 tons/year of VOC or CO were inventoried. Stack parameters, activity, and exact location were collected to provide the most comprehensive accounting possible and to support the ozone dispersion model used in the maintenance demonstration. Point source emissions are a relatively small percentage of the 2002 attainment inventory. Biogenic emissions are produced by life substances (e.g. terpenes from pine trees) as opposed to anthropogenic emissions that are produced by human activities. Biogenic emissions data was provided by WSU for the modeling study (Appendix D10-4) and calculated by county for this emissions inventory. 4.50.4 Portland and Salem Control Strategies 4.50.4.1 Portland-Vancouver AQMA Ozone Maintenance Plan The Portland-Vancouver AQMA Ozone Maintenance Plan (Oregon portion) includes federal, state and local emission control programs. All four major source categories of ozone precursor emissions are affected by rules that reduce emissions from these sources. Several of the strategies provide benefits beyond VOC and NOx emission reductions, such as air toxics and
Salem Area 2002 VOC Attainment Inventory
AREA15%
BIOGENIC67%
ON-ROAD13%
POINT0%
NONROAD5%
AREA BIOGENIC NONROAD ON-ROAD POINT
Salem Area 2002 NOx Attainment Inventory
ON-ROAD61%
BIOGENIC4%
NONROAD27%
AREA6%
POINT2%
AREA BIOGENIC NONROAD ON-ROAD POINT
Salem Area 2002 CO Attainment Inventory
ON-ROAD65%
BIOGENIC0%
POINT0%
AREA14%
NONROAD21%
AREA BIOGENIC NONROAD ON-ROAD POINT
Adopted by the EQC 02/22/07 15
greenhouse gas emission reductions, traffic congestion reduction, energy savings, and overall cost-savings for the transportation systems. The existing Portland-Vancouver AQMA Ozone Maintenance Plan strategies will remain in place and work together to protect air quality as the population increases over the next ten years. These strategies have successfully reduced VOC and NOx emissions and also reduce emissions of air toxics and greenhouse gases that are emerging issues of concern. The following strategies will remain in the Portland Ozone Maintenance Plan as they currently apply to sources in the Portland area: • Motor Vehicle Inspection Program (OAR 340-256-0300 through 0470); • Emission Standards for VOC Point Sources (Reasonably Available Control Technology) for
existing major industrial facilities (OAR 340-232-0010 through 0230); • New Source Review Program for new and expanding major industrial facilities (OAR 340-
224-0010 through 0100 and 340-225-0010 through 0090); • Voluntary Parking Ratio Rules (OAR 340-242-0300 through 0390); • Barge Loading Rules and Stage I vapor recovery systems that control VOCs from gasoline
delivery operations (included within OAR 340-232); • Aerosol Paint Rules that lower VOC content from spray paints sold in the Portland area
(OAR 340-242-0700 through 0750); • Motor Vehicle Refinishing Rules that require low-emitting painting methods at autobody
shops (OAR 340-242-0600 through 0630); and • Public education and outreach that encourages people to voluntarily reduce emissions,
such as not mowing lawns and driving less on Clean Air Action Days (now called Air Pollution Advisories).
The following strategies in the Portland-Vancouver Ozone Maintenance Plan (Oregon portion) have been modified: • Employee Commute Options Program (OAR 340-242-0010 through 0290): Program
requirements now focus on larger employers (100 or more employees) and reduce the survey requirements from annual to every two years (see detail below), and
• Industrial Emission Management Program (OAR 340-242-0400 through 0440): Re-establish the industrial growth allowance for new and modified major industrial sources to ensure that the ozone standard will not be violated even under conservative growth assumptions (see detail below).
In June, 2005, the Environmental Quality Commission amended the Motor Vehicle Inspection Program rules to replace the “enhanced” vehicle inspection test with the “basic” vehicle inspection test for vehicle model years 1981-1995. This change is reflected in the modeling projections and maintenance demonstration of this plan. Stage II vapor recovery system requirements for gas stations will remain in effect until the motor vehicle fleet reflects widespread use of on-board canister systems. The Stage II rules will be revised at that time (prior to 2015). The eventual shift from Stage II vapor recovery to on-board canisters is reflected in the 2015 modeling projections and maintenance demonstration of this plan.
Adopted by the EQC 02/22/07 16
Transportation control measures are no longer enforceable under conformity rules (40 CFR 51.900) so these measures are removed from the Portland AQMA Ozone Maintenance Plan. However, the Employee Commute Options program will remain in the maintenance plan, and DEQ and Metro will implement a voluntary program to monitor growth in motor vehicle emissions of VOC and NOx in the Portland area as described in Section 4.50.4.1.3.
4.50.4.1.1 Changes to the Employee Commute Options Rule The Employee Commute Options Program rules adopted in 1996 (OAR 340-242-0010 through 0290) require Portland-area employers with more than 50 employees to implement programs that would reduce single-occupancy commute travel by 10%. Affected employers must provide incentives for employee use of alternative commute options. The incentives must have the potential to reduce commute trips to the work site by 10% within three years of completing an initial employee survey. Annual surveys measure progress toward this goal. Annual survey data indicates that larger employers are more likely to comply with ECO and provide meaningful transportation options to their employees. Larger employers represent most of the employees in the region. For example,
• Employers with more than 100 employees generate 92% of the total trip reduction. • Employers with more than 100 employees make up 86% of the total ECO affected
employees. • Employers with more than 100 employees make up 53% of the total ECO affected
employers.
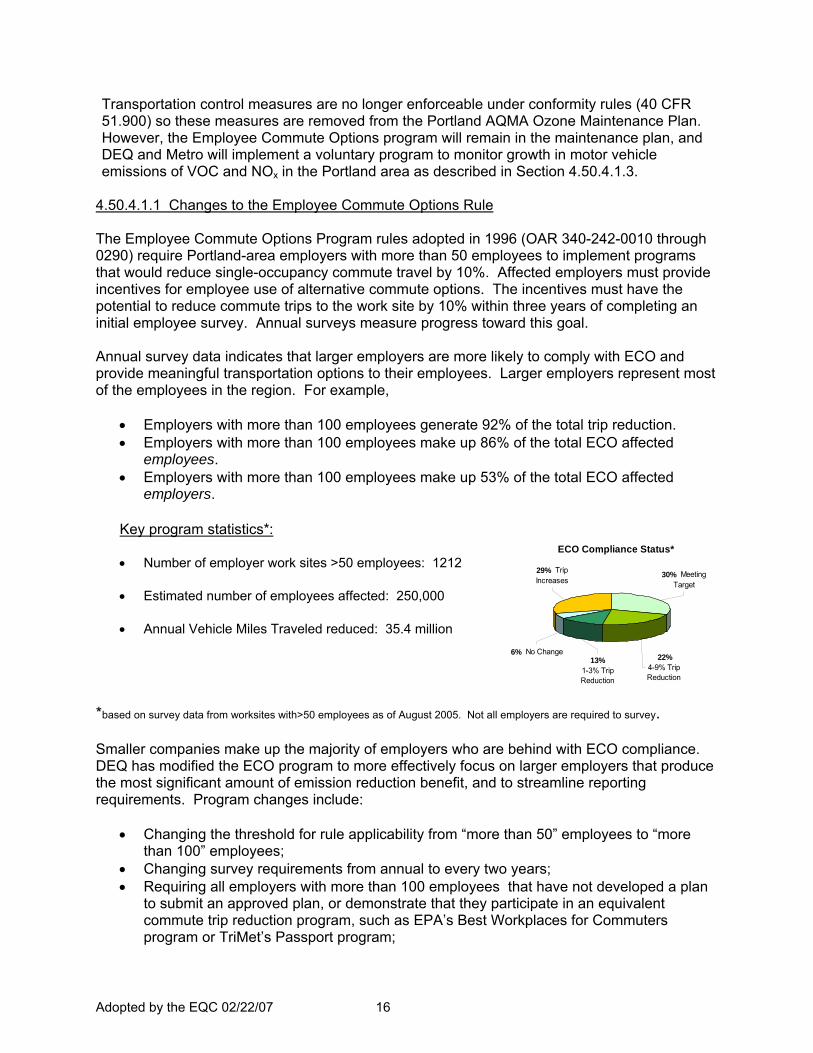
Key program statistics*: • Number of employer work sites >50 employees: 1212
• Estimated number of employees affected: 250,000
• Annual Vehicle Miles Traveled reduced: 35.4 million
*based on survey data from worksites with>50 employees as of August 2005. Not all employers are required to survey. Smaller companies make up the majority of employers who are behind with ECO compliance. DEQ has modified the ECO program to more effectively focus on larger employers that produce the most significant amount of emission reduction benefit, and to streamline reporting requirements. Program changes include:
• Changing the threshold for rule applicability from “more than 50” employees to “more than 100” employees;
• Changing survey requirements from annual to every two years; • Requiring all employers with more than 100 employees that have not developed a plan
to submit an approved plan, or demonstrate that they participate in an equivalent commute trip reduction program, such as EPA’s Best Workplaces for Commuters program or TriMet’s Passport program;
ECO Compliance Status*
30% Meeting Target
22% 4-9% Trip Reduction
13% 1-3% Trip Reduction
6% No Change
29% Trip Increases
Adopted by the EQC 02/22/07 17
• Modifying survey requirements to allow an employer to submit follow-up survey results with less than 75% response rate. DEQ will assign single occupancy vehicle trips to the percentage of employees who did not respond up to the 75% rate;
• Eliminating the 2006 sunset date since the ozone maintenance plan does not sunset; and
• Requiring employers that qualify for exemptions (e.g. through restricted parking ratios) to certify every two years that they continue to qualify for the exemption.
The Employee Commute Option Program has been effective in reducing the amount of vehicle miles traveled by single-occupancy-vehicles in the Portland area, thereby reducing air pollution and traffic congestion in the region. The ECO program has resulted in an estimated annual reduction of over 100 tons of VOCs and over 85 tons of NOx. In addition to the benefits to ozone air quality, DEQ estimates that the ECO program is also effective in reducing over 22,000 tons per year of carbon dioxide (a greenhouse gas), as well as associated air toxics emissions (most notably benzene). DEQ’s proposed rule changes would streamline the program and make it more effective in encouraging alternative commute trips among larger employers while providing relief to smaller employers. The program is one of many efforts in the Portland area to reduce single-occupancy vehicle trips and DEQ will continue to partner with regional alternative transportation programs in these efforts. DEQ will continue to focus on larger employers (those with over 100 employees) who account for over 90% of the trip and emission reduction achieved by the ECO program. Therefore, DEQ believes there will be no significant loss in emission reduction benefit from ECO by focusing the program on larger employers. 4.50.4.1.2 Industrial Emission Management Rules The 1996 Portland-Vancouver Ozone Maintenance Plan included an industrial emissions growth allowance that could be used by new and expanding major industry in lieu of obtaining emission offsets. This 2006 maintenance plan update continues this approach to managing industrial emissions growth. The growth allowance program is described below. Under the existing Industrial Emission Management Rules adopted in 1996 (OAR 340-242-0400 through 0440), new or expanding major industrial sources located within 100 km of the Portland-Vancouver AQMA must “offset” emission increases of more than 40 tons/year of VOC and NOx by obtaining an equivalent decrease from another facility. However, the offset requirement can be satisfied by obtaining an allocation from an emissions growth allowance set aside for this purpose. This 2006 maintenance plan update reestablishes the growth allowance for new and expanding major VOC and NOx industrial sources, creates an administrative and public process for releasing the growth allowance in increments, and retains the emission offset requirement as a safeguard. The growth allowance has been included in the modeled 2015 ozone maintenance demonstration.
Growth Allowance Program Procedures This plan reestablishes the industrial growth allowance at 5,000 tons for VOC and 5,000 tons for NOx
4. The owner or operator of a proposed major source or major modification may apply to DEQ for an allocation of the growth allowance in lieu of providing an emission offset. As 4 The 2006 growth allowance balance is approximately 750 tons for VOC and 200 tons for NOx. This balance would be replaced with the reestablished growth allowance.
Adopted by the EQC 02/22/07 18
required in the existing rules, the growth allowance will be allocated on a first come first served basis, with one exception. Sources that previously reduced their allowable emissions through the voluntary Plant Site Emission Limit (PSEL) donation program will receive priority access to the growth allowance. Consumption of the growth allowance will continue to be monitored and tracked by DEQ. DEQ will establish the 5,000 ton limit as a maximum cap. As a safeguard, however, DEQ will only authorize the initial use of up to 1,000 tons of VOC and 1000 tons of NOx, and hold the balance in reserve. If at some point in the future 750 tons or more of this initial increment is used for either or both pollutants, DEQ will conduct an analysis of ozone levels and expected trends to determine if conditions support the release of another 1,000 ton increment. DEQ will provide an opportunity for the public to comment on the results of the analysis and DEQ’s recommendation whether to release the next 1,000 ton increment prior to making its decision. DEQ will not authorize any further allocation of the growth increment if it thought such action could jeopardize compliance with the ozone standard. If conditions show no risk to the health standard, DEQ will authorize allocation of another 1,000 ton increment. If any single source applies to the Environmental Quality Commission to receive more than 1,000 tons of VOC or NOx, DEQ will conduct the analysis to determine whether an additional 1,000 tons can be released without jeopardizing ozone air quality prior to making a recommendation to the EQC regarding the source application. This process will be repeated until the final 1,000 ton increment, or when approximately 4,000 tons of the growth allowance of either pollutant is consumed. The growth allowance cap of 5,000 tons could only be increased through a SIP revision that is approved by EPA. The increase could utilize new federally enforceable emission reductions and shutdown credits that were not relied on in the maintenance demonstration. Any such increase to the growth allowance above the 5,000 ton cap for either VOC or NOx will be subject to public comment and approval by EPA. Federally enforceable emission reductions include requirements adopted by EPA, requirements adopted by the EQC and approved by EPA as a revision to the Oregon State Implementation Plan, and requirements established by a federally enforceable permit condition. If the growth allowance is consumed, and cannot be reestablished, emission offsets for VOC and NOx will be required for new and expanding major industry. This administrative process of incremental allocation will help DEQ better manage future industrial emission increases and respond to any unforeseen changes in future conditions, such as significant increases in summertime temperatures or future changes to the federal ozone standard. DEQ may temporarily reduce the amount of growth allowance that may be allocated to new or modified major industrial sources if monitored ozone concentrations exceed the “risk of violation” or “actual violation” thresholds described in the contingency plan (Section 4.50.7.2.1). DEQ will provide reasonable advance notice to affected industries if there is a possibility that the growth allowance could be reduced or if contingency plan requirements of OAR 340-224-0060(5) do not allow an allocation from the growth allowance to be used to meet offset requirements. The emissions growth allowance approach described above works together with several other elements in the maintenance plan, including the tracking of emission growth, ambient ozone monitoring, the emission offset backstop requirement, and the early warning and action elements in the contingency plan, to meet air quality management goals and protect compliance
Adopted by the EQC 02/22/07 19
with standards. The Industrial Emissions Management Rules provide both flexibility for future economic opportunity and protection of public health through compliance with the ozone air quality standard. 4.50.4.1.3 Transportation Conformity and Transportation Control Measures Under EPA’s 2004 ozone implementation rules (40 CFR 51.900), neither general conformity nor transportation conformity is required for areas attaining the 8-hour ozone standard. This means that new transportation project plans will no longer need to demonstrate that they conform to the ozone maintenance plans in the Portland-Vancouver AQMA. Although transportation control measures can no longer be enforced through the conformity process, DEQ and Metro (the Portland-area metropolitan planning organization) have agreed to informally track VOC, NOx, air toxics and greenhouse gas emissions when Metro assesses conformity for the purposes of the Portland Carbon Monoxide Maintenance Plan as a voluntary program to assess impacts of transportation emissions on air quality over time. In addition, when Metro assesses VMT/Capita for purposes of the Portland Carbon Monoxide Maintenance Plan Contingency Plan, the information will also be used for the Portland-Vancouver AQMA Ozone Contingency Plan (see Section 4.50.7.2.2). This approach is consistent with the EPA ozone implementation rule preamble that recommends states develop voluntary programs to address motor vehicle emissions growth (69 FR 23987-88). The Metro Council adopted Resolution 06-3695, For the Purpose of Recommending Approval by the Oregon Environmental Quality Commission of the Draft 2006 Portland-Vancouver AQMA (Oregon Portion) and Salem Keizer Area Ozone Maintenance Plan, on May 25, 2006. 4.50.4.2 Salem SKATS Ozone Maintenance Plan DEQ will retain existing strategies in the Salem-Keizer Area Transportation Study (SKATS) Air Quality Area Attainment Plan that was adopted in 1980 and revised in 1982, including Emission Standards for VOC Point Sources (OAR 340-232-0010 through 0230) and continued reliance on the control strategies in the Portland-Vancouver AQMA Ozone Maintenance Plan, with some updates:
• Designate Salem/SKATS as an ozone maintenance area under state rules;
• Modify control technology requirements for new and expanding major industrial sources
from “Lowest Achievable Emission Rate” (LAER) to “Best Available Control Technology” (BACT), while retaining all other new source review requirements; and
• Adopt a contingency plan that includes a commitment to adopt measures to reduce
emissions if the Salem area is at risk of violating or violates the ozone standard in the future.
Salem was designated an ozone “nonattainment” area under state rules, and major new and modified industrial sources that emit 40 tons/year or more of VOC or NOx were required to install the most stringent level of emission control technology known as “Lowest Achievable Emission Rate” (LAER). Once designated a “maintenance” area under state rules, the same universe of sources (40 tons/year or more of VOC or NOx) will be required to install “Best Achievable Control Technology” (BACT) that is the same as is required in Portland. LAER and BACT are determined by DEQ on a case-by-case basis to prevent air pollution and require installation of pollution control equipment through the facility’s air permit. LAER reflects
Adopted by the EQC 02/22/07 20
the most stringent level of emission control achievable at the time of permitting. LAER is typically required in areas violating or at risk of violating air quality standards and must be installed regardless of cost. BACT is established by DEQ using an analysis that starts with a review of EPA’s control technology clearinghouse and LAER technologies that are required for similar facilities within the U.S. If the permit applicant demonstrates that the cost to install LAER would be much greater at this facility than it was at other facilities where it has been installed, the applicant may justify a lower control level as BACT. BACT is typically used in maintenance and attainment areas that are in compliance with air quality standards, and can provide an equivalent or very high level of control that will not interfere with maintenance of the ozone standard. Under the Clean Air Act, Salem is designated as a federal ozone attainment area. Under this federal designation, emission control technology (BACT) would only be required for Federal Major Sources (those sources in 28 categories emitting 100 tons/year or more of VOC or NOx, or other sources emitting 250 tons/year or more). However, as an Oregon ozone maintenance area, BACT controls will continue to be required for sources emitting 40 tons/year of VOC or NOx. Keeping the current 40 tons/year threshold for triggering BACT and other New Source Review requirements will better protect future compliance with the ozone standard in the Salem area. All other requirements for New Source Review in Salem remain the same, including the current exemption from the need to provide emission offsets or use a growth allowance for sources locating within SKATS because much of Salem’s emissions transport from the Portland area. New or expanding major industrial sources within 100 km of the Portland-Vancouver AQMA (which includes part of the Salem area) will continue to be required to evaluate their impact on ozone levels in Portland. 4.50.5 Maintenance Demonstration (Portland-Vancouver and Salem) 4.50.5.1 Ozone Modeling Study DEQ and SWCAA teamed with Washington State University (WSU), the Washington Department of Ecology and EPA to study ozone formation using a computer dispersion model (see Appendix D10-4, “Historical and Future Ozone Simulations using the MM5/SMOKE/CMAQ System in the Portland/Vancouver Area”, WSU, 12/31/05 final report). The purpose of the study was to develop a predictive tool to forecast future ozone concentrations based on emission projections and summer meteorology in which ozone formation occurs. The modeling study simulated two historical high ozone episodes that occurred during the summer of 1997 and 1998. The study compared actual ozone levels measured (monitored) during the 1997 and 1998 events to model predicted ozone levels for the same period in order to test and validate model performance. The model performed within EPA guidelines for both episodes. The model performance testing verifies that the CMAQ model can predict future ozone concentrations for the region (see Appendix D10-4 for more information on model performance testing). The modeling team selected the July 26-28, 1998 episode as the basis for future year projections because ozone levels were much higher in 1998 than in 1997, and meteorology reflected worst case conditions that contribute to ozone formation in the Portland area (high temperatures and low wind speeds, with predominant winds from the north). Methodology for developing the modeling emissions data is detailed in the WSU modeling report (Appendix D10-4).
Adopted by the EQC 02/22/07 21
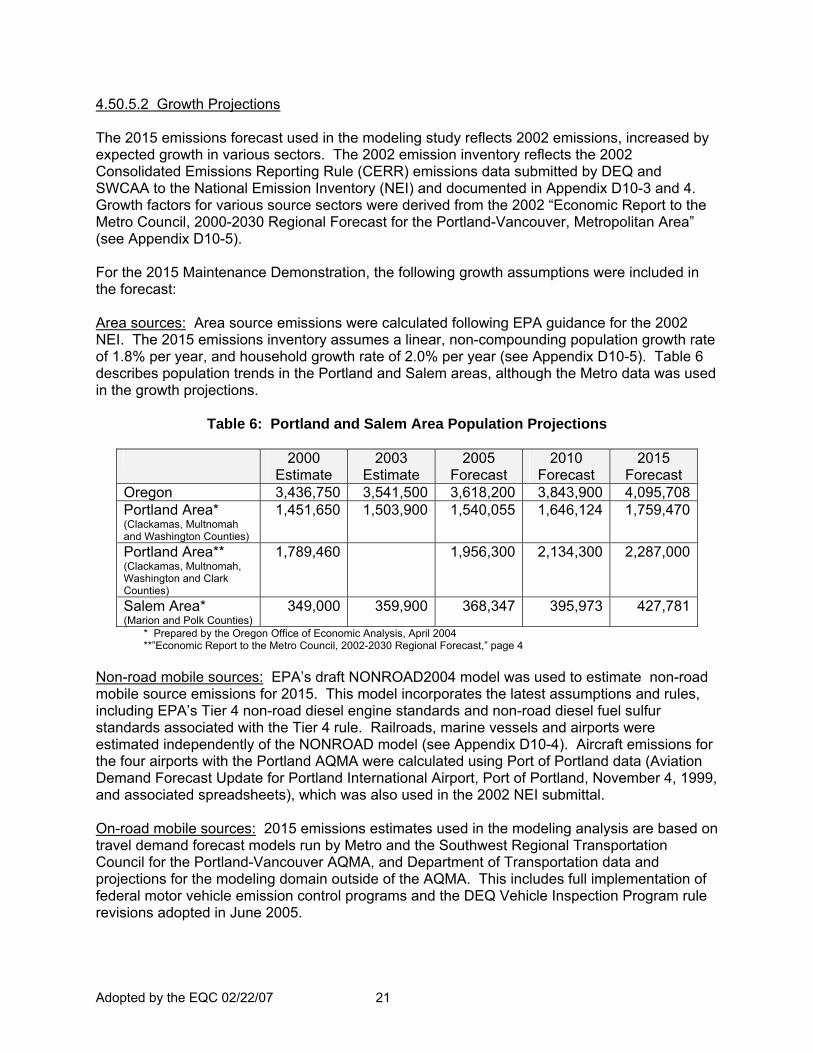
4.50.5.2 Growth Projections The 2015 emissions forecast used in the modeling study reflects 2002 emissions, increased by expected growth in various sectors. The 2002 emission inventory reflects the 2002 Consolidated Emissions Reporting Rule (CERR) emissions data submitted by DEQ and SWCAA to the National Emission Inventory (NEI) and documented in Appendix D10-3 and 4. Growth factors for various source sectors were derived from the 2002 “Economic Report to the Metro Council, 2000-2030 Regional Forecast for the Portland-Vancouver, Metropolitan Area” (see Appendix D10-5). For the 2015 Maintenance Demonstration, the following growth assumptions were included in the forecast: Area sources: Area source emissions were calculated following EPA guidance for the 2002 NEI. The 2015 emissions inventory assumes a linear, non-compounding population growth rate of 1.8% per year, and household growth rate of 2.0% per year (see Appendix D10-5). Table 6 describes population trends in the Portland and Salem areas, although the Metro data was used in the growth projections.
Table 6: Portland and Salem Area Population Projections
2000 Estimate
2003 Estimate
2005 Forecast
2010 Forecast
2015 Forecast
Oregon 3,436,750 3,541,500 3,618,200 3,843,900 4,095,708Portland Area* (Clackamas, Multnomah and Washington Counties)
1,451,650 1,503,900 1,540,055 1,646,124 1,759,470
Portland Area** (Clackamas, Multnomah, Washington and Clark Counties)
1,789,460 1,956,300 2,134,300 2,287,000
Salem Area* (Marion and Polk Counties)
349,000 359,900 368,347 395,973 427,781
* Prepared by the Oregon Office of Economic Analysis, April 2004 **”Economic Report to the Metro Council, 2002-2030 Regional Forecast,” page 4
Non-road mobile sources: EPA’s draft NONROAD2004 model was used to estimate non-road mobile source emissions for 2015. This model incorporates the latest assumptions and rules, including EPA’s Tier 4 non-road diesel engine standards and non-road diesel fuel sulfur standards associated with the Tier 4 rule. Railroads, marine vessels and airports were estimated independently of the NONROAD model (see Appendix D10-4). Aircraft emissions for the four airports with the Portland AQMA were calculated using Port of Portland data (Aviation Demand Forecast Update for Portland International Airport, Port of Portland, November 4, 1999, and associated spreadsheets), which was also used in the 2002 NEI submittal. On-road mobile sources: 2015 emissions estimates used in the modeling analysis are based on travel demand forecast models run by Metro and the Southwest Regional Transportation Council for the Portland-Vancouver AQMA, and Department of Transportation data and projections for the modeling domain outside of the AQMA. This includes full implementation of federal motor vehicle emission control programs and the DEQ Vehicle Inspection Program rule revisions adopted in June 2005.
Adopted by the EQC 02/22/07 22
Point sources: DEQ developed two different growth scenarios for major industrial (point) sources, and their purpose is discussed in more detail below in Section 4.50.5.3. The two scenarios include:
2015 Projection: reflecting actual 2002 emissions from existing industry, increased by expected employment projections in the “Economic Report to Metro Council, 2000-2030 Regional Forecast for the Portland-Vancouver Metropolitan Area”.
2015 Maintenance Demonstration: reflecting a conservative estimate of
maximum permitted levels for existing industry and the reestablished industrial growth allowance.
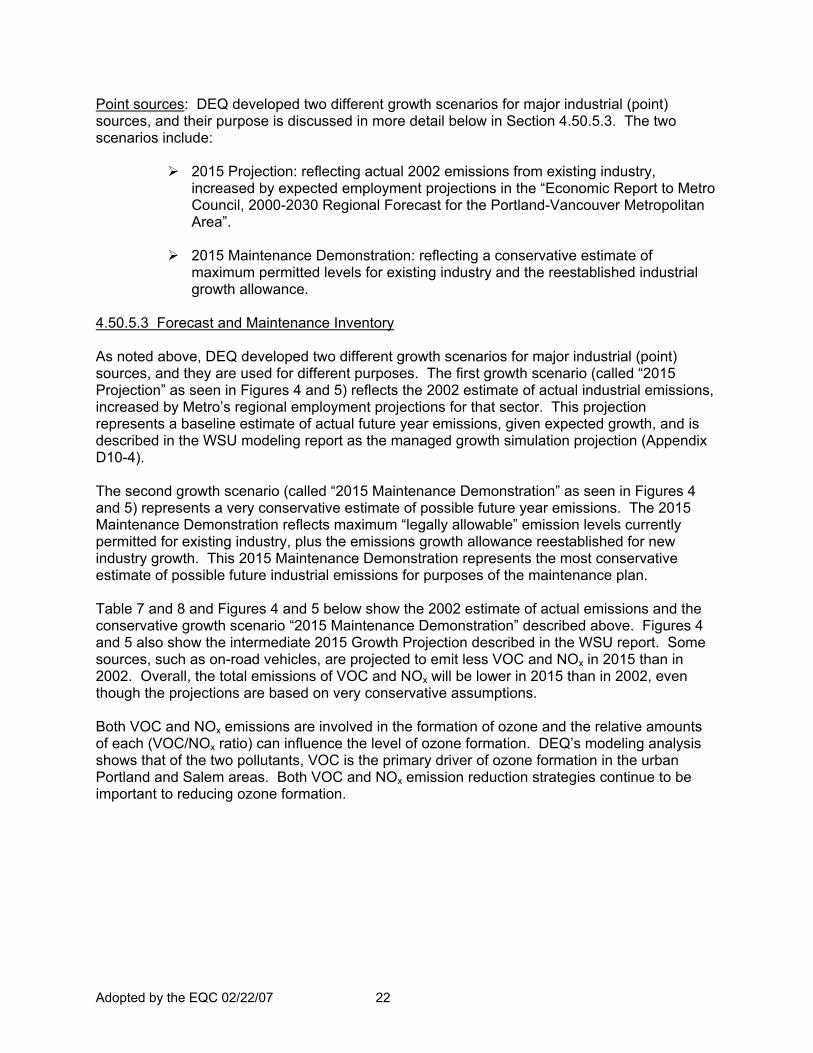
4.50.5.3 Forecast and Maintenance Inventory As noted above, DEQ developed two different growth scenarios for major industrial (point) sources, and they are used for different purposes. The first growth scenario (called “2015 Projection” as seen in Figures 4 and 5) reflects the 2002 estimate of actual industrial emissions, increased by Metro’s regional employment projections for that sector. This projection represents a baseline estimate of actual future year emissions, given expected growth, and is described in the WSU modeling report as the managed growth simulation projection (Appendix D10-4). The second growth scenario (called “2015 Maintenance Demonstration” as seen in Figures 4 and 5) represents a very conservative estimate of possible future year emissions. The 2015 Maintenance Demonstration reflects maximum “legally allowable” emission levels currently permitted for existing industry, plus the emissions growth allowance reestablished for new industry growth. This 2015 Maintenance Demonstration represents the most conservative estimate of possible future industrial emissions for purposes of the maintenance plan. Table 7 and 8 and Figures 4 and 5 below show the 2002 estimate of actual emissions and the conservative growth scenario “2015 Maintenance Demonstration” described above. Figures 4 and 5 also show the intermediate 2015 Growth Projection described in the WSU report. Some sources, such as on-road vehicles, are projected to emit less VOC and NOx in 2015 than in 2002. Overall, the total emissions of VOC and NOx will be lower in 2015 than in 2002, even though the projections are based on very conservative assumptions. Both VOC and NOx emissions are involved in the formation of ozone and the relative amounts of each (VOC/NOx ratio) can influence the level of ozone formation. DEQ’s modeling analysis shows that of the two pollutants, VOC is the primary driver of ozone formation in the urban Portland and Salem areas. Both VOC and NOx emission reduction strategies continue to be important to reducing ozone formation.
Adopted by the EQC 02/22/07 23
Figure 4: Portland Area VOC and NOx Emissions (lb/day)
and 2015 Maintenance Demonstration
Figure 5: Salem Area VOC and NOx Emissions (lb/day) and 2015 Maintenance Demonstration
Portland Area VOC Emissions
0
300,000
600,000
900,000
1,200,000
Lbs
per d
ay
POINT 17,020 18,304 119,943
ON-ROAD 139,542 54,521 54,521
NONROAD 110,188 101,699 101,699
BIOGENIC 437,910 437,910 437,910
AREA 253,871 291,098 291,098
2002 Actual2015 Growth Projection
2015 Maintenance
Demonstration
Portland Area NOX Emissions
0
100,000
200,000
300,000
400,000
Lbs
per d
ay
POINT 14,913 16,783 86,780
ON-ROAD 216,750 68,910 68,910
NONROAD 136,713 95,638 95,638
BIOGENIC 3,890 3,890 3,890
AREA 5,529 6,157 6,157
2002 Actual2015 Growth Projection
2015 Maintenance
Demonstration
Salem Area VOC Emissions
0
100,000
200,000
300,000
400,000
500,000
Lbs
per d
ay
POINT 1,198 1,657 6,021
ON-ROAD 54,980 16,004 16,004
NONROAD 20,462 17,901 17,901
BIOGENIC 296,719 296,719 296,719
AREA 66,252 68,416 68,416
2002 Actual2015 Growth Projection
2015 Maintenance
Demonstration
Salem Area NOX Emissions
0
40,000
80,000
120,000
Lbs
per d
ay
POINT 1,701 3,168 4,701
ON-ROAD 66,442 20,582 20,582
NONROAD 28,793 16,618 16,618
BIOGENIC 3,803 3,803 3,803
AREA 6,227 6,400 6,400
2002 Actual2015 Growth Projection
2015 Maintenance
Demonstration
Adopted by the EQC 02/22/07 24
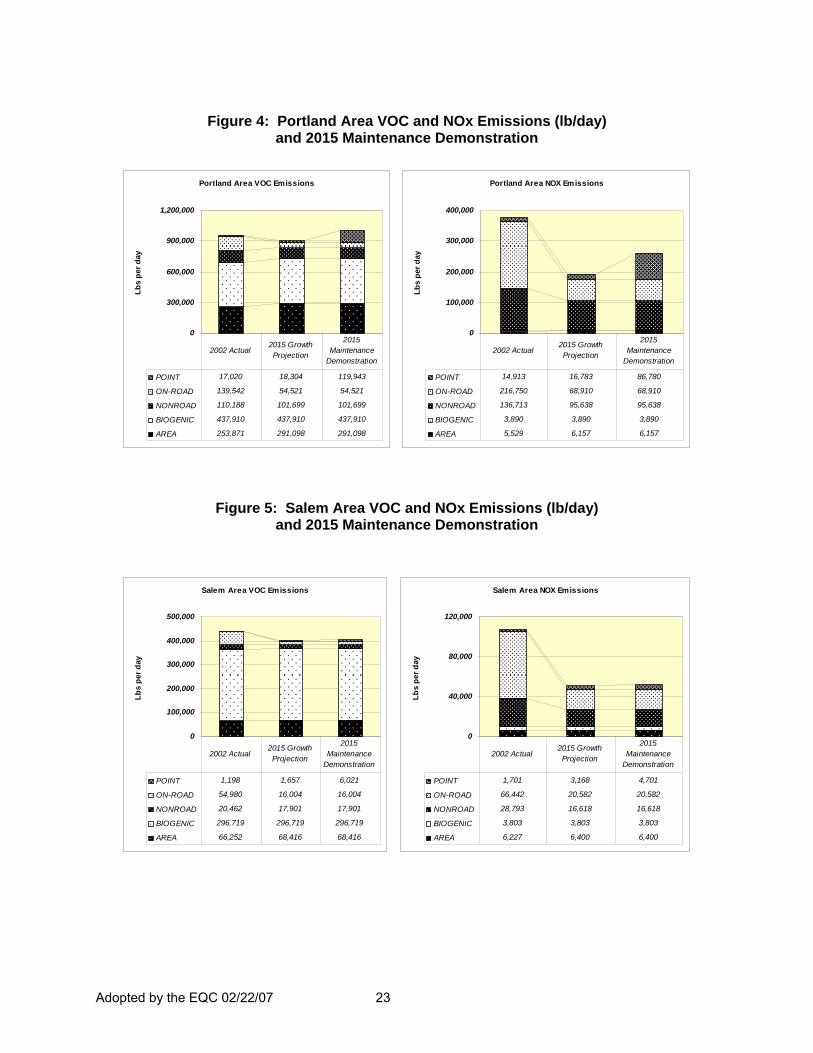
Table 7 Portland Area 2015 Maintenance Demonstration Portland Area 2015 Maintenance Demonstration Typical Summer Day, lb/day Annual Emissions (tons/year)Clackamas, Multnomah, Washington Counties Clackamas, Multnomah, Washington Counties
2015 2015 2015 2015 2015 2015Source Type VOC NOx CO Source Type VOC NOx COAREA 291,098 6,157 29,373 AREA 108,109 5,822 139,992BIOGENIC 437,910 3,890 -- NON-ROAD 13,308 17,223 330,324NON-ROAD 101,699 95,638 2,260,810 ON-ROAD 8,538 10,339 127,923ON-ROAD 54,521 68,910 560,955 POINT 21,721 15,191 19,768POINT 119,943 86,780 108,526 Total 151,675 48,574 618,007Total 1,005,171 261,375 2,959,664
Table 8
--- VOC, lbs per day --- --- NOX, lbs per day ---2015 2015
Source 2002 Maintenance % Source 2002 Maintenance %Type Actual Demonstration Change Type Actual Demonstration ChangeAREA 253,871 291,098 14.7% AREA 5,529 6,157 11.4%BIOGENIC 437,910 437,910 BIOGENIC 3,890 3,890NONROAD 110,188 101,699 -7.7% NONROAD 136,713 95,638 -30.0%ON-ROAD 139,542 54,521 -60.9% ON-ROAD 216,750 68,910 -68.2%POINT 17,020 119,943 604.7% POINT 14,913 86,780 481.9%
---------- ---------- ---------- ----------Totals 958,531 1,005,171 Totals 377,794 261,375
Portland Area VOC and NOx Emissions, (lb/day), % Change 2002-2015(Clackamas, Multnomah, Washington Counties)
The Portland area on-road emissions are expected to decrease significantly: 61% less VOC emissions and 68% less NOx emissions. This is primarily due to implementation of federal motor vehicle emission and fuel standards and continuing implementation of the vehicle inspection program. Non-road emissions also show a 30% decrease in NOx emissions due to the phase-in of federal emission and fuel standards. Area source emissions are expected to increase due to increases in population that affect categories such as architectural surface coating and consumer solvent use. Point source “actual” emissions are not expected to change significantly (see Figure 4), although Table 8 describes the difference between “actual”
Portland Area 2015 VOC Maintenance Demonstration
BIOGENIC44%
ON-ROAD5%
NON-ROAD10%
AREA29%
POINT12%
AREA BIOGENIC NON-ROAD ON-ROAD POINT
Portland Area 2015 NOx Maintenance Demonstration
NON-ROAD38%
POINT33%
ON-ROAD26%
BIOGENIC1%
AREA2%
AREA BIOGENIC NON-ROAD ON-ROAD POINT
Portland Area 2015 CO Maintenance Demonstration
ON-ROAD19%
BIOGENIC0%
POINT4%
NON-ROAD76%
AREA1%
AREA BIOGENIC NON-ROAD ON-ROAD POINT
Adopted by the EQC 02/22/07 25
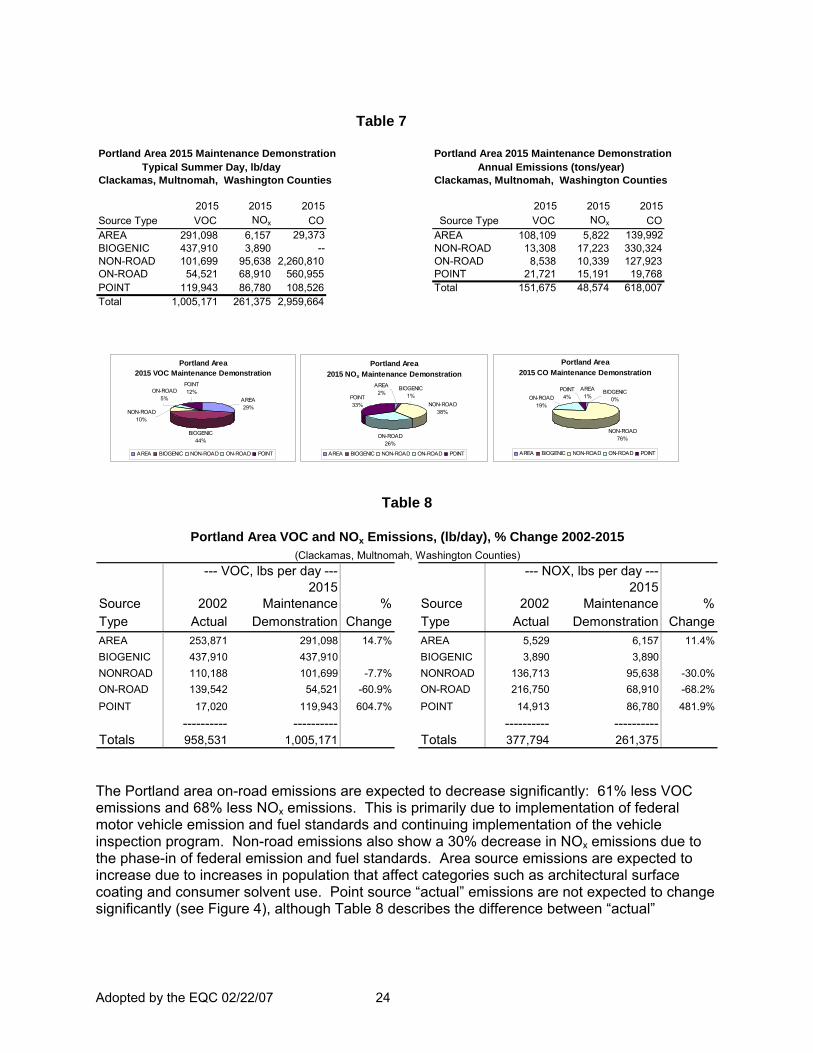
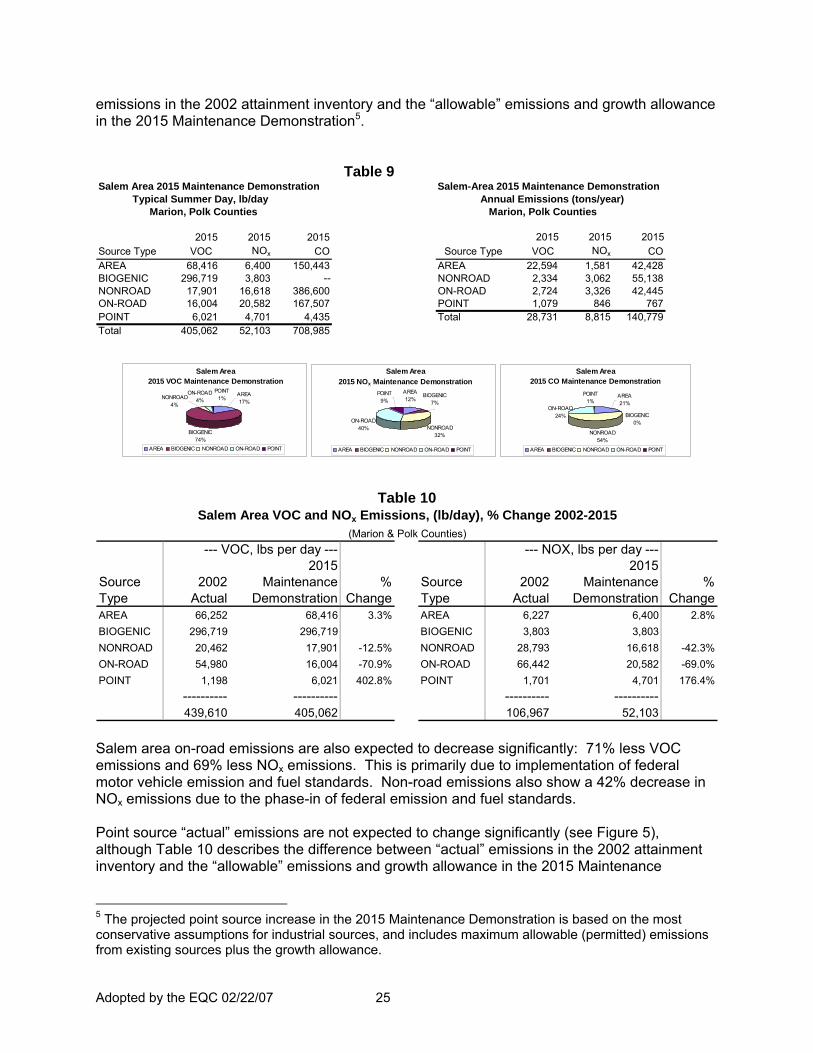
emissions in the 2002 attainment inventory and the “allowable” emissions and growth allowance in the 2015 Maintenance Demonstration5. Table 9 Salem Area 2015 Maintenance Demonstration Salem-Area 2015 Maintenance Demonstration Typical Summer Day, lb/day Annual Emissions (tons/year) Marion, Polk Counties Marion, Polk Counties
2015 2015 2015 2015 2015 2015Source Type VOC NOx CO Source Type VOC NOx COAREA 68,416 6,400 150,443 AREA 22,594 1,581 42,428BIOGENIC 296,719 3,803 -- NONROAD 2,334 3,062 55,138NONROAD 17,901 16,618 386,600 ON-ROAD 2,724 3,326 42,445ON-ROAD 16,004 20,582 167,507 POINT 1,079 846 767POINT 6,021 4,701 4,435 Total 28,731 8,815 140,779Total 405,062 52,103 708,985
Table 10
--- VOC, lbs per day --- --- NOX, lbs per day ---2015 2015
Source 2002 Maintenance % Source 2002 Maintenance %Type Actual Demonstration Change Type Actual Demonstration ChangeAREA 66,252 68,416 3.3% AREA 6,227 6,400 2.8%BIOGENIC 296,719 296,719 BIOGENIC 3,803 3,803NONROAD 20,462 17,901 -12.5% NONROAD 28,793 16,618 -42.3%ON-ROAD 54,980 16,004 -70.9% ON-ROAD 66,442 20,582 -69.0%POINT 1,198 6,021 402.8% POINT 1,701 4,701 176.4%
---------- ---------- ---------- ----------439,610 405,062 106,967 52,103
Salem Area VOC and NOx Emissions, (lb/day), % Change 2002-2015(Marion & Polk Counties)
Salem area on-road emissions are also expected to decrease significantly: 71% less VOC emissions and 69% less NOx emissions. This is primarily due to implementation of federal motor vehicle emission and fuel standards. Non-road emissions also show a 42% decrease in NOx emissions due to the phase-in of federal emission and fuel standards. Point source “actual” emissions are not expected to change significantly (see Figure 5), although Table 10 describes the difference between “actual” emissions in the 2002 attainment inventory and the “allowable” emissions and growth allowance in the 2015 Maintenance
5 The projected point source increase in the 2015 Maintenance Demonstration is based on the most conservative assumptions for industrial sources, and includes maximum allowable (permitted) emissions from existing sources plus the growth allowance.
Salem Area 2015 VOC Maintenance Demonstration
BIOGENIC74%
ON-ROAD4%
POINT1%
AREA17%
NONROAD4%
AREA BIOGENIC NONROAD ON-ROAD POINT
Salem Area 2015 NOx Maintenance Demonstration
NONROAD32%
ON-ROAD40%
AREA12%
BIOGENIC7%
POINT9%
AREA BIOGENIC NONROAD ON-ROAD POINT
Salem Area 2015 CO Maintenance Demonstration
NONROAD54%
BIOGENIC0%
AREA21%
POINT1%
ON-ROAD24%
AREA BIOGENIC NONROAD ON-ROAD POINT
Adopted by the EQC 02/22/07 26
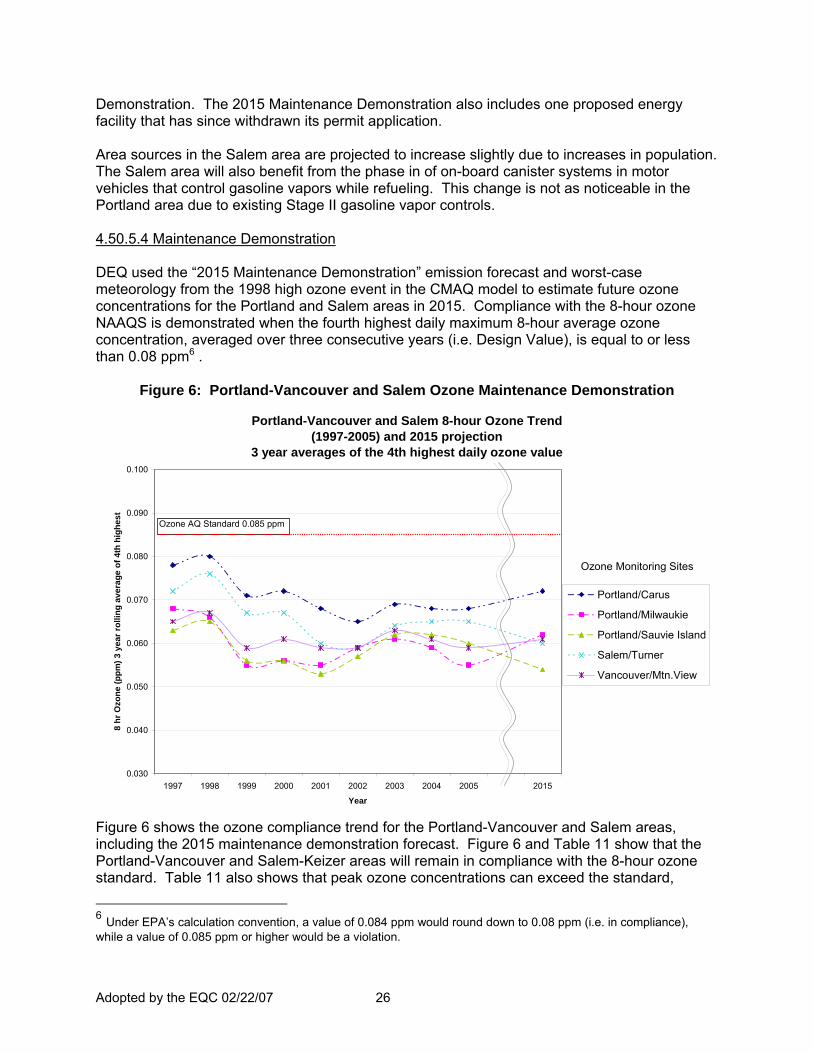
Demonstration. The 2015 Maintenance Demonstration also includes one proposed energy facility that has since withdrawn its permit application. Area sources in the Salem area are projected to increase slightly due to increases in population. The Salem area will also benefit from the phase in of on-board canister systems in motor vehicles that control gasoline vapors while refueling. This change is not as noticeable in the Portland area due to existing Stage II gasoline vapor controls. 4.50.5.4 Maintenance Demonstration DEQ used the “2015 Maintenance Demonstration” emission forecast and worst-case meteorology from the 1998 high ozone event in the CMAQ model to estimate future ozone concentrations for the Portland and Salem areas in 2015. Compliance with the 8-hour ozone NAAQS is demonstrated when the fourth highest daily maximum 8-hour average ozone concentration, averaged over three consecutive years (i.e. Design Value), is equal to or less than 0.08 ppm6 .
Figure 6: Portland-Vancouver and Salem Ozone Maintenance Demonstration
Portland-Vancouver and Salem 8-hour Ozone Trend (1997-2005) and 2015 projection
3 year averages of the 4th highest daily ozone value
0.030
0.040
0.050
0.060
0.070
0.080
0.090
0.100
1997 1998 1999 2000 2001 2002 2003 2004 2005 2015
Year
8 hr
Ozo
ne (p
pm) 3
yea
r rol
ling
aver
age
of 4
th h
ighe
st
Portland/Carus
Portland/Milwaukie
Portland/Sauvie Island
Salem/Turner
Vancouver/Mtn.View
Ozone AQ Standard 0.085 ppm
Ozone Monitoring Sites
Figure 6 shows the ozone compliance trend for the Portland-Vancouver and Salem areas, including the 2015 maintenance demonstration forecast. Figure 6 and Table 11 show that the Portland-Vancouver and Salem-Keizer areas will remain in compliance with the 8-hour ozone standard. Table 11 also shows that peak ozone concentrations can exceed the standard,
6 Under EPA’s calculation convention, a value of 0.084 ppm would round down to 0.08 ppm (i.e. in compliance), while a value of 0.085 ppm or higher would be a violation.
Adopted by the EQC 02/22/07 27
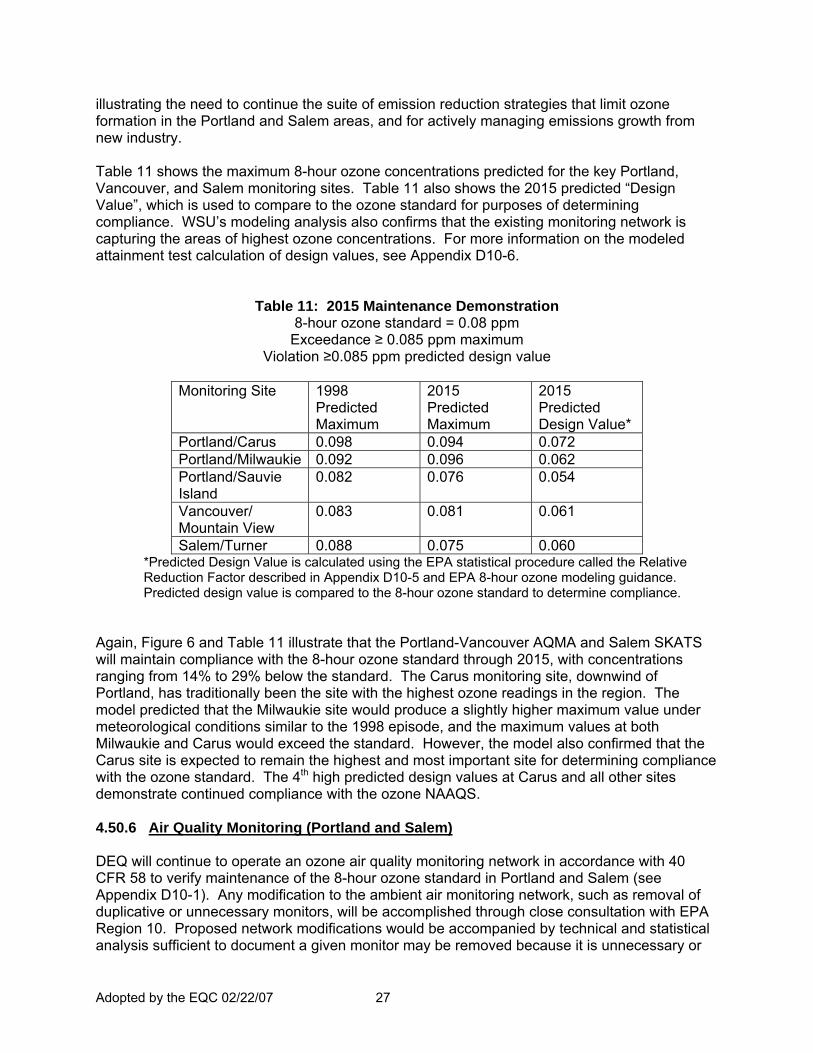
illustrating the need to continue the suite of emission reduction strategies that limit ozone formation in the Portland and Salem areas, and for actively managing emissions growth from new industry. Table 11 shows the maximum 8-hour ozone concentrations predicted for the key Portland, Vancouver, and Salem monitoring sites. Table 11 also shows the 2015 predicted “Design Value”, which is used to compare to the ozone standard for purposes of determining compliance. WSU’s modeling analysis also confirms that the existing monitoring network is capturing the areas of highest ozone concentrations. For more information on the modeled attainment test calculation of design values, see Appendix D10-6.
Table 11: 2015 Maintenance Demonstration 8-hour ozone standard = 0.08 ppm
Exceedance ≥ 0.085 ppm maximum Violation ≥0.085 ppm predicted design value
Monitoring Site 1998
Predicted Maximum
2015 Predicted Maximum
2015 Predicted Design Value*
Portland/Carus 0.098 0.094 0.072 Portland/Milwaukie 0.092 0.096 0.062 Portland/Sauvie Island
0.082 0.076 0.054
Vancouver/ Mountain View
0.083 0.081 0.061
Salem/Turner 0.088 0.075 0.060 *Predicted Design Value is calculated using the EPA statistical procedure called the Relative Reduction Factor described in Appendix D10-5 and EPA 8-hour ozone modeling guidance. Predicted design value is compared to the 8-hour ozone standard to determine compliance.
Again, Figure 6 and Table 11 illustrate that the Portland-Vancouver AQMA and Salem SKATS will maintain compliance with the 8-hour ozone standard through 2015, with concentrations ranging from 14% to 29% below the standard. The Carus monitoring site, downwind of Portland, has traditionally been the site with the highest ozone readings in the region. The model predicted that the Milwaukie site would produce a slightly higher maximum value under meteorological conditions similar to the 1998 episode, and the maximum values at both Milwaukie and Carus would exceed the standard. However, the model also confirmed that the Carus site is expected to remain the highest and most important site for determining compliance with the ozone standard. The 4th high predicted design values at Carus and all other sites demonstrate continued compliance with the ozone NAAQS. 4.50.6 Air Quality Monitoring (Portland and Salem) DEQ will continue to operate an ozone air quality monitoring network in accordance with 40 CFR 58 to verify maintenance of the 8-hour ozone standard in Portland and Salem (see Appendix D10-1). Any modification to the ambient air monitoring network, such as removal of duplicative or unnecessary monitors, will be accomplished through close consultation with EPA Region 10. Proposed network modifications would be accompanied by technical and statistical analysis sufficient to document a given monitor may be removed because it is unnecessary or
Adopted by the EQC 02/22/07 28
duplicative in the case of network reductions, or to justify the value of investing in monitoring network enhancements. In accordance with 40 CFR 58, the final network design will be subject to the approval of the EPA Regional Administrator. 4.50. 7 Contingency Plan The maintenance plan must include a process to quickly prevent or correct any measured violation of the 8-hour ozone standard. This process of investigation and (if needed) corrective action is called the “contingency plan”. Contingency plans typically have several stages of action depending on the severity of monitored ozone levels. Ambient ozone thresholds are established in the contingency plan as early-warning action levels. If monitored ozone levels exceed these action levels, the contingency provisions are triggered. 4.50.7.1 Request To Replace the Portland-Vancouver AQMA 1-Hour Contingency Plan With an 8-Hour Contingency Plan EPA revoked the one-hour ozone standard, effective June 15, 2005 (69 FR 23951, April 30, 2004). In accordance with EPA rules implementing the 8-hour ozone standard (40 CFR 51.900), DEQ requests that the one-hour ozone contingency plan be removed from the Portland-Vancouver AQMA Ozone Maintenance Plan, and replaced with a contingency plan that addresses the 8-hour ozone standard as described below. 4.50.7.2 Portland-Vancouver AQMA 8-hour Ozone Contingency Plan This contingency plan includes two sets of contingency measures. The provisions specified under Part A of the Contingency Plan for the Portland-Vancouver AQMA are linked to ambient concentrations of ozone and would be triggered if measured ozone levels at any of the ozone monitoring sites (Mountain View, Sauvie Island, Milwaukie, or Carus) exceed the early-warning thresholds below, or if a violation of the 8-hour ozone standards occurs. The provisions specified under Part B of the Contingency Plan are linked to increases in the average amount of vehicle use per person in the Portland metropolitan area, and would only affect the Oregon portion of the Portland-Vancouver AQMA. 4.50.7.2.1 Part A, Contingency Plan Based On Ambient Concentrations in Portland or Vancouver PHASE 1: ELEVATED OZONE LEVELS If the air quality index (AQI) is forecast to be within the “orange” range for ozone air quality (unhealthy for sensitive populations), or 8-hour daily maximum ozone values approach 0.100 ppm or greater, and meteorological conditions conducive to ozone formation are expected to persist, DEQ and SWCAA will issue an advisory to inform the public of air quality levels and voluntary actions they can take to limit exposure to unhealthy air pollution levels and reduce emissions. PHASE 2: RISK OF VIOLATION If monitored 8-hour ozone levels at any site within the Portland-Vancouver area registers an annual fourth high monitored value of 0.085 ppm or greater within a single ozone season or 0.080 ppm or greater averaged over two years, DEQ and SWCAA will assess the likely emissions and meteorological events contributing to elevated ozone levels. DEQ may form a planning group to assist DEQ in its review. The DEQ could recommend that no action be taken if it is determined that: (a) elevated ozone levels were caused by an event that is unlikely to
Adopted by the EQC 02/22/07 29
occur again, or (b) high ozone levels were caused by an uncontrollable event, such as a severe wildfire, or (c) federal regulations that will reduce ozone precursor emissions are scheduled to be implemented within two years. If it is determined that the event did not meet the criteria above, DEQ will evaluate options for appropriate action, including the option for additional emission reduction strategies to prevent future exceedances or a violation of the 8-hour ozone standard. PHASE 3: ACTUAL VIOLATION If a violation of the 8-hour ozone standard occurs, DEQ and SWCAA will determine the emissions and meteorological events contributing to the violation. If the violation is not due to an uncontrollable event or other criteria in Phase 2, DEQ will identify new strategies necessary to ensure compliance with the 8-hour ozone standard within 18 months of the conclusion of the ozone season that prompted the contingency plan, and revise the maintenance plan as needed to correct the violation. A revised maintenance plan would be submitted to EPA for approval. Measures that would be considered for implementation include the following:
• Reinstatement of applicable measures as defined in 40 CFR 51.900, which includes the Enhanced Inspection/Maintenance Test for certain model year vehicles7;
• Contingency Plan Requirements described in OAR 340-224-0060(5) that reinstate the LAER and offset requirements and eliminate the growth allowance until a revised maintenance plan is adopted by the EQC and approved by EPA;
• Other measures as appropriate. 4.50.7.2.2 Part B, Contingency Plan Based on Significant Increase in Vehicle Miles Traveled in the Oregon portion of the Portland-Vancouver AQMA EPA’s 8-hour ozone implementation rule (69 FR 23987-88, April 30, 2004) notes that although states cannot implement conformity for attainment areas as a matter of federal law, they could still work with their metropolitan planning organizations to develop a voluntary program to address motor vehicle emissions growth. Metro has agreed to informally track motor vehicle VOC and NOx emissions at the same time as they are demonstrating conformity with the Portland Carbon Monoxide Maintenance Plan emissions budget. In addition, Metro has agreed to the following contingency measures for the Portland Carbon Monoxide Maintenance Plan that are also appropriate as voluntary measures for addressing ozone precursor emissions within the Portland metropolitan area. Although transportation control measures cannot be enforced and are removed from the Portland AQMA Ozone Maintenance Plan, other measures to reduce vehicle miles traveled (VMT) such as the Employee Commute Option program and public education and outreach remain in the ozone maintenance plan. In addition, DEQ participates in Metro’s Regional Transportation Options program which includes many efforts in the Portland area designed to reduce single-occupancy vehicle trips. PHASE 1: 5% VMT INCREASE Metro will review and verify the local average vehicle miles traveled per capita (VMT/capita) for the Oregon portion of the Portland-Vancouver Air Quality Maintenance Area derived from the
7 Although EPA requires all former applicable measures such as the Enhanced Inspection/Maintenance test be included in the contingency plan, DEQ believes that reinstating enhanced testing would not be feasible or cost effective, and would evaluate other more effective measures if the contingency plan is triggered.
Adopted by the EQC 02/22/07 30
most recent estimates of population and daily vehicle miles traveled from federal and state sources. If daily VMT/capita exceeds a 5 % increase above the 2002 rate for two successive years, the Standing Committee [TPAC, as defined at OAR 340-252-0060(2)(b)(A)(iii)] shall be convened to:
a) determine whether there is a data problem with the trigger;
b) if there is not a data problem with the trigger, identify and analyze the effectiveness of those local actions that could reduce air pollutant emissions; and,
c) determine whether a recommendation should be made to JPACT to initiate local action to reduce VMT/capita until the 2002 level is once again attained.
PHASE 2: 10% VMT INCREASE Metro will review and verify local VMT/capita values derived from the most recent estimates of population and daily vehicle miles traveled from federal and state sources.
If average daily VMT/capita exceeds a 10 percent increase above the 2002 rate for the Oregon portion of the Portland-Vancouver Air Quality Maintenance Area for two successive years, the following measures will become required Transportation Control Measures for the region (as determined by the programming of funds for specified projects) under the Portland Carbon Monoxide Maintenance Plan:
a) Washington County Commuter Rail within six years after exceeding the 10% increase
above the 2002 VMT/capita rate,
b) Interstate 205 Light Rail Transit (I-205 LRT) within six years after exceeding the 10% increase above the 2002 VMT/capita rate;
c) An increase of efforts for the Regional Travel Options Program sufficient to increase the
number of employers reached by the program by at least 5 % per year the number of employers currently subject to the DEQ Employee Commute Options program. Alternatively, specific projects from the Regional Transportation Options program could be substituted.
d) An increase of funding of at least 5% per year greater than current funding for Transit Oriented Development projects.
e) Other programs or projects consistent with state and federal law as may be determined by the Metro Council after consultation with the Joint Policy Advisory Committee on Transportation.
4.50.7.3 Salem SKATS 8-Hour Ozone Contingency Plan PHASE 1: ELEVATED OZONE LEVELS If the air quality index (AQI) is forecast to be within the “orange” range for ozone air quality (unhealthy for sensitive populations), or 8-hour daily maximum ozone values reach 0.100 ppm or greater, and meteorological conditions conducive to ozone formation are expected to persist,
Adopted by the EQC 02/22/07 31
DEQ will issue an advisory to inform the public of air quality levels and actions they can take to limit exposure to unhealthy air pollution levels and reduce emissions. PHASE 2: RISK OF VIOLATION If monitored 8-hour ozone levels at any site within the Salem/Turner area registers an annual fourth high monitored value of 0.085 ppm or greater within a single ozone season, or 0.080 ppm or greater averaged over two years, DEQ will assess the likely emissions and meteorological events contributing to elevated ozone levels. DEQ may form a planning group to assist DEQ in its review. The DEQ could recommend that no action be taken if it is determined that: (a) elevated ozone levels were caused by an event that is unlikely to occur again, or (b) high ozone levels were caused by an uncontrollable event, such as a severe wildfire, or (c) federal regulations that will reduce ozone precursor emissions are scheduled to be implemented within two years. If it is determined that the event did not meet the criteria above, DEQ will evaluate options for appropriate action, including the option for additional emission reduction strategies to prevent future exceedances or a violation of the 8-hour ozone standard. PHASE 3: ACTUAL VIOLATION If a violation of the 8-hour ozone standard occurs, DEQ will determine the probable emissions and meteorological events contributing to the violation. If the violation is not due to an uncontrollable event or other criteria in Phase 2, DEQ will identify new strategies necessary to ensure compliance with the 8-hour ozone standard within 18 months of the conclusion of the ozone season that prompted the contingency plan, and revise the maintenance plan as needed to correct the violation. Contingency plan requirements described in OAR 340-224-0060(5) that reinstate the LAER requirement would also apply until a revised maintenance plan is adopted by the EQC and approved by EPA. 4.50.8 Verification of Continued Attainment (Portland-Vancouver and Salem) DEQ will continue to monitor ambient air quality ozone levels as described in the Contingency Plan. The Contingency Plan triggers that are based on ambient concentrations are intended to prevent violations of the 8-hour standard in the Portland-Vancouver and Salem areas. DEQ will update countywide emission inventories every three years as required by the Consolidated Emission and Reporting Rule (CERR) update of the National Emissions Inventory. If ambient ozone levels increase, DEQ will compare CERR updates with the 2002 and 2015 emissions inventories and evaluate the assumptions used in the 2015 emissions projections to determine whether emissions are increasing at a rate not anticipated in the maintenance plan. Appendices 1. Ozone Monitoring Network (Vancouver-Portland-Salem regional area map and site
description) 2. 1992 to 2005 Meteorological Factors Conducive to Ozone Formation in the Portland-
Vancouver Area (ODEQ, April 2006) 3. Emission Inventory
a. Annual Emissions Inventory b. Typical Summer Day Emissions Inventory c. Summary of Portland Area Emissions d. Summary of Salem Area Emissions
4. Historical and Future Ozone Simulations Using the MM5/SMOKE/CMAQ System in the Portland-Vancouver Area (WSU, December 31, 2005)
5. Economic Report to the Metro Council, 2000-2030 Regional Forecast for the Portland-Vancouver Metropolitan Area (Metro’s Data Resource Center, December 2002 final draft)
Adopted by the EQC 02/22/07 32
6. Modeled Attainment Test References
• “Maintenance Plan Guidance Document for Certain 8-hour Ozone Areas Under Section 110(a)(1) of the Clean Air Act” (memo dated May 20, 2005 from Lydia Wegman, EPA). The May 20, 2005 guidance applies to areas designated in attainment with the 8-hour ozone standard and preparing maintenance plans under Section 110(a)(1) of the Clean Air Act and 40 CFR 51.905(c) and (d).
• “Demonstrating Noninterference Under Section 110(l) of the Clean Air Act When Revising a State Implementation Plan” (draft EPA Guidance, 6/8/05)
• “1-Hour Ozone Maintenance Plans Containing Basic I/M Programs (memo dated May 12, 2004 from Tom Helms, EPA)
• April 30, 2004 Federal Register (69 FR 23951), Final Rule to Implement the 8-Hour Ozone NAAQS-Phase 1
• July 8, 2005 Federal Register (70 FR 39413), Notice of Final Rulemaking regarding Nonattainment Major New Source Review Implementation under 8-Hour Ozone NAAQS
• “Guidance on the Use of Models and Other Analyses in Attainment Demonstrations for the 8-hour Ozone NAAQS” (EPA-450/R-05-002, October, 2005)
• “Emission Inventory Guidance for Implementation of Ozone and Particulate Matter NAAQS and Regional Haze” (EPA-454/R-05-001, August 2005, updated November 2005)
• “2002 Base Year Emission Inventory SIP Planning: 8-hr Ozone, PM 2.5 and Regional Haze Programs” (memo dated November 18, 2002 from Lydia Wegman, EPA)
• “Procedures for Processing Requests to Redesignate Areas to Attainment” (memo dated September 4, 1992 from John Calcagni, EPA)
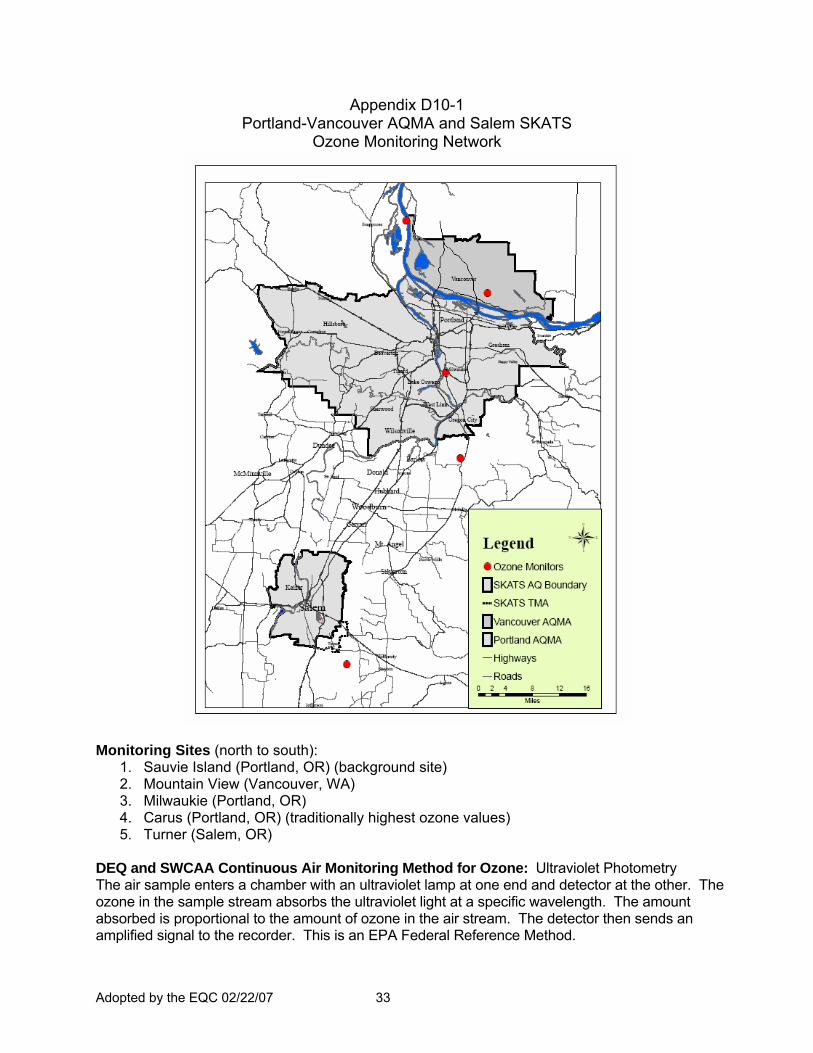
Adopted by the EQC 02/22/07 33
Appendix D10-1 Portland-Vancouver AQMA and Salem SKATS
Ozone Monitoring Network
Monitoring Sites (north to south): 1. Sauvie Island (Portland, OR) (background site) 2. Mountain View (Vancouver, WA) 3. Milwaukie (Portland, OR) 4. Carus (Portland, OR) (traditionally highest ozone values) 5. Turner (Salem, OR)
DEQ and SWCAA Continuous Air Monitoring Method for Ozone: Ultraviolet Photometry The air sample enters a chamber with an ultraviolet lamp at one end and detector at the other. The ozone in the sample stream absorbs the ultraviolet light at a specific wavelength. The amount absorbed is proportional to the amount of ozone in the air stream. The detector then sends an amplified signal to the recorder. This is an EPA Federal Reference Method.
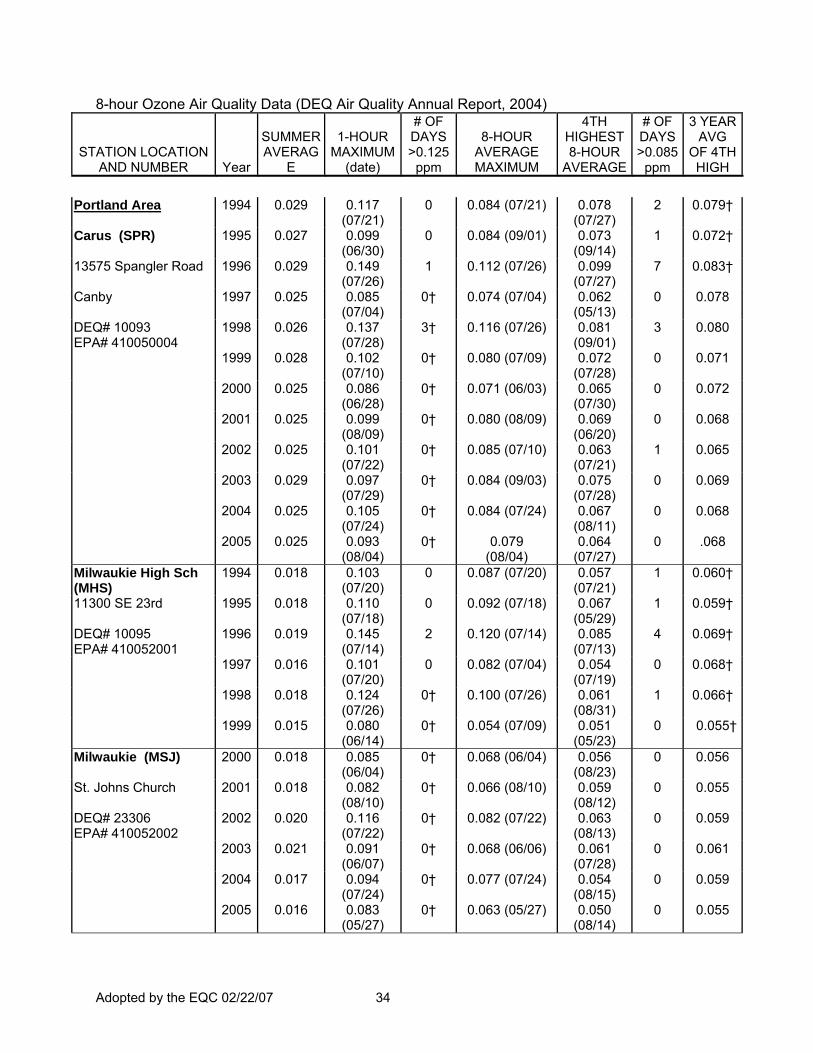
Adopted by the EQC 02/22/07 34
8-hour Ozone Air Quality Data (DEQ Air Quality Annual Report, 2004)
STATION LOCATION AND NUMBER Year
SUMMER AVERAG
E
1-HOUR MAXIMUM
(date)
# OF DAYS >0.125
ppm
8-HOUR AVERAGE MAXIMUM
4TH HIGHEST 8-HOUR
AVERAGE
# OF DAYS>0.085
ppm
3 YEAR AVG
OF 4TH HIGH
Portland Area 1994 0.029 0.117
(07/21) 0 0.084 (07/21) 0.078
(07/27) 2 0.079†
Carus (SPR) 1995 0.027 0.099 (06/30)
0 0.084 (09/01) 0.073 (09/14)
1 0.072†
13575 Spangler Road 1996 0.029 0.149 (07/26)
1 0.112 (07/26) 0.099 (07/27)
7 0.083†
Canby 1997 0.025 0.085 (07/04)
0† 0.074 (07/04) 0.062 (05/13)
0 0.078
DEQ# 10093 EPA# 410050004
1998 0.026 0.137 (07/28)
3† 0.116 (07/26) 0.081 (09/01)
3 0.080
1999 0.028 0.102 (07/10)
0† 0.080 (07/09) 0.072 (07/28)
0 0.071
2000 0.025 0.086 (06/28)
0† 0.071 (06/03) 0.065 (07/30)
0 0.072
2001 0.025 0.099 (08/09)
0† 0.080 (08/09) 0.069 (06/20)
0 0.068
2002 0.025 0.101 (07/22)
0† 0.085 (07/10) 0.063 (07/21)
1 0.065
2003 0.029 0.097 (07/29)
0† 0.084 (09/03) 0.075 (07/28)
0 0.069
2004
2005
0.025
0.025
0.105 (07/24) 0.093
(08/04)
0†
0†
0.084 (07/24)
0.079 (08/04)
0.067 (08/11) 0.064
(07/27)
0
0
0.068
.068
Milwaukie High Sch (MHS)
1994 0.018 0.103 (07/20)
0 0.087 (07/20) 0.057 (07/21)
1 0.060†
11300 SE 23rd 1995 0.018 0.110 (07/18)
0 0.092 (07/18) 0.067 (05/29)
1 0.059†
DEQ# 10095 EPA# 410052001
1996 0.019 0.145 (07/14)
2 0.120 (07/14) 0.085 (07/13)
4 0.069†
1997 0.016 0.101 (07/20)
0 0.082 (07/04) 0.054 (07/19)
0 0.068†
1998 0.018 0.124 (07/26)
0† 0.100 (07/26) 0.061 (08/31)
1 0.066†
1999 0.015 0.080 (06/14)
0† 0.054 (07/09) 0.051 (05/23)
0 0.055†
Milwaukie (MSJ) 2000 0.018 0.085 (06/04)
0† 0.068 (06/04) 0.056 (08/23)
0 0.056
St. Johns Church 2001 0.018 0.082 (08/10)
0† 0.066 (08/10) 0.059 (08/12)
0 0.055
DEQ# 23306 EPA# 410052002
2002 0.020 0.116 (07/22)
0† 0.082 (07/22) 0.063 (08/13)
0 0.059
2003 0.021 0.091 (06/07)
0† 0.068 (06/06) 0.061 (07/28)
0 0.061
2004
2005
0.017
0.016
0.094 (07/24) 0.083
(05/27)
0†
0†
0.077 (07/24)
0.063 (05/27)
0.054 (08/15) 0.050
(08/14)
0
0
0.059
0.055
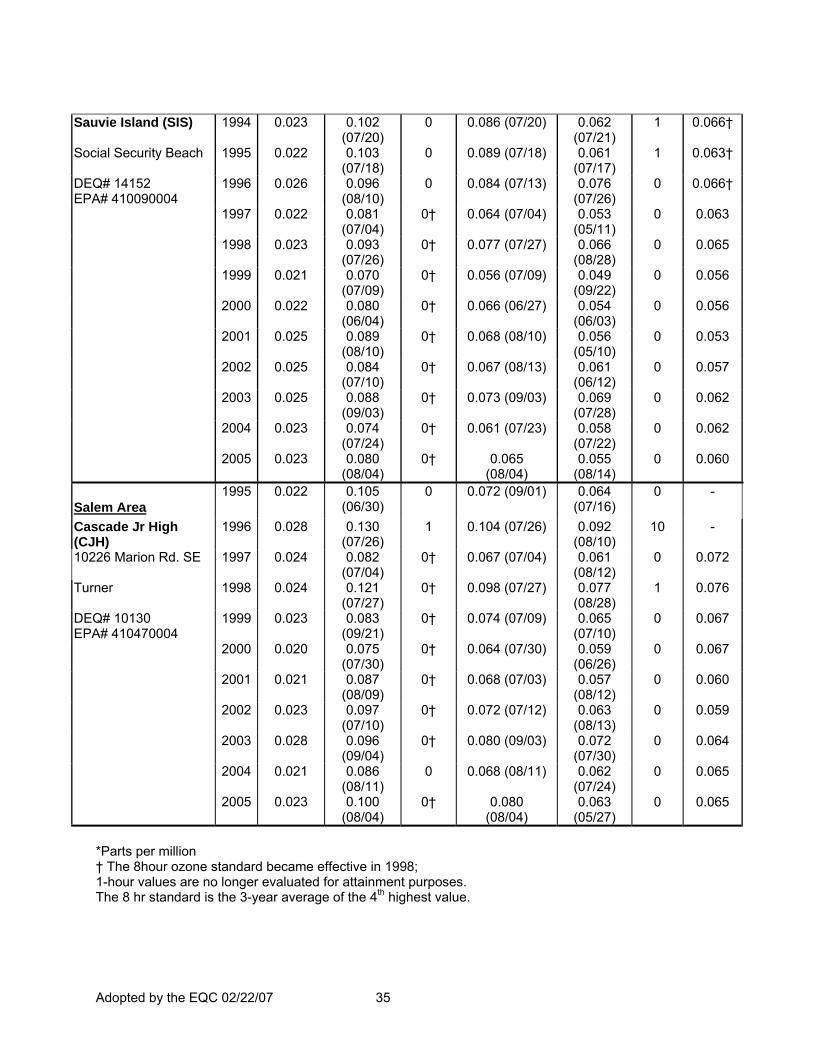
Adopted by the EQC 02/22/07 35
Sauvie Island (SIS) 1994 0.023 0.102
(07/20) 0 0.086 (07/20) 0.062
(07/21) 1 0.066†
Social Security Beach 1995 0.022 0.103 (07/18)
0 0.089 (07/18) 0.061 (07/17)
1 0.063†
DEQ# 14152 EPA# 410090004
1996 0.026 0.096 (08/10)
0 0.084 (07/13) 0.076 (07/26)
0 0.066†
1997 0.022 0.081 (07/04)
0† 0.064 (07/04) 0.053 (05/11)
0 0.063
1998 0.023 0.093 (07/26)
0† 0.077 (07/27) 0.066 (08/28)
0 0.065
1999 0.021 0.070 (07/09)
0† 0.056 (07/09) 0.049 (09/22)
0 0.056
2000 0.022 0.080 (06/04)
0† 0.066 (06/27) 0.054 (06/03)
0 0.056
2001 0.025 0.089 (08/10)
0† 0.068 (08/10) 0.056 (05/10)
0 0.053
2002 0.025 0.084 (07/10)
0† 0.067 (08/13) 0.061 (06/12)
0 0.057
2003 0.025 0.088 (09/03)
0† 0.073 (09/03) 0.069 (07/28)
0 0.062
2004
2005
0.023
0.023
0.074 (07/24) 0.080
(08/04)
0†
0†
0.061 (07/23)
0.065 (08/04)
0.058 (07/22) 0.055
(08/14)
0
0
0.062
0.060
Salem Area 1995 0.022 0.105
(06/30) 0 0.072 (09/01) 0.064
(07/16) 0 -
Cascade Jr High (CJH)
1996 0.028 0.130 (07/26)
1 0.104 (07/26) 0.092 (08/10)
10 -
10226 Marion Rd. SE 1997 0.024 0.082 (07/04)
0† 0.067 (07/04) 0.061 (08/12)
0 0.072
Turner 1998 0.024 0.121 (07/27)
0† 0.098 (07/27) 0.077 (08/28)
1 0.076
DEQ# 10130 EPA# 410470004
1999 0.023 0.083 (09/21)
0† 0.074 (07/09) 0.065 (07/10)
0 0.067
2000 0.020 0.075 (07/30)
0† 0.064 (07/30) 0.059 (06/26)
0 0.067
2001 0.021 0.087 (08/09)
0† 0.068 (07/03) 0.057 (08/12)
0 0.060
2002 0.023 0.097 (07/10)
0† 0.072 (07/12) 0.063 (08/13)
0 0.059
2003 0.028 0.096 (09/04)
0† 0.080 (09/03) 0.072 (07/30)
0 0.064
2004
2005
0.021
0.023
0.086 (08/11) 0.100
(08/04)
0
0†
0.068 (08/11)
0.080 (08/04)
0.062 (07/24) 0.063
(05/27)
0
0
0.065
0.065
*Parts per million † The 8hour ozone standard became effective in 1998; 1-hour values are no longer evaluated for attainment purposes. The 8 hr standard is the 3-year average of the 4th highest value.
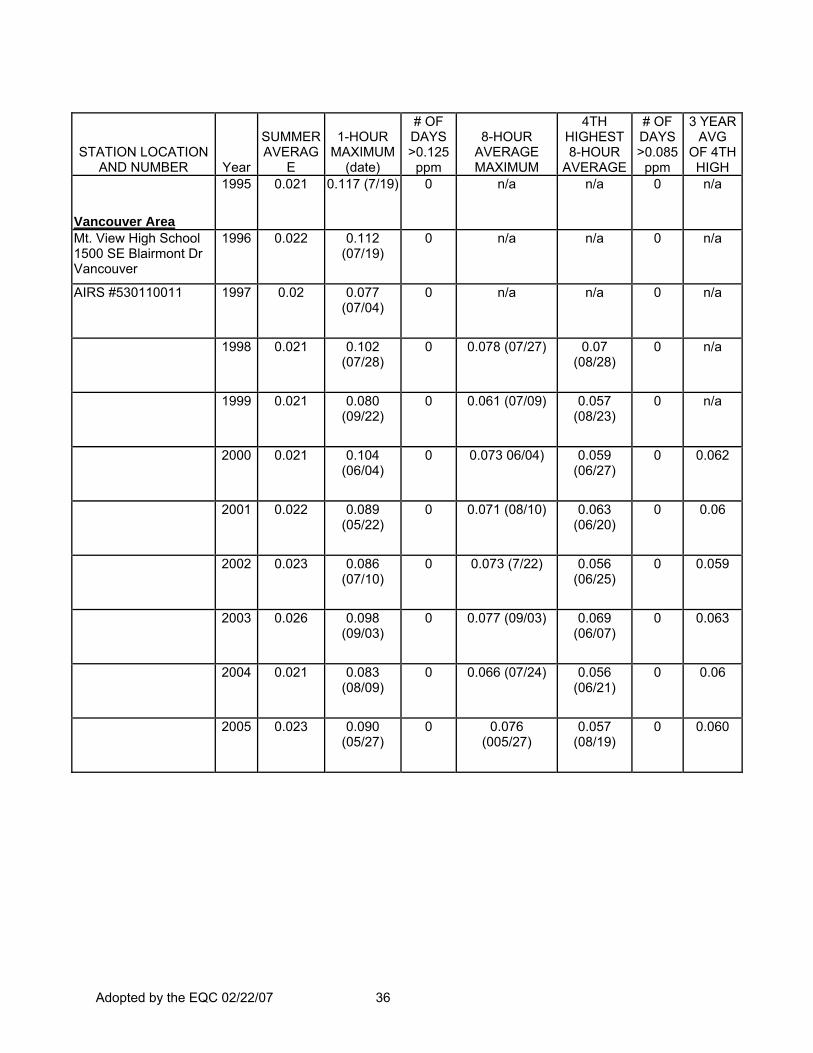
Adopted by the EQC 02/22/07 36
STATION LOCATION AND NUMBER Year
SUMMER AVERAG
E
1-HOUR MAXIMUM
(date)
# OF DAYS >0.125
ppm
8-HOUR AVERAGE MAXIMUM
4TH HIGHEST 8-HOUR
AVERAGE
# OF DAYS>0.085
ppm
3 YEAR AVG
OF 4TH HIGH
Vancouver Area
1995 0.021 0.117 (7/19) 0 n/a n/a 0 n/a
Mt. View High School 1500 SE Blairmont Dr Vancouver
1996 0.022 0.112 (07/19)
0 n/a n/a 0 n/a
AIRS #530110011 1997 0.02 0.077 (07/04)
0 n/a n/a 0 n/a
1998 0.021 0.102 (07/28)
0 0.078 (07/27) 0.07 (08/28)
0 n/a
1999 0.021 0.080 (09/22)
0 0.061 (07/09) 0.057 (08/23)
0 n/a
2000 0.021 0.104 (06/04)
0 0.073 06/04) 0.059 (06/27)
0 0.062
2001 0.022 0.089 (05/22)
0 0.071 (08/10) 0.063 (06/20)
0 0.06
2002 0.023 0.086 (07/10)
0 0.073 (7/22) 0.056 (06/25)
0 0.059
2003 0.026 0.098 (09/03)
0 0.077 (09/03) 0.069 (06/07)
0 0.063
2004 0.021 0.083 (08/09)
0 0.066 (07/24) 0.056 (06/21)
0 0.06
2005 0.023 0.090 (05/27)
0 0.076 (005/27)
0.057 (08/19)
0 0.060
Adopted by the EQC 02/22/07 37
Appendix D10-2
1992 to 2005 Meteorological Factors Conducive to Ozone Formation in the Portland-Vancouver Area
(ODEQ, April 2006)
Please contact DEQ for a copy of this appendix
Air Quality Division
(503) 229-5177 [email protected]
Or
Anthony Barnack
Air Quality Division Report Author
(503) 229-5713 [email protected]
Adopted by the EQC 02/22/07 38
Appendix D10-3 Emission Inventory
The Portland-Vancouver AQMA and the Salem-Keizer Area Transportation Study air quality area were designated “Unclassifiable/Attainment” with the 8-hour ozone National Ambient Air Quality Standard (NAAQS) on April 30, 2004 (69 FR 23829-30), as demonstrated through air quality monitoring data. EPA requires this maintenance plan to demonstrate continued compliance for at least ten years following EPA designation. WSU performed a modeling analysis that forecasted ozone levels to 2015 and determined that these areas will continue to meet the standard. The maintenance plan accommodates future growth and provides for the protection of public health by ensuring compliance with the 8-hour ozone standard. The maintenance plan continues emission reduction strategies needed to maintain compliance. To approve the maintenance plan, EPA requires permanent and enforceable reductions in emissions to remain in effect throughout the maintenance period. In compliance with published EPA requirements, this emission inventory is provided as a part of the State’s revisions to its State Implementation Plan (SIP) to formulate a strategy to maintain the NAAQS. The principal components for development and documentation for the maintenance plan inventories include stationary point sources, stationary area sources, non-road mobile sources, on-road mobile sources, biogenic emission sources, quality assurance implementation, and emissions summaries. The geographic focus for this emission inventory is the Oregon portion of the Portland-Vancouver AQMA and the Salem-Keizer Area Transportation Study (SKATS) air quality area. Countywide estimates are used to facilitate comparison with future year National Emission Inventory submittals. The emissions inventory for the Portland-Vancouver AQMA (Oregon portion) includes Clackamas, Multnomah and Washington counties. The emissions inventory for the Salem-Keizer SKATS air quality area includes Marion and Polk counties. A complete copy of the emission inventory is on file at DEQ and available upon request. The WSU modeling study (Appendix D10-4) describes the emissions inventory that was used to validate the model and evaluate the 2015 projection. The model meteorology was based on a July 1998 episode in which the Portland area violated the one-hour ozone NAAQS at the Carus monitoring site. Point source emissions from sources that are not Title 5 point sources were inventoried by DEQ regional staff and SWCAA using the following parameters:
Geographic Area VOC NOx CO AQMA >10 tons/year >40 tons/year >100 tons/year 25-mile buffer >100 tons/year >40 tons/year >100 tons/year Modeling domain >100 tons/year >40 tons/year >100 tons/year
In this document the terms “annual emissions” and “typical summer day” emissions are used to categorize the estimated emissions for a particular time period. The annual emissions, in tons per year, are a total amount of emissions for the source category that occurred throughout the year. The typical summer day emissions, in pounds per day, are based on the ozone season period from May 1st through September 30th as one in which, historically, the 8-hour ozone standard would most likely be exceeded.
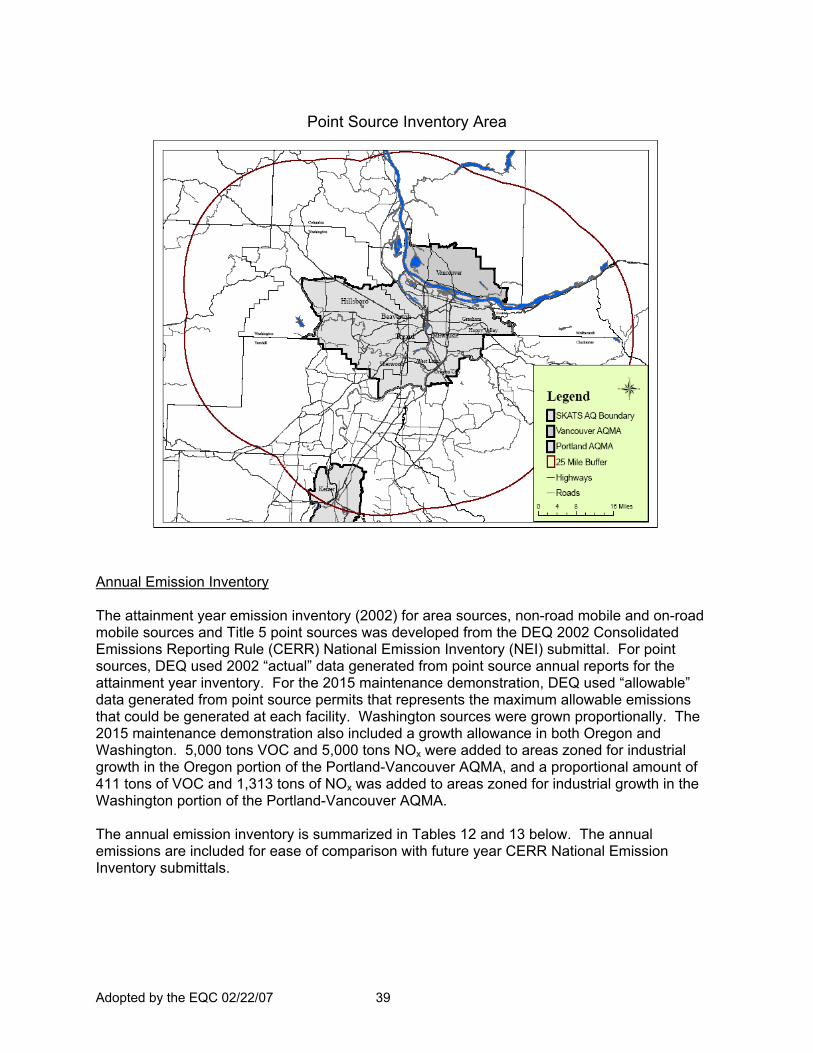
Adopted by the EQC 02/22/07 39
Point Source Inventory Area
Annual Emission Inventory The attainment year emission inventory (2002) for area sources, non-road mobile and on-road mobile sources and Title 5 point sources was developed from the DEQ 2002 Consolidated Emissions Reporting Rule (CERR) National Emission Inventory (NEI) submittal. For point sources, DEQ used 2002 “actual” data generated from point source annual reports for the attainment year inventory. For the 2015 maintenance demonstration, DEQ used “allowable” data generated from point source permits that represents the maximum allowable emissions that could be generated at each facility. Washington sources were grown proportionally. The 2015 maintenance demonstration also included a growth allowance in both Oregon and Washington. 5,000 tons VOC and 5,000 tons NOx were added to areas zoned for industrial growth in the Oregon portion of the Portland-Vancouver AQMA, and a proportional amount of 411 tons of VOC and 1,313 tons of NOx was added to areas zoned for industrial growth in the Washington portion of the Portland-Vancouver AQMA. The annual emission inventory is summarized in Tables 12 and 13 below. The annual emissions are included for ease of comparison with future year CERR National Emission Inventory submittals.
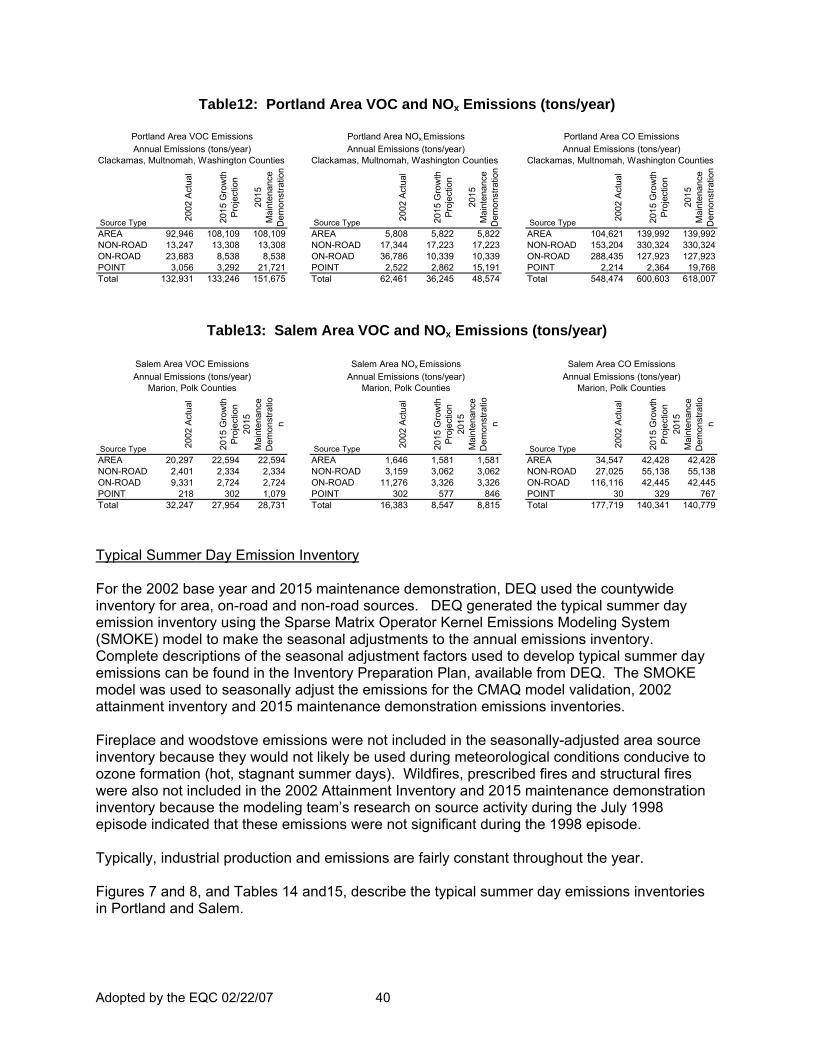
Adopted by the EQC 02/22/07 40
Table12: Portland Area VOC and NOx Emissions (tons/year)
Clackamas, Multnomah, Washington Counties Clackamas, Multnomah, Washington Counties Clackamas, Multnomah, Washington Counties
Source Type 2002
Act
ual
2015
Gro
wth
Pr
ojec
tion
2015
M
aint
enan
ce
Dem
onst
ratio
n
Source Type 2002
Act
ual
2015
Gro
wth
Pr
ojec
tion
2015
M
aint
enan
ce
Dem
onst
ratio
n
Source Type 2002
Act
ual
2015
Gro
wth
Pr
ojec
tion
2015
M
aint
enan
ce
Dem
onst
ratio
n
AREA 92,946 108,109 108,109 AREA 5,808 5,822 5,822 AREA 104,621 139,992 139,992NON-ROAD 13,247 13,308 13,308 NON-ROAD 17,344 17,223 17,223 NON-ROAD 153,204 330,324 330,324ON-ROAD 23,683 8,538 8,538 ON-ROAD 36,786 10,339 10,339 ON-ROAD 288,435 127,923 127,923POINT 3,056 3,292 21,721 POINT 2,522 2,862 15,191 POINT 2,214 2,364 19,768Total 132,931 133,246 151,675 Total 62,461 36,245 48,574 Total 548,474 600,603 618,007
Portland Area VOC Emissions Portland Area NOx Emissions Portland Area CO EmissionsAnnual Emissions (tons/year) Annual Emissions (tons/year) Annual Emissions (tons/year)
Table13: Salem Area VOC and NOx Emissions (tons/year)
Source Type 2002
Act
ual
2015
Gro
wth
Pr
ojec
tion
2015
M
aint
enan
ce
Dem
onst
ratio
n
Source Type 2002
Act
ual
2015
Gro
wth
Pr
ojec
tion
2015
M
aint
enan
ce
Dem
onst
ratio
n
Source Type 2002
Act
ual
2015
Gro
wth
Pr
ojec
tion
2015
M
aint
enan
ce
Dem
onst
ratio
n
AREA 20,297 22,594 22,594 AREA 1,646 1,581 1,581 AREA 34,547 42,428 42,428NON-ROAD 2,401 2,334 2,334 NON-ROAD 3,159 3,062 3,062 NON-ROAD 27,025 55,138 55,138ON-ROAD 9,331 2,724 2,724 ON-ROAD 11,276 3,326 3,326 ON-ROAD 116,116 42,445 42,445POINT 218 302 1,079 POINT 302 577 846 POINT 30 329 767Total 32,247 27,954 28,731 Total 16,383 8,547 8,815 Total 177,719 140,341 140,779
Marion, Polk Counties
Salem Area NOx Emissions Salem Area CO Emissions
Marion, Polk Counties Marion, Polk CountiesAnnual Emissions (tons/year) Annual Emissions (tons/year) Annual Emissions (tons/year)Salem Area VOC Emissions
Typical Summer Day Emission Inventory For the 2002 base year and 2015 maintenance demonstration, DEQ used the countywide inventory for area, on-road and non-road sources. DEQ generated the typical summer day emission inventory using the Sparse Matrix Operator Kernel Emissions Modeling System (SMOKE) model to make the seasonal adjustments to the annual emissions inventory. Complete descriptions of the seasonal adjustment factors used to develop typical summer day emissions can be found in the Inventory Preparation Plan, available from DEQ. The SMOKE model was used to seasonally adjust the emissions for the CMAQ model validation, 2002 attainment inventory and 2015 maintenance demonstration emissions inventories. Fireplace and woodstove emissions were not included in the seasonally-adjusted area source inventory because they would not likely be used during meteorological conditions conducive to ozone formation (hot, stagnant summer days). Wildfires, prescribed fires and structural fires were also not included in the 2002 Attainment Inventory and 2015 maintenance demonstration inventory because the modeling team’s research on source activity during the July 1998 episode indicated that these emissions were not significant during the 1998 episode. Typically, industrial production and emissions are fairly constant throughout the year. Figures 7 and 8, and Tables 14 and15, describe the typical summer day emissions inventories in Portland and Salem.
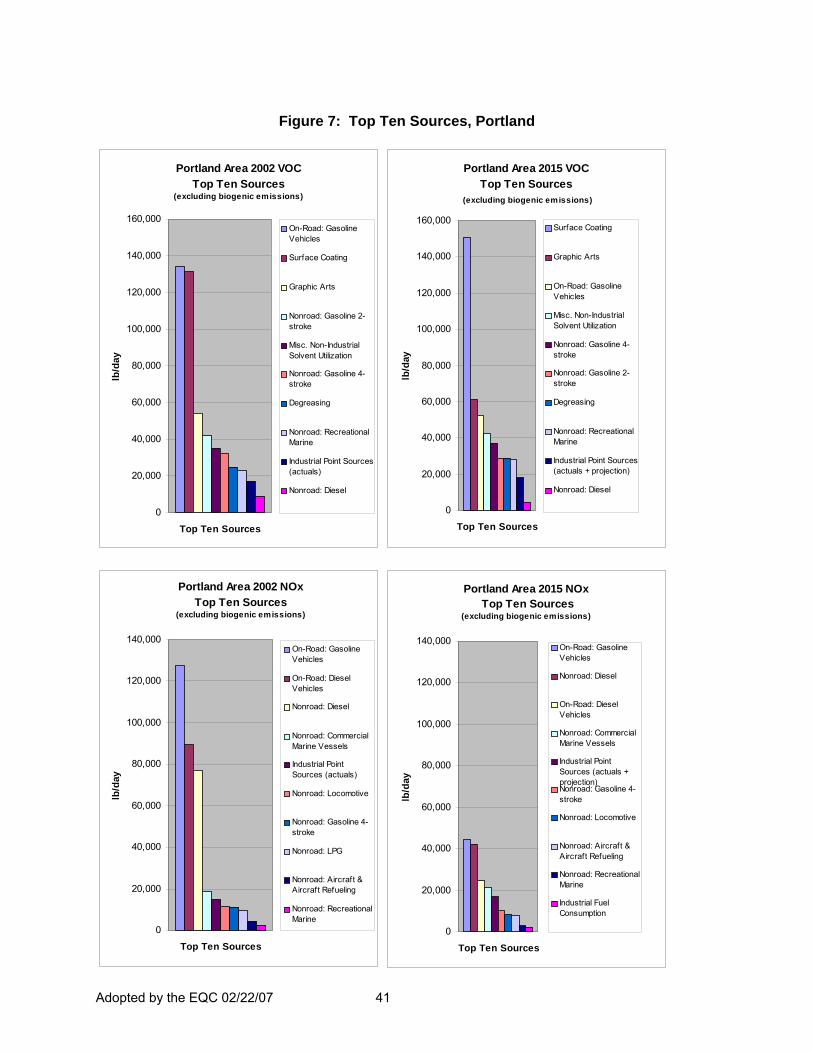
Adopted by the EQC 02/22/07 41
Figure 7: Top Ten Sources, Portland
Portland Area 2002 NOxTop Ten Sources
(excluding biogenic emissions)
0
20,000
40,000
60,000
80,000
100,000
120,000
140,000
Top Ten Sources
lb/d
ay
On-Road: GasolineVehicles
On-Road: DieselVehicles
Nonroad: Diesel
Nonroad: CommercialMarine Vessels
Industrial PointSources (actuals)
Nonroad: Locomotive
Nonroad: Gasoline 4-stroke
Nonroad: LPG
Nonroad: Aircraft &Aircraft Refueling
Nonroad: RecreationalMarine
Portland Area 2015 NOx Top Ten Sources
(excluding biogenic emissions)
0
20,000
40,000
60,000
80,000
100,000
120,000
140,000
Top Ten Sources
lb/d
ay
On-Road: GasolineVehicles
Nonroad: Diesel
On-Road: DieselVehicles
Nonroad: CommercialMarine Vessels
Industrial PointSources (actuals +projection)Nonroad: Gasoline 4-stroke
Nonroad: Locomotive
Nonroad: Aircraft &Aircraft Refueling
Nonroad: RecreationalMarine
Industrial FuelConsumption
Portland Area 2002 VOC Top Ten Sources
(excluding biogenic emissions)
0
20,000
40,000
60,000
80,000
100,000
120,000
140,000
160,000
Top Ten Sources
lb/d
ay
On-Road: GasolineVehicles
Surface Coating
Graphic Arts
Nonroad: Gasoline 2-stroke
Misc. Non-IndustrialSolvent Utilization
Nonroad: Gasoline 4-stroke
Degreasing
Nonroad: RecreationalMarine
Industrial Point Sources(actuals)
Nonroad: Diesel
Portland Area 2015 VOC Top Ten Sources
(excluding biogenic emissions)
0
20,000
40,000
60,000
80,000
100,000
120,000
140,000
160,000
Top Ten Sources
lb/d
ay
Surface Coating
Graphic Arts
On-Road: GasolineVehicles
Misc. Non-IndustrialSolvent Utilization
Nonroad: Gasoline 4-stroke
Nonroad: Gasoline 2-stroke
Degreasing
Nonroad: RecreationalMarine
Industrial Point Sources(actuals + projection)
Nonroad: Diesel
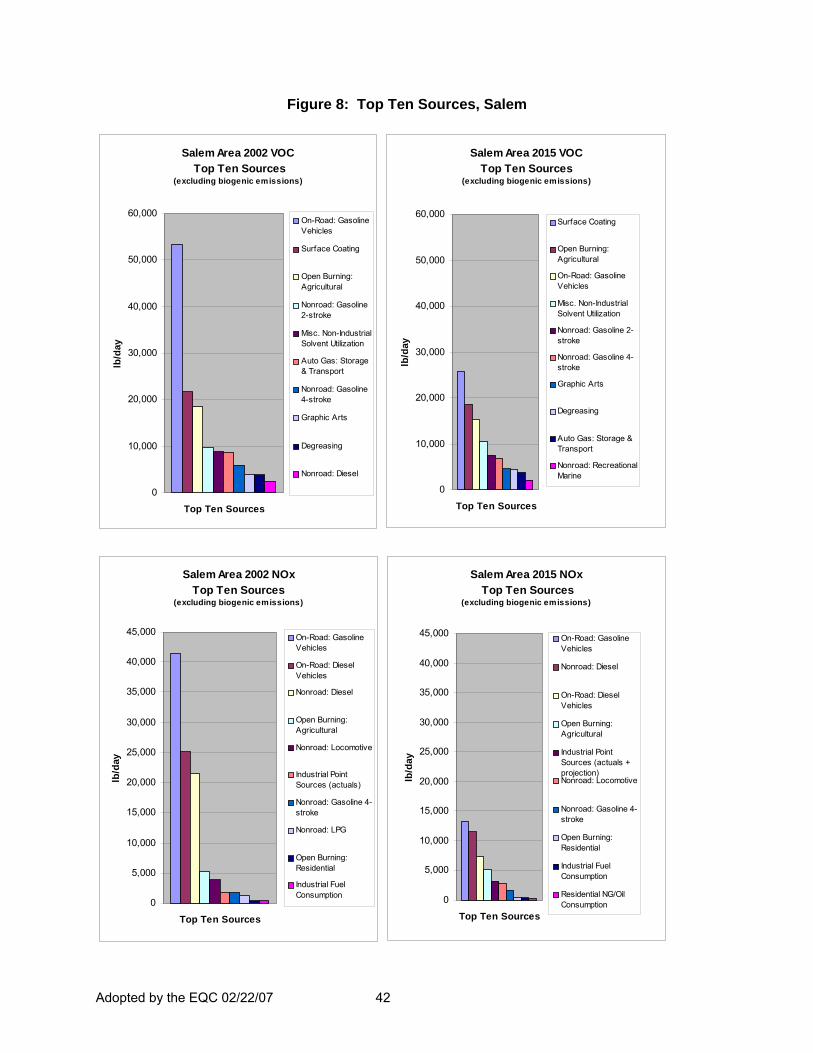
Adopted by the EQC 02/22/07 42
Figure 8: Top Ten Sources, Salem
Salem Area 2002 VOC Top Ten Sources
(excluding biogenic emissions)
0
10,000
20,000
30,000
40,000
50,000
60,000
Top Ten Sources
lb/d
ay
On-Road: GasolineVehicles
Surface Coating
Open Burning:Agricultural
Nonroad: Gasoline2-stroke
Misc. Non-IndustrialSolvent Utilization
Auto Gas: Storage& Transport
Nonroad: Gasoline4-stroke
Graphic Arts
Degreasing
Nonroad: Diesel
Salem Area 2015 VOCTop Ten Sources
(excluding biogenic emissions)
0
10,000
20,000
30,000
40,000
50,000
60,000
Top Ten Sources
lb/d
ay
Surface Coating
Open Burning:Agricultural
On-Road: GasolineVehicles
Misc. Non-IndustrialSolvent Utilization
Nonroad: Gasoline 2-stroke
Nonroad: Gasoline 4-stroke
Graphic Arts
Degreasing
Auto Gas: Storage &Transport
Nonroad: RecreationalMarine
Salem Area 2002 NOx Top Ten Sources
(excluding biogenic emissions)
0
5,000
10,000
15,000
20,000
25,000
30,000
35,000
40,000
45,000
Top Ten Sources
lb/d
ay
On-Road: GasolineVehicles
On-Road: DieselVehicles
Nonroad: Diesel
Open Burning:Agricultural
Nonroad: Locomotive
Industrial PointSources (actuals)
Nonroad: Gasoline 4-stroke
Nonroad: LPG
Open Burning:Residential
Industrial FuelConsumption
Salem Area 2015 NOx Top Ten Sources
(excluding biogenic emissions)
0
5,000
10,000
15,000
20,000
25,000
30,000
35,000
40,000
45,000
Top Ten Sources
lb/d
ay
On-Road: GasolineVehicles
Nonroad: Diesel
On-Road: DieselVehicles
Open Burning:Agricultural
Industrial PointSources (actuals +projection)Nonroad: Locomotive
Nonroad: Gasoline 4-stroke
Open Burning:Residential
Industrial FuelConsumption
Residential NG/OilConsumption
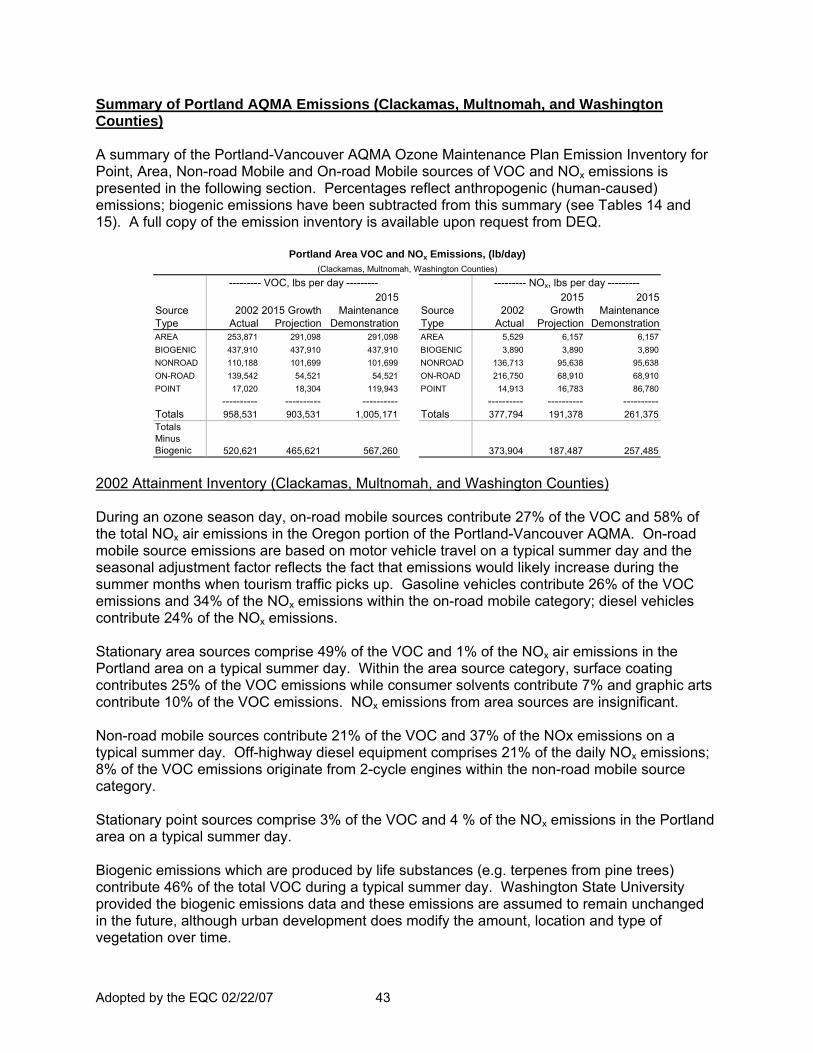
Adopted by the EQC 02/22/07 43
Summary of Portland AQMA Emissions (Clackamas, Multnomah, and Washington Counties) A summary of the Portland-Vancouver AQMA Ozone Maintenance Plan Emission Inventory for Point, Area, Non-road Mobile and On-road Mobile sources of VOC and NOx emissions is presented in the following section. Percentages reflect anthropogenic (human-caused) emissions; biogenic emissions have been subtracted from this summary (see Tables 14 and 15). A full copy of the emission inventory is available upon request from DEQ.
Source SourceType TypeAREA 253,871 291,098 291,098 AREA 5,529 6,157 6,157BIOGENIC 437,910 437,910 437,910 BIOGENIC 3,890 3,890 3,890NONROAD 110,188 101,699 101,699 NONROAD 136,713 95,638 95,638ON-ROAD 139,542 54,521 54,521 ON-ROAD 216,750 68,910 68,910POINT 17,020 18,304 119,943 POINT 14,913 16,783 86,780
---------- ---------- ---------- ---------- ---------- ----------Totals 958,531 903,531 1,005,171 Totals 377,794 191,378 261,375Totals Minus Biogenic 520,621 465,621 567,260 373,904 187,487 257,485
2002 Actual
2015 Growth Projection
Portland Area VOC and NOx Emissions, (lb/day)(Clackamas, Multnomah, Washington Counties)
--------- VOC, lbs per day --------- --------- NOx, lbs per day ---------2015
Growth Projection
2015 Maintenance
Demonstration
2015 Maintenance
Demonstration2002
Actual
2002 Attainment Inventory (Clackamas, Multnomah, and Washington Counties) During an ozone season day, on-road mobile sources contribute 27% of the VOC and 58% of the total NOx air emissions in the Oregon portion of the Portland-Vancouver AQMA. On-road mobile source emissions are based on motor vehicle travel on a typical summer day and the seasonal adjustment factor reflects the fact that emissions would likely increase during the summer months when tourism traffic picks up. Gasoline vehicles contribute 26% of the VOC emissions and 34% of the NOx emissions within the on-road mobile category; diesel vehicles contribute 24% of the NOx emissions. Stationary area sources comprise 49% of the VOC and 1% of the NOx air emissions in the Portland area on a typical summer day. Within the area source category, surface coating contributes 25% of the VOC emissions while consumer solvents contribute 7% and graphic arts contribute 10% of the VOC emissions. NOx emissions from area sources are insignificant. Non-road mobile sources contribute 21% of the VOC and 37% of the NOx emissions on a typical summer day. Off-highway diesel equipment comprises 21% of the daily NOx emissions; 8% of the VOC emissions originate from 2-cycle engines within the non-road mobile source category. Stationary point sources comprise 3% of the VOC and 4 % of the NOx emissions in the Portland area on a typical summer day. Biogenic emissions which are produced by life substances (e.g. terpenes from pine trees) contribute 46% of the total VOC during a typical summer day. Washington State University provided the biogenic emissions data and these emissions are assumed to remain unchanged in the future, although urban development does modify the amount, location and type of vegetation over time.
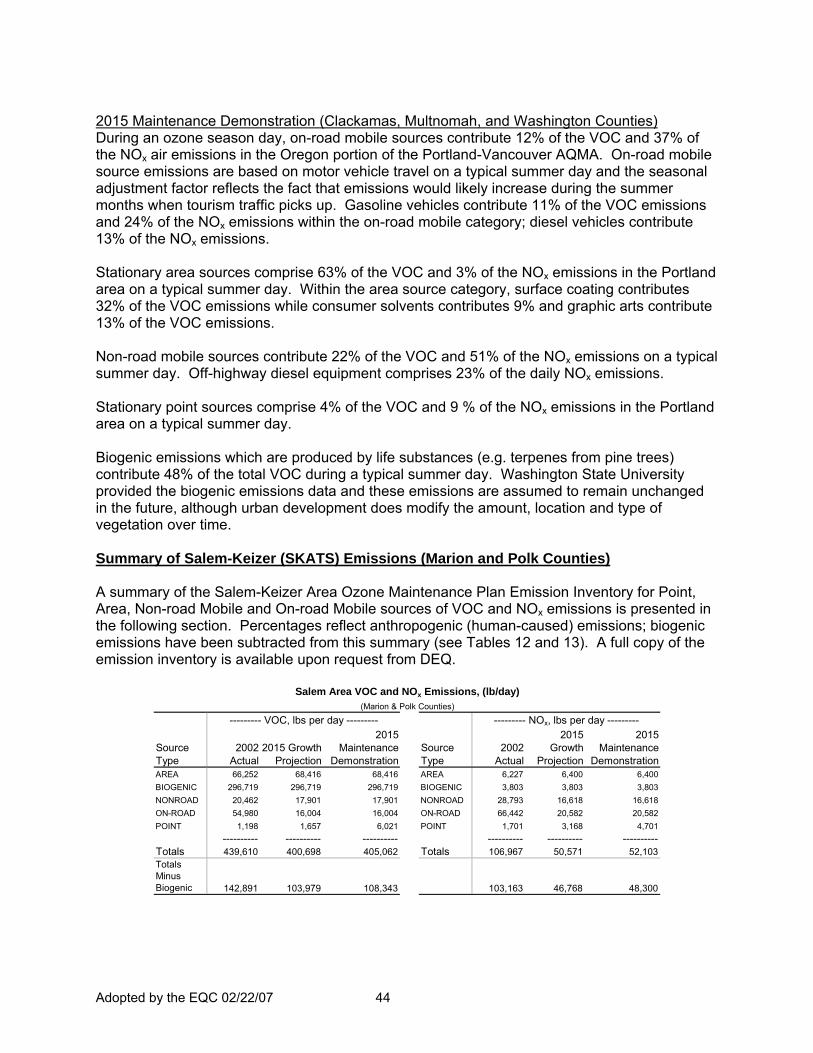
Adopted by the EQC 02/22/07 44
2015 Maintenance Demonstration (Clackamas, Multnomah, and Washington Counties) During an ozone season day, on-road mobile sources contribute 12% of the VOC and 37% of the NOx air emissions in the Oregon portion of the Portland-Vancouver AQMA. On-road mobile source emissions are based on motor vehicle travel on a typical summer day and the seasonal adjustment factor reflects the fact that emissions would likely increase during the summer months when tourism traffic picks up. Gasoline vehicles contribute 11% of the VOC emissions and 24% of the NOx emissions within the on-road mobile category; diesel vehicles contribute 13% of the NOx emissions. Stationary area sources comprise 63% of the VOC and 3% of the NOx emissions in the Portland area on a typical summer day. Within the area source category, surface coating contributes 32% of the VOC emissions while consumer solvents contributes 9% and graphic arts contribute 13% of the VOC emissions. Non-road mobile sources contribute 22% of the VOC and 51% of the NOx emissions on a typical summer day. Off-highway diesel equipment comprises 23% of the daily NOx emissions. Stationary point sources comprise 4% of the VOC and 9 % of the NOx emissions in the Portland area on a typical summer day. Biogenic emissions which are produced by life substances (e.g. terpenes from pine trees) contribute 48% of the total VOC during a typical summer day. Washington State University provided the biogenic emissions data and these emissions are assumed to remain unchanged in the future, although urban development does modify the amount, location and type of vegetation over time. Summary of Salem-Keizer (SKATS) Emissions (Marion and Polk Counties) A summary of the Salem-Keizer Area Ozone Maintenance Plan Emission Inventory for Point, Area, Non-road Mobile and On-road Mobile sources of VOC and NOx emissions is presented in the following section. Percentages reflect anthropogenic (human-caused) emissions; biogenic emissions have been subtracted from this summary (see Tables 12 and 13). A full copy of the emission inventory is available upon request from DEQ.
Source SourceType TypeAREA 66,252 68,416 68,416 AREA 6,227 6,400 6,400BIOGENIC 296,719 296,719 296,719 BIOGENIC 3,803 3,803 3,803NONROAD 20,462 17,901 17,901 NONROAD 28,793 16,618 16,618ON-ROAD 54,980 16,004 16,004 ON-ROAD 66,442 20,582 20,582POINT 1,198 1,657 6,021 POINT 1,701 3,168 4,701
---------- ---------- ---------- ---------- ---------- ----------Totals 439,610 400,698 405,062 Totals 106,967 50,571 52,103Totals Minus Biogenic 142,891 103,979 108,343 103,163 46,768 48,300
2015 Growth
Projection
2015 Maintenance
Demonstration
--------- NOx, lbs per day ---------
2002 Actual
2015 Growth Projection
--------- VOC, lbs per day ---------2015
Maintenance Demonstration
2002 Actual
Salem Area VOC and NOx Emissions, (lb/day)(Marion & Polk Counties)
Adopted by the EQC 02/22/07 45
2002 Attainment Inventory (Marion and Polk Counties) During an ozone season day, on-road mobile sources contribute 38% of the VOC and 64% of the NOx emissions in the Salem-Keizer area. On-road mobile source emissions are based on motor vehicle travel on a typical summer day and the seasonal adjustment factor reflects the fact that emissions would likely increase during the summer months when tourism traffic picks up. Gasoline vehicles contribute 35% of the VOC emissions and 40% of the NOx emissions within the on-road mobile category. On-road diesel vehicles contribute 24% of the NOx emissions. Stationary area sources comprise 46% of the VOC and 6% of the NOx emissions in the Salem area on a typical summer day. Within the area source category, surface coating contributes 15% of the VOC emissions while agricultural open burning contributes 13% and consumer solvents contributes 6% of the VOC emissions. Non-road mobile sources contribute 14% of the VOC and 28% of the NOx emissions on a typical summer day. Off-highway diesel equipment comprises 21% of the daily NOx emissions; 7% of the total VOC emissions originate from 2-cycle engines within the non-road mobile source category. Stationary point sources comprise 1% of the VOC and 2 % of the NOx emissions in the Salem area on a typical summer day. Biogenic emissions contribute 67% of the total VOC during a typical ozone season day. Biogenic emissions data was provided by Washington State University and these emissions were assumed to remain unchanged in the future, although urban development does modify the amount, location and type of vegetation over time. 2015 Maintenance Demonstration (Marion and Polk Counties) During an ozone season day, on-road mobile sources contribute 15% of the VOC and 44% of the NOx emissions in the Salem-Keizer area. On-road mobile source emissions are based on motor vehicle travel on a typical summer day and the seasonal adjustment factor reflects the fact that emissions would likely increase during the summer months when tourism traffic picks up. Gasoline vehicles contribute 15% of the VOC emissions and 28% of the NOx emissions within the on-road mobile category. On-road diesel vehicles contribute 16% of the NOx emissions. Stationary area sources comprise 66% of the VOC and 13% of the NOx emissions in the Salem area on a typical summer day. Within the area source category, surface coating contributes 25% of the VOC emissions while agricultural open burning contributes 18% and consumer solvents contributes 10% of the VOC emissions. Non-road mobile sources contribute 17% of the VOC and 36% of the NOx emissions on a typical summer day. Off-highway diesel equipment comprises 25% of the daily NOx emissions; 7% of the VOC emissions originate from 2-cycle engines within the non-road mobile source category. Stationary point sources comprise 2% of the VOC and 7 % of the NOx emissions in the Salem area on a typical summer day. This includes one proposed energy facility that has since withdrawn its permit application and will not be constructed.
Adopted by the EQC 02/22/07 46
Biogenic emissions contribute 74% of the total VOC during a typical ozone season day. Biogenic emissions data was provided by Washington State University and these emissions were assumed to remain unchanged in the future, although urban development does modify the amount, location and type of vegetation over time.
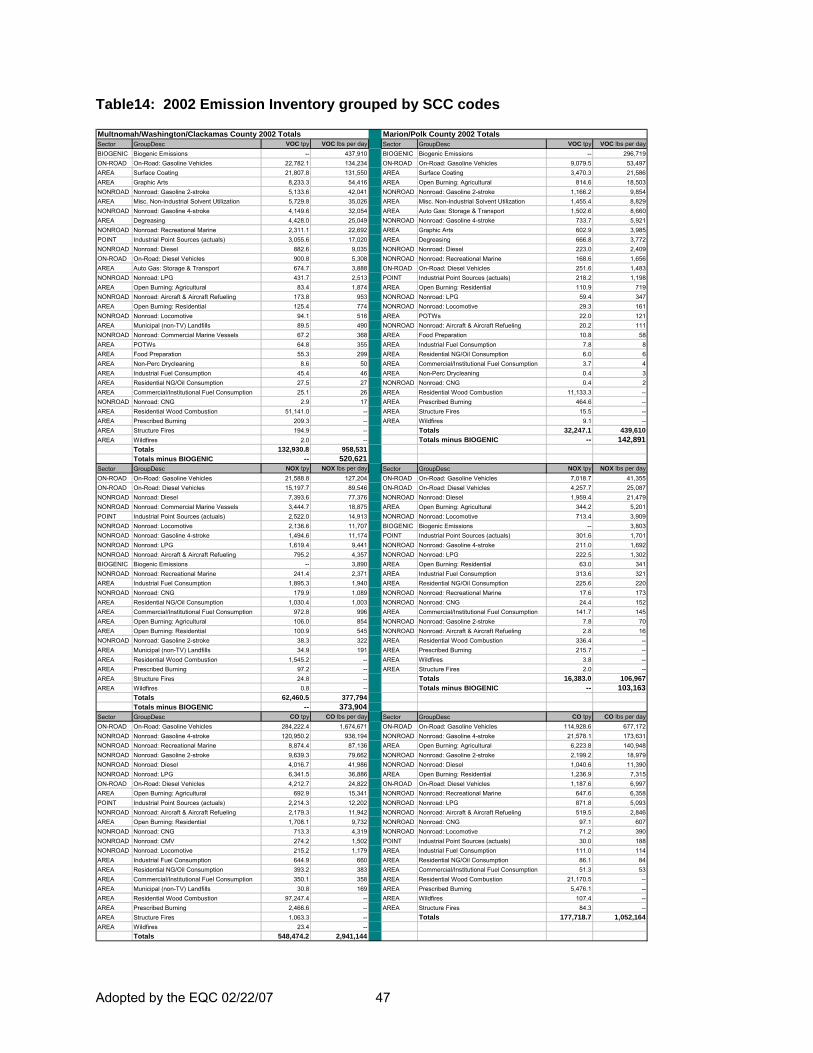
Adopted by the EQC 02/22/07 47
Table14: 2002 Emission Inventory grouped by SCC codes Multnomah/Washington/Clackamas County 2002 Totals Marion/Polk County 2002 TotalsSector GroupDesc VOC tpy VOC lbs per day Sector GroupDesc VOC tpy VOC lbs per dayBIOGENIC Biogenic Emissions -- 437,910 BIOGENIC Biogenic Emissions -- 296,719ON-ROAD On-Road: Gasoline Vehicles 22,782.1 134,234 ON-ROAD On-Road: Gasoline Vehicles 9,079.5 53,497AREA Surface Coating 21,807.8 131,550 AREA Surface Coating 3,470.3 21,586AREA Graphic Arts 8,233.3 54,416 AREA Open Burning: Agricultural 814.6 18,503NONROAD Nonroad: Gasoline 2-stroke 5,133.6 42,041 NONROAD Nonroad: Gasoline 2-stroke 1,166.2 9,854AREA Misc. Non-Industrial Solvent Utilization 5,729.8 35,026 AREA Misc. Non-Industrial Solvent Utilization 1,455.4 8,829NONROAD Nonroad: Gasoline 4-stroke 4,149.6 32,054 AREA Auto Gas: Storage & Transport 1,502.6 8,660AREA Degreasing 4,428.0 25,049 NONROAD Nonroad: Gasoline 4-stroke 733.7 5,921NONROAD Nonroad: Recreational Marine 2,311.1 22,692 AREA Graphic Arts 602.9 3,985POINT Industrial Point Sources (actuals) 3,055.6 17,020 AREA Degreasing 666.8 3,772NONROAD Nonroad: Diesel 882.6 9,035 NONROAD Nonroad: Diesel 223.0 2,409ON-ROAD On-Road: Diesel Vehicles 900.8 5,308 NONROAD Nonroad: Recreational Marine 168.6 1,656AREA Auto Gas: Storage & Transport 674.7 3,888 ON-ROAD On-Road: Diesel Vehicles 251.6 1,483NONROAD Nonroad: LPG 431.7 2,513 POINT Industrial Point Sources (actuals) 218.2 1,198AREA Open Burning: Agricultural 83.4 1,874 AREA Open Burning: Residential 110.9 719NONROAD Nonroad: Aircraft & Aircraft Refueling 173.8 953 NONROAD Nonroad: LPG 59.4 347AREA Open Burning: Residential 125.4 774 NONROAD Nonroad: Locomotive 29.3 161NONROAD Nonroad: Locomotive 94.1 516 AREA POTWs 22.0 121AREA Municipal (non-TV) Landfills 89.5 490 NONROAD Nonroad: Aircraft & Aircraft Refueling 20.2 111NONROAD Nonroad: Commercial Marine Vessels 67.2 368 AREA Food Preparation 10.8 58AREA POTWs 64.8 355 AREA Industrial Fuel Consumption 7.8 8AREA Food Preparation 55.3 299 AREA Residential NG/Oil Consumption 6.0 6AREA Non-Perc Drycleaning 8.6 50 AREA Commercial/Institutional Fuel Consumption 3.7 4AREA Industrial Fuel Consumption 45.4 46 AREA Non-Perc Drycleaning 0.4 3AREA Residential NG/Oil Consumption 27.5 27 NONROAD Nonroad: CNG 0.4 2AREA Commercial/Institutional Fuel Consumption 25.1 26 AREA Residential Wood Combustion 11,133.3 --NONROAD Nonroad: CNG 2.9 17 AREA Prescribed Burning 464.6 --AREA Residential Wood Combustion 51,141.0 -- AREA Structure Fires 15.5 --AREA Prescribed Burning 209.3 -- AREA Wildfires 9.1 --AREA Structure Fires 194.9 -- Totals 32,247.1 439,610AREA Wildfires 2.0 -- Totals minus BIOGENIC -- 142,891
Totals 132,930.8 958,531Totals minus BIOGENIC -- 520,621
Sector GroupDesc NOX tpy NOX lbs per day Sector GroupDesc NOX tpy NOX lbs per dayON-ROAD On-Road: Gasoline Vehicles 21,588.8 127,204 ON-ROAD On-Road: Gasoline Vehicles 7,018.7 41,355ON-ROAD On-Road: Diesel Vehicles 15,197.7 89,546 ON-ROAD On-Road: Diesel Vehicles 4,257.7 25,087NONROAD Nonroad: Diesel 7,393.6 77,376 NONROAD Nonroad: Diesel 1,959.4 21,479NONROAD Nonroad: Commercial Marine Vessels 3,444.7 18,875 AREA Open Burning: Agricultural 344.2 5,201POINT Industrial Point Sources (actuals) 2,522.0 14,913 NONROAD Nonroad: Locomotive 713.4 3,909NONROAD Nonroad: Locomotive 2,136.6 11,707 BIOGENIC Biogenic Emissions -- 3,803NONROAD Nonroad: Gasoline 4-stroke 1,494.6 11,174 POINT Industrial Point Sources (actuals) 301.6 1,701NONROAD Nonroad: LPG 1,619.4 9,441 NONROAD Nonroad: Gasoline 4-stroke 211.0 1,692NONROAD Nonroad: Aircraft & Aircraft Refueling 795.2 4,357 NONROAD Nonroad: LPG 222.5 1,302BIOGENIC Biogenic Emissions -- 3,890 AREA Open Burning: Residential 63.0 341NONROAD Nonroad: Recreational Marine 241.4 2,371 AREA Industrial Fuel Consumption 313.6 321AREA Industrial Fuel Consumption 1,895.3 1,940 AREA Residential NG/Oil Consumption 225.6 220NONROAD Nonroad: CNG 179.9 1,089 NONROAD Nonroad: Recreational Marine 17.6 173AREA Residential NG/Oil Consumption 1,030.4 1,003 NONROAD Nonroad: CNG 24.4 152AREA Commercial/Institutional Fuel Consumption 972.8 996 AREA Commercial/Institutional Fuel Consumption 141.7 145AREA Open Burning: Agricultural 106.0 854 NONROAD Nonroad: Gasoline 2-stroke 7.8 70AREA Open Burning: Residential 100.9 545 NONROAD Nonroad: Aircraft & Aircraft Refueling 2.8 16NONROAD Nonroad: Gasoline 2-stroke 38.3 322 AREA Residential Wood Combustion 336.4 --AREA Municipal (non-TV) Landfills 34.9 191 AREA Prescribed Burning 215.7 --AREA Residential Wood Combustion 1,545.2 -- AREA Wildfires 3.8 --AREA Prescribed Burning 97.2 -- AREA Structure Fires 2.0 --AREA Structure Fires 24.8 -- Totals 16,383.0 106,967AREA Wildfires 0.8 -- Totals minus BIOGENIC -- 103,163
Totals 62,460.5 377,794Totals minus BIOGENIC -- 373,904
Sector GroupDesc CO tpy CO lbs per day Sector GroupDesc CO tpy CO lbs per dayON-ROAD On-Road: Gasoline Vehicles 284,222.4 1,674,671 ON-ROAD On-Road: Gasoline Vehicles 114,928.6 677,172NONROAD Nonroad: Gasoline 4-stroke 120,950.2 938,194 NONROAD Nonroad: Gasoline 4-stroke 21,578.1 173,631NONROAD Nonroad: Recreational Marine 8,874.4 87,136 AREA Open Burning: Agricultural 6,223.8 140,948NONROAD Nonroad: Gasoline 2-stroke 9,639.3 79,662 NONROAD Nonroad: Gasoline 2-stroke 2,199.2 18,979NONROAD Nonroad: Diesel 4,016.7 41,986 NONROAD Nonroad: Diesel 1,040.6 11,390NONROAD Nonroad: LPG 6,341.5 36,886 AREA Open Burning: Residential 1,236.9 7,315ON-ROAD On-Road: Diesel Vehicles 4,212.7 24,822 ON-ROAD On-Road: Diesel Vehicles 1,187.6 6,997AREA Open Burning: Agricultural 692.9 15,341 NONROAD Nonroad: Recreational Marine 647.6 6,358POINT Industrial Point Sources (actuals) 2,214.3 12,202 NONROAD Nonroad: LPG 871.8 5,093NONROAD Nonroad: Aircraft & Aircraft Refueling 2,179.3 11,942 NONROAD Nonroad: Aircraft & Aircraft Refueling 519.5 2,846AREA Open Burning: Residential 1,708.1 9,732 NONROAD Nonroad: CNG 97.1 607NONROAD Nonroad: CNG 713.3 4,319 NONROAD Nonroad: Locomotive 71.2 390NONROAD Nonroad: CMV 274.2 1,502 POINT Industrial Point Sources (actuals) 30.0 188NONROAD Nonroad: Locomotive 215.2 1,179 AREA Industrial Fuel Consumption 111.0 114AREA Industrial Fuel Consumption 644.9 660 AREA Residential NG/Oil Consumption 86.1 84AREA Residential NG/Oil Consumption 393.2 383 AREA Commercial/Institutional Fuel Consumption 51.3 53AREA Commercial/Institutional Fuel Consumption 350.1 358 AREA Residential Wood Combustion 21,170.5 --AREA Municipal (non-TV) Landfills 30.8 169 AREA Prescribed Burning 5,476.1 --AREA Residential Wood Combustion 97,247.4 -- AREA Wildfires 107.4 --AREA Prescribed Burning 2,466.6 -- AREA Structure Fires 84.3 --AREA Structure Fires 1,063.3 -- Totals 177,718.7 1,052,164AREA Wildfires 23.4 --
Totals 548,474.2 2,941,144
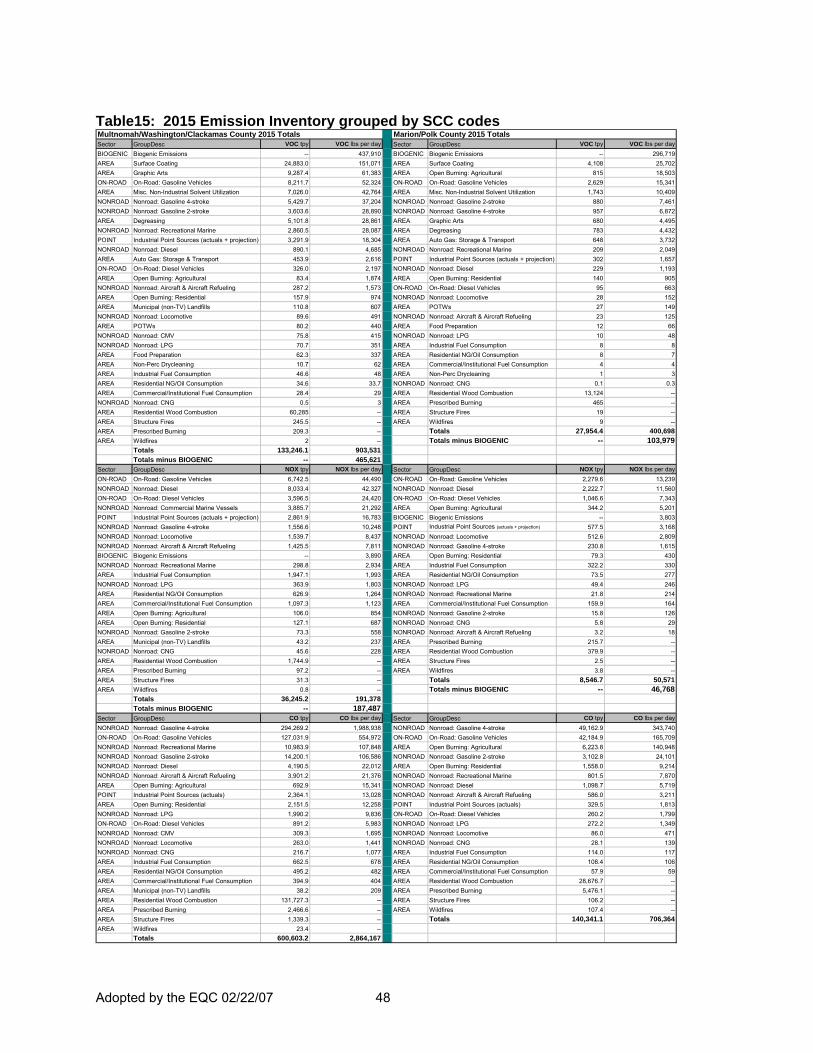
Adopted by the EQC 02/22/07 48
Table15: 2015 Emission Inventory grouped by SCC codes Multnomah/Washington/Clackamas County 2015 Totals Marion/Polk County 2015 TotalsSector GroupDesc VOC tpy VOC lbs per day Sector GroupDesc VOC tpy VOC lbs per dayBIOGENIC Biogenic Emissions -- 437,910 BIOGENIC Biogenic Emissions -- 296,719AREA Surface Coating 24,883.0 151,071 AREA Surface Coating 4,108 25,702AREA Graphic Arts 9,287.4 61,383 AREA Open Burning: Agricultural 815 18,503ON-ROAD On-Road: Gasoline Vehicles 8,211.7 52,324 ON-ROAD On-Road: Gasoline Vehicles 2,629 15,341AREA Misc. Non-Industrial Solvent Utilization 7,026.0 42,764 AREA Misc. Non-Industrial Solvent Utilization 1,743 10,409NONROAD Nonroad: Gasoline 4-stroke 5,429.7 37,204 NONROAD Nonroad: Gasoline 2-stroke 880 7,461NONROAD Nonroad: Gasoline 2-stroke 3,603.6 28,890 NONROAD Nonroad: Gasoline 4-stroke 957 6,872AREA Degreasing 5,101.8 28,861 AREA Graphic Arts 680 4,495NONROAD Nonroad: Recreational Marine 2,860.5 28,087 AREA Degreasing 783 4,432POINT Industrial Point Sources (actuals + projection) 3,291.9 18,304 AREA Auto Gas: Storage & Transport 648 3,732NONROAD Nonroad: Diesel 890.1 4,685 NONROAD Nonroad: Recreational Marine 209 2,049AREA Auto Gas: Storage & Transport 453.9 2,616 POINT Industrial Point Sources (actuals + projection) 302 1,657ON-ROAD On-Road: Diesel Vehicles 326.0 2,197 NONROAD Nonroad: Diesel 229 1,193AREA Open Burning: Agricultural 83.4 1,874 AREA Open Burning: Residential 140 905NONROAD Nonroad: Aircraft & Aircraft Refueling 287.2 1,573 ON-ROAD On-Road: Diesel Vehicles 95 663AREA Open Burning: Residential 157.9 974 NONROAD Nonroad: Locomotive 28 152AREA Municipal (non-TV) Landfills 110.8 607 AREA POTWs 27 149NONROAD Nonroad: Locomotive 89.6 491 NONROAD Nonroad: Aircraft & Aircraft Refueling 23 125AREA POTWs 80.2 440 AREA Food Preparation 12 66NONROAD Nonroad: CMV 75.8 415 NONROAD Nonroad: LPG 10 48NONROAD Nonroad: LPG 70.7 351 AREA Industrial Fuel Consumption 8 8AREA Food Preparation 62.3 337 AREA Residential NG/Oil Consumption 8 7AREA Non-Perc Drycleaning 10.7 62 AREA Commercial/Institutional Fuel Consumption 4 4AREA Industrial Fuel Consumption 46.6 48 AREA Non-Perc Drycleaning 1 3AREA Residential NG/Oil Consumption 34.6 33.7 NONROAD Nonroad: CNG 0.1 0.3AREA Commercial/Institutional Fuel Consumption 28.4 29 AREA Residential Wood Combustion 13,124 --NONROAD Nonroad: CNG 0.5 3 AREA Prescribed Burning 465 --AREA Residential Wood Combustion 60,285 -- AREA Structure Fires 19 --AREA Structure Fires 245.5 -- AREA Wildfires 9 --AREA Prescribed Burning 209.3 -- Totals 27,954.4 400,698AREA Wildfires 2 -- Totals minus BIOGENIC -- 103,979
Totals 133,246.1 903,531Totals minus BIOGENIC -- 465,621
Sector GroupDesc NOX tpy NOX lbs per day Sector GroupDesc NOX tpy NOX lbs per dayON-ROAD On-Road: Gasoline Vehicles 6,742.5 44,490 ON-ROAD On-Road: Gasoline Vehicles 2,279.6 13,239NONROAD Nonroad: Diesel 8,033.4 42,327 NONROAD Nonroad: Diesel 2,222.7 11,560ON-ROAD On-Road: Diesel Vehicles 3,596.5 24,420 ON-ROAD On-Road: Diesel Vehicles 1,046.6 7,343NONROAD Nonroad: Commercial Marine Vessels 3,885.7 21,292 AREA Open Burning: Agricultural 344.2 5,201POINT Industrial Point Sources (actuals + projection) 2,861.9 16,783 BIOGENIC Biogenic Emissions -- 3,803NONROAD Nonroad: Gasoline 4-stroke 1,556.6 10,248 POINT Industrial Point Sources (actuals + projection) 577.5 3,168NONROAD Nonroad: Locomotive 1,539.7 8,437 NONROAD Nonroad: Locomotive 512.6 2,809NONROAD Nonroad: Aircraft & Aircraft Refueling 1,425.5 7,811 NONROAD Nonroad: Gasoline 4-stroke 230.8 1,615BIOGENIC Biogenic Emissions -- 3,890 AREA Open Burning: Residential 79.3 430NONROAD Nonroad: Recreational Marine 298.8 2,934 AREA Industrial Fuel Consumption 322.2 330AREA Industrial Fuel Consumption 1,947.1 1,993 AREA Residential NG/Oil Consumption 73.5 277NONROAD Nonroad: LPG 363.9 1,803 NONROAD Nonroad: LPG 49.4 246AREA Residential NG/Oil Consumption 626.9 1,264 NONROAD Nonroad: Recreational Marine 21.8 214AREA Commercial/Institutional Fuel Consumption 1,097.3 1,123 AREA Commercial/Institutional Fuel Consumption 159.9 164AREA Open Burning: Agricultural 106.0 854 NONROAD Nonroad: Gasoline 2-stroke 15.8 126AREA Open Burning: Residential 127.1 687 NONROAD Nonroad: CNG 5.8 29NONROAD Nonroad: Gasoline 2-stroke 73.3 558 NONROAD Nonroad: Aircraft & Aircraft Refueling 3.2 18AREA Municipal (non-TV) Landfills 43.2 237 AREA Prescribed Burning 215.7 --NONROAD Nonroad: CNG 45.6 228 AREA Residential Wood Combustion 379.9 --AREA Residential Wood Combustion 1,744.9 -- AREA Structure Fires 2.5 --AREA Prescribed Burning 97.2 -- AREA Wildfires 3.8 --AREA Structure Fires 31.3 -- Totals 8,546.7 50,571AREA Wildfires 0.8 -- Totals minus BIOGENIC -- 46,768
Totals 36,245.2 191,378Totals minus BIOGENIC -- 187,487
Sector GroupDesc CO tpy CO lbs per day Sector GroupDesc CO tpy CO lbs per dayNONROAD Nonroad: Gasoline 4-stroke 294,269.2 1,988,938 NONROAD Nonroad: Gasoline 4-stroke 49,162.9 343,740ON-ROAD On-Road: Gasoline Vehicles 127,031.9 554,972 ON-ROAD On-Road: Gasoline Vehicles 42,184.9 165,709NONROAD Nonroad: Recreational Marine 10,983.9 107,848 AREA Open Burning: Agricultural 6,223.8 140,948NONROAD Nonroad: Gasoline 2-stroke 14,200.1 106,586 NONROAD Nonroad: Gasoline 2-stroke 3,102.8 24,101NONROAD Nonroad: Diesel 4,190.5 22,012 AREA Open Burning: Residential 1,558.0 9,214NONROAD Nonroad: Aircraft & Aircraft Refueling 3,901.2 21,376 NONROAD Nonroad: Recreational Marine 801.5 7,870AREA Open Burning: Agricultural 692.9 15,341 NONROAD Nonroad: Diesel 1,098.7 5,719POINT Industrial Point Sources (actuals) 2,364.1 13,028 NONROAD Nonroad: Aircraft & Aircraft Refueling 586.0 3,211AREA Open Burning: Residential 2,151.5 12,258 POINT Industrial Point Sources (actuals) 329.5 1,813NONROAD Nonroad: LPG 1,990.2 9,836 ON-ROAD On-Road: Diesel Vehicles 260.2 1,799ON-ROAD On-Road: Diesel Vehicles 891.2 5,983 NONROAD Nonroad: LPG 272.2 1,349NONROAD Nonroad: CMV 309.3 1,695 NONROAD Nonroad: Locomotive 86.0 471NONROAD Nonroad: Locomotive 263.0 1,441 NONROAD Nonroad: CNG 28.1 139NONROAD Nonroad: CNG 216.7 1,077 AREA Industrial Fuel Consumption 114.0 117AREA Industrial Fuel Consumption 662.5 678 AREA Residential NG/Oil Consumption 108.4 106AREA Residential NG/Oil Consumption 495.2 482 AREA Commercial/Institutional Fuel Consumption 57.9 59AREA Commercial/Institutional Fuel Consumption 394.9 404 AREA Residential Wood Combustion 28,676.7 --AREA Municipal (non-TV) Landfills 38.2 209 AREA Prescribed Burning 5,476.1 --AREA Residential Wood Combustion 131,727.3 -- AREA Structure Fires 106.2 --AREA Prescribed Burning 2,466.6 -- AREA Wildfires 107.4 --AREA Structure Fires 1,339.3 -- Totals 140,341.1 706,364AREA Wildfires 23.4 --
Totals 600,603.2 2,864,167
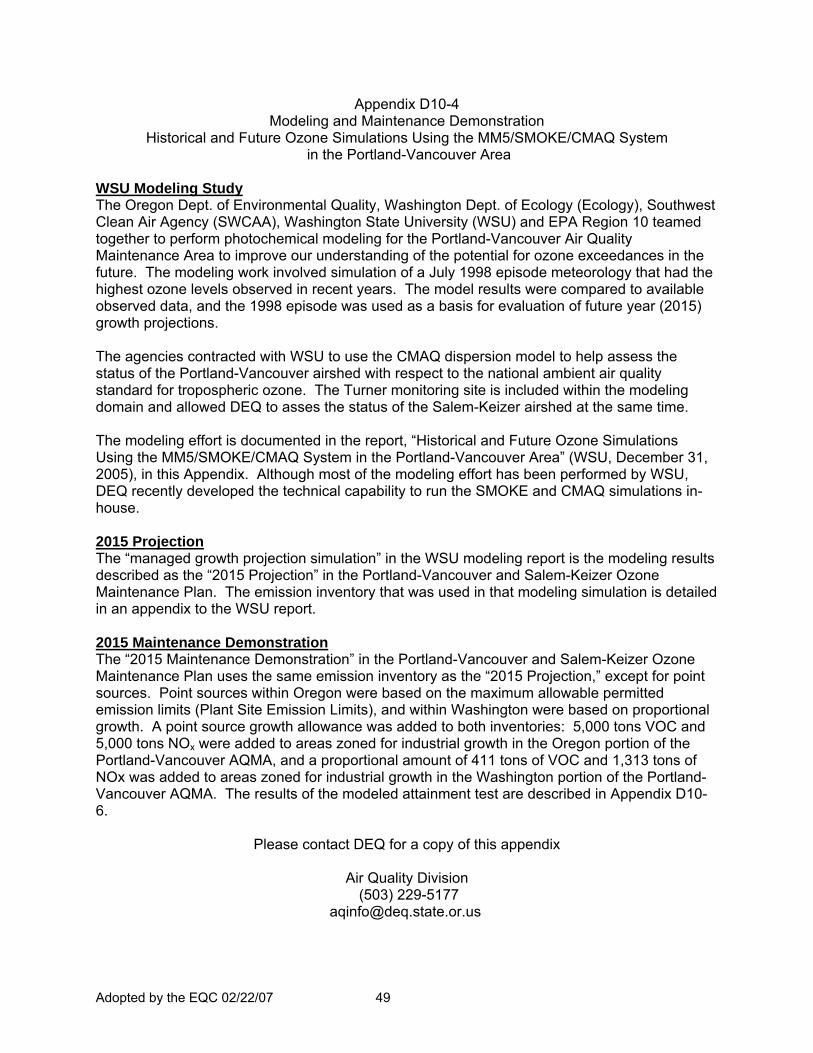
Adopted by the EQC 02/22/07 49
Appendix D10-4 Modeling and Maintenance Demonstration
Historical and Future Ozone Simulations Using the MM5/SMOKE/CMAQ System in the Portland-Vancouver Area
WSU Modeling Study The Oregon Dept. of Environmental Quality, Washington Dept. of Ecology (Ecology), Southwest Clean Air Agency (SWCAA), Washington State University (WSU) and EPA Region 10 teamed together to perform photochemical modeling for the Portland-Vancouver Air Quality Maintenance Area to improve our understanding of the potential for ozone exceedances in the future. The modeling work involved simulation of a July 1998 episode meteorology that had the highest ozone levels observed in recent years. The model results were compared to available observed data, and the 1998 episode was used as a basis for evaluation of future year (2015) growth projections. The agencies contracted with WSU to use the CMAQ dispersion model to help assess the status of the Portland-Vancouver airshed with respect to the national ambient air quality standard for tropospheric ozone. The Turner monitoring site is included within the modeling domain and allowed DEQ to asses the status of the Salem-Keizer airshed at the same time. The modeling effort is documented in the report, “Historical and Future Ozone Simulations Using the MM5/SMOKE/CMAQ System in the Portland-Vancouver Area” (WSU, December 31, 2005), in this Appendix. Although most of the modeling effort has been performed by WSU, DEQ recently developed the technical capability to run the SMOKE and CMAQ simulations in-house. 2015 Projection The “managed growth projection simulation” in the WSU modeling report is the modeling results described as the “2015 Projection” in the Portland-Vancouver and Salem-Keizer Ozone Maintenance Plan. The emission inventory that was used in that modeling simulation is detailed in an appendix to the WSU report. 2015 Maintenance Demonstration The “2015 Maintenance Demonstration” in the Portland-Vancouver and Salem-Keizer Ozone Maintenance Plan uses the same emission inventory as the “2015 Projection,” except for point sources. Point sources within Oregon were based on the maximum allowable permitted emission limits (Plant Site Emission Limits), and within Washington were based on proportional growth. A point source growth allowance was added to both inventories: 5,000 tons VOC and 5,000 tons NOx were added to areas zoned for industrial growth in the Oregon portion of the Portland-Vancouver AQMA, and a proportional amount of 411 tons of VOC and 1,313 tons of NOx was added to areas zoned for industrial growth in the Washington portion of the Portland-Vancouver AQMA. The results of the modeled attainment test are described in Appendix D10-6.
Please contact DEQ for a copy of this appendix Air Quality Division
(503) 229-5177 [email protected]
Adopted by the EQC 02/22/07 50
Appendix D10-5
Economic Report to the Metro Council 2000-2030 Regional Forecast
for the Portland-Vancouver Metropolitan Area (Data Resource Center, Metro, December 2002 final draft)
Please contact DEQ for a copy of this appendix
Air Quality Division (503) 229-5711
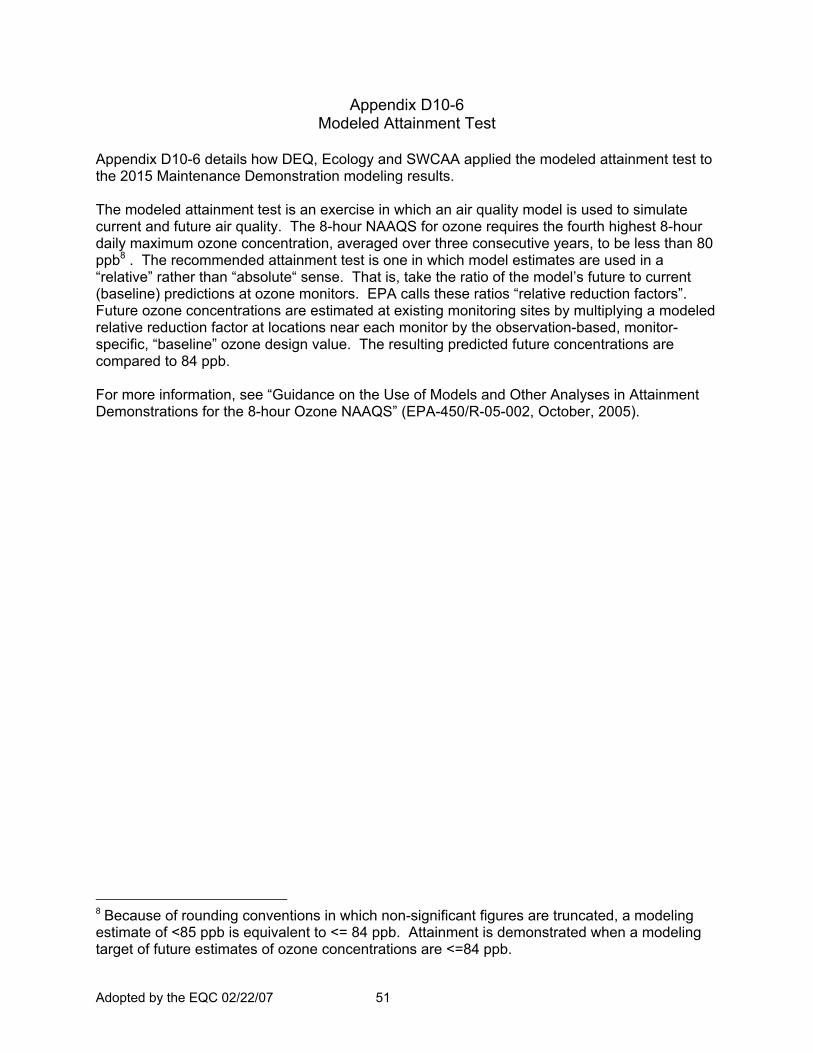
Adopted by the EQC 02/22/07 51
Appendix D10-6 Modeled Attainment Test
Appendix D10-6 details how DEQ, Ecology and SWCAA applied the modeled attainment test to the 2015 Maintenance Demonstration modeling results. The modeled attainment test is an exercise in which an air quality model is used to simulate current and future air quality. The 8-hour NAAQS for ozone requires the fourth highest 8-hour daily maximum ozone concentration, averaged over three consecutive years, to be less than 80 ppb8 . The recommended attainment test is one in which model estimates are used in a “relative” rather than “absolute“ sense. That is, take the ratio of the model’s future to current (baseline) predictions at ozone monitors. EPA calls these ratios “relative reduction factors”. Future ozone concentrations are estimated at existing monitoring sites by multiplying a modeled relative reduction factor at locations near each monitor by the observation-based, monitor-specific, “baseline” ozone design value. The resulting predicted future concentrations are compared to 84 ppb. For more information, see “Guidance on the Use of Models and Other Analyses in Attainment Demonstrations for the 8-hour Ozone NAAQS” (EPA-450/R-05-002, October, 2005).
8 Because of rounding conventions in which non-significant figures are truncated, a modeling estimate of <85 ppb is equivalent to <= 84 ppb. Attainment is demonstrated when a modeling target of future estimates of ozone concentrations are <=84 ppb.
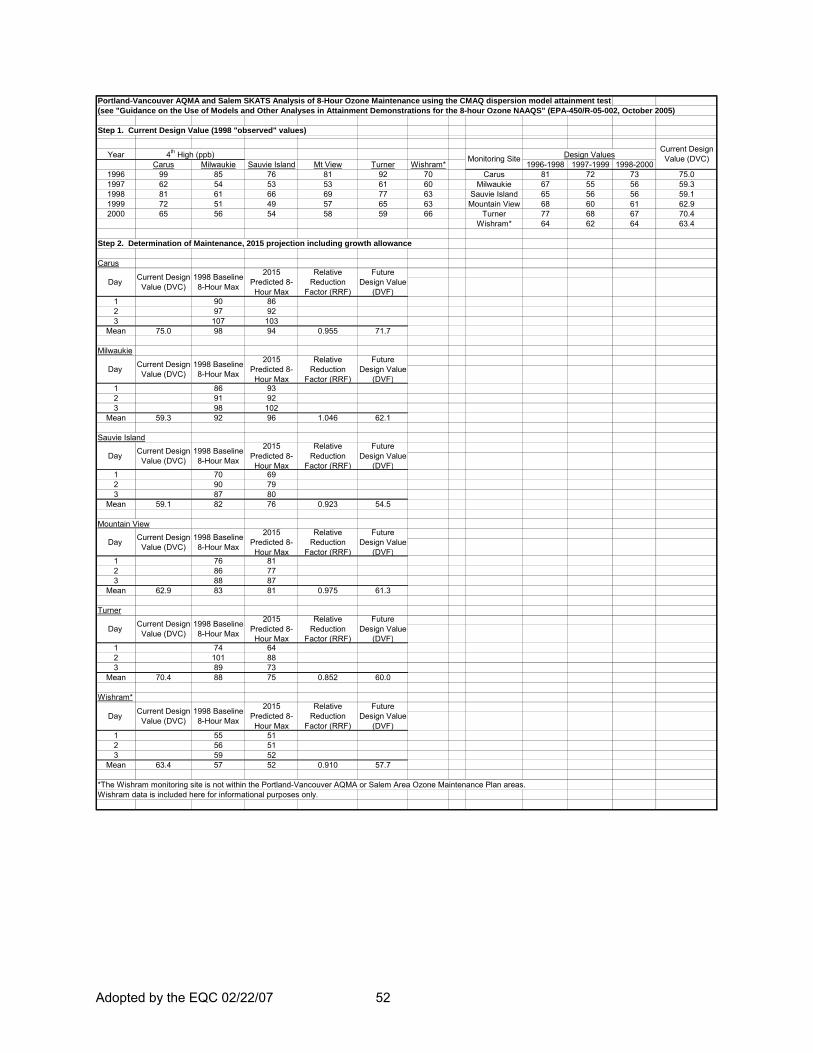
Adopted by the EQC 02/22/07 52
Portland-Vancouver AQMA and Salem SKATS Analysis of 8-Hour Ozone Maintenance using the CMAQ dispersion model attainment test(see "Guidance on the Use of Models and Other Analyses in Attainment Demonstrations for the 8-hour Ozone NAAQS" (EPA-450/R-05-002, October 2005)
Step 1. Current Design Value (1998 "observed" values)
YearCarus Milwaukie Sauvie Island Mt View Turner Wishram* 1996-1998 1997-1999 1998-2000
1996 99 85 76 81 92 70 Carus 81 72 73 75.01997 62 54 53 53 61 60 Milwaukie 67 55 56 59.31998 81 61 66 69 77 63 Sauvie Island 65 56 56 59.11999 72 51 49 57 65 63 Mountain View 68 60 61 62.92000 65 56 54 58 59 66 Turner 77 68 67 70.4
Wishram* 64 62 64 63.4
Step 2. Determination of Maintenance, 2015 projection including growth allowance
Carus
1 90 862 97 923 107 103
Mean 75.0 98 94 0.955 71.7
Milwaukie
1 86 932 91 923 98 102
Mean 59.3 92 96 1.046 62.1
Sauvie Island
1 70 692 90 793 87 80
Mean 59.1 82 76 0.923 54.5
Mountain View
1 76 812 86 773 88 87
Mean 62.9 83 81 0.975 61.3
Turner
1 74 642 101 883 89 73
Mean 70.4 88 75 0.852 60.0
Wishram*
1 55 512 56 513 59 52
Mean 63.4 57 52 0.910 57.7
*The Wishram monitoring site is not within the Portland-Vancouver AQMA or Salem Area Ozone Maintenance Plan areas. Wishram data is included here for informational purposes only.
Relative Reduction
Factor (RRF)
Future Design Value
(DVF)
Relative Reduction
Factor (RRF)
Future Design Value
(DVF)
Day Current Design Value (DVC)
Day Current Design Value (DVC)
1998 Baseline 8-Hour Max
2015 Predicted 8-Hour Max
1998 Baseline 8-Hour Max
2015 Predicted 8-Hour Max
Day Current Design Value (DVC)
1998 Baseline 8-Hour Max
2015 Predicted 8-Hour Max
Relative Reduction
Factor (RRF)
Future Design Value
(DVF)
Day Current Design Value (DVC)
1998 Baseline 8-Hour Max
2015 Predicted 8-Hour Max
Relative Reduction
Factor (RRF)
Future Design Value
(DVF)
Relative Reduction
Factor (RRF)
Future Design Value
(DVF)
Relative Reduction
Factor (RRF)
Future Design Value
(DVF)
Day Current Design Value (DVC)
Day Current Design Value (DVC)
1998 Baseline 8-Hour Max
2015 Predicted 8-Hour Max
1998 Baseline 8-Hour Max
2015 Predicted 8-Hour Max
Current Design Value (DVC)4th High (ppb) Monitoring Site Design Values

![EQC 400 4MATIC - Mercedes-Benz...EQC Technical Data EQC 400 4MATIC Engine and performance Motor Two asynchronous three-phase AC motors Rated output (kW [hp] at rpm) 300 [408] / 4100](https://img.pdfslide.us/doc/110x75/6103ce4149a8ed101d65fbc2/eqc-400-4matic-mercedes-benz-eqc-technical-data-eqc-400-4matic-engine-and.jpg)