Embed Size (px)
Citation preview

1 DC’s Awesome Canada 5
(C) Copyright 2014 All Rights Reserved
DC’s Awesome Canada 5 Portfolio123 Model
2 DC’s Awesome Canada 5
(C) Copyright 2014 All Rights Reserved
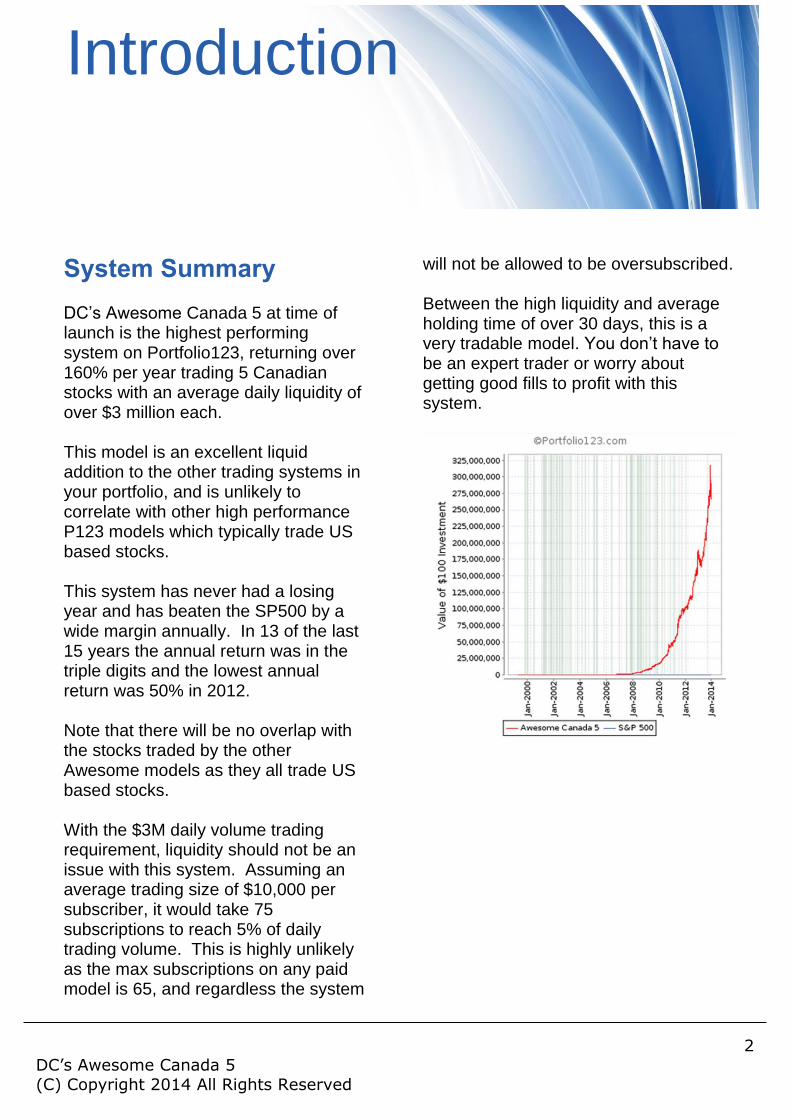
System Summary DC’s Awesome Canada 5 at time of launch is the highest performing system on Portfolio123, returning over 160% per year trading 5 Canadian stocks with an average daily liquidity of over $3 million each. This model is an excellent liquid addition to the other trading systems in your portfolio, and is unlikely to correlate with other high performance P123 models which typically trade US based stocks. This system has never had a losing year and has beaten the SP500 by a wide margin annually. In 13 of the last 15 years the annual return was in the triple digits and the lowest annual return was 50% in 2012. Note that there will be no overlap with the stocks traded by the other Awesome models as they all trade US based stocks. With the $3M daily volume trading requirement, liquidity should not be an issue with this system. Assuming an average trading size of $10,000 per subscriber, it would take 75 subscriptions to reach 5% of daily trading volume. This is highly unlikely as the max subscriptions on any paid model is 65, and regardless the system
will not be allowed to be oversubscribed. Between the high liquidity and average holding time of over 30 days, this is a very tradable model. You don’t have to be an expert trader or worry about getting good fills to profit with this system.
Introduction

3 DC’s Awesome Canada 5
(C) Copyright 2014 All Rights Reserved
System Alternatives By using different hedging vehicles other than the default of ProShares Short S&P 500 (SH), you can have higher or lower risk variations of the system to suit your preference, as shown below. For more details, see the Hedging Vehicle Test.
Hedge Annual Return
(Default) ProShares Short S&P500 (SH) 163.64%
(Lower risk) Cash 114.83%
(Lower risk) Short term bonds (SHY) 114.46%
(Lower risk) Mid term bonds (IEF) 120.34%
(Lower risk) Long term bonds (TLT) 125.99%
(Higher risk) ProShares Short Russell 2000 (RWM) 170.88%
(Higher risk) ProShares UltraShort S&P500 (SDS) 213.65%
Methodology Primary stock ranking methodology is provided by a classic trading system based on technical factors (trending and relative price changes), money flow, and earnings estimate revisions and surprises. This is a proven classic system. As a secondary methodology, other stocks meeting liquidity and price requirements may be included if they meet certain technical analysis patterns indicating a price gain may occur, and certain stocks normally picked by the primary methodology may be excluded if technical patterns indicate a potential price decline. Selling occurs when the ranking of the primary methodology drops below an acceptable level or when a technical price pattern indicates a possible drop in the stock price. Hedge entry occurs based on a moving average crossover of the S&P 500 estimates trend and a corresponding S&P 500 price drop, or based on technical patterns which indicate a market downturn may be imminent.
Conversely, a hedge exit will occur based on a moving average crossover of the S&P 500 estimates trend and a corresponding rise in the S&P 500, but may also be triggered by a technical pattern indicating a potential rise in the market.
Performance Details
The following section will show details from the model’s test from 1/2/99 to 4/12/14, with screenshots taken directly from Portfol123. Shown are the system summary, performance stats, trading stats, and trading risk screens.
Robustness Tests
Robustness tests were also run based on varying the weekly start date, starting and stopping the test yearly and every two years, changing the minimum price and liquidity requirements, and by varying the number of positions. The hedging model was also tested with different hedging vehicles and by the percent hedged. A summary of the robustness tests are below, with the detailed results on the follow pages: Weekly test: changing the start date weekly for the first 20 weeks results in an annual return of 156.04% - 163.55%, or an average of 159.95%. Yearly test: starting and stopping the model each year results in an annual return from 34.11% to 429.03%. 13 of the 15 years produced triple digit returns, and the average of all years is 152.86%.
4 DC’s Awesome Canada 5
(C) Copyright 2014 All Rights Reserved
Robustness Tests (continued)
Two year test: Starting and stopping the model every two years results in an annual return from 38.61% to 289.18%, with an average annual return of 159.80%. Minimum price test: The model has a $2 per share minimum price. Varying the minimum price from $1-$20 results in an 97.73% to 163.55%, with the lower price minimums doing better than the higher as expected. Minimum volume test: This system has a requirement of $3M daily volume. Varying the minimum daily volume from $1 to $60M results in an annual return of 39.49% to 137.85%, with the lower volume requirements doing better than the higher as expected Number of positions test: The model holds 5 stock positions. Varying the number of positions from 100 to 5 results in an annual return of 37.57% to 163.55%, with the lower number of positions performing better than the higher as expected. Hedging ratio test: Varying the hedging ratio from 100% to 10% results in an annual return of 165.33% to 47.78%, while completely un-hedged returns 43.14% annually.
Hedging vehicle test: The default hedge for the system is the ProShares Short S&P 500 (SH). Using lower risk hedges such as cash or bonds returns 114.46%-125.99%, while higher risk alternatives using leveraged ETFs return 170.88% to 213.65%.
5 DC’s Awesome Canada 5
(C) Copyright 2014 All Rights Reserved
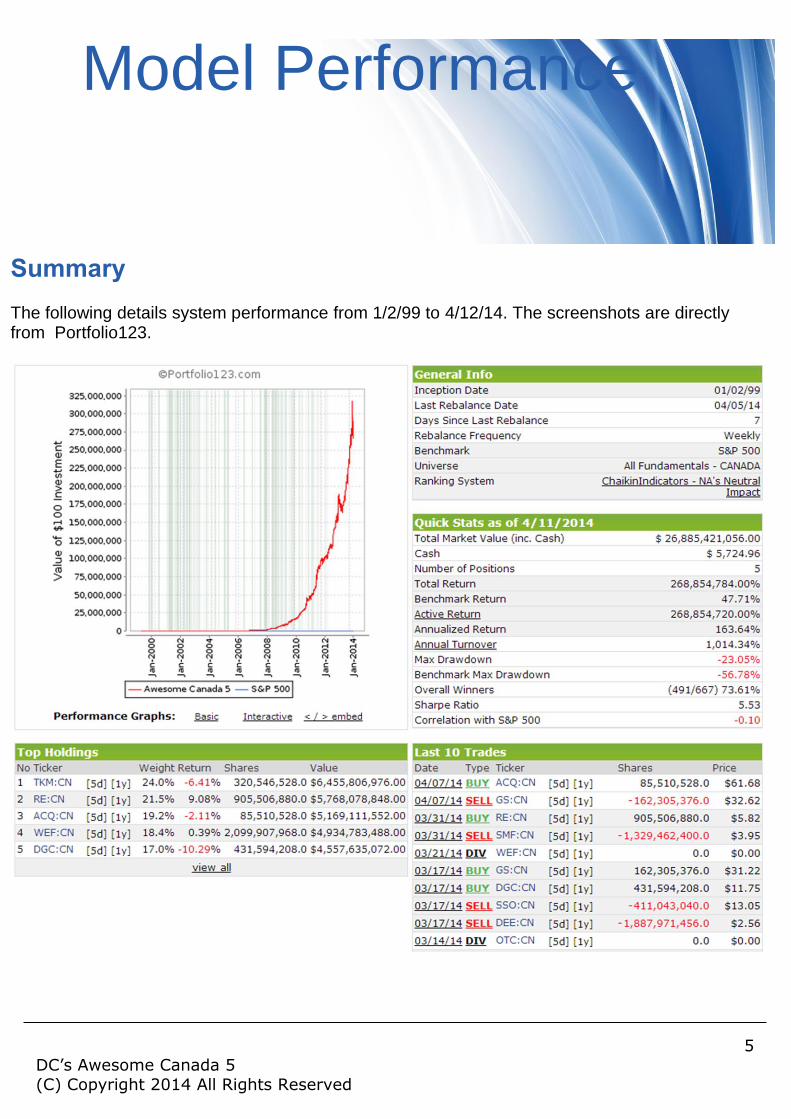
Summary The following details system performance from 1/2/99 to 4/12/14. The screenshots are directly from Portfolio123.
The liquidity of the bottom 20% of trades is over $139 million, currently outperforming all
Model Performance

6 DC’s Awesome Canada 5
(C) Copyright 2014 All Rights Reserved
Performance Stats
Trading Stats

7 DC’s Awesome Canada 5
(C) Copyright 2014 All Rights Reserved
Trading Risk
8 DC’s Awesome Canada 5
(C) Copyright 2014 All Rights Reserved
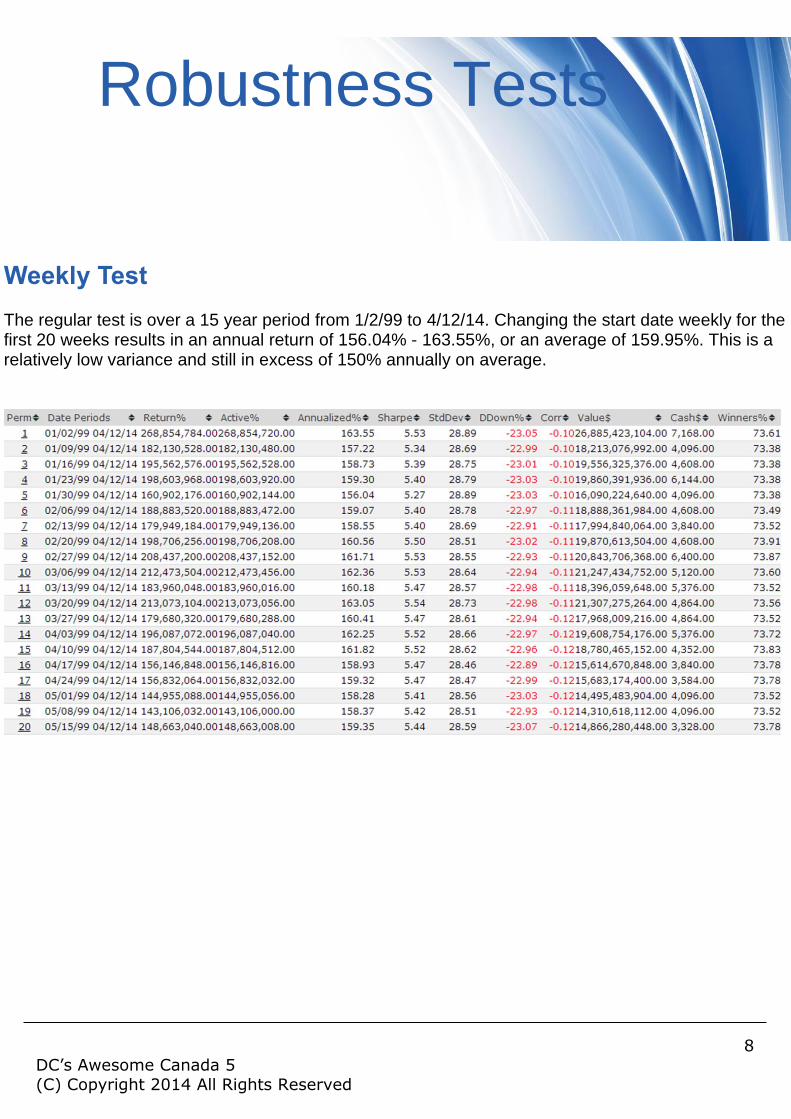
Weekly Test The regular test is over a 15 year period from 1/2/99 to 4/12/14. Changing the start date weekly for the first 20 weeks results in an annual return of 156.04% - 163.55%, or an average of 159.95%. This is a relatively low variance and still in excess of 150% annually on average.
Robustness Tests

9 DC’s Awesome Canada 5
(C) Copyright 2014 All Rights Reserved
Yearly Test Rather than running a continual 15 year test, if the model is started and stopped each year from 1999 through 2013, the annual return varies from 34.11% to a whopping 429.03%. 13 of the 15 years produced triple digit returns, and the average of all years is 152.86%.

10 DC’s Awesome Canada 5
(C) Copyright 2014 All Rights Reserved
2 Year Test Rather than running a continual 15 year test, if the model is started and stopped every two years this results in an annual return from 38.61% to 289.18%, with an average annual return of 159.80%.
Minimum Price Test The model requires a minimum stock price of $2. Varying the minimum price from $1-$20 results in an annual return from 97.73% to 163.55%. As would be expected, the lower price thresholds did better while the higher ones did worse, but as desired the performance varied relatively smoothly as the parameters were changed.

11 DC’s Awesome Canada 5
(C) Copyright 2014 All Rights Reserved
Minimum Daily Volume Test The model requires a minimum average daily volume of $3M over the last 10 days. Varying the minimum daily volume from $1 to $60M results in an annual return of 39.49% to 137.85%, with the lower volume requirements doing better than the higher as expected. Again, the performance change was relatively smooth as the minimum volume was changed.
Number of Positions Test The number of positions in the model is 10. Varying the number of positions from 100 to 5 results in an annual return of 37.57% to 163.55%, with the lower number of positions performing better as expected. As with the other tests, the performance change was relatively smooth as the number of positions was adjusted.

12 DC’s Awesome Canada 5
(C) Copyright 2014 All Rights Reserved
Hedging Ratio Test When entering a hedge, the model is hedged at 100%. Reducing the hedging percent causes performance to drop smoothly. Varying the hedging ratio from 100% to 10% results in an annual return of 165.33% to 47.78%, while completely un-hedged returns 43.14% annually.
Hedging Vehicle Test The default hedge for the system is the ProShares Short S&P 500 (SH). Alternate hedging vehicles can significantly reduce risk or increase performance, depending on your preference. Using lower risk hedges such as cash or bonds returns 114.46%-125.99%, while higher risk alternatives using leveraged ETFs return 170.88% to 213.65%.
Risk Category Hedge Annual Return
Drawdown
(System default) ProShares Short S&P500 (SH) 163.64% -23.05%
Lower risk Cash 114.83% -22.92%
Lower risk Short term bonds (SHY) 114.46% -22.95%
Lower risk Mid term bonds (IEF) 120.34% -22.61%
Lower risk Long term bonds (TLT) 125.99% -22.33%
Higher risk ProShares Short Russell 2000 (RWM) 170.88% -24.10%
Higher risk ProShares UltraShort S&P500 (SDS) 213.65% -31.03%
13 DC’s Awesome Canada 5
(C) Copyright 2014 All Rights Reserved
Final
Conclusion DC’s Awesome Canada 5 at time of launch is the highest performing system on Portfolio123, with a high average annual return of over 160% based on a 15 year test, and has excellent liquidity. The model also performs well on robustness tests based on a variety of factors, and alternate hedging approaches can significantly increase return or reduce risk as desired.
Warning
Warning - don’t put all of your money in this or any other individual trading system, but only as part of a well-diversified portfolio, including cash and other asset classes. Regardless of testing, this is only a five stock system and may experience periods of high drawdowns and volatility. Note: Simulation results must be interpreted in light of differences between simulated performance and actual trading, differences between subscriber performance and live out-of-sample model performance, and the fact that past performance is no guarantee of future results. (See Subscriber Terms.)