Embed Size (px)
Citation preview

Portfolio Presentation For
YourWealthCurvePodCast
Presented by:
John L. Smallwood, CFP
Symmetry Partners, LLC, is an investment adviser registered with the Securities and Exchange Commission. Please see disclosure page titled "Symmetry and ETF Disclosure" at theend of the presentation for additional information.

Assets in balance.Assets in balance.
Table of Contents
• Introduction – Welcome – Your Investment Team
• Our Investment Strategy – Disciplined Approach – SPIVA Persistency – Cost of Volatility – Diversification – Portfolio Engineering
• Our Recommendation – Your Portfolio and Goals for It – Asset Class Breakdown
• Appendix – Portfolio Matrixes – Portfolio Returns and Characteristics – Portfolio Performance in Good and Bad Markets – Ending Thoughts – Disclosures

Assets in balance.Assets in balance.
Welcome
Thank you for your interest in Symmetry Portfolio. The goal of this proposal is to introduce you to our company, our client service process and our unique investment strategy. Review this proposal with your advisor and you will see how we believe Symmetry can improve your portfolio and how you can begin to take steps toward a secure financial future.
Symmetry Partners builds portfolios based on more than 60 years of financial science firmly rooted in the belief that markets are largely “efficient” and that investment returns are determined principally by asset allocation, not market timing or stock selection. We believe that the most trustworthy and objective securities and market research to be found today exists in academia. As your investment manager, Symmetry offers the accountability and continuity that is so important for any long-term relationship. Symmetry takes pride in all client relationships and always puts your best interests first. We thank you for the opportunity to introduce you to our program, and we look forward to helping you enjoy a successful investment experience.
Sincerely, Symmetry Partners

Your Investment Team
DFA ($315.4 Billion)*&
Academic Research
Goal:Identify what determines stock performanceand capture reliable asset class behavior
Value-Add:
3-Factor ModelCost ControlAsset Class FundsTrading Control
Symmetry Partners($7 Billion)**
Goal:Asset allocation to optimize risk exposuresand return potential
Value-Add:
Institutional Portfolio ManagementBalanced StategiesGenerate ReportingManage Trading
John L. Smallwood, CFP&
YourWealthCurvePodCast
Goal:Improve client investment experience
Value-Add:
Evaluate Client's Unique Risk ToleranceKeep Client On Track To Achieve Personal GoalsCreate Custom Financial PlanClient Meetings and Periodic Reviews
*As of September 30, 2013**Symmetry manages more than $7 billion in combined assets under management and sub-advised assets as of 09/30/13.
CA 04/30/13 S0011

Assets in balance.Assets in balance.
Dimensional Fund Advisors
§ $315.4 Billion AUM (as of 09/30/13)
§ Established in 1981
§ Offices in Austin, Santa Monica, London, Sydney, Vancouver, and Amsterdam
§ Approximately 65 Mutual Funds invested in approximately 50 Countries
§ Funds open to institutional investment only— individuals must invest through a select group of advisors
Fast Facts
§ Eugene Fama - Efficient Markets Hypothesis - Three-Factor Model - University of Chicago
§ Kenneth French - Three-Factor Model - Advisory Editor, Journal of Finance - Dartmouth College
§ Roger G. Ibbotson - Author of Stocks, Bonds, Bills and Inflation - Yale University
§ Myron S. Scholes - Nobel Prize Winner - Stanford University
• Abbie J. Smith - Co-Editor, Journal of Accounting Research - University of Chicago
Select Board of Directors

Assets in balance.Assets in balance.
Symmetry Partners
§ Investment advisory firm registered with the SEC
§ Established in 1994 § Home Office: 628 Hebron Ave., Building Two, 5th Floor, Glastonbury, CT 06033
§ Asset management services available to individuals, institutions and retirement plans
§ More than $7 billion in combined assets under management and sub-advised assets as of 09/30/13.
Firm Profile
We offer:
§ A client-centric process supported by your financial advisor
§ An investment methodology built on more than 60 years of academic research
§ Low cost, tax efficient investment portfolios § A variety of technology and support services designed to better the investment experience of our advisors and clients
Why Symmetry?
Our Offerings
§ Symmetry’s Structured Portfolios: Broadly diversified portfolios constructed from institutional mutual funds from Dimensional Fund Advisors (DFA). Symmetry’s Structured Portfolios offer exposure to:
- 15 different asset classes - Approximately 12,000 securities - Approximately 50 countries around the
globe
§ The GlobalCore® ETF Portfolios: Globally weighted portfolios of exchange traded funds from providers including Vanguard, iShares and State Street Global Advisors. Through the GlobalCore ETF Portfolios, investors gain access to:
- More than 15 different asset classes
- Approximately 5,000 securities
- Approximately 50 countries around the globe
§ Symmetry Bond Portfolios: Symmetry Bond Portfolios offer strategically
allocated, broadly diversified fixed income solution that seeks to enhance returns through prudent exposure to maturity and credit risks

About Your AdvisorJohn L. Smallwood, CFP®
John P. SmallwoodEd d E B
Smallwood Capital Management is a comprehensive financial services firm that is committed to building clients’ futures on the foundations of solid
Edward E. Bao
Smallwood Capital Management
that is committed to building clients’ futures on the foundations of solid financial planning processes. Utilizing an academic approach towards investment planning, paired with a deep knowledge of the unique needs of their clients, enables the advisors of Smallwood Capital Management to fully provide clients with the optimal service that they deserve. Smallwood Capital Management
1161 Broad Street, Suite 312
Smallwood Capital Management is passionate about continually providing confidence and clarity to clients in this ever‐changing navigation of wealthmanagement so they may fully enjoy their wealth and pursue their dreams.
• Wealth management and financial planning
,Shrewsbury, NJ 07702
Telephone: 800-797-1000Fax: 732-389-0488
www.smallwoodcapital.com
@ Wealth management and financial planning• Retirement planning• Employer-sponsored retirement and benefit plans• Business owner protection (e.g. Key Man, Buy-Sell)
[email protected]@smallwoodcapital.com
Securities offered through Securities America, Inc., Member FINRA/SIPC and advisory services offered through Securities America Advisors, Inc. Smallwood Capital Management, Symmetry, and the Securities America companies are separate entities.
Assets in balance.Assets in balance.
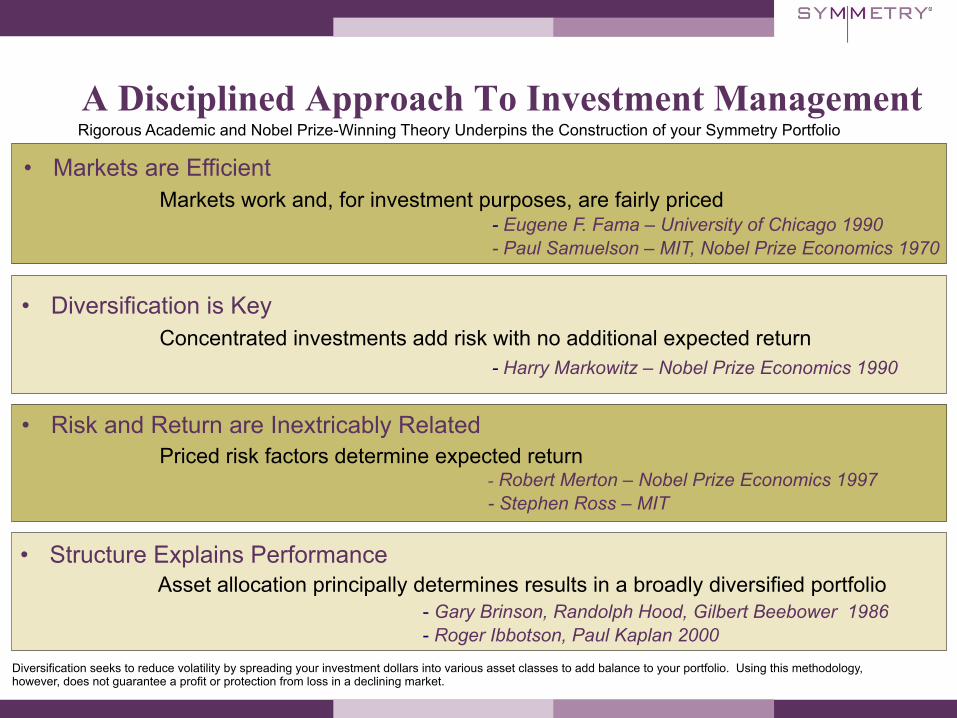
A Disciplined Approach To Investment Management Rigorous Academic and Nobel Prize-Winning Theory Underpins the Construction of your Symmetry Portfolio
• Structure Explains Performance
• Diversification is Key
Markets work and, for investment purposes, are fairly priced
Asset allocation principally determines results in a broadly diversified portfolio
Priced risk factors determine expected return
Concentrated investments add risk with no additional expected return
- Robert Merton – Nobel Prize Economics 1997 - Stephen Ross – MIT
- Eugene F. Fama – University of Chicago 1990 - Paul Samuelson – MIT, Nobel Prize Economics 1970
- Gary Brinson, Randolph Hood, Gilbert Beebower 1986 - Roger Ibbotson, Paul Kaplan 2000
• Markets are Efficient
• Risk and Return are Inextricably Related
Diversification seeks to reduce volatility by spreading your investment dollars into various asset classes to add balance to your portfolio. Using this methodology, however, does not guarantee a profit or protection from loss in a declining market.
- Harry Markowitz – Nobel Prize Economics 1990

Assets in balance.Assets in balance.
Past performance is no guarantee of future results. Data courtesy of Standard & Poor’s Index Versus Active (SPIVA) report as of 5-year period ending 12/31/12. Please see the disclosure labeled SPIVA Disclosure to fully understand the implications of the performance information.
Can Active Managers Outperform Their Relative Benchmarks?

Assets in balance.Assets in balance.
Do Winners Keep Winning?
The sample includes funds at the beginning of the three-, five-, and seven-year periods, ending in December 2009. The graph shows the proportion of funds that outperform and underperform their respective benchmarks. Winner funds are reevaluated in the subsequent period from 2010 to 2012, with the graph showing the proportion of outperformance and underperformance among past winners. See Data Appendix for more information. Data provided by the CRSP Mutual Fund Database. Source: CRSP data provided by the Center for Research in Security Prices, University of Chicago. Past performance is no guarantee of future results.
Past performance vs. subsequent performance—equity funds
For Advisor Use Only.
Do Winners Keep Winning?Past performance vs. subsequent performance—equity funds
Winners Losers !"#"-!"#!
!""$-!""%
!""&-!""%
!""'-!""%
!".#%of the $,$%&winning fundscontinue to win.
!".$%of the &$%winning fundscontinue to win.
!'."%of the (&)winning fundscontinue to win.
The sample includes funds at the beginning of the three-, five-, and seven-year periods, ending in December !""%. The graph shows the proportion of funds that outperform and underperform their respective benchmarks. Winner funds are reevaluated in the subsequent period from !"#" to !"#!, with the graph showing the proportion of outperformance and underperformance among past winners. See Data Appendix for more information. Data provided by the CRSP Mutual Fund Database. Source: CRSP data provided by the Center for Research in Security Prices, University of Chicago.
Past performance is no guarantee of future results.

Assets in balance.Assets in balance.
Do Winners Keep Winning? Past performance vs. subsequent performance—fixed income funds
For Advisor Use Only.
Do Winners Keep Winning?Past performance vs. subsequent performance—fixed income funds
Winners Losers !"#"-!"#!
The sample includes funds at the beginning of the three-, five-, and seven-year periods, ending in December !""$. The graph shows the proportion of funds that outperform and underperform their respective benchmarks. Winner funds are reevaluated in the subsequent period from !"#" to !"#!, with the graph showing the proportion of outperformance and underperformance among past winners. See Data Appendix for more information. Data provided by the CRSP Mutual Fund Database. Source: CRSP data provided by the Center for Research in Security Prices, University of Chicago.
Past performance is no guarantee of future results.
!""%-!""$
!""&-!""$
!""'-!""$
!".#%of the $$%winning fundscontinue to win.
!&.'%of the $(&winning fundscontinue to win.
&#.$%of the )!winning fundscontinue to win.
The sample includes funds at the beginning of the three-, five-, and seven-year periods, ending in December 2009. The graph shows the proportion of funds that outperform and underperform their respective benchmarks. Winner funds are reevaluated in the subsequent period from 2010 to 2012, with the graph showing the proportion of outperformance and underperformance among past winners. See Data Appendix for more information. Data provided by the CRSP Mutual Fund Database. Source: CRSP data provided by the Center for Research in Security Prices, University of Chicago. Past performance is no guarantee of future results.
Assets in balance.Assets in balance.
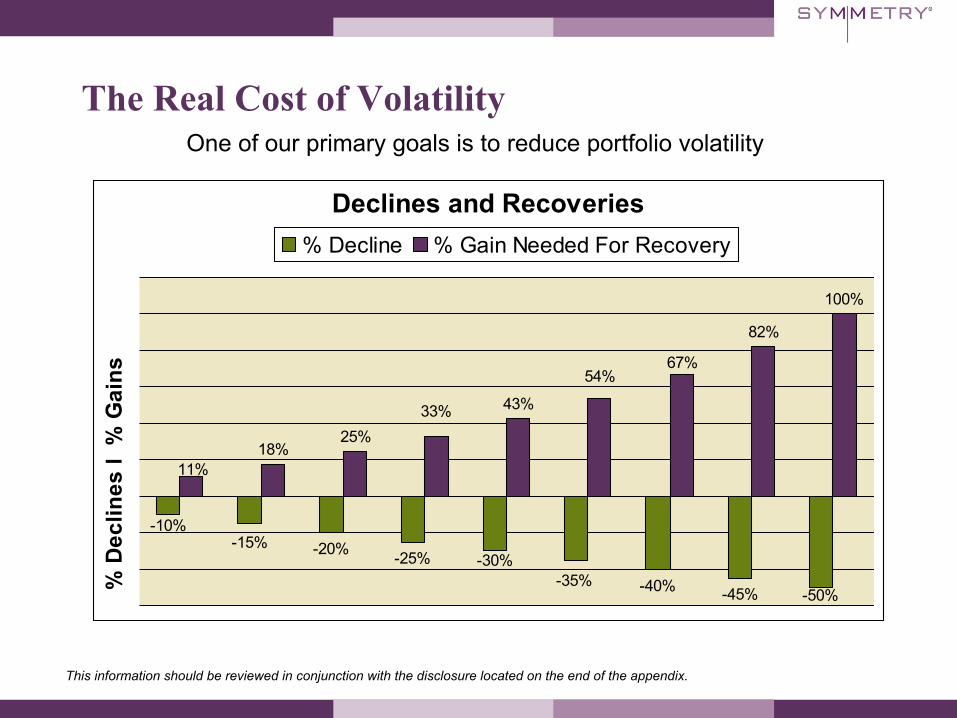
The Real Cost of Volatility One of our primary goals is to reduce portfolio volatility
This information should be reviewed in conjunction with the disclosure located on the end of the appendix.
Declines and Recoveries
-20% -25%
-40% -45%
18%25%
43%
82%
100%
-15%
-35%-30%
-50%
-10%
11%
33%
54%67%
% D
eclin
es l
% G
ains
% Decline % Gain Needed For Recovery

Assets in balance.Assets in balance.
Broad Diversification is Essential

Assets in balance.Assets in balance.
Portfolio Engineering Symmetry portfolios are engineered using the three-factor model of Eugene Fama (University of Chicago) and Kenneth French (Dartmouth College). The model identifies three independent dimensions of equity returns and allows us to measure their role in returns. Research shows that, over time, investors are rewarded for investing in stocks rather than bonds, small cap rather than large cap, and value, or distressed companies, rather than growth.
Step 1: We create your asset allocation with a core ‘Market Portfolio’
Step 2: We overweight Small Stocks Domestic and International
Step 3: We overweight Value Stocks Domestic and International
Result: A portfolio that is more diversified and has improved risk management
Microcap Int’l Small Cap Market Emerging Markets Emerging Markets Small Cap
US Large Cap Value US Small Cap Value Int’l Large Cap Value Int’l Small Cap Value Emerging Markets Value

Assets in balance.Assets in balance.
15.60%
7.80%
11.40%
4.20%4.20%
3.60%5.40%3.00%4.80%
18%
8%
12% 2%
US Core 2
US Large Value
US Vector
Intl. Core
Intl. Vector
Intl. Value
Emerging Core
Emerging Value
Global REITs
One-‐Year Fixed
Two-‐Year Global
Five-‐Year Global
Cash
Your Portfolio – Symmetry Qualified (Non Tax-Managed) Structured 60/40
Your Symmetry Portfolio has been engineered using the three-factor model of Eugene Fama (University of Chicago) and Kenneth French (Dartmouth). The model identifies three independent dimensions of equity returns and allows us to measure their role in returns.
The Symmetry 60% Equity Portfolio is fully diversified across global markets. It presently invests in the following DFA mutual funds, which target specific asset classes, and thus aim to capture the risk and reward characteristics of those classes.
US Equity FundsUS Core 2 DFQTX 15.60%US Large Value DFLVX 7.80%US Vector DFVEX 11.40%
Non-‐US Equity FundsIntl. Core DFIEX 4.20%Intl. Vector DFVQX 4.20%Intl. Value DFIVX 3.60%Emerging Core DFCEX 5.40%Emerging Value DFEVX 3.00%Global REITs DFGEX 4.80%
Fixed IncomeOne-‐Year Fixed DFIHX 18%Two-‐Year Global DFGFX 8%Five-‐Year Global DFGBX 12%Cash 2%
Factor 2: The Size Effect – investors are compensated for the extra risk they assume investing in small cap stocks over large cap stocks.
Factor 3: The BtM Effect – investors are compensated for the extra risk they assume investing in high BtM (or “value”) stocks over low BtM (or “growth”) stocks.
Factor 1: The Market Effect – investors are compensated for the extra risk they assume investing in stocks over fixed income.
Investors will not receive the exact allocations presented in this material due to a variety of implementation factors, including but not limited to: the custodian or trading platform’s own trading algorithm, any changes in price that take place from the time the positions are calculated to the time they are actually traded. In some cases for certain custodians, positions with small allocations may be eliminated altogether.
The holdings comprising the strategies and the allocations to those holdings have changed over time and may change in the future.
Symmetry tax-managed portfolios are designed with the goal of increasing the portfolio’s overall tax efficiency. Changes to portfolio holdings which comprise the portfolio may have tax consequences. If you sell assets in a taxable account, you may have to pay tax on any gain. While Symmetry seeks to mitigate tax exposure when possible, it is likely that investors will incur a taxable event while being invested in the portfolio. Fund allocation for the non-qualified (tax-managed) version of the Symmetry Portfolio is available on page 2. This information should be reviewed in conjunction with the disclosure located at the end of the presentation.
Assets in balance.Assets in balance.
15.60%
7.80%
11.40%
3.30%
6.00%4.80%4.20%3.90%
3.00%
18%
8%
12% 2%TA US Core 2
TM Mktwd. Value
US Vector
US REITs
TA World ex US Core
Intl. Vector
TM Intl. Value
Emerging Core
Emerging Value
Short-‐Term Muni
Two-‐Year Global
Five-‐Year Global
Cash
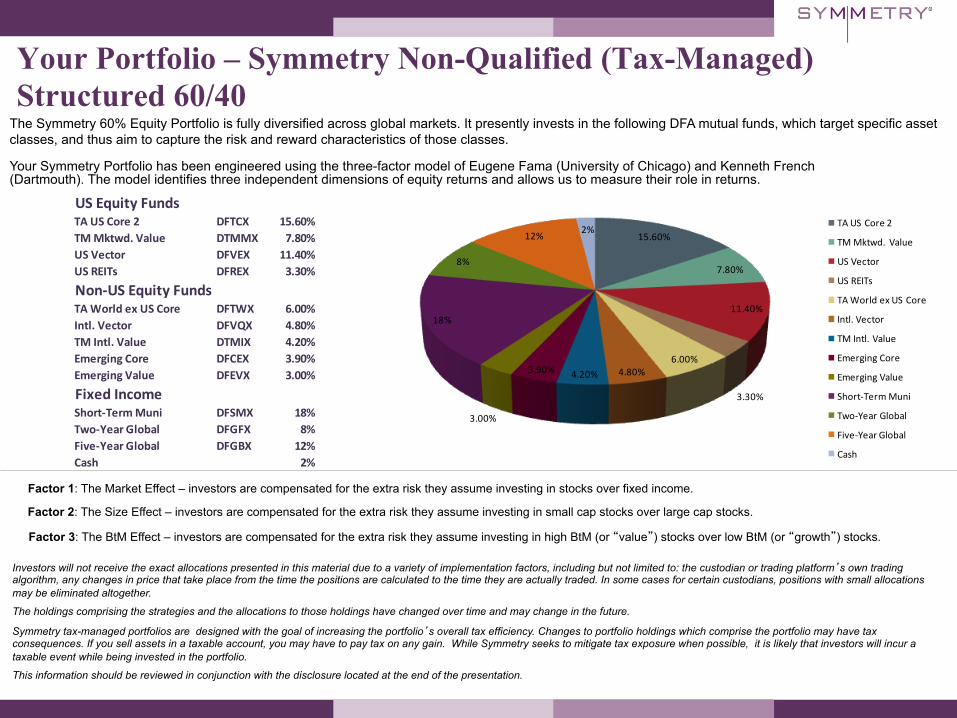
Your Portfolio – Symmetry Non-Qualified (Tax-Managed) Structured 60/40
The Symmetry 60% Equity Portfolio is fully diversified across global markets. It presently invests in the following DFA mutual funds, which target specific asset classes, and thus aim to capture the risk and reward characteristics of those classes.
Your Symmetry Portfolio has been engineered using the three-factor model of Eugene Fama (University of Chicago) and Kenneth French (Dartmouth). The model identifies three independent dimensions of equity returns and allows us to measure their role in returns.
US Equity FundsTA US Core 2 DFTCX 15.60%TM Mktwd. Value DTMMX 7.80%US Vector DFVEX 11.40%US REITs DFREX 3.30%
Non-‐US Equity FundsTA World ex US Core DFTWX 6.00%Intl. Vector DFVQX 4.80%TM Intl. Value DTMIX 4.20%Emerging Core DFCEX 3.90%Emerging Value DFEVX 3.00%
Fixed IncomeShort-‐Term Muni DFSMX 18%Two-‐Year Global DFGFX 8%Five-‐Year Global DFGBX 12%Cash 2%
Factor 2: The Size Effect – investors are compensated for the extra risk they assume investing in small cap stocks over large cap stocks.
Factor 3: The BtM Effect – investors are compensated for the extra risk they assume investing in high BtM (or “value”) stocks over low BtM (or “growth”) stocks.
Factor 1: The Market Effect – investors are compensated for the extra risk they assume investing in stocks over fixed income.
Investors will not receive the exact allocations presented in this material due to a variety of implementation factors, including but not limited to: the custodian or trading platform’s own trading algorithm, any changes in price that take place from the time the positions are calculated to the time they are actually traded. In some cases for certain custodians, positions with small allocations may be eliminated altogether.
The holdings comprising the strategies and the allocations to those holdings have changed over time and may change in the future.
Symmetry tax-managed portfolios are designed with the goal of increasing the portfolio’s overall tax efficiency. Changes to portfolio holdings which comprise the portfolio may have tax consequences. If you sell assets in a taxable account, you may have to pay tax on any gain. While Symmetry seeks to mitigate tax exposure when possible, it is likely that investors will incur a taxable event while being invested in the portfolio.
This information should be reviewed in conjunction with the disclosure located at the end of the presentation.

Assets in balance.Assets in balance.
Our Goals For Your Portfolio
• Lower Volatility
• Global Diversification
• Lower Tax Exposure
• No Hidden Surprises
Assets in balance.Assets in balance.
Appendix
• Portfolio Matrices
• Portfolio Returns and Characteristics
• Portfolio Performance in Good and Bad Markets
• Ending Thoughts
• Disclosures

Assets in balance.Assets in balance.
Symmetry Structured 60/40 Model Portfolio Returns Data Matrix
Past performance does not guarantee future results. The performance results above include the net effect of 0.50% investment management fee and mutual fund expenses. The performance information presented in this chart from January 1, 1999 to December 31, 2001 represents back tested performance based on live mutual fund data. Actual client performance may be better or worse depending upon when the client invested with Symmetry, rebalancing, cash flows and other factors unique to each client. Please see disclosure labeled Model Portfolio Returns Disclosure for additional limitations to the performance information.
Balanced Strategy
60% Equity - 40% Fixed 1999
1999 13.41 20002000 7.59 2.08 20012001 5.99 2.47 2.86 20022002 3.58 0.50 -0.28 -3.33 20032003 7.99 6.67 8.25 11.05 27.56 20042004 8.89 8.01 9.55 11.88 20.35 13.55 20052005 8.67 7.91 9.11 10.73 15.86 10.42 7.37 20062006 9.42 8.86 10.03 11.53 15.59 11.85 11.01 14.78 20072007 8.73 8.16 9.06 10.13 13.04 9.67 8.41 8.93 3.39 20082008 4.93 4.03 4.28 4.48 5.84 1.97 -0.74 -3.30 -11.24 -23.80 20092009 6.78 6.14 6.60 7.07 8.65 5.78 4.29 3.54 0.04 -1.59 27.09 20102010 7.34 6.81 7.29 7.80 9.27 6.89 5.81 5.50 3.31 3.28 20.24 13.77 20112011 6.45 5.89 6.24 6.59 7.75 5.50 4.40 3.91 1.86 1.48 11.66 4.66 -3.72 20122012 6.80 6.31 6.67 7.03 8.12 6.15 5.26 4.97 3.42 3.42 11.63 6.91 3.63 11.55 1900
1999 2000 2001 2002 2003 2004 2005 2006 2007 2008 2009 2010 2011 2012 1900
How to use this Chart1) Locate the column for the first year of the interval (2001). Years are labeled at the top and bottom of each column. 2) Locate the row for the last year of the interval (2007). Years are labeled at the beginning of each row. 3) The intersection of the selected column and row displays the annualized return for that time period, i.e. The portfolio has an annualized return of 9.06% from 2001 to 2007.

Assets in balance.Assets in balance.
Balanced Index Strategy Gross Returns Matrix
60% Equity - 40 % Fixed
This is an index that closely tracks the Symmetry philosophy.
Past performance does not guarantee future results. The data should be reviewed in conjunction with the disclosure located on the end of the appendix.
19731973 -9.2 19741974 -10.3 -11.4 19751975 1.8 7.9 31.4 19761976 6.5 12.4 26.5 21.9 19771977 7.7 12.4 21.7 17.1 12.4 19781978 9.1 13.1 20.3 16.8 14.3 16.2 19791979 10.1 13.7 19.5 16.7 15.0 16.3 16.4 19801980 11.4 14.7 19.7 17.5 16.4 17.8 18.5 20.8 19811981 11.1 14.0 18.2 16.1 15.0 15.7 15.5 15.0 9.5 19821982 11.9 14.5 18.2 16.4 15.6 16.2 16.2 16.1 13.9 18.4 19831983 12.8 15.3 18.7 17.2 16.6 17.3 17.5 17.7 16.8 20.5 22.7 19841984 12.6 14.8 17.9 16.5 15.8 16.3 16.3 16.3 15.2 17.1 16.5 10.6 19851985 13.6 15.8 18.6 17.4 17.0 17.5 17.7 17.9 17.4 19.4 19.8 18.4 26.6 19861986 14.2 16.2 18.8 17.8 17.4 17.9 18.1 18.4 18.0 19.8 20.1 19.3 23.8 21.1 19871987 13.9 15.7 18.1 17.1 16.7 17.1 17.2 17.3 16.8 18.1 18.0 16.9 19.0 15.4 10.0 19881988 14.1 15.9 18.1 17.2 16.8 17.2 17.3 17.4 17.0 18.1 18.0 17.1 18.8 16.3 14.0 18.2 19891989 14.5 16.1 18.2 17.4 17.0 17.4 17.5 17.6 17.3 18.3 18.3 17.6 19.0 17.2 15.9 19.0 19.8 19901990 13.2 14.7 16.6 15.7 15.2 15.5 15.4 15.3 14.8 15.4 15.0 13.9 14.5 12.2 10.1 10.2 6.4 -5.5 19911991 13.7 15.1 16.9 16.1 15.7 15.9 15.9 15.9 15.4 16.0 15.8 14.9 15.6 13.8 12.4 13.0 11.3 7.4 22.0 19921992 13.4 14.7 16.4 15.5 15.2 15.4 15.3 15.2 14.8 15.2 14.9 14.1 14.5 12.9 11.6 11.9 10.4 7.5 14.6 7.7 19931993 13.7 15.0 16.6 15.8 15.5 15.6 15.6 15.6 15.2 15.6 15.4 14.7 15.2 13.8 12.8 13.3 12.3 10.5 16.4 13.8 20.2 19941994 13.2 14.3 15.8 15.1 14.7 14.8 14.7 14.6 14.2 14.6 14.3 13.5 13.8 12.5 11.4 11.6 10.6 8.8 12.8 9.8 10.9 2.3 19951995 13.4 14.5 15.9 15.2 14.8 15.0 14.9 14.8 14.4 14.8 14.5 13.9 14.2 13.0 12.1 12.4 11.6 10.3 13.8 11.8 13.2 9.8 17.9 19961996 13.4 14.5 15.8 15.1 14.8 14.9 14.9 14.8 14.4 14.8 14.5 13.9 14.2 13.1 12.3 12.6 11.9 10.8 13.8 12.3 13.4 11.3 16.0 14.2 19971997 13.4 14.4 15.7 15.0 14.7 14.8 14.8 14.7 14.3 14.6 14.4 13.8 14.0 13.1 12.4 12.6 12.0 11.1 13.7 12.3 13.3 11.6 14.9 13.4 12.6 19981998 13.1 14.1 15.3 14.7 14.3 14.4 14.3 14.2 13.9 14.2 13.9 13.3 13.5 12.6 11.9 12.1 11.5 10.6 12.8 11.5 12.2 10.7 12.8 11.2 9.7 6.9 19991999 13.1 14.1 15.3 14.6 14.3 14.4 14.3 14.2 13.9 14.2 13.9 13.4 13.6 12.7 12.1 12.2 11.7 10.9 12.9 11.8 12.5 11.2 13.1 11.9 11.2 10.5 14.1 20002000 12.8 13.7 14.8 14.2 13.9 13.9 13.8 13.7 13.4 13.6 13.3 12.8 12.9 12.1 11.4 11.6 11.0 10.3 12.0 10.9 11.3 10.1 11.5 10.2 9.3 8.2 8.8 3.7 20012001 12.5 13.3 14.4 13.8 13.4 13.5 13.4 13.2 12.9 13.0 12.8 12.2 12.3 11.5 10.9 11.0 10.4 9.7 11.2 10.1 10.4 9.3 10.3 9.1 8.1 7.0 7.0 3.6 3.5 20022002 11.8 12.6 13.6 13.0 12.7 12.7 12.5 12.4 12.0 12.1 11.8 11.2 11.3 10.4 9.8 9.8 9.2 8.5 9.7 8.7 8.7 7.5 8.2 6.9 5.7 4.4 3.8 0.6 -1.0 -5.3 20032003 12.3 13.1 14.1 13.5 13.2 13.2 13.1 13.0 12.6 12.8 12.5 12.0 12.1 11.3 10.8 10.8 10.4 9.7 11.0 10.1 10.3 9.4 10.2 9.3 8.6 8.0 8.2 6.8 7.8 10.0 27.7 20042004 12.3 13.1 14.0 13.5 13.2 13.2 13.1 13.0 12.7 12.8 12.6 12.1 12.2 11.5 11.0 11.0 10.6 10.0 11.2 10.4 10.6 9.8 10.6 9.8 9.3 8.8 9.1 8.2 9.3 11.3 20.6 13.9 20052005 12.2 13.0 13.9 13.3 13.0 13.1 12.9 12.8 12.5 12.6 12.4 11.9 12.0 11.3 10.8 10.9 10.4 9.9 11.0 10.3 10.5 9.7 10.4 9.7 9.2 8.7 9.0 8.2 9.1 10.5 16.4 11.1 8.3 20062006 12.3 13.1 13.9 13.4 13.1 13.2 13.1 12.9 12.6 12.8 12.5 12.1 12.2 11.5 11.1 11.1 10.8 10.3 11.3 10.7 10.9 10.2 10.9 10.2 9.9 9.6 9.9 9.3 10.3 11.7 16.3 12.8 12.2 16.3 20072007 12.1 12.8 13.6 13.1 12.8 12.9 12.7 12.6 12.3 12.4 12.2 11.8 11.8 11.2 10.8 10.8 10.4 9.9 10.9 10.3 10.4 9.8 10.4 9.8 9.4 9.0 9.3 8.7 9.4 10.4 13.9 10.6 9.6 10.2 4.5 20082008 10.8 11.5 12.2 11.7 11.4 11.4 11.2 11.0 10.7 10.7 10.5 10.0 10.0 9.3 8.8 8.7 8.3 7.7 8.5 7.7 7.7 7.0 7.3 6.5 5.9 5.3 5.2 4.2 4.3 4.4 6.1 2.2 -0.5 -3.3 -11.8 -25.5 20092009 11.2 11.8 12.6 12.1 11.8 11.8 11.6 11.5 11.2 11.2 11.0 10.5 10.5 9.9 9.5 9.4 9.0 8.5 9.3 8.6 8.7 8.0 8.4 7.8 7.3 6.9 6.9 6.2 6.4 6.8 8.6 5.8 4.2 3.2 -0.8 -3.4 25.2 20102010 11.3 11.9 12.6 12.1 11.9 11.8 11.7 11.6 11.3 11.3 11.1 10.7 10.7 10.1 9.6 9.6 9.3 8.8 9.5 8.9 9.0 8.4 8.8 8.2 7.8 7.4 7.4 6.9 7.2 7.6 9.3 6.9 5.8 5.3 2.7 2.1 19.5 14.1 20112011 10.9 11.5 12.2 11.7 11.4 11.4 11.2 11.1 10.8 10.8 10.5 10.1 10.1 9.5 9.1 9.0 8.7 8.2 8.9 8.3 8.3 7.7 8.0 7.4 7.0 6.6 6.6 5.9 6.2 6.4 7.8 5.5 4.4 3.8 1.4 0.7 11.3 4.9 -3.5 20122012 10.9 11.5 12.2 11.7 11.4 11.4 11.2 11.1 10.8 10.8 10.6 10.2 10.2 9.6 9.2 9.2 8.8 8.4 9.0 8.4 8.5 7.9 8.2 7.7 7.3 6.9 6.9 6.4 6.6 6.9 8.2 6.3 5.3 4.9 3.1 2.9 11.5 7.3 4.0 12.1
1973 1974 1975 1976 1977 1978 1979 1980 1981 1982 1983 1984 1985 1986 1987 1988 1989 1990 1991 1992 1993 1994 1995 1996 1997 1998 1999 2000 2001 2002 2003 2004 2005 2006 2007 2008 2009 2010 2011 2012
How to use this Chart1) Locate the column for the first year of the interval (1986). Years are labeled at the top and bottom of each column. 2) Locate the row for the last year of the interval (2004). Years are labeled at the beginning of each row. 3) The intersection of the selected column and row displays the annualized return for that time period, i.e. The index has an annualized return of 11.5% from 1986 to 2004.

Assets in balance.Assets in balance.
Structured Model Portfolio Returns Structured Structured Structured Structured Structured Structured Structured Structured Structured Structured Structured S&P 500 0/100 10/90 20/80 30/70 40/60 50/50 60/40 70/30 80/20 90/10 100/0 Index
0% Equities 10% Equities 20% Equities 30% Equities 40% Equities 50% Equities 60% Equities 70% Equities 80% Equities 90% Equities 100% Equities 100% EquitiesSince Jan. 1999 ReturnJan. 1, 1999 - Oct. 31, 2013 3.03 3.91 4.72 5.47 6.15 6.77 7.32 7.80 8.21 8.53 8.79 4.34Annual Standard Deviation 1.66 2.05 3.39 4.96 6.60 8.29 10.01 11.77 13.57 15.42 17.07 15.56
10-Year ReturnNov. 1, 2003 - Oct. 31, 2013 2.16 3.24 4.25 5.17 6.01 6.77 7.45 8.03 8.52 8.90 9.20 7.46Annual Standard Deviation 1.32 2.14 3.70 5.40 7.14 8.92 10.74 12.60 14.50 16.47 18.17 14.66
5-Year ReturnNov. 1, 2008 - Oct. 31, 2013 1.78 3.65 5.43 7.13 8.74 10.27 11.69 13.02 14.24 15.33 16.09 15.17Annual Standard Deviation 1.11 2.23 4.03 5.93 7.87 9.85 11.86 13.94 16.09 18.33 20.23 16.25
3-Year ReturnNov. 1, 2010 - Oct. 31, 2013 0.64 1.93 3.23 4.51 5.80 7.08 8.35 9.63 10.89 12.16 13.16 16.56Annual Standard Deviation 0.92 1.73 3.11 4.58 6.10 7.66 9.24 10.86 12.51 14.19 15.57 12.47
1-Year ReturnNov. 1, 2012 - Oct. 31, 2013 0.00 2.65 5.34 8.07 10.84 13.66 16.52 19.43 22.37 25.37 27.83 27.18
Year-to-Date 2013Jan. 1, 2013 - Oct. 31, 2013 -0.07 2.13 4.35 6.59 8.86 11.15 13.46 15.80 18.15 20.54 22.48 25.30
Past performance does not guarantee future results. The performance results above include the net effect of 0.50% investment management fee and mutual fund expenses. Please be advised that some of the portfolios may not be available through all broker-dealers. Actual client performance may be better or worse depending upon when the client invested with Symmetry, rebalancing, cash flows and other factors unique to each client. The performance information presented in this chart from January 1, 1999 to December 31, 2001 represents back tested performance based on live mutual fund data. Please see disclosure labeled Model Portfolio Returns Disclosure for additional limitations to the performance information. .

Assets in balance.Assets in balance.
Symmetry 60/40 Average Annual Returns During Good and Bad Market Periods: 1999-2012
Created with Zephyr StyleADVISOR
Past performance does not guarantee future results. The above information is supplemented by the DFA Fund Performance and Symmetry During Good and Bad Periods Disclosure. The data should be reviewed in conjunction with the disclosure to understand additional limitations of the performance data. Data is from sources believed to be reliable but cannot be guaranteed or warranted.
The comparison above shows the Symmetry Portfolio against a mainstream equity and balanced index during good years, bad years, and the overall timeframe using averages of calendar year performance. Symmetry’s performance will differ from that of the benchmarks based on the equity to fixed income mix and on differences in portfolio design. Returns depicted here are simple averages and do not include the effects of compounding or volatility of the investment, which would be incorporated in the annualized returns. Please see the chart below to view the difference between an annualized return and an average annual return over the available time frame.
Choosing a Symmetry Balanced Portfolio takes the emotion out of investing while providing a disciplined, principled and low cost investment solution. Symmetry seeks to leverage the best of academic research by providing passively managed, globally diversified investments with targeted tilts toward small cap and value stocks.
Portfolio performance data for the years 1999 through 2001 represents hypothetical returns. Classification of Good and Bad Years can also be found in the table below.
Good Years: 1999, 2003-2007, 2009-2012 Bad Years: 2000-2002, 2008 All Years: 1999-2012
Structured 60/40
Lipper Balanced
S&P 500
12.87%10.92%
14.64%
0.00%
5.00%
10.00%
15.00%
20.00%Annual Average of Good Years
-5.55%
-9.43%
-20.02%-25.00%
-20.00%
-15.00%
-10.00%
-5.00%
0.00%Annual Average of Bad Years
7.61%
5.10% 4.74%
0.00%
5.00%
10.00%Annual Average of All Years
Calendar Year Returns for: 2012 2011 2010 2009 2008 2007 2006 2005 2004 2003 2002 2001 2000 1999Avg. Annual
Return1999-2012
Annualized Return
1999-2012
Classification of Year Good Good Good Good Bad Good Good Good Good Good Bad Bad Bad GoodStructured 60/40 Portfolio 11.54% -3.72% 13.76% 27.09% -23.80% 3.38% 14.78% 7.37% 13.55% 27.56% -3.32% 2.86% 2.08% 13.41% 7.61% 6.80%Lipper Balanced Fd IX 11.94% 0.74% 11.90% 23.35% -26.18% 6.53% 11.60% 5.20% 8.99% 19.94% -10.69% -3.24% 2.39% 8.98% 5.10% 4.34%S&P 500 Index 16.00% 2.11% 15.06% 26.46% -37.00% 5.49% 15.80% 4.91% 10.88% 28.69% -22.10% -11.88% -9.11% 21.04% 4.74% 2.94%
Assets in balance.Assets in balance.
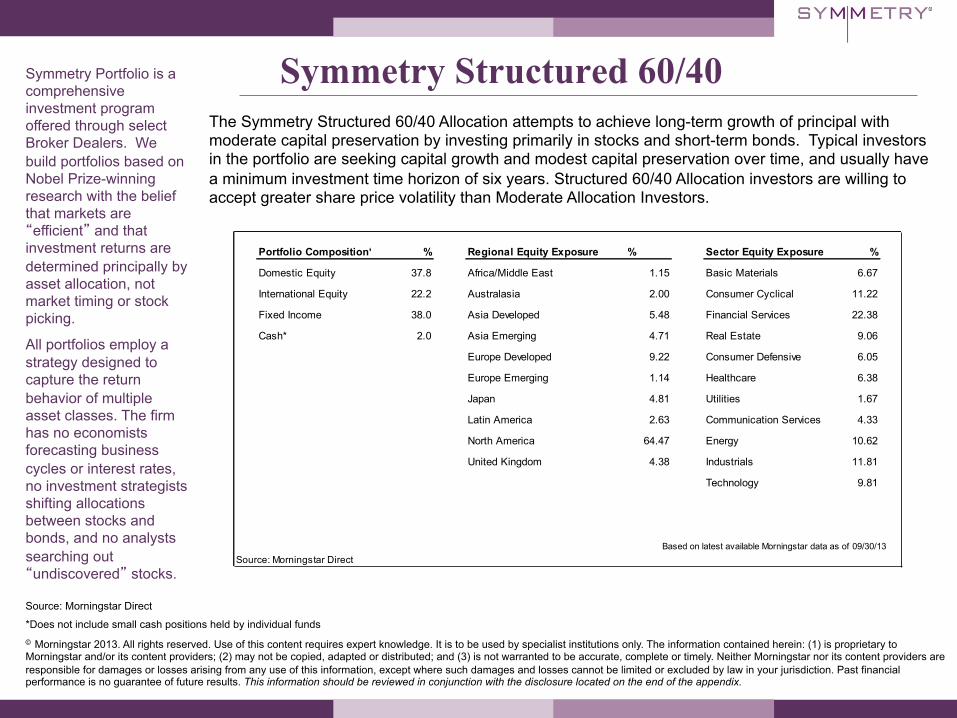
Symmetry Structured 60/40 The Symmetry Structured 60/40 Allocation attempts to achieve long-term growth of principal with moderate capital preservation by investing primarily in stocks and short-term bonds. Typical investors in the portfolio are seeking capital growth and modest capital preservation over time, and usually have a minimum investment time horizon of six years. Structured 60/40 Allocation investors are willing to accept greater share price volatility than Moderate Allocation Investors.
Symmetry Portfolio is a comprehensive investment program offered through select Broker Dealers. We build portfolios based on Nobel Prize-winning research with the belief that markets are “efficient” and that investment returns are determined principally by asset allocation, not market timing or stock picking.
All portfolios employ a strategy designed to capture the return behavior of multiple asset classes. The firm has no economists forecasting business cycles or interest rates, no investment strategists shifting allocations between stocks and bonds, and no analysts searching out “undiscovered” stocks.
Source: Morningstar Direct
*Does not include small cash positions held by individual funds © Morningstar 2013. All rights reserved. Use of this content requires expert knowledge. It is to be used by specialist institutions only. The information contained herein: (1) is proprietary to Morningstar and/or its content providers; (2) may not be copied, adapted or distributed; and (3) is not warranted to be accurate, complete or timely. Neither Morningstar nor its content providers are responsible for damages or losses arising from any use of this information, except where such damages and losses cannot be limited or excluded by law in your jurisdiction. Past financial performance is no guarantee of future results. This information should be reviewed in conjunction with the disclosure located on the end of the appendix.
Portfolio Composition* % Regional Equity Exposure % Sector Equity Exposure %
Domestic Equity 37.8 Africa/Middle East 1.15 Basic Materials 6.67
International Equity 22.2 Australasia 2.00 Consumer Cyclical 11.22
Fixed Income 38.0 Asia Developed 5.48 Financial Services 22.38
Cash* 2.0 Asia Emerging 4.71 Real Estate 9.06
Europe Developed 9.22 Consumer Defensive 6.05
Europe Emerging 1.14 Healthcare 6.38
Japan 4.81 Utilities 1.67
Latin America 2.63 Communication Services 4.33
North America 64.47 Energy 10.62
United Kingdom 4.38 Industrials 11.81
Technology 9.81
Based on latest available Morningstar data as of 09/30/13Source: Morningstar Direct

Assets in balance.Assets in balance.
We believe markets are quite efficient at pricing securities and all the effort managers expend in trying to beat the market are in most cases, wasted. We believe investors can expect to outperform riskless assets by holding a diversified equity portfolio, since stocks are priced to deliver higher expected returns as compensation for risk. Passive investment vehicles offer a diversified, efficient approach for the long term investor to capture capital market rates of return. Broadly speaking, there are four components to investing: • Cost • Risk • Taxes • Return Investors can control the first three. Unfortunately, they all too often focus on the one component over which, we believe, they have no control: return. The Symmetry strategies provide a framework from which to build a low cost, diversified, tax-efficient portfolio that enables the investor to manage risk effectively. Capitalism will provide the returns.
- Patrick A. Sweeny, Principal
Ending Thoughts

Assets in balance.Assets in balance.
Symmetry Disclosure With respect to the Symmetry portfolios referenced herein, Symmetry Partners, LLC is an investment advisory firm registered with the Securities and Exchange Commission. Symmetry charges an investment management fee for its services. All Symmetry Partners fees can be found in the ADV Part 2A located on the Symmetry Partners website, www.symmetrypartners.com. As with any investment strategy, there is the possibility of profitability as well as loss. Diversification seeks to reduce volatility by spreading your investment dollars into various asset classes to add balance to your portfolio. Using this methodology, however, does not guarantee a profit or protection from loss in a declining market. Rebalancing assets can have tax consequences. If you sell assets in a taxable account you may have to pay tax on any gain resulting from the sale. Please consult your tax advisor. Symmetry follows a passive investment strategy that involves limited ongoing buying and selling actions. Passive investors will purchase investments with the intention of long-term appreciation and limited maintenance. Passively managed portfolios are designed to closely track their respective benchmark index rather than seek out performance. As a result, the portfolio may hold securities regardless of the current or projected performance of a specific security or a particular industry or market sector. Maintaining investments in securities regardless of market conditions or the performance of individual securities could cause the portfolio to lose value if the market as a whole falls. The credit quality of the investment in the portfolio does not apply to the stability or safety of the fund. In an environment where interest rates may trend upward, rising rates will negatively impact most bond funds, and fixed income securities held by a fund are likely to decrease in value. Bond funds and individual bonds with a longer duration (a measure of the expected life of a security) tend to be more sensitive to changes in interest rates, usually making them more volatile than securities with shorter durations. DIFFERENT TYPES OF INVESTMENTS AND/OR INVESTMENT STRATEGIES INVOLVE VARYING LEVELS OF RISK, AND THERE CAN BE NO ASSURANCE THAT ANY SPECIFIC INVESTMENT OR INVESTMENT STRATEGY WILL BE EITHER SUITABLE OR PROFITABLE FOR YOUR PORTFOLIO. Allocation models are not intended to represent investment advice that is appropriate for all investors. Each investor must take into account his/her financial resources, investment goals, risk tolerance, investing time horizon, tax situation and other relevant factors to determine if such portfolio is suitable. Model composition is subject to change. You and your advisor should carefully consider your suitability depending on your financial situation. Higher potential return generally involves greater risk, short term volatility is not uncommon when investing in various types of funds including but not limited to: sector, emerging markets, small and mid-cap funds. International investing involves special risks such as currency fluctuation, lower liquidity, political and economic uncertainties, and differences in accounting standards. Risks of foreign investing are generally intensified for investments in emerging markets. Risks for emerging markets include risks relating to the relatively smaller size and lesser liquidity of these markets, high inflation rates and adverse political developments. Risks for investing in international equity include foreign currency risk, as well as, fluctuation due to economic or political actions of foreign governments and/or less regulated or liquid markets. Risks for smaller companies include business risks, significant stock price fluctuation and illiquidity. Investing in real estate entails certain risks, including changes in: the economy, supply and demand, laws, tenant turnover, interest rates (including periods of high interest rates), availability of mortgage funds, operating expenses and cost of insurance. Some real estate investments offer limited liquidity options. An investor should carefully consider investment objectives, risks, charges and expenses before investing. To obtain a prospectus, which contains this and other information, please visit the following websites: www.vanguard.com, www.spdrs.com, www.ishares.com, www.dfaus.com. Please read the prospectus carefully before investing.

Assets in balance.Assets in balance.
DALBAR Disclosure Symmetry Partners, LLC is an investment advisory firm registered with the Securities and Exchange Commission. Symmetry charges an investment management fee for its services. All Symmetry Partners’ fees can be found in the ADV Part 2A located on the Symmetry Partners’ website, www.symmetrypartners.com. Diversification seeks to reduce volatility by spreading your investment dollars into various asset classes to add balance to your portfolio. Using this methodology, however, does not guarantee a profit or protection from loss in a declining market. Different types of investments and/or investment strategies involve varying levels of risk, and there can be no assurance that any specific investment or investment strategy will either be suitable or profitable for your portfolio. You and your advisor should carefully consider your suitability depending on your situation. Symmetry follows a passive investment strategy that involves limited ongoing buying and selling actions. Passive investors will purchase investments with the intention of long-term appreciation and limited maintenance. Passively managed portfolios are designed to closely track their respective benchmark index rather than seek outperformance. As a result, the portfolio may hold securities regardless of the current or projected performance of a specific security or a particular industry or sector. Maintaining investments in securities regardless of market conditions or the performance of individual securities could cause the portfolio to lose value if the market as a whole fails. Source: “Quantitative Analysis of Investor Behavior, 2013,” DALBAR, Inc. www.dalbar.com Equity benchmark performance and systematic equity investing examples are represented by the Standard & Poor’s 500 Composite Index, an unmanaged index of 500 common stocks generally considered representative of the U.S. stock market. Indexes do not take into account the fees and expenses associated with investing, and individuals cannot invest directly in any index. Past performance cannot guarantee of future results. Average stock investor performance results are based on a DALBAR study, “Quantitative Analysis of Investor Behavior (QAIB), 2013.” DALBAR is an independent, Boston-based financial research firm. Using monthly fund data supplied by the Investment Company Institute, QAIB calculates investor returns as the change in total mutual fund assets after excluding sales, redemptions and exchanges. This method of calculation captures realized and unrealized capital gains, dividends, interest, trading costs, sales charges, fees, expenses and any other costs. After calculating investor returns in dollar terms, two percentages are calculated for the period examined: Total investor return rate and annualized investor return rate. Total return rate is determined by calculating the investor return dollars as a percentage of the net of the sales, redemptions, and exchanges for the period. Standard & Poor’s 500 Index represents the 500 leading U.S. companies, approximately 80% of the total U.S. market capitalization. Indices are unmanaged. Investors cannot directly invest in an index. Indexes have no fees. Historical performance results for indexes generally do not reflect the deduction of transaction and/or custodial charges or investment management fees, the incurrence of which have the effect of decreasing historical performance results. Actual performance for client accounts may differ materially from index portfolios.

Assets in balance.Assets in balance.
SPIVA Disclosure Symmetry Partners, LLC, is an investment adviser registered with the Securities and Exchange Commission. The firm only transacts business in states where it is properly registered, or excluded or exempted from registration requirements. No current or prospective client should assume that future performance of any specific investment, investment strategy, or product made reference to directly or indirectly in this piece will be profitable. As with any investment strategy, there is a possibility or profitability as well as loss. All data is from sources believed to be reliable but cannot be guaranteed or warranted. Symmetry charges an investment management fee for its services. All Symmetry Partners fees can be found in the ADV Part 2A located on the Symmetry Partners website, www.symmetrypartners.com. As with any investment strategy, there is the possibility of profitability as well as loss. Diversification seeks to reduce volatility by spreading your investment dollars into various asset classes to add balance to your portfolio. Using this methodology, however, does not guarantee a profit or protection from loss in a declining market. Rebalancing assets can have tax consequences. If you sell assets in a taxable account you may have to pay tax on any gain resulting from the sale. Please consult your tax advisor. Different types of investments and/or investment strategies involve varying levels of risk, and there can be no assurance that any specific investment or investment strategy will either be suitable or profitable for your portfolio. You and your advisor should carefully consider your suitability depending on your situation. Symmetry follows a passive investment strategy that involves limited ongoing buying and selling actions. Passive investors will purchase investments with the intentions of long-term appreciation and limited maintenance. Passively managed portfolios are designed to closely track their respective benchmark index rather than seek out performance. As a result, the portfolio may hold securities regardless of the current or projected performance of a specific security or a particular industry or market sector. Maintaining investments in securities regardless of market conditions or the performance of individual securities could cause the portfolio to lose value if the market as a whole falls. Past performance is no guarantee of future results. Data courtesy of Standard & Poor’s Index Versus Active (SPIVA) report as of 5-year period ending 12/31/12. The SPIVA Scorecard presents the performances of actively managed mutual funds as compared to benchmark indices. It covers U.S. equity, international equity and fixed income categories. Percentages represent the percent of the equal-weighted asset class that is outperformed by its relative benchmark as defined below. The analysis shows that in most cases the number of active managers in the given asset classes underperforming the benchmark is higher than the number outperforming, though randomly in any one asset class the number of active managers outperforming the relevant benchmark is more than 50%. This same general conclusion holds for each five-year holding period ending December going back to Dec. 2002, as analyzed by SPIVA, except for the period ending Dec. 2007, for which SPIVA did not create a report. Active manager data is obtained from the CRSP Survivorship-Bias-Free US Mutual Fund Database for the 2008 analysis and from the S&P Mutual Fund database, a continuous, consistent, survivorship-bias free database. Data is from sources believed to be reliable, but cannot be guaranteed or warranted. All indexes have certain limitations. Investors cannot invest directly in an index. Indexes have no fees. Historical performance results for investment indexes generally do not reflect the deduction of transaction and/or custodial charges or the deduction of an investment management fee, the incurrence of which would have the effect of decreasing historical performance results. Actual performance for client accounts may differ materially from the index portfolios. The SPIVA comparison is made against the “average” active manager performance. Investors cannot invest in the “average active manager.” S&P 500 Index: Widely regarded as the best single gauge of the U.S. equities market, this market capitalization-weighted index includes a representative sample of 500 leading companies in leading industries of the U.S. economy and provides over 80% coverage of U.S. equities. S&P MidCap 400 Index: This index consists of 400 mid-sized companies and covers approximately 7% of the U.S. equities market. S&P SmallCap 600 Index: This index consists of 600 small-cap stocks and covers approximately 3% of the U.S. equities market. S&P Composite 1500 Index: This is a broad market, capitalization weighted index of 1500 stocks. This index is comprised of three size-based indices: The S&P 500 Index, the S&P MidCap 400 Index, and the S&P SmallCap 600 Index, which measures the performance of large-, mid- and small-cap stocks respectively. This index represents 90% of U.S. equities. S&P United States REIT Index: This index measures the investable universe of publicly traded real estate investment trusts. S&P 700 Index: This index measures the non-United States component of the global equity markets. The index covers all of the regions included in the S&P Global 1200 except for the United States (S&P 500). S&P/IFCI Composite Index: This index is widely recognized as a comprehensive and reliable measure of the world’s emerging markets. It measures the returns of stocks that are legally and practically available to foreign investors. Barclays Capital 1-3 Year Government Bond Index: This index consists of U.S. Treasury and U.S. Government agency bonds with maturities from one to three years. Barclays Capital 1-3 Year Government/Credit Bond Index: This index covers corporate and non-corporate fixed-income securities that are rated investment grade and have 1-3 yrs to final maturity. For further information regarding Standard and Poor’s Indices Versus Active Funds Scorecard, please go to www.spiva.standardpoors.com.

Assets in balance.Assets in balance.
Real Cost of Volatility The data for the chart is calculated by an arithmetic formula and rounding. Please look at the first column on the chart, (-10% decline and 11% increase). If $100.00 invested decreases 10% to $90.00, then an 11% increase would be needed to recover the original investment, ($90.00 x 11% = 9.9 rounded to $10.00 + $90.00 = $100.00). The chart does not constitute a complete description of investment services and is for informational purposes only. Other factors such as investment objectives, expenses, etc., should also be considered. The chart does not represent a solicitation of a formula for security selection. Broad Diversification is Essential
Disclosures

Assets in balance.Assets in balance.
Disclosures Broad Diversification is Essential Continued

Assets in balance.Assets in balance.
Symmetry Portfolio Past performance is no guarantee of future results. The data represents Symmetry Portfolio’s asset allocation and funds for one portfolio. The portfolio is designed based on historical data achieved through academic research as described in the material. The data is not a complete description of the investment services offered. Different types of investment strategies involve varying degrees of risk, and there can be no assurance that any specific investment strategy will either be suitable or profitable. Other factors such as investment objectives, expenses, etc., should also be considered. The prospectus contains this and other information about the investment company. Prospectus may be obtained from your advisor or from Dimensional Fund Advisors at www.dfaus.com. Please read the prospectus carefully before investing or sending money. Investment return and principal value of an investment in a fund(s) will fluctuate so that an investor’s shares when redeemed may be worth more or less than their original cost. Model Portfolio Returns Data Matrix Example of rebalancing: assuming no additional cash flows, a qualified Structured 60/40 Portfolio net the effect of .50% with an annual rebalance in September would have returned 19.54% during the 2009 calendar year. The same portfolio rebalanced in March would have returned 30.27% over the same time frame. The model returns are currently rebalanced in April as that is the date of the last model change, which occurred in 2008. Please note that 2009 was marked by unusual volatility that caused a wider dispersion in returns based on time of rebalance, particularly for portfolios with both equity and fixed income. Our experience is that in most periods, the difference in return due to rebalance date is markedly lower. Please note that the performance information presented through the time period May 31, 2006, is the result of the Symmetry Legacy Portfolios. The Legacy Portfolios are comprised of the following Dimensional Fund Advisor funds: DFLCX, DFLVX, DFSCX, DFSVX, DFREX, DFIVX, DFISX, DISVX, DFEMX, DFEVX, DEMSX, DFIHX, DFFGX, DFGFX, DFGBX, and the asset allocation assigned to each fund pursuant to the strategy and structure of the portfolio, (i.e., 100% equity, etc.). As of June 1, 2006, Symmetry made changes to the Portfolios and following funds: DFLCX, DFSCX, DFSVX, DFIVX, DFEMX, DEMSX, and DFFGX were replaced by DFQTX, DFVEX, DFCEX, and DFIEX. As of April 1, 2008, Symmetry has added DFITX (International Real Estate Fund) to the Portfolios. Please be advised that the information presented does not include Symmetry Partners Non-Qualified (tax-managed) Portfolios, which contain funds that are geared toward achieving tax efficiency. Symmetry tax-managed portfolios are designed with the goal of increasing the portfolio’s overall tax efficiency. Changes to portfolio holdings which comprise the portfolio may have tax consequences. If you sell assets in a taxable account, you may have to pay tax on any gain. While Symmetry seeks to mitigate tax exposure when possible, it is likely that investors will incur a taxable event while being invested in the portfolio. Past performance is no guarantee of future results. Investment return and principal value of an investment in the fund(s) will fluctuate so that an investor’s shares when redeemed may be worth more or less than their original cost. As with any investment strategy, there is a potential for profit as well as the possibility of loss. The Symmetry investment strategy is based on a hybrid of Modern Portfolio Theory and Efficient Market Hypothesis. The strategy employs passive management with emphasis on diversity in order to reduce risk. The portfolios are designed, based on historical performance data, for funds to be invested and allocated in approximately three to fifteen mutual funds as determined by academic research. The data shown represents model portfolios constructed by Symmetry Partners utilizing DFA, (Dimensional Fund Advisors), mutual funds. DFA creates mutual funds that attempt to track proprietary indexes. The performance information presented in this chart from January 1, 1999, to December 31, 2001, represents back tested performance figures based on live mutual fund data. The period of January 1, 2002, to the present represents the time period the portfolios were constructed and are model returns with historical data from live DFA mutual funds. The back tested and model performance figures assume reinvested dividends and capital gains. The performance results include the net effect of .50% investment management and mutual fund expenses. Symmetry’s compensation is the investment management fee only and Symmetry is not paid any form of compensation or commission from any mutual fund company or broker-dealer. Back tested and model performances have certain limitations and do not reflect actual client performance. Actual client accounts may vary significantly from the model performances due to factors unique to each client. The performance figures include yearly rebalancing, a 2% cash position, but do not take into consideration actual trading in client accounts, advisor or referral fee, transaction costs such as wire transfer fee, etc., and the custodian fee. All of which, when deducted, would reduce returns. The performance figures also exclude non-discretionary assets, which are not part of Symmetry’s model portfolios. The back tested performance results also differ from actual performance because it is achieved through the retroactive application of Symmetry’s model portfolios. For all data periods, the Symmetry Portfolio returns data is provided by Dimensional Fund Advisors and is imported in Zephyr StyleADVISOR from the DFA software program. The performance figures and standard deviations are calculated utilizing Zephyr StyleADVISOR and inputting the appropriate time range and corresponding months. Standard deviation is a measure of the risk of an investment that measures the dispersion of returns around the average return. The higher the standard deviation, the more volatile, or “risky” the investment has been based on historical returns.
Disclosures

Assets in balance.Assets in balance.
Disclosures Balanced Index Strategy Gross Returns Matrix
Balanced Index Strategy Returns provided by Dimensional Fund Advisors. Data is from sources believed to be reliable but cannot be guaranteed or warranted. 12% S&P 500 Index: Index of 500 large cap companies traded on major US exchanges, as provided by DFA from Standard and Poor’s Index Services Group. 12% Dimensional US Large Cap Value Index: June 1927–Present: Dimensional US Large Cap Value Index (20%). Composition: A subset of the US Large Cap Index. The subset is defined as companies whose book-to-market ratio falls in the top 20% of the US Large Cap Index after the exclusion of utilities, companies lacking financial data, and companies with negative book-to-market ratio. Source: CRSP and Compustat. 6% Dimensional US Small Cap Index: June 1927–Present: Dimensional US Small Cap Index. Composition: Market-capitalization-weighted index of securities of the smallest US companies whose market capitalization falls in the lowest 8% of the total market capitalization of the Eligible Market. Source: CRSP and Compustat. 6% Dimensional US Small Cap Value Index: June 1927–Present: Dimensional US Small Cap Value Index (25%). Composition: A subset of the US Small Cap Index. The subset is defined as companies whose book-to-market ratio falls in the top 25% of the US Small Cap Index after the exclusion of utilities, companies lacking financial data, and companies with negative book-to-market ratio. Source: CRSP and Compustat. 6% Dow Jones US Select REIT Index: Total Returns in USD. April 2009–Present: Dow Jones US Select REIT Index. Source: Dow Jones Indexes. January 1978–March 2009: Dow Jones Wilshire REIT Index. Source: Dow Jones Wilshire. Composition: U.S. publicly traded Real Estate Investment Trusts weighted by float-adjusted market capitalization. 6% Dimensional International Value Index: January 1994–Present: Simulated by Dimensional from Bloomberg securities data. Returns computed from the average of four staggered, market cap-weighted annually rebalanced portfolios of value company securities. Value breaks are formed by country on the top 30% of large companies ranked on book-to-market capitalization. 3% Dimensional International Small Cap Index: January 1994–Present: Simulated by Dimensional from Bloomberg securities data. Returns computed from the average of four staggered, market cap-weighted annually rebalanced portfolios of small company securities. Small companies defined as the bottom 10% of the market ranked by market cap. July 1981–December 1993: Simulated by Dimensional from StyleResearch securities data. Includes securities of MSCI EAFE countries in the bottom 10% of market capitalization, excluding the bottom 1%. January 1970–June 1981: 50% Hoare Govett Small Companies Index, 50% Nomura Small Companies Index. 3% Dimensional International Small Cap Value Index: January 1994–Present: Simulated by Dimensional from Bloomberg securities data. Returns computed from the average of four staggered, market cap-weighted annually rebalanced portfolios of small value company securities. Value breaks are formed by country on the top 30% of large companies ranked on book-to-market capitalization. Small companies defined as the bottom 10% of the market ranked by market cap. July 1981–December 1993: Simulated by Dimensional from StyleResearch securities data. Includes securities, of MSCI EAFE countries, in the top 30% of book-to-market by market capitalization conditional on the securities being in the bottom 10% of market capitalization, excluding the bottom 1%. 2.4% Dimensional Emerging Markets Small Index: January 1994–Present: Simulated by Dimensional from Bloomberg securities data. Returns computed from the average of four staggered, market cap-weighted annually rebalanced portfolios of small company securities. Small companies are defined by country using the Algorithm market cap breaks. January 1989–December 1993: Fama/French Emerging Markets Small Cap Index. 1.8% Dimensional Emerging Markets Index: January 1994–Present: Simulated by Dimensional from Bloomberg securities data. Returns computed from the average of four staggered, market-cap weighted annually rebalanced portfolios. 1.8% Dimensional Emerging Markets Value Index: January 1994–Present: Simulated by Dimensional from Bloomberg securities data. Returns computed from the average of four staggered, market cap-weighted annually rebalanced portfolios of value company securities. January 1989–December 1993: Fama/French Emerging Markets Value Index. 10% BofA ML 1-Year US Treasury Note Index: Total returns in USD. July 2000–Present: BofA Merrill Lynch 1-Year US Treasury Note Index. June 1991–June 2000: ML One Year Treasury Bill Index. July 1963–May 1991: CRSP/DFA. Source: BofA Merrill Lynch GC03 Index. 10% Barclays Treasury Bond Index 1-5 Years: November 2008–Present: Barclays Treasury Bond Index 1-5 Years. Total returns in USD. January 1976–October 2008: Lehman Brothers Treasury Bond Index Range 1-5 Years. Source: Barclays. 10% Citigroup WGBI 1-3 Years (hedged): Source: Citigroup. Total returns hedged to USD. January 1985–Present: Citigroup World Government Bond Index 1-3 Years (hedged). 10% Citigroup WGBI 1-5 Years (hedged): Source: Citigroup. Total returns hedged to USD. January 1985–Present: Citigroup World Government Bond Index 1-5 Years (hedged). CRSP is the Center for Research in Security Prices located at the University of Chicago. Real Estate Stocks weighting allocated evenly between US Small Cap and US Small Cap Value prior to January 1978 data inception. International Value weighting allocated evenly between International Small Cap and MSCI EAFE Index (net dividends) prior to January 1975 data inception. International Small Cap Value weighting allocated to International Small Cap prior to July 1981 data inception. Emerging Markets weighting allocated evenly between International Small Cap and International Value prior to January 1988 data inception. Emerging Markets Value and Small Cap weighting allocated evenly between International Small Cap and International Value prior to January 1989 data inception. Two-Year Global weighting allocated to One-Year prior to January 1990 data inception. Five-Year Gov’t weighting allocated to Barclays Capital US Gov’t Bond Index Intermediate prior to January 1976 data inception. Five-Year Global weighting allocated Barclays Capital US Gov’t Bond Index Intermediate prior to January 1990 data inception. All indexes have certain limitations. Investors cannot invest directly in an index. Indexes have no fees. Historical performance results for investment indexes generally do not reflect the deduction of transaction and/or custodial charges or the deduction of an investment management fee, the incurrence of which would have the effect of decreasing historical performance results. Actual performance for client accounts may differ materially from the index portfolios. Dimensional Fund Advisors creates funds that target the asset classes that the indexes track. The Symmetry philosophy is to encompass the distinct asset classes by constructing portfolios utilizing the applicable DFA mutual funds. As with any investment strategy, there is a potential for profit as well as the possibility of loss.

Assets in balance.Assets in balance.
Structured Model Portfolio Returns
Created with Zephyr StyleADVISOR
Disclosures Example of rebalancing: assuming no additional cash flows, a qualified Structured 60/40 Portfolio net the effect of .50% with an annual rebalance in September would have returned 19.54% during the 2009 calendar year. The same portfolio rebalanced in March would have returned 30.27% over the same time frame. The model returns are currently rebalanced in August, as that is the date of the last model change, which occurred in 2013. Please note that 2009 was marked by unusual volatility that caused a wider dispersion in returns based on time of rebalance, particularly for portfolios with both equity and fixed income. Our experience is that in most periods, the difference in return due to rebalance date is markedly lower. Please note that the performance information presented through the time period May 31, 2006, is the result of the Symmetry Legacy Portfolios. The Legacy Portfolios are comprised of the following Dimensional Fund Advisor funds: DFLCX, DFLVX, DFSCX, DFSVX, DFREX, DFIVX, DFISX, DISVX, DFEMX, DFEVX, DEMSX, DFIHX, DFFGX, DFGFX, DFGBX, and the asset allocation assigned to each fund pursuant to the strategy and structure of the portfolio, (i.e., 100% equity, etc.). As of June 1, 2006, Symmetry made changes to the Portfolios and following funds: DFLCX, DFSCX, DFSVX, DFIVX, DFEMX, DEMSX, and DFFGX were replaced by DFQTX, DFVEX, DFCEX, and DFIEX. As of April 1, 2008, Symmetry has added DFITX (International Real Estate Fund) to the Portfolios. In August 2013, Symmetry removed the following funds: DISVX, DFISX, DFREX, and DFITX. The following funds were added: DFVQX, DFIVX, and DFGEX. Please be advised that the information presented does not include Symmetry Partners Non-Qualified (tax-managed) Portfolios, which contain funds that are geared toward achieving tax efficiency. Symmetry tax-managed portfolios are designed with the goal of increasing the portfolio’s overall tax efficiency. Changes to portfolio holdings which comprise the portfolio may have tax consequences. If you sell assets in a taxable account, you may have to pay tax on any gain. While Symmetry seeks to mitigate tax exposure when possible, it is likely that investors will incur a taxable event while being invested in the portfolio. Past performance is no guarantee of future results. Investment return and principal value of an investment in the fund(s) will fluctuate so that an investor’s shares when redeemed may be worth more or less than their original cost. As with any investment strategy, there is a potential for profit as well as the possibility of loss. The Symmetry investment strategy is based on a hybrid of Modern Portfolio Theory and Efficient Market Hypothesis. The strategy employs passive management with emphasis on diversity in order to reduce risk. The portfolios are designed, based on historical performance data, for funds to be invested and allocated in approximately three to fifteen mutual funds as determined by academic research. The data shown represents model portfolios constructed by Symmetry Partners utilizing DFA, (Dimensional Fund Advisors), mutual funds. DFA creates mutual funds that attempt to track proprietary indexes. The performance information presented in this chart from January 1, 1999, to December 31, 2001, represents back tested performance figures based on live mutual fund data. The period of January 1, 2002, to the present represents the time period the portfolios were constructed and are model returns with historical data from live DFA mutual funds. The back tested and model performance figures assume reinvested dividends and capital gains. The performance results include the net effect of .50% investment management fee and mutual fund expenses. Symmetry’s compensation is the investment management fee only and Symmetry is not paid any form of compensation or commission from any mutual fund company or broker-dealer. Back tested and model performances have certain limitations and do not reflect actual client performance. Actual client accounts may vary significantly from the model performances due to factors unique to each client. The performance figures include yearly rebalancing, a 2% cash position, but do not take into consideration actual trading in client accounts, advisor or referral fee, transaction costs such as wire transfer fee, etc., and the custodian fee. All of which, when deducted, would reduce returns. The performance figures also exclude non-discretionary assets, which are not part of Symmetry’s model portfolios. The back tested performance results also differ from actual performance because it is achieved through the retroactive application of Symmetry’s model portfolios. For all data periods, the Symmetry Portfolio returns data is provided by Dimensional Fund Advisors and is imported in Zephyr StyleADVISOR from the DFA software program. The performance figures and standard deviations are calculated utilizing Zephyr StyleADVISOR and inputting the appropriate time range and corresponding months. The comparison to the S & P index is chosen to demonstrate the performance figures against a widely recognized index. The S & P 500 index does not necessarily represent a benchmark for model portfolio comparison as large cap stocks dominate the index and Symmetry’ s model returns are diversified with approximately three to fifteen mutual funds. All indexes have certain limitations. Investors cannot invest directly in an index. Indexes have no fees. Historical performance results for investment indexes generally do not reflect the deduction of transaction and/or custodial charges or the deduction of an investment management fee, the incurrence of which would have the effect of decreasing historical performance results. Actual performance for client accounts may differ materially from the index portfolios. Standard deviation is a measure of the risk of an investment that measures the dispersion of returns around the average return. The higher the standard deviation, the more volatile, or “risky” the investment has been based on historical returns.

Assets in balance.Assets in balance.
DFA Fund Performance 3rd 1-Year 5-Year 10-Year Since
Inception Quarter 11/12 - 10/13 11/08 - 10/13 11/03 - 10/13 Inception Ticker Date 2013 Ann Return Ann Return Ann Return Ann Return
US Core 2 DFQTX Oct 2005 0.22% 5.16% 33.66% 17.14% N/A 7.42%US Vector DFVEX Jan 2006 0.32% 5.64% 36.80% 17.56% N/A 7.50%US Large Value DFLVX Mar 1993 0.27% 4.93% 35.52% 17.72% 9.11% 10.21%Intl. Core DFIEX Oct 2005 0.40% 10.20% 27.98% 14.11% N/A 5.68%Intl. Vector DFVQX Sep 2008 0.54% 10.91% 29.52% 15.15% N/A 6.10%Intl. Value DFIVX Mar 1994 0.45% 10.44% 27.90% 12.61% 8.78% 7.13%Emerging Core DFCEX May 2005 0.68% 8.87% 7.75% 17.29% N/A 11.23%Emerging Value DFEVX Apr 1998 0.61% 9.87% 8.01% 16.55% 14.78% 12.89%Global REITs DFGEX Jul 2008 0.32% 2.90% 9.74% 15.37% N/A 6.11%One-Year DFIHX Aug 1983 0.17% 0.19% 0.43% 1.35% 2.24% 5.20%Two-Year Global DFGFX Mar 1996 0.18% 0.20% 0.51% 1.54% 2.28% 3.68%Five-Year Global DFGBX Dec 1990 0.28% 0.91% 0.63% 4.43% 3.76% 5.89%
Expense Ratio
The Symmetry Structured Portfolios currently invest in the fund allocations listed above. The model performance information for the Symmetry Structured Portfolios reflects various allocation changes made over time. Beginning in 1999, the Portfolio performance reflects the Symmetry Legacy Models, which held the following funds: DFLCX, DFLVX, DFSCX, DFSVX, DFREX, DFIVX, DFISX, DISVX, DFEMX, DFEVX, DEMSX, DFIHX, DFFGX, DFGFX, DFGBX, and the asset allocation assigned to each fund pursuant to the strategy and structure of the portfolio, (i.e., 100% equity, etc.). As of June 1, 2006, Symmetry made changes to the Portfolios and following funds: DFLCX, DFSCX, DFSVX, DFIVX, DFEMX, DEMSX, and DFFGX were replaced by DFQTX, DFVEX, DFCEX, and DFIEX. As of April 1, 2008, Symmetry has added DFITX (International Real Estate Fund) to the Portfolios. In August 2013, Symmetry removed the following funds: DISVX, DFISX, DFREX, and DFITX. The following funds were added: DFVQX, DFIVX, and DFGEX.
DFA Funds above are no-load institutional fund shares.
The performance information above is past performance. Past performance does not guarantee future results. The investment return and principal value will fluctuate so that an investor’s shares, when redeemed, may be worth more or less than their original cost. Current performance may be lower or higher than the performance data quoted.
Investors will not receive the exact allocations due to a variety of implementation factors, including but not limited to: the custodian or trading platform’s own trading algorithm, any changes in price that take place from the time the positions are calculated to the time they are actually traded. In some cases for certain custodians, positions, with small allocations may be eliminated altogether. Calculation of expense ratios does not include cash position.
The holdings comprising the strategies and the allocations to those holdings have changed over time and may change in the future.
Investors should consider the investment objectives, risks, and charges and expenses of the investment company carefully before investing. The prospectus contains this and other information about the investment company. Prospectuses may be obtained from your advisor or from Dimensional Fund Advisors: www.dfaus.com. For the most recent month end performance information, please call Dimensional Fund Advisors at 310-395-8005. Please read the prospectus carefully before investing or sending money. Expense ratios as of the end of the 2012 fiscal year per prospectus dated 2/28/13.

Assets in balance.Assets in balance.
Symmetry During Good and Bad Market Periods The first graph illustrates the average return over the course of the good years. The second graph illustrates the average return over the course of the bad years and the last graph shows the average return over the course of the entire time frame of the analysis. Arithmetic mean is calculated as the sum of all the terms in the series divided by the number of terms. For illustrative purposes, the good years average annual return was measured as the sum of all the good year returns divided by the number of good years. Please note that the performance information presented through the time period May 31, 2006, is the result of the Symmetry Legacy Portfolios. The Legacy Portfolios are comprised of the following Dimensional Fund Advisor funds: DFLCX, DFLVX, DFSCX, DFSVX, DFREX, DFIVX, DFISX, DISVX, DFEMX, DFEVX, DEMSX, DFIHX, DFFGX, DFGFX, DFGBX, and the asset allocation assigned to each fund pursuant to the strategy and structure of the portfolio, (i.e., 100% equity, etc.). As of June 1, 2006, Symmetry made changes to the Portfolios and following funds: DFLCX, DFSCX, DFSVX, DFIVX, DFEMX, DEMSX, and DFFGX were replaced by DFQTX, DFVEX, DFCEX, and DFIEX. As of April 1, 2008, Symmetry has added DFITX (International Real Estate Fund) to the Portfolios. Please be advised that the information presented does not include Symmetry Partners Non-Qualified (tax-managed) Portfolios, which contain funds that are geared toward achieving tax efficiency. Changes to portfolio holdings which comprise the portfolio may have tax consequences. If you sell assets in a taxable account, you may have to pay tax on any gain. While Symmetry seeks to mitigate tax exposure when possible, it is likely that investors will incur a taxable event while being invested in the portfolio. Example of rebalancing: assuming no additional cash flows, a qualified Structured 60/40 Portfolio net the effect of .50% with an annual rebalance in September would have returned 19.54% during the 2009 calendar year. The same portfolio rebalanced in March would have returned 30.27% over the same time frame. The model returns are currently rebalanced in April as that is the date of the last model change, which occurred in 2008. Please note that 2009 was marked by unusual volatility that caused a wider dispersion in returns based on time of rebalance, particularly for portfolios with both equity and fixed income. Our experience is that in most periods, the difference in return due to rebalance date is markedly lower. Past performance is no guarantee of future results. Investment return and principal value of an investment in the fund(s) will fluctuate so that an investor’s shares when redeemed may be worth more or less than their original cost. As with any investment strategy, there is a potential for profit as well as the possibility of loss. The Symmetry investment strategy is based on a hybrid of Modern Portfolio Theory and Efficient Market Hypothesis. The strategy employs passive management with emphasis on diversity in order to reduce risk. The portfolios are designed, based on historical performance data, for funds to be invested and allocated in approximately three to fifteen mutual funds as determined by academic research. The data shown represents model portfolios constructed by Symmetry Partners utilizing DFA, (Dimensional Fund Advisors), mutual funds. DFA creates mutual funds that attempt to track proprietary indexes. The performance information presented in this chart from January 1, 1999, to December 31, 2001, represents back tested performance figures based on live mutual fund data. The period of January 1, 2002, to the present represents the time period the portfolios were constructed and are model returns with historical data from live DFA mutual funds. The back tested and model performance figures assume reinvested dividends and capital gains. The performance results include the net effect of .50% investment management and mutual fund expenses. Symmetry’s compensation is the investment management fee only and Symmetry is not paid any form of compensation or commission from any mutual fund company or broker-dealer. Back tested and model performances have certain limitations and do not reflect actual client performance. Actual client accounts may vary significantly from the model performances due to factors unique to each client. The performance figures include yearly rebalancing, a 2% cash position, but do not take into consideration actual trading in client accounts, advisor or referral fee, transaction costs such as wire transfer fee, etc., and the custodian fee. All of which, when deducted, would reduce returns. The performance figures also exclude non-discretionary assets, which are not part of Symmetry’s model portfolios. The back tested performance results also differ from actual performance because it is achieved through the retroactive application of Symmetry’s model portfolios. For all data periods, the Symmetry Portfolio returns data is provided by Dimensional Fund Advisors and is imported into Zephyr StyleADVISOR from the DFA software program. The performance figures are calculated utilizing Zephyr StyleADVISOR and inputting the appropriate time range and corresponding months. Symmetry’s model portfolios are diversified with approximately twelve distinct asset classes ranging form domestic large cap, small cap, bonds (2 to 5 year maturities, except in the equity portfolio where there are no bonds), real estate, and international value, etc. The comparison to the S & P 500 and Lipper Balanced Fund Index are chosen to demonstrate the performance results against widely recognized indexes. The indexes do not necessarily represent a benchmark for model portfolio comparison. The S&P 500 Index represents the 500 leading U.S. companies, approximately 80% of the total U.S. market capitalization. The Lipper Balanced Fund Index measures the average level of performance of funds whose primary objective is to conserve principal by maintaining, at all times, a balanced portfolio of both stocks and bonds. Typically, the stock/bond ratio ranges from 60%/40%. All indexes have certain limitations. Investors cannot invest directly in an index. Indexes have no fees. Historical performance results for investment indexes generally do not reflect the deduction of transaction and/or custodial charges or the deduction of an investment management fee, the incurrence of which would have the effect of decreasing historical performance results. Actual performance for client accounts may differ materially from the index portfolios.
Disclosures

Assets in balance.Assets in balance.
DFA Fund Disclosure 4th 1-Year 5-Year 10-Year Since
Quarter 1/12 - 12/12 1/08 - 12/12 1/03 - 12/12 Jan. 19992012 Ann Return Ann Return Ann Return Ann Return
Structured 60/40net of 0.50% Jan. 1999 2.62% 11.54% 3.42% 8.12% 6.80%
4th 1-Year 5-Year 10-Year SinceQuarter 1/12 - 12/12 1/08 - 12/12 1/03 - 12/12 Inception
Ticker 2012 Ann Return Ann Return Ann Return Ann ReturnUS Core 2 DFQTX Oct. 2005 16.6% 0.22% 2.26% 18.08% 2.80% N/A 4.51%US Lar Value DFLVX Mar. 1993 7.9% 0.28% 3.54% 22.05% 1.83% 8.41% 9.15%US Vector DFVEX Jan. 2006 11.5% 0.33% 3.60% 18.97% 2.89% N/A 4.28%Real Estate DFREX Jan. 1993 3.6% 0.22% 2.51% 17.48% 5.75% 11.41% 10.06%Int Core DFIEX Oct. 2005 7.2% 0.40% 7.54% 18.74% -2.18% N/A 3.67%Int Small DFISX Oct. 1996 1.2% 0.55% 6.50% 18.86% -0.13% 12.76% 6.49%Int Sm Value DISVX Jan. 1995 3.6% 0.70% 8.71% 22.26% -0.62% 13.49% 7.08%Int Real Estate DFITX Apr. 2007 2.4% 0.42% 7.22% 33.41% -0.87% N/A -3.36%EM Core DFCEX May. 2005 3.8% 0.67% 7.15% 20.48% 1.37% N/A 12.54%EM Mkts Value DFEVX Apr. 1998 2.2% 0.61% 7.08% 19.36% -0.82% 20.02% 13.70%1-Yr Fixed DFIHX Aug. 1983 20.0% 0.17% 0.10% 0.93% 1.72% 2.33% 5.34%2-Yr Global DFGFX Mar. 1996 8.0% 0.18% 0.11% 1.03% 1.94% 2.39% 3.85%5-Yr Global DFGBX Dec. 1990 12.0% 0.28% 0.42% 4.80% 4.56% 3.95% 6.11%
Structured 60/40
AllocationInception
Date
Inception Date
Mutual Fund Expense
Ratio
The Symmetry Structured Portfolios currently invest in the fund allocations listed above.
The model performance information for the Symmetry Structured Portfolios reflects various allocation changes made over time. Beginning in 1999, the Portfolio performance reflects the Symmetry Legacy Models, which held the following funds: DFLCX, DFLVX, DFSCX, DFSVX, DFREX, DFIVX, DFISX, DISVX, DFEMX, DFEVX, DEMSX, DFIHX, DFFGX, DFGFX, DFGBX, and the asset allocation assigned to each fund pursuant to the strategy and structure of the portfolio (i.e., 100% equity, etc.). As of June 1, 2006, Symmetry made changes to the Portfolios and following funds: DFLCX, DFSCX, DFSVX, DFIVX, DFEMX, DEMSX, and DFFGX were replaced by DFQTX, DFVEX, DFCEX, and DFIEX. As of April 1, 2008, Symmetry has added DFITX (International Real Estate Fund) to the Portfolios.
DFA Funds above are no-load institutional fund shares.
The performance information above is past performance. Past performance does not guarantee future results. The investment return and principal value will fluctuate so that an investor’s shares, when redeemed, may be worth more or less than their original cost. Current performance may be lower or higher than the performance data quoted.
Investors will not receive the exact allocations presented above due to a variety of implementation factors, including but not limited to: the custodian or trading platform’s own trading algorithm, any changes in price that take place from the time the positions are calculated to the time they are actually traded. In some cases for certain custodians, positions with small allocations may be eliminated altogether. Calculation of expense ratio does not include cash position.
The holdings comprising the strategies and the allocations to those holdings have changed over time and may change in the future.
Investors should consider the investment objectives, risks, and charges and expenses of the investment company carefully before investing. The prospectus contains this and other information about the investment company. Prospectuses may be obtained from your advisor or from Dimensional Fund Advisors: www.dfaus.com. For the most recent month end performance information, please call Dimensional Fund Advisors at 310-395-8005. Please read the prospectus carefully before investing or sending money. Expense ratios as of the end of the 2011 fiscal year per prospectus dated 2/28/12.
Assets in balance.Assets in balance.
Data Appendix Research conducted by Dimensional Fund Advisors LP. Mutual fund data is from the CRSP Mutual Fund Database, provided by the Center for Research in Security Prices, University of Chicago.
Certain types of equity and fixed income funds were excluded from the performance study. For equities, sector funds and funds with a narrow investment focus, such as real estate and gold, were excluded. Money market funds, municipal bond funds, and asset-backed security funds were excluded from fixed income.
Funds are identified using Lipper fund classification codes and are matched to their respective benchmarks at the beginning of the sample periods. Winner funds are those whose cumulative return over the period exceeded that of their respective benchmark. Loser funds are funds that did not survive the period or whose cumulative return did not exceed their respective benchmark.
Expense ratio ranges — The ranges of expense ratios for equity funds over the one-, five-, and 10-year periods are 0.02% to 4.95%, 0.01% to 4.47%, and 0.02% to 4.43%, respectively. For fixed income funds, ranges over the same periods are 0.02% to 2.61%, 0.03% to 2.56%, and 0.10% to 2.32%, respectively.
Portfolio turnover ranges — Ranges for equity fund turnover over the one-, five-, and 10-year periods are 1% to 1,135%, 1% to 5,062%, and 1% to 2,447%, respectively.
Benchmark data provided by Barclays, MSCI, and Russell. Barclays data provided by Barclays Bank PLC. MSCI data copyright MSCI 2013, all rights reserved. Russell data copyright © Russell Investment Group 1995-2013, all rights reserved.
Benchmark indices are not available for direct investment. Their performance does not reflect the expenses associated with the management of an actual portfolio.
Mutual fund investment values will fluctuate, and shares, when redeemed, may be worth more or less than original cost. Diversification neither assures a profit nor guarantees against a loss in a declining market. Past performance is no guarantee of future results.
For Advisor Use Only.