Embed Size (px)
Citation preview

Portfolio Management
Prof. Ian GiddyNew York University
New York University
Stern School of Business
Copyright ©1998 Ian H. Giddy Portfolio Management 2
Agenda
How to evaluate portfolio performance What portfolio theory tells us
How to put stocks or funds that outperform the market into your “active” portfolio

Copyright ©1998 Ian H. Giddy Portfolio Management 3
Performance evaluation: “the science of attribution”
Example: Why did this taxi take so long?The traffic; the driver; my lousy
instructions? How much should I tip this taxi
driver? Would I use this taxi company
again?
Why Measure Performance?

Copyright ©1998 Ian H. Giddy Portfolio Management 4
Portfolio Performance Evaluation
How well did the portfolio do? How do we adjust for risk, to compare
different managers? Why?
RiskTimingAsset allocationSecurity selection

Copyright ©1998 Ian H. Giddy Portfolio Management 5
Abnormal Performance
What is abnormal?
Performance can be measured against: Benchmark portfolio Market adjusted Market model / index model adjusted Reward to risk measures such as the Sharpe
measure:E (rp-rf) / p

Copyright ©1998 Ian H. Giddy Portfolio Management 6
Performance Evaluation Issues
Theoretically correct measures are difficult to construct
Different statistics or measures are appropriate for different types of investment decisions or portfolios
Many industry and academic measures are different
The nature of active management leads to measurement problems

Copyright ©1998 Ian H. Giddy Portfolio Management 7
Measuring Portfolio Returns
Dollar-weighted return (IRR)
vs Time-weighted return
Arithmetic average
vs Geometric average

Copyright ©1998 Ian H. Giddy Portfolio Management 8
Performance Evaluation Measures
Sharpe’s measureThe portfolio’s average excess return per unit of total risk
Treynor’s measureThe portfolio’s average excess return per unit of systematic
risk
Jensen’s measureThe excess of the portfolio’s return over that predicted by the
CAPM
Appraisal ratioPortfolio’s abnormal return per unit of risk that could be
diversified by holding a market index portfolio

Copyright ©1998 Ian H. Giddy Portfolio Management 9
Performance Evaluation Measures
Sharpe’s measure
Treynor’s measure
Jensen’s measure
Appraisal ratio
( ) /r rP f P
( ) /r rP f P
P r r r rP f P M f [ ( )]
( / ( ) P Pe

Copyright ©1998 Ian H. Giddy Portfolio Management 10
Risk Adjusted Performance: Sharpe
1) Sharpe Index
rp = Average return on the portfolio
rf = Average risk free rate
p= Standard deviation of portfolio
return
( ) /r rP f P

Copyright ©1998 Ian H. Giddy Portfolio Management 11
Risk Adjusted Performance: Treynor
2) Treynor Measure
rp = Average return on the portfolio
rf = Average risk free rate
ßp = Weighted average for portfolio
( ) /r rP f P

Copyright ©1998 Ian H. Giddy Portfolio Management 12
3) 3) Jensen’s Measure
p = Alpha for the portfolio
rrpp = Average return on the portfolio
ßßpp = Weighted average Beta
rrff = Average risk free rate
rrmm = Avg. return on market index port.
Risk Adjusted Performance: Jensen
P r r r rP f P M f [ ( )]

Copyright ©1998 Ian H. Giddy Portfolio Management 13
Which Measure is Appropriate?
It depends on investment assumptions
1) If the portfolio represents the entire investment for an individual, Sharpe Index compared to the Sharpe Index for the market.
2) If many alternatives are possible, use the Jensen or the Treynor measure
The Treynor measure is more complete because it adjusts for risk

Copyright ©1998 Ian H. Giddy Portfolio Management 14
Limitations
Assumptions underlying measures limit their usefulness
When the portfolio is being actively managed, basic stability requirements are not met
Practitioners often use benchmark portfolio comparisons to measure performance

Copyright ©1998 Ian H. Giddy Portfolio Management 15
Factors That Lead to Abnormal Performance
Market timing Superior selection
Sectors or industriesIndividual companies

Copyright ©1998 Ian H. Giddy Portfolio Management 16
Performance Attribution
Decomposing overall performance into components
Components are related to specific elements of performance
Example componentsBroad AllocationIndustrySecurity ChoiceUp and Down Markets
Copyright ©1998 Ian H. Giddy Portfolio Management 17
Performance Attribution
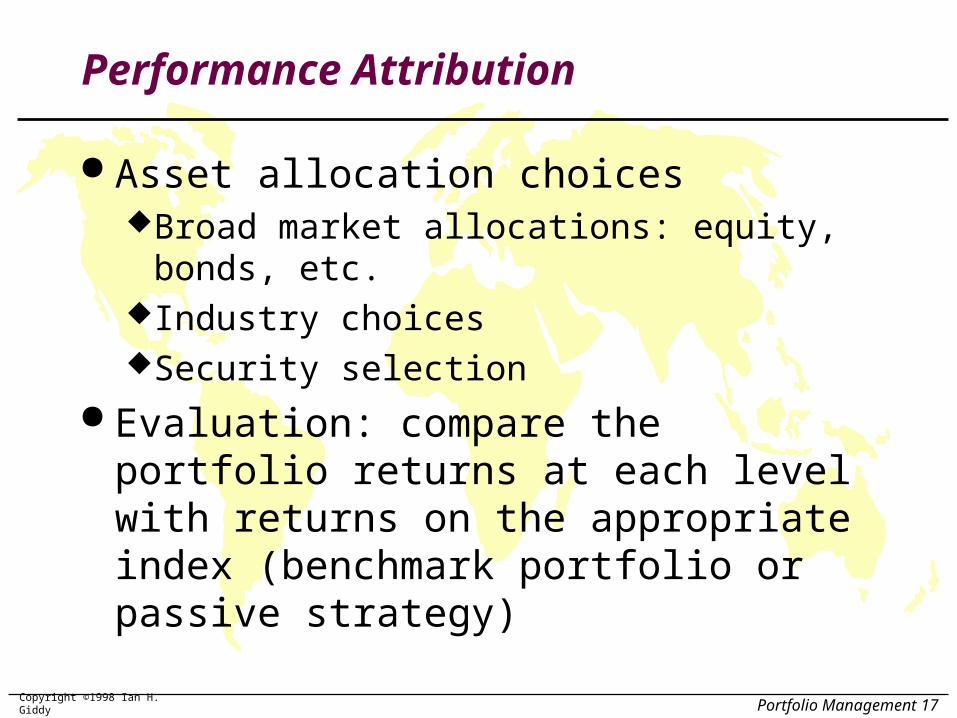
Asset allocation choicesBroad market allocations: equity, bonds,
etc.Industry choicesSecurity selection
Evaluation: compare the portfolio returns at each level with returns on the appropriate index (benchmark portfolio or passive strategy)

Copyright ©1998 Ian H. Giddy Portfolio Management 18
Process of Attributing Performance to Components
Set up a ‘Benchmark’ or ‘Bogey’ portfolio Use indexes for each component Use target weight structure

Copyright ©1998 Ian H. Giddy Portfolio Management 19
Calculate the return on the ‘Bogey’ and on the managed portfolio
Explain the difference in return based on component weights or selection
Summarize the performance differences into appropriate categories
Process of Attributing Performance to Components

Copyright ©1998 Ian H. Giddy Portfolio Management 20
Performance Attribution:1. Excess Return
Excess Return: Managed Portfolio vs Benchmark
ComponentBenchmark Weight
Return of Index during Period Performance
Equity (FUSEX) 60% 5.81% 3.49%Bonds (VUSTX) 30% 1.45% 0.44%Cash 10% 0.48% 0.05%
Bogey (Benchmark Portfolio) Return 3.97%Return of Managed Portfolio 5.34%Excess return of managed portfolio 1.37%

Copyright ©1998 Ian H. Giddy Portfolio Management 21
Performance Attribution:2. Asset Allocation
Contribution of Asset Allocation to Performance
(1) (2) (3) (4) (3)x(4)
Component
Managed Portfolio Weights
Benchmark Portfolio Weights
Excess Weight
Component Return minus Total Benchmark Return
Contribution to Performance
Equity 70% 60% 10% 1.84% 0.184%Bonds 7% 30% -23% -2.52% 0.579%Cash 23% 10% 13% -3.49% -0.454%
Contribution of Asset Allocation 0.310%

Copyright ©1998 Ian H. Giddy Portfolio Management 22
Performance Attribution:3. Security Selection
Contribution of Security Selection to Performance
(1) (2) (3) (4) (3)x(4)
Component
Managed Portfolio Performance
Component Index Performance
Excess Performance
Managed Portfolio Weight
Contribution to Performance
Equity 7.28% 5.81% 1.47% 70.00% 1.029%Bonds 1.89% 1.45% 0.44% 7.00% 0.031%Cash 0.48% 0.48% 0.00% 23.00% 0.000%
Contribution of Security Selection 1.060%

Copyright ©1998 Ian H. Giddy Portfolio Management 23
Performance Attribution:4. Summary
Portfolio Attribution Summary
Contribution1 Asset Allocation 0.310%2 Selection
1 Equity excess return 1.029%2 Bonds excess return 0.031%3 Cash excess return 0.000% 1.060%
Total excess return on portfolio 1.370%
Portfolio Attribution Summary
Contribution1 Asset Allocation 0.310%2 Selection
1 Equity excess return 1.029%2 Bonds excess return 0.031%3 Cash excess return 0.000% 1.060%
Total excess return on portfolio 1.370%
Source: http://www.stern.nyu.edu/~igiddy/performance.xls

Copyright ©1998 Ian H. Giddy Portfolio Management 24
Active Portfolio Management
Stock-picking and active portfolio management must pay, else the market would not be efficient!
The optimal risky portfolio maximizes the reward-to-variability ratio; the slope of the CAL:
PASSIVE
CAPITAL ALLOCATON LINE
ACTIVE
CAPITAL ALLOCATON LINEE(rp)

Copyright ©1998 Ian H. Giddy Portfolio Management 25
Lure of Active Management
Are markets totally efficient? Some managers outperform the market for extended
periods While the abnormal performance may not be too
large, it is too large to be attributed solely to noise Evidence of anomalies such as the turn of the year
exist
The evidence suggests that there is some role for active management

Copyright ©1998 Ian H. Giddy Portfolio Management 26
Market Timing
Adjusting portfolio for up and down movements in the market
Low Market Return - low ßeta High Market Return - high ßeta
Copyright ©1998 Ian H. Giddy Portfolio Management 27
Market Timing
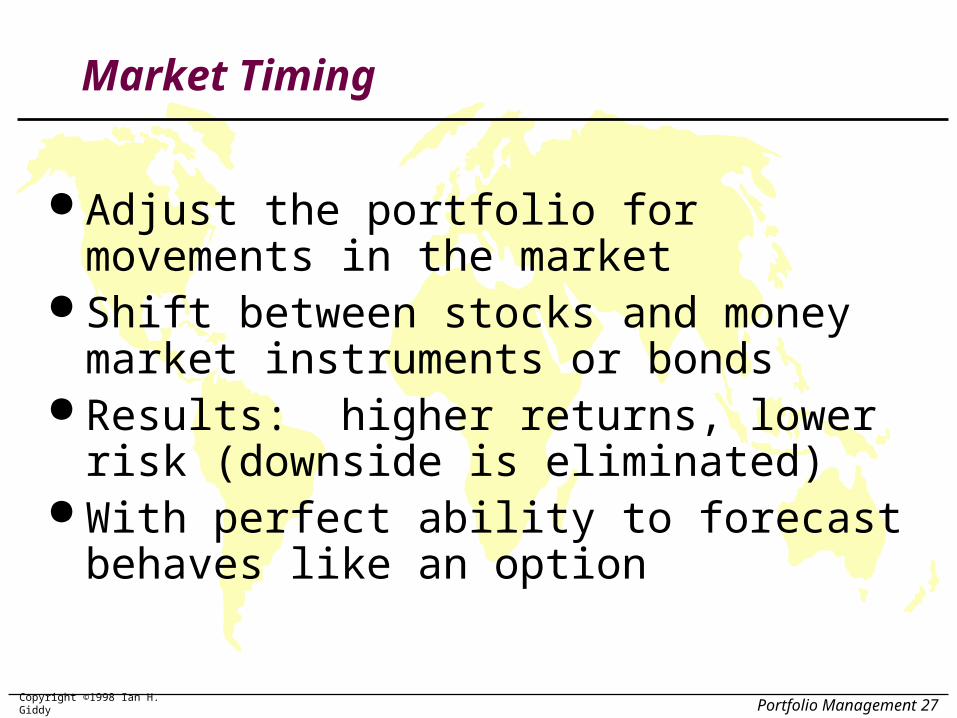
Adjust the portfolio for movements in the market
Shift between stocks and money market instruments or bonds
Results: higher returns, lower risk (downside is eliminated)
With perfect ability to forecast behaves like an option

Copyright ©1998 Ian H. Giddy Portfolio Management 28
Example of Market Timing
**
****
**
**
**
**
**
**
****
****
******
******
****
****
rrpp - r - rff
rrmm - r - rff
Steadily Increasing the BetaSteadily Increasing the Beta

Copyright ©1998 Ian H. Giddy Portfolio Management 29
Market Timing: An Option on the S&P
Value of perfect timing is a call option worth C
Timing ability measured by PBull+ PBear-1
Value of timing ability is (PBull+ PBear -1)C
P = the proportion of correct forecasts
rf
rfrM

Copyright ©1998 Ian H. Giddy Portfolio Management 30
rrff
rrff
rrMM
Rate of Return of a Perfect Market Timer

Copyright ©1998 Ian H. Giddy Portfolio Management 31
YearYear7171727273737474757576767777787879798080
Stock Ret.Stock Ret..1431 .1431 .1898 .1898
-.1466 -.1466 -.2647 -.2647 .3720 .3720 .2384 .2384
-.0718 -.0718 .0656 .0656 .1844 .1844 .3242 .3242
T-Bill RetT-Bill Ret.0439.0439.0384.0384.0693.0693.0800.0800.0580.0580.0508.0508.0512.0512.0718.0718.1038.1038.1124.1124
Avg. Ret.Avg. Ret.S.D. Ret.S.D. Ret.
.1034.1034
.2068.2068.0680.0680.0248.0248
Returns on Stocks and Bills

Copyright ©1998 Ian H. Giddy Portfolio Management 32
With Perfect Forecasting Ability
Switch to T-Bills in ‘73, ‘74, ‘77, ‘78 No negative returns or losses Average Ret. = .1724 S.D. Ret. = .1118 Results with perfect timing
70% increase in mean return46% lower S.D.

Copyright ©1998 Ian H. Giddy Portfolio Management 33
With Imperfect Ability to Forecast
Long horizon to judge the ability Judge proportions of correct calls Bull markets and bear market calls

Copyright ©1998 Ian H. Giddy Portfolio Management 34
Conclusion: Hold Three Things
Risk-free asset Passive portfolio Active portfolio

Copyright ©1998 Ian H. Giddy Portfolio Management 35
Superior Selection Ability
Concentrate funds in undervalued stocks or undervalued sectors or industries
Balance funds in an active portfolio and in a passive portfolio
Active selection will mean some unsystematic risk

Copyright ©1998 Ian H. Giddy Portfolio Management 36
Sharpe’s Ratio
PASSIVE CAL
ACTIVE CALE(rp)
SE r rP f
P
( )
Used to guage performance of professional portfolios

Copyright ©1998 Ian H. Giddy Portfolio Management 37
Treynor-Black Model
Model used to combine actively managed stocks with a passively managed portfolio
Using a reward-to-risk measure that is similar to the the Sharpe Measure, the optimal combination of active and passive portfolios can be determined

Copyright ©1998 Ian H. Giddy Portfolio Management 38
Security Selection
Alpha is the expected return on a security above that explained by its beta and the security market line:
Treynor-Black model says weight of each security should be based on ratio of its mispricing to its nonsystematic risk:
r r r r ei i f i M f i ( )
i
i ie2 ( )

Copyright ©1998 Ian H. Giddy Portfolio Management 39
Treynor-Black Model: Assumptions
Analysts will have a limited ability to find a select number of undervalued securities
Portfolio managers can estimate the expected return and risk, and the abnormal performance for the actively-managed portfolio
Portfolio managers can estimate the expected risk and return parameters for a broad market (passively managed) portfolio

Copyright ©1998 Ian H. Giddy Portfolio Management 40
Reward to Variability Measures
Passive Portfolio Passive Portfolio ::
S2m = [E(rm) - rf
m]2

Copyright ©1998 Ian H. Giddy Portfolio Management 41
Appraisal RatioAppraisal Ratio
AA
AA = Alpha for the active portfolio= Alpha for the active portfolio
(ep)
(Ap)(Ap) = Unsystematic standard= Unsystematic standard deviation for activedeviation for active
Reward to Variability Measures
Copyright ©1998 Ian H. Giddy Portfolio Management 42
Reward to Variability Measures
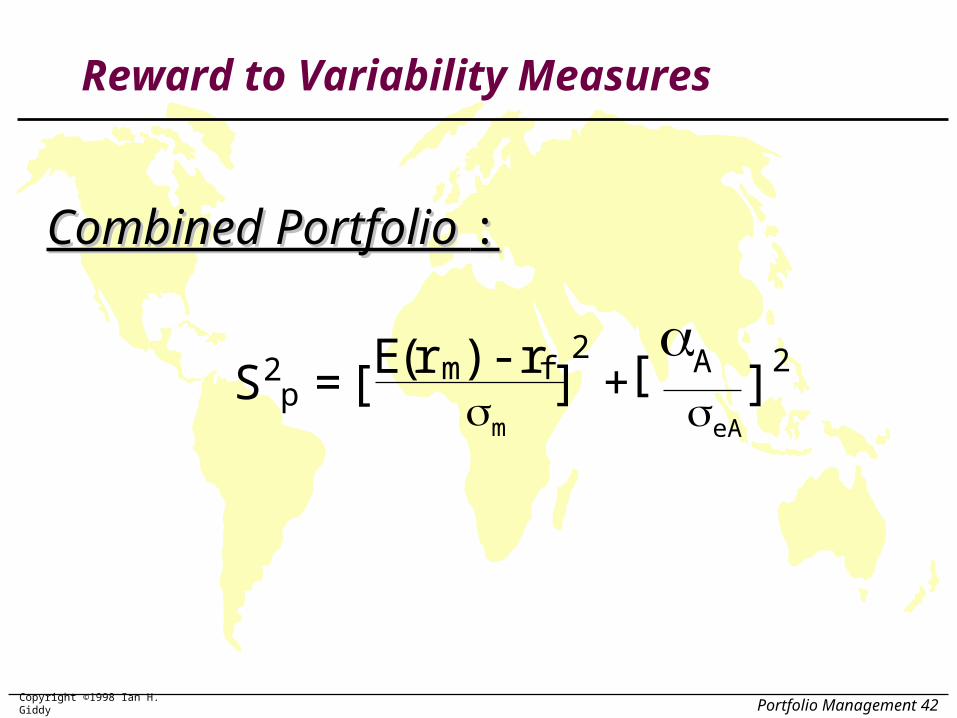
Combined Portfolio Combined Portfolio ::
S2p = [E(rm) - rf
m
]2 + eA
[ A]
2

Copyright ©1998 Ian H. Giddy Portfolio Management 43
Market Portfolio
Active Portfolio
E(r)E(r)
CMLCMLCALCAL
Rf
Treynor-Black Allocation
Optimal Portfolio

Copyright ©1998 Ian H. Giddy Portfolio Management 44
Implementing the Treynor-Black Approach
Use passive portfolio (index fund) as baseline; find its E(rM) and E(VarM)
Analyze a few securities; find mispriced ones
For each security, use estimates of Alpha, Beta and residual risk to determine optimum weights
Determine optimal weights for active and passive portfolios

Copyright ©1998 Ian H. Giddy Portfolio Management 45
Summary Points: Treynor-Black Model
Sharpe Measure will increase with added ability to pick stocks
Slope of CAL>CML
(rp-rf)/p > (rm-rf)/p
P is the portfolio that combines the passively managed portfolio with the actively managed portfolio
The combined efficient frontier has a higher return for the same level of risk

Copyright ©1998 Ian H. Giddy Portfolio Management 46
Summary
How to evaluate portfolio performance How to put stocks or funds that
outperform the market into your “active” portfolio
Portfolio theory helps construct the right active/passive/riskfree mix.

Copyright ©1998 Ian H. Giddy Portfolio Management 50
Ian Giddy
Ian H. Giddy
NYU Stern School of Business
Tel 212-998-0332; Fax 212-995-4233
http://giddy.org