Embed Size (px)
Citation preview
Giddy/SIM Financial Risk Management/1
Prof. Ian GiddyNew York University
Financial Risk Management
SIM/NYUThe Job of the CFO
Copyright ©2001 Ian H. Giddy Financial Risk Management -5giddy.org
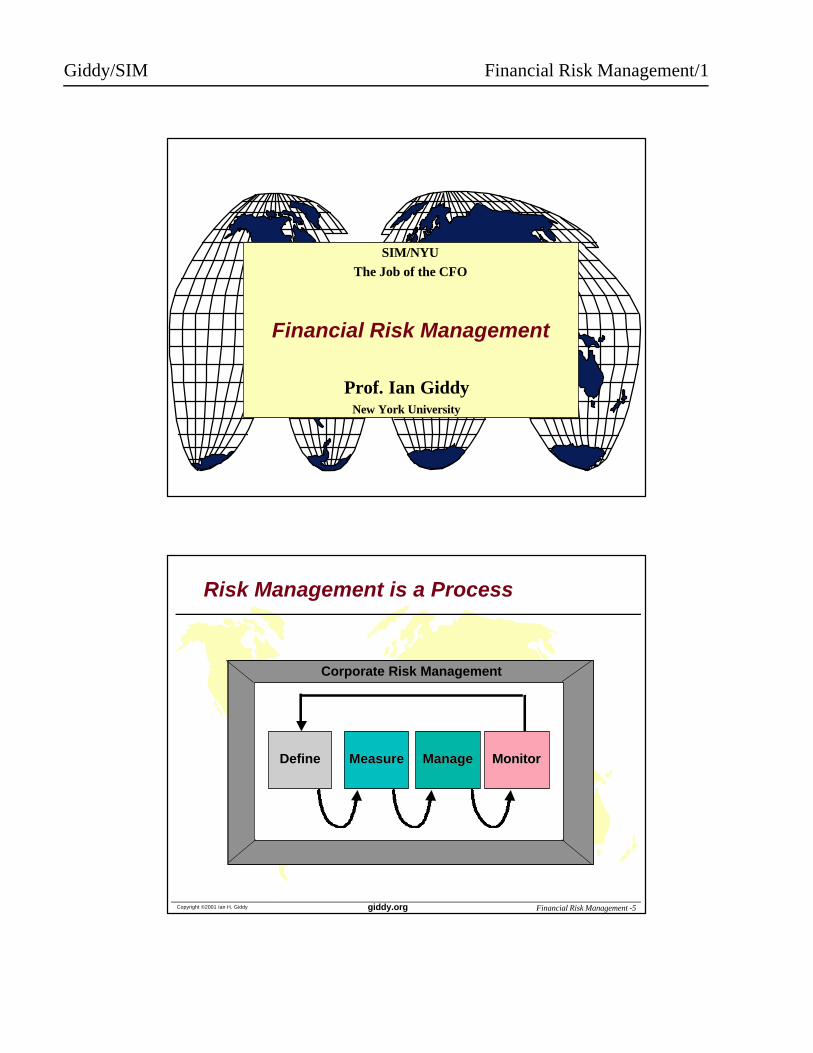
Risk Management is a Process
Corporate Risk Management
DefineDefine MeasureMeasure ManageManage MonitorMonitor
Giddy/SIM Financial Risk Management/2
Copyright ©2001 Ian H. Giddy Financial Risk Management -6giddy.org
Financial Risk Management
l Why does it matter?
l Why and when should we hedge?
l What should we hedge? How should we gauge exposure?
l Financial risk management must be tied to the company’s business
Copyright ©2001 Ian H. Giddy Financial Risk Management -7giddy.org
The Case For Hedging
l Company has special information
l Company has special market access
l Secure cash for investment opportunities
l Reduce potential costs of financial distress, increase debt capacity, and reduce expected taxes
Since currency matching reduces the probability of financial distress, it allows the firm to have greater leverage and therefore a greater tax shield.
Giddy/SIM Financial Risk Management/3
Copyright ©2001 Ian H. Giddy Financial Risk Management -8giddy.org
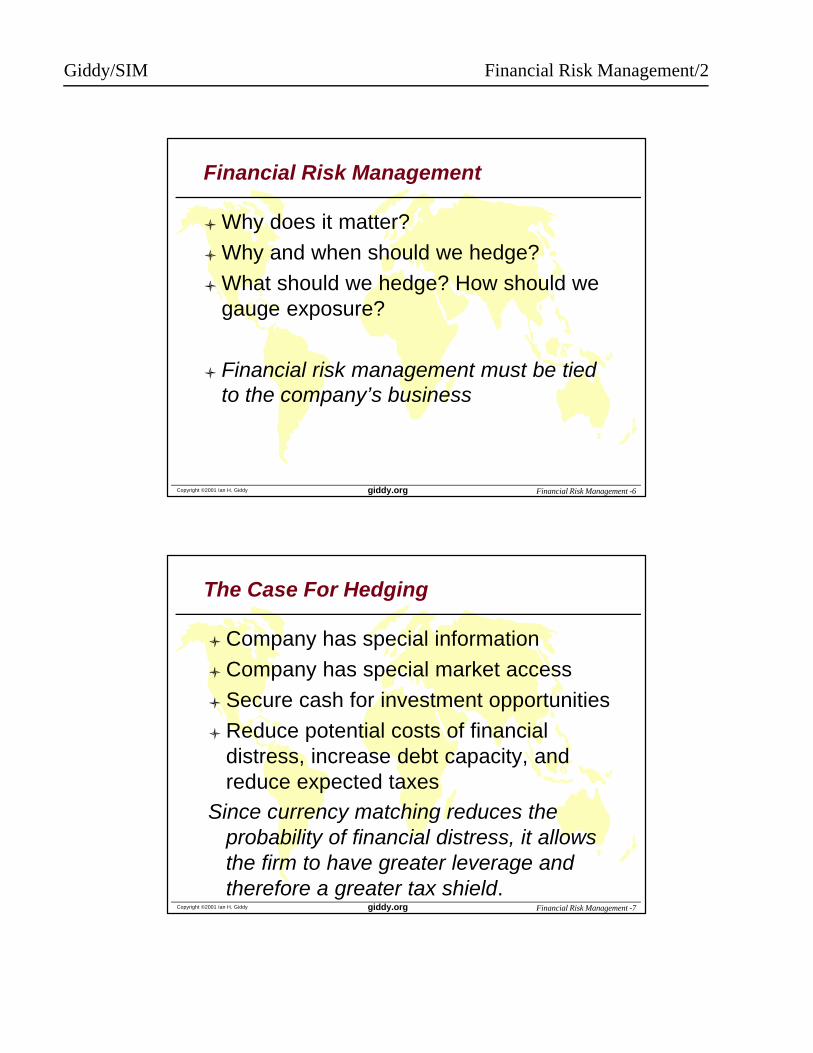
VALUE OF THE FIRM
ALL-EQUITY VALUE
DEBTRATIO
HEDGING CANREDUCE COSTS OF FINANCIALDISTRESS
Optimal Capital Structure
Copyright ©2001 Ian H. Giddy Financial Risk Management -9giddy.org
Negativenet worth
Positivenet worth
Distribution of net worth withhedging
Distribution of net worthwithout hedging (or withgreater exchange ratevolatility)
Profile of return to creditors
Costs of bankruptcy to creditors
Net worth of the firm
+
-
Hedging, Valuation, Taxes and Financial Distress
Giddy/SIM Financial Risk Management/4
Copyright ©2001 Ian H. Giddy Financial Risk Management -10giddy.org
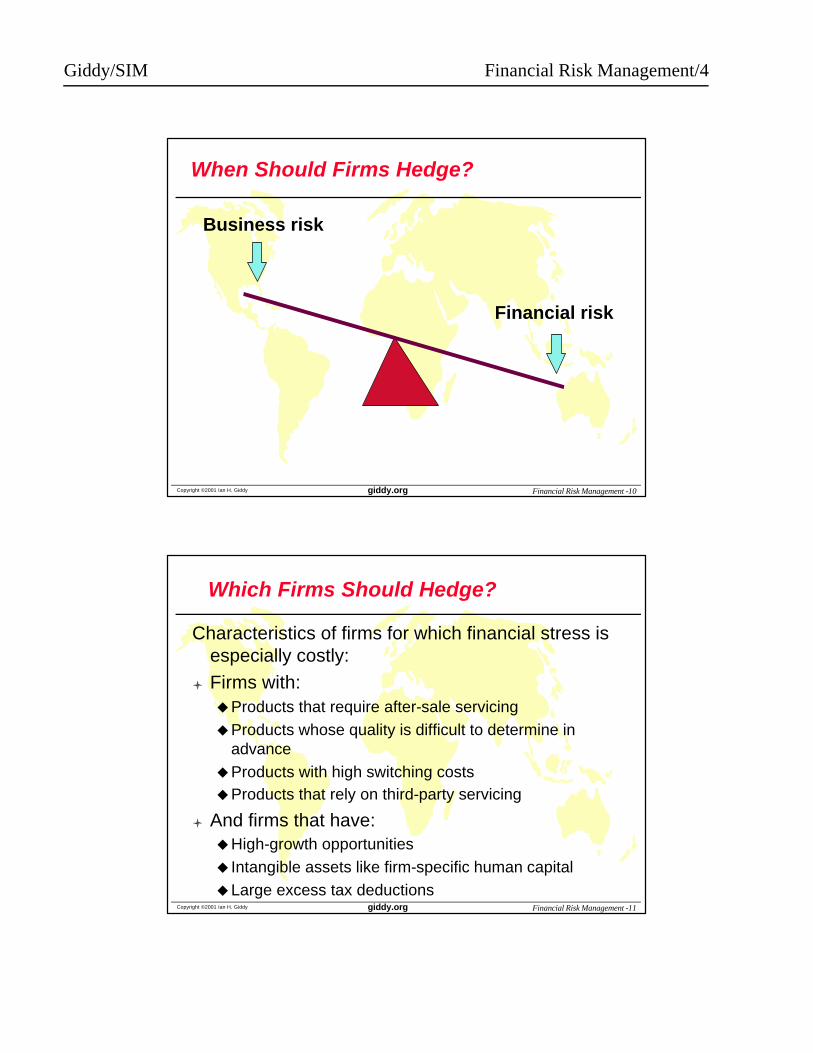
When Should Firms Hedge?
Business risk
Financial risk
Copyright ©2001 Ian H. Giddy Financial Risk Management -11giddy.org
Which Firms Should Hedge?
Characteristics of firms for which financial stress is especially costly:
l Firms with:uProducts that require after-sale servicinguProducts whose quality is difficult to determine in
advanceuProducts with high switching costsuProducts that rely on third-party servicing
l And firms that have:uHigh-growth opportunitiesu Intangible assets like firm-specific human capitaluLarge excess tax deductions
Giddy/SIM Financial Risk Management/5
Copyright ©2001 Ian H. Giddy Financial Risk Management -12giddy.org
What Exposure Should Firms Hedge?
lCurrency riskuTransactions
uTranslation exposure
uEconomic exposure
uInterest Rate RiskuCommodity Price Risk
Copyright ©2001 Ian H. Giddy Financial Risk Management -13giddy.org
Measuring Market Exposure
l Defining corporate exposure:
“How will my company’s value be affected by market price fluctuations?”
l Types of exposureuTransactions
uBalance sheet/portfolio
uEconomic
l A risk management framework
Giddy/SIM Financial Risk Management/6
Copyright ©2001 Ian H. Giddy Financial Risk Management -14giddy.org
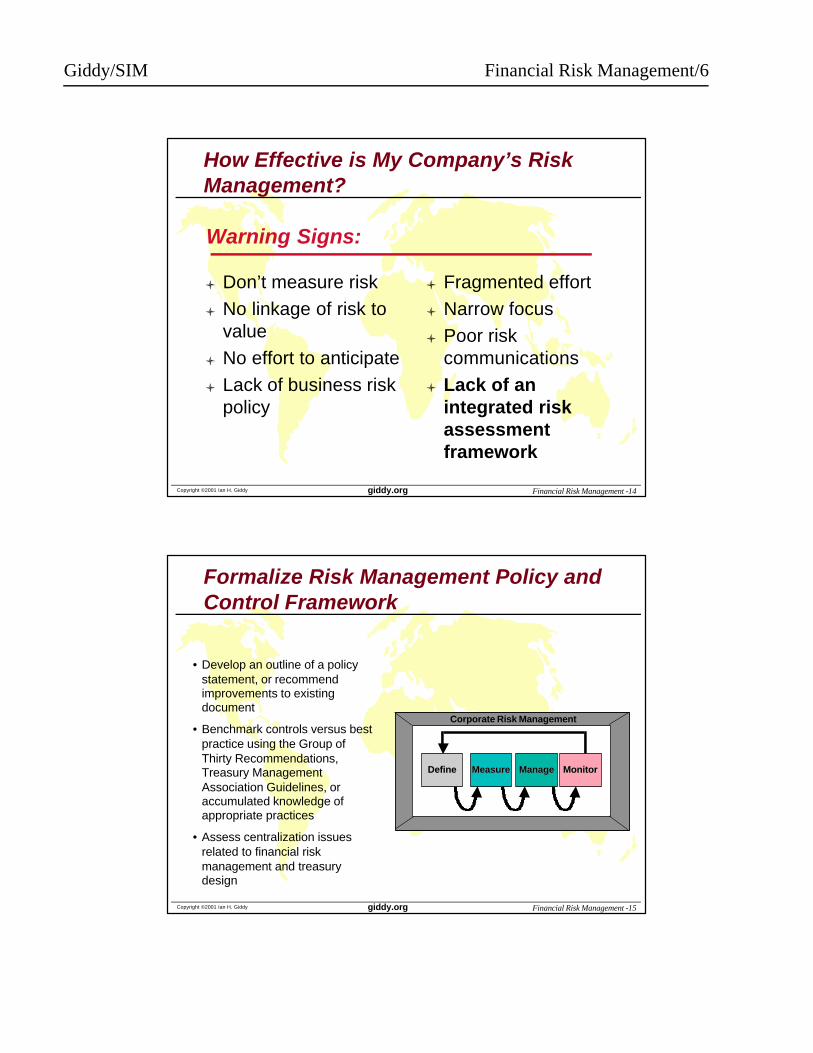
How Effective is My Company’s Risk Management?
l Don’t measure risk
l No linkage of risk to value
l No effort to anticipate
l Lack of business risk policy
l Fragmented effort
l Narrow focus
l Poor risk communications
l Lack of an integrated risk assessment framework
Warning Signs:
Copyright ©2001 Ian H. Giddy Financial Risk Management -15giddy.org
Formalize Risk Management Policy and Control Framework
Corporate Risk Management
DefineDefine MeasureMeasure ManageManage MonitorMonitor
• Develop an outline of a policy statement, or recommend improvements to existing document
• Benchmark controls versus best practice using the Group of Thirty Recommendations, Treasury Management Association Guidelines, or accumulated knowledge of appropriate practices
• Assess centralization issues related to financial risk management and treasury design
Giddy/SIM Financial Risk Management/7
Copyright ©2001 Ian H. Giddy Financial Risk Management -16giddy.org
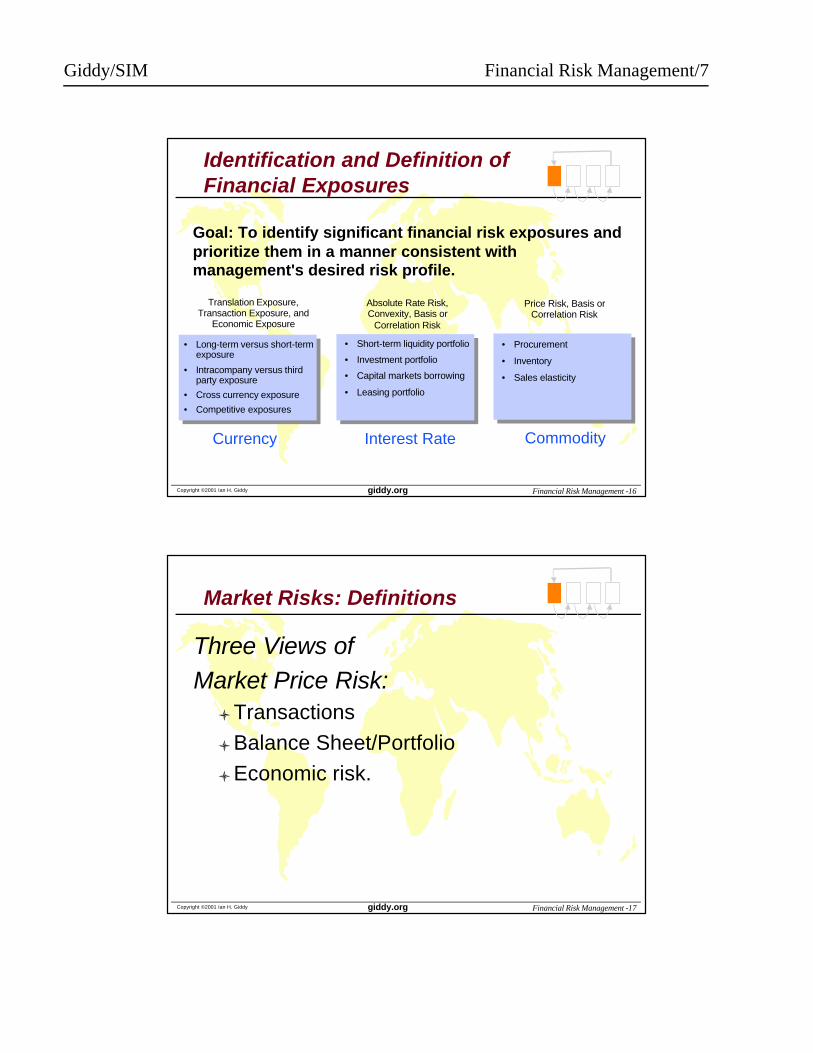
Identification and Definition of Financial Exposures
Goal: To identify significant financial risk exposures and prioritize them in a manner consistent with management's desired risk profile.
Translation Exposure, Transaction Exposure, and
Economic Exposure
• Long-term versus short-term exposure
• Intracompany versus third party exposure
• Cross currency exposure
• Competitive exposures
Absolute Rate Risk, Convexity, Basis or
Correlation Risk
Currency Interest Rate
• Short-term liquidity portfolio
• Investment portfolio
• Capital markets borrowing
• Leasing portfolio
Price Risk, Basis or Correlation Risk
Commodity
• Procurement
• Inventory
• Sales elasticity
Copyright ©2001 Ian H. Giddy Financial Risk Management -17giddy.org
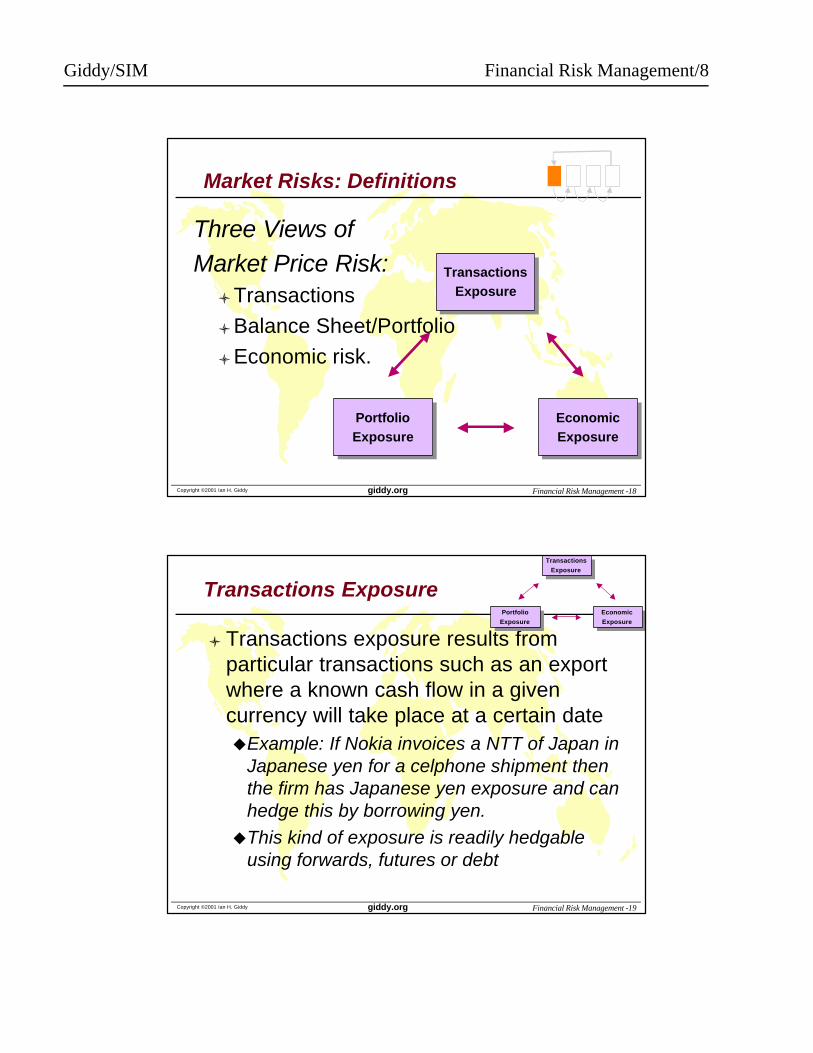
Market Risks: Definitions
Three Views ofMarket Price Risk:
lTransactions
lBalance Sheet/Portfolio
lEconomic risk.
Giddy/SIM Financial Risk Management/8
Copyright ©2001 Ian H. Giddy Financial Risk Management -18giddy.org
Market Risks: Definitions
Three Views ofMarket Price Risk:
lTransactions
lBalance Sheet/Portfolio
lEconomic risk.
TransactionsExposure
TransactionsExposure
PortfolioExposure
PortfolioExposure
EconomicExposure
EconomicExposure
Copyright ©2001 Ian H. Giddy Financial Risk Management -19giddy.org
Transactions Exposure
l Transactions exposure results from particular transactions such as an export where a known cash flow in a given currency will take place at a certain dateuExample: If Nokia invoices a NTT of Japan in
Japanese yen for a celphone shipment then the firm has Japanese yen exposure and can hedge this by borrowing yen.
uThis kind of exposure is readily hedgableusing forwards, futures or debt
Transactions
Exposure
Transactions
Exposure
Portfolio
Exposure
Portfolio
ExposureEconomic
Exposure
Economic
Exposure
Giddy/SIM Financial Risk Management/9
Copyright ©2001 Ian H. Giddy Financial Risk Management -20giddy.org
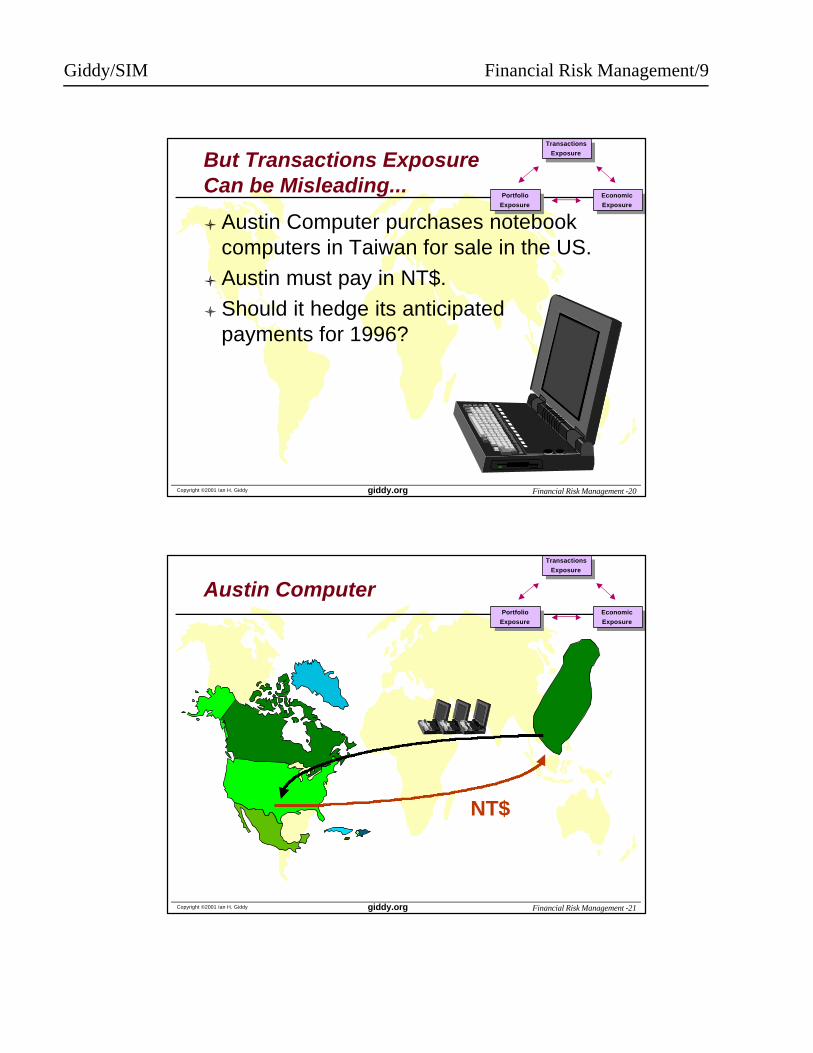
But Transactions Exposure Can be Misleading...
l Austin Computer purchases notebook computers in Taiwan for sale in the US.
l Austin must pay in NT$.
l Should it hedge its anticipated payments for 1996?
Transactions
Exposure
Transactions
Exposure
Portfolio
Exposure
Portfolio
ExposureEconomic
Exposure
Economic
Exposure
Copyright ©2001 Ian H. Giddy Financial Risk Management -21giddy.org
Austin Computer
NT$
Transactions
Exposure
Transactions
Exposure
Portfolio
Exposure
Portfolio
ExposureEconomic
Exposure
Economic
Exposure
Giddy/SIM Financial Risk Management/10
Copyright ©2001 Ian H. Giddy Financial Risk Management -22giddy.org
Interest Rate Risk:Portfolio
l Portfolio risk: interest rate fluctuations can affect the value of a bond investment portfolio
l Bond price fluctuations will affect the balance sheet
l Can be hedged, using duration as a risk/sensitivity measurement tool
l Can be hedged with futures, bond options, and swaps.
Transactions
Exposure
Transactions
Exposure
Portfolio
Exposure
Portfolio
ExposureEconomic
Exposure
Economic
Exposure
Copyright ©2001 Ian H. Giddy Financial Risk Management -23giddy.org
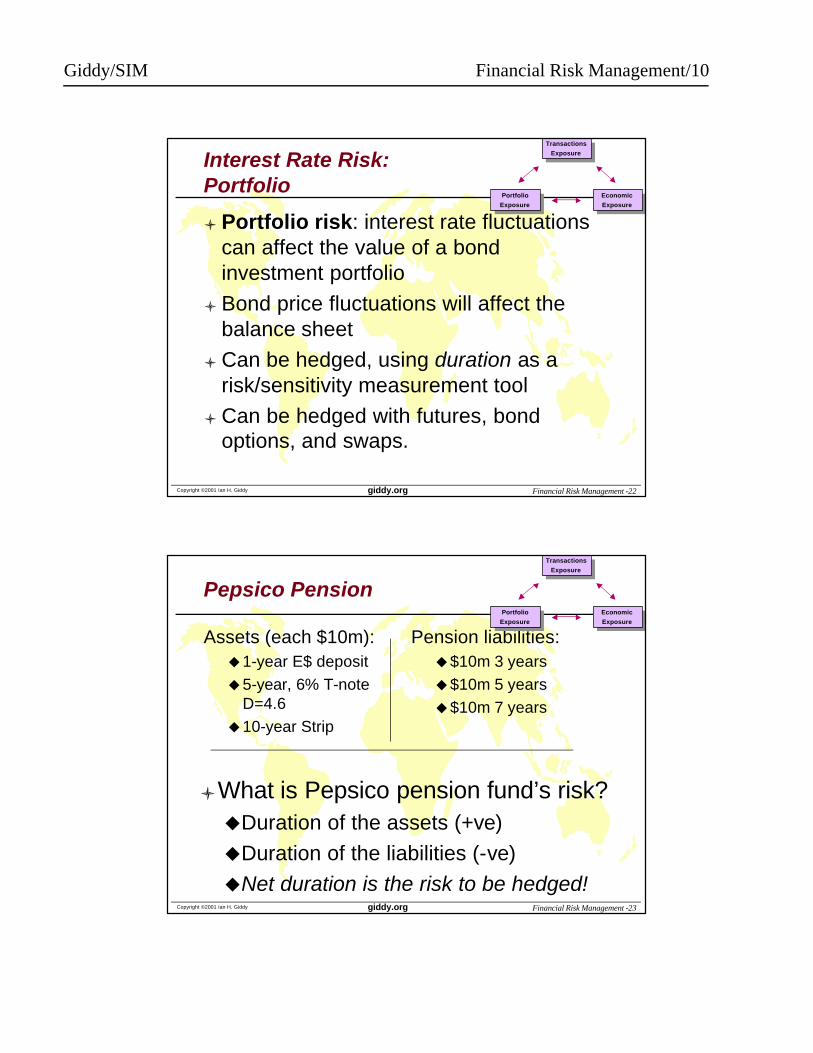
Pepsico Pension
Assets (each $10m):u1-year E$ depositu5-year, 6% T-note
D=4.6u10-year Strip
Pension liabilities:u$10m 3 yearsu$10m 5 yearsu$10m 7 years
lWhat is Pepsico pension fund’s risk? uDuration of the assets (+ve)
uDuration of the liabilities (-ve)
uNet duration is the risk to be hedged!
Transactions
Exposure
Transactions
Exposure
Portfolio
Exposure
Portfolio
ExposureEconomic
Exposure
Economic
Exposure
Giddy/SIM Financial Risk Management/11
Copyright ©2001 Ian H. Giddy Financial Risk Management -24giddy.org
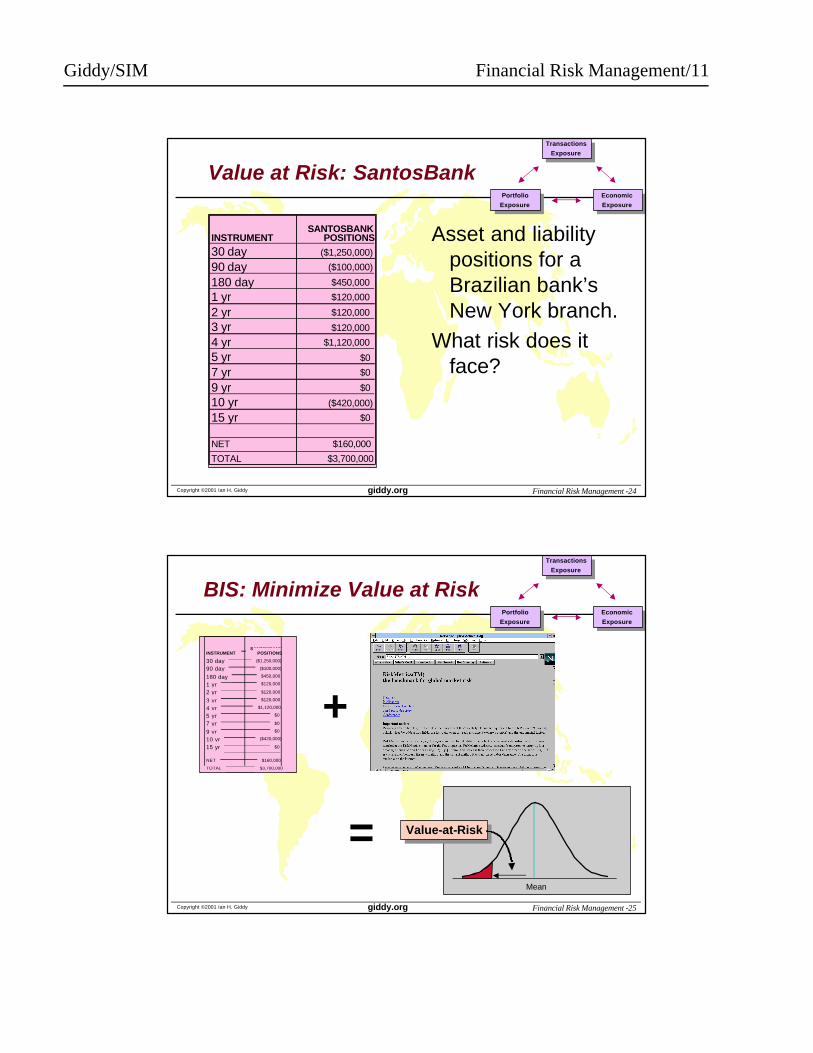
Value at Risk: SantosBank
Asset and liability positions for a Brazilian bank’s New York branch.
What risk does it face?
INSTRUMENTSANTOSBANK
POSITIONS
30 day ($1,250,000)
90 day ($100,000)
180 day $450,000
1 yr $120,000
2 yr $120,000
3 yr $120,000
4 yr $1,120,000
5 yr $0
7 yr $0
9 yr $0
10 yr ($420,000)
15 yr $0
NET $160,000
TOTAL $3,700,000
Transactions
Exposure
Transactions
Exposure
Portfolio
Exposure
Portfolio
ExposureEconomic
Exposure
Economic
Exposure
Copyright ©2001 Ian H. Giddy Financial Risk Management -25giddy.org
BIS: Minimize Value at RiskTransactions
Exposure
Transactions
Exposure
Portfolio
Exposure
Portfolio
ExposureEconomic
Exposure
Economic
Exposure
Mean
Value-at-RiskValue-at-Risk
INSTRUMENTSANTOSBANK
POSITIONS
30 day ($1,250,000)
90 day ($100,000)
180 day $450,000
1 yr $120,000
2 yr $120,000
3 yr $120,000
4 yr $1,120,000
5 yr $0
7 yr $0
9 yr $0
10 yr ($420,000)
15 yr $0
NET $160,000
TOTAL $3,700,000
+
=
Giddy/SIM Financial Risk Management/12
Copyright ©2001 Ian H. Giddy Financial Risk Management -26giddy.org
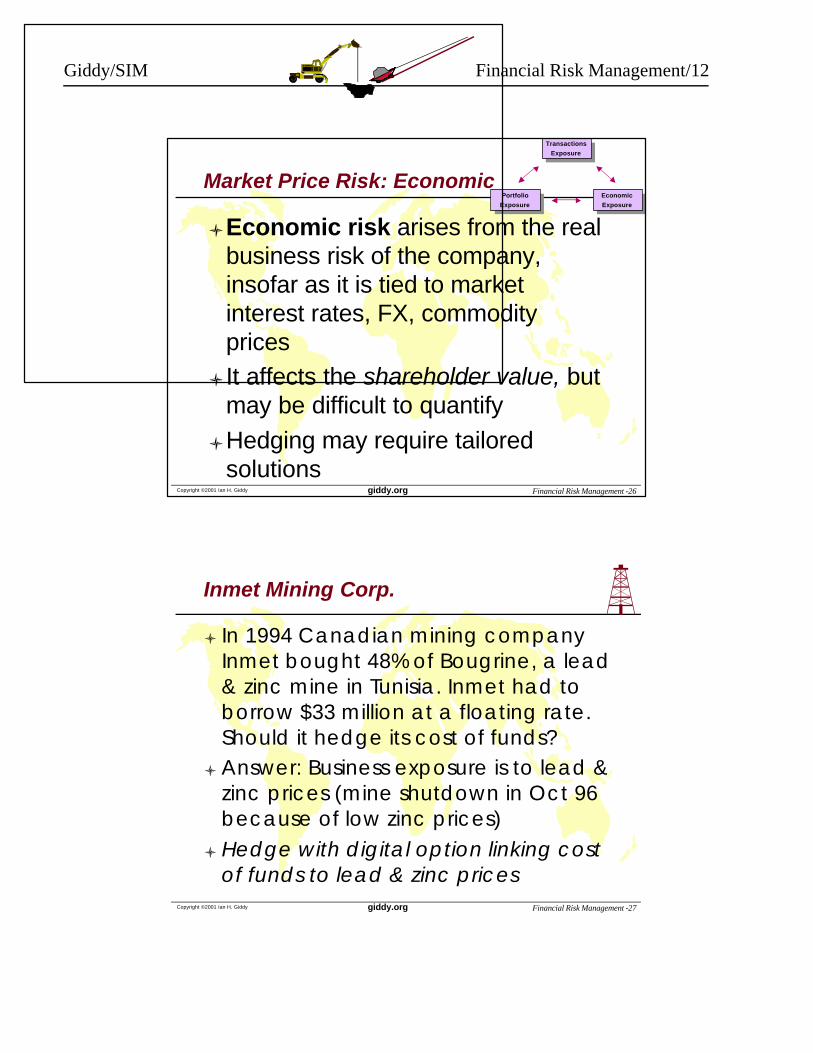
Market Price Risk: Economic
lEconomic risk arises from the real business risk of the company, insofar as it is tied to market interest rates, FX, commodity prices
lIt affects the shareholder value, but may be difficult to quantify
lHedging may require tailored solutions
Transactions
Exposure
Transactions
Exposure
Portfolio
Exposure
Portfolio
ExposureEconomic
Exposure
Economic
Exposure
Copyright ©2001 Ian H. Giddy Financial Risk Management -27giddy.org
Inmet Mining Corp.
l In 1994 Canadian mining companyInmet bought 48% of Bougrine, a lead & zinc mine in Tunisia. Inmet had to borrow $33 million at a floating rate. Should it hedge its cost of funds?
l Answer: Business exposure is to lead & zinc prices (mine shutdown in Oct 96 because of low zinc prices)
l Hedge with digital option linking cost of funds to lead & zinc prices
Giddy/SIM Financial Risk Management/13
Copyright ©2001 Ian H. Giddy Financial Risk Management -28giddy.org
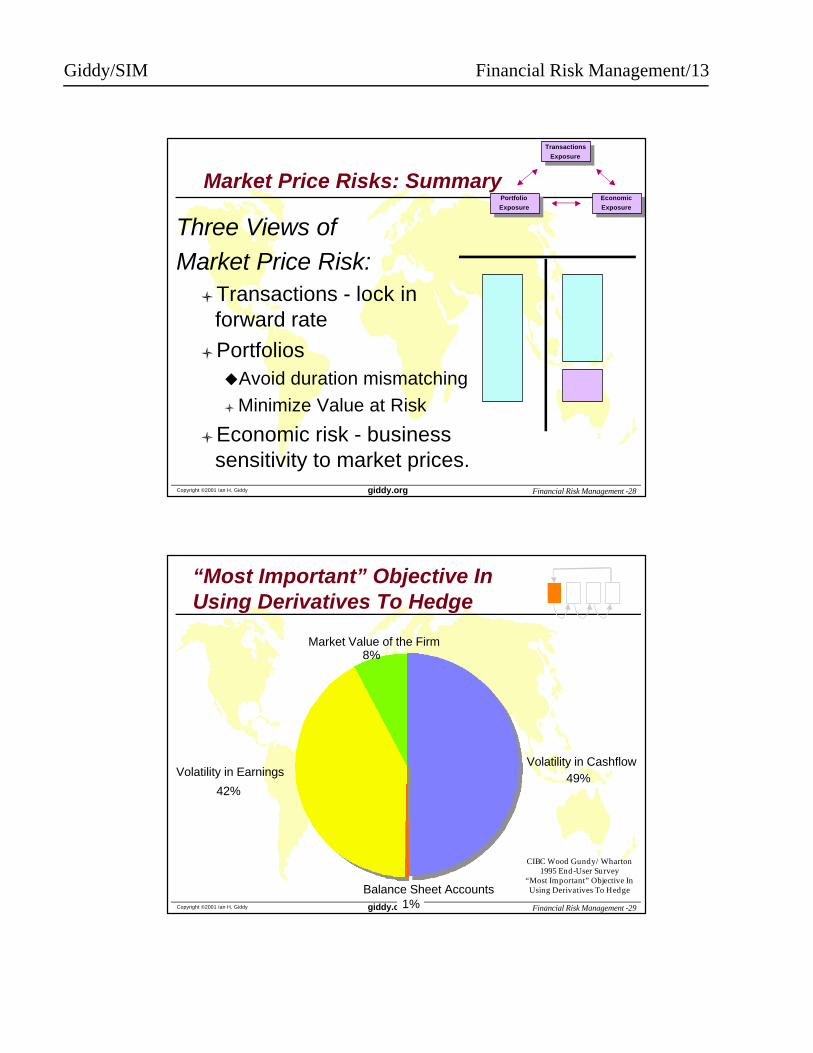
Market Price Risks: Summary
Three Views ofMarket Price Risk:
lTransactions - lock in forward rate
lPortfoliosuAvoid duration mismatching
l Minimize Value at Risk
lEconomic risk - business sensitivity to market prices.
Transactions
Exposure
Transactions
Exposure
Portfolio
Exposure
Portfolio
ExposureEconomic
Exposure
Economic
Exposure
Copyright ©2001 Ian H. Giddy Financial Risk Management -29giddy.org
Volatility in Cashflow49%
Balance Sheet Accounts1%
Volatility in Earnings
42%
Market Value of the Firm8%
“Most Important” Objective InUsing Derivatives To Hedge
CIBC Wood Gundy/Wharton 1995 End-User Survey
“Most Important” Objective In Using Derivatives To Hedge
Giddy/SIM Financial Risk Management/14
Copyright ©2001 Ian H. Giddy Financial Risk Management -30giddy.org
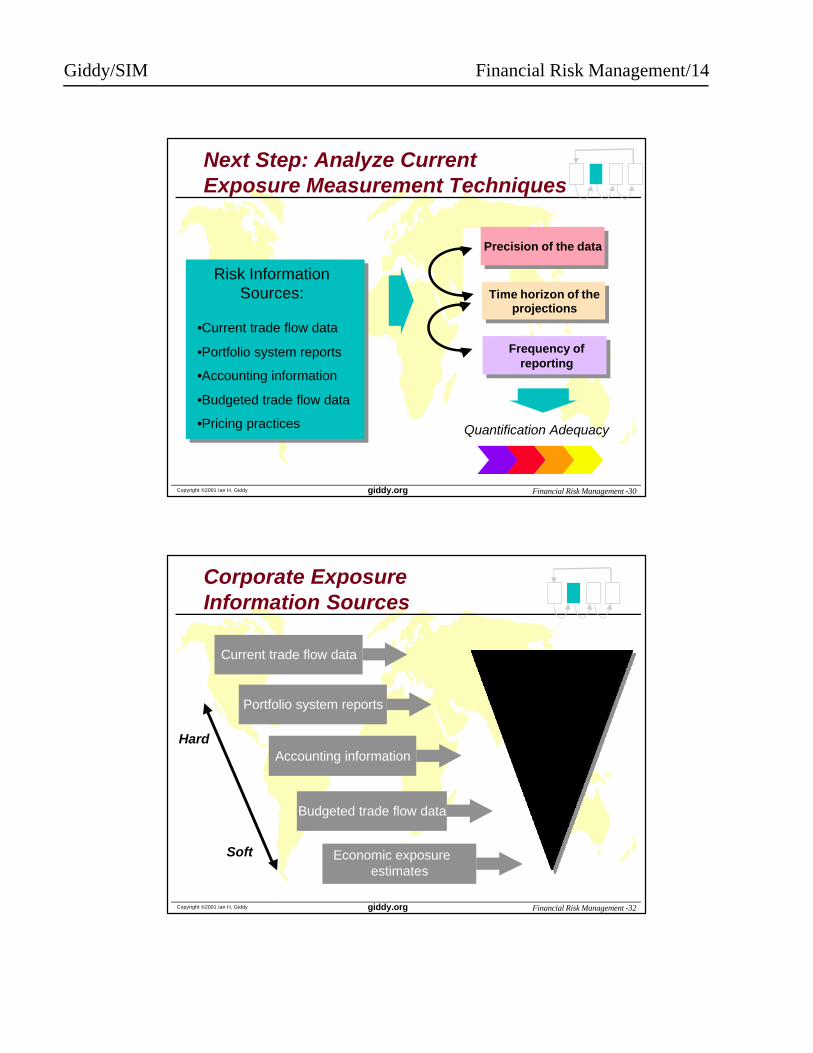
Next Step: Analyze Current Exposure Measurement Techniques
Precision of the dataPrecision of the data
Time horizon of the projections
Frequency of reporting
•Current trade flow data
•Portfolio system reports
•Accounting information
•Budgeted trade flow data
•Pricing practices
Risk Information Sources:
Quantification Adequacy
Copyright ©2001 Ian H. Giddy Financial Risk Management -32giddy.org
Corporate Exposure Information Sources
Current trade flow data
Portfolio system reports
Accounting information
Budgeted trade flow data
Economic exposure estimates
Hard
Soft
ExposureDatabase
Giddy/SIM Financial Risk Management/15
Copyright ©2001 Ian H. Giddy Financial Risk Management -33giddy.org
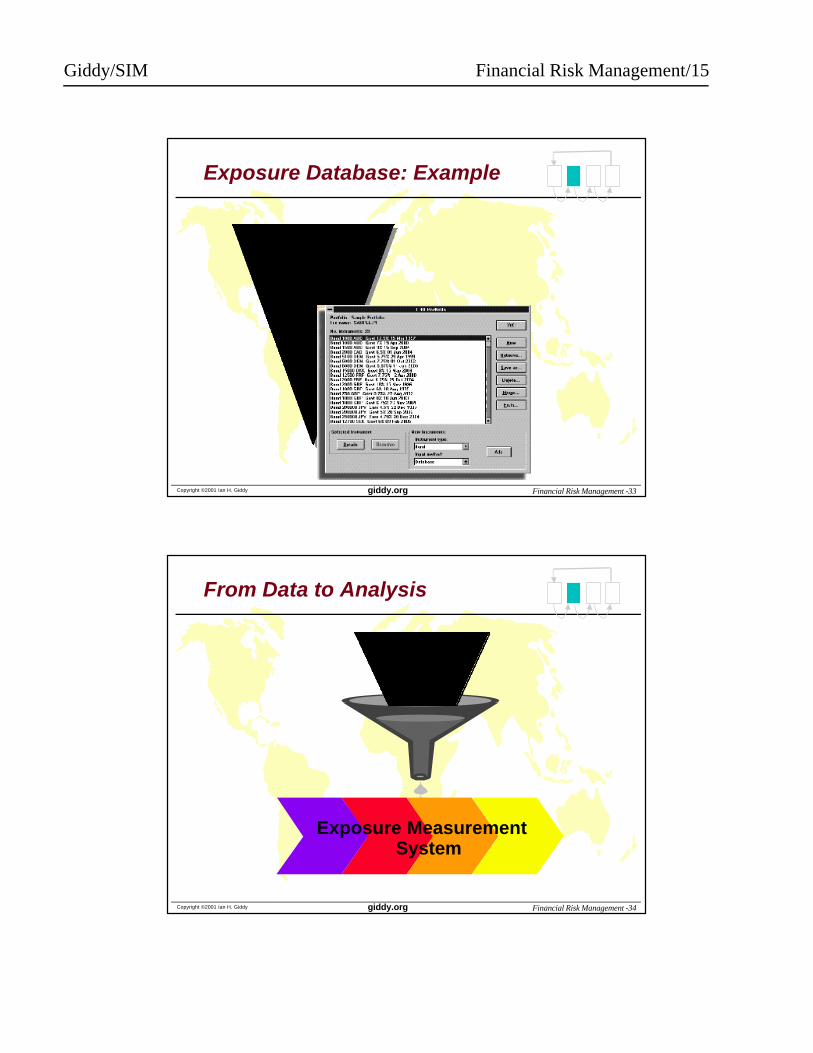
Exposure Database: Example
ExposureDatabase
Copyright ©2001 Ian H. Giddy Financial Risk Management -34giddy.org
From Data to Analysis
ExposureDatabase
Exposure Measurement System
Giddy/SIM Financial Risk Management/16
Copyright ©2001 Ian H. Giddy Financial Risk Management -35giddy.org
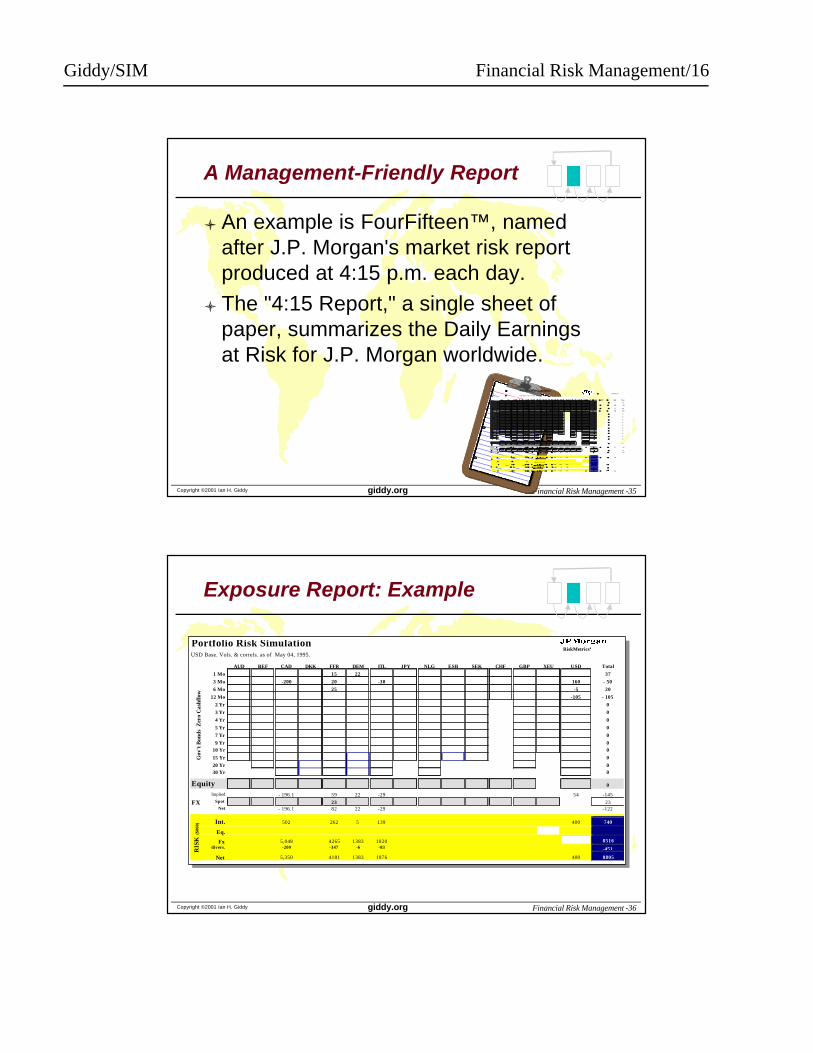
A Management-Friendly Report
l An example is FourFifteen™, named after J.P. Morgan's market risk report produced at 4:15 p.m. each day.
l The "4:15 Report," a single sheet of paper, summarizes the Daily Earnings at Risk for J.P. Morgan worldwide.
n nn Portfolio Risk Simulation
n nn USD Base. Vols. & correls. as of May 04, 1995.
n nn AUDn nn BEFn nn CADn nn DKKn nn FFRn nn DEMn nn ITLn nn JPYn nn NLGn nn ESBn nn SEKn nn CHFn nn GBPn nn XEUn nn USDn nn Total
n nn 1 Mon nn 15n nn 22 n nn 37
n nn 3 Mon nn - 200n nn 20n nn - 30 n nn 160n nn - 50
n nn 6 Mon nn 25 n nn - 5n nn 20
n nn 12 Mo n nn - 105n nn - 105
n nn 2 Yr n nn 0
n nn 3 Yr n nn 0
n nn 4 Yr n nn 0
n nn 5 Yr n nn 0
n nn 7 Yr n nn 0
n nn 9 Yr n nn 0
n nn 10 Yr n nn 0
n nn 15 Yr n nn 0
n nn 20 Yr n nn 0
n nn 30 Yr n nn 0
n nn Equity n nn 0
n nn Impliedn nn - 196.1n nn 59n nn 22n nn - 29 n nn 54n nn - 145
n nn Spotn nn 23 n nn 23
n nn Netn nn - 196.1n nn 82n nn 22n nn - 29 n nn - 122
n nn Int.n nn 502n nn 262n nn 5n nn 139 n nn 400n nn 740
n nn Eq.
n nn Fxn nn 5,048n nn 4265n nn 1383n nn 1820 n nn 8516
n nn divers.n nn - 200n nn - 347n nn - 6n nn - 83 n nn - 451
n nn Netn nn 5,350n nn 4181n nn 1383n nn 1876 n nn 400n nn 8805
nn
nR
ISK
n
nn
($00
0)
n nn RiskMetricsª
nn
nG
ov'
tB
on
ds
Zer
oC
ash
flo
w
n nn FX
Copyright ©2001 Ian H. Giddy Financial Risk Management -36giddy.org
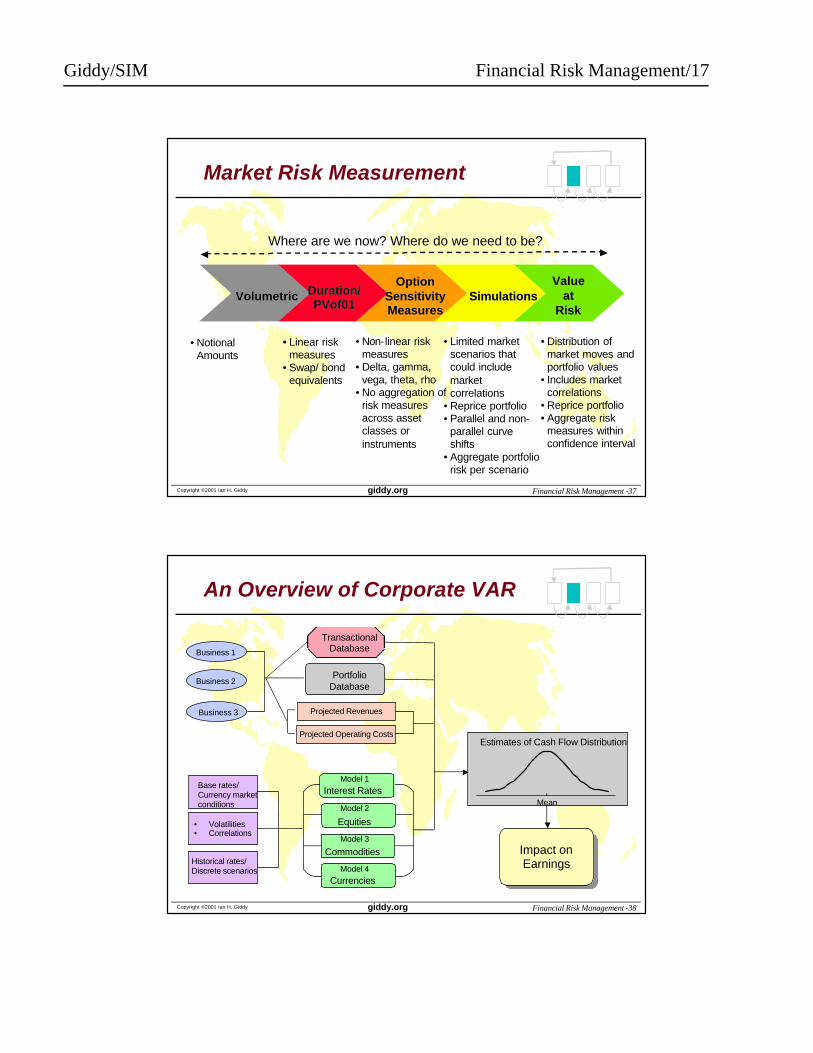
Exposure Report: Example
Portfolio Risk SimulationUSD Base. Vols. & correls. as of May 04, 1995.
AUD BEF CAD DKK FFR DEM ITL JPY NLG ESB SEK CHF GBP XEU USD Total
1 Mo 15 22 37
3 Mo -200 20 -30 160 - 50
6 Mo 25 -5 20
12 Mo -105 - 105
2 Yr 0
3 Yr 0
4 Yr 0
5 Yr 0
7 Yr 0
9 Yr 010 Yr 0
15 Yr 0
20 Yr 030 Yr 0
Equity 0
Implied - 196.1 59 22 -29 54 -145Spot 23 23
Net - 196.1 82 22 -29 -122
Int. 502 262 5 139 400 740
Eq.
Fx 5,048 4265 1383 1820 8516divers. -200 -347 -6 -83 -451
Net 5,350 4181 1383 1876 400 8805
RIS
K (
$000
)
RiskMetricsª
Gov
't B
onds
Zer
o C
ashf
low
FX
Giddy/SIM Financial Risk Management/17
Copyright ©2001 Ian H. Giddy Financial Risk Management -37giddy.org
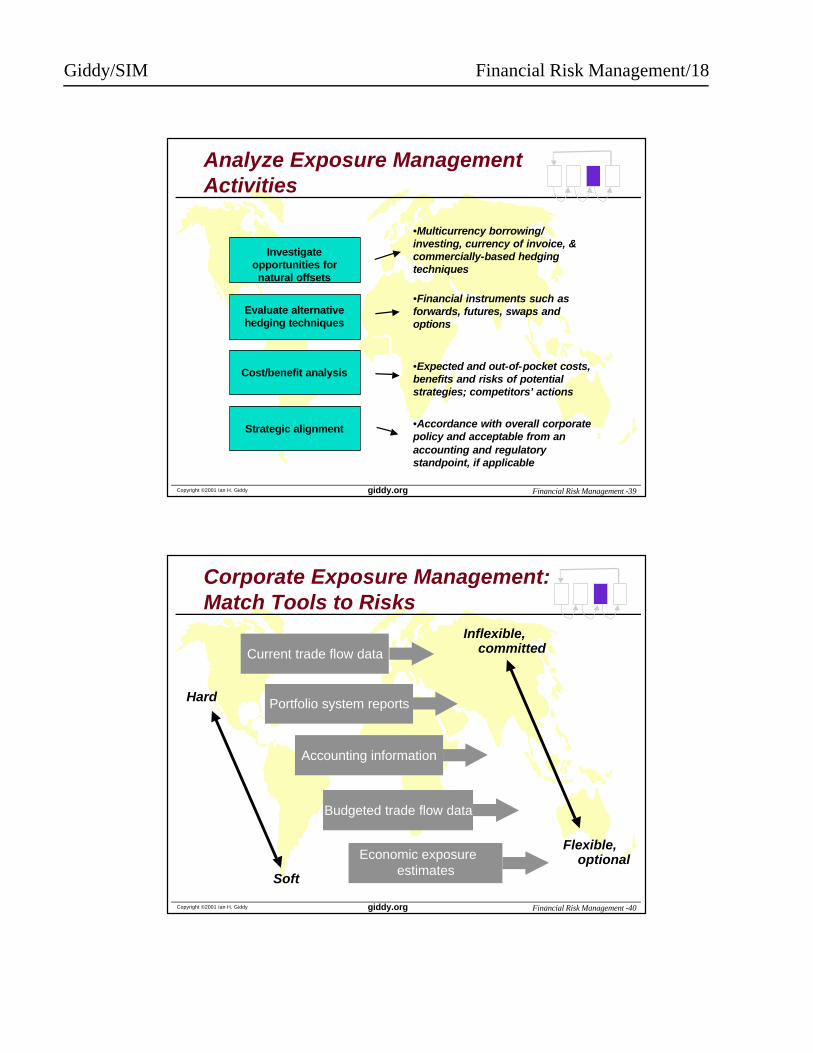
Market Risk Measurement
VolumetricVolumetric Duration/ Duration/ PVof01PVof01
Option Option Sensitivity Sensitivity MeasuresMeasures
SimulationsSimulationsValueValue
atatRiskRisk
• Notional Amounts
• Linear risk measures
• Swap/ bond equivalents
• Non-linear risk measures
• Delta, gamma,vega, theta, rho
• No aggregation of risk measures across asset classes or instruments
• Limited market scenarios that could include market correlations
• Reprice portfolio• Parallel and non-
parallel curve shifts
• Aggregate portfolio risk per scenario
• Distribution of market moves and portfolio values
• Includes market correlations
• Reprice portfolio• Aggregate risk
measures within confidence interval
Where are we now? Where do we need to be?
Copyright ©2001 Ian H. Giddy Financial Risk Management -38giddy.org
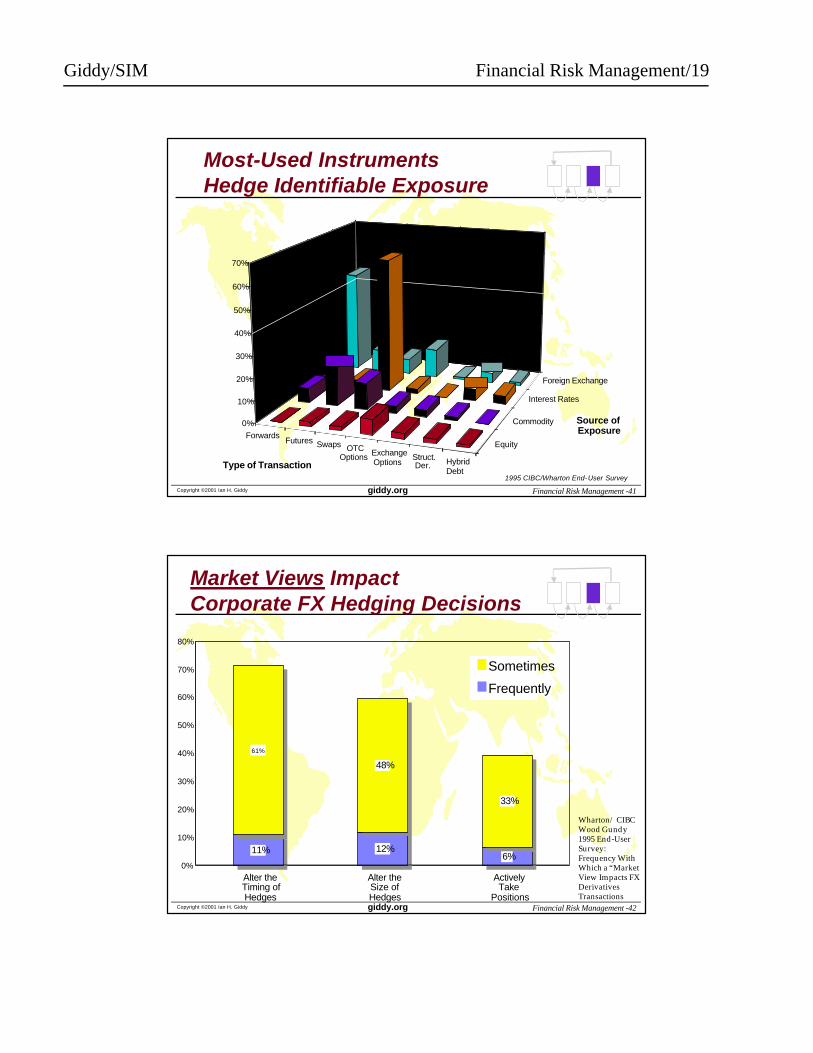
An Overview of Corporate VAR
Mean
Estimates of Cash Flow Distribution
• Volatilities• Correlations
Base rates/ Currency market conditions
Historical rates/ Discrete scenarios
Model 1
Model 2
Model 3
Model 4
Interest Rates
Currencies
Equities
Commodities Impact on Earnings
Business 2
Business 1
Business 3
Transactional Database
Projected Revenues
Projected Operating Costs
PortfolioDatabase
Giddy/SIM Financial Risk Management/18
Copyright ©2001 Ian H. Giddy Financial Risk Management -39giddy.org
Analyze Exposure Management Activities
Evaluate alternative hedging techniques
Strategic alignment
•Multicurrency borrowing/ investing, currency of invoice, & commercially-based hedging techniques
•Financial instruments such as forwards, futures, swaps and options
•Expected and out-of-pocket costs, benefits and risks of potential strategies; competitors’ actions
•Accordance with overall corporate policy and acceptable from an accounting and regulatory standpoint, if applicable
Cost/benefit analysis
Investigate opportunities for natural offsets
Copyright ©2001 Ian H. Giddy Financial Risk Management -40giddy.org
Corporate Exposure Management:Match Tools to Risks
Current trade flow data
Portfolio system reports
Accounting information
Budgeted trade flow data
Economic exposure estimates
Hard
Soft
Inflexible, committed
Flexible, optional
Giddy/SIM Financial Risk Management/19
Copyright ©2001 Ian H. Giddy Financial Risk Management -41giddy.org
ForwardsFutures Swaps OTC
Options ExchangeOptions
Struct.Der. Hybrid
Debt
Equity
Commodity
Interest Rates
Foreign Exchange
0%
10%
20%
30%
40%
50%
60%
70%
Source ofExposure
Type of Transaction1995 CIBC/Wharton End-User Survey
Most-Used InstrumentsHedge Identifiable Exposure
Copyright ©2001 Ian H. Giddy Financial Risk Management -42giddy.org
11% 12%6%
61%
48%
33%
0%
10%
20%
30%
40%
50%
60%
70%
80%
Alter theTiming ofHedges
Alter theSize ofHedges
ActivelyTake
Positions
Sometimes
Frequently
Wharton/ CIBC Wood Gundy 1995 End-User Survey:Frequency With Which a “Market View Impacts FX Derivatives Transactions
Market Views Impact Corporate FX Hedging Decisions
Giddy/SIM Financial Risk Management/20
Copyright ©2001 Ian H. Giddy Financial Risk Management -46giddy.org
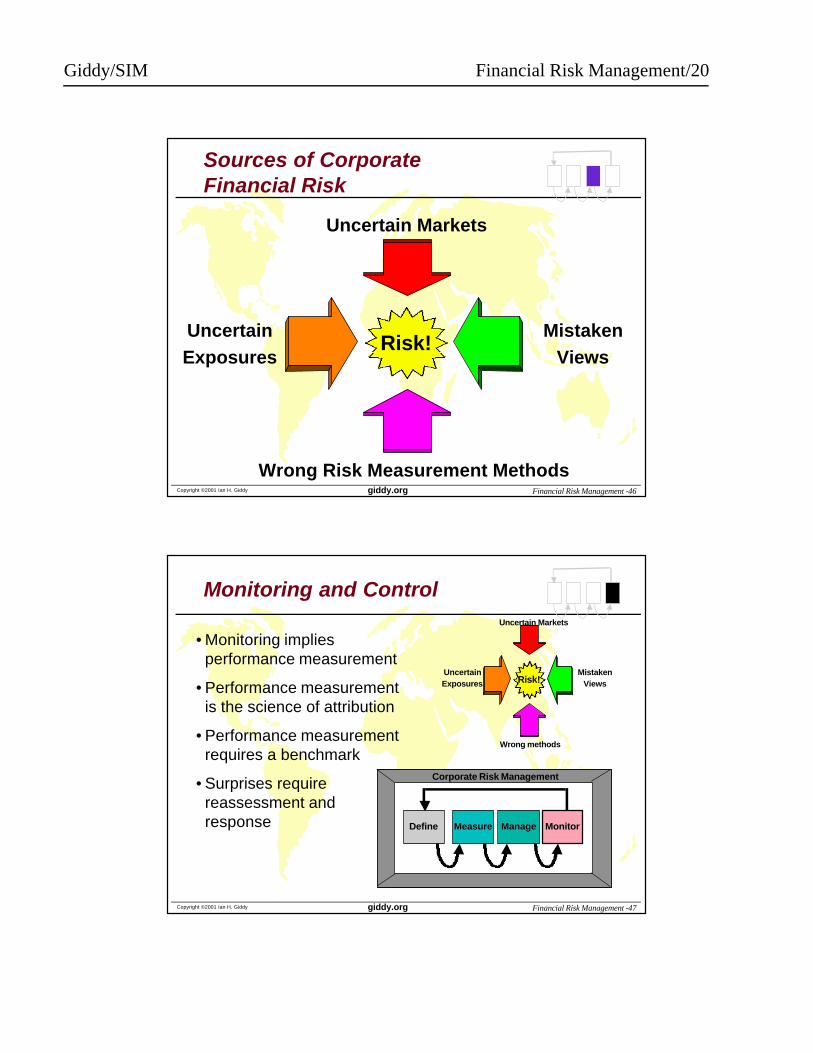
Sources of Corporate Financial Risk
Uncertain Markets
UncertainExposures
MistakenViews
Wrong Risk Measurement Methods
Risk!
Copyright ©2001 Ian H. Giddy Financial Risk Management -47giddy.org
Monitoring and Control
Corporate Risk Management
DefineDefine MeasureMeasure ManageManage MonitorMonitor
• Monitoring implies performance measurement
• Performance measurement is the science of attribution
• Performance measurement requires a benchmark
• Surprises require reassessment and response
Uncertain Markets
UncertainExposures
MistakenViewsRisk!
Wrong methods
Giddy/SIM Financial Risk Management/21
Copyright ©2001 Ian H. Giddy Financial Risk Management -48giddy.org
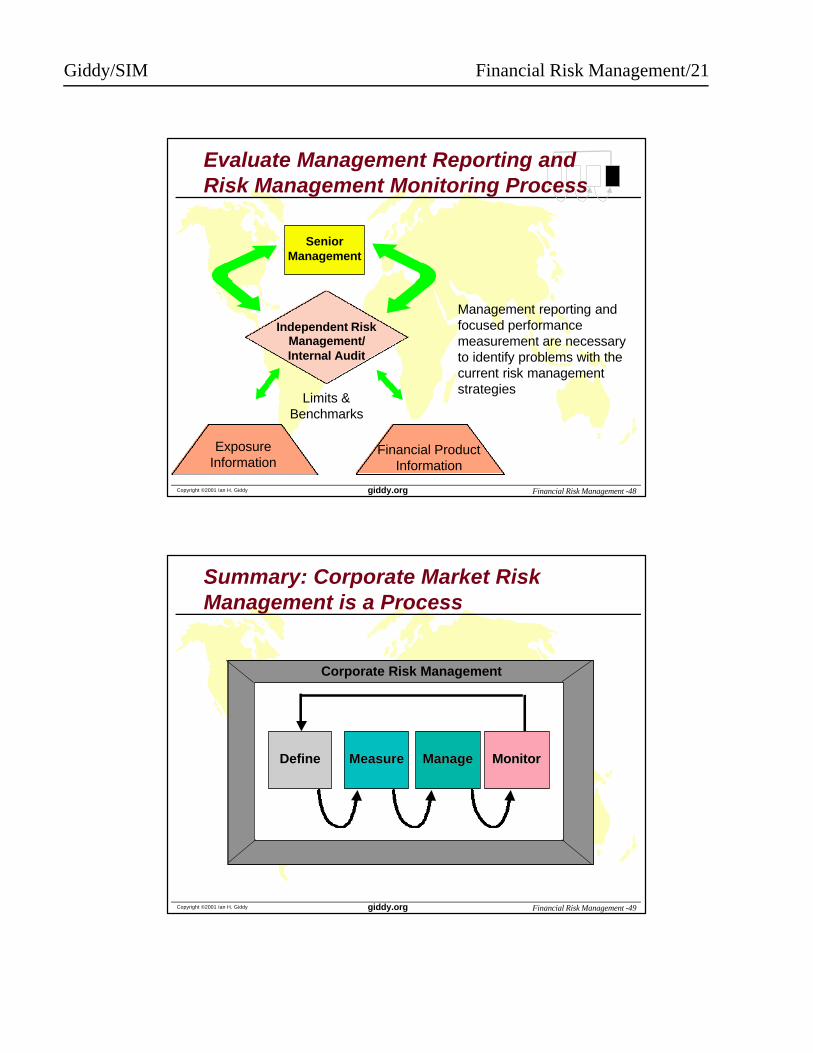
Evaluate Management Reporting and Risk Management Monitoring Process
Senior Management
Independent Risk Management/ Internal Audit
Exposure Information
Financial Product Information
Limits & Benchmarks
Management reporting and focused performance measurement are necessary to identify problems with the current risk management strategies
Copyright ©2001 Ian H. Giddy Financial Risk Management -49giddy.org
Summary: Corporate Market Risk Management is a Process
Corporate Risk Management
DefineDefine MeasureMeasure ManageManage MonitorMonitor
Giddy/SIM Financial Risk Management/22
Copyright ©2001 Ian H. Giddy Financial Risk Management -53giddy.org
Ian Giddy
Ian H. GiddyNYU Stern School of Business
44 West 4th Street, New York, NY 10012
Tel 212-998-0332; Fax 212-995-4233
http://www.giddy.org