Embed Size (px)
Citation preview

GR-NC-04
UNIVERSITY OF CALIFORNIA COOPERATIVE EXTENSION
2004
SAMPLE COSTS TOESTABLISH A VINEYARD AND PRODUCE
WINE GRAPESCHARDONNAY
NORTH COAST REGIONSonoma County
Prepared by:
Rhonda J. Smith UC Cooperative Extension Farm Advisor, Sonoma CountyKaren M. Klonsky UC Cooperative Extension Economist, Department of Agricultural and Resource
Economics, UC DavisPete Livingston UC Cooperative Extension Staff Research Associate, Department of Agricultural and
Resource Economics, UC DavisRichard L. De Moura Staff Research Associate, Department of Agricultural and Resource Economics, UC
Davis

2004 Wine Grape Cost and Return Study North Coast/Sonoma County UC Cooperative Extension 2
INTRODUCTION
The sample costs for vineyard establishment and wine grape production in Sonoma County are presented in thisstudy. The hypothetical vineyard used in this report consists of 35 acres, 30 of which are being established and5 acres in farmstead, roads, reservoir and pumping stations.
This study is intended as a guide only. It can be used to make production decisions, determine potential returns,prepare budgets and evaluate production loans. Sample costs given for labor, materials, equipment and contractservices are based on current figures. Costs and practices detailed in this study will not be applicable to everysituation. A blank column titled Your Cost is provided in Tables 2 and 3 to enter your actual costs.
CONTENTS
INTRODUCTION ............................................................................................................................................ 2ASSUMPTIONS ............................................................................................................................................... 3 Establishment Operating Costs ........................................................................................................................ 4 Production Operating Costs ............................................................................................................................ 8 Cash Overhead Costs......................................................................................................................................11 Non-Cash Overhead Costs..............................................................................................................................12REFERENCES ................................................................................................................................................14Table 1. SAMPLE COSTS PER ACRE TO ESTABLISH A VINEYARD ......................................................15Table 2. COSTS PER ACRE TO PRODUCE CHARDONNAY WINE GRAPES ..........................................17Table 3. COSTS AND RETURNS PER ACRE TO PRODUCE CHARDONNAY WINE GRAPES .............19Table 4. MONTHLY CASH COSTS – CHARDONNAY WINE GRAPES ....................................................21Table 5. WHOLE FARM EQUIPMENT, INVESTMENT, AND BUSINESS OVERHEAD COSTS...............23Table 6. HOURLY EQUIPMENT COSTS .....................................................................................................24Table 7. RANGING ANALYSIS.....................................................................................................................25Table 8. COSTS AND RETURNS/BREAKEVEN ANALYSIS .....................................................................26Table 9. DETAILS OF OPERATIONS ...........................................................................................................27
For an explanation of calculations used for the study refer to the Assumptions. For more information call theDepartment of Agricultural and Resource Economics, Cooperative Extension, University of California, Davis,California, at 530-752-2414 or Rhonda Smith, UC Cooperative Extension Sonoma County Farm Advisor, at707-565-2621 or email [email protected].
This and other cost of production studies can be ordered from the Department of Agricultural and ResourceEconomics, at the above address or by calling 530-752-4424. They can also be downloaded from thedepartment’s website http://coststudies.ucdavis.edu, or obtained from your county UC Cooperative Extensionoffice.
Acknowledgment. Appreciation is expressed to the growers who provided input and reviews. Special thanksto Duff Bevill, Bevill Vineyard Management; Keith Horn, Clos du Bois Wines; Steve Hill, Durell Vineyards;and Kirk Lokka, Sonoma-Cutrer Vineyard.
The University of California, in accordance with applicable Federal and State law and University policy, does not discriminate on the basis of race, color, nationalorigin, religion, sex, disability, age, medical condition (cancer–related), ancestry, marital status, citizenship, sexual orientation, or status as a Vietnam-era veteran orspecial disabled veteran.
Inquiries regarding the University’s nondiscrimination policies may be directed to the Affirmative Action Director, University of California, Agriculture and NaturalResources, 1111 Franklin, 6th Floor, Oakland, CA 94607-5200 (510) 987-0096.

2004 Wine Grape Cost and Return Study North Coast/Sonoma County UC Cooperative Extension 3
ASSUMPTIONS
The following assumptions refer to Tables 1 to 9 and pertain to sample costs to establish a vineyard and producewine grapes in the North Coast Region - Sonoma County. Practices described represent production proceduresand materials that for the most part are considered typical of a well-managed vineyard in Sonoma County.However, some of the practices and costs described are not representative of all vineyard sites located in thecounty. Site characteristics that will have the greatest impact on farming practices and thus establishment andproduction costs include the following: slope, rocky, very clayey or shallow soils, soil chemistry characteristicsthat affect nutrient uptake, poor drainage, excessive wind, and soil pests and diseases such as nematodes andoak root fungus.
The use of trade names and cultural practices in this report does not constitute an endorsement orrecommendation by the University of California nor is any criticism implied by omission of other similarproducts or cultural practices.
Farm. The hypothetical vineyard is assumed to lie in the Russian River Valley appellation in Sonoma County.The farm is owned and operated by the grower with assistance from a part-time foreman. The site has less thana 5% average slope and was previously planted to grapevines. The farm is 35 contiguous acres, 30 of which areplanted. Roads, irrigation system, reservoir, and farmstead occupy the other 5 acres. There is no home on theproperty. The land is valued at $65,000 per acre.
Two moderate-to-high yielding clones of Chardonnay are planted in the vineyard. The first crop is harvested inthe third year and the vineyard is considered in full production by the fifth year. In this study, the averageannual yield is 6 tons per acre, however in reality, production is strongly influenced by the vineyard’s specificlocation within the Russian River Valley and weather that may significantly impact yield in some years.
The owner is responsible for making all of the production decisions, hiring the general laborers and operatingthe machinery. Basic hourly wages are $11.57 for general labor and $14.93 for machine labor. Payrolloverhead is in addition to these wages.
Site Determination (Regulations). A site assessment done by the Sonoma County AgriculturalCommissioner’s office under the authority of the Sonoma County Vineyard Erosion and Sediment ControlOrdinance (VESCO) determined the planting area to be a “Level 1”. This designation does not require theinstallation of design features such as sediment basins or slope adjustment to manage surface flows from rainfallor prevent sediment movement. A $300 fee is required for a Level 1 site and is paid in the first year only.
The purpose of VESCO is to reduce erosion and runoff in vineyards planted on slopes or high erodible soils.VESCO requires that growers notify the county Agricultural Commissioner of the intent to establish or replant avineyard for commercial production. Documentation of slope and soil types coupled with a site visit by thecounty resulted in the determination of the site’s Level status. Depending on the findings, an erosion andsediment control plan may be required prior to any site modifications. The fee charged by the county isdependent upon the Level determination, size of the vineyard and required mitigation.
Additional information related to regulatory oversight of vineyard development in Sonoma County can be foundin the Vineyard Site Assessment Guide available from the University of California Cooperative ExtensionSonoma County office.

2004 Wine Grape Cost and Return Study North Coast/Sonoma County UC Cooperative Extension 4
Vineyard Design. The vineyard is laid out in three blocks each containing 40 rows. There are two avenuesbetween the three blocks with turn-around space for equipment at the end of the rows. The rows are 1,000 feetlong and have 166 vines per row. Vine spacing is 8-foot by 6-foot (row-by-vine) and vines are trained tobilateral cordons and spur pruned.
Trellis System. The trellis system, installed by a commercial trellis company, is designed to support a bilateralcordon-trained, spur-pruned vineyard. The estimated cost includes all components and installation labor. Thetrellis system in this study utilizes either a rebar or rolled edge, pre-notched, metal highway stake at eachplanting position with drill pipe for end posts. A single permanent cordon wire is attached to all stakes and endposts at a 36-inch height and 2 pairs of movable wires are hung on notches in the highway stakes. The trellissystem is considered part of the vineyard since it will be removed at the time of vine removal and is shown inthe vineyard establishment costs in Table 1. The following details the trellis system installation.
The vineyard is laid out in the spring of the first year, and all stakes, end posts and wires are installed. Five-foot, 3/8 inch rebar stakes are hammered into the ground on six foot centers leaving every third position for anin-line, nine-foot rolled edge metal highway stake. The latter stakes are driven three feet into the ground on 18-foot centers. A nine-foot, 2-7/8 inch drill pipe with a double spade is set at the end of each row, buried 4.5 feetinto the ground. A permanent, 12-gauge, high tensile, cordon wire is attached to each rebar and highway stake36 inches above the ground. The 14-gauge wire for supporting the drip irrigation lateral (black hose) is clippedto each highway stake 14 inches above the ground and secured to each end post. The drip lateral is attached tothe drip wire with 14-gauge U-ties. Two pairs of movable, 14-gauge, high tensile wires are secured to eachendpost and strung on the in-line highway stakes in the row. During the growing season, these movable wiresare moved up the stakes as shoot growth occurs and are held in position by notches in the highway stakes.
Establishment Operating Costs
The following establishment descriptions are typical practices for many vineyards in Sonoma County, but maynot be appropriate to individual circumstances.
Site Preparation. Removal of the old vineyard and all land preparations up to planting the cover crop arecontracted out to commercial companies. All of these activities, up to, but not including mowing the covercrop, occur in the fall of the year prior to planting. Although most operations that prepare the vineyard forplanting are done in the year prior to planting, costs are shown in the first year in Table 1.
Costs to remove the old vineyard include separation and proper disposal of plastic, metal, and pressure treatedwood that composed the old trellis and irrigation systems. Vines are pushed into a pile and burned. Lime isspread at 10 tons per acre over the cleared ground to adjust soil acidity to a desirable range. The ground isripped in three different directions to a depth of four-feet to improve rooting depth and increase waterinfiltration. Two passes with a stubble disc follow and old vine roots are removed by hand after each pass. Adrag is used on the third and final pass with the stubble disc.
A cover crop seed mix that maximizes production of vegetative biomass is broadcast in the fall over the entire30-acre site and a drag is used on the same seeding pass. In the spring of the following year, the cover crop ismowed one time with a flail mower then disced three times by the owner.
Vines. Dormant, bench grafted Chardonnay vines are planted in the early spring on an 8-foot X 6-foot spacing(row-by-vine) resulting in a planting density of 908 vines per acre. In the second year 4% or 36 vines per acreare replanted for those lost in the first and second years. Vines will be trained during the first and second years

2004 Wine Grape Cost and Return Study North Coast/Sonoma County UC Cooperative Extension 5
and are expected to begin yielding harvestable fruit in three years (third leaf). They will be productive for anadditional 22 years.
Plant. The vineyard is planted in May of the first year and replanting weak or dead vines is done in the secondyear as described below.
First Year. After the site is mowed and disced in the spring, a contractor’s crew lays out the vineyard. Eachplanting spot is marked with a plastic picnic knife. This is followed by trellis installation. Prior to planting, thevine rows are strip sprayed one time with Roundup herbicide. In May, a contractor digs the holes by hand, andplants dormant, bench grafted vines. Soil is mounded over each vine to protect it against drying and sunburn.Two to three weeks later each vine is unmounded and a grow tube is installed.
Second Year. In the first winter (January), grow tubes are opened and vines are pruned to a two-bud spur. Fourpercent of the vines, or 36 vines per acre, are replaced in the second year after dying during the first season.
Prune, Train, Sucker. Not all of the same practices that follow are used for other varieties or trellis systems.Also, the experienced vineyard owner or manager will modify these practices and still successfully develop thevineyard.
First Year. The training operations in the first growing season are made in two passes. During the first pass inApril, the vines are unmounded when shoots begin to emerge from the mound. At that time, scion roots aretrimmed and a grow tube is placed over each vine and tied to the stake. In mid May, on the second pass, thetube is lifted up and the vine is shoot thinned to one or two shoots and the tube is placed back over the vine andretied to the stake as necessary.
Second Year. During the plants’ first winter, the grow tubes are opened and each vine is pruned to a single twobud spur. The tube is then closed and retied to the stake as necessary. At the same time the lower pair ofmoveable trellis wires are moved to the first position above the cordon wire and the upper pair of moveablewires are moved to the top position on the in-line stakes.
In spring and summer of the second growing season up to five passes are needed to train the vines. In the firstpass during April, the tube is opened again, vines are shoot-thinned to one shoot and the tube is replaced. In thesecond pass in early May, the tube is permanently removed, the vine is topped and tied to the stake with threeties. Because vines grow at different rates, a third pass is needed for late vines, which are treated like those onthe second pass. For the majority of vines on the third pass in June, lateral shoots are removed from the trunkand the top two laterals are loosely tied to the cordon wire. Two final passes – late June and July - are madecontinuing to tie cordon shoots to the wires and to train late vines. Additionally, on the final pass cordon shootsare topped and lateral shoots arising from the cordon shoots are stuffed inside the lower pair of moveable wires.
Third Year. In January of the second winter, pruning starts by cutting off all of the laterals from the cordons,and topping cordons if necessary. Later in January, the head of the vine is re-tied to the stake and the cordoncanes are tied to the cordon wire. The top moveable pair of wires is moved to the middle position.
When rapid shoot growth occurs in early spring (April), the cordons are shoot-thinned to select spur positions.At the same time, cordon extensions on vines that require them are tied. On the next pass in May,approximately one-quarter of the shoots arising from the cordons require stuffing between the lower pair ofmoveable wires. Up to six spur positions per cordon are selected and cordon extensions are tied as needed.During the third pass at the end of June, all shoots arising from the cordons will be stuffed between the

2004 Wine Grape Cost and Return Study North Coast/Sonoma County UC Cooperative Extension 6
appropriate pair of movable wires. In addition, crop removal occurs during the same pass in the followingmanner: all clusters are removed on shoots that are shorter than 18 inches in length; one cluster is allowed toremain on shoots that are between 18 to 24 inches in length and two clusters are left on shoots over 30 incheslong.
Costs that reflect training practices are only shown through the fourth year in this study (Table 1); however,slower growing vines may need to be trained for a longer period. In addition, pruning costs during theproduction years in this study are only presented for activities directed to fully trained vines (Table 2).
Pest Management. The pesticides and rates mentioned in this cost study as well as other materials are listed inUC Integrated Pest Management Guidelines, Grapes, available at www.ipm.ucdavis.edu. Pesticides mentionedin the study are commonly used, but are not recommendations.
Insect and Mite Management. A pest control adviser (PCA) monitors insect and mite pests and beneficialinsect populations beginning in the first year to determine if control measures are necessary. In this vineyard,only thrips require chemical (Provado) control beginning in the third year. Worm pests are uncommon in theNorth Coast and are monitored, but control treatments are not needed in this study.
Disease Management. Foliar pathogens can cause disease in grapevines, but control actions for only the twomajor fungal diseases - powdery mildew and Botrytis bunch rot - are addressed in this study. Powdery mildewdisease pressure is closely related to temperature and leaf wetness in the spring, and temperature and relativehumidity in early summer; therefore weather conditions determine spray intervals and hence total number offungicide applications per year. Weather will also play a role in the choice of materials used to control powderymildew. Disease control treatments are not made in the first year.
Second Year. In this study, a spray and dusting program for powdery mildew control begins in the second year.The first two applications occur in early May. Both consist of a micronized sulfur product (Thiolux) tankmixed with a copper material (Champ). Because vines are small, only every third row is driven to apply thesesprays. Two treatments with dusting sulfur follow in June and every other row is driven.
Third Year. In March, micronized sulfur (Thiolux) and copper (Champ) are tank mixed and applied twice.Again every third row is driven. These sprays are followed by four applications of dusting sulfur at 10-dayintervals in which alternate rows are driven until mid May. Rally, one member of a class of fungicides knownas sterol inhibitors (SI) is applied at pre-bloom in May and twice again at 14-day intervals. (The pre-bloomapplication is combined with foliar fertilizers). At pre-bunch close in late June, an SI (Rally) is tank mixed andapplied with a material (Vanguard) that controls Botrytis bunch rot. Removing leaves or lateral shoots fromaround the clusters in late June on one side of the row also reduces incidence of Botrytis bunch rot andimproves spray penetration. One last powdery mildew treatment is made in early July using Flint, a strobilurin(a fungicide class). All pesticide applications are made using a 60 HP tractor and a vineyard duster or sprayer.
Vineyard Floor Management/Weed/Cover Crop. A “wall to wall” green manure cover crop is seeded afterthe site is prepared in the fall of the year prior to planting and in the row centers in the first fall after the vinesare planted. In the second year, a cover crop mixture of legumes and annual grasses is seeded. No cover isplanted in the third year because the floor will be protected by significant regrowth from previous plantings. Allcenters will be mowed and disced each spring and summer of the establishment years, up to the third seasonwhen an alternate strategy begins. The specific herbicides used in the vineyard may be affected by the presenceof a Ground Water Protection Area. For more information, contact the Sonoma County AgriculturalCommissioner’s office.

2004 Wine Grape Cost and Return Study North Coast/Sonoma County UC Cooperative Extension 7
First Year. In April during site preparation, the grower mows once and discs three times before the contractorlays out the vineyard. A contact herbicide (Roundup) is applied to the vine rows prior to planting. After thevines are planted in May, the centers are mowed once and a contact herbicide (Roundup) applied in the vinerows. In the summer, the centers will be mowed once again and disced three times. Vine row weeds arecontrolled by one application of a contact herbicide (Roundup) in the summer. In the fall, the row centers aredisced once and a green manure cover crop is seeded with the grower’s drill and roller.Second Year. In the winter (January), vine row weeds are controlled with one application of a contact(Roundup) and pre-emergent herbicide (Prowl) mix. In the late spring, a second herbicide treatment is madewith a contact material (Roundup) in the vine row just before the grow tubes are removed in early May. Rowcenters are mowed once in March with a flail mower and this single pass also chops the prunings. Centers aredisced a total of three times from spring to early summer. In the fall (October), the row centers are disced oncein preparation for planting a legume and annual grass cover crop seed using the grower’s drill.
Third Year. To control vine row weeds in the winter (January), a mixture of two pre emergent (Goal, Princep)and one post-emergent herbicide (Roundup) is applied. All centers are mowed once in the spring (March) to cutthe cover crop and chop vine prunings. After the spring mowing/chopping, alternating centers are manageddifferently. One set is mowed once in May and no other vineyard floor management activities occur for the restof the growing season. The other set of centers are disced four times through the summer. In June, vine rowsreceive one application of a contact herbicide (Roundup) as a summer strip spray. No cover crop is planted inthe fall.
Fertilize. Fertilizer is applied through the drip irrigation system in all years of vineyard establishment. Solubledry and liquid formulations are injected into the irrigation system using a fertilizer injector.
First Year. A solution grade fertilizer material, calcium nitrate (15.5-0-0), is applied through the drip irrigationsystem from April through July for a total of 60 pounds of nitrogen per acre.
Second Year. Calcium nitrate is applied through the drip system in April to supply 15.5 pounds of nitrogen peracre. Also, a total of 20 gallons of 2-15-15 is applied through the drip lines in a split application in June andJuly. By the end of the growing season, a total of 19.76 pounds of nitrogen, 32 pounds of phosphorus and 32pounds of potassium per acre are applied.
Third Year. The same materials and rates are injected as in the second year. In addition, boron and zinc foliarmicronutrients are tank mixed with the powdery mildew fungicide application that occurs just prior to fullbloom. One pound of actual boron (Solubor) and two pounds of actual zinc (Neutral Zinc) per acre are sprayed.
Irrigation. In this study pumped irrigation water is calculated to cost $6.03 per acre-inch. The irrigation costincludes labor and a water cost that is based on using a 15 hp motor to pump from 150 feet deep over 30 acres.Price per acre-foot of water will vary by grower in this region depending on quantity pumped, power cost,various well characteristics, and other irrigation factors.
Irrigation water is applied weekly through September each year,beginning in May in years 1 and 2, June in year 3 and July in year 4.No assumption is made about in-season rainfall or the irrigationsystem’s emission uniformity. A post-harvest irrigation is applied withthe overhead sprinklers during the production years, beginning in year3. The amount of irrigation water by years is shown in Table A.
Table A. Applied Irrigation Water –DripNumber of
Year months AcIn/year1 5 2.002 5 3.003 4 3.344+ 3 3.34Applied irrigation water – Sprinkler3+ once-post harvest 2.00

2004 Wine Grape Cost and Return Study North Coast/Sonoma County UC Cooperative Extension 8
Frost Protection. It is assumed that the vineyard will need frost protection during the months of March, April,and May for a total of three nights beginning in the third year and six nights in subsequent years. The sprinklersrun for six hours per night. Water cost for frost protection is $7.18 per acre-inch because of the extra pumpingrequired from the reservoir.
Harvest. In this study, the first crop is harvested in the third leaf (third year)in order to increase the likelihood of uniform vine size throughout thevineyard. The vineyard contracts to have the grape crop custom harvestedby hand in both the third and fourth years and is charged on a per acre basis.In many instances, it is more appropriate to take the first crop off in thesecond year if site conditions and initial vine growth warrant. Assumedaverage yields in the Russian River Valley are shown in Table B.
Assessments. The grower is a member of two associations that fund their operations with membership fees.The Sonoma County Grape Growers Association (SCGGA) determines grower membership fees on an acreagebasis. During the first two years, the fee is $5.00 per non-producing grape acre with a minimum of $250 pervineyard. Once the vineyard begins to produce fruit the fee changes to $12.50 per bearing acre. The SCGGAinternet site can be accessed at http://www.sonomagrapevine.org/.
The grower is also a member of the Russian River Valley Winegrowers (RRVW). Members are assessed on atonnage-produced basis with a minimum of $275 per vineyard regardless of yield. During the first two years,only the minimum fee is assessed by the RRVW. Additional information about this organization is available athttp://rrvw.org/.
Production Operating Costs
Prune, Tie, and Sucker. Pruning and tying are done during the winter months (January) and the prunings arechopped in March with a flail mower. Cordon shoot removal is done twice each year, once in April and againin May. Trunk suckering occurs once a year in May.
Canopy Management and Crop Adjustment. Wires are moved a total of two times (April and May) duringeach growing season in order to vertically position the canopy. Selected basal leaves and lateral shoots areremoved by hand from the fruiting zone once in either June or July from the side of the row that receives themorning sun. The vine shoots are hedged once in June just above the top of the highway stakes.
In July at 10% veraison (i.e. 10% of the fruit has started to ripen), the crop level is adjusted by thinning. Fruitclusters are removed from shoots smaller than 18 inches in length. Two clusters are retained on shoots that areat least 30 inches long and one cluster is retained on shoots between 18 and 30 inches in length.
Fertilize. The fertilizers are applied through the drip system and as foliar sprays. Solution grade calciumnitrate is injected in June to give the vines 15.5 pounds of actual nitrogen. A mixed liquid fertilizer (2-15-15) isinjected twice during the season at 10 gallons of material per acre per application. This brings the total actualnitrogen applied per acre for the season to 19.76 pounds. Potassium as potassium thiosulfate is injected in July.Thus, the total pounds of phosphorus and potassium are 32 and 62.5 pounds, respectively.
Normally, in two out of three years, a pre-bloom foliar application of both zinc (Neutral Zinc) and boron(Solubor) is added to the SI (Rally) spray application in mid to late May. Two pounds of actual zinc and one-pound actual boron are applied. In this study the full cost is included each year. Every third year, oppositecluster petioles are collected at bloom for tissue nutrient analyses. One third of the cost is included each year.
Table B. Annual Chardonnay YieldsSonoma County (District 3)
Year Tons Per Acre0 0.03 2.54 4.5
5+ 6.0

2004 Wine Grape Cost and Return Study North Coast/Sonoma County UC Cooperative Extension 9
Irrigation. The cost includes labor and pumping costs based on using a 15 hp motor to pump from 150 feetdeep over 30 acres. In this study pumped irrigation water is calculated to cost $6.03 per acre-inch. Price peracre-inch of water will vary by grower in this region depending on quantity pumped, power cost, various wellcharacteristics, and other irrigation factors. Beginning in July, irrigation water is applied weekly throughSeptember. A post-harvest irrigation in September is applied with the overhead sprinklers. No assumption ismade about in-season rainfall or the irrigation system’s emission uniformity.
Frost Protection. It is assumed that the vineyard will need frost protection for six nights during March, Apriland May. The overhead sprinklers run for six hours per night. After each frost protection event the reservoir isfilled with water from the well. The cost of water used for frost protection is the cost of water pumped from theirrigation well to the reservoir and the cost to operate the booster pump during the freezing periods. Water costfor frost protection is $7.18 per acre-inch because of the extra pumping required from the reservoir.
Pest Management. The pesticides and rates mentioned in this cost study are listed in UC Integrated PestManagement Guidelines, Grapes. Pesticides mentioned in the study are not recommendations, but thosecommonly used in the region. For information on other pesticides available, pest identification, monitoring,and management visit the UC IPM website at www.ipm.ucdavis.edu. A Pesticide Identification number isrequired to purchase pesticides for commercial use. For information regarding pesticide ID numbers and usepermits, contact the Sonoma County Agricultural Commissioner's office. For additional productioninformation, contact the UC Cooperative Extension Sonoma County Viticulture Farm Advisor.
Pest Control Adviser. The pest control adviser (PCA) monitors the field for pests, diseases, and nutrition.PCA’s are required to provide written recommendations for pesticides that they advise a grower to use. Growersmay hire private (independent) PCA’s or receive the service as part of the services provided by their local retailagricultural chemical and fertilizer supplier. In this study the grower hires a private PCA.
Vineyard Floor Management/Weed/Cover Crop. Mowing and cultivation are used to manage vegetation in thecenters and herbicides are used to control weeds in the vine rows. Beginning in the fall of the fourth year, acover crop seed mixture of legumes plus annual grasses is planted throughout the vineyard. After planting theadjacent centers are managed differently. Prunings are placed in alternate centers and mowed/chopped once inMarch. Those centers will be mowed once again the following month and not disced. Adjacent centers are alsomowed once in March then disced two times, once each in May and June. At the end of a four-year cycle, adifferent cover crop mix will be planted.
Vine row weeds are controlled with a winter (January) dormant mix using the pre-emergent herbicide, Goal anda contact herbicide, Roundup, applied as a strip spray. In two out of three years, Fire Power herbicide is stripsprayed in the spring. Every third year, perennial weeds are controlled with an application of Rely. In somesituations Rely will be applied in the summer. In the above applications, two-thirds and one-third of the costsare charged to the vineyard each year.
Insect and Mite Management. A PCA monitors the vineyard weekly. It is assumed that it is necessary to treatgrape leafhoppers once every third year and mites in two out of every three years. One-third and two thirds ofthe respective costs are charged to the vineyard each year. Provado is applied for leafhopper control andAcramite for mite control. In Table 3, the rates and material costs reflect the fact that they are not used everyyear.
2004 Wine Grape Cost and Return Study North Coast/Sonoma County UC Cooperative Extension 10
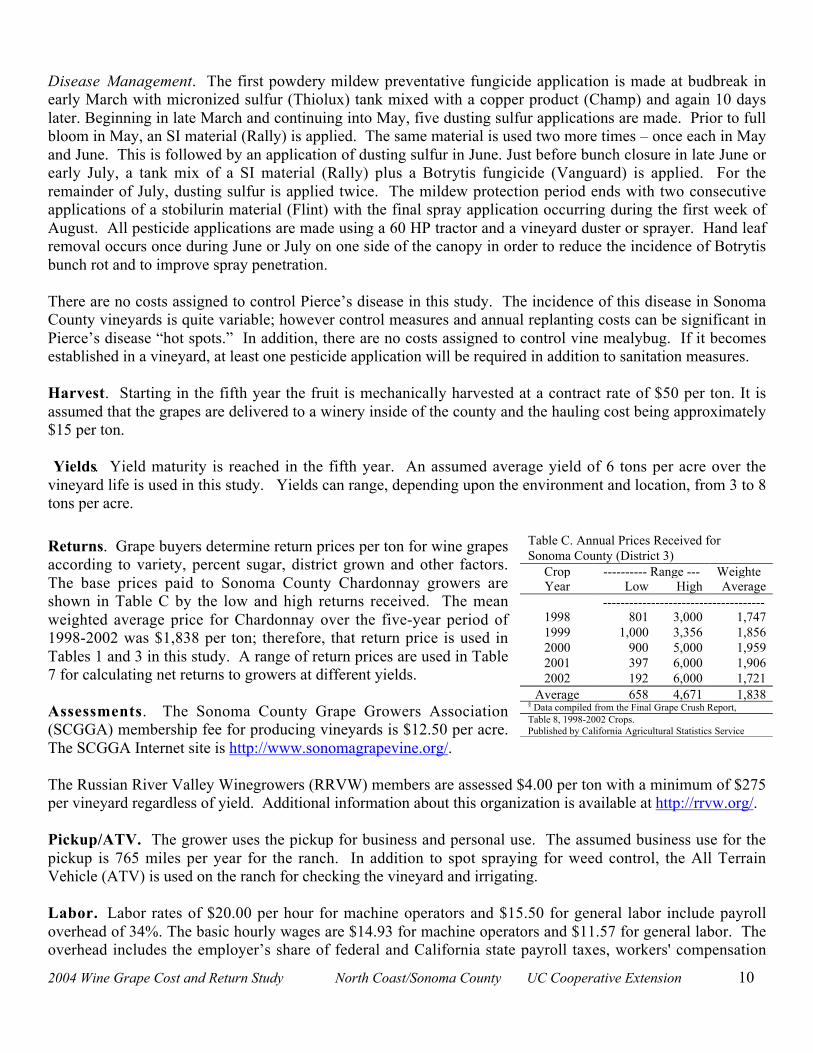
Disease Management. The first powdery mildew preventative fungicide application is made at budbreak inearly March with micronized sulfur (Thiolux) tank mixed with a copper product (Champ) and again 10 dayslater. Beginning in late March and continuing into May, five dusting sulfur applications are made. Prior to fullbloom in May, an SI material (Rally) is applied. The same material is used two more times – once each in Mayand June. This is followed by an application of dusting sulfur in June. Just before bunch closure in late June orearly July, a tank mix of a SI material (Rally) plus a Botrytis fungicide (Vanguard) is applied. For theremainder of July, dusting sulfur is applied twice. The mildew protection period ends with two consecutiveapplications of a stobilurin material (Flint) with the final spray application occurring during the first week ofAugust. All pesticide applications are made using a 60 HP tractor and a vineyard duster or sprayer. Hand leafremoval occurs once during June or July on one side of the canopy in order to reduce the incidence of Botrytisbunch rot and to improve spray penetration.
There are no costs assigned to control Pierce’s disease in this study. The incidence of this disease in SonomaCounty vineyards is quite variable; however control measures and annual replanting costs can be significant inPierce’s disease “hot spots.” In addition, there are no costs assigned to control vine mealybug. If it becomesestablished in a vineyard, at least one pesticide application will be required in addition to sanitation measures.
Harvest. Starting in the fifth year the fruit is mechanically harvested at a contract rate of $50 per ton. It isassumed that the grapes are delivered to a winery inside of the county and the hauling cost being approximately$15 per ton.
Yields. Yield maturity is reached in the fifth year. An assumed average yield of 6 tons per acre over thevineyard life is used in this study. Yields can range, depending upon the environment and location, from 3 to 8tons per acre.
Returns. Grape buyers determine return prices per ton for wine grapesaccording to variety, percent sugar, district grown and other factors.The base prices paid to Sonoma County Chardonnay growers areshown in Table C by the low and high returns received. The meanweighted average price for Chardonnay over the five-year period of1998-2002 was $1,838 per ton; therefore, that return price is used inTables 1 and 3 in this study. A range of return prices are used in Table7 for calculating net returns to growers at different yields.
Assessments. The Sonoma County Grape Growers Association(SCGGA) membership fee for producing vineyards is $12.50 per acre.The SCGGA Internet site is http://www.sonomagrapevine.org/.
The Russian River Valley Winegrowers (RRVW) members are assessed $4.00 per ton with a minimum of $275per vineyard regardless of yield. Additional information about this organization is available at http://rrvw.org/.
Pickup/ATV. The grower uses the pickup for business and personal use. The assumed business use for thepickup is 765 miles per year for the ranch. In addition to spot spraying for weed control, the All TerrainVehicle (ATV) is used on the ranch for checking the vineyard and irrigating.
Labor. Labor rates of $20.00 per hour for machine operators and $15.50 for general labor include payrolloverhead of 34%. The basic hourly wages are $14.93 for machine operators and $11.57 for general labor. Theoverhead includes the employer’s share of federal and California state payroll taxes, workers' compensation
Table C. Annual Prices Received forChardonnay§Sonoma County (District 3)
Crop ---------- Range ----------
WeightedYear Low High Average
------------------------------------------------- $/Ton ----------------
----------------------------1998 801 3,000 1,7471999 1,000 3,356 1,8562000 900 5,000 1,9592001 397 6,000 1,9062002 192 6,000 1,721
Average 658 4,671 1,838§ Data compiled from the Final Grape Crush Report,Table 8, 1998-2002 Crops.Published by California Agricultural Statistics Service

2004 Wine Grape Cost and Return Study North Coast/Sonoma County UC Cooperative Extension 11
insurance for vineyards (code 0040), and a percentage for other possible benefits. Workers’ compensationinsurance costs will vary among growers, but for this study the cost is based upon the average industry final rateas of January 1, 2004 (California Department of Insurance). Labor for operations involving machinery are 20%higher than the operation time given in Table 2 to account for the extra labor involved in equipment set up,moving, maintenance, work breaks, and field repair.
Wages for management are not included as a cash cost. Any return above total costs is considered a return tomanagement and risk. However, growers wanting to account for management may wish to add a cost. Themanager (owner) makes all production decisions regarding cultural practices, pest management, and labor aswell as operates all machinery.
Equipment Operating Costs. Repair costs are based on purchase price, annual hours of use, total hours of life,and repair coefficients formulated by American Society of Agricultural Engineers (ASAE). Fuel andlubrication costs are also determined by ASAE equations based on maximum Power Take Off (PTO)horsepower, and fuel type. Prices for on-farm delivery of diesel and gasoline are $1.45 and $1.88 per gallon,respectively. The fuel prices are averaged based on four California delivery locations plus $0.24 per gallon,which is one-half the difference between the high and low price for regular gasoline in 2003 from the CaliforniaState Automobile Association Monthly Survey. The cost includes a 2.25% sales tax (effective September 2001)on diesel fuel and 7.25% sales tax on gasoline. Gasoline also includes federal and state excise tax, which can berefunded for on-farm use when filing your income tax. The fuel, lube, and repair cost per acre for eachoperation in Table 2 is determined by multiplying the total hourly operating cost in Table 6 for each piece ofequipment used for the selected operation by the hours per acre. Tractor time is 10% higher than implementtime for a given operation to account for setup, travel and down time.
Interest On Operating Capital. Interest on operating capital is based on cash operating costs and is calculatedmonthly until harvest at a nominal rate of 6.23% per year. A nominal interest rate is the typical market cost ofborrowed funds. The interest cost of post harvest operations is discounted back to the last harvest month usinga negative interest charge.
Risk. The risks associated with producing and marketing wine grapes are significant. While this study makesevery effort to model a production system based on typical, real world practices, it cannot fully representfinancial, agronomic and market risks that affect the profitability and economic viability of winegrapeproduction. A market channel should be determined before the vineyard is planted and brought into production.Though not used in this study, crop insurance is a risk management tool available to growers.
Cash Overhead Costs
Cash overhead consists of various cash expenses paid out during the year that are assigned to the whole farm,not to a particular operation. These costs include property taxes, interest on operating capital, office expense,liability and property insurance, and equipment repairs.
Property Taxes. Counties in California charge a base property tax rate of 1% on the assessed value of theproperty. In some counties special assessment districts exist and charge additional taxes on property includingequipment, buildings, and improvements. For this study, county taxes are calculated as 1% of the average valueof the property. Average value equals new cost plus salvage value divided by 2 on a per acre basis. The salvagevalue for land is equal to the purchase price because land does not depreciate.
Insurance. Insurance for farm investments vary depending on the assets included and the amount of coverage.

2004 Wine Grape Cost and Return Study North Coast/Sonoma County UC Cooperative Extension 12
Property insurance provides coverage for property loss and is charged at 0.676% of the average value of theassets over their useful life. Liability insurance covers accidents on the farm and costs $516 for the entire farm.
Office Expense. Office and business expenses for 30 acres are estimated at $9,000 annually or $250 per acre.These expenses include office supplies, telephones, bookkeeping, accounting, legal fees, road maintenance, etc.
Foreman Salary. The vineyard employs a single foreman to supervise work crews and production practices.Due to the small acreage, the vineyard employs the foreman 25% of the time and pays one quarter of the annualsalary of $50,000 plus 34% for payroll taxes and benefits.
Sanitation Services. Sanitation services provide portable toilets for the vineyard and cost the farm $436annually. This cost includes delivery and servicing of toilets.
Investment Repairs. Annual maintenance is calculated as 2% of the purchase price.
Non-Cash Overhead Costs
Non-cash overhead is calculated as the capital recovery cost for equipment and other farm investments.
Capital Recovery Costs. Capital recovery cost is the annual depreciation and interest costs for a capitalinvestment. It is the amount of money required each year to recover the difference between the purchase priceand salvage value (unrecovered capital). It is equivalent to the annual payment on a loan for the investmentwith the down payment equal to the discounted salvage value. This is a more complex method of calculatingownership costs than straight-line depreciation and opportunity costs, but more accurately represents the annualcosts of ownership because it takes the time value of money into account (Boehlje and Eidman). The formulafor the calculation of the annual capital recovery costs is ((Purchase Price – Salvage Value) x Capital RecoveryFactor) + (Salvage Value x Interest Rate).
Salvage Value. Salvage value is an estimate of the remaining value of an investment at the end of its useful life.For farm machinery (tractors and implements) the remaining value is a percentage of the new cost of theinvestment (Boehlje and Eidman). The percent remaining value is calculated from equations developed by theAmerican Society of Agricultural Engineers (ASAE) based on equipment type and years of life. The life inyears is estimated by dividing the wear out life, as given by ASAE by the annual hours of use in this operation.For other investments including irrigation systems, buildings, and miscellaneous equipment, the value at the endof its useful life is zero. The salvage value for land is the purchase price because land does not depreciate.
Capital Recovery Factor. Capital recovery factor is the amortization factor or annual payment whose presentvalue at compound interest is 1. The amortization factor is a table value that corresponds to the interest rateused and the life of the machine.
Interest Rate. The interest rate of 6.23% used to calculate capital recovery cost is the United States Departmentof Agriculture-Economic Reporting Service’s (USDA-ERS) ten year average of California’s agricultural sectorlong-term realized rate of return to these specialized resources that can only be used effectively in theagricultural sector.
Building. The shop building is a 400 square foot metal building or buildings on a cement slab.

2004 Wine Grape Cost and Return Study North Coast/Sonoma County UC Cooperative Extension 13
Land. Land is valued at $65,000 per acre. This study assumes the land was purchased for planting a vineyard.Because only 30 of the 35 acres are planted to grapes, land is valued at $75,833 per plantable acre.
Drip Irrigation System. Since the vineyard is established on land previously planted to grapevines it isassumed to have an existing well and an adequate water supply. A new pump, 15 horsepower (hp) motor, filtersystem, and fertilizer injector will be installed along with the drip irrigation system prior to planting. The costof these components plus drip laterals and the labor to install each are included in the irrigation system cost.Water and fertilizers are pumped to the vineyard through a filtration station into a mainline, sub-mains and thenthe drip laterals along the vine rows. In the first year, one, one-half gallon per minute emitter is punched intothe lateral 18-inches from each stake. A second emitter is added in Year 2 so that each vine is centered betweentwo emitters.
Frost Protection System. There are several components of the frost protection system: a 12 acre-footreservoir, motor, pump, and overhead sprinklers. The reservoir is designed to hold enough water to protect thevineyard during the frost season. Water is pumped from the reservoir by the 1,650 gallons per minute (gpm)booster pump to the overhead sprinklers. Sprinkler risers are spaced 36 by 48 feet throughout the vineyardsecured to existing highway stakes.
Fuel Tanks. A single 250-gallon fuel tank using gravity feed is on a metal stand. The tank is set up in acement containment pad that meets federal, state, and county regulations.
Tools. This includes shop, hand, and miscellaneous field tools.
Establishment Cost. An establishment cost is the sum of the costs for land preparation, trellis system, vines,planting, cash overhead and production expenses for growing the vines through the first year that grapes areharvested. The vineyard establishment cost is used to determine the capital recovery cost, during the productionyears. The Total Accumulated Net Cash Cost on Table 1 in the third year represents the establishment cost.For this study the cost is $16,657 per acre or $499,710 for the 30-acre vineyard. The establishment cost isamortized over the remaining 22 years the vineyard is in production.
Equipment. Farm equipment is purchased either new or used. In Table 5, the new purchase price is adjustedto 60% to indicate a mix of new and used equipment. Equipment costs are composed of three parts: non-cashoverhead, cash overhead, and operating costs. Both of the overhead factors have been discussed in previoussections. The operating costs consist of repairs, fuel, and lubrication and are discussed under operating costs.
Table Values. Due to rounding, the totals may be slightly different from the sum of the components.

2004 Wine Grape Cost and Return Study North Coast/Sonoma County UC Cooperative Extension 14
REFERENCES
American Society of Agricultural Engineers. 1994. American Society of Agricultural Engineers StandardsYearbook. Russell H. Hahn and Evelyn E. Rosentreter (ed.) St. Joseph, Missouri. 41st edition.
Boehlje, Michael D., and Vernon R. Eidman. 1984. Farm Management. John Wiley and Sons. New York, NewYork
California Department of Food and Agriculture. 1999, 2000, 2001, 2002, 2003. Final Grape Crush Report1998 - 2002 Crop. California Agricultural Statistics Service and Federal State Market News Service.Sacramento, California. http://www.nass.usda.gov/ca/bul/crush/indexgcb.htm. Internet accessed February2004.
Integrated Pest Management Education and Publications. 2002. UC Pest Management Guidelines, Grape. In M.L. Flint (ed.) UC IPM Pest Management Guidelines. University of California. Division of Agriculture andNatural Resources. Oakland, California. Publication 3448. http://www.ipm.ucdavis.edu Internet accessedJanuary 2004.
Lewis, D.J., R. Smith, A. Baker, G. Davis, C. Gin, C. Mandel, B. Saljulga, C. Sanders. 2001. Vineyard SiteAssessment Guide: A primer for Effective Interaction with Resource and Regulatory Agencies in SonomaCounty. University of California Cooperative Extension, Sonoma County, CA.
Russian River Valley Winegrowers. P.O. Box 16, Fulton, California. http://rrvw.org/. Internet accessedFebruary 2004.
Smith, Rhonda, Karen Klonsky, and Pete Livingston. 1999. Sample Costs to Establish A Vineyard And ProduceWine Grapes, Chardonnay, Sonoma County – 1999. University of California, Cooperative Extension.Department of Agricultural and Resource Economics. Davis, CA.
Sonoma County Grape Growers Association. P.O. Box 1959, Sebastopol, California.http://www.sonomagrapevine.org/. Internet accessed February 2004.
University of California, Division of Agriculture and Natural Resources. 1992. Grape Pest Management.Donald L. Flaherty, et. al. (ed.) Second Edition. University of California, Division of Agriculture andNatural Resources. Oakland, California. Publication 3343.
United States Department of Agriculture-Economic Reporting Service. Farm Financial Rations IndicatingSolvency and Profitability 1960 – 03, California. 2003.www.ers.usda.gov/data/farmbalancesheet/fbsdmu.htm. Internet accessed January 5, 2004.
2004 Wine Grape Cost and Return Study North Coast/Sonoma County UC Cooperative Extension 15
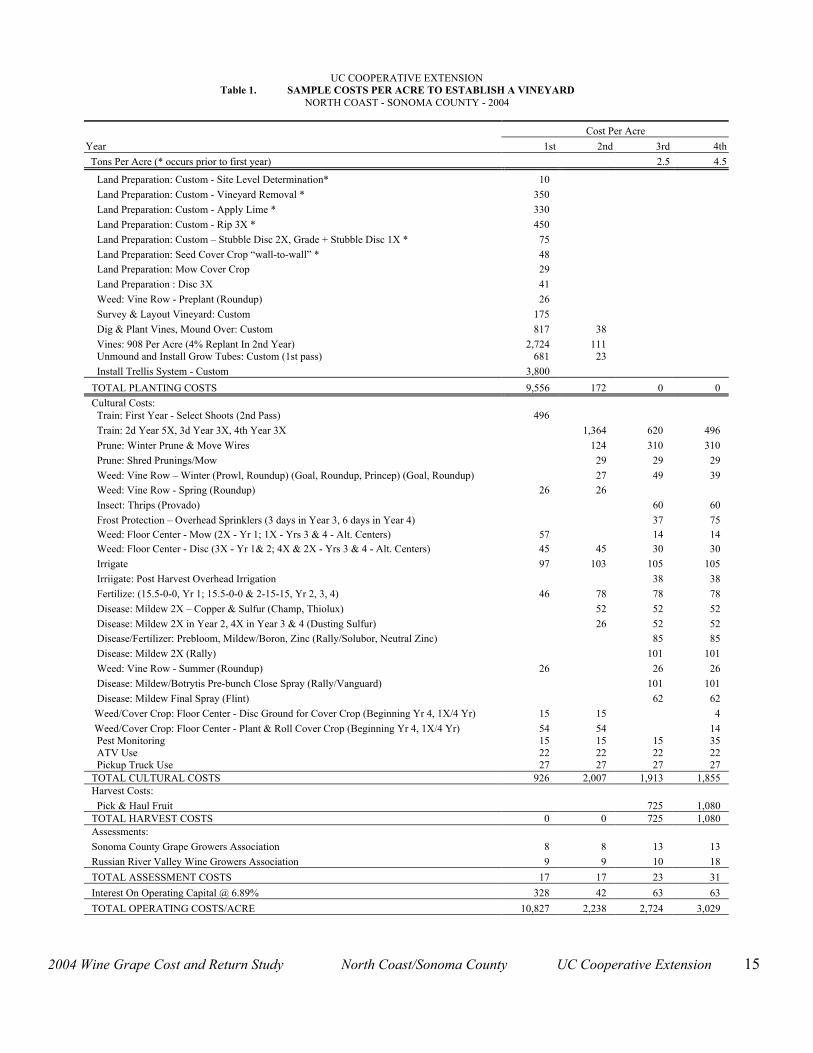
UC COOPERATIVE EXTENSIONTable 1. SAMPLE COSTS PER ACRE TO ESTABLISH A VINEYARD
NORTH COAST - SONOMA COUNTY - 2004
Cost Per Acre
Year 1st 2nd 3rd 4th
Tons Per Acre (* occurs prior to first year) 2.5 4.5
Land Preparation: Custom - Site Level Determination* 10
Land Preparation: Custom - Vineyard Removal * 350
Land Preparation: Custom - Apply Lime * 330
Land Preparation: Custom - Rip 3X * 450
Land Preparation: Custom – Stubble Disc 2X, Grade + Stubble Disc 1X * 75
Land Preparation: Seed Cover Crop “wall-to-wall” * 48 Land Preparation: Mow Cover Crop 29
Land Preparation : Disc 3X 41
Weed: Vine Row - Preplant (Roundup) 26
Survey & Layout Vineyard: Custom 175
Dig & Plant Vines, Mound Over: Custom 817 38
Vines: 908 Per Acre (4% Replant In 2nd Year) 2,724 111 Unmound and Install Grow Tubes: Custom (1st pass) 681 23
Install Trellis System - Custom 3,800
TOTAL PLANTING COSTS 9,556 172 0 0
Cultural Costs: Train: First Year - Select Shoots (2nd Pass) 496
Train: 2d Year 5X, 3d Year 3X, 4th Year 3X 1,364 620 496
Prune: Winter Prune & Move Wires 124 310 310
Prune: Shred Prunings/Mow 29 29 29
Weed: Vine Row – Winter (Prowl, Roundup) (Goal, Roundup, Princep) (Goal, Roundup) 27 49 39 Weed: Vine Row - Spring (Roundup) 26 26
Insect: Thrips (Provado) 60 60
Frost Protection – Overhead Sprinklers (3 days in Year 3, 6 days in Year 4) 37 75 Weed: Floor Center - Mow (2X - Yr 1; 1X - Yrs 3 & 4 - Alt. Centers) 57 14 14 Weed: Floor Center - Disc (3X - Yr 1& 2; 4X & 2X - Yrs 3 & 4 - Alt. Centers) 45 45 30 30
Irrigate 97 103 105 105
Irriigate: Post Harvest Overhead Irrigation 38 38
Fertilize: (15.5-0-0, Yr 1; 15.5-0-0 & 2-15-15, Yr 2, 3, 4) 46 78 78 78
Disease: Mildew 2X – Copper & Sulfur (Champ, Thiolux) 52 52 52
Disease: Mildew 2X in Year 2, 4X in Year 3 & 4 (Dusting Sulfur) 26 52 52 Disease/Fertilizer: Prebloom, Mildew/Boron, Zinc (Rally/Solubor, Neutral Zinc) 85 85
Disease: Mildew 2X (Rally) 101 101
Weed: Vine Row - Summer (Roundup) 26 26 26
Disease: Mildew/Botrytis Pre-bunch Close Spray (Rally/Vanguard) 101 101
Disease: Mildew Final Spray (Flint) 62 62
Weed/Cover Crop: Floor Center - Disc Ground for Cover Crop (Beginning Yr 4, 1X/4 Yr) 15 15 4
Weed/Cover Crop: Floor Center - Plant & Roll Cover Crop (Beginning Yr 4, 1X/4 Yr) 54 54 14 Pest Monitoring 15 15 15 35 ATV Use 22 22 22 22 Pickup Truck Use 27 27 27 27TOTAL CULTURAL COSTS 926 2,007 1,913 1,855Harvest Costs:
Pick & Haul Fruit 725 1,080TOTAL HARVEST COSTS 0 0 725 1,080Assessments:
Sonoma County Grape Growers Association 8 8 13 13
Russian River Valley Wine Growers Association 9 9 10 18
TOTAL ASSESSMENT COSTS 17 17 23 31
Interest On Operating Capital @ 6.89% 328 42 63 63
TOTAL OPERATING COSTS/ACRE 10,827 2,238 2,724 3,029

2004 Wine Grape Cost and Return Study North Coast/Sonoma County UC Cooperative Extension 16
UC COOPERATIVE EXTENSIONTable 1. Continued
Cost Per Acre
Year 1st 2nd 3rd 4th
Tons Per Acre 2.5 4.5
Cash Overhead Costs: Office Expense 250 250 250 250 Liability Insurance 17 17 17 17 Sanitation Fee 15 15 15 15 Manager Salary (25% Time, includes payroll overhead) 558 558 558 558 Property Taxes 806 806 806 806 Property Insurance 33 32 32 32 Investment Repairs 143 143 143 143TOTAL CASH OVERHEAD COSTS 1,822 1,821 1,820 1,821TOTAL CASH COSTS/ACRE 12,649 4,059 4,544 4,850INCOME/ACRE FROM PRODUCTION 0 0 4,595 8,271
NET CASH COSTS/ACRE FOR THE YEAR 12,649 4,059 0 0PROFIT/ACRE ABOVE CASH COSTS 0 0 51 3,421ACCUMULATED NET CASH COSTS/ACRE 12,649 16,708 16,657 13,236
Capital Recovery Cost: Shop Building 20 20 20 20 Land 4,724 4,724 4,724 4,724 Drip Irrigation System 136 136 136 136 Frost Protection System 191 191 191 191 Fuel Tank: 1 - 250 Gallon 3 3 3 3 Reservoir: 12 AcFt 227 227 227 227 Shop Tools 9 9 9 9 Equipment 159 152 135 152TOTAL CAPITAL RECOVERY COST 5,469 5,462 5,445 5,462
TOTAL COST/ACRE FOR THE YEAR 18,118 9,521 9,989 10,312INCOME/ACRE FROM PRODUCTION 0 0 4,595 8,271TOTAL NET COST/ACRE FOR THE YEAR 18,118 9,521 5,394 2,041TOTAL ACCUMULATED NET COST/ACRE 18,118 27,639 33,033 35,074

2004 Wine Grape Cost and Return Study North Coast/Sonoma County UC Cooperative Extension 17
UC COOPERATIVE EXTENSIONTable 2. COSTS PER ACRE TO PRODUCE WINE GRAPE
NORTH COAST - SONOMA COUNTY - 2004
Operation Cash and Labor Cost per AcreTime Labor Fuel, Lube Material Custom/ Total Your
Operation (Hrs/A) Cost & Repairs Cost Rent Cost CostCULTURAL:Prune: Winter 18.00 279 0 0 0 279Prune: Winter-Retie & Move Wires 8.00 124 0 0 0 124Weed: Vine Row - Winter (Goal, Roundup) 0.84 20 2 17 0 39Weed/Prune: Floor Centers - Shred Prunings/Mow (Alt Rows) 0.43 10 4 0 0 14Weed: Floor Centers - Mow Non-Pruning Centers (Alt Rows) 0.43 10 4 0 0 14Disease: 2X - Copper & Sulfur (Champ, Thiolux) 0.38 9 3 28 0 40Frost Protection: Overhead Sprinklers 6X 3.00 47 0 28 0 75Disease: Mildew 5X (Dusting Sulfur) - Alt. Rows 2.21 53 15 8 0 76Weed: Floor Center - Mow Alternate Centers 0.43 10 4 0 0 14Sucker: Cordons 2X 16.00 248 0 0 0 248Canopy: Move Wires 2X 16.00 248 0 0 0 248Sucker: Trunks 8.00 124 0 0 0 124Insect: Leafhoppers 1X/3Yr (Provado) 0.38 9 3 10 0 22Insect: Mites 2X/3Yr (Acramite) 0.76 18 6 35 0 59Weed: Floor Centers - Disc Alternate Centers 2X 0.48 12 3 0 0 15Weed: Vine Row - Spring 2X/3Yr (Fire Power) 0.16 4 0 3 0 7Weed: Vine Row - Spring 1X/3Yr (Rely) 0.38 9 3 4 0 16Disease/Fertilizer: Prebloom, Mildew/Boron, Zinc (Rally/Solubor, Neutral Zinc) 1.15 28 9 49 0 85Disease: Mildew Mid-Season 2X (Rally) 1.67 40 13 48 0 101Fertilize: N (CaNO3) 0.00 0 0 12 0 12Canopy: Leaf Removal 12.00 186 0 0 0 186Canopy: Hedging 0.43 10 5 0 0 16Fertilize: NPK (2-15-15) 0.00 0 0 66 0 66Disease: Mildew 3X (Dusting Sulfur) 2.21 53 15 5 0 73
Disease: Mildew/Botrytis - Pre-bunch Close (Rally/Vanguard) 1.15 28 9 65 0 101Crop Adjustment: Fruit Thin 18.00 279 0 0 0 279Irrigate 12X (1X/week) 3.30 51 0 20 0 71
Disease: Mildew Late Season (Flint) 2.29 55 18 52 0 125Fertilize: Potassium (Thiosulfate) 0.00 0 0 24 0 24Pickup Truck Use 0.85 20 6 0 0 27ATV Use 0.85 20 2 0 0 22
Pest Monitoring PCA 0.00 0 0 0 35 35Fertilize: Tissue Analysis - 1X/ 3 Yrs 0.00 0 0 0 3 3
TOTAL CULTURAL COSTS 119.80 2,006 125 473 38 2,641
HARVEST:
Harvest & Haul 0.00 0 0 0 840 840
TOTAL HARVEST COSTS 0.00 0 0 0 840 840
Postharvest:Irrigation: Overhead Sprinklers 1.50 23 0 14 0 38Cover Crop: Disc Centers 1X/4 Yr 0.12 3 1 0 0 4Cover Crop: Plant 1X/4 Yr 0.12 3 1 10 0 14
TOTAL POSTHARVEST COSTS 1.74 29 2 25 0 56 Assessment:Sonoma County Grape Growers Association 0.00 0 0 13 0 13
Russian River Valley Winegrowers 0.00 0 0 24 0 24
TOTAL ASSESSMENT COSTS 0.00 0 0 37 0 37 Interest on operating capital @ 6.89% 84
TOTAL OPERATING COSTS/ACRE 2,035 127 534 878 3,657
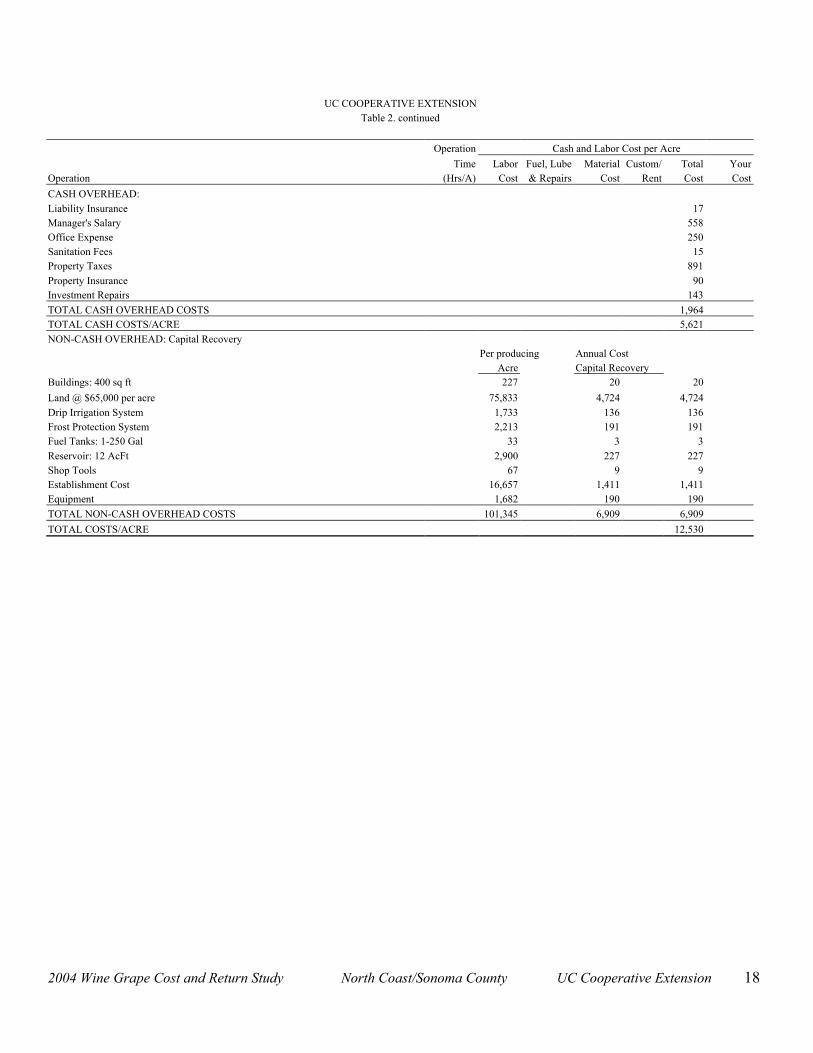
2004 Wine Grape Cost and Return Study North Coast/Sonoma County UC Cooperative Extension 18
UC COOPERATIVE EXTENSIONTable 2. continued
Operation Cash and Labor Cost per Acre
Time Labor Fuel, Lube Material Custom/ Total YourOperation (Hrs/A) Cost & Repairs Cost Rent Cost Cost
CASH OVERHEAD:Liability Insurance 17Manager's Salary 558Office Expense 250Sanitation Fees 15Property Taxes 891Property Insurance 90Investment Repairs 143
TOTAL CASH OVERHEAD COSTS 1,964 TOTAL CASH COSTS/ACRE 5,621 NON-CASH OVERHEAD: Capital Recovery
Per producing Annual CostAcre Capital Recovery
Buildings: 400 sq ft 227 20 20
Land @ $65,000 per acre 75,833 4,724 4,724Drip Irrigation System 1,733 136 136Frost Protection System 2,213 191 191Fuel Tanks: 1-250 Gal 33 3 3Reservoir: 12 AcFt 2,900 227 227Shop Tools 67 9 9Establishment Cost 16,657 1,411 1,411Equipment 1,682 190 190
TOTAL NON-CASH OVERHEAD COSTS 101,345 6,909 6,909
TOTAL COSTS/ACRE 12,530

2004 Wine Grape Cost and Return Study North Coast/Sonoma County UC Cooperative Extension 19
UC COOPERATIVE EXTENSIONTable 3. COSTS AND RETURNS PER ACRE TO PRODUCE WINE GRAPE
NORTH COAST - SONOMA COUNTY 2004
Quantity/ Price or Value or Your Acre Unit Cost/Unit Cost/Acre CostGROSS RETURNS
Chardonnay 6.00 ton 1,838 11,028 OPERATING COSTSHerbicide:
Goal 2XL 1.00 pint 13.32 13Roundup Ultra Max 0.50 pint 7.50 4Fire Power 0.67 qt 4.63 3Rely 0.50 qt 7.15 4
Fungicide:Champ 2 Flowable 3.60 pint 4.69 17Thiolux Micronized Sulfur 12.00 lb 0.90 11Dusting Sulfur 80.00 lb 0.16 13Rally 20.00 oz 4.75 95Vanguard 10.00 oz 4.09 41Flint 4.00 oz 12.99 52
Water:Water - Frost Protection 3.96 acin 7.18 28Water - Pumped 3.34 acin 6.03 20Water - Post Harvest 2.00 acin 7.18 14
Insecticide:Provado Solupak 0.25 oz 40.90 10
Miticide:Acramite 50 WS 0.50 lb 70.00 35
Fertilizer:Solubor 4.90 lb 4.40 22Neutral Zinc 3.84 lb 0.92 415.5-0-0 CaNO3 Solution Grade 15.50 lb N 0.77 122-15-15 20.00 gal 3.30 66Potassium Thiosulfate 10.00 gal 2.36 24
Contract:Mechanical Harvest 6.00 ton 125.00 750Haul to Crusher 6.00 ton 15.00 90PCA Fee 1.00 acre 35.00 35Tissue Analysis 1.00 acre 3.00 3
Cover Crop:Seed 5.00 lb 2.10 10
Assessments:SCGGA Fee 1.00 acre 12.50 13RRVW Fee 6.00 ton 4.00 24
Labor (machine) 21.29 hrs 20.00 426Labor (non-machine) 103.80 hrs 15.50 1,609Fuel - Gas 3.35 gal 1.88 6Fuel - Diesel 48.72 gal 1.45 71Lube 12Machinery repair 38Interest on operating capital @ 6.89% 84
TOTAL OPERATING COSTS/ACRE 3,657 NET RETURNS ABOVE OPERATING COSTS 7,371

2004 Wine Grape Cost and Return Study North Coast/Sonoma County UC Cooperative Extension 20
UC COOPERATIVE EXTENSIONTable 3. continued
Quantity/ Price or Value or Your Acre Unit Cost/Unit Cost/Acre CostCASH OVERHEAD COSTS:
Liability Insurance 17
Manager's Salary 558
Office Expense 250Sanitation Fees 15Property Taxes 891Property Insurance 90Investment Repairs 143
TOTAL CASH OVERHEAD COSTS/ACRE 1,964 TOTAL CASH COSTS/ACRE 5,621 NON-CASH OVERHEAD COSTS (Capital Recovery)Buildings: 400 sq ft 20Land @ $65,000 per acre 4,724
Drip Irrigation System 136Frost Protection System 191Fuel Tanks: 1-250G 3Reservoir: 12 AcFt 227Shop Tools 9Establishment Cost 1,411Equipment 190
TOTAL NON-CASH OVERHEAD COSTS/ACRE 6,909 TOTAL COSTS/ACRE 12,530
NET RETURNS ABOVE TOTAL COSTS -1,502

2004 Wine Grape Cost and Return Study North Coast/Sonoma County UC Cooperative Extension 21
UC COOPERATIVE EXTENSIONTable 4. MONTHLY CASH COSTS PER ACRE TO PRODUCE WINE GRAPE
NORTH COAST - SONOMA COUNTY 2004
Beginning JAN 04 JAN FEB MAR APR MAY JUN JUL AUG SEP OCT NOV DEC TOTALEnding DEC 04 04 04 04 04 04 04 04 04 04 04 04 04 Cultural:Prune: Winter 279 279Prune: Winter-Retie & Move Wires 124 124Weed: Vine Row - Winter (Goal, Roundup) 39 39Weed/Prune: Floor Centers - Shred Prunings/Mow (Alt Rows) 14 14Weed: Floor Centers - Mow Non Pruning Centers (Alt Rows) 14 14Disease: 2X - Copper & Sulfur (Thiolux, Champ) 40 40Frost Protection: Overhead Sprinklers 6X 25 25 25 75Disease: Mildew 5X (Dusting Sulfur) - Alt. Rows 24 39 13 76Weed: Floor Center - Mow Alternate Centers 14 14Sucker: Cordons 124 124 248Canopy: Move Wires 2X 124 124 248Sucker: Trunks 124 124Insect: Leafhoppers 1X/3Yr (Provado) 22 22Insect: Mites 2X/3Yr (Acramite) 59 59Weed: Floor Centers - Disc Alternate Centers 7 7 15Weed: Vine Row - Spring 2X/3Yr (Fire Power) 7 7Weed: Vine Row - Spring 1X/3Yr (Rely) 16 16Disease/Fertilizer: Prebloom, Mildew/B, Zn (Rally/Solubor, Zinc) 85 85Disease: Mildew Mid-Season (Rally) 50 50 101Fertilize: N (CaNO3) 12 12Canopy: Leaf Removal 186 186Canopy: Hedging 16 16Fertilize: NPK (2-15-15) 33 33 66Disease: Mildew 3X (Dusting Sulfur) 24 49 73Disease: Mildew/Botrytis - Pre-bunch Close (Rally/Vanguard) 101 101Crop Adjustment: Fruit Thin 279 279Irrigate 12X 24 24 24 71Disease: Mildew Late Season (Flint) 62 62 125
Fertilize: Potassium (Thiosulfate) 24 24Pickup Truck Use 2 2 2 2 2 2 2 2 2 2 2 2 27
ATV Use 2 2 2 2 2 2 2 2 2 2 2 2 22
Pest Monitoring PCA 4 4 4 4 4 4 4 4 4 4 35Fertilize: Tissue Analysis 1X/ 3 Yr 3 3
TOTAL CULTURAL COSTS 449 8 126 334 668 437 478 94 31 8 4 4 2,641Harvest:
Harvest & Haul 840 840
TOTAL HARVEST COSTS 840 840Postharvest:Irrigation: Overhead Sprinklers 38 38Cover Crop: Disc Centers 1X/4 Yr 4 4Cover Crop: Plant 1X/4 Yr 14 14
TOTAL POSTHARVEST COSTS 38 18 56Assessment:Sonoma County Grape Growers 13 13Russian River Valley Wine 24 24
TOTAL ASSESSMENT COSTS 37 37Interest on operating capital 3 3 3 5 9 12 14 15 20 0 0 0 84
TOTAL OPERATING COSTS/ACRE 452 10 129 339 678 449 492 109 966 26 4 4 3,657

2004 Wine Grape Cost and Return Study North Coast/Sonoma County UC Cooperative Extension 22
UC COOPERATIVE EXTENSIONTable 4. continued
Beginning JAN 04 JAN FEB MAR APR MAY JUN JUL AUG SEP OCT NOV DEC TOTALEnding DEC 04 04 04 04 04 04 04 04 04 04 04 04 04
OVERHEAD:Liability Insurance 17 17Manager's Salary 56 56 56 56 56 56 56 56 56 56 558Office Expense 25 25 25 25 25 25 25 25 25 25 250Sanitation Fees 1 1 1 1 1 1 1 1 1 1 15Property Taxes 891 891Property Insurance 45 45 90Investment Repairs 12 12 12 12 12 12 12 12 12 12 12 12 143
TOTAL CASH OVERHEAD COSTS 1,047 94 94 94 94 94 139 94 94 94 12 12 1,964
TOTAL CASH COSTS/ACRE 1,499 104 223 433 772 543 631 203 1,060 120 16 16 5,621
§ Postharvest operation costs are discounted back to the time of the first harvest

2004 Wine Grape Cost and Return Study North Coast/Sonoma County UC Cooperative Extension 23
UC COOPERATIVE EXTENSIONTable 5. WHOLE FARM ANNUAL EQUIPMENT, INVESTMENT, AND BUSINESS OVERHEAD COSTS
NORTH COAST - SONOMA COUNTY 2004
ANNUAL EQUIPMENT COSTS
- Cash Overhead -
Yrs Salvage Capital Insur-Yr Description Price Life Value Recovery ance Taxes Total04 60 HP 4WD Tractor 29,000 16 5,194 2,717 116 171 3,00304 ATV 4WD 6,700 5 3,003 1,070 33 49 1,15204 Brush Shredder 6' 6,900 15 662 693 26 38 75704 Disc - Offset 5' 4,350 15 418 437 16 24 47704 Duster - 3 Pt 4,700 12 651 530 18 27 57404 Orchard Sprayer 300 G 10,000 10 1,768 1,241 40 59 1,33904 Pickup Truck 1/2 T 26,000 7 9,863 3,529 121 179 3,82904 Ringroller - 5' 657 20 34 57 2 3 6304 Seed Drill - 5' 7,000 10 1,238 869 28 41 93804 Sprayer ATV 20 Gal 475 10 84 59 2 3 6404 Vine Trimmer 14,200 10 228 1,933 49 72 2,054
TOTAL 109,982 23,143 13,135 450 666 14,250
60% of New Cost * 65,989 13,886 7,881 270 399 8,550
* Used to reflect a mix of new and used equipment.
ANNUAL INVESTMENT COSTS
Cash OverheadYrs Salvage Capital Insur-
Description Price Life Value Recovery ance Taxes Repairs TotalINVESTMENTBuildings: 400 SqFt 6,800 20 680 586 25 37 136 785Drip Irrigation System 52,000 25 5,200 4,065 193 286 1,040 5,585Vineyard Establishment Cost 499,710 22 42,332 1,689 2,499 0 46,520Frost Protection System 66,400 20 6,640 5,722 247 365 1,328 7,662Fuel Tanks: 1-250G 1,000 25 100 78 4 6 20 107Land 2,275,000 23 2,275,000 141,732 0 22,750 0 164,482Reservoir: 12 AcFt 87,000 25 8,700 6,802 323 479 1,740 9,344Shop Tools 2,000 10 200 260 7 11 40 318
TOTAL INVESTMENT 2,989,910 2,296,520 201,577 2,489 26,432 4,304 234,802
ANNUAL BUSINESS OVERHEAD COSTS
Units/ Price/ TotalDescription Farm Unit Unit CostLiability Insurance 30 acre 17.20 516Manager's Salary 25% Time 30 acre 558.00 16,740Office Expense 30 acre 250.00 7,500Sanitation Fees 30 acre 14.53 436

2004 Wine Grape Cost and Return Study North Coast/Sonoma County UC Cooperative Extension 24
UC COOPERATIVE EXTENSIONTable 6. HOURLY EQUIPMENT COSTS
NORTH COAST - SONOMA COUNTY 2004
COSTS PER HOUR
Actual -- Cash Overhead -- -------- Operating --------Hours Capital Insur- Fuel & Total Total
Yr Description Used Recovery ance Taxes Repairs Lube Oper. Costs/Hr.04 60 HP 4WD Tractor 496.40 3.28 0.14 0.21 0.70 4.91 5.61 9.2404 ATV 4WD 172.40 3.72 0.11 0.17 0.50 1.44 1.94 5.9504 Brush Shredder 6' 39.00 10.66 0.39 0.58 3.10 0.00 3.10 14.7404 Disc - Offset 5' 18.20 14.41 0.53 0.79 0.67 0.00 0.67 16.4004 Duster - 3 Pt 132.70 2.40 0.08 0.12 0.65 0.00 0.65 3.2504 Orchard Sprayer 300 G 244.80 3.04 0.10 0.14 1.69 0.00 1.69 4.9704 Pickup Truck 1/2 T 142.50 14.86 0.51 0.76 1.91 5.40 7.31 23.4304 Ringroller - 5' 3.70 9.37 0.38 0.56 0.07 0.00 0.07 10.3804 Seed Drill - 5' 3.70 141.61 4.54 6.72 1.88 0.00 1.88 154.7404 Sprayer ATV 20 Gal 29.90 1.18 0.04 0.06 0.13 0.00 0.13 1.40
04 Vine Trimmer 12.90 89.92 2.27 3.36 5.87 0.00 5.87 101.42

2004 Wine Grape Cost and Return Study North Coast/Sonoma County UC Cooperative Extension 25
UC COOPERATIVE EXTENSIONTable 7. RANGING ANALYSIS
NORTH COAST - SONOMA COUNTY 2004
COSTS PER ACRE AT VARYING YIELDS FOR WINE GRAPE
YIELD (ton/acre) 3.00 4.00 5.00 6.00 7.00 8.00 9.00OPERATING COSTS/ACRE:Cultural Cost 2,641 2,641 2,641 2,641 2,641 2,641 2,641Harvest Cost 420 560 700 840 980 1,120 1,260Postharvest Cost 56 56 56 56 56 56 56Assessment Cost 25 28 33 37 41 44 48Interest on operating capital 81 82 83 84 85 85 86TOTAL OPERATING COSTS/ACRE 3,223 3,367 3,513 3,658 3,803 3,946 4,091TOTAL OPERATING COSTS/ton 1,074 842 703 610 543 493 455CASH OVERHEAD COSTS/ACRE 1,964 1,964 1,964 1,964 1,964 1,964 1,964TOTAL CASH COSTS/ACRE 5,187 5,331 5,477 5,622 5,767 5,910 6,055TOTAL CASH COSTS/ton 1,729 1,333 1,095 937 824 739 673
NON-CASH OVERHEAD COSTS/ACRE 6,909 6,909 6,909 6,909 6,909 6,909 6,909TOTAL COSTS/ACRE 12,096 12,240 12,386 12,531 12,676 12,819 12,964
TOTAL COSTS/ton 4,032 3,060 2,477 2,089 1,811 1,602 1,440
NET RETURNS PER ACRE ABOVE OPERATING COSTS
PRICE YIELD (ton/acre)
$/ton 3.00 4.00 5.00 6.00 7.00 8.00 9.00
1,550 1,427 2,833 4,237 5,642 7,047 8,454 9,8591,650 1,727 3,233 4,737 6,242 7,747 9,254 10,7591,750 2,027 3,633 5,237 6,842 8,447 10,054 11,6591,850 2,327 4,033 5,737 7,442 9,147 10,854 12,5591,950 2,627 4,433 6,237 8,042 9,847 11,654 13,4592,050 2,927 4,833 6,737 8,642 10,547 12,454 14,359
2,150 3,227 5,233 7,237 9,242 11,247 13,254 15,259
NET RETURNS PER ACRE ABOVE CASH COSTS
PRICE YIELD (ton/acre)
$/ton 3.00 4.00 5.00 6.00 7.00 8.00 9.001,550 -537 869 2,273 3,678 5,083 6,490 7,8951,650 -237 1,269 2,773 4,278 5,783 7,290 8,7951,750 63 1,669 3,273 4,878 6,483 8,090 9,6951,850 363 2,069 3,773 5,478 7,183 8,890 10,5951,950 663 2,469 4,273 6,078 7,883 9,690 11,4952,050 963 2,869 4,773 6,678 8,583 10,490 12,395
2,150 1,263 3,269 5,273 7,278 9,283 11,290 13,295
NET RETURNS PER ACRE ABOVE TOTAL COSTS
PRICE YIELD (ton/acre)$/ton 3.00 4.00 5.00 6.00 7.00 8.00 9.001,550 -7,446 -6,040 -4,636 -3,231 -1,826 -419 9861,650 -7,146 -5,640 -4,136 -2,631 -1,126 381 1,8861,750 -6,846 -5,240 -3,636 -2,031 -426 1,181 2,7861,850 -6,546 -4,840 -3,136 -1,431 274 1,981 3,6861,950 -6,246 -4,440 -2,636 -831 974 2,781 4,5862,050 -5,946 -4,040 -2,136 -231 1,674 3,581 5,486
2,150 -5,646 -3,640 -1,636 369 2,374 4,381 6,386

2004 Wine Grape Cost and Return Study North Coast/Sonoma County UC Cooperative Extension 26
UC COOPERATIVE EXTENSION Table 8. COSTS AND RETURNS / BREAKEVEN ANALYSIS
NORTH COAST - SONOMA COUNTY 2004
COSTS AND RETURNS - PER ACRE BASIS
1. Gross 2. Operating 3. Net Returns 4. Cash 5. Net Returns 6. Total 7. Net ReturnsReturns Costs Above Oper. Costs Above Cash Costs Above Total
Crop Costs (1-2) Costs (1-4) Costs (1-6)Wine Grape 11,028 3,657 7,371 5,621 5,407 12,530 -1,502
COSTS AND RETURNS - TOTAL ACREAGE
1. Gross 2. Operating 3. Net Returns 4. Cash 5. Net Returns 6. Total 7. Net ReturnsReturns Costs Above Oper. Costs Above Cash Costs Above Total
Crop Costs (1-2) Costs (1-4) Costs (1-6)Wine Grape 330,084 109,712 221,128 168,618 162,222 375,901 -45,061
BREAKEVEN PRICES PER YIELD UNIT
-------- Breakeven Price To Cover --------Base Yield Yield Operating Cash Total
CROP (Units/Acre) Units Costs Costs Costs
Wine Grape 6.0 Ton 609.51 936.77 2,088.34
BREAKEVEN YIELDS PER ACRE
-------- Breakeven Yield To Cover --------Yield Base Price Operating Cash Total
CROP Units ($/Unit) Costs Costs Costs
----------- Yield Units / Acre -----------Wine Grape Ton 1,838 2.0 3.1 6.8

2004 Wine Grape Cost and Return Study North Coast/Sonoma County UC Cooperative Extension 27
UC COOPERATIVE EXTENSION
Table 9. DETAILS OF OPERATIONS
NORTH COAST – SONOMA COUNTY 2004
Operation Equipment Broadcast Material
Operation Month Power Unit Implement Material Rate/acre Unit
Prune: Winter January Labor
Prune: Winter – Re-tie & Move Wires January Labor
Weed: Vine Row -Winter January ATV - 4WD Sprayer - ATV 20 Gal Goal 2XL 1.00 pint
Roundup 0.50 pint
Weed/Prune: Floor Centers– Shred Prunings/ Mow (Alt Rows) March 60 HP 4WD Tractor Shredder/Mower - 6'
Weed: Floor Center- Mow No Prunings Centers (Alt Rows) March 60 HP 4WD Tractor Shredder/Mower – 6’
Disease: Powdery Mildew Cu & S Spray 2X March 60 HP 4WD Tractor Orch Sprayer - 300 Gal Champ 2.67 lb
Thiolux 12.00 lb
Frost Protection : Overhead Sprinklers 6X March Labor Water 2X 1.32 acin
April Labor Water 2X 1.32 acin
May Labor Water 2X 1.32 acin
Disease: Powdery Mildew Dusting Sulfur 5X March 60 HP 4WD Tractor Duster - 3 Point Sulfur Dust 10.00 lb
April 60 HP 4WD Tractor Duster - 3 Point Sulfur Dust 3X 30.00 lb
May 60 HP 4WD Tractor Duster - 3 Point Sulfur Dust 10.00 lb
Weed: Floor Centers– Mow Alternate Centers April 60 HP 4WD Tractor Shredder/Mower - 6'
Sucker: Shoot Thin Cordons 2X April Labor
May Labor
Sucker: Trunks May Labor
Canopy: Move Wires 2X April Labor
May Labor
Insect: Leafhopper (Sprayed 1X/3 Years) May 60 HP 4WD Tractor Orchard Sprayer - 300 Gal Provado 75 0.25 oz
Insect: Mites (Sprayed 2X/3 Years) May 60 HP 4WD Tractor Orchard Sprayer - 300 Gal Acaramite 0.50 lb
Weed: Floor Centers– Disc Alternate Center 2X May 60 HP 4WD Tractor Disc - Offset 5'
June 60 HP 4WD Tractor Disc – Offset 5’
Weed: Vine Row -Spring (2X/3 Years) May ATV - 4WD Sprayer - ATV 20 Gal Fire Power 0.67 qt
Weed: Vine Row – Spring (1X/3 Years) May ATV - 4WD Sprayer - ATV 20 Gal Rely 0.33 qt
Disease/Fertilizer: Pre-Bloom - Mildew/Zn & B May 60 HP 4WD Tractor Orchard Sprayer - 300 Gal Rally 5.00 oz
Solubor 4.90 lb
Neutral Zinc 3.84 lbs
Disease: Mildew Mid-season Sprays 2X May 60 HP 4WD Tractor Orchard Sprayer - 300 Gal Rally 5.00 oz
June 60 HP 4WD Tractor Orchard Sprayer - 300 Gal Rally 5.00 oz
Fertilize: Nitrogen June 15-0-0 15.5 lbs
Canopy: Leaf Removal June Labor
Canopy: Hedging June Labor
Fertilize: NPK 2X June 2-15-15 10.00 gal
July 2-15-15 10.00 gal
Disease: Mildew 3X June 60 HP 4WD Tractor Duster - 3 Point Sulfur Dust 10.00 lb
July 60 HP 4WD Tractor Duster - 3 Point Sulfur Dust 2X 20.00 lb
Disease: Mildew/Botrytis Pre-Bunch Close Spray June 60 HP 4WD Tractor Orchard Sprayer - 300 Gal Rally 5.00 oz
Vangard 10.00 oz
Crop Adjustment: Fruit Thin July Labor
Irrigate 12X (1X/week) July Labor Water 1.12 acin
August Labor Water 1.10 acin
September Labor Water 1.12 acin
Disease: Mildew Late Season 2X July 60 HP 4WD Tractor Orchard Sprayer - 300 Gal Flint 2.00 oz
August 60 HP 4WD Tractor Orchard Sprayer - 300 Gal Flint 2.00 oz
Fertilize: Potassium July Potassium Thiosulfate 10.00 gal
Harvest & Haul September Harvest - Contract
Haul - Contract
Irrigation: Postharvest Overhead Sprinklers September Labor Water 2.00 acin
Cover Crop: Disc Centers (1X/4 Years) October 60 HP 4WD Tractor Disc - Offset 5'
Cover Crop: Plant & Roll (1X/4 Years) October 60 HP 4WD Tractor Seed Drill - 5' Cover Crop Mix 5.00 lb
Ringroller - 5"