Embed Size (px)
Citation preview
Pore Formation Upon Nitriding Iron and Iron-Based Alloys:The Role of Alloying Elements and Grain Boundaries
B. SCHWARZ, H. GOHRING, S.R. MEKA, R.E. SCHACHERL, and E.J. MITTEMEIJER
Pure iron and a series of iron-based Fe-Me alloys (with Me = Al, Si, Cr, Co, Ni, and Ge) werenitrided in a NH3/H2 gas mixture at 923 K (650 �C). Different nitriding potentials were appliedto investigate the development of pores under ferrite and austenite stabilizing conditions. In allcases, pores developed in the nitrided microstructure, i.e., also and strikingly pure ferritic ironexhibited pore development. The pore development is shown to be caused by the decompositionof (homogeneous) nitrogen-rich Fe(-Me)-N phase into nitrogen-depleted Fe(-Me)-N phase andmolecular N2 gas. The latter, gas phase can be associated with such high pressure that thesurrounding iron-based matrix can yield. Thermodynamic assessments indicate that continueddecomposition, i.e., beyond the state where yielding is initiated, is possible. Precipitatingalloying-element nitrides, i.e., AlN, CrN, or Si3N4, in the diffusion zone below the surface,hinder the formation of pores due to the competition of alloying-element nitride (MexNy)precipitation and pore (N2) development; alloying elements reducing the solubility of nitrogenenhance pore formation. No pore formation was observed upon nitriding a single crystallinepure iron specimen, nitrided under ferrite stabilizing conditions, thereby exhibiting the essentialfunction of grain boundaries for nucleation of pores.
DOI: 10.1007/s11661-014-2581-x� The Minerals, Metals & Materials Society and ASM International 2014
I. INTRODUCTION
NITRIDING is a thermochemical surface treatmentapplied to improve the mechanical and chemical prop-erties of ferritic steel components.[1–3] The nitrided zonecan be subdivided into an outer iron-nitride compoundlayer, consisting of e-Fe3N1+x and/or c¢-Fe4N1�y, ontop of a diffusion zone of nitrogen in the ferrite matrix.
The finite rate of nitrogen supply to the specimensurface (owing to the finite rate of dissociation ofammonia at the surface of the specimen, as holds for theusually applied gaseous nitriding processes) is in com-petition with its inward diffusion into the substrate.Consequently, the concentration of interstitially dis-solved nitrogen at the surface, and also in the subsurfaceregions, of a nitrided pure iron specimen increasesgradually as a function of nitriding time (at constanttemperature).[4] If the ferrite is alloyed with nitrideforming alloying elements, such as Al, V, and Cr, theinwardly diffusing nitrogen atoms become consumed byalloying-element nitride development, which then gov-erns the shape of the developing nitrogen content depthprofile. The precipitated (semi-) coherent nitrides cause
a high hardness and a distinct residual stress-depthprofile of compressive nature in the surface adjacentregion, which effects are responsible for the considerableimprovement of especially the mechanical properties,e.g., the fatigue resistance. If the nitriding potential ishigh enough, then after a certain time, the nitrogensolubility limit of the ferrite matrix is surpassed leadingto the nucleation and growth of an iron-nitride com-pound layer at the surface, which can be associated withsignificant enhancement of the resistance against wear.[5]
Formation of pores in the iron-nitride compound layeris a well-known phenomenon.[6–10] The pores can occurwithin the grains and along the grain boundaries of theiron-nitride layer. The coalescence of individual pores atthe grain boundaries results in opened grain boundaries/micro-cracks. Pores, in the form of ‘‘open’’ grainboundaries in contact with the outer surface, can bebeneficial due to their function as reservoirs for lubri-cants to provide better tribological performance,[11] butin general pores are detrimental due to the associatedmechanical weakening of the material.Different contradictory mechanisms have been pre-
sented in the literature for pore formation in the iron-nitride compound layer upon nitriding; see the overviewpresented in Reference 9. The most widely acceptedtheory is based on the thermodynamic instability of theiron-nitride phases:[6,7,12] iron-nitride phases which arenot in direct contact with the nitriding atmosphere(NH3/H2 gas mixture or nitrogen plasma or salt bath)are, at the usual applied temperatures and pressures,thermodynamically unstable and tend to decomposeinto molecular N2 gas and iron.Development of pores upon nitriding is not restricted
to the iron-nitride compound layer. Pores can occur as
B.SCHWARZandH.GOHRING,Ph.D. Students, andS.R.MEKA,Research Scientist, are with the Max Planck Institute for IntelligentSystems (formerly Max Planck Institute for Metals Research), Heisen-bergstrasse 3, 70569 Stuttgart, Germany. Contact e-mails: [email protected], [email protected]. SCHACHERL, Research Scien-tist, and E.J. MITTEMEIJER, Professor, Head of Department PhaseTransformations, are with the Max Planck Institute for IntelligentSystems (formerly Max Planck Institute for Metals Research), and alsowith the Institute for Materials Science, University of Stuttgart,Heisenbergstrasse 3, 70569 Stuttgart, Germany
Manuscript submitted January 6, 2014.Article published online October 3, 2014
METALLURGICAL AND MATERIALS TRANSACTIONS A VOLUME 45A, DECEMBER 2014—6173
well in the diffusion zone, underneath the iron-nitridecompound layer, although this has been noticed rarely inthe literature: Nitriding of pure iron, employing nitrid-ing parameters (temperature and nitriding potential)corresponding with the austenite phase region of theLehrer diagram,[13] resulted in the growth of nitrogenaustenite from the surface accompanied by the develop-ment of pores along the austenite grain boundariesbelow the surface.[14] Upon prolonged nitriding of iron-based Fe-Me alloys, employing nitriding parameterscorresponding with the ferrite phase region of the Lehrerdiagram, pores can develop below the surface alonggrain boundaries in the ferritic matrix.[15–17]
In the case of iron-based alloys, the nitrogen absorbedby the specimen can have different chemical states:bonded in the alloying-element nitrides, adsorbed at thenitride platelet faces and dissolved in the matrix. Thenitrogen which is responsible for the porosity develop-ment is the less strongly bonded dissolved nitrogen.[18]
Until now the attention was largely devoted to poredevelopment in the iron-nitride compound layer,whereas little attention was paid on pore developmentin nitrogen ferrite and nitrogen austenite. Yet, as shownin this work, such pore formation in the nitrogendiffusion zone is a generally occurring phenomenon,leading to pore fractions of possibly 10 vol. pct andmore, and thus may have a pronouncedly negative effecton the mechanical properties. As commercial nitridingsteels are usually alloyed with a series of alloyingelements, it is essential to understand the influence of thedissolved alloying elements and/or the developing alloy-ing-element nitride particles on the pore formation innitrogen diffusion zones of nitrided steels.
Against the above background, the current projectaims at understanding of (i) the development of porosityin pure nitrogen ferrite and in pure nitrogen austeniteand (ii) the effects of alloying elements (Me = Al, Si,Cr, Co, Ni, and Ge) on pore formation in ferrite andaustenite. In order to reveal the role of grain boundarieson pore formation, experiments have also been per-formed on single crystal iron specimens.
II. THERMODYNAMICS OF GAS NITRIDINGAND PORE FORMATION
At a given temperature, a specific chemical potential ofnitrogen in a solid iron-nitrogen phase Fe[N] (as a-Fe[N](nitrogen ferrite), c-Fe[N] (nitrogen austenite), and the ironnitrides c¢-Fe4N1�y and e-Fe3N1+x), and thus a certainnitrogen concentration (activity) in the phase concerned,can in principle be realized (actually, at the surface of thesolid substrate; see what follows) by imposing an outer gasatmosphere of pure N2 gas at very high pressure. Thecorresponding equilibrium can be described as:
1
2N2 Ð N½ �; ½1�
where [N] denotes nitrogen dissolved in the solid sub-strate. The (hypothetical) N2 gas pressures which areneeded to establish certain chemical potentials, and
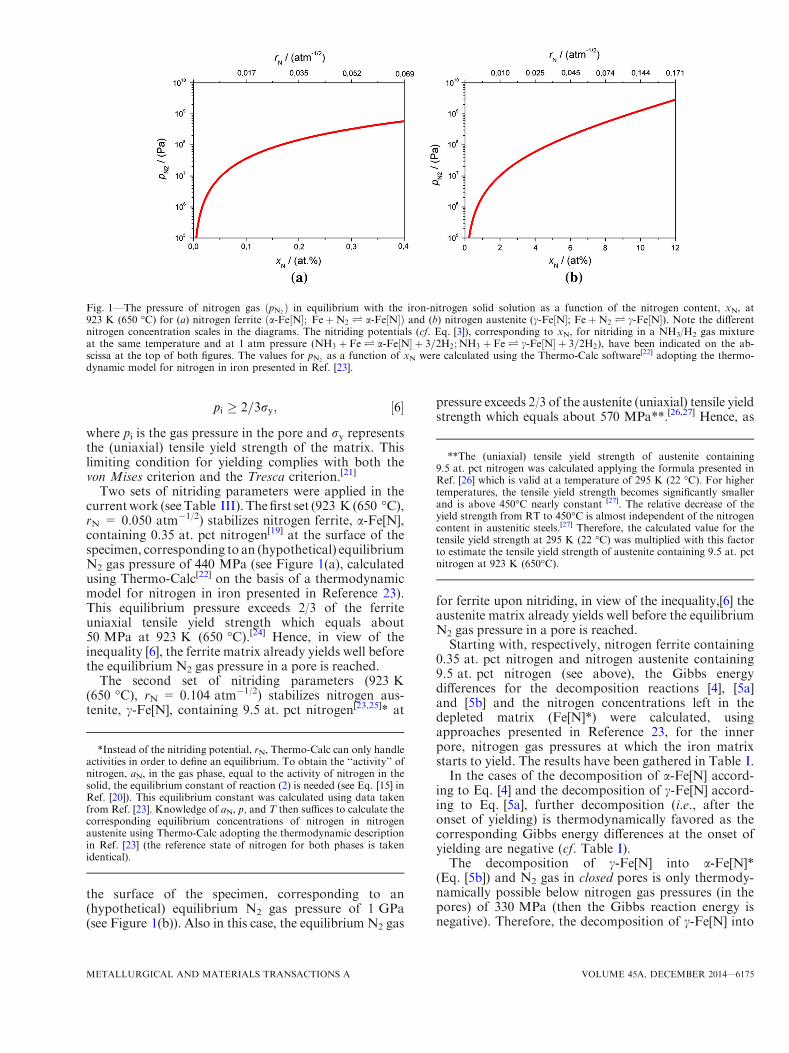
thus concentrations of dissolved nitrogen in a-Fe[N] orc-Fe[N] at a temperature of 923 K (650 �C) have beenplotted in Figure 1. These pressures are (with reason-able effort) technically unfeasible. Therefore, gasnitriding is usually performed with a gas mixture ofNH3 and H2 at atmospheric pressure. Upon operatingthis process, NH3 dissociates at the surface into H2 gasand nitrogen dissolved in the solid substrate. The cor-responding equilibrium can be described as:
NH3 Ð N½ � þ 3
2H2: ½2�
It is important to realize that establishment of thisequilibrium requires that thermal dissociation of NH3
can be ignored and that the recombination of nitrogenatoms adsorbed at the surface is negligible (if the latterwould not hold, a stationary state, instead of anequilibrium situation, would occur at the surface ofthe substrate; for full discussion see References 1, 19).The equilibrium concentration of dissolved nitrogen
in the iron-based Fe[N] phase and the nature of thisFe[N] phase, (i.e., a-Fe[N], c-Fe[N], c¢-Fe4N1�y, ore-Fe3N1+x) is determined by the temperature and thechemical potential of nitrogen which is directly propor-tional to the nitriding potential[20]
rN ¼p NH3ð Þp H2ð Þ3=2
; ½3�
where p is the partial pressure. Thus, the equilibriumnitrogen concentration in the specimen can be easily tunedby adjusting the composition of the nitriding gas atmo-sphere (see abscissa at the top of Figures 1(a) and (b)).The Fe[N] phase which is not in direct contact with
the nitriding gas atmosphere, i.e., the part of thesubstrate underneath the surface, is unstable withrespect to its decomposition into nitrogen-depletedFe[N]* and N2 gas. Thus, in the bulk of nitrogen ferriteand nitrogen austenite the following reactions (Eq. [4]and Eqs. [5a, 5b], respectively) can occur under releaseof Gibbs energy
a-Fe N½ � ! a-Fe N½ ��þN2; ½4�
c-Fe N½ � ! c-Fe N½ ��þN2; ½5a�
c-Fe N½ � ! a-Fe N½ ��þN2: ½5b�
The formation of N2 gas can lead to pore develop-ment, provided diffusion to an outer surface, notexposed to the nitriding atmosphere, where escape ofdissolved nitrogen as N2 gas might occur, can beneglected. Upon this decomposition, the rise of thenitrogen gas pressure in the pores leads to plasticdeformation of the surrounding matrix, as follows fromthe following consideration.Adopting a spherical shape for a pore (=hollow
sphere) yielding of the surrounding pore wall, taken ofinfinite thickness, occurs if
6174—VOLUME 45A, DECEMBER 2014 METALLURGICAL AND MATERIALS TRANSACTIONS A
pi � 2=3ry; ½6�
where pi is the gas pressure in the pore and ry representsthe (uniaxial) tensile yield strength of the matrix. Thislimiting condition for yielding complies with both thevon Mises criterion and the Tresca criterion.[21]
Two sets of nitriding parameters were applied in thecurrentwork (seeTable III). Thefirst set (923 K (650 �C),rN = 0.050 atm�1/2) stabilizes nitrogen ferrite, a-Fe[N],containing 0.35 at. pct nitrogen[19] at the surface of thespecimen, corresponding to an (hypothetical) equilibriumN2 gas pressure of 440 MPa (see Figure 1(a), calculatedusing Thermo-Calc[22] on the basis of a thermodynamicmodel for nitrogen in iron presented in Reference 23).This equilibrium pressure exceeds 2/3 of the ferriteuniaxial tensile yield strength which equals about50 MPa at 923 K (650 �C).[24] Hence, in view of theinequality [6], the ferrite matrix already yields well beforethe equilibrium N2 gas pressure in a pore is reached.
The second set of nitriding parameters (923 K(650 �C), rN = 0.104 atm�1/2) stabilizes nitrogen aus-tenite, c-Fe[N], containing 9.5 at. pct nitrogen[23,25]* at
the surface of the specimen, corresponding to an(hypothetical) equilibrium N2 gas pressure of 1 GPa(see Figure 1(b)). Also in this case, the equilibrium N2 gas
pressure exceeds 2/3 of the austenite (uniaxial) tensile yieldstrength which equals about 570 MPa**.[26,27] Hence, as
for ferrite upon nitriding, in view of the inequality,[6] theaustenite matrix already yields well before the equilibriumN2 gas pressure in a pore is reached.Starting with, respectively, nitrogen ferrite containing
0.35 at. pct nitrogen and nitrogen austenite containing9.5 at. pct nitrogen (see above), the Gibbs energydifferences for the decomposition reactions [4], [5a]and [5b] and the nitrogen concentrations left in thedepleted matrix (Fe[N]*) were calculated, usingapproaches presented in Reference 23, for the innerpore, nitrogen gas pressures at which the iron matrixstarts to yield. The results have been gathered in Table I.In the cases of the decomposition of a-Fe[N] accord-
ing to Eq. [4] and the decomposition of c-Fe[N] accord-ing to Eq. [5a], further decomposition (i.e., after theonset of yielding) is thermodynamically favored as thecorresponding Gibbs energy differences at the onset ofyielding are negative (cf. Table I).The decomposition of c-Fe[N] into a-Fe[N]*
(Eq. [5b]) and N2 gas in closed pores is only thermody-namically possible below nitrogen gas pressures (in thepores) of 330 MPa (then the Gibbs reaction energy isnegative). Therefore, the decomposition of c-Fe[N] into
Fig. 1—The pressure of nitrogen gas ðpN2Þ in equilibrium with the iron-nitrogen solid solution as a function of the nitrogen content, xN, at
923 K (650 �C) for (a) nitrogen ferrite a-Fe N½ �; FeþN2 Ð a-Fe N½ �ð Þ and (b) nitrogen austenite (c-Fe N½ �; FeþN2 Ð c-Fe N½ �). Note the differentnitrogen concentration scales in the diagrams. The nitriding potentials (cf. Eq. [3]), corresponding to xN, for nitriding in a NH3/H2 gas mixtureat the same temperature and at 1 atm pressure (NH3 þ FeÐ a-Fe N½ � þ 3=2H2;NH3 þ FeÐ c-Fe N½ � þ 3=2H2), have been indicated on the ab-scissa at the top of both figures. The values for pN2
as a function of xN were calculated using the Thermo-Calc software[22] adopting the thermo-dynamic model for nitrogen in iron presented in Ref. [23].
*Instead of the nitriding potential, rN, Thermo-Calc can only handleactivities in order to define an equilibrium. To obtain the ‘‘activity’’ ofnitrogen, aN, in the gas phase, equal to the activity of nitrogen in thesolid, the equilibrium constant of reaction (2) is needed (see Eq. [15] inRef. [20]). This equilibrium constant was calculated using data takenfrom Ref. [23]. Knowledge of aN, p, and T then suffices to calculate thecorresponding equilibrium concentrations of nitrogen in nitrogenaustenite using Thermo-Calc adopting the thermodynamic descriptionin Ref. [23] (the reference state of nitrogen for both phases is takenidentical).
**The (uniaxial) tensile yield strength of austenite containing9.5 at. pct nitrogen was calculated applying the formula presented inRef. [26] which is valid at a temperature of 295 K (22 �C). For highertemperatures, the tensile yield strength becomes significantly smallerand is above 450�C nearly constant [27]. The relative decrease of theyield strength from RT to 450�C is almost independent of the nitrogencontent in austenitic steels.[27] Therefore, the calculated value for thetensile yield strength at 295 K (22 �C) was multiplied with this factorto estimate the tensile yield strength of austenite containing 9.5 at. pctnitrogen at 923 K (650�C).
METALLURGICAL AND MATERIALS TRANSACTIONS A VOLUME 45A, DECEMBER 2014—6175
a-Fe[N]* can in principle occur but the release of Gibbsfree energy for the decomposition of c-Fe[N] intoc-Fe[N]* (Eq. [5a]) is larger at the considered condi-tions, and thus is thermodynamically favored.
III. EXPERIMENTAL PROCEDURES
A. Specimen Preparation
Several iron-based alloys were prepared from elemen-tal granules of Fe (purity 99.98 wt pct), Al (purity99.999 wt pct), Si (purity 99.999 wt pct), Cr (purity99.98 wt pct), Co (purity 99.98 wt pct), Ni (purity99.98 wt pct), and Ge (purity 99.999 wt pct). The gran-ules were melted in an induction furnace under aprotective Ar atmosphere and cast to rods with a lengthof 100 mm and a diameter of 10 mm. The cast rods wereground to remove surface oxides and cleaned in ethanolin an ultrasonic bath, and thereafter cold-rolled tosheets of approximately 1 mm thickness. Rectangularspecimens (15 9 10 9 1) mm were cut from such cold-rolled sheets. These specimens were ground and polished(final stage with 1 lm diamond paste) from both sidesand ultrasonically cleaned in ethanol. The specimenswere then encapsulated in a quartz tube under protectiveAr atmosphere and recrystallized at 1073 K (800 �C) for20 minutes. After the recrystallization treatment, thespecimens were polished (again) with 1 lm diamondpaste to remove surface oxides, which might haveformed during the recrystallization treatment, andultrasonically cleaned in ethanol.
In order to determine the amounts of alloyingelements in samples taken from the produced casts,inductively coupled plasma optical emission spectros-copy (ICP-OES) was applied, whereas carrier gas hotextraction was used to determine the amount of lightelement impurities such as O and N. The amounts of Cand S were determined by means of the combustionmethod. Results of the chemical analysis for Fe and theiron-based alloy casts are shown in Table II.
B. Nitriding
The gas nitriding facility consists of a vertical multiz-one quartz tube furnace (diameter 28 mm) and isequipped with temperature controllers (temperaturevariation ±1 �C) and gas mass-flow controllers. For
the nitriding treatments, the sheet specimens (see above)were suspended with a quartz fiber and positioned in theuniform temperature zone of the furnace. The sum ofthe gas fluxes of NH3 (purity 99.998 vol pct) and H2
(purity 99.999 vol pct) were kept constant at 500 mL/min and the NH3 and H2 gas fluxes were maintainedsuch to set the required nitriding potential.[20] Nitridingexperiments were carried out such that either nitrogenferrite or nitrogen austenite was stabilized at thespecimen‘s surface. The corresponding two sets ofnitriding conditions employed in the present work areshown in Table III. The nitriding treatment was inter-rupted by quenching the specimens into water whichwas purged with N2 gas to minimize the amount ofdissolved oxygen.
C. Weight Measurement
Specimens were weighed before nitriding and afterhomogenous (through) nitriding, and the weight uptakewas used to calculate the nitrogen uptake of thespecimens. Five weight measurements were carried outand from the mean, the average nitrogen content and itsstandard deviation were calculated. For weighing, acomparator balance (Mettler XP56) with 1 lg(0.001 mg) sensitivity was used.
D. X-Ray Diffraction
A PANalytic X¢Pert MPD (multi-purpose diffractom-eter) was used to characterize the phases developed afternitriding. Co-Ka radiation and Bragg–Brentano geome-trywith a graphitemonochromator in the diffracted beamand a PANalytical X¢Celerator detector were employed.The specimens were rotated around their surface normalduring the measurements to enhance crystal statistics.The recorded XRD-patterns were analyzed by using thesoftware X¢Pert HighScore and the different phases wereidentified using the database from the InternationalCenter for Diffraction Data (ICDD).[28]
E. Light Microscopy
Specimens for light microscopical analysis were cutperpendicular to the nitrided surface and embedded inStruers Polyfast to obtain cross-sections. The embeddedcross-sections were ground, polished (final stage 1 lmdiamond paste) and etched with 2 vol pct Nital for
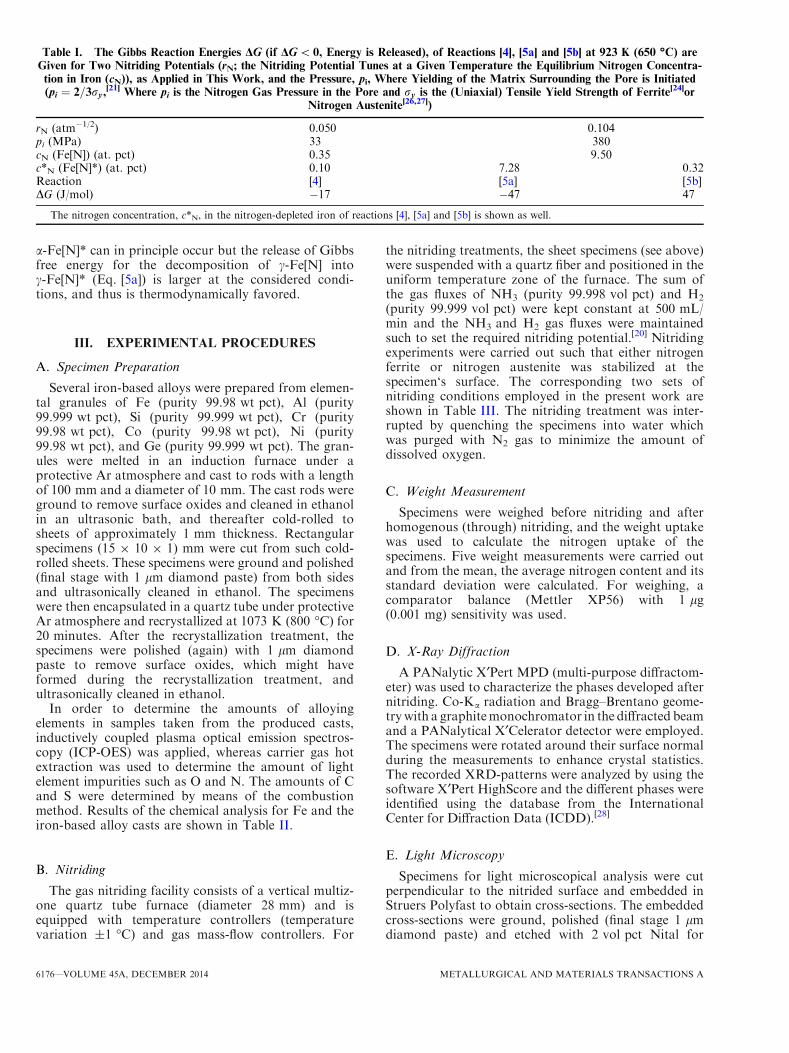
Table I. The Gibbs Reaction Energies DG (if DG< 0, Energy is Released), of Reactions [4], [5a] and [5b] at 923 K (650 �C) areGiven for Two Nitriding Potentials (rN; the Nitriding Potential Tunes at a Given Temperature the Equilibrium Nitrogen Concentra-
tion in Iron (cN)), as Applied in This Work, and the Pressure, pi, Where Yielding of the Matrix Surrounding the Pore is Initiated(pi ¼ 2=3ry,
[21] Where pi is the Nitrogen Gas Pressure in the Pore and ry is the (Uniaxial) Tensile Yield Strength of Ferrite[24]or
Nitrogen Austenite[26,27])
rN (atm�1/2) 0.050 0.104pi (MPa) 33 380cN (Fe[N]) (at. pct) 0.35 9.50c*N (Fe[N]*) (at. pct) 0.10 7.28 0.32Reaction [4] [5a] [5b]DG (J/mol) �17 �47 47
The nitrogen concentration, c*N, in the nitrogen-depleted iron of reactions [4], [5a] and [5b] is shown as well.
6176—VOLUME 45A, DECEMBER 2014 METALLURGICAL AND MATERIALS TRANSACTIONS A
30 seconds. A Zeiss Axiophot microscope, equippedwith an Olympus Color View IIIu digital camera, wasused to record the microstructures. In order to deter-mine the void fraction in the nitrided region, 10 imageswere recorded from different, randomly selected regionsof the nitrided volume (each image covers a rectangulararea of (440 9 100) lm2) and the area fraction of thepores was determined by using the software analySIS 5.0from Soft Imaging System. The area fraction of thepores is equal to the volume fraction of the pores if thepores do not exhibit a morphological texture.[29]
F. Scanning Electron Microscopy (SEM) and ElectronBackscatter Diffraction (EBSD)
A LEO 1530 VP (acceleration voltage 3 kV, workingdistance 6 mm) equipped with an in-lens detector(30 mm aperture) was applied to record SEM micro-graphs. EBSD investigation was carried out to deter-mine the distribution, shape, and crystal orientation ofthe phases present in a specimen’s cross-section. To thisend, a Zeiss LEO 438 VP scanning electron microscope(acceleration voltage 20 kV) equipped with a high-speedcamera from EDAX and the analyzing software OIM5.31 from TSL was employed.
G. Electron Probe Microanalysis (EPMA)
Inorder todetermine local chemical compositions, pointscanswere performedusing the SX100microanalyzer fromCameca. Cross-sections for analysis were prepared in asimilar way as for light microscopy except that the finaletching step was omitted. A focused electron beam ofacceleration voltage of 15 kV and current of 100 nA wasemployed. The intensities of generated characteristicN-Ka, and Fe-Kb X-ray emission peaks were used toobtain the element concentrations ofNandFe, respectively:The measured N-Ka, and Fe-Kb intensities were divided by
the intensities recorded from c¢-Fe4N (N-Ka) and Fe(Fe-Kb) standard specimens, respectively, and the concen-tration values were calculated from these intensity ratiosapplying the /(qz)-approach according to Reference 30.
IV. RESULTS
A. Pore Formation in Nitrogen Ferrite and the Role ofAlloying Elements
Microstructures of the nitrided regions as developed inpure iron and the binary iron-based Fe-Me alloys nitridedfor 72 hours under conditions which, at least for pure iron(see what follows), stabilize the ferrite phase at the surfaceof the specimen [923 K (650 �C), rN = 0.050 atm�1/2;cf. Reference 13] are shown in Figure 2. The amount ofnitrogen taken up by the specimens upon nitriding(cf. Section III–C) and the resulting pore fractions(cf. Section III–E) have been gathered in Table IV.The micrographs reveal the development of porosity
along grain boundaries of the ferrite matrix. Theamount of porosity in the alloys shows a strongdependence on the presence and the type of alloyingelement: Fe-Ni and Fe-Ge alloys show the highestporosity; pure iron and Fe-Cr and Fe-Co alloys take anintermediate position and the lowest porosity can bedetected in Fe-Al and Fe-Si alloys (see Figure 2 andTable IV). The shape, size and density of the poresnucleating at the grain boundaries are largely deter-mined by the nature and geometrical arrangement of thegrain boundaries which is a function of grain size andgrain shape (e.g., the pore nucleated at a grain boundaryjunction could have three legged morphology). It canfurther be expected that anisotropy of surface energycan in principle induce a facetted appearance of a pore.The X-ray diffractograms recorded from the surface
of the iron and iron-based Fe-Me alloy specimens afterthe nitriding treatment are shown in Figure 3. Except
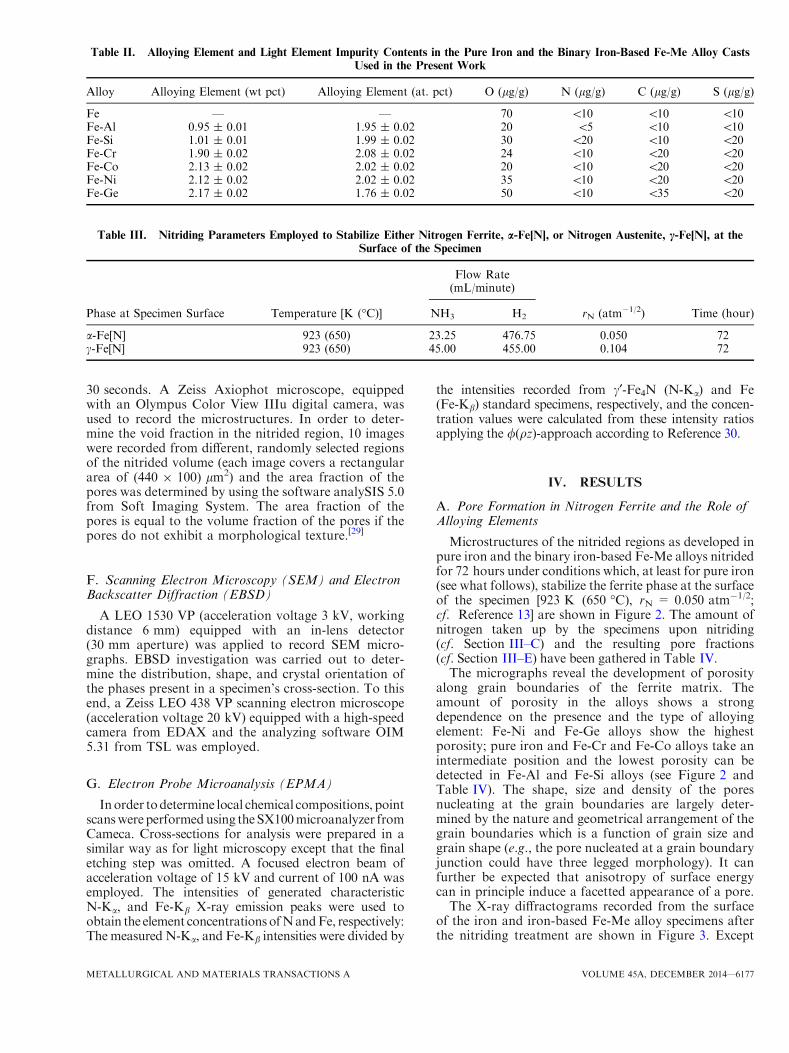
Table II. Alloying Element and Light Element Impurity Contents in the Pure Iron and the Binary Iron-Based Fe-Me Alloy Casts
Used in the Present Work
Alloy Alloying Element (wt pct) Alloying Element (at. pct) O (lg/g) N (lg/g) C (lg/g) S (lg/g)
Fe — — 70 <10 <10 <10Fe-Al 0.95 ± 0.01 1.95 ± 0.02 20 <5 <10 <10Fe-Si 1.01 ± 0.01 1.99 ± 0.02 30 <20 <10 <20Fe-Cr 1.90 ± 0.02 2.08 ± 0.02 24 <10 <20 <20Fe-Co 2.13 ± 0.02 2.02 ± 0.02 20 <10 <20 <20Fe-Ni 2.12 ± 0.02 2.02 ± 0.02 35 <10 <20 <20Fe-Ge 2.17 ± 0.02 1.76 ± 0.02 50 <10 <35 <20
Table III. Nitriding Parameters Employed to Stabilize Either Nitrogen Ferrite, a-Fe[N], or Nitrogen Austenite, c-Fe[N], at the
Surface of the Specimen
Phase at Specimen Surface Temperature [K (�C)]
Flow Rate(mL/minute)
rN (atm�1/2) Time (hour)NH3 H2
a-Fe[N] 923 (650) 23.25 476.75 0.050 72c-Fe[N] 923 (650) 45.00 455.00 0.104 72
METALLURGICAL AND MATERIALS TRANSACTIONS A VOLUME 45A, DECEMBER 2014—6177
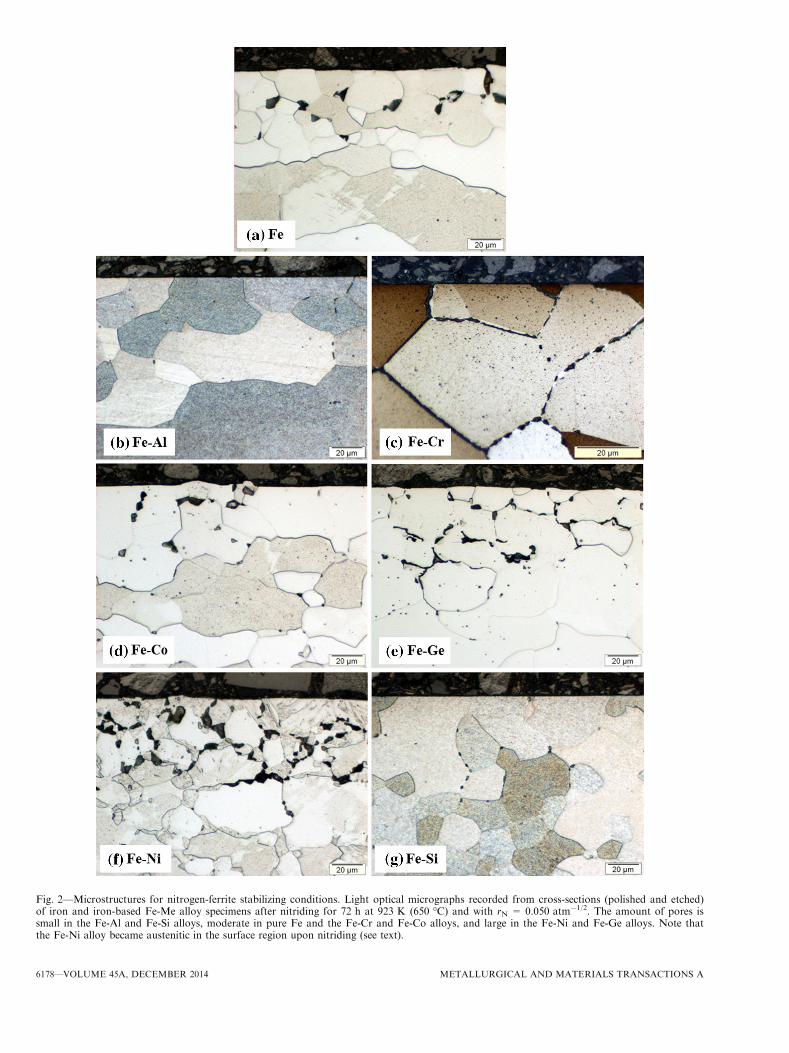
Fig. 2—Microstructures for nitrogen-ferrite stabilizing conditions. Light optical micrographs recorded from cross-sections (polished and etched)of iron and iron-based Fe-Me alloy specimens after nitriding for 72 h at 923 K (650 �C) and with rN = 0.050 atm�1/2. The amount of pores issmall in the Fe-Al and Fe-Si alloys, moderate in pure Fe and the Fe-Cr and Fe-Co alloys, and large in the Fe-Ni and Fe-Ge alloys. Note thatthe Fe-Ni alloy became austenitic in the surface region upon nitriding (see text).
6178—VOLUME 45A, DECEMBER 2014 METALLURGICAL AND MATERIALS TRANSACTIONS A
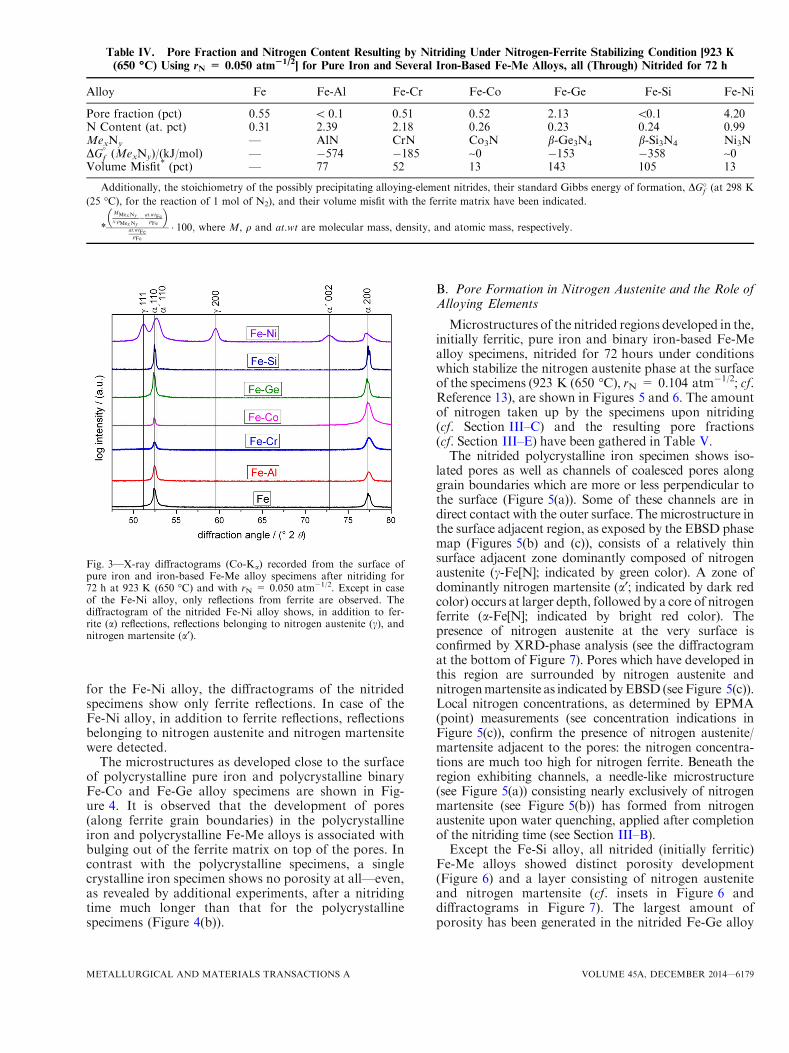
for the Fe-Ni alloy, the diffractograms of the nitridedspecimens show only ferrite reflections. In case of theFe-Ni alloy, in addition to ferrite reflections, reflectionsbelonging to nitrogen austenite and nitrogen martensitewere detected.
The microstructures as developed close to the surfaceof polycrystalline pure iron and polycrystalline binaryFe-Co and Fe-Ge alloy specimens are shown in Fig-ure 4. It is observed that the development of pores(along ferrite grain boundaries) in the polycrystallineiron and polycrystalline Fe-Me alloys is associated withbulging out of the ferrite matrix on top of the pores. Incontrast with the polycrystalline specimens, a singlecrystalline iron specimen shows no porosity at all—even,as revealed by additional experiments, after a nitridingtime much longer than that for the polycrystallinespecimens (Figure 4(b)).
B. Pore Formation in Nitrogen Austenite and the Role ofAlloying Elements
Microstructures of the nitrided regions developed in the,initially ferritic, pure iron and binary iron-based Fe-Mealloy specimens, nitrided for 72 hours under conditionswhich stabilize the nitrogen austenite phase at the surfaceof the specimens (923 K (650 �C), rN = 0.104 atm�1/2; cf.Reference 13), are shown in Figures 5 and 6. The amountof nitrogen taken up by the specimens upon nitriding(cf. Section III–C) and the resulting pore fractions(cf. Section III–E) have been gathered in Table V.The nitrided polycrystalline iron specimen shows iso-
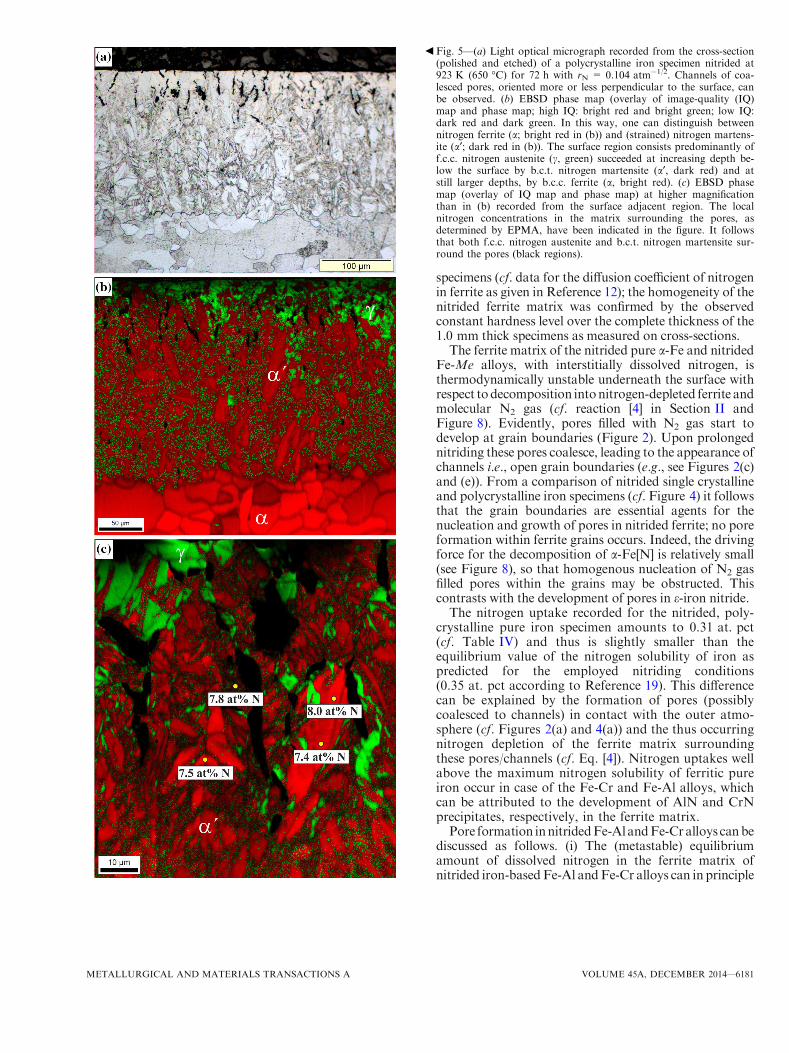
lated pores as well as channels of coalesced pores alonggrain boundaries which are more or less perpendicular tothe surface (Figure 5(a)). Some of these channels are indirect contact with the outer surface. The microstructure inthe surface adjacent region, as exposed by the EBSD phasemap (Figures 5(b) and (c)), consists of a relatively thinsurface adjacent zone dominantly composed of nitrogenaustenite (c-Fe[N]; indicated by green color). A zone ofdominantly nitrogen martensite (a¢; indicated by dark redcolor) occurs at larger depth, followed by a core of nitrogenferrite (a-Fe[N]; indicated by bright red color). Thepresence of nitrogen austenite at the very surface isconfirmed by XRD-phase analysis (see the diffractogramat the bottom of Figure 7). Pores which have developed inthis region are surrounded by nitrogen austenite andnitrogenmartensite as indicated byEBSD (seeFigure 5(c)).Local nitrogen concentrations, as determined by EPMA(point) measurements (see concentration indications inFigure 5(c)), confirm the presence of nitrogen austenite/martensite adjacent to the pores: the nitrogen concentra-tions are much too high for nitrogen ferrite. Beneath theregion exhibiting channels, a needle-like microstructure(see Figure 5(a)) consisting nearly exclusively of nitrogenmartensite (see Figure 5(b)) has formed from nitrogenaustenite upon water quenching, applied after completionof the nitriding time (see Section III–B).Except the Fe-Si alloy, all nitrided (initially ferritic)
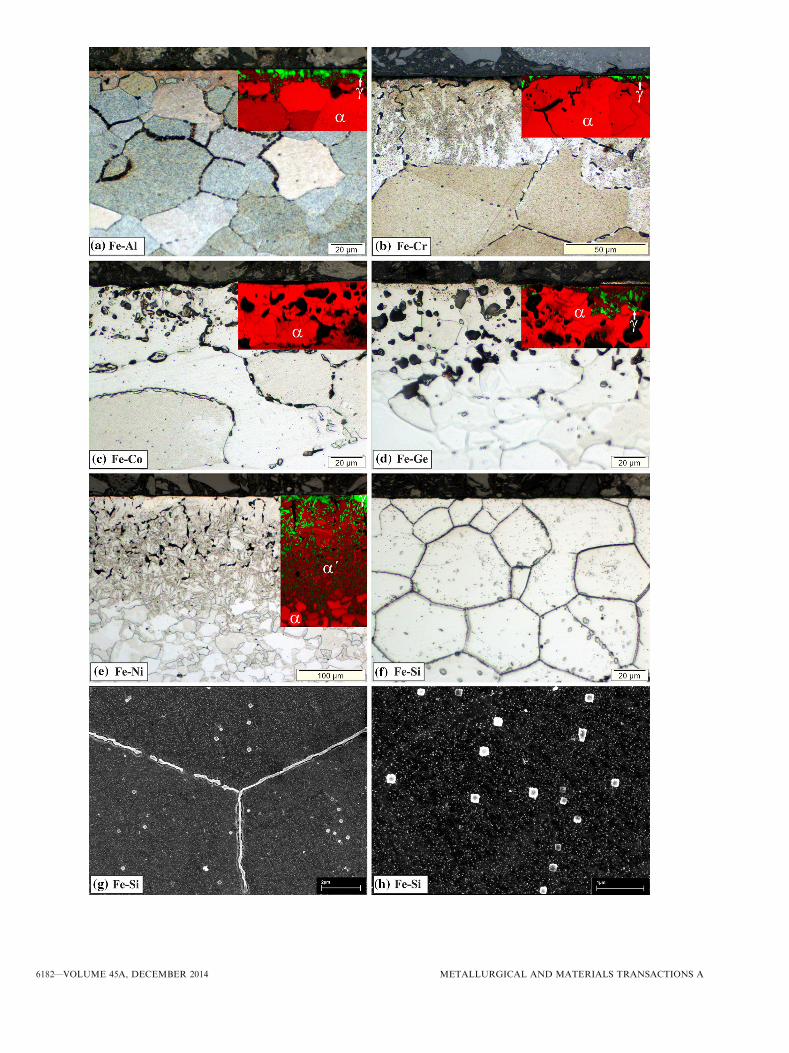
Fe-Me alloys showed distinct porosity development(Figure 6) and a layer consisting of nitrogen austeniteand nitrogen martensite (cf. insets in Figure 6 anddiffractograms in Figure 7). The largest amount ofporosity has been generated in the nitrided Fe-Ge alloy
Table IV. Pore Fraction and Nitrogen Content Resulting by Nitriding Under Nitrogen-Ferrite Stabilizing Condition [923 K
(650 �C) Using rN = 0.050 atm21/2] for Pure Iron and Several Iron-Based Fe-Me Alloys, all (Through) Nitrided for 72 h
Alloy Fe Fe-Al Fe-Cr Fe-Co Fe-Ge Fe-Si Fe-Ni
Pore fraction (pct) 0.55 < 0.1 0.51 0.52 2.13 <0.1 4.20N Content (at. pct) 0.31 2.39 2.18 0.26 0.23 0.24 0.99MexNy — AlN CrN Co3N b-Ge3N4 b-Si3N4 Ni3NDG
�
f (MexNy)/(kJ/mol) — �574 �185 ~0 �153 �358 ~0Volume Misfit* (pct) — 77 52 13 143 105 13
Additionally, the stoichiometry of the possibly precipitating alloying-element nitrides, their standard Gibbs energy of formation, DG�f (at 298 K
(25 �C), for the reaction of 1 mol of N2), and their volume misfit with the ferrite matrix have been indicated.
*
MMexNyx�qMexNy
�at:wtFeqFe
� �at:wtFe
qFe
� 100; where M, q and at.wt are molecular mass, density, and atomic mass, respectively.
Fig. 3—X-ray diffractograms (Co-Ka) recorded from the surface ofpure iron and iron-based Fe-Me alloy specimens after nitriding for72 h at 923 K (650 �C) and with rN = 0.050 atm�1/2. Except in caseof the Fe-Ni alloy, only reflections from ferrite are observed. Thediffractogram of the nitrided Fe-Ni alloy shows, in addition to fer-rite (a) reflections, reflections belonging to nitrogen austenite (c), andnitrogen martensite (a¢).
METALLURGICAL AND MATERIALS TRANSACTIONS A VOLUME 45A, DECEMBER 2014—6179
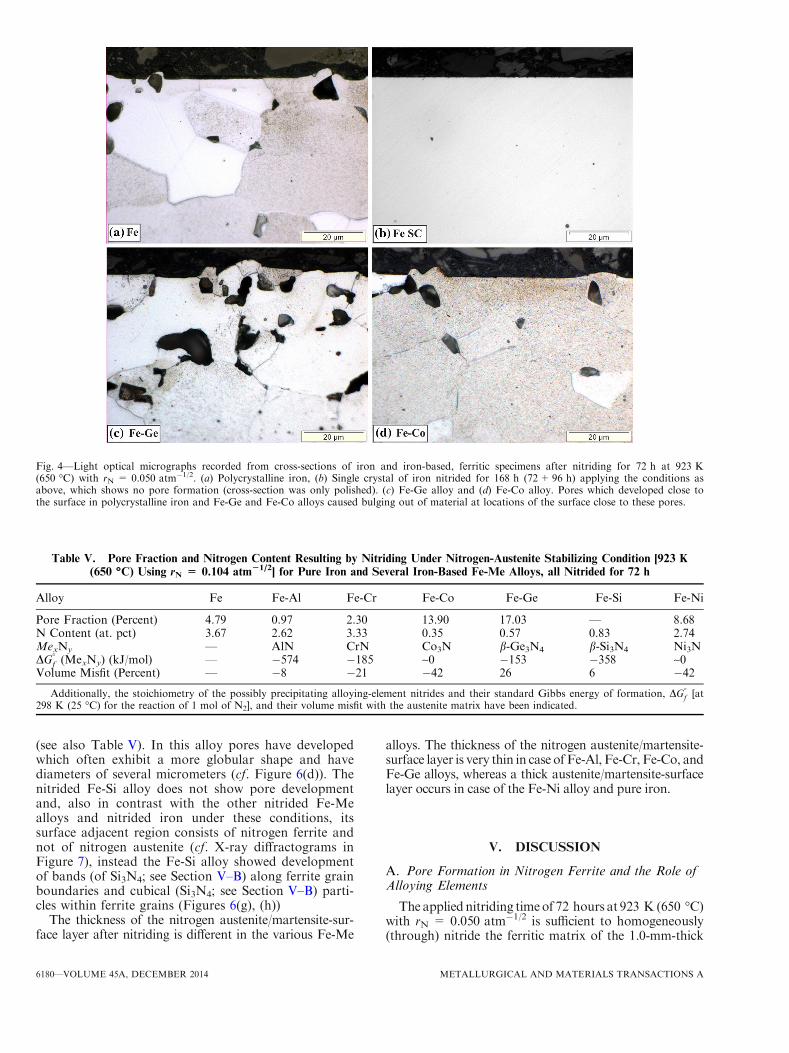
(see also Table V). In this alloy pores have developedwhich often exhibit a more globular shape and havediameters of several micrometers (cf. Figure 6(d)). Thenitrided Fe-Si alloy does not show pore developmentand, also in contrast with the other nitrided Fe-Mealloys and nitrided iron under these conditions, itssurface adjacent region consists of nitrogen ferrite andnot of nitrogen austenite (cf. X-ray diffractograms inFigure 7), instead the Fe-Si alloy showed developmentof bands (of Si3N4; see Section V–B) along ferrite grainboundaries and cubical (Si3N4; see Section V–B) parti-cles within ferrite grains (Figures 6(g), (h))
The thickness of the nitrogen austenite/martensite-sur-face layer after nitriding is different in the various Fe-Me
alloys. The thickness of the nitrogen austenite/martensite-surface layer is very thin in case of Fe-Al, Fe-Cr, Fe-Co, andFe-Ge alloys, whereas a thick austenite/martensite-surfacelayer occurs in case of the Fe-Ni alloy and pure iron.
V. DISCUSSION
A. Pore Formation in Nitrogen Ferrite and the Role ofAlloying Elements
The applied nitriding timeof 72 hours at 923 K (650 �C)with rN = 0.050 atm�1/2 is sufficient to homogeneously(through) nitride the ferritic matrix of the 1.0-mm-thick
Fig. 4—Light optical micrographs recorded from cross-sections of iron and iron-based, ferritic specimens after nitriding for 72 h at 923 K(650 �C) with rN = 0.050 atm�1/2. (a) Polycrystalline iron, (b) Single crystal of iron nitrided for 168 h (72+96 h) applying the conditions asabove, which shows no pore formation (cross-section was only polished). (c) Fe-Ge alloy and (d) Fe-Co alloy. Pores which developed close tothe surface in polycrystalline iron and Fe-Ge and Fe-Co alloys caused bulging out of material at locations of the surface close to these pores.
Table V. Pore Fraction and Nitrogen Content Resulting by Nitriding Under Nitrogen-Austenite Stabilizing Condition [923 K
(650 �C) Using rN = 0.104 atm21/2] for Pure Iron and Several Iron-Based Fe-Me Alloys, all Nitrided for 72 h
Alloy Fe Fe-Al Fe-Cr Fe-Co Fe-Ge Fe-Si Fe-Ni
Pore Fraction (Percent) 4.79 0.97 2.30 13.90 17.03 — 8.68N Content (at. pct) 3.67 2.62 3.33 0.35 0.57 0.83 2.74MexNy — AlN CrN Co3N b-Ge3N4 b-Si3N4 Ni3NDG
�
f (MexNy) (kJ/mol) — �574 �185 ~0 �153 �358 ~0Volume Misfit (Percent) — �8 �21 �42 26 6 �42
Additionally, the stoichiometry of the possibly precipitating alloying-element nitrides and their standard Gibbs energy of formation, DG�
f [at298 K (25 �C) for the reaction of 1 mol of N2], and their volume misfit with the austenite matrix have been indicated.
6180—VOLUME 45A, DECEMBER 2014 METALLURGICAL AND MATERIALS TRANSACTIONS A
specimens (cf. data for the diffusion coefficient of nitrogenin ferrite as given in Reference 12); the homogeneity of thenitrided ferrite matrix was confirmed by the observedconstant hardness level over the complete thickness of the1.0 mm thick specimens as measured on cross-sections.The ferrite matrix of the nitrided pure a-Fe and nitrided
Fe-Me alloys, with interstitially dissolved nitrogen, isthermodynamically unstable underneath the surface withrespect todecomposition intonitrogen-depleted ferrite andmolecular N2 gas (cf. reaction [4] in Section II andFigure 8). Evidently, pores filled with N2 gas start todevelop at grain boundaries (Figure 2). Upon prolongednitriding these pores coalesce, leading to the appearance ofchannels i.e., open grain boundaries (e.g., see Figures 2(c)and (e)). From a comparison of nitrided single crystallineand polycrystalline iron specimens (cf. Figure 4) it followsthat the grain boundaries are essential agents for thenucleation and growth of pores in nitrided ferrite; no poreformation within ferrite grains occurs. Indeed, the drivingforce for the decomposition of a-Fe[N] is relatively small(see Figure 8), so that homogenous nucleation of N2 gasfilled pores within the grains may be obstructed. Thiscontrasts with the development of pores in e-iron nitride.The nitrogen uptake recorded for the nitrided, poly-
crystalline pure iron specimen amounts to 0.31 at. pct(cf. Table IV) and thus is slightly smaller than theequilibrium value of the nitrogen solubility of iron aspredicted for the employed nitriding conditions(0.35 at. pct according to Reference 19). This differencecan be explained by the formation of pores (possiblycoalesced to channels) in contact with the outer atmo-sphere (cf. Figures 2(a) and 4(a)) and the thus occurringnitrogen depletion of the ferrite matrix surroundingthese pores/channels (cf. Eq. [4]). Nitrogen uptakes wellabove the maximum nitrogen solubility of ferritic pureiron occur in case of the Fe-Cr and Fe-Al alloys, whichcan be attributed to the development of AlN and CrNprecipitates, respectively, in the ferrite matrix.Pore formation innitridedFe-AlandFe-Cralloys canbe
discussed as follows. (i) The (metastable) equilibriumamount of dissolved nitrogen in the ferrite matrix ofnitrided iron-basedFe-Al andFe-Cr alloys can in principle
Fig. 5—(a) Light optical micrograph recorded from the cross-section(polished and etched) of a polycrystalline iron specimen nitrided at923 K (650 �C) for 72 h with rN = 0.104 atm�1/2. Channels of coa-lesced pores, oriented more or less perpendicular to the surface, canbe observed. (b) EBSD phase map (overlay of image-quality (IQ)map and phase map; high IQ: bright red and bright green; low IQ:dark red and dark green. In this way, one can distinguish betweennitrogen ferrite (a; bright red in (b)) and (strained) nitrogen martens-ite (a¢; dark red in (b)). The surface region consists predominantly off.c.c. nitrogen austenite (c, green) succeeded at increasing depth be-low the surface by b.c.t. nitrogen martensite (a¢, dark red) and atstill larger depths, by b.c.c. ferrite (a, bright red). (c) EBSD phasemap (overlay of IQ map and phase map) at higher magnificationthan in (b) recorded from the surface adjacent region. The localnitrogen concentrations in the matrix surrounding the pores, asdetermined by EPMA, have been indicated in the figure. It followsthat both f.c.c. nitrogen austenite and b.c.t. nitrogen martensite sur-round the pores (black regions).
b
METALLURGICAL AND MATERIALS TRANSACTIONS A VOLUME 45A, DECEMBER 2014—6181
6182—VOLUME 45A, DECEMBER 2014 METALLURGICAL AND MATERIALS TRANSACTIONS A
be larger than that for nitridedpure iron, due to (a) a highernitrogen solubility in iron-based Fe-Al[31] and Fe-Cralloys[32] as compared to pure iron and (b) the presenceof so-called excess nitrogen taken up in the strain fieldssurrounding theMeN-precipitates.[33–35] (ii)Moreover, thedevelopment of AlN� and CrN precipitates in Fe-Al and
Fe-Cr alloys upon nitriding competes with the develop-ment of N2 gas containing pores. Hence, it is concludedfrom (i) and (ii) that the pore fractions in nitrided Fe-Aland Fe-Cr alloys can be smaller than in nitrided pure iron,
as observed (cf. Table IV). Note that the presence ofdissolved excess nitrogen in nitrided Fe-Al and Fe-Cralloys after the nitriding only seemingly suggests a higherdriving force for pore development than in pure iron: thisexcess nitrogen is thermodynamically stabilized by themisfit-strain fields surrounding the Me-nitride precipi-tates.[33] However, if upon continued nitriding, a coherentfi incoherent transition sets in for the initially precipitatedMe-nitrides in the surface adjacent region, then the nitride/matrix misfit is no longer (fully) accommodated elasticallyand the capacity for dissolving excess nitrogen gets lost.The originally dissolved excess nitrogen then tends toprecipitate and N2 gas filled pores can develop at grainboundaries. This effect has been observed in Reference 36.Pore formation in nitrided Fe-Co and Fe-Ge alloys
can be discussed as follows. The Fe-Co and Fe-Ge alloysshow a nitrogen uptake much smaller than that of theFe-Al and Fe-Cr alloys (cf. Table IV) and even smallerthan that of pure iron. (i) Co[37] and Ge� dissolved in a-
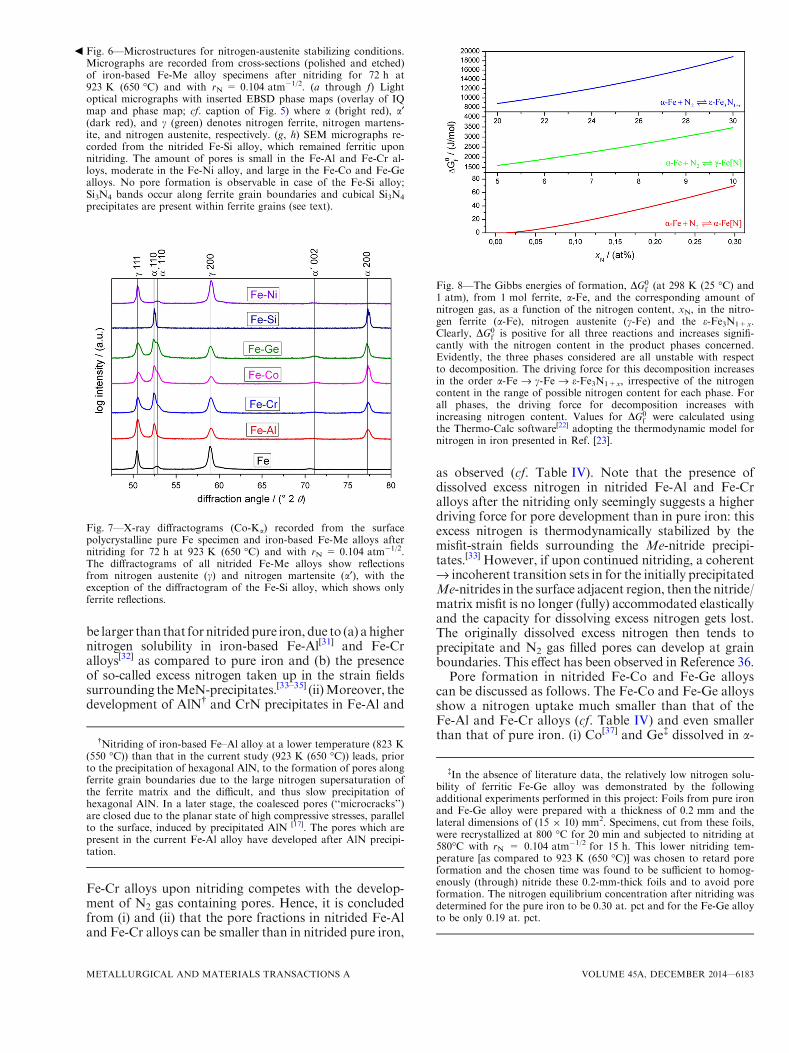
Fig. 7—X-ray diffractograms (Co-Ka) recorded from the surfacepolycrystalline pure Fe specimen and iron-based Fe-Me alloys afternitriding for 72 h at 923 K (650 �C) and with rN = 0.104 atm�1/2.The diffractograms of all nitrided Fe-Me alloys show reflectionsfrom nitrogen austenite (c) and nitrogen martensite (a¢), with theexception of the diffractogram of the Fe-Si alloy, which shows onlyferrite reflections.
Fig. 8—The Gibbs energies of formation, DG0f (at 298 K (25 �C) and
1 atm), from 1 mol ferrite, a-Fe, and the corresponding amount ofnitrogen gas, as a function of the nitrogen content, xN, in the nitro-gen ferrite (a-Fe), nitrogen austenite (c-Fe) and the e-Fe3N1+x.Clearly, DG0
f is positive for all three reactions and increases signifi-cantly with the nitrogen content in the product phases concerned.Evidently, the three phases considered are all unstable with respectto decomposition. The driving force for this decomposition increasesin the order a-Fe fi c-Fe fi e-Fe3N1+x, irrespective of the nitrogencontent in the range of possible nitrogen content for each phase. Forall phases, the driving force for decomposition increases withincreasing nitrogen content. Values for DG0
f were calculated usingthe Thermo-Calc software[22] adopting the thermodynamic model fornitrogen in iron presented in Ref. [23].
Fig. 6—Microstructures for nitrogen-austenite stabilizing conditions.Micrographs are recorded from cross-sections (polished and etched)of iron-based Fe-Me alloy specimens after nitriding for 72 h at923 K (650 �C) and with rN = 0.104 atm�1/2. (a through f) Lightoptical micrographs with inserted EBSD phase maps (overlay of IQmap and phase map; cf. caption of Fig. 5) where a (bright red), a¢(dark red), and c (green) denotes nitrogen ferrite, nitrogen martens-ite, and nitrogen austenite, respectively. (g, h) SEM micrographs re-corded from the nitrided Fe-Si alloy, which remained ferritic uponnitriding. The amount of pores is small in the Fe-Al and Fe-Cr al-loys, moderate in the Fe-Ni alloy, and large in the Fe-Co and Fe-Gealloys. No pore formation is observable in case of the Fe-Si alloy;Si3N4 bands occur along ferrite grain boundaries and cubical Si3N4
precipitates are present within ferrite grains (see text).
b
�Nitriding of iron-based Fe–Al alloy at a lower temperature (823 K(550 �C)) than that in the current study (923 K (650 �C)) leads, priorto the precipitation of hexagonal AlN, to the formation of pores alongferrite grain boundaries due to the large nitrogen supersaturation ofthe ferrite matrix and the difficult, and thus slow precipitation ofhexagonal AlN. In a later stage, the coalesced pores (‘‘microcracks’’)are closed due to the planar state of high compressive stresses, parallelto the surface, induced by precipitated AlN [17]. The pores which arepresent in the current Fe-Al alloy have developed after AlN precipi-tation.
�In the absence of literature data, the relatively low nitrogen solu-bility of ferritic Fe-Ge alloy was demonstrated by the followingadditional experiments performed in this project: Foils from pure ironand Fe-Ge alloy were prepared with a thickness of 0.2 mm and thelateral dimensions of (15 9 10) mm2. Specimens, cut from these foils,were recrystallized at 800 �C for 20 min and subjected to nitriding at580�C with rN = 0.104 atm�1/2 for 15 h. This lower nitriding tem-perature [as compared to 923 K (650 �C)] was chosen to retard poreformation and the chosen time was found to be sufficient to homog-enously (through) nitride these 0.2-mm-thick foils and to avoid poreformation. The nitrogen equilibrium concentration after nitriding wasdetermined for the pure iron to be 0.30 at. pct and for the Fe-Ge alloyto be only 0.19 at. pct.
METALLURGICAL AND MATERIALS TRANSACTIONS A VOLUME 45A, DECEMBER 2014—6183
Fe lower the nitrogen solubility of the ferrite. Extremelyhigh nitriding potentials are necessary to form Co andGe nitrides: see Reference 38 for a Lehrer-type diagramfor the Co-N system and note the extremely largevolume misfit of Ge3N4 with the ferrite matrix, as givenin Table IV. (ii) In nitrided Fe-Co and Fe-Ge alloys, theformation of N2 gas filled pores can occur in the absenceof competition with Me-nitride precipitation. Hence, itis concluded from (i) and (ii) that pore fractions innitrided Fe-Co and Fe-Ge alloys can be (much) higherthan in nitrided pure iron, as observed (cf. Table IV).
Si as an alloying element in iron lowers, similar asCo and Ge, the equilibrium nitrogen solubility inferrite.[39] Although, as compared with the Fe-Gesystem (where no Me-nitride development was ob-served at all upon nitriding), for the Fe-Si system thechemical driving force for Me-nitride precipitation islarger and the nitride/matrix misfit is smaller (but stillvery large; see Table IV), yet, but only after very longnitriding times, (amorphous instead of crystalline)silicon-nitride precipitates develop in the ferrite matrixgrains (see References 40 through 42 and Figure 6(g)).On this basis, and with reference to the abovediscussion on nitrided Fe-Co and Fe-Ge alloys, onemight expect a pore fraction of value as observed forFe-Co and Fe-Ge alloys. Instead, a pore fraction isobserved that is even distinctively smaller than that forpure iron. Recognizing that in ferritic pure iron andferritic Fe-Me alloys the grain boundaries act as theonly nucleation agents for the N2 gas filled pores (seeFigure 2, Section IV–A and above), this peculiar phe-nomenon is interpreted as follows. Si3N4 precipitates asamorphous bands along the ferrite matrix grainboundaries, prior to precipitation of (cubical) Si3N4
particles within the ferrite matrix grains.[41] It issuggested that these amorphous bands hinder thenucleation of pores at grain boundaries, which arethe agents for nucleation of N2 gas filled pores inferritic material, as discussed above, (also) because byformation of these bands the nitrogen otherwiseavailable for pore formation is consumed.
The relatively high amount of nitrogen taken up bythe Fe-Ni alloy specimen (0.99 at. pct) is due to thedevelopment of nitrogen austenite (so the specimen didnot remain ferritic as the other alloys nitrided subject tothe same conditions; cf. Figure 3); it cannot be ascribedto the development of nickel nitride: extremely highnitriding potentials, which are not applied in this work,are required to stabilize nickel nitrides.[43] Upon waterquenching to room temperature, nitrogen austenitetransforms to nitrogen martensite provided its nitrogencontent is not too high (martensite start temperature,Ms, of pure Fe[N] is above RT for a nitrogen contentlarger than 8.4 at. pct[44]). The austenite stabilizationobserved upon nitriding for the originally ferritic Fe-Nialloy in the surface adjacent region is the result of thecombined austenite stabilization effects of both dis-solved nitrogen and dissolved Ni (evidently, only the2 at. pct Ni in the considered Fe-Ni alloy cannotstabilize the austenite phase at the nitriding temperatureof 923 K (650 �C), according to the data presented inReference 45).
The high N2 gas pressures which would develop in theclosed pores cannot be sustained by surrounding matrix(cf. Section II). Thus, pore formation is associated withplastic yielding of the surrounding ferrite matrix: thediameters of the pores at the grain boundaries in thepolycrystalline specimens are several microns and itappears that, under the action of the N2 gas pressure inclosed pores in the subsurface region, the specimensurface can (even) bulge out (Figures 4(a), (c) and (d))by plastic yielding of the ferrite matrix surrounding thepores.Precipitation of alloying-element nitrides significantly
strengthens the ferrite matrix which, in view of thediscussion in the above paragraph, can then retard poregrowth. Hence, not only pore nucleation is less abun-dant in the case of alloying elements which easilyprecipitate as nitrides (due to a smaller chemical drivingforce for pore formation in the beginning of nitriding;see above discussion), but also the subsequent poregrowth is retarded.
B. Pore Formation in Nitrogen Austenite and the Role ofAlloying Elements
The microstructure developing upon nitriding an(initially ferritic) pure iron specimen, employing condi-tions which stabilize nitrogen austenite, c-Fe[N], at thespecimen surface (923 K (650 �C), rN = 0.104 atm�1/2),can be understood as follows (see Figure 5). Nucleationof nitrogen austenite can occur at the moment that thenitrogen concentration in ferrite at the surface exceedsthat of the ferrite/austenite phase boundary in the Fe-Nphase diagram. Continued nitriding leads to a thicknessincrease of this formed nitrogen-austenite layer bymigration of the a/c transformation front in the direc-tion of the specimen’s core. The here applied nitridingtime of 72 hours at 923 K (650 �C) is not sufficient forthe complete transformation of the 1.0-mm-thick spec-imen into nitrogen austenite, and thus the specimenswere not homogenously (through) nitrided (the coreregion of the specimens remained ferritic; the coreregion is saturated with nitrogen; a hardness measure-ments in the core region revealed a hardness (200 HV0.1)which is twice that of unnitrided pure ferrite), incontrast with the nitrided ferritic specimens discussedin Section V–A.Similar as discussed for nitrogen ferrite (Section V–
A), the nitrogen austenite underneath the surface isthermodynamically unstable with respect to decompo-sition into nitrogen-depleted austenite and molecular N2
gas (cf. reaction [5a] in Section II and Figure 8). As aconsequence, porosity develops along the grain bound-aries of austenite in the subsurface regions. Prolongednitriding leads to the coalescence of pores to channelswhich can be in direct contact with the nitriding outeratmosphere (NH3/H2-gas mixture). (Subsequent) De-crease of the nitrogen concentration in nitrogen austen-ite adjacent to the pores can eventually lead to thereemergence of ferrite, as reported in an earlier inves-tigation.[14]
In the current work, pores which have developedupon nitriding at austenite grain boundaries are,
6184—VOLUME 45A, DECEMBER 2014 METALLURGICAL AND MATERIALS TRANSACTIONS A
according to the EBSD and EPMA measurements (seeFigure 5(c)), surrounded by nitrogen austenite (and/ornitrogen martensite after quenching). The nitrogenconcentrations in the vicinity of pores (see Figure 5(c))are too high for the presence (by reemergence asdiscussed above or by direct decomposition accordingto reaction [5b]) of a possible ferrite phase (the maxi-mum solubility of nitrogen in ferrite at 923 K (650 �C)amounts to approx. 0.27 at. pct[23]). As shown inSection II, the value of the Gibbs reaction energy ofthe decomposition reaction [5a] of nitrogen austeniteinto nitrogen-depleted nitrogen austenite and N2 gas isnegative, whereas the decomposition reaction [5b] ofnitrogen austenite into nitrogen-depleted ferrite and N2
gas is only thermodynamically possible until an innerpore N2 gas pressure of 330 MPa has been attained.Therefore, the occurrence of nitrogen ferrite, as a directdecomposition product of nitrogen austenite, is at theN2 gas pressures in the pores where yielding of thesurrounding matrix occurs (380 MPa; cf. Section II)inhibited.
The EBSD phase map (Figure 5(b)) shows nitrogenaustenite concentrated close to the surface of thenitrided and quenched iron specimen. The martensitestart temperature (Ms) depends on the nitrogen concen-tration (the higher the nitrogen concentration the loweris Ms
[44]). Nitrogen austenite regions at the very surfacecontain the highest nitrogen content and thus the lowestMs. For the employed nitriding conditions, the expectedsurface nitrogen concentration is 9.5 at. pct[23,25] whichcorresponds to a Ms temperature of approx. �323 K(�50 �C).[44] Consequently, the nitrogen austenite phaseclose to the surface, i.e., the nitrogen austenite with thehighest nitrogen content in the specimen, is preservedupon quenching to room temperature.
Similar to pore formation in nitrogen-ferrite speci-mens, the pore formation tendency is lower for the Fe-Me alloys with alloying elements which more or lesseasily precipitate as nitrides (i.e., Me = Al, Cr, and Si)and the pore formation tendency is higher for alloyingelements which cannot precipitate, in the practice of thecurrent experiments, as alloying-element nitrides (i.e.,Me = Co, Ge, and Ni).
The non-occurrence of nitrogen austenite (at thesurface), in the case of the nitrided Fe-Si alloy (Figures 6and 7), can be ascribed to Si being the strongest ferritestabilizing alloying element, as compared to Co, Ni, andGe.
Nitrided Fe-Ni alloy shows a microstructure which iscomparable to the microstructure of nitrided pure iron(cf. Figures 5(a) and 6(e)). A pronounced layer ofnitrogen martensite with a thickness of approximately200 lm (see what follows) is visible in the light opticalmicrograph and the EBSD phase map inset (seeFigure 6(e)).
The thickness of the nitrogen austenite/martensitelayers is much smaller in the Fe-Me alloys which arealloyed with ferrite stabilizing alloying elements such asAl, Cr, and Ge (Ni is an austenite stabilizing element).Also the occurrence of pronounced pore development,as in case of the Fe-Co alloy, obstructs growth of thenitrogen-austenite layer, because the nitrogen that could
be used for nitrogen-austenite layer growth gets lost bypore development.The attainable nitrogen supersaturation in austenite is
much larger than in ferrite (cf. Section II), whichpromotes pore nucleation, but this is counteracted bya nitrogen diffusion rate in austenite being much slowerthan in ferrite (a factor 1000 at 923 K (650 �C)[46,47]).Especially if the growth rate of the nitrogen-austenitelayer into ferrite is (partly) interface controlled, then thegrowth rate is (also) controlled by the difference inGibbs energy of ferrite and austenite.[48] In case offerrite stabilizing alloying elements, as Al, Cr, and Ge,this difference in Gibbs energy will be relatively small,which would lead to a reduced rate of austenite layergrowth. This is observed indeed for Fe-Al, Fe-Cr, andFe-Ge alloys compared to pure Fe (cf. Figures 6(a), (b)and (d) vs 5(a)). In such cases the ferrite matrixunderneath the relatively slowly growing austenite layerwill become more rapidly supersaturated with nitrogen.Indeed for the same time of nitriding, at identicalnitriding conditions, porosity in the ferrite underneaththe austenite layer is observed for Fe-Al, Fe-Cr, and Fe-Ge alloys and not for pure Fe (see, Figures 6(a), (b) and(d) vs 5a).
VI. CONCLUSIONS
� The thermodynamic instability of pure nitrogen fer-rite can in principle induce its decomposition innitrogen-depleted ferrite and nitrogen gas. Thisnitrogen gas development leads to the formation ofpores at grain boundaries, as shown in this projectfor the nitrided ferrite matrix of pure iron. Strik-ingly, a single crystal of nitrided, pure ferritic irondid not show porosity development.
� The nitrogen gas pressure in closed pores exceeds thecritical value for yielding according to both the vonMises criterion and the Tresca criterion, and the ma-trix surrounding the pores visibly yields as, for exam-ple, exhibited by bulging out of the specimen surface.
� The thermodynamic instability of pure nitrogen aus-tenite induces its decomposition in nitrogen-depletedaustenite and nitrogen gas leading to pore develop-ment similar as in nitrogen ferrite. The driving forcefor this process is much larger than for the decom-position of nitrogen ferrite. The decomposition ofnitrogen austenite into nitrogen ferrite and N2 gas isthermodynamically possible, but the release of Gibbsenergy is small in comparison with the decomposi-tion of nitrogen austenite into nitrogen-depleted aus-tenite and N2 gas. The ferrite phase can reemerge ifthe nitrogen depletion of the austenite, surroundingchannels (at grain boundaries) in contact with theouter surface, continues.
� Alloying elements that enhance the nitrogen equilib-rium solubility in iron, i.e., Al and Cr, and that pre-cipitate easily as nitrides, such as AlN and CrN,
METALLURGICAL AND MATERIALS TRANSACTIONS A VOLUME 45A, DECEMBER 2014—6185
exhibit less pronounced pore formation than pureiron.
� Alloying elements that reduce the nitrogen equilib-rium solubility in iron, i.e., Co and Ge, and that donot precipitate easily as nitrides, promote the forma-tion of pores as compared to pure iron.
� Si dissolved in iron lowers the nitrogen equilibriumsolubility in iron and precipitates (very slowly) as(amorphous) Si3N4. The pore formation at ferritegrain boundaries is retarded due to the developmentof amorphous Si3N4 bands along the grain bound-aries which inhibits nucleation of N2 gas filled poresat the grain boundaries.
ACKNOWLEDGMENTS
The authors thank Mr. Dipl.-Ing. (FH) P. Kress andMr. W. Engelhardt for assistance with the nitridingexperiments, Dr. E. Bischoff for EBSD investigation anddiscussion, Dipl.-Ing. P. J. Rossi for SEM investigationand Mrs. S. Haug for EPMA analysis (all with the MaxPlanck Institute for Intelligent Systems, Stuttgart).
REFERENCES1. E.J. Mittemeijer: in ASM Handbook, vol. 4A, J.I. Dossett and
G.E. Totten, eds., 2013, pp. 619–46.2. D.Liedtke,U.Baudis, J. Boßlet,U.Huchel,H.Klumper-Westkamp,
W. Lerche, and H.-J. Spies:Warmebehandlung von Eisenwerkstoffen,3rd ed., Expert-Verlag, Renningen-Malmsheim, 2006.
3. P.M. Unterweiser and A.G. Gray, eds.: Source Book on Nitriding,ASM, Metals Park, OH, 1977.
4. H.C.F. Rozendaal, E.J. Mittemeijer, P.F. Colijn, and P.J. van derSchaaf: Metall. Trans. A, 1983, vol. 14A, pp. 395–99.
5. S.R. Meka and E.J. Mittemeijer: JOM, 2013, vol. 65 (6),pp. 769–75.
6. B. Prenosil: HTM, 1973, vol. 28, pp. 157–64.7. M.A.J. Somers and E.J. Mittemeijer: Surf. Eng., 1987, vol. 3 (2),
pp. 123–37.8. M.A.J. Somers, B.J. Kooi, W.G. Sloof, and E.J. Mittemeijer: Surf.
Interface Anal., 1992, vol. 19 (1–12), pp. 633–37.9. R. Hoffmann, E.J. Mittemeijer, and M.A.J. Somers: HTM, 1996,
vol. 51, pp. 162–69.10. C. Middendorf and W. Mader: Z. Metallkd., 2003, vol. 94 (3),
pp. 333–40.11. I. Etsion: J. Tribol-T ASME, 2005, vol. 127, pp. 248–53.12. E.J. Mittemeijer and M.A.J. Somers: Surf. Eng., 1997, vol. 13 (6),
pp. 483–97.13. E. Lehrer: Z. Elektrochem., 1930, vol. 36, pp. 383–92.14. E.J. Mittemeijer, M. van Rooyen, I. Wierszyllowski, H.C.F.
Rozendaal, and P.F. Colijn: Z. Metallkd., 1983, vol. 74 (7),pp. 473–83.
15. F.X. Lu: Inst Phys. Conf. Ser. No. 68, Chapter 9, 1983.16. E.J. Mittemeijer: J. Met., 1985, vol. 37 (9), pp. 16–20.17. S.R. Meka, S.S. Hosmani, A.R. Clauss, and E.J. Mittemeijer: Int.
J. Mater. Res., 2008, vol. 99 (7), pp. 808–14.
18. S.S. Hosmani, R.E. Schacherl, and E.J. Mittemeijer: Acta Mater.,2006, vol. 54 (10), pp. 2783–92.
19. J. Stein, R.E. Schacherl, M. Jung, S.R. Meka, B. Rheingans, andE.J. Mittemeijer: Int. J. Mater. Res., 2013, vol. 104 (11),pp. 1053–65.
20. E.J. Mittemeijer and J.T. Slycke: Surf. Eng., 1996, vol. 12 (2),pp. 152–62.
21. M. Yu, G. Ma, and J. Li: Structural Plasticity: Limit, Shakedownand Dynamic Plastic Analyses of Structures, Springer Books, NewYork, 2009.
22. J.O. Anderson, T. Helander, L. Hoglund, P.F. Shi, and B. Sund-man: CALPHAD, 2002, vol. 26, pp. 273–312.
23. J. Kunze: HTM, 1996, vol. 51 (6), pp. 348–54.24. K.D. Clarke, R.J. Comstock, Jr., M.C. Mataya, C.J. Tyne, and
D.K. Matlock: Metall. Mater. Trans. A, 2008, vol. 39A,pp. 752–62.
25. M.W. Chase Jr.: J Phys Chem Ref Data, Monograph 9, 1998,http://webbook.nist.gov, Accessed November 2013.
26. M.O. Speidel: Proc Stainless Steel World 2001 Conference, TheHague, The Netherlands, 2001.
27. M.L.G. Byrnes, M. Grujicic, and W.S. Owen: Acta Metall. Mater.,1987, vol. 35 (7), pp. 1853–62.
28. JCPDS: PDF-2 (2002) database. Version 2.1, International Centerfor Diffraction Data, 2002.
29. R.T. DeHoff and F.N. Rhines: Quantitative Microscopy, McGraw-Hill, New York, 1968.
30. J.L. Pouchou and F. Pichoir: Rech Aerospatiale, 1984, no. 3,pp. 167–92.
31. A.H. Jehn and P. Perrot: Aluminum-Iron-Nitrogen, Landolt-Bornstein New Series IV/11D1, Accessed November 2013.
32. P. Perrot: Chromium-Iron-Nitrogen, Landolt-Bornstein New SeriesIV/11D3, http://www.springermaterials.com, Accessed November2013.
33. M.A.J. Somers, R.M. Lankreijer, and E.J. Mittemeijer: Philos.Mag. A, 1989, vol. 59 (2), pp. 353–78.
34. M.H. Biglari, C.M. Brakman, E.J. Mittemeijer, and S. van derZwaag: PhilosMag. A, 1995, vol. 72 (4), pp. 931–47.
35. R.E. Schacherl, P.C.J. Graat, and E.J. Mittemeijer: Metall. Mater.Trans. A, 2004, vol. 35A, pp. 3387–98.
36. P.M. Hekker, H.C.F. Rozendaal, and E.J. Mittemeijer: J. Mater.Sci., 1985, vol. 20 (2), pp. 718–29.
37. S.Y. Zaginaychenko, Z.A. Matysina, and M.I. Milyan: Fiz. Met.Metalloved, 1990, vol. 22, pp. 63–67.
38. A. Leineweber, F. Lienert, S. Glock, T. Woehrle, P. Schaaf, M.Wilke, and E.J. Mittemeijer: Z. Kristallogr. Proc., 2011, vol. 1,pp. 293–98.
39. J. Kunze and P.O.K. Friedrich: J. Mater. Sci. Lett., 1986, vol. 5(8), pp. 815–18.
40. E.J. Mittemeijer, M.H. Biglari, A.J. Bottger, N.M. van der Pers,W.G. Sloof, and F.D. Tichelaar: Scripta Mater., 1999, vol. 41 (6),pp. 625–30.
41. S.R. Meka, K.S. Jung, E. Bischoff, and E.J. Mittemeijer: Philos.Mag., 2012, vol. 92 (11), pp. 1435–55.
42. H.P. van Landeghem, M. Goune, and A. Redjaimia: Steel Res.Int., 2012, vol. 83 (6), pp. 590–93.
43. M. Fonovic, A. Leineweber, and E.J. Mittemeijer: Surf. Eng.,2013, vol. 30, pp. 16–20.
44. T. Bell and W.S. Owen: Trans. Metall. Soc. AIME, 1967, vol. 239(12), p. 1940.
45. Fe-Ni (Iron-Nickel), The Landolt-Bornstein Database IV/5,Springer Materials, http://www.springermaterials.com, AccessedNovember 2013.
46. J.D. Fast and M.B. Verrijp: J. Iron Steel. Ins., 1954, vol. 176 (1),pp. 24–27.
47. H.J. Grabke and E.M. Petersen: Scripta Metall., 1978, vol. 12 (12),pp. 1111–14.
48. E.J. Mittemeijer: Fundamentals of Materials Science, Springer-Verlag, Berlin, 2010.
6186—VOLUME 45A, DECEMBER 2014 METALLURGICAL AND MATERIALS TRANSACTIONS A


![Steiner, T., Meka, S. R., Rheingans, B., Bischoff, E ... · nitriding pure iron [21]. The nitriding treatment was terminated by quenching the specimen into N2‐flushed water at room](https://img.pdfslide.us/doc/110x75/5e1f2e0a69f24f4e92283a65/steiner-t-meka-s-r-rheingans-b-bischoff-e-nitriding-pure-iron-21.jpg)