Embed Size (px)
Citation preview

University of Rhode IslandDigitalCommons@URICivil & Environmental Engineering FacultyPublications Civil & Environmental Engineering
2013
Population Vulnerability to Biannual CholeraOutbreaks and Associated Macro-Scale Drivers inthe Bengal DeltaAli Shafqat AkandaUniversity of Rhode Island, [email protected]
Antarpreet S. Jutla
See next page for additional authors
Follow this and additional works at: https://digitalcommons.uri.edu/cve_facpubs
Terms of UseAll rights reserved under copyright.
This Article is brought to you for free and open access by the Civil & Environmental Engineering at DigitalCommons@URI. It has been accepted forinclusion in Civil & Environmental Engineering Faculty Publications by an authorized administrator of DigitalCommons@URI. For more information,please contact [email protected].
Citation/Publisher AttributionAkanda, A. S., Jutla, A. S., Gute, D. M., Sack, R. B., Alam, M., Huq, A., Colwell, R. R., & Islam, S. (2013). Population Vulnerability toBiannual Cholera Outbreaks and Associated Macro-Scale Drivers in the Bengal Delta. The American Journal of Tropical Medicine andHygiene, 89(5), 950-959. doi: 10.4269/ajtmh.12-0492Available at: https://doi.org/10.4269/ajtmh.12-0492

AuthorsAli Shafqat Akanda, Antarpreet S. Jutla, David M. Gute, R. Bradley Sack, Munirul Alam, Anwar Huq, Rita R.Colwell, and Shafiqul Islam
This article is available at DigitalCommons@URI: https://digitalcommons.uri.edu/cve_facpubs/20

Am. J. Trop. Med. Hyg., 89(5), 2013, pp. 950–959doi:10.4269/ajtmh.12-0492Copyright © 2013 by The American Society of Tropical Medicine and Hygiene
Population Vulnerability to Biannual Cholera Outbreaks and Associated Macro-Scale
Drivers in the Bengal Delta
Ali Shafqat Akanda, Antarpreet S. Jutla, David M. Gute, R. Bradley Sack, Munirul Alam, Anwar Huq,Rita R. Colwell, and Shafiqul Islam*
Department of Civil and Environmental Engineering, University of Rhode Island, Kingston, Rhode Island; Civil and Environmental Engineering,West Virginia University, Morgantown, West Virginia; Department of Civil and Environmental Engineering, and Water Diplomacy,
Fletcher School of Law and Diplomacy, Tufts University, Medford, Massachusetts; Bloomberg School of Public Health, Johns HopkinsUniversity, Baltimore, Maryland; International Centre for Diarrhoeal Disease Research, Dhaka, Bangladesh; Center for Bioinformatics
and Computational Biology, and Maryland Pathogen Research Institute, University of Maryland, College Park, Maryland
Abstract. The highly populated floodplains of the Bengal Delta have a long history of endemic and epidemic choleraoutbreaks, both coastal and inland. Previous studies have not addressed the spatio-temporal dynamics of populationvulnerability related to the influence of underlying large-scale processes. We analyzed spatial and temporal variability ofcholera incidence across six surveillance sites in the Bengal Delta and their association with regional hydroclimatic andenvironmental drivers. More specifically, we use salinity and flood inundation modeling across the vulnerable districtsof Bangladesh to test earlier proposed hypotheses on the role of these environmental variables. Our results show stronginfluence of seasonal and interannual variability in estuarine salinity on spring outbreaks and inland flooding on falloutbreaks. A large segment of the population in the Bengal Delta floodplains remain vulnerable to these biannual choleratransmission mechanisms that provide ecologic and environmental conditions for outbreaks over large geographic regions.
INTRODUCTION
Cholera, an acute diarrheal illness caused by the bacteriumVibrio cholerae, remains a major public health threat in thedeveloping world. Seasonal recurrence of this infectious dis-ease in endemic areas, the role of climate in its proliferation,and recent epidemic outbreaks across different continents havegreatly challenged scientists, epidemiologists, and public healthprofessionals. The life cycle of V. cholerae is intricately linkedto two types of processes with vastly different spatial and tem-poral scales.1 Despite major advances in the understanding ofthe microbiologic and genetic level processes surrounding thebacterium, the role of the large-scale hydrologic, ecologic, andclimatic (referred to as macro-scale) processes in propagatingthe disease in space and time is not well understood. For exam-ple, the existence of an aquatic environmental reservoir ofV. cholerae and its association with marine plankton specieshas been firmly established.2 However, the role of river dis-charge or ocean temperature in aiding the bacterium growthor propagation of the disease is not well understood.3
A large number of investigations of cholera outbreaks andthe role of environmental factors have been published, espe-cially since 2005. Colwell1 and Lobitz and others4 were amongthe first to suggest large-scale role of climate processes oncholera outbreaks in the Bengal delta region. Pascual andothers,5,6 Koelle and others,7 and Cash and others8 havesuggested a strong relationship of Bengal cholera with sea-surface temperature in the Pacific Ocean and the El Nino-Southern Oscillation phenomenon. Constantin de Magny andothers9 and Emch and others10 have also suggested the roleof regional precipitation and influence of the ocean climate onregional cholera outbreaks. It should be noted that mostof these studies have relied on surveillance data from Matlab,
a rural coastal town in Bangladesh. The geographic and hydro-logic dissimilarities between Matlab and other affected areaswere reported as early as 1978.11 Bengal cholera outbreaks aresubject to strong seasonal influences in regional hydrocli-matology and display a wide variation in location, timeof occurrence and magnitude.12 It is generally accepted thatcholera outbreaks across the region are under reported andthat the disease burden has been severely underestimated.Studies using Matlab as the main data source thus provide alimited picture of the spatial and temporal variability of choleraoutbreaks and underlying processes for the entire Ganges-Brahmaputra-Meghna (GBM) basin.Akanda and others12,13 recently showed how regional
droughts or floods in the GBM basin region affect the magni-tude of cholera outbreaks in spring and in fall, respectively.The physical basis of these findings is that the highly asym-metric hydrology of the GBM region causes drastic reductionof freshwater flows in the dry season, accelerating the salinefront movement from Bay of Bengal towards inland fresh-water; the inward movement of seawater and increased salinityof the estuarine rivers provide an optimal growth environmentfor the bacterium. An asymmetric influence of the regionalrivers on cholera suggests seasonal cholera in multiple loca-tions is associated with underlying macro-scale climatic driversthroughout the region, i.e., in coastal areas in the spring andinland regions in the fall. Salinity of estuarine rivers and waterinundation in the inland floodplains has been suggested toinfluence cholera outbreaks in the Bengal Delta.12,14 However,these hypotheses were not examined by detailed modelingstudies or undertaking an investigation directly linking estua-rine salinity to spring cholera outbreaks. Similarly, detailedflood impact studies to quantitatively link local and regionalfloods with water and sanitation breakdown and subsequentfall cholera outbreaks in different locations across the BengalDelta region have not been conducted.In this study, we investigate how such macro-scale envi-
ronmental drivers physically modulate cholera dynamics indisease-prone areas and affect populations over large geo-graphic areas in the Bengal Delta. With long-term cholera
*Address correspondence to Shafiqul Islam, Department of Civil andEnvironmental Engineering, Tufts University, 200 College Avenue,311 Anderson Hall, Medford, MA 02155. E-mail: [email protected]
950

surveillance data from the inland mega-city of Dhaka, andrecent surveillance data from additional locations in the flood-plains and regional surveillance centers, we can identify theseasonal nature of cholera outbreaks in multiple locationswith respect to the underlying macro-scale climatic driversthroughout the region. Ability to provide a rapid assessmentof underlying drivers, as a precursor to epidemic outbreaks,would greatly aid in identifying population centers atincreased risk of epidemics. More specifically, we address thefollowing three questions in this study. The first question isDo seasonal GBM stream flow patterns show a macro-scaleasymmetric relationship with spring and fall disease incidencein different surveillance locations? The second question isDoes estuarine salinity intrusion over large areas increase riskof cholera in the dry season, and do inland flood patterns andwater stagnation in lowland areas lead to elevated levelsof cholera incidence in the fall? The third question is Can weestimate the size of the population at risk in response tomacro-scale environmental mechanisms of dual seasonal out-breaks, based on detailed simulation of salinity and floodingin the Bengal Delta floodplains?
MATERIALS AND METHODS
Study area and surveillance locations. Much of the litera-ture on epidemiology, transmission, propagation, and controlof cholera involves long-term datasets generated by the Inter-national Center for Diarrheal Disease Research (icddr,b) inMatlab, Bangladesh, where cholera is endemic and extensivesurveillance and associated hydroclimatic data are available.The icddr,b has maintained a sophisticated disease surveil-lance program in Dhaka since 1980, where cholera incidenceis assessed by testing for V. cholerae among a sequentialsample of patients visiting the hospital each week. These dataand cholera incidence records from Matlab (1998–2007),Bakerganj (1998–2007), Chhatak (1999–2005), and Mathbaria(2003–2007) in Bangladesh, where the icddr,b maintains satel-lite surveillance operations (Figure 1 and Table 1) were usedin the study. Kolkata cholera incidence is recorded by theNational Institute of Cholera and Enteric Diseases in India.Bangladesh is situated on alluvial floodplains in the down-
stream parts of the Ganges-Brahmaputra-Meghna River basinencompassing the Bengal Delta (Figure 1). The hydroclima-tology of this region is highly asymmetric in time and space,with more than 80% of the annual precipitation occurring dur-ing the four monsoon months of June through September.Average annual rainfall ranges from 1,500 mm in the Gangesbasin catchments in the west to more than 4,000 mm in theMeghna basin areas in eastern Bangladesh.15 As a result, theentire GBM basin region experiences an asymmetric pattern ofwater availability with severe scarcity of water predominatingduring the winter and spring months in downstream, followedby abundance of water in summer in floodplains along theriver corridors and lower elevation delta areas.16
Dhaka, a mega-city with 12 million persons and a popula-tion of more than 23 million persons in the Greater Dhakaregion, is a freshwater ecosystem in central Bangladesh,surrounded by several tributaries of the GBM rivers. Matlab(population = 250,000) is a cholera-endemic area in southeast-ern Bangladesh, located near the confluence of the GBMrivers. However, it is less than 100 kilometers from the coastof the Bay of Bengal and is subject to tidal fluctuations.
Matlab is sustained predominantly by an agriculture sectorand better access to healthcare compared with other rurallocations in Bangladesh.Bakerganj is a district town in southern Bangladesh adja-
cent to the main GBM outlet, known as the Meghna Channel,and prone to major flood events, typically during the latermonths of the monsoon season.15 This region has a largefishing industry, with numerous estuarine channels leading tothe Bay of Bengal. Population exposure to brackish water ishigh. Mathbaria, a coastal locality close to the Bay of Bengal,is known for freshwater scarcity because the region is servedby one major river from the north, the Gorai. Chhatak,located inland and farthest from the coast, experiences heavyrainfall during monsoon months and is prone to flash floods.Mathbaria experiences cholera outbreaks predominantly
in the spring, whereas Chhatak cholera outbreaks occur inthe fall. Dhaka, Matlab, and Bakerganj, located along thecentral floodplains of the GBM river system, have the charac-teristic dual cholera outbreak pattern. For comparative pur-poses, additional cholera incidence data were obtained fromKolkata, a major city in eastern India with a population ofmore than 20 million persons, which is also located in theBengal Delta and supplied by a distributary of the GangesRiver. It experiences biannual cholera peaks in the spring andfall like the other locations, according to the recent surveil-lance records for 1998–2007.Seasonal and interannual variability analysis. Monthly and
seasonal occurrences of cholera were compared over multiplesurveillance locations throughout the region. Monthly clima-tologic incidence (average monthly incidence for the durationof the study period) was computed for the surveillance centersand the data were analyzed to obtain monthly and seasonalincidence patterns. A list of the surveillance centers and thelength of the data period is shown in Table 1. Monthly aver-age cholera incidence with confidence intervals is shown inFigure 2A. For seasonal analysis, cholera time series wasdisaggregated into two seasonal components, spring (March–May) and fall (October–December), for each of the six sites.Seasonal cholera incidence anomalies were calculated as devi-ations from the mean for 1998–2007 and normalized withrespective standard deviations. Mathbaria and Chhatak wereexcluded from the anomaly analysis because of a shortertemporal length of available data. However, the single peaknature of these locations (Mathbaria in the spring andChaatak in the fall) enabled effective comparison of incidenceof these locations with the dual peak signature of other thefour locations with respective interannual variation. A com-parison of mean seasonal cholera incidence anomalies isshown in Figure 2B and C.Macro-scale role of regional rivers. If the hypothesis of
large-scale hydroclimatic controls of cholera dynamics is valid,a dual role of river discharge for all the surveillance locationsalong these major rivers would be seen, namely, region-wideinverse relationship between low flow and spring cholera and apositive relationship between fall cholera with high flow. Totest this hypothesis, seasonal low and high flow volumes forthe Ganges and the Brahmaputra Rivers were compared withmean spring and fall cholera incidence anomalies for all fourlocations, respectively. Mean stream flow values for the lowestflow months (February and March) and the two highest flowmonths (July and August) were used to develop a seasonallow and high flow time series. Kolkata is situated on the
VULNERABILITY TO CHOLERA DRIVERS 951

Figure 1. A, District-wise population density map of Bangladesh, showing surveillance areas used in this study and location of majorrivers in the region. B, Schematic of conceptual model setup for simulation of estuarine salinity and flood inundation. GBM = Ganges-Brahmaputra-Meghna.
952 AKANDA AND OTHERS

Bhagirathi-Hooghly River system in eastern India, which isdirectly supplied by upstream diversions from the GangesRiver.17 Thus, only stream flow data from the Ganges Riverwere used for the Kolkata analysis.
Salinity and flood extent simulation. Lack of salinity datafor the estuarine ecosystems and detailed flood informationpost-monsoon has prevented previous studies from analyzingthe role of these variables on cholera transmission. A physicallybased mathematical model was used to circumvent the needfor intensive data collection and estimate flow and salinity dataat various ungauged sites in the Bengal Delta. MIKE-11, a one-dimensional river modeling system, developed by the DanishHydraulic Institute (Copenhagen, Denmark),18 was used tosimulate dominant hydrologic processes in inland floodplainsand coastal ecosystems of this large river basin.After successful calibration of the model for the GBM
system and coastal region, we tested seasonal and interannualscenarios or options with the model to determine the impact ofhydroclimatic changes on hydrologic and ecological indicators
Figure 2. Comparison of normalized A, mean monthly cholera incidence; B, mean spring incidence anomaly; and C, mean fall incidenceanomaly for selected locations, Bangladesh.
Table 1
Ecosystem type, average cholera incidence, and data length forsix locations
Location Ecosystem type Data period
Dhaka, Bangladesh Urban, floodplain 1980–2007Matlab, Bangladesh Rural, floodplain 1998–2007Mathbaria, Bangladesh Rural, coastal 2003–2007Chhatak, Bangladesh Rural, upstream 1999–2005Bakerganj, Bangladesh Semi-urban, coastal 1998–2007Kolkata, India Urban, coastal 1998–2007
VULNERABILITY TO CHOLERA DRIVERS 953
relevant to cholera. Results for different seasonal forcing werepost-processed using the MIKE-11 Advection-Dispersionmodule and geographic information system tools to developestuarine salinity and floodplain inundation maps (Figure 1B).Matlab (Mathworks, Inc., Natlick, MA) and Excel (MicrosoftCorporation, Redmond, WA) were used for statistical analysesand ArcGIS (ESRI, Redlands, CA) was used for flood areaanalysis and visualization.The Nedbør-Afrstrømnings Model18 generates overland
flow from upstream flow, rainfall, evaporation and ground-water and uses it to express lateral inflow for the Hydro-Dynamic module, which uses an implicit finite differencesolution of the Saint Venant equations18 and known boundaryconditions at upstream inflow points and downstream tidalwater level boundaries to estimate water levels at river reachcontrol points. For validation of the environmental compo-nent of the model, runoff values are compared with waterlevel and flow observations from existing gauging stationsacross the GBM river system inside Bangladesh.19 The modelhas been extensively calibrated against measured flow andobserved river stage values using parameters such asManning’sNumber, channel geometry, and riverbed soil type.The Hydro-Dynamic module outputs are subsequently used
as input to the Advection–Dispersion module to simulate salin-ity of river water), and to geographic information system tocompute flooded land area. TheAdvection–Dispersion moduleapplies advective transport with the mean flow volume anddispersive transport for concentration gradient to solve forone-dimensional conservation of mass. Observed salinity con-centrations are used at all model boundary locations as initialconditions. The salinity model was calibrated separately for thedry (January–April) and wet (July–October) seasons to reflectseasonal variation of salinity in the rivers.20 The geographicinformation system module uses detailed digital elevationmodels of the GBM spatial domain and outputs of river waterlevels at locations across the basin to compute depth and extentof flooding. Monthly salinity and flood area statistics werecalculated for affected districts in Bangladesh and analyzedwith cholera incidence data at surveillance locations.Role of estuarine salinity and flood inundation. Seasonal
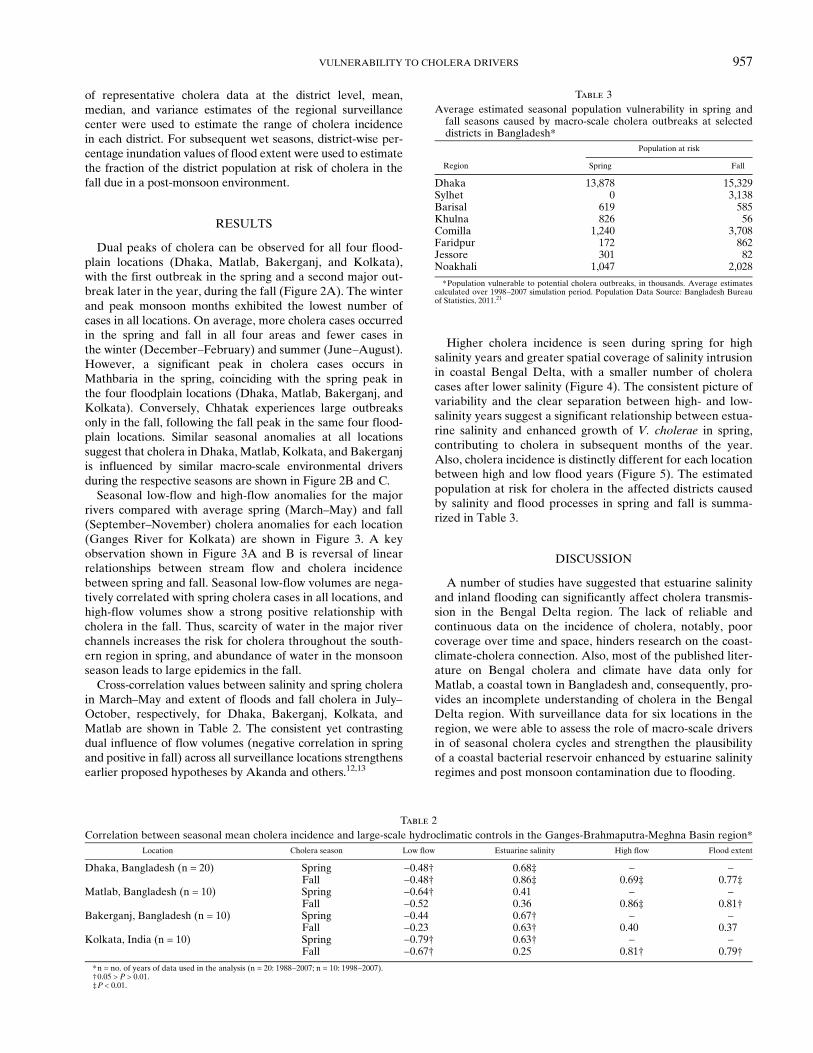
associations were analyzed by using Pearson correlation coef-ficients calculated for March–May salinity and spring cholera,and July–October flooding and corresponding fall cholera(Table 2). The analysis was extended by examining the pat-tern of monthly cholera in all four (Dhaka, Matlab, Kolkataand Bakerganj) surveillance locations after high and lowsalinity in the estuaries. The 10 year analysis for 1998–2007was divided into high and low bins, based on salinity duringoutbreak seasons, and average monthly cholera in selectedsets of five high and five low years across all four surveillancelocations (Figure 4). To establish evidence for flood inunda-tion perpetuating the progression of cholera in the fall, the10 year (1998–2007) period of analysis was divided into highand low bins, based on the extent of flooding in the wet season(July–October), and average of the monthly cholera casesin Dhaka, Matlab, Kolkata, and Bakerganj, for the selectedfive high and five low years (Figure 5).Estimating population at risk. The district-wide population
database (BangladeshBureauof Statistics, 2011)21 ofBangladeshwas used to estimate the population at risk of cholera in eachdistrict. We argue that the population of a district is not con-stantly at risk because of spatial and temporal changes in hydro-
climatic and ecologic forcings and resulting environmentalconditions. Thus, the percentage of population in each districtas a function of the seasonal drivers of cholera was used toestimate monthly population vulnerability. However, becauselocation-specific cholera data are not available, the risk of trans-mission is assumed to be uniformacross all locationswithin eachdistrict. This limitation has been further addressed in the discus-sion section of this report.During the dry season, coastal districts in the south and
central districts contiguous with Dhaka and the river corridorsare vulnerable to cholera. Salinity at different locations alongthe rivers and coastal points was used to estimate averagesalinity in districts, and a variance weighted average valuein the central districts away from coastal areas was used toestimate the fraction of population at risk. In the absence
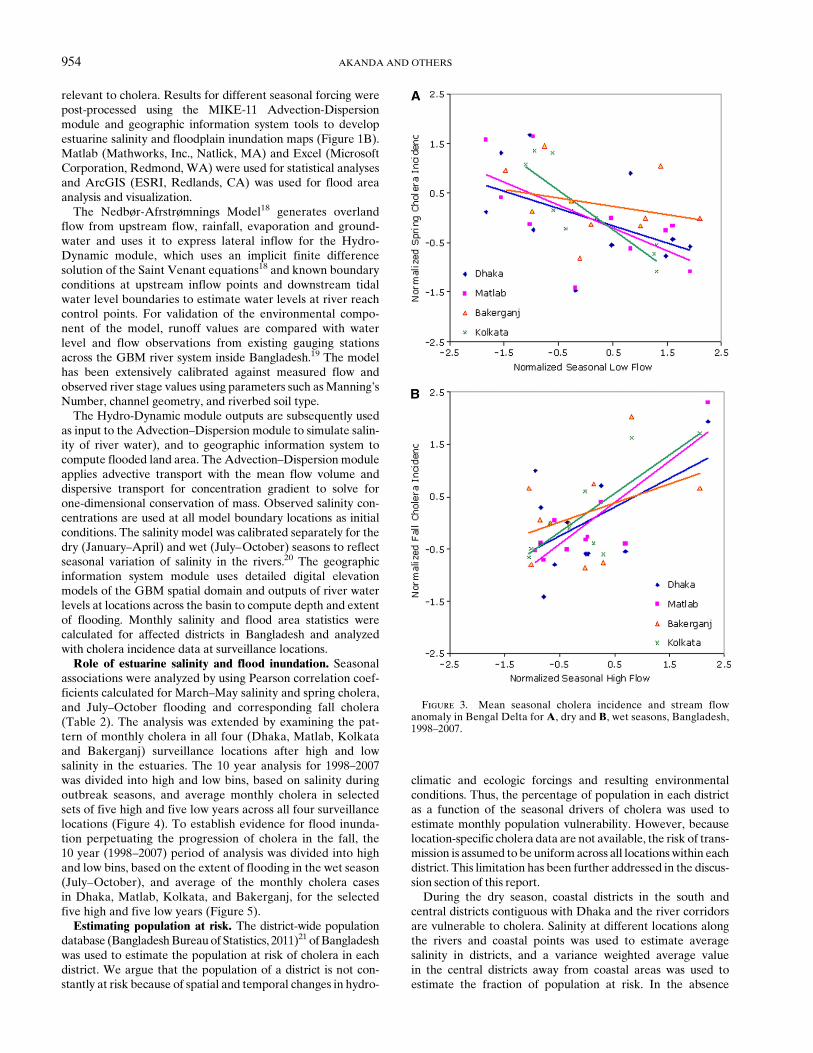
Figure 3. Mean seasonal cholera incidence and stream flowanomaly in Bengal Delta for A, dry and B, wet seasons, Bangladesh,1998–2007.
954 AKANDA AND OTHERS

Figure 4. Monthly cholera incidence in Dhaka, Matlab, and Bakerganj, Bangladseh, and Kolkata, India, and high and low estuarine salinityin southwestern Bangladesh, 1988–2007.
VULNERABILITY TO CHOLERA DRIVERS 955

Figure 5. Monthly cholera incidence in Dhaka, Matlab, Bakerganj, Bangladesh, and Kolkata, India, and high and low flood inundationin central and northeastern Bangladesh, 1988–2007.
956 AKANDA AND OTHERS
of representative cholera data at the district level, mean,median, and variance estimates of the regional surveillancecenter were used to estimate the range of cholera incidencein each district. For subsequent wet seasons, district-wise per-centage inundation values of flood extent were used to estimatethe fraction of the district population at risk of cholera in thefall due in a post-monsoon environment.
RESULTS
Dual peaks of cholera can be observed for all four flood-plain locations (Dhaka, Matlab, Bakerganj, and Kolkata),with the first outbreak in the spring and a second major out-break later in the year, during the fall (Figure 2A). The winterand peak monsoon months exhibited the lowest number ofcases in all locations. On average, more cholera cases occurredin the spring and fall in all four areas and fewer cases inthe winter (December–February) and summer (June–August).However, a significant peak in cholera cases occurs inMathbaria in the spring, coinciding with the spring peak inthe four floodplain locations (Dhaka, Matlab, Bakerganj, andKolkata). Conversely, Chhatak experiences large outbreaksonly in the fall, following the fall peak in the same four flood-plain locations. Similar seasonal anomalies at all locationssuggest that cholera in Dhaka, Matlab, Kolkata, and Bakerganjis influenced by similar macro-scale environmental driversduring the respective seasons are shown in Figure 2B and C.Seasonal low-flow and high-flow anomalies for the major
rivers compared with average spring (March–May) and fall(September–November) cholera anomalies for each location(Ganges River for Kolkata) are shown in Figure 3. A keyobservation shown in Figure 3A and B is reversal of linearrelationships between stream flow and cholera incidencebetween spring and fall. Seasonal low-flow volumes are nega-tively correlated with spring cholera cases in all locations, andhigh-flow volumes show a strong positive relationship withcholera in the fall. Thus, scarcity of water in the major riverchannels increases the risk for cholera throughout the south-ern region in spring, and abundance of water in the monsoonseason leads to large epidemics in the fall.Cross-correlation values between salinity and spring cholera
in March–May and extent of floods and fall cholera in July–October, respectively, for Dhaka, Bakerganj, Kolkata, andMatlab are shown in Table 2. The consistent yet contrastingdual influence of flow volumes (negative correlation in springand positive in fall) across all surveillance locations strengthensearlier proposed hypotheses by Akanda and others.12,13
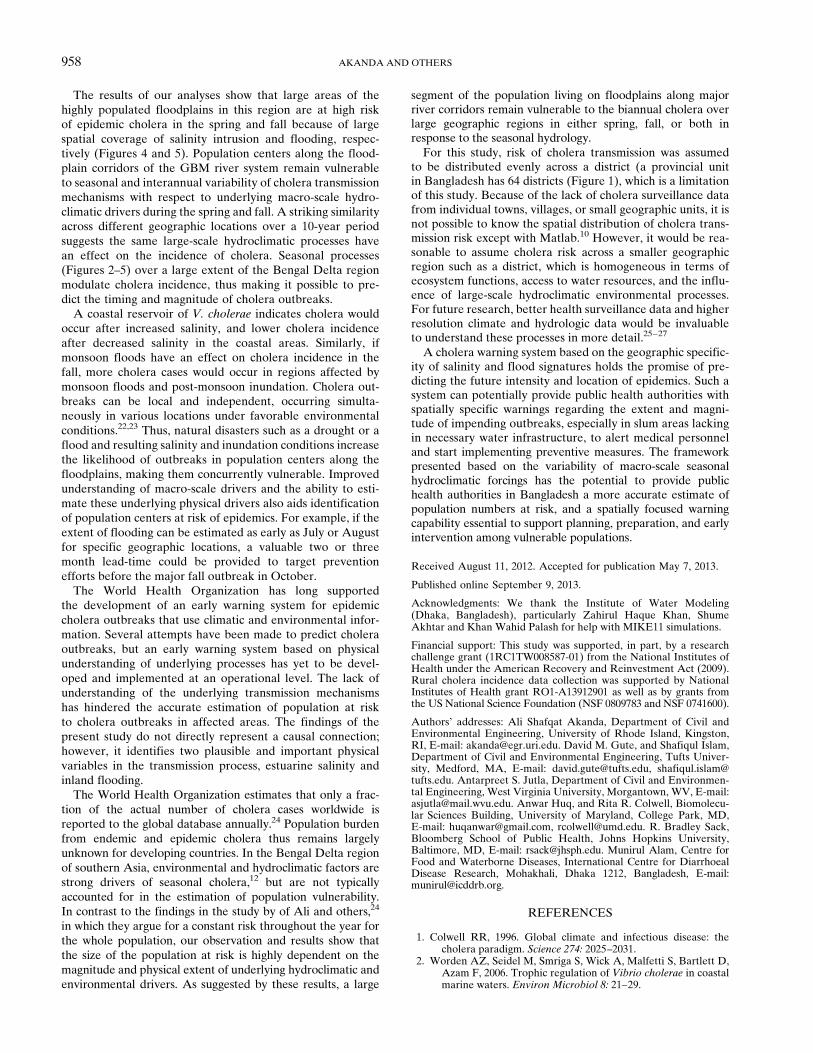
Higher cholera incidence is seen during spring for highsalinity years and greater spatial coverage of salinity intrusionin coastal Bengal Delta, with a smaller number of choleracases after lower salinity (Figure 4). The consistent picture ofvariability and the clear separation between high- and low-salinity years suggest a significant relationship between estua-rine salinity and enhanced growth of V. cholerae in spring,contributing to cholera in subsequent months of the year.Also, cholera incidence is distinctly different for each locationbetween high and low flood years (Figure 5). The estimatedpopulation at risk for cholera in the affected districts causedby salinity and flood processes in spring and fall is summa-rized in Table 3.
DISCUSSION
A number of studies have suggested that estuarine salinityand inland flooding can significantly affect cholera transmis-sion in the Bengal Delta region. The lack of reliable andcontinuous data on the incidence of cholera, notably, poorcoverage over time and space, hinders research on the coast-climate-cholera connection. Also, most of the published liter-ature on Bengal cholera and climate have data only forMatlab, a coastal town in Bangladesh and, consequently, pro-vides an incomplete understanding of cholera in the BengalDelta region. With surveillance data for six locations in theregion, we were able to assess the role of macro-scale driversin of seasonal cholera cycles and strengthen the plausibilityof a coastal bacterial reservoir enhanced by estuarine salinityregimes and post monsoon contamination due to flooding.
Table 2
Correlation between seasonal mean cholera incidence and large-scale hydroclimatic controls in the Ganges-Brahmaputra-Meghna Basin region*Location Cholera season Low flow Estuarine salinity High flow Flood extent
Dhaka, Bangladesh (n = 20) Spring −0.48† 0.68‡ − −
Fall −0.48† 0.86‡ 0.69‡ 0.77‡Matlab, Bangladesh (n = 10) Spring −0.64† 0.41 − −
Fall −0.52 0.36 0.86‡ 0.81†Bakerganj, Bangladesh (n = 10) Spring −0.44 0.67† − −
Fall −0.23 0.63† 0.40 0.37Kolkata, India (n = 10) Spring −0.79† 0.63† − −
Fall −0.67† 0.25 0.81† 0.79†
*n = no. of years of data used in the analysis (n = 20: 1988–2007; n = 10: 1998–2007).†0.05 > P > 0.01.‡P < 0.01.
Table 3
Average estimated seasonal population vulnerability in spring andfall seasons caused by macro-scale cholera outbreaks at selecteddistricts in Bangladesh*
Region
Population at risk
Spring Fall
Dhaka 13,878 15,329Sylhet 0 3,138Barisal 619 585Khulna 826 56Comilla 1,240 3,708Faridpur 172 862Jessore 301 82Noakhali 1,047 2,028
*Population vulnerable to potential cholera outbreaks, in thousands. Average estimatescalculated over 1998–2007 simulation period. Population Data Source: Bangladesh Bureauof Statistics, 2011.21
VULNERABILITY TO CHOLERA DRIVERS 957
The results of our analyses show that large areas of thehighly populated floodplains in this region are at high riskof epidemic cholera in the spring and fall because of largespatial coverage of salinity intrusion and flooding, respec-tively (Figures 4 and 5). Population centers along the flood-plain corridors of the GBM river system remain vulnerableto seasonal and interannual variability of cholera transmissionmechanisms with respect to underlying macro-scale hydro-climatic drivers during the spring and fall. A striking similarityacross different geographic locations over a 10-year periodsuggests the same large-scale hydroclimatic processes havean effect on the incidence of cholera. Seasonal processes(Figures 2–5) over a large extent of the Bengal Delta regionmodulate cholera incidence, thus making it possible to pre-dict the timing and magnitude of cholera outbreaks.A coastal reservoir of V. cholerae indicates cholera would
occur after increased salinity, and lower cholera incidenceafter decreased salinity in the coastal areas. Similarly, ifmonsoon floods have an effect on cholera incidence in thefall, more cholera cases would occur in regions affected bymonsoon floods and post-monsoon inundation. Cholera out-breaks can be local and independent, occurring simulta-neously in various locations under favorable environmentalconditions.22,23 Thus, natural disasters such as a drought or aflood and resulting salinity and inundation conditions increasethe likelihood of outbreaks in population centers along thefloodplains, making them concurrently vulnerable. Improvedunderstanding of macro-scale drivers and the ability to esti-mate these underlying physical drivers also aids identificationof population centers at risk of epidemics. For example, if theextent of flooding can be estimated as early as July or Augustfor specific geographic locations, a valuable two or threemonth lead-time could be provided to target preventionefforts before the major fall outbreak in October.The World Health Organization has long supported
the development of an early warning system for epidemiccholera outbreaks that use climatic and environmental infor-mation. Several attempts have been made to predict choleraoutbreaks, but an early warning system based on physicalunderstanding of underlying processes has yet to be devel-oped and implemented at an operational level. The lack ofunderstanding of the underlying transmission mechanismshas hindered the accurate estimation of population at riskto cholera outbreaks in affected areas. The findings of thepresent study do not directly represent a causal connection;however, it identifies two plausible and important physicalvariables in the transmission process, estuarine salinity andinland flooding.The World Health Organization estimates that only a frac-
tion of the actual number of cholera cases worldwide isreported to the global database annually.24 Population burdenfrom endemic and epidemic cholera thus remains largelyunknown for developing countries. In the Bengal Delta regionof southern Asia, environmental and hydroclimatic factors arestrong drivers of seasonal cholera,12 but are not typicallyaccounted for in the estimation of population vulnerability.In contrast to the findings in the study by of Ali and others,24
in which they argue for a constant risk throughout the year forthe whole population, our observation and results show thatthe size of the population at risk is highly dependent on themagnitude and physical extent of underlying hydroclimatic andenvironmental drivers. As suggested by these results, a large
segment of the population living on floodplains along majorriver corridors remain vulnerable to the biannual cholera overlarge geographic regions in either spring, fall, or both inresponse to the seasonal hydrology.For this study, risk of cholera transmission was assumed
to be distributed evenly across a district (a provincial unitin Bangladesh has 64 districts (Figure 1), which is a limitationof this study. Because of the lack of cholera surveillance datafrom individual towns, villages, or small geographic units, it isnot possible to know the spatial distribution of cholera trans-mission risk except with Matlab.10 However, it would be rea-sonable to assume cholera risk across a smaller geographicregion such as a district, which is homogeneous in terms ofecosystem functions, access to water resources, and the influ-ence of large-scale hydroclimatic environmental processes.For future research, better health surveillance data and higherresolution climate and hydrologic data would be invaluableto understand these processes in more detail.25–27
A cholera warning system based on the geographic specific-ity of salinity and flood signatures holds the promise of pre-dicting the future intensity and location of epidemics. Such asystem can potentially provide public health authorities withspatially specific warnings regarding the extent and magni-tude of impending outbreaks, especially in slum areas lackingin necessary water infrastructure, to alert medical personneland start implementing preventive measures. The frameworkpresented based on the variability of macro-scale seasonalhydroclimatic forcings has the potential to provide publichealth authorities in Bangladesh a more accurate estimate ofpopulation numbers at risk, and a spatially focused warningcapability essential to support planning, preparation, and earlyintervention among vulnerable populations.
Received August 11, 2012. Accepted for publication May 7, 2013.
Published online September 9, 2013.
Acknowledgments: We thank the Institute of Water Modeling(Dhaka, Bangladesh), particularly Zahirul Haque Khan, ShumeAkhtar and Khan Wahid Palash for help with MIKE11 simulations.
Financial support: This study was supported, in part, by a researchchallenge grant (1RC1TW008587-01) from the National Institutes ofHealth under the American Recovery and Reinvestment Act (2009).Rural cholera incidence data collection was supported by NationalInstitutes of Health grant RO1-A13912901 as well as by grants fromthe US National Science Foundation (NSF 0809783 and NSF 0741600).
Authors’ addresses: Ali Shafqat Akanda, Department of Civil andEnvironmental Engineering, University of Rhode Island, Kingston,RI, E-mail: [email protected]. David M. Gute, and Shafiqul Islam,Department of Civil and Environmental Engineering, Tufts Univer-sity, Medford, MA, E-mail: [email protected], [email protected]. Antarpreet S. Jutla, Department of Civil and Environmen-tal Engineering, West Virginia University, Morgantown, WV, E-mail:[email protected]. Anwar Huq, and Rita R. Colwell, Biomolecu-lar Sciences Building, University of Maryland, College Park, MD,E-mail: [email protected], [email protected]. R. Bradley Sack,Bloomberg School of Public Health, Johns Hopkins University,Baltimore, MD, E-mail: [email protected]. Munirul Alam, Centre forFood and Waterborne Diseases, International Centre for DiarrhoealDisease Research, Mohakhali, Dhaka 1212, Bangladesh, E-mail:[email protected].
REFERENCES
1. Colwell RR, 1996. Global climate and infectious disease: thecholera paradigm. Science 274: 2025–2031.
2. Worden AZ, Seidel M, Smriga S, Wick A, Malfetti S, Bartlett D,Azam F, 2006. Trophic regulation of Vibrio cholerae in coastalmarine waters. Environ Microbiol 8: 21–29.
958 AKANDA AND OTHERS

3. Jutla AS, Akanda AS, Griffiths J, Colwell RR, Islam S, 2011.Warming oceans, phytoplankton, and river discharge: implica-tions for cholera outbreaks. Am J Trop Med Hyg 85: 303–308.
4. Lobitz B, Beck L, Huq A, Wood B, Faruque A, Colwell R, 2000.Climate and infectious disease: Use of remote sensing fordetection of Vibrio cholerae. Proc Natl Acad Sci USA 97.
5. Pascual M, Rodo X, Ellner SP, Colwell RR, Bouma MJ, 2000.Cholera dynamics and El Nino-Southern Oscillation. Science289: 1766–1769.
6. Pascual M, Chaves LF, Cash B, Rodo X, Yunus M, 2008. Pre-dicting endemic cholera: the role of climate variability anddisease dynamics. Clim Res 36: 131–140.
7. Koelle K, Rodo X, Pascual M, Yunus M, Mostafa G, 2005.Refractory periods and climate forcing in cholera dynamics.Nature 436. 696–700.
8. Cash BA, Rodo X, Kinter JL III, 2008. Links between tropicalPacific SST and cholera incidence in Bangladesh: role of theeastern and central tropical Pacific. J Clim 21: 4647–4663.
9. Constantin de Magny G, Murtugudde R, Sapiano MR, Nizam A,Brown CW, Busalacchi AJ, Yunus M, Nair GB, Gil AI, LanataCF, Calkins J, Manna B, Rajendran K, Bhattacharya MK,Huq A, Sack RB, Colwell RR, 2008. Environmental signaturesassociated with cholera epidemics. Proc Natl Acad Sci USA105: 17676–17681.
10. Emch M, Feldacker C, Yunus M, Streatfield PK, Dinh Thiem V,Canh do G, Ali CM, 2008. Local environmental predictorsof cholera in Bangladesh and Vietnam. Am J Trop Med Hyg78: 823–832.
11. Briscoe J, 1978. The role of water supply in improving healthin poor countries. Am J Clin Nutr 81: 2100–2113.
12. Akanda AS, Jutla AS, Alam M, Constantin de Magny G, AlamM, Sack RB, Huq A, Colwell RR, Islam S, 2011. Hydroclimaticinfluences on seasonal and spatial cholera transmission cycles:implications for public health intervention in Bengal Delta.Water Resour Res 47: W00H07.
13. Akanda AS, Jutla AS, Islam S, 2009. Dual peak cholera trans-mission in Bengal Delta: a hydroclimatological explanation.Geophys Res Lett 36: L19401.
14. Miller CJ, Drasar BS, Feachem RG, 1982. Cholera and estuarinesalinity in Calcutta and London. Lancet 1: 1216–1218.
15. Mirza MM, 2003. Three recent extreme floods in Bangladesh:a Hydro-meteorological analysis. Nat Hazards 28: 35–64.
16. Akanda AS, 2012. South Asia’s water conundrum: hydro-climatic and geopolitical asymmetry, and brewing conflictsin the eastern Himalayas. Intl J River Basin Management 10:307–315.
17. Rahman MM, Hassan MQ, Islam MS, Shamsad SZ, 2000.Environmental impact assessment on water quality deterio-ration caused by decreased Ganges flow. Environ Geol 40:31–40.
18. Danish Hydraulic Institute, 2008. Scientific Documentation onMIKE-11 NAM-HD-AD and MIKE-11 GIS. Copenhagen: DHIPress, Release 9.2.
19. Nishat B, Rahman SM, 2009. Water resources modeling of theGanges-Brahmaputra-Meghna River basins using satelliteremote sensing data. J Am Water Resour Assoc 45: 1313–1327.
20. Wahid S, Babel M, Bhuiyan A, 2007. Hydrologic monitoringand analysis in Sundarbans mangrove ecosystem, Bangladesh.J Hydrol (Amst) 332: 381–395.
21. Bangladesh Bureau of Statistics (BBS), Bangladesh, 2011. Avail-able at: http://www.bbs.gov.bd.
22. Stine O, Alam M, Tang L, Nair GB, Siddique AK, Faruque SM,Huq A, Colwell RR, Sack RB, Morris JG Jr, 2008. Seasonalcholera from multiple small outbreaks in rural Bangladesh.Emerg Infect Dis 14: 831–833.
23. Alam M, Islam A, Bhuyan NA, Rahim N, Hossain A, Khan GY,Ahmed D, Watanabe H, Izumiya H, Faruque AS, Akanda AS,Islam S, Sack RB, Huq A, Colwell RR, Cravioto A, 2011.Clonal transmission, dual peak, and off-season cholera inBangladesh. Infection Ecology and Epi 1: 7273.
24. Ali M, Lopez AL, You YA, Kim YE, Sah B, Maskery B, ClemensJ, 2012. The global burden of cholera. Bull World HealthOrgan 90: 209–218A.
25. Jutla AS, Akanda AS, Huq A, Faruque A, Colwell R, Islam S,2013. A water marker monitored by satellites to predictendemic cholera. Remote Sensing Letters, doi:10.1080/2150704X.2013.802097.
26. Jutla AS, Whitcombe E, Hasan H, Haley B, Akanda AS, Huq A,Alam M, Sack B, Colwell R, 2013. Environmental factorsinfluencing epidemic cholera. Am J Trop Med Hyg 89: 597–607.
27. Jutla AS, Akanda AS, Islam S, 2013. A framework for pre-dicting endemic cholera using satellite derived environmen-tal determinants. Environmental Modelling and Software,doi:http://dx.doi.org/10.1016/j.envsoft.2013.05.008.
VULNERABILITY TO CHOLERA DRIVERS 959


![Predictive modeling of cholera outbreaks in Bangladeshvnminin.github.io/papers/Koepke2016.pdf · through an environmental reservoir effect [Codeço (2001), Tien and Earn (2010)]](https://img.pdfslide.us/doc/110x75/5f4e0ddd7272764ef03c8a24/predictive-modeling-of-cholera-outbreaks-in-through-an-environmental-reservoir-effect.jpg)