Embed Size (px)
Citation preview
Indian Journal of Marine Sciences
Vol. 38(1), March 2009, pp. 57-68
1
Population structure, growth, mortality and yield per recruit of segestid shrimp,
Acetes japonicus (Decapoda: Sergestidae) from the coastal waters of Malacca,
Peninsular Malaysia
S. M. Nurul Amin1, A. Arshad
1, 2, S. S. Siraj
2 and B. Japar Sidik
3
1Laboratory of Marine Science and Aquaculture, Institute of Bioscience, Universiti Putra Malaysia, 43400 Serdang, Selangor, Malaysia 2Department of Aquaculture, Faculty of Agriculture, Universiti Putra Malaysia, 43400 UPM Serdang, Selangor, Malaysia
3Department of Animal Science and Fishery, Faculty of Agriculture and Food Sciences, Universiti Putra Malaysia,
Bintulu Campus, 89007 Bintulu Sarawak
[E-mail: [email protected]]
Received 7 June 2007; 16 November 2007
Present study consists the population structure, growth, mortality and relative yield recruit of A. japonicus from the
coastal waters of Malacca, Peninsular Malaysia. FISAT software has been used to examine the monthly data. The
asymptotic length (Lα) and growth co-efficient (K) was estimated as 29.08 mm and 1.4 y-1. The growth performance index
(ϕ′) was calculated as 3.073. The exponent (b) of the length-weight relationship was found to be 3.063 (± 0.015). The
asymptotic weight was calculated as 187.72 mg. Total mortality coefficient (Z) was estimated at 5.16 yr-1. The natural
mortality (M) and fishing mortality (F) was calculated as 2.35 yr-1 and 2.81 yr-1, respectively. Exploitation rate (E) of A.
japonicus was estimated as 0.54. The recruitment pattern was continuous throughout the year with one major peak. The
relative yield per recruit analysis predicted the maximum exploitation rate (Emax) = 0.52. The current exploitation rate E is
slightly higher than predicted Emax. The stock of A. japonicus was found to be over exploited in the investigated area.
[Keywords: Population dynamics, Acetes Japonicus, Malaysia]
Introduction The sergestid shrimps of the genus Acetes, family
sergestidae, are one of the economically important
organisms in Asian and African waters1. There are
several accounts of Acetes fishery from Malay
Peninsular2,1,3&4
. In west Malaysia, Acetes (Local
name ‘udang geragau’) supports a considerable
subsistence fishery5 which is based mainly on A.
japonicus and A. indicus1. The world-wide
geographical distribution of Acetes has been
summarized by Omori and Holthuis6.
The shrimp of the genus Acetes plays a substantial
role in the food webs of coastal waters, acting as
predators7. It appears in a very large swarm in the
shallow inshore coastal waters, which is brackish with
a salinity of 30 ppt or less, during certain seasons of
the year2. Only a very small proportion of the catch is
disposed off as fresh shrimp but the greater part is sun
dried and sold as dried shrimp or processed into a
paste known locally as 'Belachan' or pickled whole to
give a product known as 'Chinchalok2. The annual
landing of Acetes in Malaysia was 7,528 tons during
20048.
Spectacular schools or swarms of Acetes,
particularly in coastal Asia, are the bases of important
commercial fishes for consumption by humans and
domestic animals4,9,1,10,11&12
. The commercial
importance also derives from the use and potential of
Acetes as a food organism for aquaculture
industry13&14
. These combined features make Acetes
excellent candidates for population dynamic studies.
In spite of greater abundance and importance of the
genus Acetes in the fishery of Asian countries, very
little information is available on the population
parameters like growth and motilities so far except the
studies carried out by15,16,17,18
.
Knowledge of various population parameters like
as asymptotic length (L∝) and growth coefficient (K),
motilities (natural and fishing) rate and exploitation
level (E) are necessary for planning and management
of A. japonicus resources. Lack of knowledge on the
population structure and proper evaluation of the
exploitation of this resource emphasize the
importance of a detailed study to facilitate better
___________
Address for correspondence:
Laboratory of Marine Science and Aquaculture Institute of
Bioscience, Universiti Putra Malaysia 43400 UPM Serdang,
Selangor, Malaysia
INDIAN J. MAR. SCI., VOL. 38, NO. 1, MARCH 2009
58
management of the resource. There are many tools for
assessing exploitation level and status of stock. Of
these, FiSA T (FAO-ICLARM Stock Assessment
Tools) has been most frequently used for estimating
population parameters of shrimps19,20,21,22&23
because
primarily it requires only length-frequency data. The
objectives of the present study were to estimate the
key population parameters and exploitation rate (E) of
A. japonicus in order to assess the stock status of the
species around the coast waters of Malacca,
Peninsular Malaysia.
Materials and Methods Collection of data
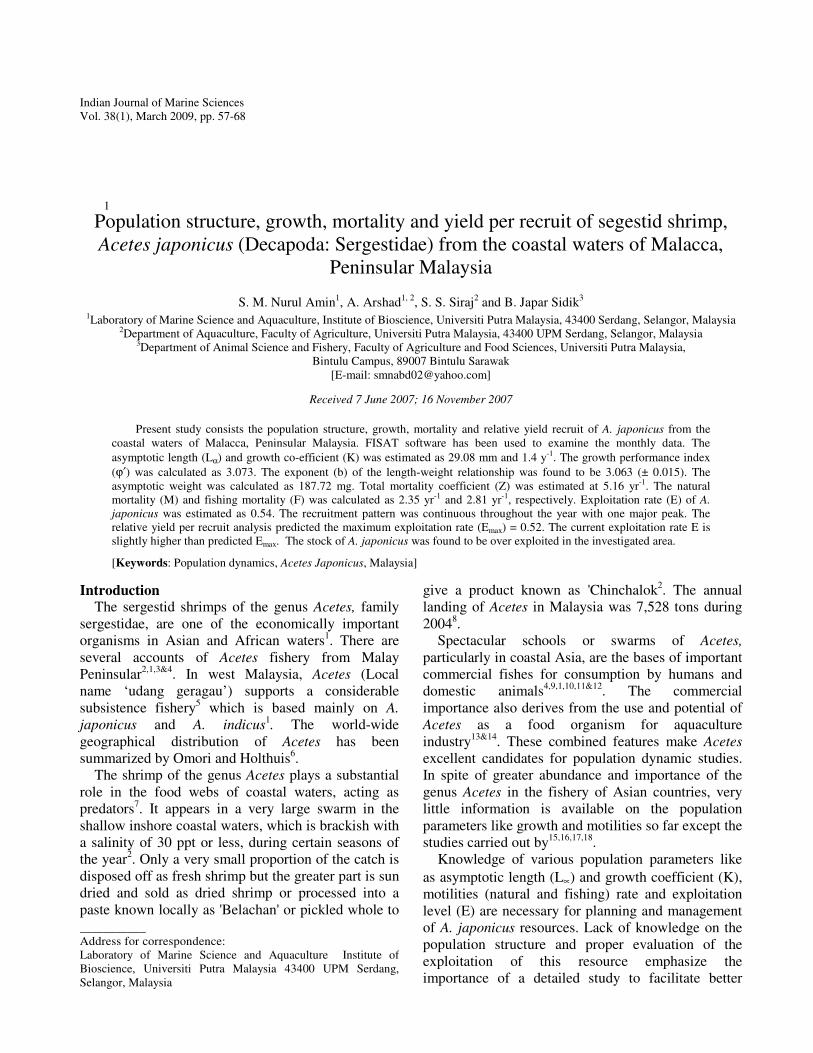
Monthly fresh samples of A. japonicus were
collected between February 2005 and January 2006
from commercial push net catches landed at Klebang
Besar (N 02°13.009′ and E 102° 11.921′) Malacca
(Fig. 1). Acetes shrimps were caught by the push net
(triangular shape) known locally as 'Sungkor', as
described by Omori-1
in the coastal waters of Klebang
Besar, Malacca. Dimensions of the net were 5-6 m in
length, 4.0-4.5 m in wide and 3.0-3.5m in height. The
mean mesh sizes were 3.2 (± 0.27) cm at the anterior
section, 0.75 (±0.05) cm at the middle and 0.5 (±0.08)
at cod end (stretched). After collection, samples were
fixed in 10% formalin solution in the field and
analyzed after 2-3 days of preservation. In the
laboratory, A. japonicus was identified using a Nikon
dissecting microscope. Sex of A. japonicus was
determined by the presence or absence of petasma on
the first pleopod and clasping spine on the lower
antennular flagellum1. The works of Omori
-1 were
followed during the identification of A. japonicus.
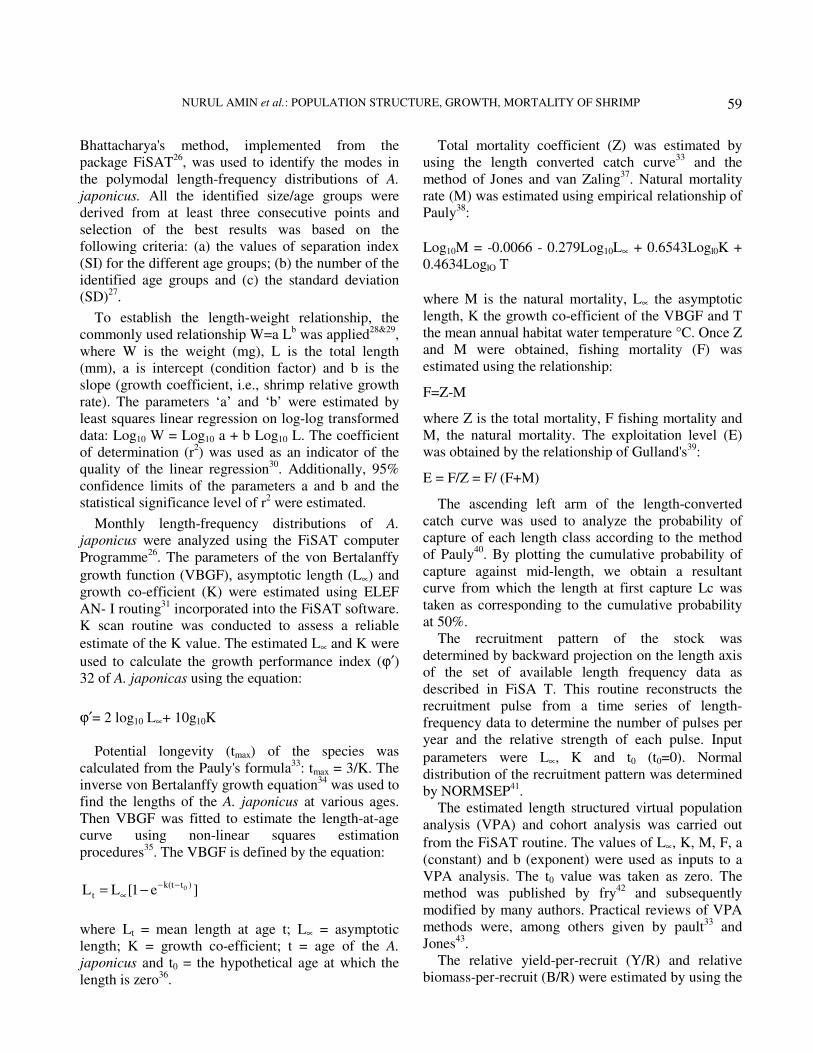
Total length (TL) of 3516 individuals (Table 1) was
measured from the tip of the rostrum to the tip of the
telson to the nearest 0.1 mm using vernier caliper.
Total weight was measured by an electronic balance
to the 0.1 mg accuracy. Data analysis
To estimate the population structure, the length-
frequency data of A. japonicus were analyzed by
using the MINTAB Version 14 and SPSS Version
11.5. The differences in the size-frequency
distributions of population between sexes were
determined by the Kolmogorov-Smimov two-sample
test24
. Student's t-test was used for comparison of the
mean total length of males and females25
.
Size-frequency distributions of A. japonicus in 1-
mm interval were plotted for each month.
Fig. l―Sampling location (dot) in the coastal waters of Malacca,
Peninsular Malaysia
Table 1―Length-frequency data of A. japonicus from the coastal
waters of Malacca, Malaysia.
ML F M A M J J A S O
8.5 6
9.5 32
10.5 3 1 73
11.5 3 2 144 4
12.5 1 8 15 7 12 223 9
13.5 13 9 21 1 16 32 31 216 20
14.5 52 23 27 11 23 21 87 244 20
15.5 96 28 37 11 23 25 102 157 18
16.5 99 16 41 6 23 21 76 48 16
17.5 78 8 30 20 18 38 12 10
18.5 38 8 47 15 13 37 7 10
19.5 38 13 48 3 8 12 68 4 11
20.5 31 16 48 6 4 16 47 7 6
21.5 33 15 63 5 12 24 9 6
22.5 50 17 55 3 13 2 5 18 8
23.5 34 13 19 2 2 1 16 6
24.5 22 3 7 1 9 1
25.5 5 2 2
26.5 1 2
27.5 2
592 172 451 48 166 182 531 1229 145
NURUL AMIN et al.: POPULATION STRUCTURE, GROWTH, MORTALITY OF SHRIMP
59
Bhattacharya's method, implemented from the
package FiSAT26
, was used to identify the modes in
the polymodal length-frequency distributions of A.
japonicus. All the identified size/age groups were
derived from at least three consecutive points and
selection of the best results was based on the
following criteria: (a) the values of separation index
(SI) for the different age groups; (b) the number of the
identified age groups and (c) the standard deviation
(SD)27
.
To establish the length-weight relationship, the
commonly used relationship W=a Lb was applied
28&29,
where W is the weight (mg), L is the total length
(mm), a is intercept (condition factor) and b is the
slope (growth coefficient, i.e., shrimp relative growth
rate). The parameters ‘a’ and ‘b’ were estimated by
least squares linear regression on log-log transformed
data: Log10 W = Log10 a + b Log10 L. The coefficient
of determination (r2) was used as an indicator of the
quality of the linear regression30
. Additionally, 95%
confidence limits of the parameters a and b and the
statistical significance level of r2 were estimated.
Monthly length-frequency distributions of A.
japonicus were analyzed using the FiSAT computer
Programme26
. The parameters of the von Bertalanffy
growth function (VBGF), asymptotic length (L∝) and
growth co-efficient (K) were estimated using ELEF
AN- I routing31
incorporated into the FiSAT software.
K scan routine was conducted to assess a reliable
estimate of the K value. The estimated L∝ and K were
used to calculate the growth performance index (ϕ′) 32 of A. japonicas using the equation:
ϕ′= 2 log10 L∝+ 10g10K
Potential longevity (tmax) of the species was
calculated from the Pauly's formula33
: tmax = 3/K. The
inverse von Bertalanffy growth equation34
was used to
find the lengths of the A. japonicus at various ages.
Then VBGF was fitted to estimate the length-at-age
curve using non-linear squares estimation
procedures35
. The VBGF is defined by the equation:
0k(t t )
tL L [1 e ]− −
∝= −
where Lt = mean length at age t; L∝ = asymptotic
length; K = growth co-efficient; t = age of the A.
japonicus and t0 = the hypothetical age at which the
length is zero36
.
Total mortality coefficient (Z) was estimated by
using the length converted catch curve33
and the
method of Jones and van Zaling37
. Natural mortality
rate (M) was estimated using empirical relationship of
Pauly38
:
Log10M = -0.0066 - 0.279Log10L∝ + 0.6543Logl0K +
0.4634LoglO T
where M is the natural mortality, L∝ the asymptotic
length, K the growth co-efficient of the VBGF and T
the mean annual habitat water temperature °C. Once Z
and M were obtained, fishing mortality (F) was
estimated using the relationship:
F=Z-M
where Z is the total mortality, F fishing mortality and
M, the natural mortality. The exploitation level (E)
was obtained by the relationship of Gulland's39
:
E = F/Z = F/ (F+M)
The ascending left arm of the length-converted
catch curve was used to analyze the probability of
capture of each length class according to the method
of Pauly40
. By plotting the cumulative probability of
capture against mid-length, we obtain a resultant
curve from which the length at first capture Lc was
taken as corresponding to the cumulative probability
at 50%.
The recruitment pattern of the stock was
determined by backward projection on the length axis
of the set of available length frequency data as
described in FiSA T. This routine reconstructs the
recruitment pulse from a time series of length-
frequency data to determine the number of pulses per
year and the relative strength of each pulse. Input
parameters were L∝, K and t0 (t0=0). Normal
distribution of the recruitment pattern was determined
by NORMSEP41
.
The estimated length structured virtual population
analysis (VPA) and cohort analysis was carried out
from the FiSAT routine. The values of L∝, K, M, F, a
(constant) and b (exponent) were used as inputs to a
VPA analysis. The t0 value was taken as zero. The
method was published by fry42
and subsequently
modified by many authors. Practical reviews of VPA
methods were, among others given by pault33
and
Jones43
.
The relative yield-per-recruit (Y/R) and relative
biomass-per-recruit (B/R) were estimated by using the
INDIAN J. MAR. SCI., VOL. 38, NO. 1, MARCH 2009
60
model of Beverton and Ho1t44
as modified by Pauly
and Soriano45
and incorporated in FiSA T software
package. The input requirements in the procedure
were the values of Lc/L∝ = 0.31 and M/K = 1.68.
From the analysis, the maximum allowable limit of
exploitation (Emax) giving maximum relative yield-
per-recruit was estimated. Also EO.1, the exploitation
rate at which the marginal increase in relative yield-
per-recruit is 10% of its value at E = 0 and E0.5, the
exploitation rate corresponding to 50% of the
unexploited relative biomass-per-recruit (B/R), were
estimated.
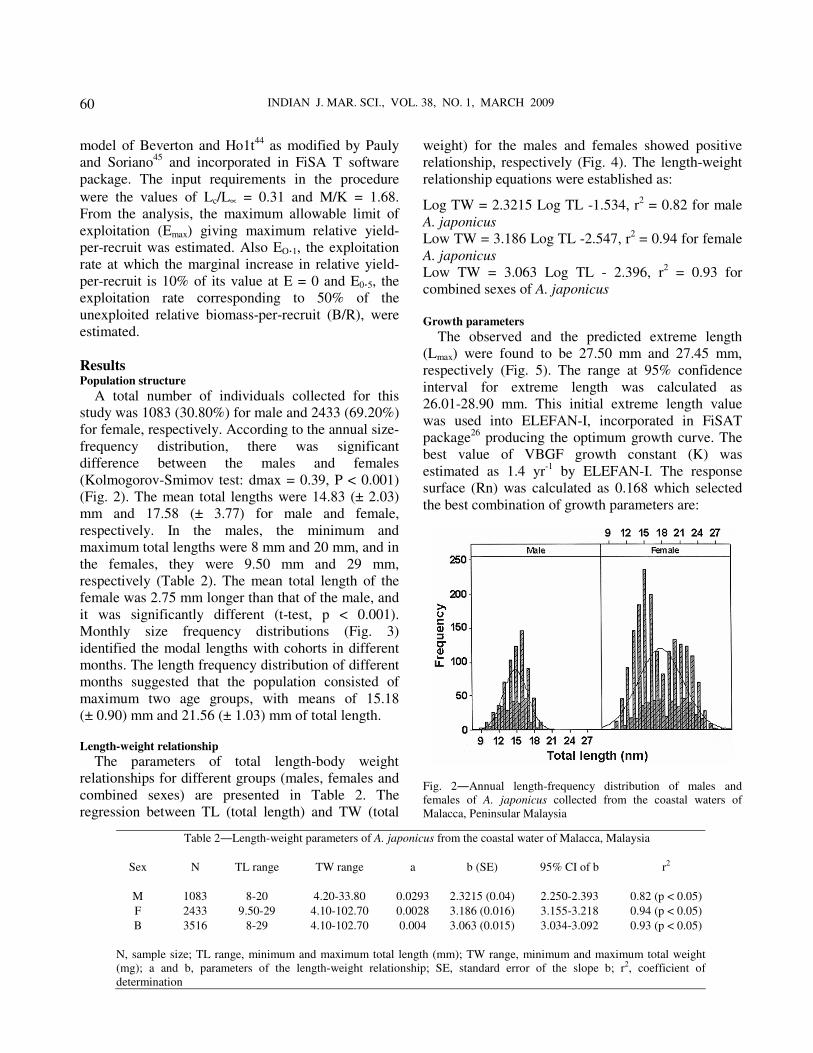
Results Population structure
A total number of individuals collected for this
study was 1083 (30.80%) for male and 2433 (69.20%)
for female, respectively. According to the annual size-
frequency distribution, there was significant
difference between the males and females
(Kolmogorov-Smimov test: dmax = 0.39, P < 0.001)
(Fig. 2). The mean total lengths were 14.83 (± 2.03)
mm and 17.58 (± 3.77) for male and female,
respectively. In the males, the minimum and
maximum total lengths were 8 mm and 20 mm, and in
the females, they were 9.50 mm and 29 mm,
respectively (Table 2). The mean total length of the
female was 2.75 mm longer than that of the male, and
it was significantly different (t-test, p < 0.001).
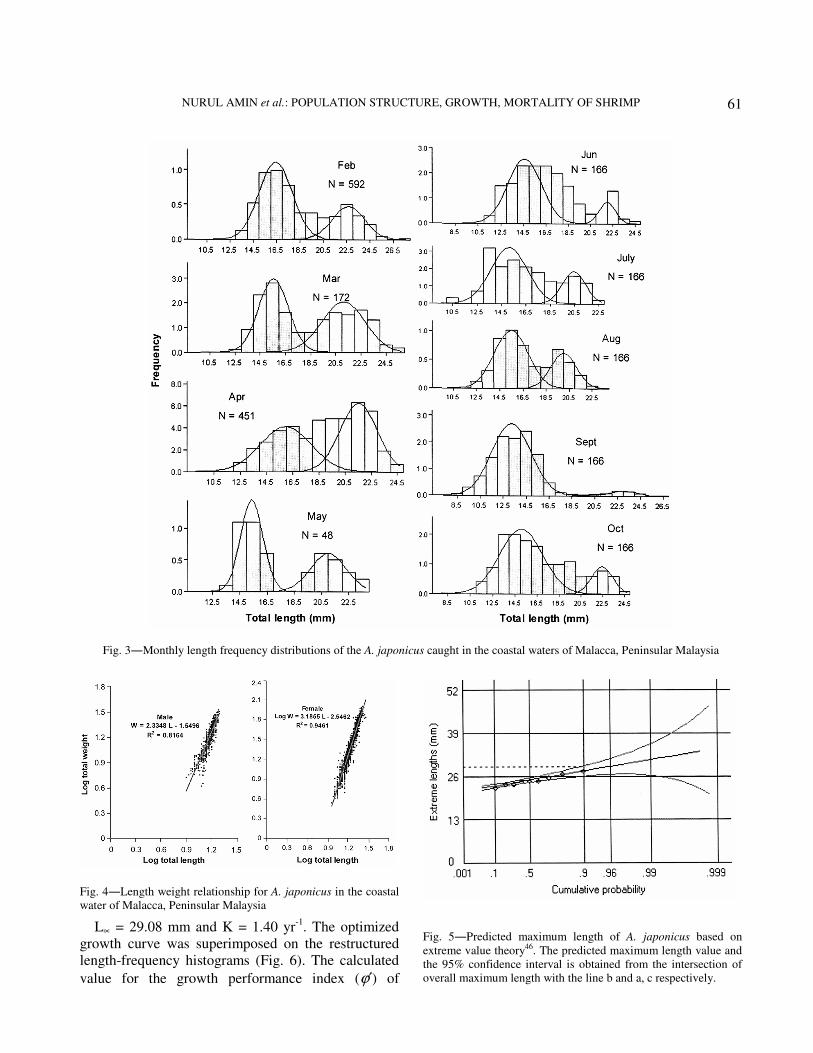
Monthly size frequency distributions (Fig. 3)
identified the modal lengths with cohorts in different
months. The length frequency distribution of different
months suggested that the population consisted of
maximum two age groups, with means of 15.18
(± 0.90) mm and 21.56 (± 1.03) mm of total length. Length-weight relationship
The parameters of total length-body weight
relationships for different groups (males, females and
combined sexes) are presented in Table 2. The
regression between TL (total length) and TW (total
weight) for the males and females showed positive
relationship, respectively (Fig. 4). The length-weight
relationship equations were established as:
Log TW = 2.3215 Log TL -1.534, r2 = 0.82 for male
A. japonicus
Low TW = 3.186 Log TL -2.547, r2 = 0.94 for female
A. japonicus
Low TW = 3.063 Log TL - 2.396, r2 = 0.93 for
combined sexes of A. japonicus
Growth parameters
The observed and the predicted extreme length
(Lmax) were found to be 27.50 mm and 27.45 mm,
respectively (Fig. 5). The range at 95% confidence
interval for extreme length was calculated as
26.01-28.90 mm. This initial extreme length value
was used into ELEFAN-I, incorporated in FiSAT
package26
producing the optimum growth curve. The
best value of VBGF growth constant (K) was
estimated as 1.4 yr-1
by ELEFAN-I. The response
surface (Rn) was calculated as 0.168 which selected
the best combination of growth parameters are:
Table 2―Length-weight parameters of A. japonicus from the coastal water of Malacca, Malaysia
Sex N TL range TW range a b (SE) 95% CI of b r2
M 1083 8-20 4.20-33.80 0.0293 2.3215 (0.04) 2.250-2.393 0.82 (p < 0.05)
F 2433 9.50-29 4.10-102.70 0.0028 3.186 (0.016) 3.155-3.218 0.94 (p < 0.05)
B 3516 8-29 4.10-102.70 0.004 3.063 (0.015) 3.034-3.092 0.93 (p < 0.05)
N, sample size; TL range, minimum and maximum total length (mm); TW range, minimum and maximum total weight
(mg); a and b, parameters of the length-weight relationship; SE, standard error of the slope b; r2, coefficient of
determination
Fig. 2―Annual length-frequency distribution of males and
females of A. japonicus collected from the coastal waters of
Malacca, Peninsular Malaysia
NURUL AMIN et al.: POPULATION STRUCTURE, GROWTH, MORTALITY OF SHRIMP
61
L∝ = 29.08 mm and K = 1.40 yr-1
. The optimized
growth curve was superimposed on the restructured
length-frequency histograms (Fig. 6). The calculated
value for the growth performance index (ϕ′) of
Fig. 3―Monthly length frequency distributions of the A. japonicus caught in the coastal waters of Malacca, Peninsular Malaysia
Fig. 5―Predicted maximum length of A. japonicus based on
extreme value theory46. The predicted maximum length value and
the 95% confidence interval is obtained from the intersection of
overall maximum length with the line b and a, c respectively.
Fig. 4―Length weight relationship for A. japonicus in the coastal
water of Malacca, Peninsular Malaysia
INDIAN J. MAR. SCI., VOL. 38, NO. 1, MARCH 2009
62
A. japonicus during the present investigation was
3.073. This value was close to the ϕ/-values recorded
in the literature15&16
but slightly higher than the value
recorded by Oh and Jeongl8
.
Age and growth
The application of Bhattacharya's method through
FiSAT determined model lengths of A. japonicus
ranging from 17 mm (in 13.22 September) to 22.97
mm (in September), with satisfactory separation index
(Table 3). The two dominant modal groups of A.
japonicus were identified reflecting different annual
cohorts. Therefore, the monthly size frequency
distributions suggested that the population consisted
of only two age groups, with modes at approximately
15 mm and ≥ 22 mm total length. Using the estimated
value of the growth coefficient (K= 1.4 yr-1
), the
longevity (tmax = 3/K) was calculated as 2.14 years
approximately. It is assumed as in the ELEFAN-I
analysis that the value of the third parameter of the
von Bertalanffy growth function t0 be zero31
.
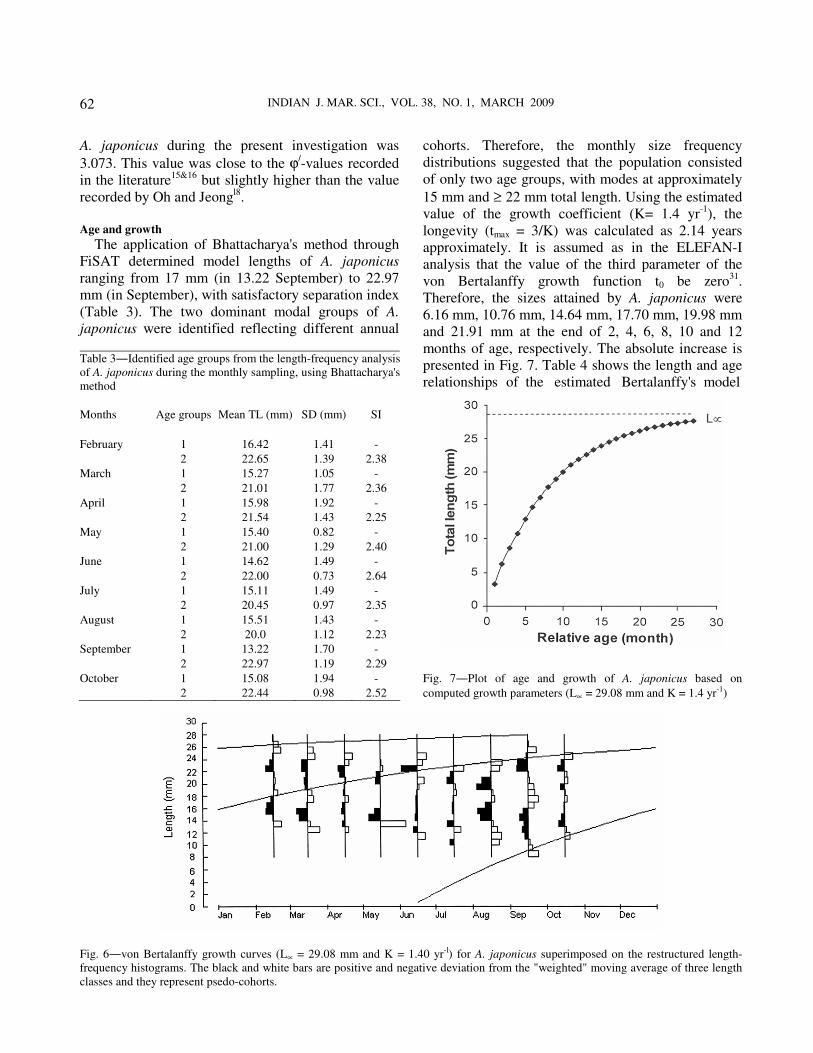
Therefore, the sizes attained by A. japonicus were
6.16 mm, 10.76 mm, 14.64 mm, 17.70 mm, 19.98 mm
and 21.91 mm at the end of 2, 4, 6, 8, 10 and 12
months of age, respectively. The absolute increase is
presented in Fig. 7. Table 4 shows the length and age
relationships of the estimated Bertalanffy's model
Fig. 6―von Bertalanffy growth curves (L∝ = 29.08 mm and K = 1.40 yr-l) for A. japonicus superimposed on the restructured length-
frequency histograms. The black and white bars are positive and negative deviation from the "weighted" moving average of three length
classes and they represent psedo-cohorts.
Table 3―Identified age groups from the length-frequency analysis
of A. japonicus during the monthly sampling, using Bhattacharya's
method
Months Age groups Mean TL (mm) SD (mm) SI
February 1 16.42 1.41 -
2 22.65 1.39 2.38
March 1 15.27 1.05 -
2 21.01 1.77 2.36
April 1 15.98 1.92 -
2 21.54 1.43 2.25
May 1 15.40 0.82 -
2 21.00 1.29 2.40
June 1 14.62 1.49 -
2 22.00 0.73 2.64
July 1 15.11 1.49 -
2 20.45 0.97 2.35
August 1 15.51 1.43 -
2 20.0 1.12 2.23
September 1 13.22 1.70 -
2 22.97 1.19 2.29
October 1 15.08 1.94 -
2 22.44 0.98 2.52
Fig. 7―Plot of age and growth of A. japonicus based on
computed growth parameters (L∝ = 29.08 mm and K = 1.4 yr-1)
NURUL AMIN et al.: POPULATION STRUCTURE, GROWTH, MORTALITY OF SHRIMP
63
Table 4―Length-at-age key for A. japonicus from coastal
waters of Malacca, estimated using the VBGF parameters
(L∝ = 29.08 and K = 1.40 yr-l)
Relative age
(month)
Total length (mm)
3.08
Growth rate
(dL/dT)
1 3.08 -
2 6.16 3.08
3 8.59 2.43
4 10.76 2.17
5 12.93 2.17
6 14.64 1.71
7 16.17 1.53
8 17.70 1.53
9 18.90 1.20
10 19.98 1.08
11 21.06 1.08
12 21.91 0.85
13 22.67 0.76
14 23.43 0.76
15 24.03 0.60
16 24.56 0.53
17 25.09 0.53
18 25.52 0.43
19 25.90 0.38
20 26.27 0.37
21 26.57 0.30
22 26.84 0.27
23 27.10 0.26
24 27.31 0.21
25 27.50 0.19
26 27.69 0.19
27 27.83 0.14
Table 5―Population parameters of A. japonicus from the
coastal water of Malacca, Malaysia
Population parameters A. japonicus
Asymptotic length (L∝) in mm 29.08
Asymptotic weight (W∝) in mg 187.72
Growth co-efficient (K yr-1) 1.40
Growth performance index (ϕ/) 3.073
Natural mortality (M yr-l) 2.35
Fishing mortality (F y-1) 2.81
Total mortality (Z yr-1) 5.16
Exploitation level (E) 0.54
Allowable limit of exploitation (Emax) 0.52
Sample number (N) 3516
using growth parameters L∝ = 29.08 mm, K = 1.04
yr-1
and t0 = 0. The total lengths correspond to the
relative age since the value of t0 =0. Therefore the
actual age, could not be calculated based on length
data only.
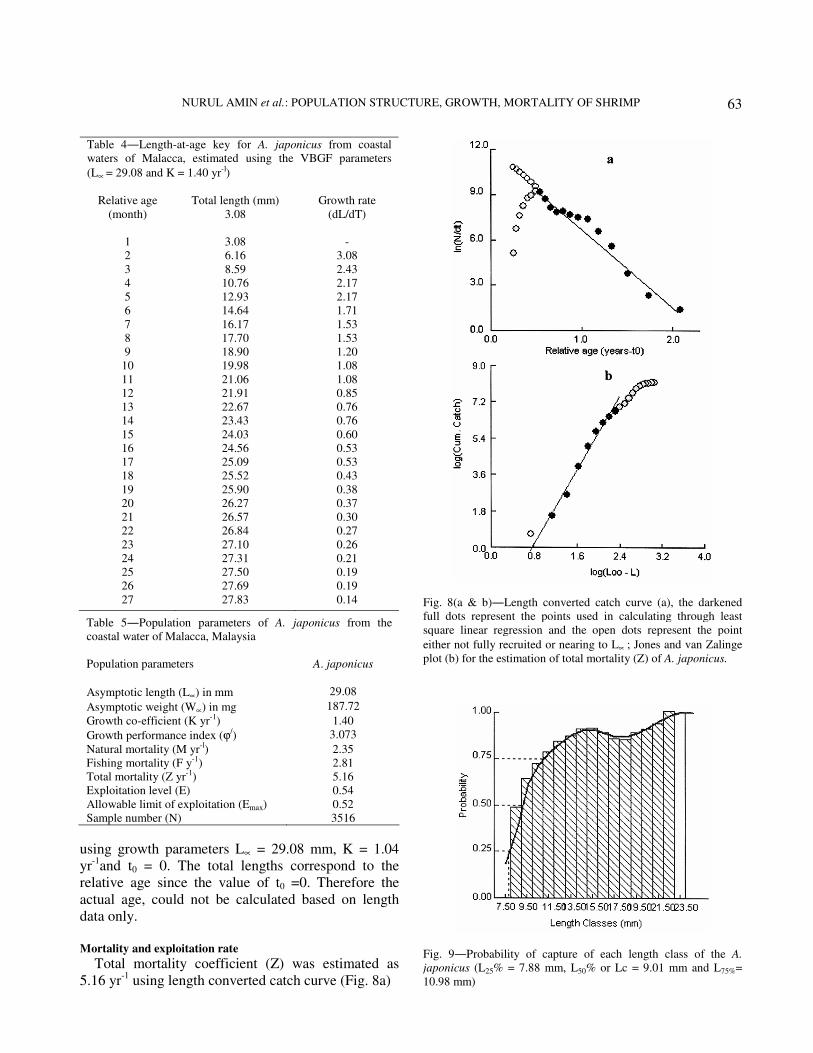
Mortality and exploitation rate
Total mortality coefficient (Z) was estimated as
5.16 yr-1
using length converted catch curve (Fig. 8a)
Fig. 8(a & b)―Length converted catch curve (a), the darkened
full dots represent the points used in calculating through least
square linear regression and the open dots represent the point
either not fully recruited or nearing to L∝ ; Jones and van Zalinge
plot (b) for the estimation of total mortality (Z) of A. japonicus.
Fig. 9―Probability of capture of each length class of the A.
japonicus (L25% = 7.88 mm, L50% or Lc = 9.01 mm and L75%=
10.98 mm)
INDIAN J. MAR. SCI., VOL. 38, NO. 1, MARCH 2009
64
while the Jones and van Zalinge method (Fig. 8b)
gave a value of Z = 4.99 yr-1
. Natural mortality (M)
was estimated at 2.35 yr-1
. Based on Z from length
converted catch curve, fishing mortality (F) was
found to be 2.81 yr-1
(Table 5). From these figures, an
exploitation rate (E) of 0.54 was obtained for the A.
japonicus fishery in the coastal waters of Malacca,
Peninsular Malaysia which seemed to be above the
optimum level of exploitation (E = 0.50).
Length at first capture
The length at first capture (the length at which 50%
of the shrimp becomes vulnerable to the gear) was
calculated as a component of the length converted
catch curve analysis (Fig. 9). The value obtained was
L50% = 9.01 mm from the analysis of probability of
capture. The length at which 75% of the shrimps are
retained in the gear was estimated as L75% =
10.98 mm.
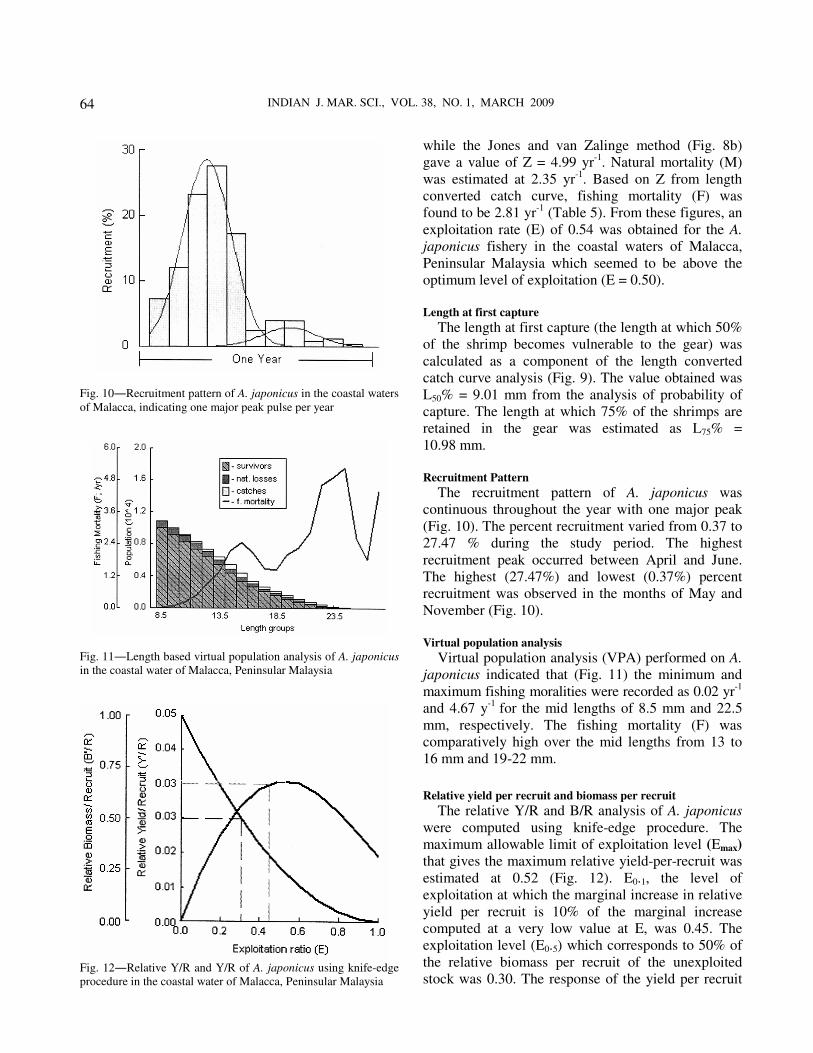
Recruitment Pattern
The recruitment pattern of A. japonicus was
continuous throughout the year with one major peak
(Fig. 10). The percent recruitment varied from 0.37 to
27.47 % during the study period. The highest
recruitment peak occurred between April and June.
The highest (27.47%) and lowest (0.37%) percent
recruitment was observed in the months of May and
November (Fig. 10).
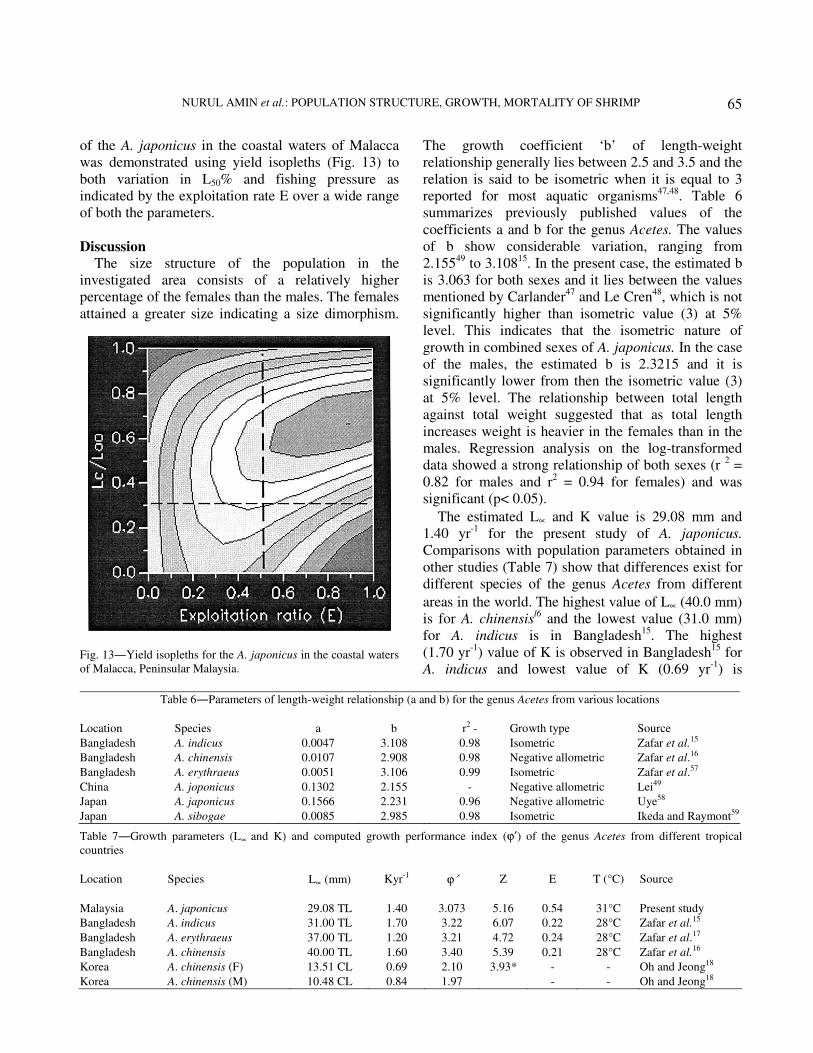
Virtual population analysis
Virtual population analysis (VPA) performed on A.
japonicus indicated that (Fig. 11) the minimum and
maximum fishing moralities were recorded as 0.02 yr-1
and 4.67 y-1
for the mid lengths of 8.5 mm and 22.5
mm, respectively. The fishing mortality (F) was
comparatively high over the mid lengths from 13 to
16 mm and 19-22 mm.
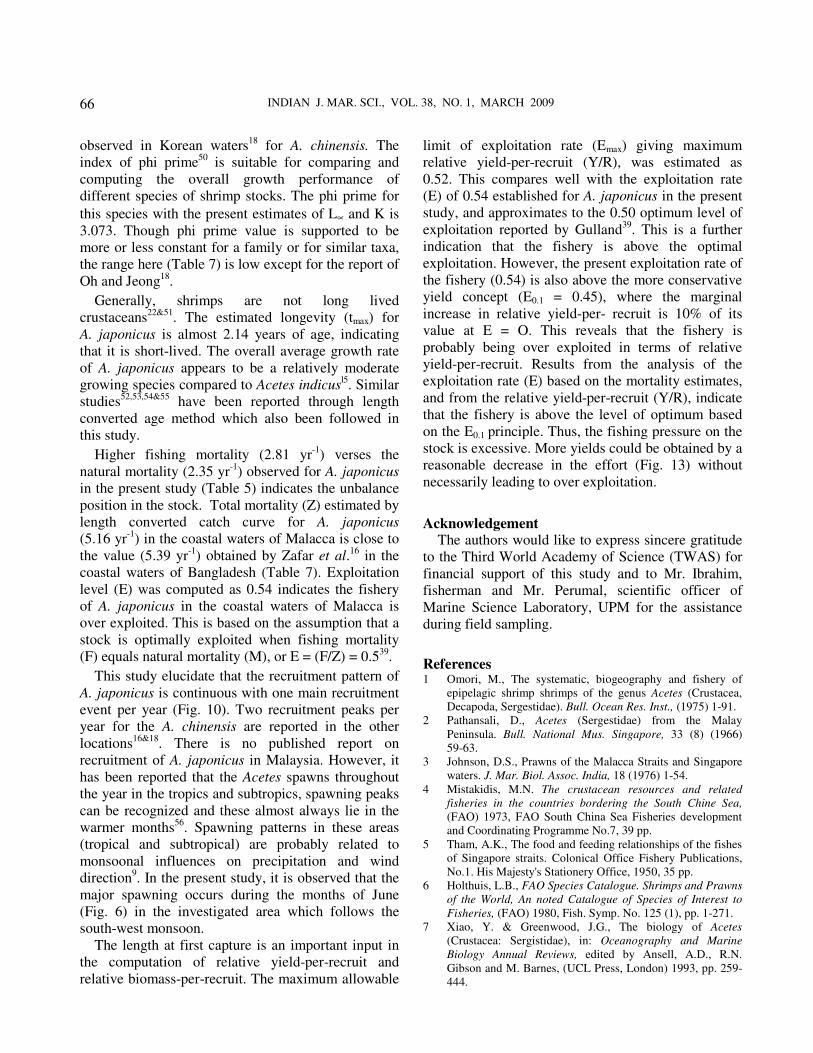
Relative yield per recruit and biomass per recruit
The relative Y/R and B/R analysis of A. japonicus
were computed using knife-edge procedure. The
maximum allowable limit of exploitation level (Emax)
that gives the maximum relative yield-per-recruit was
estimated at 0.52 (Fig. 12). E0.1, the level of
exploitation at which the marginal increase in relative
yield per recruit is 10% of the marginal increase
computed at a very low value at E, was 0.45. The
exploitation level (E0.5) which corresponds to 50% of
the relative biomass per recruit of the unexploited
stock was 0.30. The response of the yield per recruit
Fig. 10―Recruitment pattern of A. japonicus in the coastal waters
of Malacca, indicating one major peak pulse per year
Fig. 11―Length based virtual population analysis of A. japonicus
in the coastal water of Malacca, Peninsular Malaysia
Fig. 12―Relative Y/R and Y/R of A. japonicus using knife-edge
procedure in the coastal water of Malacca, Peninsular Malaysia
NURUL AMIN et al.: POPULATION STRUCTURE, GROWTH, MORTALITY OF SHRIMP
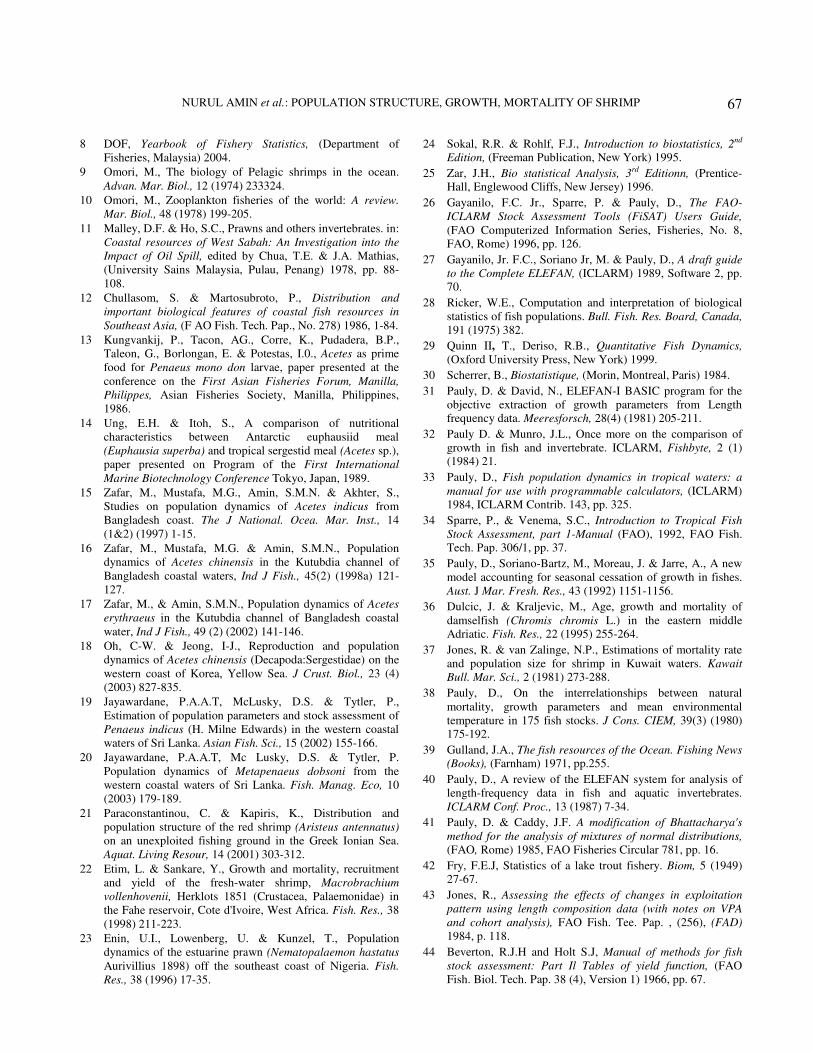
65
of the A. japonicus in the coastal waters of Malacca
was demonstrated using yield isopleths (Fig. 13) to
both variation in L50% and fishing pressure as
indicated by the exploitation rate E over a wide range
of both the parameters.
Discussion
The size structure of the population in the
investigated area consists of a relatively higher
percentage of the females than the males. The females
attained a greater size indicating a size dimorphism.
The growth coefficient ‘b’ of length-weight
relationship generally lies between 2.5 and 3.5 and the
relation is said to be isometric when it is equal to 3
reported for most aquatic organisms47,48
. Table 6
summarizes previously published values of the
coefficients a and b for the genus Acetes. The values
of b show considerable variation, ranging from
2.15549
to 3.10815
. In the present case, the estimated b
is 3.063 for both sexes and it lies between the values
mentioned by Carlander47
and Le Cren48
, which is not
significantly higher than isometric value (3) at 5%
level. This indicates that the isometric nature of
growth in combined sexes of A. japonicus. In the case
of the males, the estimated b is 2.3215 and it is
significantly lower from then the isometric value (3)
at 5% level. The relationship between total length
against total weight suggested that as total length
increases weight is heavier in the females than in the
males. Regression analysis on the log-transformed
data showed a strong relationship of both sexes (r 2 =
0.82 for males and r2 = 0.94 for females) and was
significant (p< 0.05).
The estimated L∝ and K value is 29.08 mm and
1.40 yr-1
for the present study of A. japonicus.
Comparisons with population parameters obtained in
other studies (Table 7) show that differences exist for
different species of the genus Acetes from different
areas in the world. The highest value of L∝ (40.0 mm)
is for A. chinensisl6 and the lowest value (31.0 mm)
for A. indicus is in Bangladesh15
. The highest
(1.70 yr-1
) value of K is observed in Bangladesh15
for
A. indicus and lowest value of K (0.69 yr-1
) is
Table 6―Parameters of length-weight relationship (a and b) for the genus Acetes from various locations
Location Species a b r2 - Growth type Source
Bangladesh A. indicus 0.0047 3.108 0.98 Isometric Zafar et al.15
Bangladesh A. chinensis 0.0107 2.908 0.98 Negative allometric Zafar et al.16
Bangladesh A. erythraeus 0.0051 3.106 0.99 Isometric Zafar et al.57
China A. joponicus 0.1302 2.155 - Negative allometric Lei49
Japan A. japonicus 0.1566 2.231 0.96 Negative allometric Uye58
Japan A. sibogae 0.0085 2.985 0.98 Isometric Ikeda and Raymont59
Table 7―Growth parameters (L∝ and K) and computed growth performance index (ϕ′) of the genus Acetes from different tropical
countries
Location Species L∝ (mm) Kyr-1 ϕ′ Z E T (°C) Source
Malaysia A. japonicus 29.08 TL 1.40 3.073 5.16 0.54 31°C Present study
Bangladesh A. indicus 31.00 TL 1.70 3.22 6.07 0.22 28°C Zafar et al.15
Bangladesh A. erythraeus 37.00 TL 1.20 3.21 4.72 0.24 28°C Zafar et al.17
Bangladesh A. chinensis 40.00 TL 1.60 3.40 5.39 0.21 28°C Zafar et al.16
Korea A. chinensis (F) 13.51 CL 0.69 2.10 3.93* - - Oh and Jeong18
Korea A. chinensis (M) 10.48 CL 0.84 1.97 - - Oh and Jeong18
Fig. 13―Yield isopleths for the A. japonicus in the coastal waters
of Malacca, Peninsular Malaysia.
INDIAN J. MAR. SCI., VOL. 38, NO. 1, MARCH 2009
66
observed in Korean waters18
for A. chinensis. The
index of phi prime50
is suitable for comparing and
computing the overall growth performance of
different species of shrimp stocks. The phi prime for
this species with the present estimates of L∝ and K is
3.073. Though phi prime value is supported to be
more or less constant for a family or for similar taxa,
the range here (Table 7) is low except for the report of
Oh and Jeong18
.
Generally, shrimps are not long lived
crustaceans22&51
. The estimated longevity (tmax) for
A. japonicus is almost 2.14 years of age, indicating
that it is short-lived. The overall average growth rate
of A. japonicus appears to be a relatively moderate
growing species compared to Acetes indicusl5. Similar
studies52,53,54&55
have been reported through length
converted age method which also been followed in
this study.
Higher fishing mortality (2.81 yr-1
) verses the
natural mortality (2.35 yr-1
) observed for A. japonicus
in the present study (Table 5) indicates the unbalance
position in the stock. Total mortality (Z) estimated by
length converted catch curve for A. japonicus
(5.16 yr-1
) in the coastal waters of Malacca is close to
the value (5.39 yr-1
) obtained by Zafar et al.16
in the
coastal waters of Bangladesh (Table 7). Exploitation
level (E) was computed as 0.54 indicates the fishery
of A. japonicus in the coastal waters of Malacca is
over exploited. This is based on the assumption that a
stock is optimally exploited when fishing mortality
(F) equals natural mortality (M), or E = (F/Z) = 0.539
.
This study elucidate that the recruitment pattern of
A. japonicus is continuous with one main recruitment
event per year (Fig. 10). Two recruitment peaks per
year for the A. chinensis are reported in the other
locations16&18
. There is no published report on
recruitment of A. japonicus in Malaysia. However, it
has been reported that the Acetes spawns throughout
the year in the tropics and subtropics, spawning peaks
can be recognized and these almost always lie in the
warmer months56
. Spawning patterns in these areas
(tropical and subtropical) are probably related to
monsoonal influences on precipitation and wind
direction9. In the present study, it is observed that the
major spawning occurs during the months of June
(Fig. 6) in the investigated area which follows the
south-west monsoon.
The length at first capture is an important input in
the computation of relative yield-per-recruit and
relative biomass-per-recruit. The maximum allowable
limit of exploitation rate (Emax) giving maximum
relative yield-per-recruit (Y/R), was estimated as
0.52. This compares well with the exploitation rate
(E) of 0.54 established for A. japonicus in the present
study, and approximates to the 0.50 optimum level of
exploitation reported by Gulland39
. This is a further
indication that the fishery is above the optimal
exploitation. However, the present exploitation rate of
the fishery (0.54) is also above the more conservative
yield concept (E0.1 = 0.45), where the marginal
increase in relative yield-per- recruit is 10% of its
value at E = O. This reveals that the fishery is
probably being over exploited in terms of relative
yield-per-recruit. Results from the analysis of the
exploitation rate (E) based on the mortality estimates,
and from the relative yield-per-recruit (Y/R), indicate
that the fishery is above the level of optimum based
on the E0.1 principle. Thus, the fishing pressure on the
stock is excessive. More yields could be obtained by a
reasonable decrease in the effort (Fig. 13) without
necessarily leading to over exploitation.
Acknowledgement The authors would like to express sincere gratitude
to the Third World Academy of Science (TWAS) for
financial support of this study and to Mr. Ibrahim,
fisherman and Mr. Perumal, scientific officer of
Marine Science Laboratory, UPM for the assistance
during field sampling.
References 1 Omori, M., The systematic, biogeography and fishery of
epipelagic shrimp shrimps of the genus Acetes (Crustacea,
Decapoda, Sergestidae). Bull. Ocean Res. Inst., (1975) 1-91.
2 Pathansali, D., Acetes (Sergestidae) from the Malay
Peninsula. Bull. National Mus. Singapore, 33 (8) (1966)
59-63.
3 Johnson, D.S., Prawns of the Malacca Straits and Singapore
waters. J. Mar. Biol. Assoc. India, 18 (1976) 1-54.
4 Mistakidis, M.N. The crustacean resources and related
fisheries in the countries bordering the South Chine Sea,
(FAO) 1973, FAO South China Sea Fisheries development
and Coordinating Programme No.7, 39 pp.
5 Tham, A.K., The food and feeding relationships of the fishes
of Singapore straits. Colonical Office Fishery Publications,
No.1. His Majesty's Stationery Office, 1950, 35 pp.
6 Holthuis, L.B., FAO Species Catalogue. Shrimps and Prawns
of the World, An noted Catalogue of Species of Interest to
Fisheries, (FAO) 1980, Fish. Symp. No. 125 (1), pp. 1-271.
7 Xiao, Y. & Greenwood, J.G., The biology of Acetes
(Crustacea: Sergistidae), in: Oceanography and Marine
Biology Annual Reviews, edited by Ansell, A.D., R.N.
Gibson and M. Barnes, (UCL Press, London) 1993, pp. 259-
444.
NURUL AMIN et al.: POPULATION STRUCTURE, GROWTH, MORTALITY OF SHRIMP
67
8 DOF, Yearbook of Fishery Statistics, (Department of
Fisheries, Malaysia) 2004.
9 Omori, M., The biology of Pelagic shrimps in the ocean.
Advan. Mar. Biol., 12 (1974) 233324.
10 Omori, M., Zooplankton fisheries of the world: A review.
Mar. Biol., 48 (1978) 199-205.
11 Malley, D.F. & Ho, S.C., Prawns and others invertebrates. in:
Coastal resources of West Sabah: An Investigation into the
Impact of Oil Spill, edited by Chua, T.E. & J.A. Mathias,
(University Sains Malaysia, Pulau, Penang) 1978, pp. 88-
108.
12 Chullasom, S. & Martosubroto, P., Distribution and
important biological features of coastal fish resources in
Southeast Asia, (F AO Fish. Tech. Pap., No. 278) 1986, 1-84.
13 Kungvankij, P., Tacon, AG., Corre, K., Pudadera, B.P.,
Taleon, G., Borlongan, E. & Potestas, I.0., Acetes as prime
food for Penaeus mono don larvae, paper presented at the
conference on the First Asian Fisheries Forum, Manilla,
Philippes, Asian Fisheries Society, Manilla, Philippines,
1986.
14 Ung, E.H. & Itoh, S., A comparison of nutritional
characteristics between Antarctic euphausiid meal
(Euphausia superba) and tropical sergestid meal (Acetes sp.),
paper presented on Program of the First International
Marine Biotechnology Conference Tokyo, Japan, 1989.
15 Zafar, M., Mustafa, M.G., Amin, S.M.N. & Akhter, S.,
Studies on population dynamics of Acetes indicus from
Bangladesh coast. The J National. Ocea. Mar. Inst., 14
(1&2) (1997) 1-15.
16 Zafar, M., Mustafa, M.G. & Amin, S.M.N., Population
dynamics of Acetes chinensis in the Kutubdia channel of
Bangladesh coastal waters, Ind J Fish., 45(2) (1998a) 121-
127.
17 Zafar, M., & Amin, S.M.N., Population dynamics of Acetes
erythraeus in the Kutubdia channel of Bangladesh coastal
water, Ind J Fish., 49 (2) (2002) 141-146.
18 Oh, C-W. & Jeong, I-J., Reproduction and population
dynamics of Acetes chinensis (Decapoda:Sergestidae) on the
western coast of Korea, Yellow Sea. J Crust. Biol., 23 (4)
(2003) 827-835.
19 Jayawardane, P.A.A.T, McLusky, D.S. & Tytler, P.,
Estimation of population parameters and stock assessment of
Penaeus indicus (H. Milne Edwards) in the western coastal
waters of Sri Lanka. Asian Fish. Sci., 15 (2002) 155-166.
20 Jayawardane, P.A.A.T, Mc Lusky, D.S. & Tytler, P.
Population dynamics of Metapenaeus dobsoni from the
western coastal waters of Sri Lanka. Fish. Manag. Eco, 10
(2003) 179-189.
21 Paraconstantinou, C. & Kapiris, K., Distribution and
population structure of the red shrimp (Aristeus antennatus)
on an unexploited fishing ground in the Greek Ionian Sea.
Aquat. Living Resour, 14 (2001) 303-312.
22 Etim, L. & Sankare, Y., Growth and mortality, recruitment
and yield of the fresh-water shrimp, Macrobrachium
vollenhovenii, Herklots 1851 (Crustacea, Palaemonidae) in
the Fahe reservoir, Cote d'Ivoire, West Africa. Fish. Res., 38
(1998) 211-223.
23 Enin, U.I., Lowenberg, U. & Kunzel, T., Population
dynamics of the estuarine prawn (Nematopalaemon hastatus
Aurivillius 1898) off the southeast coast of Nigeria. Fish.
Res., 38 (1996) 17-35.
24 Sokal, R.R. & Rohlf, F.J., Introduction to biostatistics, 2nd
Edition, (Freeman Publication, New York) 1995.
25 Zar, J.H., Bio statistical Analysis, 3rd Editionn, (Prentice-
Hall, Englewood Cliffs, New Jersey) 1996.
26 Gayanilo, F.C. Jr., Sparre, P. & Pauly, D., The FAO-
ICLARM Stock Assessment Tools (FiSAT) Users Guide,
(FAO Computerized Information Series, Fisheries, No. 8,
FAO, Rome) 1996, pp. 126.
27 Gayanilo, Jr. F.C., Soriano Jr, M. & Pauly, D., A draft guide
to the Complete ELEFAN, (ICLARM) 1989, Software 2, pp.
70.
28 Ricker, W.E., Computation and interpretation of biological
statistics of fish populations. Bull. Fish. Res. Board, Canada,
191 (1975) 382.
29 Quinn II, T., Deriso, R.B., Quantitative Fish Dynamics,
(Oxford University Press, New York) 1999.
30 Scherrer, B., Biostatistique, (Morin, Montreal, Paris) 1984.
31 Pauly, D. & David, N., ELEFAN-I BASIC program for the
objective extraction of growth parameters from Length
frequency data. Meeresforsch, 28(4) (1981) 205-211.
32 Pauly D. & Munro, J.L., Once more on the comparison of
growth in fish and invertebrate. ICLARM, Fishbyte, 2 (1)
(1984) 21.
33 Pauly, D., Fish population dynamics in tropical waters: a
manual for use with programmable calculators, (ICLARM)
1984, ICLARM Contrib. 143, pp. 325.
34 Sparre, P., & Venema, S.C., Introduction to Tropical Fish
Stock Assessment, part 1-Manual (FAO), 1992, FAO Fish.
Tech. Pap. 306/1, pp. 37.
35 Pauly, D., Soriano-Bartz, M., Moreau, J. & Jarre, A., A new
model accounting for seasonal cessation of growth in fishes.
Aust. J Mar. Fresh. Res., 43 (1992) 1151-1156.
36 Dulcic, J. & Kraljevic, M., Age, growth and mortality of
damselfish (Chromis chromis L.) in the eastern middle
Adriatic. Fish. Res., 22 (1995) 255-264.
37 Jones, R. & van Zalinge, N.P., Estimations of mortality rate
and population size for shrimp in Kuwait waters. Kawait
Bull. Mar. Sci., 2 (1981) 273-288.
38 Pauly, D., On the interrelationships between natural
mortality, growth parameters and mean environmental
temperature in 175 fish stocks. J Cons. CIEM, 39(3) (1980)
175-192.
39 Gulland, J.A., The fish resources of the Ocean. Fishing News
(Books), (Farnham) 1971, pp.255.
40 Pauly, D., A review of the ELEFAN system for analysis of
length-frequency data in fish and aquatic invertebrates.
ICLARM Conf. Proc., 13 (1987) 7-34.
41 Pauly, D. & Caddy, J.F. A modification of Bhattacharya's
method for the analysis of mixtures of normal distributions,
(FAO, Rome) 1985, FAO Fisheries Circular 781, pp. 16.
42 Fry, F.E.J, Statistics of a lake trout fishery. Biom, 5 (1949)
27-67.
43 Jones, R., Assessing the effects of changes in exploitation
pattern using length composition data (with notes on VPA
and cohort analysis), FAO Fish. Tee. Pap. , (256), (FAD)
1984, p. 118.
44 Beverton, R.J.H and Holt S.J, Manual of methods for fish
stock assessment: Part Il Tables of yield function, (FAO
Fish. Biol. Tech. Pap. 38 (4), Version 1) 1966, pp. 67.
INDIAN J. MAR. SCI., VOL. 38, NO. 1, MARCH 2009
68
45 Pauly, D. & Soriano, M.L., Some practical extensions to
Beverton and Holt's relative yield-per-recruit model,
presented on The First Asian Fisheries Forum, Asian
Fisheries Society, Manila, Philippines, 1986.
46 Formacion, S.P., Rongo, J.M. & Sambilay, V.C., Extreme
value theory applied to the statistical distribution of the
largest lengths offish. Asian Fish. Sci., 4 (1991) 123-135.
47 Carlander K., Handbook of Freshwater Fishery Biology,
Vol.1, (Iowa State University Press, Ames, IA) 1977.
48 Le Cren, E.D., The length-weight relationship and seasonal
cycle in gonadal weight and condition in the perch (Perca
fluviatilis). J Ani. Eco., 20 (1951) 271-279.
49 Lei, M, Studies in the biology of Acetes japonicus
Kishinouye in the eastern coastal waters of Guangdong
Province, China, in: Selected Oceanic Works in. China,
(Ocean Press, Bejing) 1988, pp. 234-243.
50 Munro, J.L. & Pauly, D.A, simple method for comparing the
growth of fishes and invertebrates. ICLARM Fishbyte, 1 (1)
(1983) 5-6.
51 Dineshbabu, A.P., Manissery, J.K., Morphometric
relationships and growth of the 'ridge back shrimp
'Solenocera choprai (Decapoda/Crustacea) from Mangalore
(southwest coast of India). Indian J Mar. Sci., 36 (2007) 65-
70.
52 Al-Barwani, S.M., Arshad, A., Amin, S.M.N., Japar, S.B.,
Siraj. S.S. & Yap, C.K., Population dynamics of the green
mussel Perna viridis from the high spat-fall coastal water of
Malacca, Peninsular Malaysia, Fish. Res., 84 (2007) 147-
152.
53 Amin, S.M.N., Rahman, M.A, Haldar, G.C. & Mazid, M.A.,
Studies on age and growth and exploitation level of
Tenualosa ilisha in the coastal region of Chittagong,
Bangladesh. J Inland Fish. Soc. India, 33 (2001) 1-5.
54 Amin, S.M.N. & Zafar, M., Studies on age, growth and
virtual population analysis of Coilia dussumieri from the
neritic water of Bangladesh. J Biol. Sci., 4 (2004) 342-344.
55 Blaber, S.J.M., Staunton-Smith, J., Milton, D.A., Fry, G.,
Velde, T.V., Pang, J., Wong, P., & Boon-Teck, O., The
Biology and Life-history Strategies of Ilisha (Teleostei:
Pristigasteridae) in the Coastal Waters and Estuaries of
Sarawak. Estuar. Coast. Shelf Sci., 47 (1998) 499-511.
56 Nataraj, S., On some species of Acetes (Crustacea,
Sergistidae) from Travancore. Records of the Indian
Museum, 45 (1947) 139-147.