Embed Size (px)
Citation preview
Forschungsinstitut zur Zukunft der ArbeitInstitute for the Study of Labor
DI
SC
US
SI
ON
P
AP
ER
S
ER
IE
S
Population Policy:Abortion and Modern Contraception Are Substitutes
IZA DP No. 9809
March 2016
Grant MillerChristine Valente
Population Policy: Abortion and
Modern Contraception Are Substitutes
Grant Miller Stanford University
and NBER
Christine Valente
University of Bristol and IZA
Discussion Paper No. 9809 March 2016
IZA
P.O. Box 7240 53072 Bonn
Germany
Phone: +49-228-3894-0 Fax: +49-228-3894-180
E-mail: [email protected]
Any opinions expressed here are those of the author(s) and not those of IZA. Research published in this series may include views on policy, but the institute itself takes no institutional policy positions. The IZA research network is committed to the IZA Guiding Principles of Research Integrity. The Institute for the Study of Labor (IZA) in Bonn is a local and virtual international research center and a place of communication between science, politics and business. IZA is an independent nonprofit organization supported by Deutsche Post Foundation. The center is associated with the University of Bonn and offers a stimulating research environment through its international network, workshops and conferences, data service, project support, research visits and doctoral program. IZA engages in (i) original and internationally competitive research in all fields of labor economics, (ii) development of policy concepts, and (iii) dissemination of research results and concepts to the interested public. IZA Discussion Papers often represent preliminary work and are circulated to encourage discussion. Citation of such a paper should account for its provisional character. A revised version may be available directly from the author.
IZA Discussion Paper No. 9809 March 2016
ABSTRACT
Population Policy: Abortion and Modern Contraception Are Substitutes*
There is longstanding debate in population policy about the relationship between modern contraception and abortion. Although theory predicts that they should be substitutes, the existing body of empirical evidence is difficult to interpret. What is required is a large‐scale intervention that alters the supply (or full price) of one or the other – and importantly, does so in isolation (reproductive health programs often bundle primary health care and family planning – and in some instances, abortion services). In this paper, we study Nepal’s 2004 legalization of abortion provision and subsequent expansion of abortion services, an unusual and rapidly‐implemented policy meeting these requirements. Using four waves of rich individual‐level data representative of fertile‐age Nepalese women, we find robust evidence of substitution between modern contraception and abortion. This finding has important implications for public policy and foreign aid, suggesting that an effective strategy for reducing expensive and potentially unsafe abortions may be to expand the supply of modern contraceptives. JEL Classification: J13, N35 Keywords: abortion, contraception, Nepal Corresponding author: Christine Valente Department of Economics University of Bristol 8 Woodland Road BS8 1TN, Bristol United Kingdom E-mail: [email protected]
* The authors thank the Center for Research on Environmental Health and Population Activities for their assistance in collecting Comprehensive Abortion Care Center Data and to the Family Health Division of the Ministry of Health and Population of Nepal for granting access to Technical Committee for Implementation of Comprehensive Abortion Care records. We also thank five anonymous referees for their useful suggestions. Christine Valente gratefully acknowledges funding from ESRC grant No. RES‐000‐22‐3740.
2
1. Introduction
There is longstandingdebate in reproductivehealth circles about the relationship
betweenmoderncontraceptionandabortionuse.Overseveraldecades,populationscholars
have documented concomitant increases in both contraceptive prevalence and abortion
ratesaroundtheworldinsettingsasdiverseasCuba,SouthKorea,Bangladesh,Singapore,
Netherlands,Denmark,andtheUnitedStates(NobleandPotts1996;Rahmanetal.2001;
MarstonandCleland2003).Thisphenomenoniscommonlyattributedtorapidreductions
indesiredfertility,whichinturnincreasedemandforallmethodsofbirthcontrol(Marston
andCleland2003).
However,theorypredictsthatholdingdemandforbirthcontrolconstant(andabsent
absolute moral or religious constraints), women (couples) 1 should use modern
contraceptivesandabortion interchangeably– that is, theyaresubstitutes(Westoffetal.
1981;KaneandStaiger1996;BongaartsandWestoff2000;Westoff2000;Rahmanet al.
2001;MarstonandCleland2003).2Arelativeincreaseintheaffordability,availability,or
acceptabilityofoneshouldleadwomenwishingtoregulatetheirfertilitytosubstituteaway
1Becausewestudymarriedwomeninapatriarchalsociety,thechoiceofcontraceptionislikelytobetheresultofintra‐householdbargaining.Wedonottheoreticallyorempiricallydistinguishindividualpreferencesfromthechoicesthatresultfromthisbargainingprocess.However,ourreduced‐formestimatesisolateimportant–andpolicyrelevant–parametersofinterest.Recognizingthispoint,werefertocontraceptivedecisionsaswomen’sdecisionsforsimplicitythroughoutthepaper.2 A separate strand of economic theory, which studies the response of risk‐taking behavior to perceivedchangesintheconsequencesofabadoutcome(e.g.,increasedautomobilesafety,availabilityoftreatmentforamedicalcondition),suggestsanadditionalmechanismthroughwhichwomenwhodonotwanttobecomepregnantmay reduce contraceptive usewhen access to abortion improves. There is indeed evidence thatreducing thecostofabadoutcomemay increase risk‐taking inotherhealthareas.ExamplesarePeltzman(1975)ontheeffectofautomobilesafetyondangerousdriving,Dilleyetal.(1997)onHIVtreatmentandrisk‐takingamongmenwhohavesexwithmen,andPeltzman(2011)ontheeffectofmedicalbreakthroughs(e.g.,newtreatmentsforheartdisease)onoffsettingbehavior(e.g.,obesity).
3
from the other.3Since themid‐1990s (as declining fertility rates have plateaued), global
contraceptive prevalence has continued to rise, while abortion rates have declined – a
relationshipconsistentwithsubstitution.
Debateabouttherelationshipbetweencontraceptionandabortionhasfundamental
implications forpublicpolicyandforeignaid. Importantly, ifmoderncontraceptivesand
abortionsaresubstitutes,thenaneffectivestrategyforreducingexpensiveandpotentially
life‐threatening abortions may be to boost the supply4of modern contraceptives. Two
recentanalysesoftheUnitedStates’“MexicoCityPolicy”(MCP)suggestthatbyreducing
fundingforfamilyplanningprograms,theMCPmayhaveactuallyreducedtheavailabilityof
moderncontraceptivesrelativetoabortionandthusincreasedabortionrates(Bendavidet
al.2011,Jones2011).5
Understanding the trade‐off between contraception andabortionwould also shed
light on ways to prevent maternal deaths. Research on the determinants of maternal
mortalityworldwidesuggeststhatunsafeabortionplaysaquantitativelyimportantrole.In
LatinAmericanandCaribbeancountries, a systematic review found thatunsafeabortion
accounts for roughly 50% more maternal deaths than better‐known complications like
sepsis(Khanetal.2006).TheWorldHealthOrganizationestimatesthat13%ofmaternal
3The theoretical discussionof the tradeoff between contraception and abortion among demographers hastendedtofocusontheeffectofchangingcontraceptiveprevalenceontheabortionrate(e.g.,BongaartsandWestoff2000).Intheeconomicsliterature,thetradeoffisunderstoodasgoingbothways(seeKaneandStaiger1996foradiscussionoftheeffectofachangeinthecostofabortiononcontraceptiveuse).Thedifferencestemsfromtheeconomicmodelingofcontraceptivechoicesasdependingonthecostofcontraceptionrelativetothecostofnotusingcontraception,whichinturndependsonthecostofabortion(seeSection4).4Changesinsupplyincludebothchangesinavailabilityandchangesinthefullpriceofcontraception(monetary,social,andemotionalprice).Forbrevity,werefertothesechangescollectivelyas‘supply’changesthroughout.5FirstannouncedinMexicoCityin1984byPresidentReagan’sadministration,the‘MexicoCityPolicy’requiresallnon‐governmentalorganizationsoperatingabroadtorefrainfromperformingorcounselingwomenaboutabortionasameansoffertilitycontrolasaconditionforreceivingU.S.federalfunding.
4
deathsworldwidearelinkedtounsafeabortion(WHO2010).Givenconcernsaboutunder‐
reporting, existing evidence is also suspected to underestimate mortality from unsafe
abortion(Gerdtsetal.2013).
What isneededtoestablishwhetherornot theuseofmoderncontraceptivesand
abortionsarecomplementsorsubstitutesisalarge‐scaleinterventionthataltersthesupply
ofeitheroneortheother–andimportantly,doessoinisolation.Todate,findingsuchcases
hasbeenchallengingbecausereal‐worldreproductivehealthprogramsgenerallydelivera
bundleofservicestogether,makingitdifficulttodisentangletheeffectofsupplyofmodern
contraceptivesorabortionfromotherprogramcomponents. Asacaseinpoint,thewell‐
knownMatlabFamilyPlanningExperimentbundledtheprovisionofmoderncontraceptives
withtheprovisionofbothabortionservices(menstrualregulation)andchildhealthservices,
makingitdifficulttoisolatetheeffectofcontraceptivesupply(Rahmanetal.2001;Miller
andSingerBabiarz2013).
Thispaperstudiesanunusualpolicychangewell‐suitedtoassessingtherelationship
between theuseofmodern contraceptives and abortion. Starting inMarch2004,Nepal
legalizedtheprovisionofabortionbyselectedexistinghealthserviceproviders.Inaddition
toitsscale,whatdistinguishesthispolicyisthatindoingso,Nepaldidnotexpandthesupply
ofmoderncontraceptives,bundlethelegalizationofabortionwithchangesintheprovision
ofanyothertypeofservice,orexpandthehealthcareworkforce.Weutilizeunusuallyrich
individual‐leveldatarepresentativeoffertileageNepalesewomencollectedinfourwaves
both before and after the legalization of abortion to estimate how the use of modern
contraceptives(andotherreproductivebehaviors)respondedtothispolicy.
5
Wefindthattheadditionofalegalabortioncenterinone’sdistrictisassociatedwith
a2.6%decreaseintheoddsofusinganycontraceptive[OR:0.974,95%CI:(0.961;0.987)],
implying that a move from zero to the mean number of centers post‐legalization was
associatedwithareductionincontraceptiveprevalenceof2percentagepoints‐6%ofthe
pre‐legalizationprevalencerate.Decomposing thiseffectamongtraditionalcontraceptive
methods(suchaswithdrawalandtherhythmmethod),femalesterilization,andreversible
modernmethods,we find that thedecreaseoccursprincipally among reversiblemodern
methods.
2. Background
2.1. GlobalandRegionalTrends
Globally,contraceptiveuseandabortionrateshavebeeninverselyrelatedoverthe
pastseveraldecades.Contraceptiveprevalencehasincreasedsteadilyoverthepasttwenty
years, rising from 54.8% to 63.3% between 1990 and 2010 (Alkema et al. 2013).
Simultaneously, there has been a steady decline in abortion rates, falling from 35 to 28
abortionsper1,000womenonaverageworldwidebetween1995and2008(Sedghetal.
2012). These global trends are of course consistent with substitution of modern
contraceptionforabortion,butanumberofpotentiallyimportantconfoundingfactorshave
alsobeenatworkovertime(changesindesiredfertility,forexample).
Theinverserelationshipbetweenabortionandcontraceptionisparticularlyevident
informerlysocialistEasternEuropeancountries.Undercommunism,abortionwasamajor
(ifnottheprincipal)methodofbirthcontrolacrossmuchofEasternEuropeandCentralAsia
6
(Frejka1983).6Afterthecollapseofcommunism,abortionratesdeclinedsteeplywiththe
diffusionofmoderncontraceptivesduring the1990s (Westoff etal.1998;Westoff2000;
Pop‐Eleches2010)againsuggestingthatcontraceptionandabortionmayhavebeenused
interchangeably.
On the other hand, concomitant increases in both contraceptive prevalence and
abortionrateshavebeenobservedinavarietyofcountriesfurtherbackintime,including
Cuba,SouthKorea,Bangladesh,Singapore,theNetherlands,Denmark,andtheUnitedStates
(Noble andPotts1996;Rahmanet al. 2001;Marston andCleland2003). Bongaarts and
Westoff(2000)andMarstonandCleland(2003)suggestthatthesesimultaneousincreases
mayoccurduringtransitionstolowerfertilityifthesupplyofmoderncontraceptivesfailsto
keep pace with the reduction in desired fertility. Then, as desired fertility plateaus,
substitution betweenmodern contraceptives and abortion should becomemore evident
(MarstonandCleland2003).Thisisconsistentwithglobaltrendssincethemid‐1990s,as
theworldwidedeclineinfertilitydecelerated(WorldDevelopmentIndicators2014).
2.2. PreviousEstimatesofSubstitutionbetweenAbortionandContraception
Manystudiesoftherelationshipbetweencontraceptionandabortionindeveloping
countriesarelimitedtoinformalanalysesoftheirco‐movement.Onlyahandfulofstudies
haveattempted to estimate the causal relationshipbetween the two.Two recent studies
investigate changes in abortion and contraceptiveuse inducedby theMexicoCity Policy
(MCP).Bendavidetal.(2011)comparechangesinabortionandcontraceptiveuseovertime
in countries highly exposed to the Mexico City Policy (MCP) relative to less exposed
6TheSovietUnionwasthefirstcountrytolegalizeabortionin1920.
7
countries.Theauthors findthatmoreexposedcountriesexperiencedslower increases in
contraceptiveprevalenceandhigherincreasesinabortionafterthere‐enactmentoftheMCP,
suggestingthatreducedcontraceptivesupplymayhaveincreasedtheincidenceofabortion.
Jones(2011)comparesabortionratesamongwomeninGhanaduringperiodsinwhichthe
MCPisbothenforcedandnotenforced.Shefindsthatruralwomenaremorelikelytohave
an abortion during periods of enforcement,which she links to the increased number of
unwantedpregnanciesfollowingthereductionincontraceptivesupplyunderthepolicy.
Rahman et al. (2001) analyzes changes in abortion linked to the Matlab Family
PlanningExperimentintervention.Theauthorsshowthatabortionratesfell intreatment
villages relative to control villages between 1979 and 1998 (despite increasing secular
trends in both contraceptive use and abortion). However, the experimental treatment
bundled menstrual regulation 7 services together with the provision of modern
contraceptivesbetween1977and1983(donorsthenstoppedsupportingthiscomponentof
theprogram).Mostoftherelativedeclineinabortionintreatmentareasoccurredaround
1983–andsoisplausiblyduetotheendofabortionservices.Antenatalandchildhealth
serviceswerealsobundledtogetherwiththeprovisionofmoderncontraceptivesbeginning
in1978(Phillipsetal.1984),makingitdifficulttodisentangletheindependentcontribution
ofcontraceptivesupplyfromimprovementsinchildsurvival.8
Evidence fromwealthycountries isalsothin. AnanatandHungerman(2012) find
thattheavailabilityoforalcontraceptivesstartingatage16isassociatedwithareductionin
7Theterm“menstrualregulation”referstomanualvacuumaspirationprocedurescarriedoutafteramissedperiodbutbeforepregnancyisclinicallyconfirmed.8Forinstance,Phillipsetal.(27)findthatcontraceptiveprevalenceisindependentlycorrelatedwithsomeofthematernalandchildhealthcomponentsoftheMatlabprogramme,andthatthesignofthecorrelationvarieswiththetypeofintervention.
8
theprobabilityofreportinghavinghadanabortionbetweenages16and19.Glasieretal.
(2004)findnochangeinabortionratesinScottishcommunitiesfollowingfreedistribution
of advance emergency contraception to women ages 16‐29. Finally, Durrance (2013)
analyzes the diffusion of emergency contraception through pharmacies in the state of
Washington,findingnochangeintheabortionrate.
3. TheNepaleseNaturalExperiment
3.1. TheLegalizationofAbortioninNepal
Prior to 2002, Nepalese women who terminated their pregnancies faced
imprisonment for infanticide. 9 On September 27, 2002, the King of Nepal signed a bill
legalizingabortionpriortothetwelfthweekofpregnancy,priortotheeighteenthweekin
casesofrapeorincest,andatanygestationalagewithappropriatemedicaladvice(toprotect
thehealthofthemotheror incasesofseverebirthdefects, forexample)(MOHP,WHO&
CREHPA 2006). When this law was enacted, however, Nepalese reproductive health
providerswereneither permittednor adequately trained to begin offering safe abortion
services.Consequently,therewasverylittleincreaseinabortion,ifany,followingthislawin
2002(Valente2014).
Nepal’sfirstlegalabortionserviceswereofferedinMarch2004,andthenumberof
healthcentersregisteredtoprovidethemgrewrapidlyovertime,risingto141inJune2006
and291byFebruary2010.Toplacethisexpansionintocontext,thenumberofregistered
abortionprovidersgrewfromnonetonearlytwiceasmanyproviderspercapitaasinthe
9Althoughimprisonmentwasnotacommonoutcomeamongwomenwhohadanabortion,amongthesmallpopulationoffemaleinmatesinNepaleseprisons(405in1997),asubstantialproportionisbelievedtohavebeenconvictedonabortion‐relatedcharges(Ramaseshan1997).
9
UnitedStatesby2010–overaperiodofjustsixyears.10Thislarge‐scalepolicychangehas
been hailed by advocates as a success, and, according to observers, “Nepal's experience
making high‐quality abortion care widely accessible in a short period of time offers
importantlessonsforothercountriesseekingtoreducematernalmortalityandmorbidity
fromunsafeabortion”(Samandarietal.2012,p.1).
Underthepolicy,seniorgynecologistsfromcentralandregionalhospitalsaswellas
from someNGO and private clinicswere trained to becomeboth the first legal abortion
providers as well as safe abortion trainers themselves. With the aim to result in rapid
nationalscale‐up,trainingthencascadedfromregionalandzonalhospitalstopublicdistrict
hospitals(Samandarietal.2012).Theprivatesector(primarilyMarieStopesInternational
andtheFamilyPlanningAssociationofNepal)also“fill(s)animportantnicheinurbanareas”
(Samandarietal,2012)andislessprevalentinruralareas–whichwerehometo83%ofthe
Nepalesepopulationaccordingtothe2011populationcensus.Asaresult,morepopulous
districts,districtsinthemoreaccessibleregionsofthecountry,andurbanareasweremore
likelytohavelegalabortionservicesinearlyyears.11
Although illegalabortionshavealwaysbeenavailable tosomedegree, legalization
greatlyreducedtheeffective(quality‐adjusted)fullprice.Thecostofalegalabortionranges
10291 abortion centers in 2010 relative to a totalNepal population of 26.49Million reported in the 2011Nepalesepopulationcensusimpliesonecenterper91,031inhabitants.IntheUnitedStates,therewere1,793abortion providers in 2008 (Guttmacher Institute 2013) relative to a total population of 305 Million(PopulationReferenceBureau2008),implyingoneproviderper170,106inhabitants.11Inaddition,NepalexperiencedaMaoistinsurgencyin1996,whichledtoa10‐yearlow‐tomedium‐intensityconflict,peakingin2002.Conflictareasbetween2004and2006mayhavealsoexperiencedslower,lessintenseincreasesinthesupplyoflegalabortion.Ifareasinwhichabortionsupplygrewmoreslowlyhadpre‐existingtrenddifferencesincontraceptiveuse,thiscouldbiasourestimates.InSection7,weshowthatourresultsarerobusttoallowingformorepopulousdistricts,districtsinmoreaccessibleregionsofthecountry,andurbanareastoexperiencedifferentialtimetrendsincontraception–aswellastocontrollingforconflictintensity.
10
fromRs800toRs2000(USD11.33toUSD28.33)(MOHP&CREHPA2006)relativetomean
annual income Rs51,978 in 2004 (Central Bureau of Statistics 2004, p.37). Government
policy stipulates that poor women are entitled to abortion services free of charge, but
eligibilitycriteriahavenotbeenclearlydefined,andinpractice,theytendnottoreceiveany
preferentialtreatment(CREHPA2007,Samandarietal.2012).Comparisonstothecostof
illegalabortionsaredifficult; fivecasestudies inMOHPetal. (2006) report considerable
variation(Rs200,Rs500,Rs700,Rs3000,Rs8000).However,legalabortionsaremuchsafer,
reducing the likelihood of maternal death and post‐abortion complications requiring
expensivemedical care (MOHP et al. 2006).12 Consistentwith legalization reducing the
effective(quality‐adjusted)priceonanabortion,Valente(2014)showsthathavingalegal
abortioncenternearbyatthestartofapregnancyreducestheprobabilityofcarryingthe
pregnancytotermby8.1%.13
Incontrasttoabortion,contraceptionservicesareavailablefreeofchargethrough
governmentfacilities(andatasubsidizedpricethroughsocialmarketingorganizationslike
PSI – and at full price in private facilities) (Shrestha et al. 2012). Condoms, pills, and
injectablesareprovidedbyalllevelsofgovernmentfacilitiesandproviders,whileIUDsand
implants can be obtained in selected hospitals, primary health centers, and health posts
(Shrestha et al. 2012). In the latest Demographic and Health Survey (DHS 2011), 55%
(47.5%)ofsterilizedwomen(men)weresterilizedinagovernmenthospitalorclinic,while
19.4%(32.5%)weresterilizedthroughagovernment‐runmobileclinic.
12MOHPetal.(2006)reportsthatcostsforpost‐abortionemergencycarecanrangefromRs2000toRs5000.13Thisfigureisbasedonabinarydefinitionofproximitytoalegalabortioncentrecorrespondingtothemediandistance to the nearest legal abortion centre (28.6 kilometers). Various robustness checks for differentdefinitionsofaccesstoalegalabortioncentrearepresentedinValente(2014).
11
AuniquefeatureofNepal’slegalizationofabortionisitsnarrowfocus.Inparticular,
itwasnotaccompaniedbyameaningfulincreaseinthesupplyofmoderncontraceptives,an
expansionofthereproductivehealthworkforce,orimprovementsintheprovisionofother
healthservices.Instead,pre‐existingreproductivehealthcareprovidersweretrainedand
licensedtoofferabortionservicesaspartoftheirexistingpractices.14ThisfeatureofNepal’s
policychangeallowsustoisolatechangesintheuseofmoderncontraceptiveslinkeddirectly
toexpansionsinabortionsupply(thatarenotattributabletosimultaneouschangesineither
health service delivery or contraceptive supply that often accompany such changes in
abortionpolicyasin,e.g.,Pop‐Eleches(2010)).15
3.2. TrendsinModernContraceptiveUseandAbortioninNepal
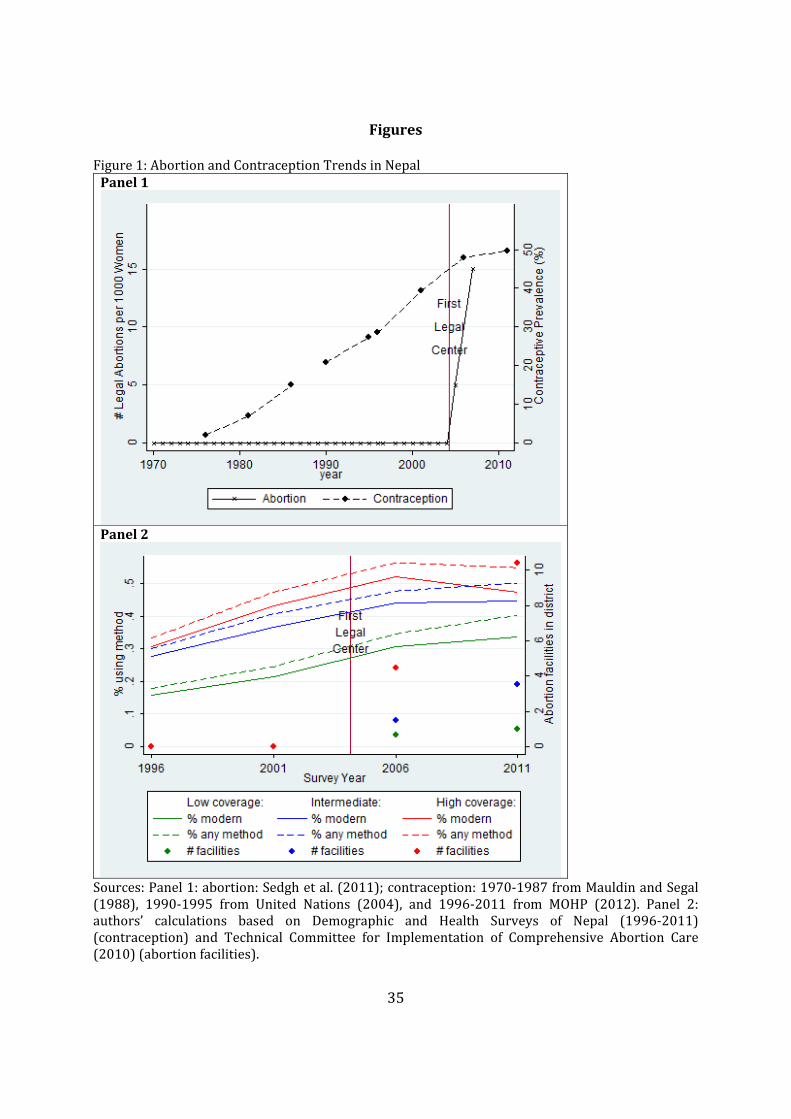
Figure1showsthecontraceptiveprevalenceandabortionratesinNepalovertime.
Afterarapid,sustained,increaseintheuseofmoderncontraceptivesfromthelate1970s
untilthemid2000s(fromonly2%to48%),contraceptiveprevalencethenplateauedwith
thelegalizationofabortionin2004(Figure1Panel1).Asinothercountries,thispatternof
co‐movement is consistentwith substitution (and occurred during a period of declining
fertility,withNepal’stotalfertilityratefallingfrom4.6in1996to2.6in2011(MOHPetal.
2012)).
14AsurveyofComprehensiveAbortionCare(CAC)providersconductedin2009revealedthatonly8of139surveyedprovidersintroducednewcontraceptiveservicesormaternalandchildhealthservicesataroundthesametimeastheystartedprovidingabortionservices(Valente2014).15Ofcourse,mostabortionclientsreceivepost‐abortioncontraceptivecounselling(MOHP&CREHPA2006).Thiscouldleadustounderestimatetheextentofthesubstitutionawayfromcontraceptionifwomenwhouseabortionservicesaremorelikelytousecontraceptionafterhavinghadanabortion.However,theresultsofourstatisticalanalysisarevirtuallyunchangedwhenexcludingwomenwhoreporthavinghadanabortionwithinoneyearofthesurvey,thussuggestingthatpost‐abortionchangesincontraceptiveusearenotinfluencingourfindings(fullresultsareavailableonrequest).
12
However,theseaggregatetrendsmayreflectchangesincontraceptiveuseunrelated
tothelegalizationofabortion.Abettertestofwhetherornottheplateauingofcontraceptive
prevalenceislinkedtoNepal’sincreaseinabortionsupplywouldusedistrict‐levelvariation
in themagnitude of abortion supply. Figure 2 shows the concentration of legal abortion
center across Nepal’s districts, illustrating that there is substantial geographic variation.
SplittingNepal’s 75 districts into terciles of legal abortion center concentration in 2010,
Figure1Panel2showsthatplateauing incontraceptiveprevalence isgreater indistricts
withhigherconcentrationsoflegalabortioncenters.Figure1Panel2alsoshowsthatareas
with fewer abortion centers initially had lower contraceptive prevalence rates. Our
estimation strategy accounts for these baseline differences across districts (due to both
observable and unobservable, time‐invariant factors), assuming that there are no time‐
varyingomittedvariablescorrelatedwithboth the increase in legalabortioncentersand
contraceptiveuse. InSection7,wereportanumberofrobustnesstestsshowingthatour
resultsareunlikelytobedrivenbytime‐varyingomittedvariables.
4. ConceptualFramework
Beforeturningtoourdataandmethodsusedtoestimatetherelationshipbetween
abortion supply and contraceptive use in Nepal, we first present a simple conceptual
frameworktoclarifythehypothesistestedinthispaper.
To fix ideas, consider the choice between using contraception and not using
contraceptionfacedbyawoman(couple)whodoesnotwanttohaveachildnow(Figure
A2). Define , a dummy variable equal to one if woman uses contraception, and zero
13
otherwise; is a dummy variable equal to one if woman has an abortion, and zero
otherwise.Finally,define ,theprobabilityoffailureofthecontraceptivemethodusedby
the woman (and so 0 1 ). For simplicity, we assume that, in the absence of
contraception, the woman becomes pregnant with probability one. Assuming a strictly
positive probability of less than one does not change the qualitative implications of the
model,nordoesallowingforimperfectpredictionsoftheprobabilitiesofbecomingpregnant
withandwithoutcontraception.16Ifawomanusescontraception,thenwithprobability1
, she does not become pregnant and therefore never aborts.With probability , she
becomespregnantandeitherabortsornot. Ifawomandecidestonotusecontraception,
thenshebecomespregnantandeitherabortsornot.
Nowdefinethecosts(financialandpsychological)attachedtousingcontraceptionas
,thedirectcostsattachedtohavinganabortionas ,andthenetpresentvalueofthecosts
attachedtohavinganunwantedchildas ,whichareallallowedtovaryacrosswomen.
Conditionalonbeingpregnantwithanunwantedpregnancy,woman abortsifandonlyif
. Woman will use contraception if and only if her expected cost from using
contraceptionislowerthanthatfromnotusingcontraception,i.e.,ifandonlyif17:
1 1
16Theonlydifferencewhenassumingaprobabilityofbecomingpregnantintheabsenceofcontraceptioninferiortooneisthatinequality(1)becomes: 1 min , ,where istheprobabilityofbecomingpregnantintheabsenceofeffectivecontraception,and istheprobabilityofbecomingpregnantdespiteusingcontraceptionwhencontraceptiveprotectionisneeded(whichisthecasewithprobability ).Allowingwomentoholderroneousbeliefsintermsof and changestherangesofcostsoverwhichwomendecidetousecontraceptionornot,butdoesnotalterthequalitativeconclusionsofthemodelabouttheeffectofadecreaseinthecostofabortionrelativetocontraception.17Notethatwhen ,theexpectedcostofusingcontraceptionis: 1 andthecostofnotusingcontraceptionis .When ,theexpectedcostofusingcontraceptionis:
1 andthecostofnotusingcontraceptionis .
14
Insummary,awomanwillusecontraceptionifandonlyif:
1 min , (1)
Ourhypothesisisthatwhenalegal,safe,andaffordableabortioncenteropensina
woman’s district of residence, decreaseswhile all the other parameters of themodel
remainconstant,andhencemin , eitherdecreasesorstaysthesame.Therefore,given
that1 is positive, inequality (1) becomes less likely to hold and fewer women use
contraception,resultinginsubstitutionofabortiontocontraception.
Previous studies estimating the trade‐off between contraceptive use and abortion
generally analyze how abortion use responds to changes in contraceptive supply. This
approachreliesheavilyontheaccuracyofabortionreporting,whichisknowntobepoorin
surveydata(JonesandForrest1992). Incontrast,ourstudy investigateshowtheuseof
moderncontraceptivesrespondstotheprovisionoflegalabortioncenters.Indoingso,we
provideatestofwhetherornotwomendecidenottousecontraceptionup‐frontwhenitis
lessdifficult/costlytohaveanabortion(ratherthanwhetherornottheyarelesslikelyto
haveanabortionex‐postwhenthesupplyofcontraceptivesincreases).
5. DataandMethods
5.1. DataonNepaleseWomenandLegalAbortionCenters
TomeasuremoderncontraceptiveuseamongNepalesewomen,weusefourwaves
fromtheNepaleseDemographicandHealthSurveys (DHS), twopre‐legalizationand two
post‐legalization (Demographic and Health Surveys of Nepal 1996‐2011). Collecting
nationally representative data from fertile‐age women (defined as ages 15‐49) in 1996,
2001, 2006, and 2011, these surveys provide the best available information about
15
reproductivebehavioramongNepalesewomen.Eachwave includes ahousehold survey
(collecting general information about household composition and socio‐economic
characteristics),andanindividualsurveyadministeredtoallfertile‐agewomen(including
questionsaboutcurrentandretrospectivefertilityregulationpracticesoverthepreceding
four or five years – as well as complete retrospective fertility histories detailing all
pregnancies, including those that did not end in a livebirth). We restrict the sample to
marriedwomen(becausethe1996and2001surveysonlyincludedmarriedwomen),but
wealsoassesstherobustnessofourresultstoalternativeapproaches.18Ourpooledsample
acrossthesefoursurveywavesincludes32,098women.19
Abriefnoteabouttheuseofcontemporaneousdata(fromsurveyyearsonly)versus
retrospectivecontraceptivehistorydata(foryearspriortothesurveyyear,asrecalledby
respondents in survey years) is warranted. An important virtue of using only
contemporaneousdataisthatitminimizesmeasurementerrorinreporteduseofmodern
contraceptives.20Thedrawbacksofusingonlycontemporaneousdataarethepossibilityof
lowerstatisticalpower(becauseofsmallersamplesizes)andlessflexibilitytoexaminethe
evolutionofcontraceptiveuseovertimerelativetotheexpansionoflegalabortioncenters.
18Forexample,wealsorestrictoursample towomenages25andabove,amongwhommarriage isnearlyuniversal – 97.3% of respondents ages 25 and above in the 2006 and 2011weremarried at the time ofinterview.FocusingonmarriedwomenisconsistentwiththecompositionoflegalabortionserviceclientsinNepal.AsurveycarriedoutbyCREHPAin2006indicatesthatnearly98%ofclientswereorhadbeenmarried,closeto60%werebetween20and29yearsold(only5%wereunder20),andlessthan7%hadnolivingchild(23%,40%,and31%,hadone,two,andthreeormorelivingchildren,respectively)(MOHP&CREHPA2006).AninternationalcomparisonoflegalabortionserviceclientcharacteristicssuggeststhatthecharacteristicsofNepaleseclientsaregenerallycomparabletothoseobservedinotherlessdevelopedcountries(Bankoleetal.1999,MOHP&CREHPA2006).1940,622womenwereinterviewedintotal(8,429in1996,8,726in2001,10,793in2006and12,674in2011).Afterdropping2,175womenwhoarenotusualresidentsofthehouseholdinwhichtheyareobserved,6,348unmarriedwomen interviewed in2006and2011,andonewomanwhose levelofeducation ismissing,weobtainthefinalsampleof32,098.20ThequestionaskedintheDHSis“Areyoucurrentlydoingsomethingorusinganymethodtodelayoravoidgettingpregnant?,”
16
Although we cannot be certain about how much measurement error exists in the
retrospective recall data about contraceptive use, studies of contraceptive history recall
error suggest substantial limitations in the use of such recall data (Strickler et al. 1997,
Beckett et al. 2001).21Beyond contraceptiveuse,more recent research suggests that the
quality of recall data deteriorates very rapidly and that the length of the recall period
influences self‐reported morbidity and use of health services in ways not previously
demonstrated(Dasetal.2012).22Giventheseconcerns,theavailabilityofanunusuallylarge
numberofDHSwavesforouranalysis(four),andthefactthatwehaveadequatepowerto
examinethecorrelationbetweentrendsincontraceptiveuseandtheintensityofabortion
supply(asshowninSection6),wefocusoncontemporaneousdatainouranalysis.
Weusethetotalnumberoflegalabortioncentersineachdistrict,month,andyearto
measuretheintensityofabortionsupply.Weconstructedthismeasureusingadministrative
records from the Nepalese Technical Committee for Implementation of Comprehensive
AbortionCare(TCIC2010)containingexactregistrationdatesforeachlegalabortionfacility
authorized before February 2010. We then assign intensity of abortion supply to each
21Strickleretal.(1997)andBeckettetal.(2001)comparecontraceptiveusebythesamewomanforthesameperiodsoftime–butreportedattwodifferentsurveydates–andfindthattherearesubstantialinconsistenciesatthedisaggregatedlevel.Specifically,Strickleretal.(1997)findthat,amongMoroccanwomenreportingatleastoneperiodofcontraceptiveuse,only45.1%reportedperiodsofuseandnon‐useinthesameorderintwodifferentsurveys,andonly29.3%reportedthesamesequenceandlengthofcontraceptiveuse.Similarly,whencomparingindividualreportsofcontraceptiveuseincontemporaneousandrecalldataforMalaysia,Beckettetal(2001)obtainaKappacoefficientofonly0.38.Inthepresenceofmisclassification(e.g.,reportingnotusingcontraceptionwheninfactusingandvice‐versa),Hausmanetal.(47)showthatestimatesareinconsistentandtheirprecisioncanbeoverstated.22NotethatrecallerrorforthevariablesexaminedbyDasetal.(2012)–whichincludevisitstothedoctorandself‐medication–isveryrelevanttorecallerrorincontraceptiveuse,butlesssoformoresalienteventssuchasthebirthofachild.
17
individualwomaninourpooledDHSsampleatthedistrict‐month‐yearlevel(accordingto
herinterviewdate).23
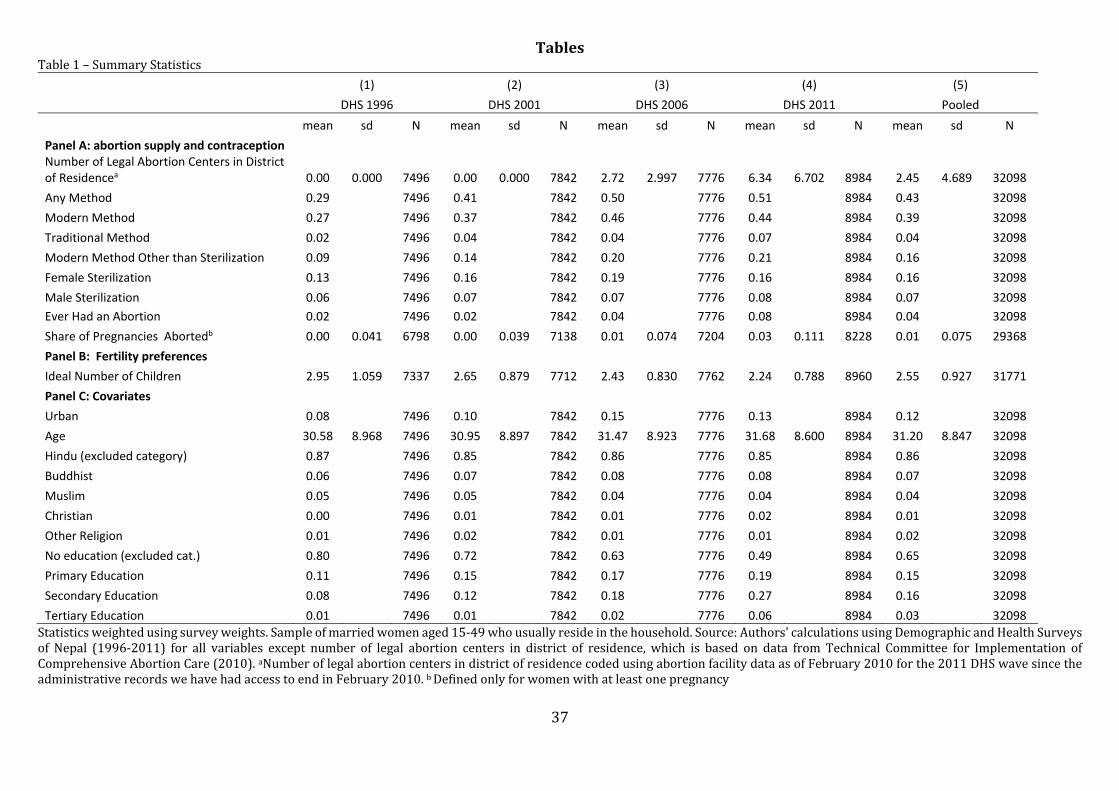
Table1reportsdescriptivestatisticsbothforourpooledsampleandseparatelyfor
eachsurveyyear.Thefirstrowreportsthemeannumberoflegalabortioncentersinthe
woman’sdistrictineachsurveywave.Theintensityofabortionsupplyvariesconsiderably
both across survey waves and across districts within each post‐legalization wave. On
average,womeninterviewedin2006had2.72centersintheirdistrict(s.d.:2.997),andthis
numberrisesto6.34(s.d.:6.702)by2011.
The next eight rows then summarize modern and traditional contraception and
abortion.Moderncontraceptiveuseincreasesbetweeneachsurveywaveuntil2006(from
27% in 1996 to 46% in 2006) but then ceases to rise between 2006 and 2011. Among
modernmethods,themostcommonisfemalesterilization,butreversiblemethodsaccount
formostoftheincreaseincontraceptiveprevalencebetweensurveywaves.In1996,2%of
womenreporteverhavinganabortion,24risingto8%by2011.Desiredfertilityalsodeclined
acrosssurveywaves.Forexample,theaverage“ideal”numberofchildrenfellfrom2.95in
1996to2.24in2011.25
23Bydefinition,anabortioncenterisonlylegalifitis“listed”withtheTechnicalCommitteeforImplementationofComprehensiveAbortionCare(TCIC),andthedatausedherearebasedonthelistofallfacilitiesincludedontheTCIClistuptoFebruary2010.24Foreachpregnancyinthepregnancyhistoryofthewoman,sheisaskedwhetherthebaby[was]“bornalive,borndead,orlostbeforebirth”;thenwhenthepregnancyendedandhowlongitlasted;andthenonly“didyou[therespondent]orsomeoneelsedosomethingtoendthispregnancy?”.Thesequenceofquestionsisthesameforthefoursurveys,butthevariablesavailablechangedin2011.Before2011,wecountasanabortionanypregnancy not ending in live birth forwhich thewoman either says that somethingwas done to end thepregnancyorrefusestoanswerthelastquestion.Inthe2011survey,thedatasetdoesnotcontainthenecessaryraw data to apply the exact same rule, but contrary to the previous surveys, provides a classification ofpregnanciesaslivebirth/stillbirth/miscarriage/abortionbasedonthesamesurveyquestions.25PanelCshowsthatoursampleisapredominantlyruralandwithlowlevelsofeducation(especiallyamongwomen)thatincreaserapidlyacrossstudywaves.
18
5.2. StatisticalMethods
We estimate logitmodels of the following general form forwoman i in districtd
observedinsurveys:
1 (2)
Where / 1 isthecumulativelogisticdistribution.Here isadichotomous
indicatorforvariousmeasuresofcontraceptiveuse(equalto1ifwomanireportsusinga
givenmethodofcontraception,and0otherwise), isthenumberoflegalabortioncenters
inthedistrictatthetimeofthesurvey, isavectorofindividualcharacteristics(urban
dummy, age, religiondummies, education attainmentdummies), is a vectorof district
dummy variables, is a vector of (3) DHS wave dummies (equivalent to year dummy
variables). 26 We estimate equation (2) using survey weights and allowing for error
correlationofanarbitrarynaturewithindistrict.Equation(2)implementsa`difference‐in‐
difference’estimationstrategyinwhich capturestheeffectofeachlegalabortioncenterin
awoman’sdistrictoncontraceptiveuse,controllingforbaselinedifferencesincontraceptive
usebetweendistricts( )andtimetrendscommontoalldistricts( ).Thevalidityofour
estimatesthusreliesontheassumptionofnomeaningfuldifferencesinpre‐existingfertility
regulationtrendsacrossdistrictswithvaryingincreasesinthesupplyoflegalabortions.In
Section7,wereportevidenceconsistentwiththisassumption.
26Note thatCds is codedusingabortion facilitydata asof February2010 for the2011DHSwavesince theadministrativerecordswehavehadaccesstoendinFebruary2010.
19
6. Results
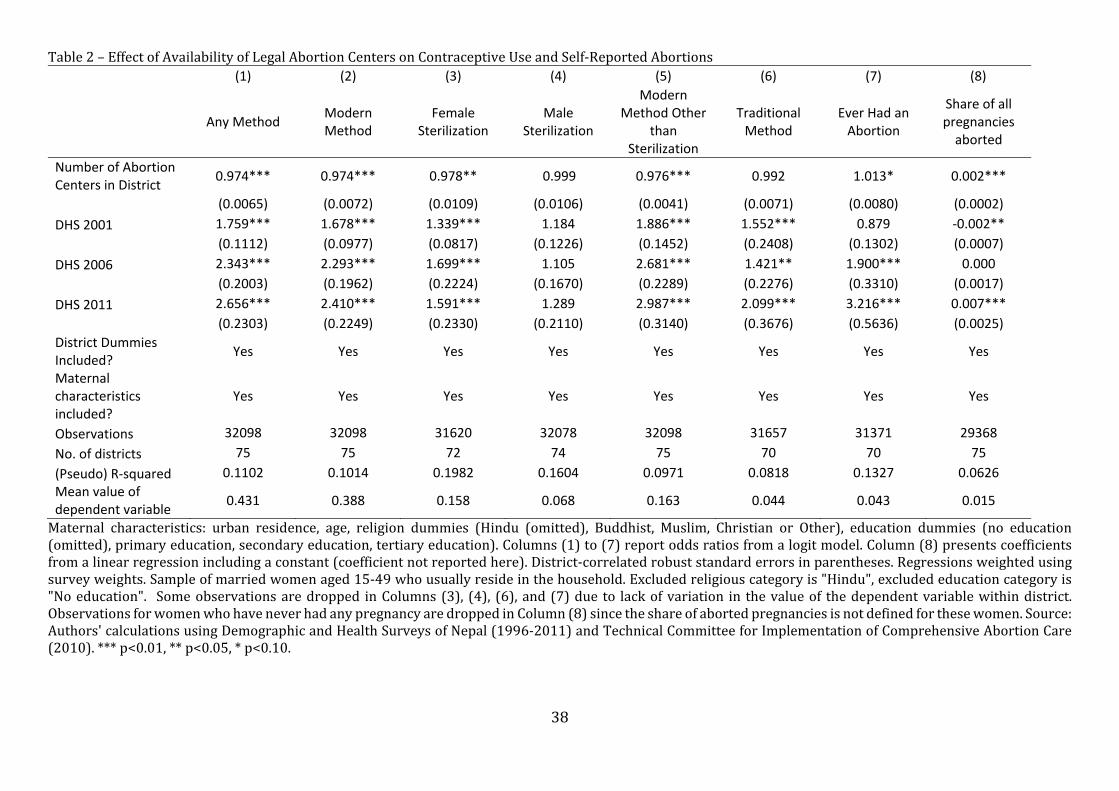
The first six columns of Table 2 report odds ratios estimates of the effect of the
numberoflegalabortioncenters(α)forvariousindicatorsofcontraceptiveuse(shownat
thetopofeachcolumn)obtainedbyestimatingEquation(2).Thefirstcolumnshowsresults
foruseofanyformofcontraception(modernortraditional):theadditionofalegalabortion
centerinawoman’sdistrictofresidenceisassociatedwitha2.6%reductionintheoddsof
usinganycontraceptive[OR:0.974,95%CI:(0.961;0.987)].27Thisoddsratiocorrespondsto
adecreaseintheprobabilityofusinganyformofcontraceptionof0.5percentagepointsper
legalabortioncenter[95%CI:(‐0.007;‐0.002)],a2percentagepointreductionfromthepre‐
legalizationmeanof35%associatedwithfourlegalabortioncenters–themeannumberof
centersinthetwopost‐legalizationsurveywaves).28
Columns (2) and (6) report separate estimates for use of any modern and any
traditional method of contraception (respectively). 29 The odds of using modern
contraceptivesdecreaseby2.6%withanadditionalabortioncenter,whiletheoddsratiofor
useoftraditionalmethodsisindistinguishablefromone[OR:0.974,95%CI:(0.960;0.989)
andOR:0.992,95%CI:(0.978;1.006),respectively].Takentogether,theseresultssuggest
thatwhenalegalabortionfacilityopensinawoman’sdistrict,shereducesheruseofmodern
contraceptives,whiletraditionalcontraceptionremainsunchanged.Analyzingtheeffectof
anadditionalabortioncenteronmoderncontraceptiveusebyagegroup,wefindthelargest
27ThisandtheotherpointestimatesofinterestinTable2arenearlyunchangedwhenthelinearagevariableisreplacedwithseven5‐yearagecategories.Resultsareavailableonrequest.28Marginaleffectsreportedinthepaperarecomputedatthemodeofallcategoricalcovariates,themeanofmaternalage,andthemeannumberofabortioncentersperdistrictinthetwopost‐legalizationsurveys.29Traditionalmethodssuchaswithdrawalandtherhythmmethodareonlyusedby4%ofwomeninourpooledsample,buttheirusehasincreasedovertime,from2%in1996to7%in2011.
20
decreaseincontraceptiveuseamongthe15‐19andthe30‐34agegroup,whiletheeffectis
statisticallysignificantforallgroupsuptoages35‐39(TableA1).
Columns(3),(4),and(5)ofTable2thenanalyzehowsubstitutionawayfrommodern
contraceptionwiththeopeningof legalabortioncentersvariesbetweensterilizationand
reversible modern methods.30 Column (3) shows that an additional abortion center is
associated with a 2.2% reduction in the odds of female sterilization [OR: 0.978, 95%
CI:(0.957;0.999)], implyinga0.23percentagepointdecrease in theprevalenceof female
sterilization. On the contrary, we find that abortion centers have no effect on male
sterilization (Column (4)). The estimated change in odds of using reversible modern
methodsreportedinColumn(5)issimilartothatofusingfemalesterilization,decliningby
2.4%witheachadditionallegalabortionfacility[OR:0.976,95%CI:(0.968;0.984)].31
IfourinterpretationoftheestimatesinthefirstsixcolumnsofTable2iscorrect,the
expansion of legal abortion centers should also be associated with an increase in the
probability thatwomen abort (although an effect on contraceptive usemay be detected
before theeffectonabortion isrealized). TheseventhcolumnofTable2reports results
obtainedbyre‐estimatingEquation(2)usingadichotomousindicatorforwhetherornota
womanreportseverhavinganabortion(definedasapregnancythatdidnotresultinalive
birthandforwhichsomeonehasdonesomethingtoendthepregnancy).Eachadditional
30Amongreversiblemodernmethods,condomsmayrequiremorenegotiationwithmalepartners.Repeatingourestimationseparatelyforcondomuse(OR:.989;95%CI:.979;1.0004)andforotherreversiblemethods(OR:.976;95%CI:.967;.984),wefindalargerassociationforotherreversiblemodernmethods,althoughthedifferencebetweenthemisnotstatisticallysignificant.31Oddsratiosontheothercovariatesgenerallyhavetheexpectedsigns:theindicatorsforeachDHSsurveycapturetheoveralltrendsincontraceptiveusedescribedinSection5.1,andconfirmthaturban,bettereducated,andolderwomenaremorelikelytousecontraception.Coefficientsonreligiousaffiliationvariablesarealsoreasonable(e.g.,MuslimsaresignificantlylesslikelytousecontraceptionthanHindus).Itisinterestingtonotethattheeducationgradientisverysteepfortraditionalmethodsbutmuchlesssoforuseofanytypeofcontraception.
21
legalabortioncenterinawoman’sdistrictisassociatedwitha1.3%increaseinoddsofever
havinganabortion,which isstatisticallysignificantat the90%level (OR:1.013;95%CI:
0.998; 1.029), and implies a 4 %‐increase relative to the pre‐legalization proportion
reportingeverhavinganabortionforfourlegalabortioncenters.Becausethelikelihoodof
everhavinganabortionpartlydependsonthenumberofpastpregnancies,weconfirmthat
the estimates in column (7) are not driven by changes in fertility by using the share of
pregnancies aborted by the respondent as the dependent variable (estimating a linear
specificationbyordinaryleastsquares).Column(8)showsthattheabortioncenterestimate
is again positive and statistically significant (linear coefficient: 0.0019; 95% CI:
0.0015;0.0022).
7. AssessmentofRobustnessandExtensions
7.1TestingforPre‐ExistingTrendDifferences
Althoughour‘difference‐in‐difference’estimationframeworkaccountsforbaseline
differences in contraceptive prevalence across districts, it assumes that districts with
varyingconcentrationsofabortionfacilitieshadparalleltrendsincontraceptiveprevalence
priortothelegalizationofabortion.Totestwhetherornotthenumberofabortioncenters
wastargetedtodistrictswithpre‐existingtrenddifferencesincontraceptiveprevalence,we
conducttworelated“placeboexperiments”.
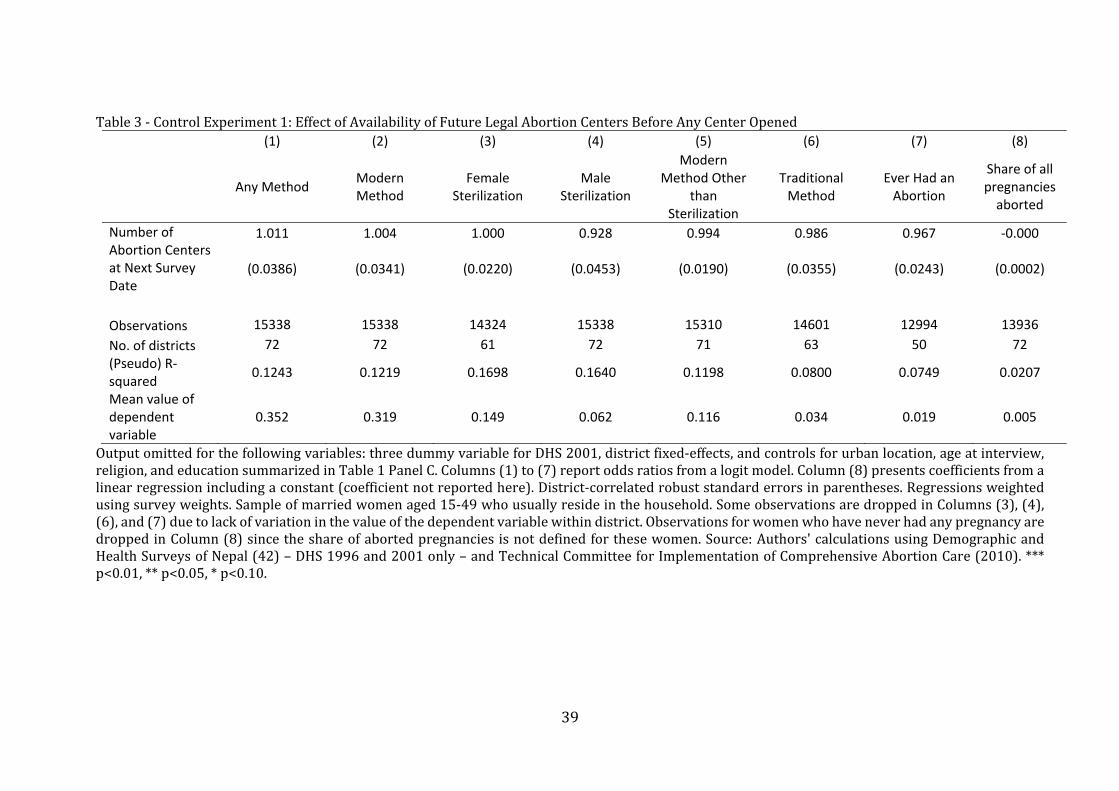
Inthefirst,weassignadistrict‐levelmeasureofthefuturenumberofabortioncenters
(thenumberofcentersatthetimeofnextsurvey)toeachwomaninthe1996and2001DHS
waves (i.e., before any legal abortion center opened). Re‐estimating Equation (2) using

22
futurenumberofabortioncentersinlieuofthecurrentnumberofcenters,Table3reports
estimatesfortheparameter intheequation
1 . Consistent with our assumption of
‘paralleltrends,’noneoftheseestimatedoddsratiosaresignificantlydifferentfrom1(nor
istheestimateforfuturenumberofabortioncentersestimatedbyordinaryleastsquaresin
Column(8)significantlydifferentfromzero).
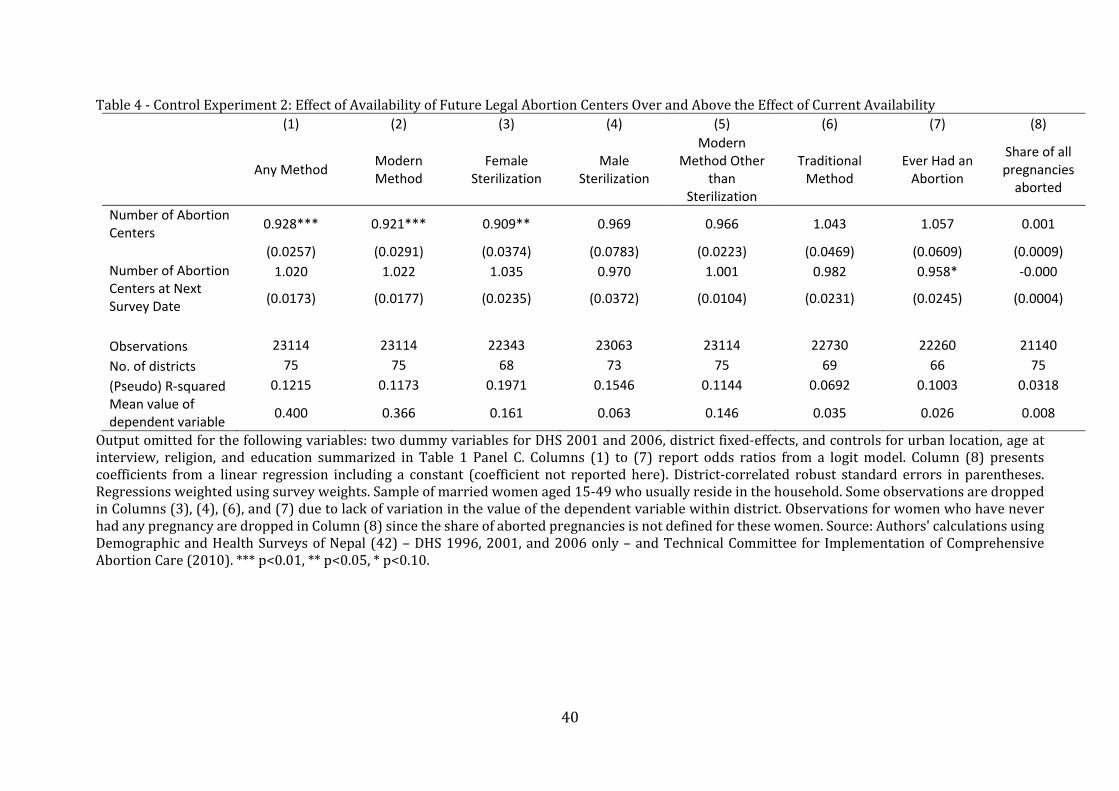
Thesecondplaceboexperimentrepeats the firstwith twodifferences: italsouses
data from the 2006DHSwave, and it includes both current and future number of legal
abortionfacilities(becausesomecenterswereoperatingin2006).Table4showsestimates
for future and current number of legal abortion facilities, again suggesting that current
contraceptiveprevalenceandpastabortionbehaviorarenotcorrelatedwithfutureabortion
supply.Overall,theseresultssuggestnotargetingofabortioncenterstodistrictswithpre‐
existing trend differences in contraceptive prevalence – and are consistent with our
interpretation of Table 2 showing evidence that abortion and the use of modern
contraceptivesaresubstitutes.
7.2OtherRobustnessTests
For completeness, we also estimate variants of equation (2) using recall data
containedinthe2006and2011DHSfertilityhistoriesandreportourresultsinTableA2.
Ourspecificationsusewoman‐monthobservationsfromApril2000toFebruary2010and
excludes women who were sterilized or whose husbands were sterilized by March
2004; isreplacedby ,thenumberoflegalabortioncentersinthedistrictforeach
monthandyear.Wefindanegative,statisticallysignificantrelationshipbetweenthenumber

23
ofabortioncentersinawoman’sdistrictandheroddsofreportinguseofanycontraceptive
method,confirmingourinferencesfromcontemporaneousdata(Column1).Thisestimateis
robusttocontrollingforlinear,quadraticorcubicdistrict‐specifictrends(Columns2,3,and
4,respectively).Whenaddingaplacebotreatmentvariableequaltothenumberofabortion
centersinthedistrict12monthsinthefuture,theresultpersists,andtheeffectoftheplacebo
treatmentvariableisstatisticallyinsignificant(Column5).
We then investigate the robustnessofourmainresults toaddressingavarietyof
otherpotentialconcerns:
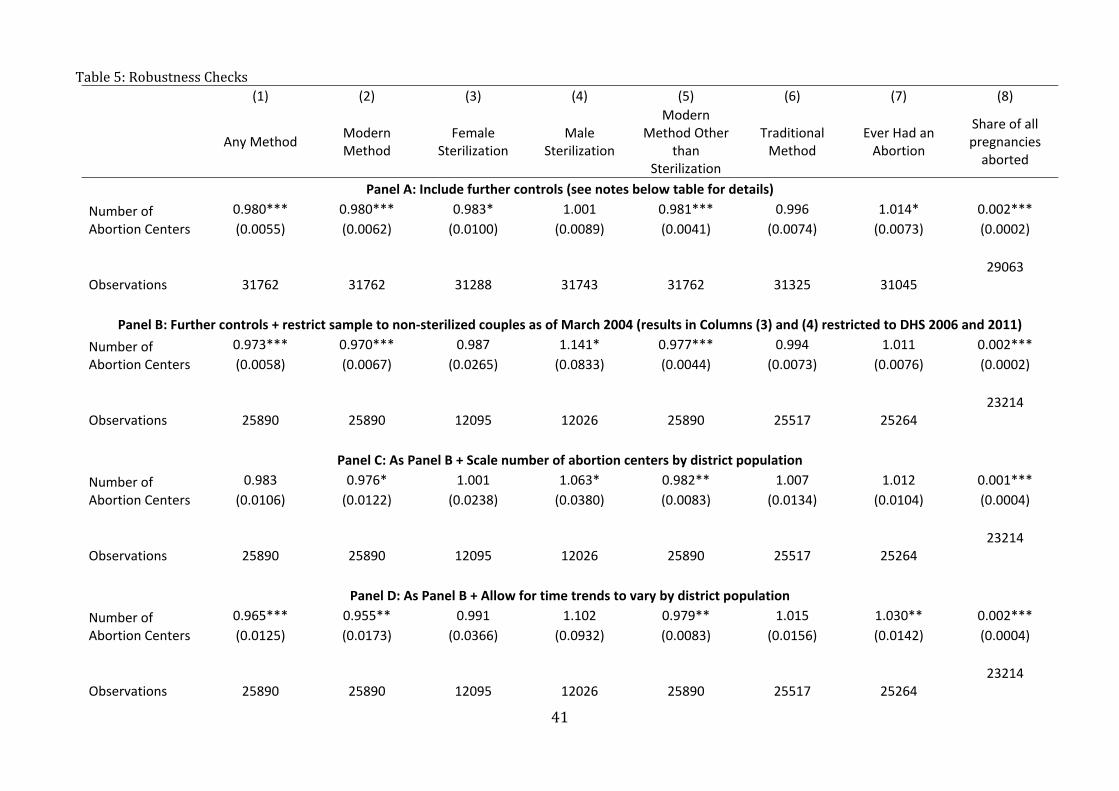
1. First,wecontrolforanumberofadditionalregressorsinPanelAofTable5.
Specifically,wecontrolforrespondents’idealnumberofchildren;numberof
conflictcasualtiesintheyearprecedingthesurveyinrespondents’districts
(per 1991 district population, the year of the last pre‐conflict population
census);whetherornotrespondentsreporthavingheardafamilyplanning
message on the radio in the lastmonth;whether or not respondentswere
visitedbyafamilyplanningworkerintheprevious12months;whetherornot
respondents had heard of AIDS; and socio‐economic status (measured by
quintileinthedistributionofhouseholdassetownership).Ourconclusionsdo
notchangeafterweincludetheseadditionalcontrols.32
2. Second,inPanelB,werestrictthesampleanalyzedinPanelAtowomenwho
werenotsterilizedandwhosehusbandswerenotsterilizedasofMarch2004.
32WealsoestimatetherobustnesstestshowninTable5,PanelAincludingboththenumberofchildrenborntoawomanandwhetherornotawomanhadajobinthepast12months.Theresultingestimateschangeverylittle(andinsignificantlyso)whenincludingtheseadditionalcovariates.Theseresultsareavailableuponrequest.

24
Theresultsconfirmthesign,significance,andmagnitudeofthemainestimates
forallmoderncontraceptionandfortemporarymethods.33
3. Third,inPanelC,wefurtherscalethenumberofabortioncentersbydistrict
population(asof2001,thedateofthelastpre‐legalizationpopulationcensus).
Ourestimatesbecomemore imprecise (thestandarderrorsnearlydouble),
but the negative association between legal abortion centers and the
prevalence of any modern contraception – and specifically temporary
methods–remainsstatisticallysignificant.34
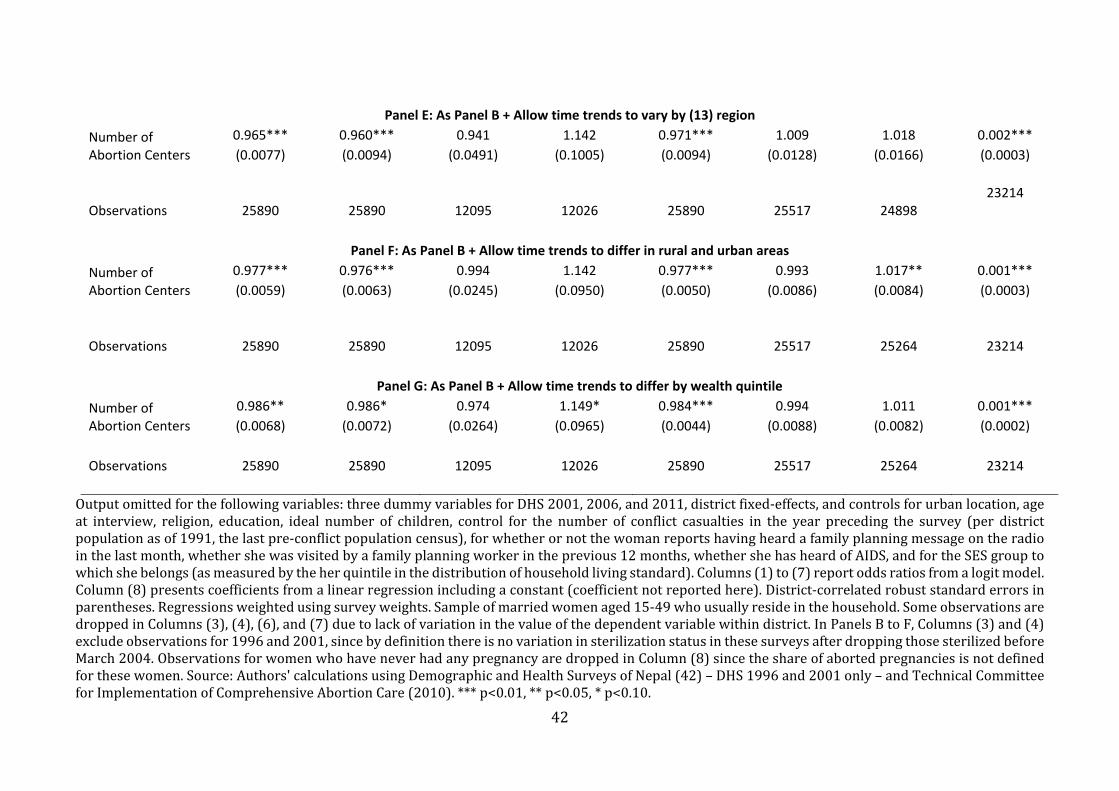
4. Fourth,inPanelsD,E,andF,weexplicitlyallowtimetrendstovarybypre‐
legalization district population (Panel D), region (Panel E), rural/urban
location(PanelF),andwealthquintile (PanelG).35Morepopulousdistricts,
districts in the more accessible regions of the country, and urban areas
experienced earlier/more intense expansions of legal abortion supply.
Additionally,privateprovidersaremoreprevalentinurbanareas,andthese
private providers may be more responsive to local demand than public
facilities. The twomain national health and population programs in place
during therelevantperiod(theNepalFamilyHealthProgramduring2001‐
33Notethatinthisrestrictedsample,bydefinition,thereisnovariationinsterilizationstatusinthe1996and2001DHS(asthosesterilizedby1996or2001aredroppedfromthesample),sothatwecanonlyusethe2006and2011DHSsurveysfortheanalysisofthesterilizationoutcomes.Thefindingsonsterilizationoutcomesusingonlythelasttwosurveyssuggestastatisticallyinsignificantdecreaseinfemalesterilization,andamarginallysignificantincreaseinmalesterilization(butthetotaleffectonmoderncontraceptionisstillsignificantlyandconsistentlynegativeoverall).34Althoughresultsarelessprecise,thenumberofabortioncentersperinhabitantisverysimilartoourmainmeasureofprogramtreatment:thenumberofabortioncenters.Thecorrelationbetweenthesetwovariablesis0.71.35Aregionisdefinedastheinteractionbetweenaneconomicregion(ofwhichtherearefiveinNepal)andanecologicalbelt(terai,hillormountain),with13regionsdefinedintheDHS.
25
2006andtheNepalHealthSectorProgramImplementationPlanduring2004‐
2009) also aimed to prioritize the poor and those living in remote areas
(MOHP et al., 2012). Interacting DHS wave and initial population, region,
urban location, andwealth quintile in Panels D, E, F, and G show that our
conclusionsareunchangedwhenallowingforsystematictrenddifferencesin
contraceptiveusebythesecharacteristics.
Finally, we explore the robustness of our conclusions to a variety of weighting,
functional form, and sample considerations and find that our results are robust to using
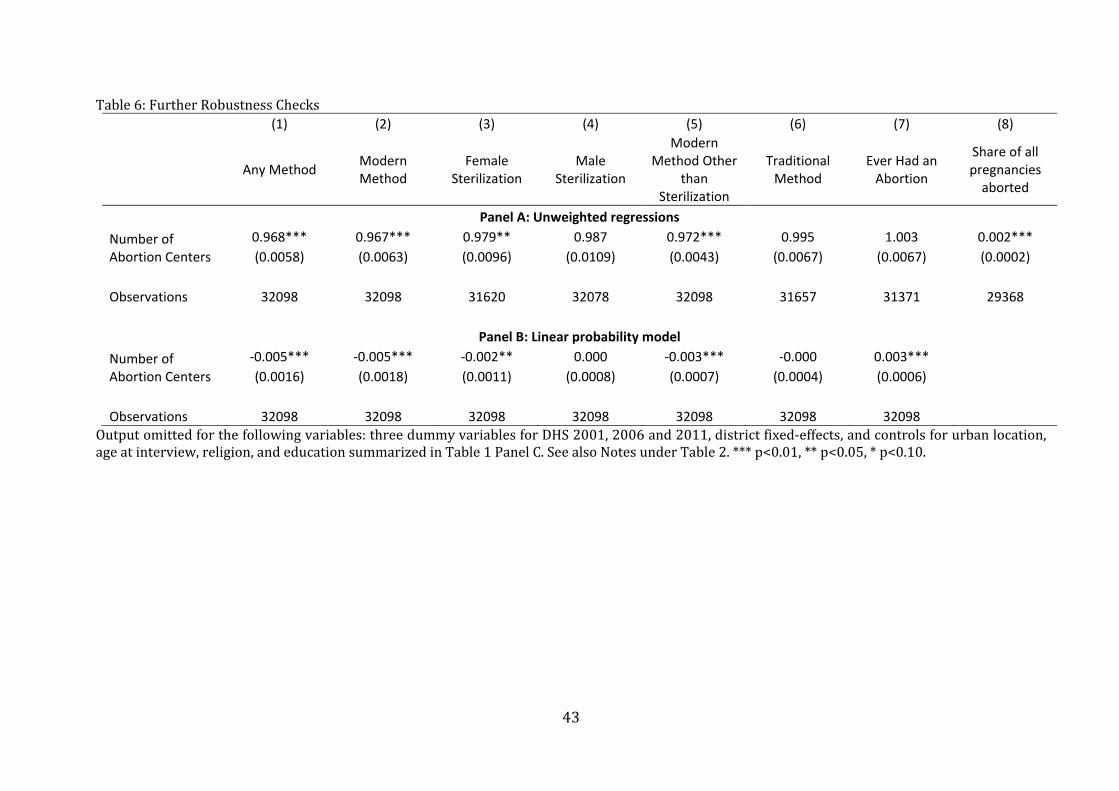
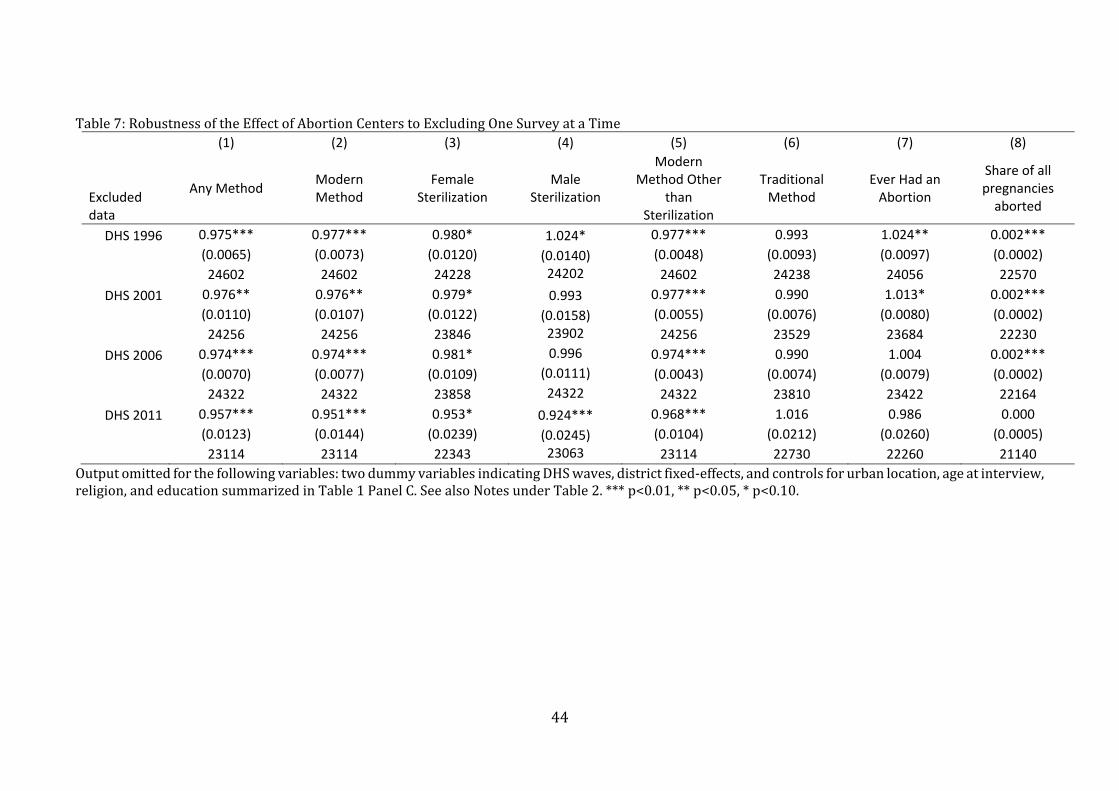
unweighted‐ratherthanweightedlogitmodels(PanelAofTable6),toreplacingourlogit
specificationwitha linearprobabilitymodel (PanelBofTable6), toexcludingeachDHS
surveyinturntoinvestigateifourconclusionsdependonanyindividualsurvey(Table7)36,
and to limiting the sample to allwomen ages 25‐49 insteadof restrictingour sample to
marriedwomen(Table8).37
7.3ConsiderationofChangesinTemporaryModernMethodsvs.Sterilization
Theresultspresentedsofarsuggestthattheincreaseinthesupplyoflegalabortions
affected the use of temporary modern contraceptive methods, but its effect on new
sterilizationsislessclear.Oneplausibleexplanationforreductionsinthecostofabortionto
36TheonlyoutcomeforwhichtheconclusionsvarywhenindividualDHSsurveysareexcludedismalesterilization,whichsignificantlyincreaseswithanadditionalabortioncenterifweexcludethe1996survey,andsignificantlydecreasesifweexcludethe2011survey,whereasithasastatisticallyinsignificanteffectifweincludeallfoursurveysorexcludethe2001or2006surveys.WethereforeconcludefromtheresultsinTable7thatthereisnorobustevidenceofachangeinmalesterilization,asinthemainanalysis.37WealsorepeatedtheanalysisexcludingthecapitalKathmandu,whichhasthelargestnumberofabortionfacilitiesofalldistricts.Theestimatedoddsratiosareverysimilartothoseobtainedwiththewholesample,butestimatesbecomemuchlesspreciselyestimatedduetothelossinvariationinourabortionsupplyvariable,andthereforemostoddsratiosbecomestatisticallyinsignificant.Fullresultsareavailableonrequest.
26
affecttemporarycontraceptionbutnotsterilizationcanbeunderstoodbyreturningtoour
conceptualframeworkinSection4.Re‐arrangingInequality(1)bydividingeachsideby1
andallowingformorethanonetypeofcontraceptivemethoddenotedbym,womaniwill
choose the contraceptivemethodwith the lowest perceived ratio of cost to success rate
( aslongasthevalueofthisratioislessthanmin , .Ifchangesinabortionsupply
onlyaffectthedecisionsofwomenforwhomtheperceivedratioofcosttosuccess( is
higher for sterilization than for temporary methods, the relevant trade‐off is between
temporarymethodsandnocontraception.Thiscouldbethecaseifwomenwhofaceahigh
costofhavinganabortion(regardlessofwhetherornotitislegallyandsafelyprovided–
duetomoralconsiderationsorhightransportcosts,forexample)werealsomorelikelyto
havealowerperceivedcost‐to‐successrateofsterilizationrelativetotemporarymethods.
Ifthiswerethecase,thenlegalabortioncenterswouldnotdecrease sufficientlytoaffect
min , forwomenwhowouldchoosesterilizationovertemporarymethods.
8. Conclusion
Althoughscholarshavewrittenextensivelyabouttherelationshipbetweentheuseof
moderncontraceptivesandabortion–andhavegenerallyreportedaninverserelationship
betweenthetwo,thecausalrelationshipbetweenthetwohasbeendifficulttoisolate.Akey
difficultyisthefactthatreproductivehealthprogramsoftenaltermanyaspectsofservice
deliverysimultaneously–expandingthereproductivehealthworkforce,bundlingtogether
new contraception and abortion services, and improving the quality of health services
generally.EventhefamousMatlabfamilyplanningexperimentintegratedtheprovisionof

27
moderncontraceptiveswiththeprovisionofbothabortionservices(menstrualregulation)
and antenatal and child health services, making it difficult to isolate the effect of
contraceptivesupply.
Thisstudyanalyzestherelationshipbetweencontraceptiveuseandabortionduring
therapidscale‐upoflegalabortionservicesacrossNepal–a“naturalexperiment”inwhich
abortion services were not accompanied by changes in contraceptive supply or other
potentiallyconfoundinghealthpolicychanges. UsingfourDHSsurveywaves(twobefore
andtwoafterlegalization)andanofficialcensusofalllegalabortioncenters,wefindthat
eachlegalabortioncenterinawoman’s(couple’s)districtofresidencewasassociatedwith
a2.6%reductionintheoddsofusinganycontraceptive.Forthemeannumberofcenters
perdistrictinthepost‐legalizationperiod(four),ourestimatesimplythatNepal’sexpansion
of abortion supply was associated with a 2 percentage point decline in the use of
contraceptives – a 6% decrease relative to the pre‐legalization mean. 38 This decline in
contraceptiveuseoccursamongmodern(butnottraditional)methodsandisdrivenmost
robustlybychangesintheuseofreversiblemodernmethods(primarilyinjectionsand,toa
lesser extent, condoms and the pill). Our direct assessments of the “parallel trends”
assumption underlying our difference‐in‐difference study design also strengthens the
interpretation that our estimates provide evidence of true substitution between use of
moderncontraceptivesandabortion.
We emphasize two important policy implications of our findings. First, policies
aiming to reduce the full cost of abortion (financial, social, psychological, etc.) shouldbe
38Theeffectestimatedhereisbasedonthevariationovertimeinlocalavailabilityofabortioncentersacrossdistricts.Itmaythereforebeanunderestimateofthetruesubstitutioneffectbecausewomenmaybeabletotraveltoabortioncenterslocatedoutsidetheirdistrict(e.g.,inthecapitalKathmandu).

28
accompaniedbymeasurestoalsoreducethefullcostofcontraceptiveuse(broadlydefined
to includesocialandpsychologicalcosts) ifpolicymakerswishtoavoidsubstitutionfrom
contraceptiontoabortion.Second,indemonstratingatrade‐offbetweencontraceptionand
abortion,ourfindingsalsosuggestthatreductionsinthecostofcontraceptionmayreduce
theincidenceofabortion.
29
References
Alkema,Leontine,Kantorova,Vladimira,Menozzi,Clare&Biddlecom,Ann(2013)National,
regional,andglobalratesandtrendsincontraceptiveprevalenceandunmetneedforfamily
planning between 1990 and 2015: a systematic and comprehensive analysis.TheLancet
381(9878):1642‐1652.
Ananat,ElizabethOltmans&Hungerman,DanielM.2012.ThePowerofthePillfortheNext
Generation: Oral Contraception's Effects on Fertility, Abortion, and Maternal and Child
Characteristics.TheReviewofEconomicsandStatistics94(1):37‐51.
Bankole,Akinrinola,Singh,SusheelaandHaas,Malcolm(1999).Characteristicsofwomen
who obtain induced abortion: A worldwide review. International Family Planning
Perspectives,25(2):68‐77.
Beckett,M.,DaVanzo,J.,Sastry,N.,Panis,C.&Peterson,C.(2001)Thequalityofretrospective
data:anexaminationoflong‐termrecallinadevelopingcountry.JournalofHumanResources
36(3):593‐625.
Bendavid, Eran and Avila, Patrick andMiller, Grant (2011) United States aid policy and
induced abortion in sub‐Saharan Africa. Bulletin of the World Health Organization
89(12):873‐880c.
BongaartsJ,andWestoffCF(2000).Thepotentialroleofcontraceptioninreducingabortion.
StudFamPlann31:193‐202.
CentralBureauofStatistics (2004),NepalLivingStandardsSurvey2003/2004Statistical
ReportVolumeTwo.

30
Das,Jishnu,Hammer,Jeff.andSánchez‐Paramo,Carolina(2012)TheImpactofRecallPeriods
on Reported Morbidity and Health Seeking Behavior. Journal ofDevelopment Economics
98(1):76‐88.
Dilley, James W andWoods, William J and McFarland, William (1997) Are advances in
treatmentchangingviewsabouthigh‐risksex?NewEnglandJournalofMedicine337(7):501‐
502.
DemographicandHealthSurveysofNepal(1996,2001,2006,2011).ElectronicDatabases.
MeasureDHS.
Durrance,ChristinePiette(2013)TheEffectsofIncreasedAccesstotheMorning‐AfterPill
onAbortionandSTDRates.EconomicInquiry51(3):1682‐1695.
Frejka,Tomas(1983)InducedAbortionand.Fertility:AQuarter.CenturyofExperiencein
EasternEurope.PopulationandDevelopmentReview9(3):494‐520.
Gerdts, Caitlin andVohra,Divya andAhern, Jennifer (2013)MeasuringUnsafeAbortion‐
RelatedMortality:ASystematicReviewoftheExistingMethods.PloSone8(1):e53346.
Glasier,Anna,KarenFairjurst,SalleyWyke,SueZiebland,PeterSeaman,JeremyWalker,and
Fatim Lkha (2004). Advanced Provision of Emergency Contraception Does not Reduce
AbortionRates.Contraception69,361‐366.
Guttmacher Institute (2013). Facts on Induced Abortion in the United States.
http://www.guttmacher.org/pubs/fb_induced_abortion.pdf.Lastaccessed01/11/2013.
Hausman, J.A. , Abrevaya, Jason, and Scott‐Morton, F.M. (1998) Misclassification of the
dependentvariableinadiscrete‐responsesetting.JournalofEconometrics87(2):239‐269.
Henshaw, StanleyK., Singh, Susheela andHaas, Taylor (1999) The incidence of abortion
worldwide.InternationalFamilyPlanningPerspectives25(1):44‐48.
31
Jones,Kelly(2011).EvaluatingtheMexicoCityPolicy:HowUSforeignpolicyaffectsfertility
outcomesandchildhealthinGhana.IFPRIDiscussionPaper01147.
Jones,E.F.,&Forrest,J.D.(1992).UnderreportingofabortioninsurveysofUSwomen:1976
to1988.Demography,29(1),113‐126.
Kane,ThomasJ.andStaiger,Douglas(1996).TeenMotherhoodandAbortionAccess,The
QuarterlyJournalofEconomics;111(2):467‐506.
Khan,KhalidSandWojdyla,DanielandSay,LaleandGülmezoglu,AMetinandVanLook,
PaulFA(2006)WHOanalysisofcausesofmaternaldeath:asystematicreview.Thelancet
367(9516):1066‐1074.
Marston, Cicely and Cleland, John (2003) Relationships between Contraception and
Abortion:Areviewoftheevidence.InternationalFamilyPlanningPerspectives29(1):6‐13.
Mauldin,W.ParkerandSegal,SheldonJ. (1988)PrevalenceofContraceptiveUse:Trends
andIssues.StudiesinFamilyPlanning19(6):335‐353.
Miller,GrantandSingerBabiarz,Kim.2013.FamilyPlanning:ProgramEffects,inIrmaElo
and Andrew Foster (eds.), International Encyclopedia of Social and Behavioral Sciences,
ElsevierPress,Forthcoming.
MOHP&CREHPA(2006),NepalComprehensiveAbortionCare(CAC):NationalFacility‐
basedAbortionStudy2006,MinistryofHealthandPopulation(Nepal),CenterforResearch
onEnvironment,HealthandPopulationActivities(Nepal)andIPAS(USA).
MinistryofHealthandPopulation(MOHP)[Nepal],NewERA,andMacroInternationalInc.
(2007).NepalDemographicandHealthSurvey2006.Kathmandu,Nepal:MinistryofHealth
andPopulation,NewERA,andMacroInternationalInc.

32
Ministry of Health and Population (MOHP) [Nepal], New ERA, and ICF International Inc.
(2012)NepalDemographicandHealthSurvey2011.Kathmandu,Nepal:MinistryofHealth
andPopulation,NewERA,andICFInternational,Calverton,Maryland.
MOHP,WHO&CREHPA(2006),UnsafeAbortion:NepalCountryProfile,MinistryofHealth
andPopulation(Nepal),WorldHealthOrganization(NewDelhi)andCenterforResearch
onEnvironment,HealthandPopulationActivities(Nepal).
Noble,JeanneandPotts,Malcolm(1996).ThefertilitytransitioninCubaandtheFederal
RepublicofKorea:theimpactoforganisedfamilyplanning.JournalofBiosocialScience,
28:211‐225.
Peltzman,Sam(1975)Theeffectsofautomobilesafetyregulation.TheJournalofPolitical
Economy83(4):677‐725.
Peltzman,Sam(2011)OffsettingBehavior,MedicalBreakthroughs,andBreakdowns.Journal
ofHumanCapital5(3):302‐341.
Phillips, J. F., Simmons, R., Chakraborty, J., & Chowdhury, A. I. (1984). Integrating health
services into an MCH‐FP program: lessons from Matlab, Bangladesh.Studies in family
planning,15(4),153‐161.
Pop‐Eleches, C. (2010) The Supply of Birth Control Methods, Education, and Fertility:
EvidencefromRomania.JournalofHumanResources45(4):971‐997.
Population Reference Bureau (2008). World Population Data Sheet.
http://www.prb.org/pdf08/08WPDS_Eng.pdf.Lastaccessed01/11/2013.
Rahman,Mizanur,DaVanzo,Julie,andRazzaque,Abdur(2001)Dobetterfamilyplanning
servicesreduceabortioninBangladesh?TheLancet358(9287):1051–1056.
33
Ramaseshan,G. (1997)Womenimprisonedforabortion inNepal:Reportofa forumAsia
fact‐findingmission.ReproductiveHealthMatters5(10):133‐138.
Samandari,G.,Wolf,M.,Basnett,I.,Hyman,A.,Andersen,K.(2012)Implementationoflegal
abortioninNepal:amodelforrapidscale‐upofhigh‐qualitycare.Reprod.Health9(7):1–11.
Sedgh,Gilda,Singh,Susheela,Åhman,Elisabeth,Henshaw,StanleyK,&IqbalHShah(2007).
Inducedabortion:estimatedratesandtrendsworldwide.TheLancet370(9595):1338‐1345.
Sedgh,Gilda,Singh,SusheelaHenshaw,StanleyK,&Bankole,Akinrinola(2011).Legal
AbortionWorldwidein2008:LevelsandRecentTrends.InternationalPerspectiveson
SexualandReproductiveHealth37(2):84–94.
Sedgh,Gilda,Singh,Susheela,Shah,IqbalH,Åhman,Elisabeth,Henshaw,StanleyK,&
Bankole,Akinrinola(2012)Inducedabortion:incidenceandtrendsworldwidefrom1995
to2008.TheLancet379(9816):625‐63.
Shrestha,D.R,Shrestha,A.andGhimire,J.(2012).Emergingchallengesinfamilyplanning
programmeinNepal.JournalofNepalHealthResearchCouncil,10(21):108‐112.
Strickler,JenniferA. ,Magnani,RobertJ. ,McCann,H.Gilman,Brown,LisanneF.andRice,
JanetC.(1997)TheReliabilityofReportingofContraceptiveBehaviorinDHSCalendarData:
EvidencefromMorocco.StudiesinFamilyPlanning28(1):44‐53.
TechnicalCommitteeforImplementationofComprehensiveAbortionCare(TCIC)(2010).
LegalAbortionCentersDatabase(March2004‐February2010).
UnitedNations(2004)LevelsandTrendsofContraceptiveUseasAssessedin2002.United
Nations:NewYork.
Valente, Christine (2014) Access to abortion, investments in neonatal health, and sex‐
selection:EvidencefromNepal.JournalofDevelopmentEconomics107:225‐243.
34
Westoff,CharlesF.,DeLung,JaneS.,Goldman,NoreenandDarrochForrest,Jacqueline(1981)
AbortionsPreventablebyContraceptivePractice.FamilyPlanningPerspectives13(5):218‐
223.
Westoff, Charles F., Almaz T. Sharmanov, Jeremiah Sullivan, and Trevor Croft. (1998).
ReplacementofAbortionbyContraceptioninThreeCentralAsianRepublics.Calverton,MD:
ThePolicyProjectandMacroInternational.
Westoff,CharlesF.(2000).TheSubstitutionofContraceptionforAbortioninKazakhstanin
the1990s.DHSAnalyticalStudiesNo.1.Calverton,Maryland:ORCMacro.
WorldDevelopmentIndicators(2014).Totalfertilityratesinvariouscountries,1960‐2011.
Online Database. TheWorld Bank. http://databank.worldbank.org/data/home.aspx. Last
accessed21January2014.
WHO (2010) Unsafe abortion: global and regional estimates of the incidence of unsafe
abortionandassociatedmortalityin2008.WHO,Geneva,Switzerland.
35
Figures
Figure1:AbortionandContraceptionTrendsinNepalPanel1
Panel2
Sources:Panel1:abortion:Sedghetal.(2011);contraception:1970‐1987fromMauldinandSegal(1988), 1990‐1995 from United Nations (2004), and 1996‐2011 from MOHP (2012). Panel 2:authors’ calculations based on Demographic and Health Surveys of Nepal (1996‐2011)(contraception) and Technical Committee for Implementation of Comprehensive Abortion Care(2010)(abortionfacilities).

36
Figure2:District‐levelCoverageofAbortionCenters
Source:TechnicalCommitteeforImplementationofComprehensiveAbortionCare(2010).
37
TablesTable1–SummaryStatistics
(1) (2) (3) (4) (5)
DHS 1996 DHS 2001 DHS 2006 DHS 2011 Pooled
mean sd N mean sd N mean sd N mean sd N mean sd N
Panel A: abortion supply and contraception Number of Legal Abortion Centers in District of Residencea 0.00 0.000 7496 0.00 0.000 7842 2.72 2.997 7776 6.34 6.702 8984 2.45 4.689 32098
Any Method 0.29 7496 0.41 7842 0.50 7776 0.51 8984 0.43 32098
Modern Method 0.27 7496 0.37 7842 0.46 7776 0.44 8984 0.39 32098
Traditional Method 0.02 7496 0.04 7842 0.04 7776 0.07 8984 0.04 32098
Modern Method Other than Sterilization 0.09 7496 0.14 7842 0.20 7776 0.21 8984 0.16 32098
Female Sterilization 0.13 7496 0.16 7842 0.19 7776 0.16 8984 0.16 32098
Male Sterilization 0.06 7496 0.07 7842 0.07 7776 0.08 8984 0.07 32098
Ever Had an Abortion 0.02 7496 0.02 7842 0.04 7776 0.08 8984 0.04 32098
Share of Pregnancies Abortedb 0.00 0.041 6798 0.00 0.039 7138 0.01 0.074 7204 0.03 0.111 8228 0.01 0.075 29368
Panel B: Fertility preferences
Ideal Number of Children 2.95 1.059 7337 2.65 0.879 7712 2.43 0.830 7762 2.24 0.788 8960 2.55 0.927 31771
Panel C: Covariates
Urban 0.08 7496 0.10 7842 0.15 7776 0.13 8984 0.12 32098
Age 30.58 8.968 7496 30.95 8.897 7842 31.47 8.923 7776 31.68 8.600 8984 31.20 8.847 32098
Hindu (excluded category) 0.87 7496 0.85 7842 0.86 7776 0.85 8984 0.86 32098
Buddhist 0.06 7496 0.07 7842 0.08 7776 0.08 8984 0.07 32098
Muslim 0.05 7496 0.05 7842 0.04 7776 0.04 8984 0.04 32098
Christian 0.00 7496 0.01 7842 0.01 7776 0.02 8984 0.01 32098
Other Religion 0.01 7496 0.02 7842 0.01 7776 0.01 8984 0.02 32098
No education (excluded cat.) 0.80 7496 0.72 7842 0.63 7776 0.49 8984 0.65 32098
Primary Education 0.11 7496 0.15 7842 0.17 7776 0.19 8984 0.15 32098
Secondary Education 0.08 7496 0.12 7842 0.18 7776 0.27 8984 0.16 32098
Tertiary Education 0.01 7496 0.01 7842 0.02 7776 0.06 8984 0.03 32098
Statisticsweightedusingsurveyweights.Sampleofmarriedwomenaged15‐49whousuallyresideinthehousehold.Source:Authors'calculationsusingDemographicandHealthSurveysof Nepal (1996‐2011) for all variables except number of legal abortion centers in district of residence, which is based on data from Technical Committee for Implementation ofComprehensiveAbortionCare(2010).aNumberoflegalabortioncentersindistrictofresidencecodedusingabortionfacilitydataasofFebruary2010forthe2011DHSwavesincetheadministrativerecordswehavehadaccesstoendinFebruary2010.bDefinedonlyforwomenwithatleastonepregnancy
38
Table2–EffectofAvailabilityofLegalAbortionCentersonContraceptiveUseandSelf‐ReportedAbortions (1) (2) (3) (4) (5) (6) (7) (8)
Any Method Modern Method
Female Sterilization
Male Sterilization
Modern Method Other
than Sterilization
Traditional Method
Ever Had an Abortion
Share of all pregnancies aborted
Number of Abortion Centers in District
0.974*** 0.974*** 0.978** 0.999 0.976*** 0.992 1.013* 0.002***
(0.0065) (0.0072) (0.0109) (0.0106) (0.0041) (0.0071) (0.0080) (0.0002)
DHS 2001 1.759*** 1.678*** 1.339*** 1.184 1.886*** 1.552*** 0.879 ‐0.002**
(0.1112) (0.0977) (0.0817) (0.1226) (0.1452) (0.2408) (0.1302) (0.0007)
DHS 2006 2.343*** 2.293*** 1.699*** 1.105 2.681*** 1.421** 1.900*** 0.000
(0.2003) (0.1962) (0.2224) (0.1670) (0.2289) (0.2276) (0.3310) (0.0017)
DHS 2011 2.656*** 2.410*** 1.591*** 1.289 2.987*** 2.099*** 3.216*** 0.007***
(0.2303) (0.2249) (0.2330) (0.2110) (0.3140) (0.3676) (0.5636) (0.0025)
District Dummies Included?
Yes Yes Yes Yes Yes Yes Yes Yes
Maternal characteristics included?
Yes Yes Yes Yes Yes Yes Yes Yes
Observations 32098 32098 31620 32078 32098 31657 31371 29368
No. of districts 75 75 72 74 75 70 70 75
(Pseudo) R‐squared 0.1102 0.1014 0.1982 0.1604 0.0971 0.0818 0.1327 0.0626
Mean value of dependent variable
0.431 0.388 0.158 0.068 0.163 0.044 0.043 0.015
Maternal characteristics: urban residence, age, religion dummies (Hindu (omitted), Buddhist, Muslim, Christian or Other), education dummies (no education(omitted),primaryeducation,secondaryeducation,tertiaryeducation).Columns(1)to(7)reportoddsratiosfromalogitmodel.Column(8)presentscoefficientsfromalinearregressionincludingaconstant(coefficientnotreportedhere).District‐correlatedrobuststandarderrorsinparentheses.Regressionsweightedusingsurveyweights.Sampleofmarriedwomenaged15‐49whousuallyresideinthehousehold.Excludedreligiouscategoryis"Hindu",excludededucationcategoryis"Noeducation". Someobservationsaredropped inColumns (3), (4), (6),and(7)due to lackofvariation in thevalueof thedependentvariablewithindistrict.ObservationsforwomenwhohaveneverhadanypregnancyaredroppedinColumn(8)sincetheshareofabortedpregnanciesisnotdefinedforthesewomen.Source:Authors'calculationsusingDemographicandHealthSurveysofNepal(1996‐2011)andTechnicalCommitteeforImplementationofComprehensiveAbortionCare(2010).***p<0.01,**p<0.05,*p<0.10.
39
Table3‐ControlExperiment1:EffectofAvailabilityofFutureLegalAbortionCentersBeforeAnyCenterOpened (1) (2) (3) (4) (5) (6) (7) (8)
Any Method Modern Method
Female Sterilization
Male Sterilization
Modern Method Other
than Sterilization
Traditional Method
Ever Had an Abortion
Share of all pregnancies aborted
Number of Abortion Centers at Next Survey Date
1.011 1.004 1.000 0.928 0.994 0.986 0.967 ‐0.000
(0.0386) (0.0341) (0.0220) (0.0453) (0.0190) (0.0355) (0.0243) (0.0002)
Observations 15338 15338 14324 15338 15310 14601 12994 13936
No. of districts 72 72 61 72 71 63 50 72
(Pseudo) R‐squared
0.1243 0.1219 0.1698 0.1640 0.1198 0.0800 0.0749 0.0207
Mean value of dependent variable
0.352 0.319 0.149 0.062 0.116 0.034 0.019 0.005
Outputomittedforthefollowingvariables:threedummyvariableforDHS2001,districtfixed‐effects,andcontrolsforurbanlocation,ageatinterview,religion,andeducationsummarizedinTable1PanelC.Columns(1)to(7)reportoddsratiosfromalogitmodel.Column(8)presentscoefficientsfromalinearregressionincludingaconstant(coefficientnotreportedhere).District‐correlatedrobuststandarderrorsinparentheses.Regressionsweightedusingsurveyweights.Sampleofmarriedwomenaged15‐49whousuallyresideinthehousehold.SomeobservationsaredroppedinColumns(3),(4),(6),and(7)duetolackofvariationinthevalueofthedependentvariablewithindistrict.ObservationsforwomenwhohaveneverhadanypregnancyaredroppedinColumn(8)sincetheshareofabortedpregnanciesisnotdefinedforthesewomen.Source:Authors'calculationsusingDemographicandHealthSurveysofNepal(42)–DHS1996and2001only–andTechnicalCommitteeforImplementationofComprehensiveAbortionCare(2010).***p<0.01,**p<0.05,*p<0.10.
40
Table4‐ControlExperiment2:EffectofAvailabilityofFutureLegalAbortionCentersOverandAbovetheEffectofCurrentAvailability (1) (2) (3) (4) (5) (6) (7) (8)
Any Method Modern Method
Female Sterilization
Male Sterilization
Modern Method Other
than Sterilization
Traditional Method
Ever Had an Abortion
Share of all pregnancies aborted
Number of Abortion Centers
0.928*** 0.921*** 0.909** 0.969 0.966 1.043 1.057 0.001
(0.0257) (0.0291) (0.0374) (0.0783) (0.0223) (0.0469) (0.0609) (0.0009)
Number of Abortion Centers at Next Survey Date
1.020 1.022 1.035 0.970 1.001 0.982 0.958* ‐0.000
(0.0173) (0.0177) (0.0235) (0.0372) (0.0104) (0.0231) (0.0245) (0.0004)
Observations 23114 23114 22343 23063 23114 22730 22260 21140
No. of districts 75 75 68 73 75 69 66 75
(Pseudo) R‐squared 0.1215 0.1173 0.1971 0.1546 0.1144 0.0692 0.1003 0.0318
Mean value of dependent variable
0.400 0.366 0.161 0.063 0.146 0.035 0.026 0.008
Outputomittedforthefollowingvariables:twodummyvariablesforDHS2001and2006,districtfixed‐effects,andcontrolsforurbanlocation,ageatinterview, religion, and education summarized in Table 1 Panel C. Columns (1) to (7) report odds ratios from a logitmodel. Column (8) presentscoefficients from a linear regression including a constant (coefficient not reported here). District‐correlated robust standard errors in parentheses.Regressionsweightedusingsurveyweights.Sampleofmarriedwomenaged15‐49whousuallyresideinthehousehold.SomeobservationsaredroppedinColumns(3),(4),(6),and(7)duetolackofvariationinthevalueofthedependentvariablewithindistrict.ObservationsforwomenwhohaveneverhadanypregnancyaredroppedinColumn(8)sincetheshareofabortedpregnanciesisnotdefinedforthesewomen.Source:Authors'calculationsusingDemographicandHealthSurveysofNepal(42)–DHS1996,2001,and2006only–andTechnicalCommittee for ImplementationofComprehensiveAbortionCare(2010).***p<0.01,**p<0.05,*p<0.10.
41
Table5:RobustnessChecks (1) (2) (3) (4) (5) (6) (7) (8)
Any Method Modern Method
Female Sterilization
Male Sterilization
Modern Method Other
than Sterilization
Traditional Method
Ever Had an Abortion
Share of all pregnancies aborted
Panel A: Include further controls (see notes below table for details) Number of Abortion Centers
0.980*** 0.980*** 0.983* 1.001 0.981*** 0.996 1.014* 0.002***
(0.0055) (0.0062) (0.0100) (0.0089) (0.0041) (0.0074) (0.0073) (0.0002)
Observations 31762 31762 31288 31743 31762 31325 31045 29063
Panel B: Further controls + restrict sample to non‐sterilized couples as of March 2004 (results in Columns (3) and (4) restricted to DHS 2006 and 2011) Number of Abortion Centers
0.973*** 0.970*** 0.987 1.141* 0.977*** 0.994 1.011 0.002***
(0.0058) (0.0067) (0.0265) (0.0833) (0.0044) (0.0073) (0.0076) (0.0002)
Observations 25890 25890 12095 12026 25890 25517 25264 23214
Panel C: As Panel B + Scale number of abortion centers by district population Number of Abortion Centers
0.983 0.976* 1.001 1.063* 0.982** 1.007 1.012 0.001***
(0.0106) (0.0122) (0.0238) (0.0380) (0.0083) (0.0134) (0.0104) (0.0004)
Observations 25890 25890 12095 12026 25890 25517 25264 23214
Panel D: As Panel B + Allow for time trends to vary by district population Number of Abortion Centers
0.965*** 0.955** 0.991 1.102 0.979** 1.015 1.030** 0.002***
(0.0125) (0.0173) (0.0366) (0.0932) (0.0083) (0.0156) (0.0142) (0.0004)
Observations 25890 25890 12095 12026 25890 25517 25264 23214
42
Panel E: As Panel B + Allow time trends to vary by (13) region Number of Abortion Centers
0.965*** 0.960*** 0.941 1.142 0.971*** 1.009 1.018 0.002***
(0.0077) (0.0094) (0.0491) (0.1005) (0.0094) (0.0128) (0.0166) (0.0003)
Observations 25890 25890 12095 12026 25890 25517 24898 23214
Panel F: As Panel B + Allow time trends to differ in rural and urban areas Number of Abortion Centers
0.977*** 0.976*** 0.994 1.142 0.977*** 0.993 1.017** 0.001***
(0.0059) (0.0063) (0.0245) (0.0950) (0.0050) (0.0086) (0.0084) (0.0003)
Observations 25890 25890 12095 12026 25890 25517 25264
23214
Panel G: As Panel B + Allow time trends to differ by wealth quintile
Number of Abortion Centers
0.986** 0.986* 0.974 1.149* 0.984*** 0.994 1.011 0.001***
(0.0068) (0.0072) (0.0264) (0.0965) (0.0044) (0.0088) (0.0082) (0.0002)
Observations 25890 25890 12095 12026 25890 25517 25264 23214
Outputomittedforthefollowingvariables:threedummyvariablesforDHS2001,2006,and2011,districtfixed‐effects,andcontrolsforurbanlocation,ageat interview, religion, education, ideal number of children, control for the number of conflict casualties in the year preceding the survey (per districtpopulationasof1991,thelastpre‐conflictpopulationcensus),forwhetherornotthewomanreportshavingheardafamilyplanningmessageontheradiointhelastmonth,whethershewasvisitedbyafamilyplanningworkerintheprevious12months,whethershehasheardofAIDS,andfortheSESgrouptowhichshebelongs(asmeasuredbytheherquintileinthedistributionofhouseholdlivingstandard).Columns(1)to(7)reportoddsratiosfromalogitmodel.Column(8)presentscoefficientsfromalinearregressionincludingaconstant(coefficientnotreportedhere).District‐correlatedrobuststandarderrorsinparentheses.Regressionsweightedusingsurveyweights.Sampleofmarriedwomenaged15‐49whousuallyresideinthehousehold.SomeobservationsaredroppedinColumns(3),(4),(6),and(7)duetolackofvariationinthevalueofthedependentvariablewithindistrict.InPanelsBtoF,Columns(3)and(4)excludeobservationsfor1996and2001,sincebydefinitionthereisnovariationinsterilizationstatusinthesesurveysafterdroppingthosesterilizedbeforeMarch2004.ObservationsforwomenwhohaveneverhadanypregnancyaredroppedinColumn(8)sincetheshareofabortedpregnanciesisnotdefinedforthesewomen.Source:Authors'calculationsusingDemographicandHealthSurveysofNepal(42)–DHS1996and2001only–andTechnicalCommitteeforImplementationofComprehensiveAbortionCare(2010).***p<0.01,**p<0.05,*p<0.10.
43
Table6:FurtherRobustnessChecks (1) (2) (3) (4) (5) (6) (7) (8)
Any Method Modern Method
Female Sterilization
Male Sterilization
Modern Method Other
than Sterilization
Traditional Method
Ever Had an Abortion
Share of all pregnancies aborted
Panel A: Unweighted regressions Number of Abortion Centers
0.968*** 0.967*** 0.979** 0.987 0.972*** 0.995 1.003 0.002***
(0.0058) (0.0063) (0.0096) (0.0109) (0.0043) (0.0067) (0.0067) (0.0002)
Observations 32098 32098 31620 32078 32098 31657 31371 29368
Panel B: Linear probability model Number of Abortion Centers
‐0.005*** ‐0.005*** ‐0.002** 0.000 ‐0.003*** ‐0.000 0.003***
(0.0016) (0.0018) (0.0011) (0.0008) (0.0007) (0.0004) (0.0006)
Observations 32098 32098 32098 32098 32098 32098 32098
Outputomittedforthefollowingvariables:threedummyvariablesforDHS2001,2006and2011,districtfixed‐effects,andcontrolsforurbanlocation,ageatinterview,religion,andeducationsummarizedinTable1PanelC.SeealsoNotesunderTable2.***p<0.01,**p<0.05,*p<0.10.
44
Table7:RobustnessoftheEffectofAbortionCenterstoExcludingOneSurveyataTime (1) (2) (3) (4) (5) (6) (7) (8)
Excluded data
Any Method Modern Method
Female Sterilization
Male Sterilization
Modern Method Other
than Sterilization
Traditional Method
Ever Had an Abortion
Share of all pregnancies aborted
DHS 1996 0.975*** 0.977*** 0.980* 1.024* 0.977*** 0.993 1.024** 0.002***
(0.0065) (0.0073) (0.0120) (0.0140) (0.0048) (0.0093) (0.0097) (0.0002)
24602 24602 24228 24202 24602 24238 24056 22570
DHS 2001 0.976** 0.976** 0.979* 0.993 0.977*** 0.990 1.013* 0.002***
(0.0110) (0.0107) (0.0122) (0.0158) (0.0055) (0.0076) (0.0080) (0.0002)
24256 24256 23846 23902 24256 23529 23684 22230
DHS 2006 0.974*** 0.974*** 0.981* 0.996 0.974*** 0.990 1.004 0.002***
(0.0070) (0.0077) (0.0109) (0.0111) (0.0043) (0.0074) (0.0079) (0.0002)
24322 24322 23858 24322 24322 23810 23422 22164
DHS 2011 0.957*** 0.951*** 0.953* 0.924*** 0.968*** 1.016 0.986 0.000
(0.0123) (0.0144) (0.0239) (0.0245) (0.0104) (0.0212) (0.0260) (0.0005)
23114 23114 22343 23063 23114 22730 22260 21140
Outputomittedforthefollowingvariables:twodummyvariablesindicatingDHSwaves,districtfixed‐effects,andcontrolsforurbanlocation,ageatinterview,religion,andeducationsummarizedinTable1PanelC.SeealsoNotesunderTable2.***p<0.01,**p<0.05,*p<0.10.
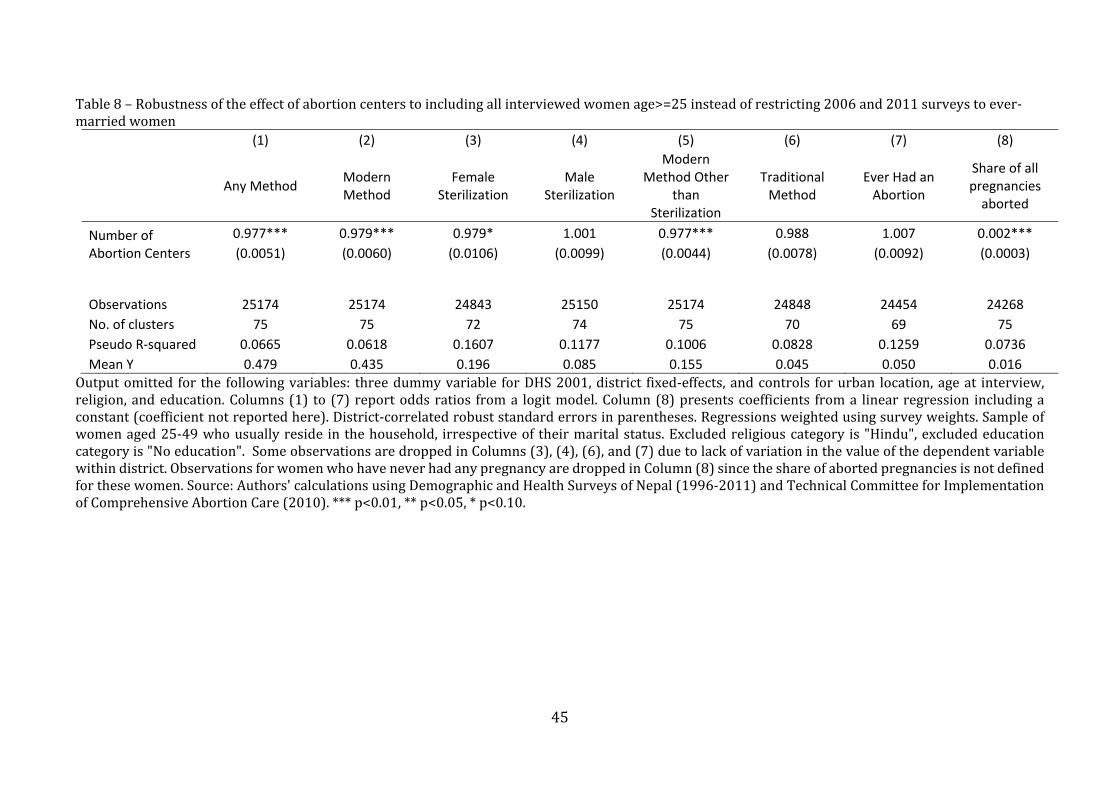
45
Table8–Robustnessoftheeffectofabortioncenterstoincludingallinterviewedwomenage>=25insteadofrestricting2006and2011surveystoever‐marriedwomen (1) (2) (3) (4) (5) (6) (7) (8)
Any Method Modern Method
Female Sterilization
Male Sterilization
Modern Method Other
than Sterilization
Traditional Method
Ever Had an Abortion
Share of all pregnancies aborted
Number of Abortion Centers
0.977*** 0.979*** 0.979* 1.001 0.977*** 0.988 1.007 0.002***
(0.0051) (0.0060) (0.0106) (0.0099) (0.0044) (0.0078) (0.0092) (0.0003)
Observations 25174 25174 24843 25150 25174 24848 24454 24268
No. of clusters 75 75 72 74 75 70 69 75
Pseudo R‐squared 0.0665 0.0618 0.1607 0.1177 0.1006 0.0828 0.1259 0.0736
Mean Y 0.479 0.435 0.196 0.085 0.155 0.045 0.050 0.016
Outputomitted for the followingvariables: threedummyvariable forDHS2001,district fixed‐effects,andcontrols forurban location,ageat interview,religion,andeducation.Columns(1) to (7)reportoddsratios froma logitmodel.Column(8)presentscoefficients froma linearregression includingaconstant(coefficientnotreportedhere).District‐correlatedrobuststandarderrorsinparentheses.Regressionsweightedusingsurveyweights.Sampleofwomenaged25‐49whousuallyreside inthehousehold, irrespectiveof theirmaritalstatus.Excludedreligiouscategory is"Hindu",excludededucationcategoryis"Noeducation".SomeobservationsaredroppedinColumns(3),(4),(6),and(7)duetolackofvariationinthevalueofthedependentvariablewithindistrict.ObservationsforwomenwhohaveneverhadanypregnancyaredroppedinColumn(8)sincetheshareofabortedpregnanciesisnotdefinedforthesewomen.Source:Authors'calculationsusingDemographicandHealthSurveysofNepal(1996‐2011)andTechnicalCommitteeforImplementationofComprehensiveAbortionCare(2010).***p<0.01,**p<0.05,*p<0.10.
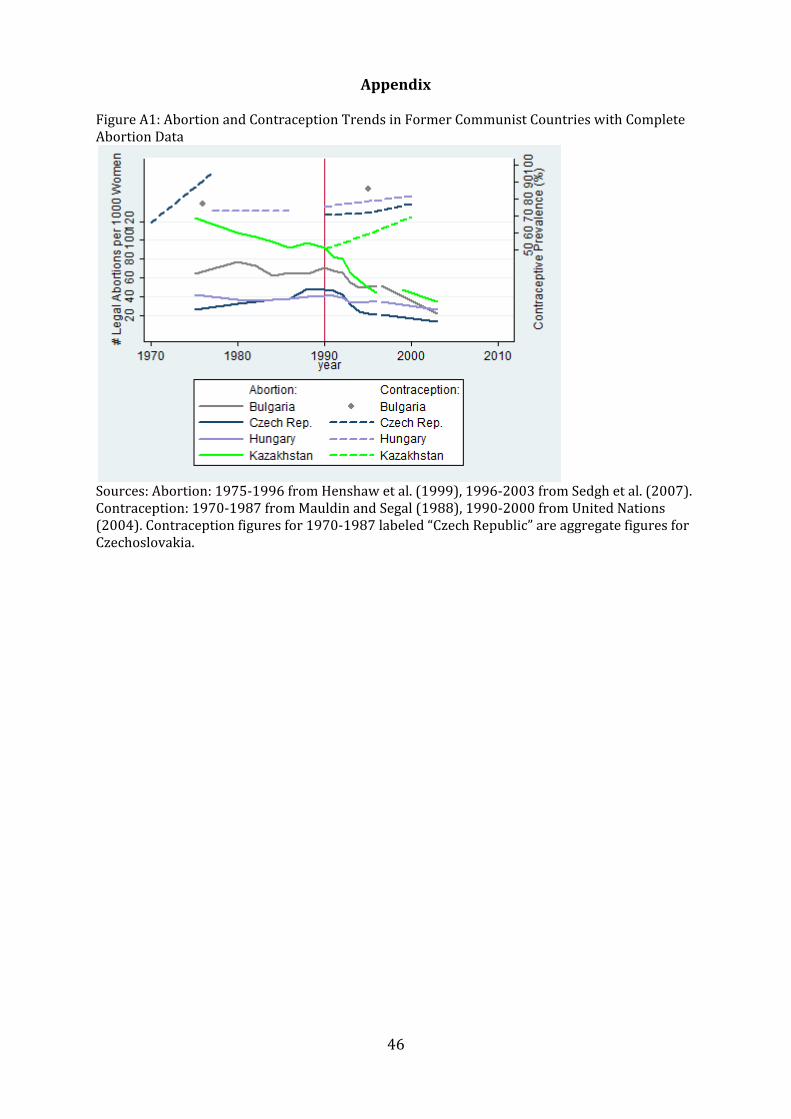
46
AppendixFigureA1:AbortionandContraceptionTrendsinFormerCommunistCountrieswithCompleteAbortionData
Sources:Abortion:1975‐1996fromHenshawetal.(1999),1996‐2003fromSedghetal.(2007).Contraception:1970‐1987fromMauldinandSegal(1988),1990‐2000fromUnitedNations(2004).Contraceptionfiguresfor1970‐1987labeled“CzechRepublic”areaggregatefiguresforCzechoslovakia.

47
FigureA2:AnalyticalFramework
C=1
1 nopregnancy A=0
pregnancy A=0 C=0 A=1
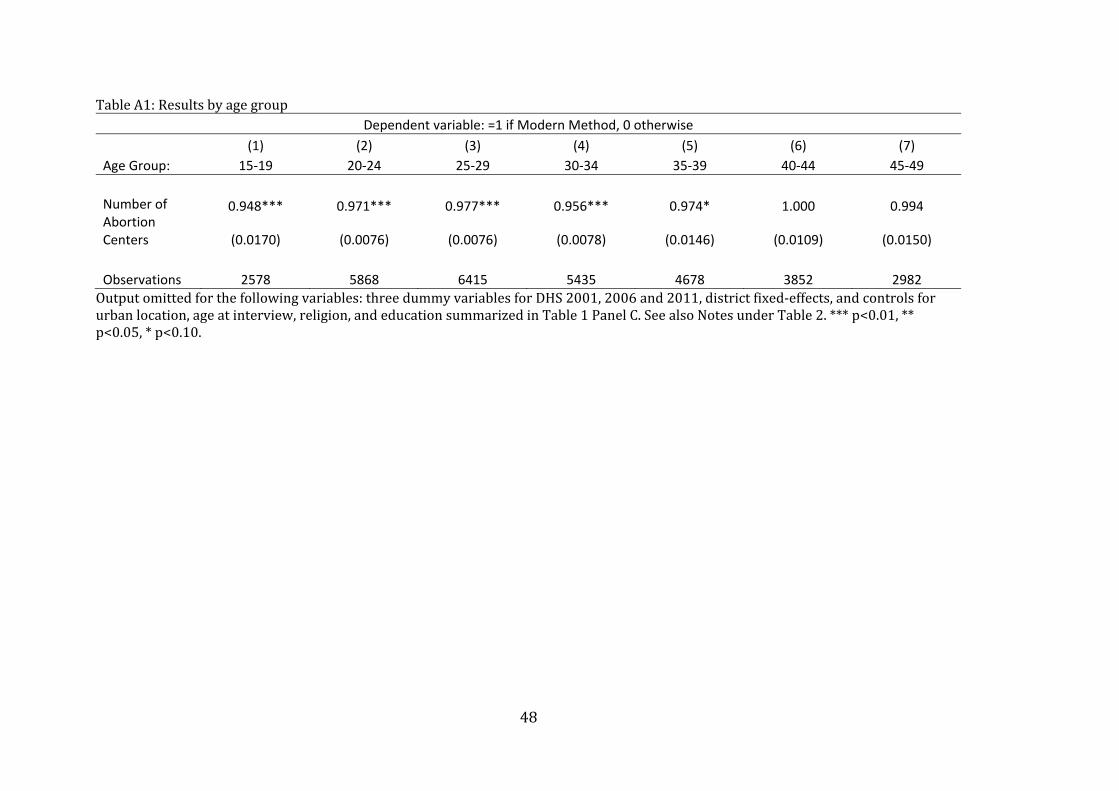
48
TableA1:ResultsbyagegroupDependent variable: =1 if Modern Method, 0 otherwise
(1) (2) (3) (4) (5) (6) (7)
Age Group: 15‐19 20‐24 25‐29 30‐34 35‐39 40‐44 45‐49
Number of Abortion Centers
0.948*** 0.971*** 0.977*** 0.956*** 0.974* 1.000 0.994
(0.0170) (0.0076) (0.0076) (0.0078) (0.0146) (0.0109) (0.0150)
Observations 2578 5868 6415 5435 4678 3852 2982
Outputomittedforthefollowingvariables:threedummyvariablesforDHS2001,2006and2011,districtfixed‐effects,andcontrolsforurbanlocation,ageatinterview,religion,andeducationsummarizedinTable1PanelC.SeealsoNotesunderTable2.***p<0.01,**p<0.05,*p<0.10.
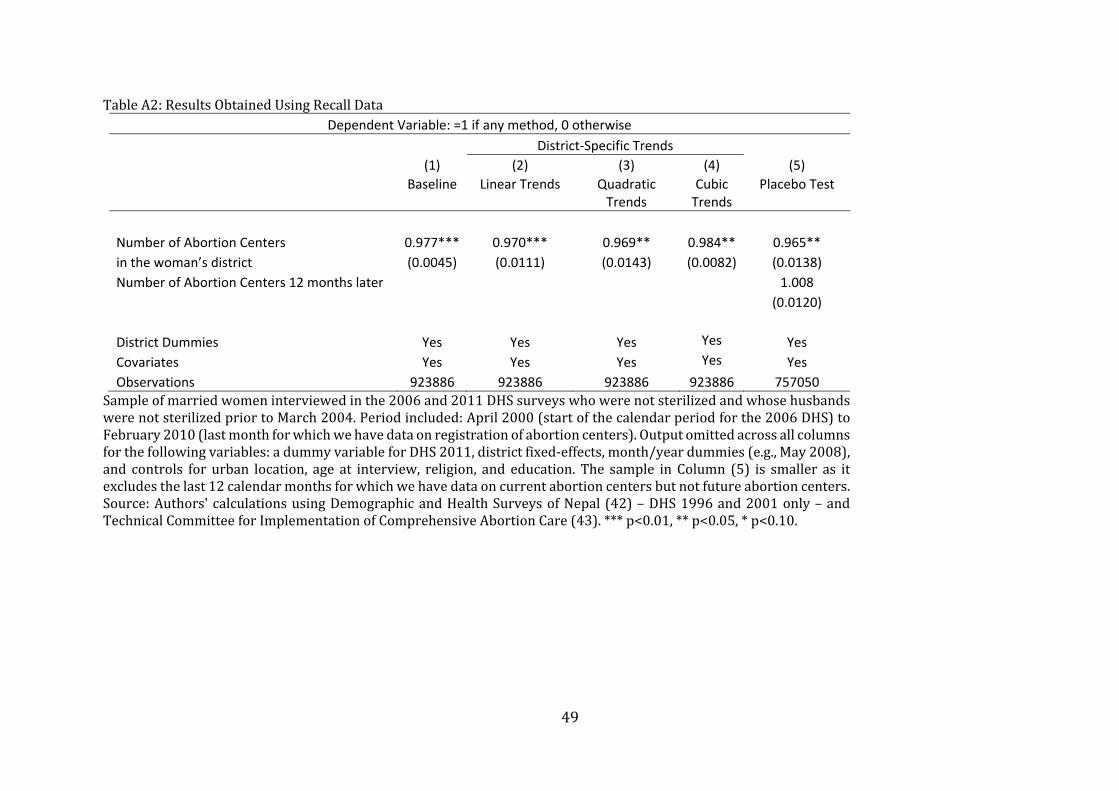
49
TableA2:ResultsObtainedUsingRecallDataDependent Variable: =1 if any method, 0 otherwise
District‐Specific Trends
(1) (2) (3) (4) (5)
Baseline Linear Trends Quadratic
Trends Cubic Trends
Placebo Test
Number of Abortion Centers
0.977*** 0.970*** 0.969** 0.984** 0.965**
in the woman’s district (0.0045) (0.0111) (0.0143) (0.0082) (0.0138)
Number of Abortion Centers 12 months later 1.008
(0.0120)
District Dummies Yes Yes Yes Yes Yes
Covariates Yes Yes Yes Yes Yes
Observations 923886 923886 923886 923886 757050
Sampleofmarriedwomeninterviewedinthe2006and2011DHSsurveyswhowerenotsterilizedandwhosehusbandswerenotsterilizedpriortoMarch2004.Periodincluded:April2000(startofthecalendarperiodforthe2006DHS)toFebruary2010(lastmonthforwhichwehavedataonregistrationofabortioncenters).Outputomittedacrossallcolumnsforthefollowingvariables:adummyvariableforDHS2011,districtfixed‐effects,month/yeardummies(e.g.,May2008),and controls for urban location, age at interview, religion, and education. The sample in Column (5) is smaller as itexcludesthelast12calendarmonthsforwhichwehavedataoncurrentabortioncentersbutnotfutureabortioncenters.Source:Authors'calculationsusingDemographicandHealthSurveysofNepal(42)–DHS1996and2001only–andTechnicalCommitteeforImplementationofComprehensiveAbortionCare(43).***p<0.01,**p<0.05,*p<0.10.