Embed Size (px)
Citation preview

1
Abortion morbidity and post abortion care in India:
Evidence from 2 Community based studies
Shelley Saha Sinha
Centre for Health and Social Justice
Date of last revision: (September, 2010)
DO NOT CITE WITHOUT AUTHORS’ PERMISSION
Prepared for the Seminar on The Health, Social and Economic
Consequences of Unsafe Abortion, organized by the IUSSP Scientific Panel
on Abortion and Population Council’s Mexico office, San Juan del Rio,
Mexico, 10-12 November 2010
.

2
Abstract:
Induced abortion is legal in India since 1971, but it has not translated into improved access
to safe abortion care. Between 2001-2003, 10526 ever-married women were interviewed in
Maharashtra and Tamil Nadu to enquire into abortion rate, care and cost under the aegis of
Assessment Abortion Project-India. The paper analyses the data from 762 abortions, of
which 339 are induced. The study found that as many as 79% of the abortions developed
complications. Rural women had more per abortion morbidity than women from the urban
areas. High gestational age was found to be associated with high abortion morbidity.
Excessive bleeding was found to be the most common post-abortion complaints. D&C was
the most common line of treatment by formal providers and therefore resulted in high
abortion care cost. In large number of induced abortions women were not asked for follow
up visits. Consent from family members in contravention to the MTP Act was sought by
providers in more than four-fifth of the induced abortions. Significant proportion of women
did not receive support from their family. The paper at the end suggests key policy changes
for improving abortion care services for women in the country.
3
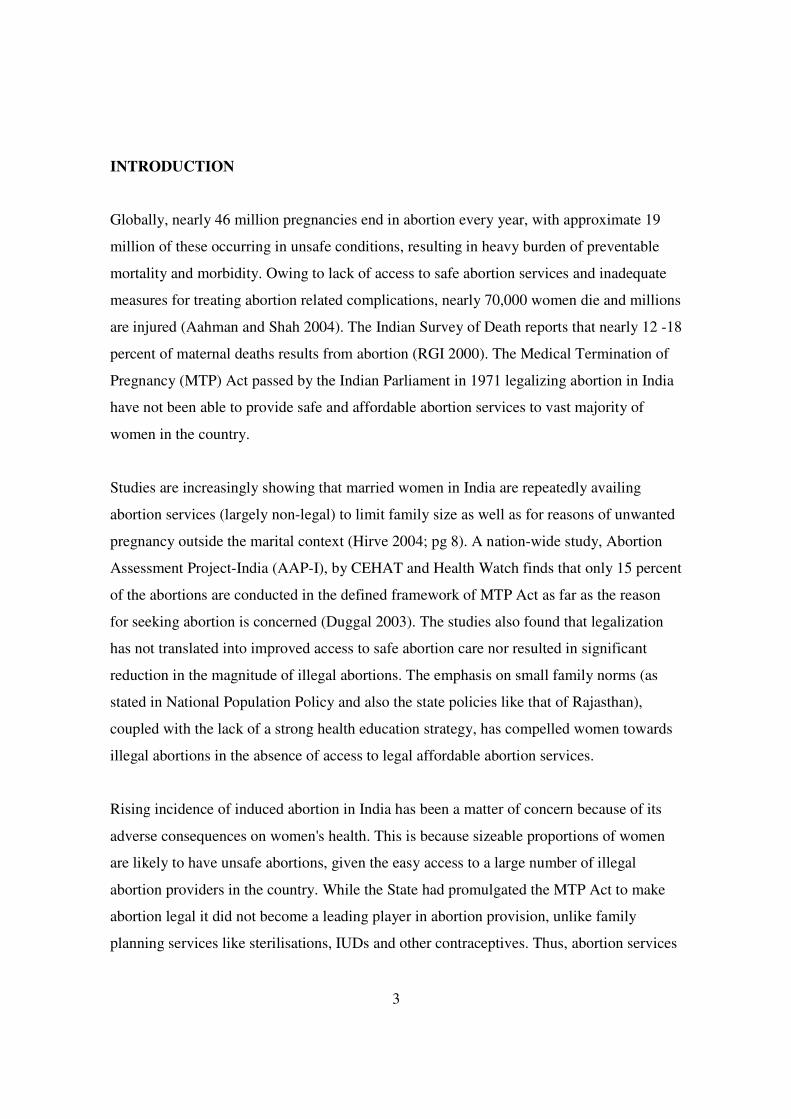
INTRODUCTION
Globally, nearly 46 million pregnancies end in abortion every year, with approximate 19
million of these occurring in unsafe conditions, resulting in heavy burden of preventable
mortality and morbidity. Owing to lack of access to safe abortion services and inadequate
measures for treating abortion related complications, nearly 70,000 women die and millions
are injured (Aahman and Shah 2004). The Indian Survey of Death reports that nearly 12 -18
percent of maternal deaths results from abortion (RGI 2000). The Medical Termination of
Pregnancy (MTP) Act passed by the Indian Parliament in 1971 legalizing abortion in India
have not been able to provide safe and affordable abortion services to vast majority of
women in the country.
Studies are increasingly showing that married women in India are repeatedly availing
abortion services (largely non-legal) to limit family size as well as for reasons of unwanted
pregnancy outside the marital context (Hirve 2004; pg 8). A nation-wide study, Abortion
Assessment Project-India (AAP-I), by CEHAT and Health Watch finds that only 15 percent
of the abortions are conducted in the defined framework of MTP Act as far as the reason
for seeking abortion is concerned (Duggal 2003). The studies also found that legalization
has not translated into improved access to safe abortion care nor resulted in significant
reduction in the magnitude of illegal abortions. The emphasis on small family norms (as
stated in National Population Policy and also the state policies like that of Rajasthan),
coupled with the lack of a strong health education strategy, has compelled women towards
illegal abortions in the absence of access to legal affordable abortion services.
Rising incidence of induced abortion in India has been a matter of concern because of its
adverse consequences on women's health. This is because sizeable proportions of women
are likely to have unsafe abortions, given the easy access to a large number of illegal
abortion providers in the country. While the State had promulgated the MTP Act to make
abortion legal it did not become a leading player in abortion provision, unlike family
planning services like sterilisations, IUDs and other contraceptives. Thus, abortion services
4
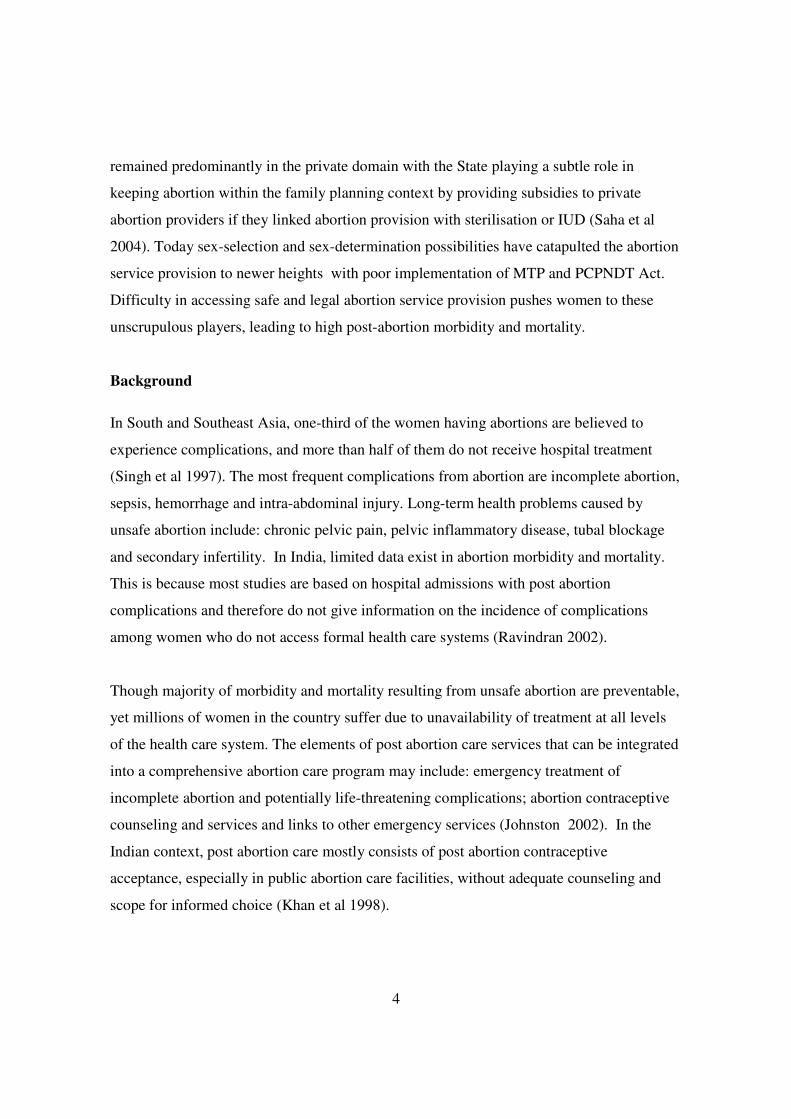
remained predominantly in the private domain with the State playing a subtle role in
keeping abortion within the family planning context by providing subsidies to private
abortion providers if they linked abortion provision with sterilisation or IUD (Saha et al
2004). Today sex-selection and sex-determination possibilities have catapulted the abortion
service provision to newer heights with poor implementation of MTP and PCPNDT Act.
Difficulty in accessing safe and legal abortion service provision pushes women to these
unscrupulous players, leading to high post-abortion morbidity and mortality.
Background
In South and Southeast Asia, one-third of the women having abortions are believed to
experience complications, and more than half of them do not receive hospital treatment
(Singh et al 1997). The most frequent complications from abortion are incomplete abortion,
sepsis, hemorrhage and intra-abdominal injury. Long-term health problems caused by
unsafe abortion include: chronic pelvic pain, pelvic inflammatory disease, tubal blockage
and secondary infertility. In India, limited data exist in abortion morbidity and mortality.
This is because most studies are based on hospital admissions with post abortion
complications and therefore do not give information on the incidence of complications
among women who do not access formal health care systems (Ravindran 2002).
Though majority of morbidity and mortality resulting from unsafe abortion are preventable,
yet millions of women in the country suffer due to unavailability of treatment at all levels
of the health care system. The elements of post abortion care services that can be integrated
into a comprehensive abortion care program may include: emergency treatment of
incomplete abortion and potentially life-threatening complications; abortion contraceptive
counseling and services and links to other emergency services (Johnston 2002). In the
Indian context, post abortion care mostly consists of post abortion contraceptive
acceptance, especially in public abortion care facilities, without adequate counseling and
scope for informed choice (Khan et al 1998).
5
Very little is known regarding care that a woman from India gets after she has had an
abortion, both natural and intentional, either from the health care setting or from the family.
Given this lack of information on various aspects of abortion, community based household
studies were undertaken in two states of Maharashtra and Tamil Nadu under the aegis of
Abortion Assessment Project-Indiai in 2001-02 to enquire into abortion rate, care and cost.
The study provided useful information for better program implementation and policy
making to facilitate women’s access to safe, legal and affordable abortion care services.
This paper addresses the information gap related to abortion morbidity and care and also
provides a better understanding in overcoming methodological issues related to self
reported abortion morbidity.
STUDY SETTING
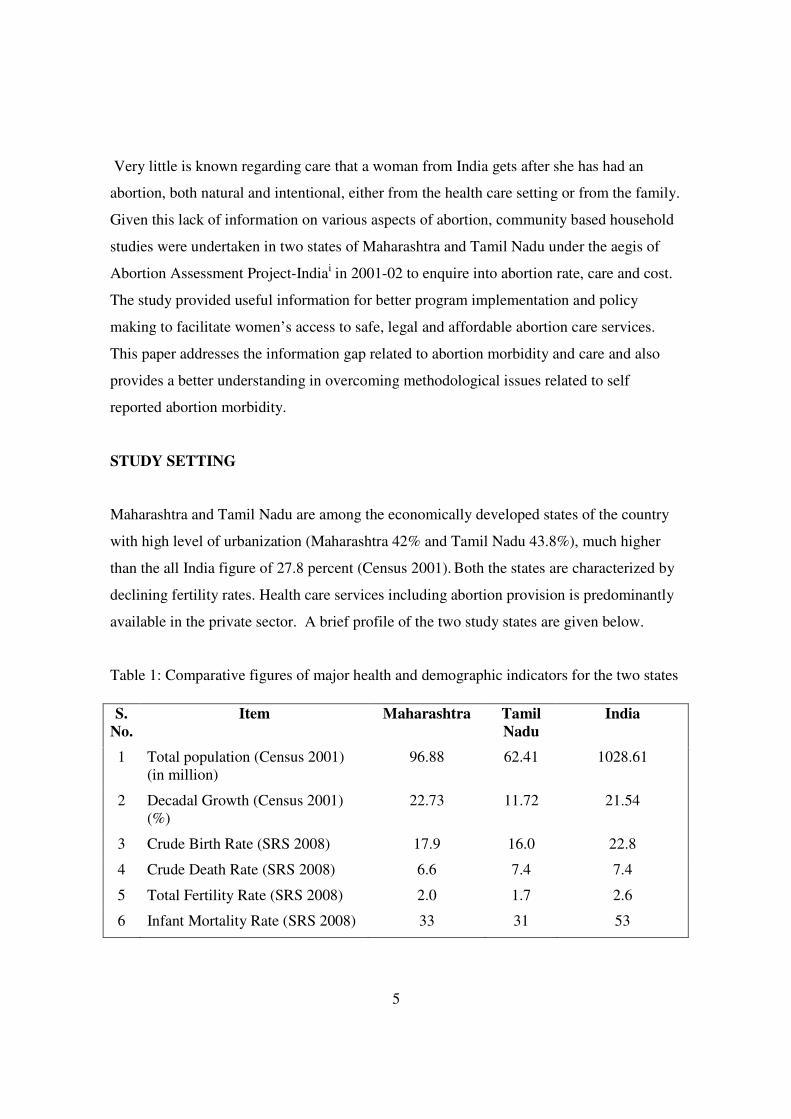
Maharashtra and Tamil Nadu are among the economically developed states of the country
with high level of urbanization (Maharashtra 42% and Tamil Nadu 43.8%), much higher
than the all India figure of 27.8 percent (Census 2001). Both the states are characterized by
declining fertility rates. Health care services including abortion provision is predominantly
available in the private sector. A brief profile of the two study states are given below.
Table 1: Comparative figures of major health and demographic indicators for the two states
S.
No.
Item Maharashtra Tamil
Nadu
India
1 Total population (Census 2001)
(in million)
96.88 62.41 1028.61
2 Decadal Growth (Census 2001)
(%)
22.73 11.72 21.54
3 Crude Birth Rate (SRS 2008) 17.9 16.0 22.8
4 Crude Death Rate (SRS 2008) 6.6 7.4 7.4
5 Total Fertility Rate (SRS 2008) 2.0 1.7 2.6
6 Infant Mortality Rate (SRS 2008) 33 31 53

6
METHODOLOGY
The aim of the two studies were to study pregnancy outcome with a focus on rate of
abortion, health care seeking behavior and the cost and care associated with abortions.
Given the fact that abortion is culturally stigmatized, special care was taken during
sampling and data collection to capture enough conceptions to arrive at estimates for
abortion incidences after accounting for underreporting and refusal to participate in the
study. The study was designed in such a way that the data besides giving state specific
incidences can also give rural-urban incidences of abortion separately.
A state representative sample was selected using a self-weighing systematic, multistage
stratified sampling procedure. With a 95 percent confidence interval and with an error of
less than 0.01, a sample size of 5000 and 5500 households were estimated respectively for
Maharashtra and Tamil Nadu. In Maharashtra data was collected from 103 rural primary
sampling units (PSU) and 100 urban PSUs. In Tamil Nadu, data was collected from 72
rural PSUs and 38 urban PSUs. From each PSU, households were selected using population
proportionate to sampling (PPS) method. All ever-married women in the age group of 13-
55 years in the sample from 10982 households (5405 from Maharashtra and 5487 from
Tamil Nadu) were contacted with woman’s questionnaire. After age verification, 10526
ever married women (5712 women from Maharashtra and 4814 from Tamil Nadu) in the
age group 15-54 (in case of Tamil Nadu it was 15-49) were identified as eligible women
7 Maternal Mortality Ratio (SRS
2004 - 2006)
130 111 254
8 Sex Ratio (Census 2001) 922 987 933
9 Population below Poverty line
(%)
25.02 21.12 26.10
10 Female Literacy Rate (Census
2001) (%)
67.0 64.4 53.7
Source http://mohfw.nic.in/NRHM/State%20Files/maharashtra.htm#sp
http://mohfw.nic.in/NRHM/State%20Files/tamilnadu.htm#sp
7
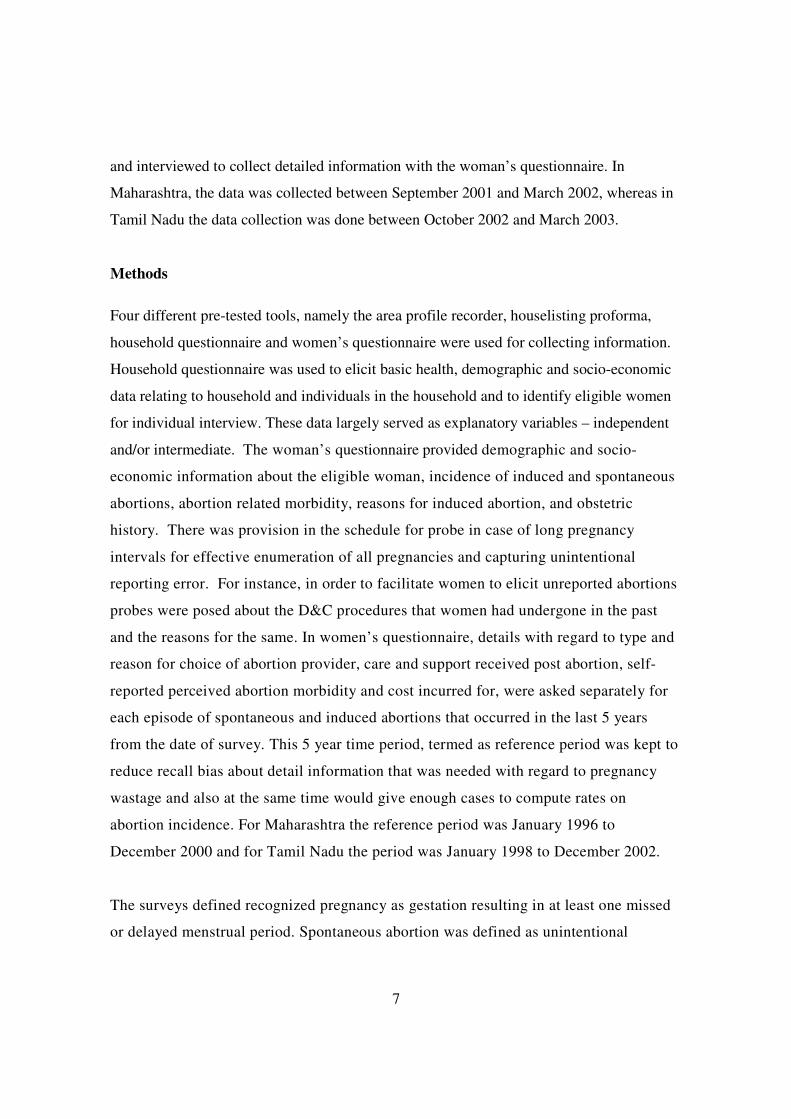
and interviewed to collect detailed information with the woman’s questionnaire. In
Maharashtra, the data was collected between September 2001 and March 2002, whereas in
Tamil Nadu the data collection was done between October 2002 and March 2003.
Methods
Four different pre-tested tools, namely the area profile recorder, houselisting proforma,
household questionnaire and women’s questionnaire were used for collecting information.
Household questionnaire was used to elicit basic health, demographic and socio-economic
data relating to household and individuals in the household and to identify eligible women
for individual interview. These data largely served as explanatory variables – independent
and/or intermediate. The woman’s questionnaire provided demographic and socio-
economic information about the eligible woman, incidence of induced and spontaneous
abortions, abortion related morbidity, reasons for induced abortion, and obstetric
history. There was provision in the schedule for probe in case of long pregnancy
intervals for effective enumeration of all pregnancies and capturing unintentional
reporting error. For instance, in order to facilitate women to elicit unreported abortions
probes were posed about the D&C procedures that women had undergone in the past
and the reasons for the same. In women’s questionnaire, details with regard to type and
reason for choice of abortion provider, care and support received post abortion, self-
reported perceived abortion morbidity and cost incurred for, were asked separately for
each episode of spontaneous and induced abortions that occurred in the last 5 years
from the date of survey. This 5 year time period, termed as reference period was kept to
reduce recall bias about detail information that was needed with regard to pregnancy
wastage and also at the same time would give enough cases to compute rates on
abortion incidence. For Maharashtra the reference period was January 1996 to
December 2000 and for Tamil Nadu the period was January 1998 to December 2002.
The surveys defined recognized pregnancy as gestation resulting in at least one missed
or delayed menstrual period. Spontaneous abortion was defined as unintentional

8
termination of pregnancy by 28th
week of gestation. Pregnancy wastage was classified
as induced abortion when there was intentional termination of pregnancy.
Abortion being a stigmatized issue, special care was taken to resolve various ethical
dilemmas and issues right from the stage of conceptualizing the study. All possible
efforts were made to ensure that even inadvertently ethical norms of social research are
not violated.ii Both the studies had institutional ethics committee who reviewed the
study at different stages.
Analysis
The two studies captured 2228 abortions (628 from Maharashtra and 1600 from Tamil
Nadu) from a total of 27,557 pregnancy outcomes (14448 from Maharashtra and 13109
from Tamil Nadu) from 10526 women interviewed. Of these 2228 abortions, 823 were
induced and the rest were spontaneous abortion. Though data from lifetime abortions were
used for calculating abortion rate and ratio, the care and cost information collected for
abortions occurring outside the reference period were not used for further analysis related
to care and cost.
This paper analyses data of 762 abortions, 339 induced and 423 spontaneous abortions that
took place during the reference period. In Maharashtra, there were 5 cases of pregnancy
wastage where there was difficulty in classifying it into a particular type of abortion but it
was decided to classify them as ‘possible induced abortion’. For the analysis, these cases
were included as ‘induced abortion’ as this being a community based study and one relied
on whatever was reported by research participants. The data was analyzed using SPSS
software and weights were applied during analysis. A standard of living index (SLI) was
computed taking into account various ownership of assets. The quartiles values were used
to decide the cut off points to categorize the households into – low, medium and high.
FINDINGS
9
The findings presented below are of the abortions during the reference period. The first
section presents in brief the incidence of both types of abortion which will help readers to
understand the basic trends in abortion incidence in the two study states. This is followed
by type of provider accessed for abortion. The third and fourth section provide information
on prevalence of post abortion morbidity and management of abortion. Last two sections
deals with issues specific to induced abortion and post abortion family support.
Abortion incidence
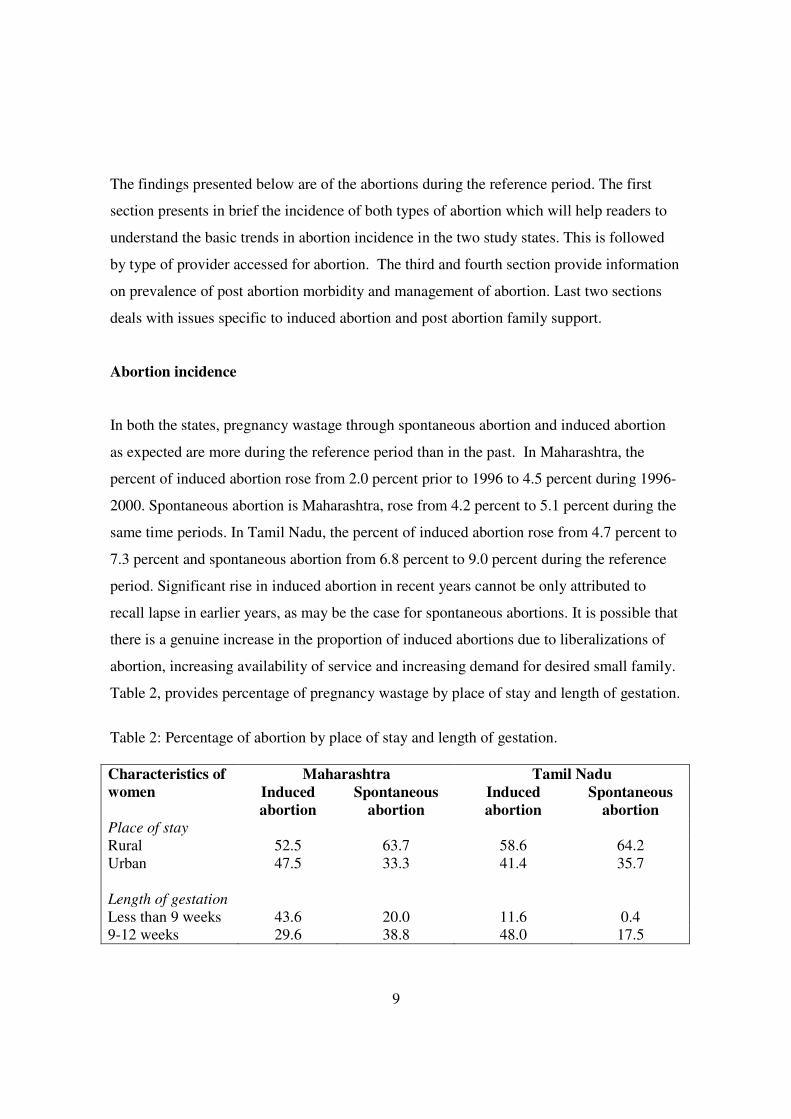
In both the states, pregnancy wastage through spontaneous abortion and induced abortion
as expected are more during the reference period than in the past. In Maharashtra, the
percent of induced abortion rose from 2.0 percent prior to 1996 to 4.5 percent during 1996-
2000. Spontaneous abortion is Maharashtra, rose from 4.2 percent to 5.1 percent during the
same time periods. In Tamil Nadu, the percent of induced abortion rose from 4.7 percent to
7.3 percent and spontaneous abortion from 6.8 percent to 9.0 percent during the reference
period. Significant rise in induced abortion in recent years cannot be only attributed to
recall lapse in earlier years, as may be the case for spontaneous abortions. It is possible that
there is a genuine increase in the proportion of induced abortions due to liberalizations of
abortion, increasing availability of service and increasing demand for desired small family.
Table 2, provides percentage of pregnancy wastage by place of stay and length of gestation.
Table 2: Percentage of abortion by place of stay and length of gestation.
Maharashtra Tamil Nadu Characteristics of
women Induced
abortion
Spontaneous
abortion
Induced
abortion
Spontaneous
abortion
Place of stay
Rural 52.5 63.7 58.6 64.2
Urban 47.5 33.3 41.4 35.7
Length of gestation
Less than 9 weeks 43.6 20.0 11.6 0.4
9-12 weeks 29.6 38.8 48.0 17.5
10
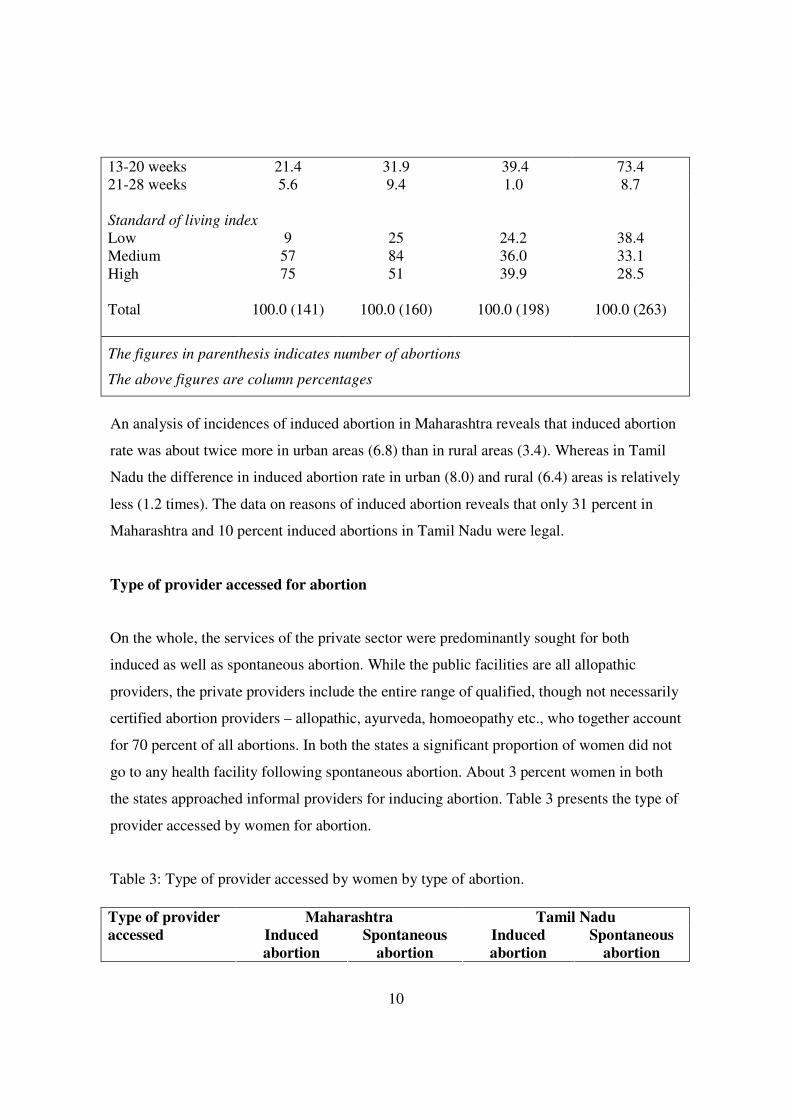
13-20 weeks 21.4 31.9 39.4 73.4
21-28 weeks 5.6 9.4 1.0 8.7
Standard of living index
Low 9 25 24.2 38.4
Medium 57 84 36.0 33.1
High 75 51 39.9 28.5
Total 100.0 (141) 100.0 (160) 100.0 (198) 100.0 (263)
The figures in parenthesis indicates number of abortions
The above figures are column percentages
An analysis of incidences of induced abortion in Maharashtra reveals that induced abortion
rate was about twice more in urban areas (6.8) than in rural areas (3.4). Whereas in Tamil
Nadu the difference in induced abortion rate in urban (8.0) and rural (6.4) areas is relatively
less (1.2 times). The data on reasons of induced abortion reveals that only 31 percent in
Maharashtra and 10 percent induced abortions in Tamil Nadu were legal.
Type of provider accessed for abortion
On the whole, the services of the private sector were predominantly sought for both
induced as well as spontaneous abortion. While the public facilities are all allopathic
providers, the private providers include the entire range of qualified, though not necessarily
certified abortion providers – allopathic, ayurveda, homoeopathy etc., who together account
for 70 percent of all abortions. In both the states a significant proportion of women did not
go to any health facility following spontaneous abortion. About 3 percent women in both
the states approached informal providers for inducing abortion. Table 3 presents the type of
provider accessed by women for abortion.
Table 3: Type of provider accessed by women by type of abortion.
Maharashtra Tamil Nadu Type of provider
accessed Induced
abortion
Spontaneous
abortion
Induced
abortion
Spontaneous
abortion
11
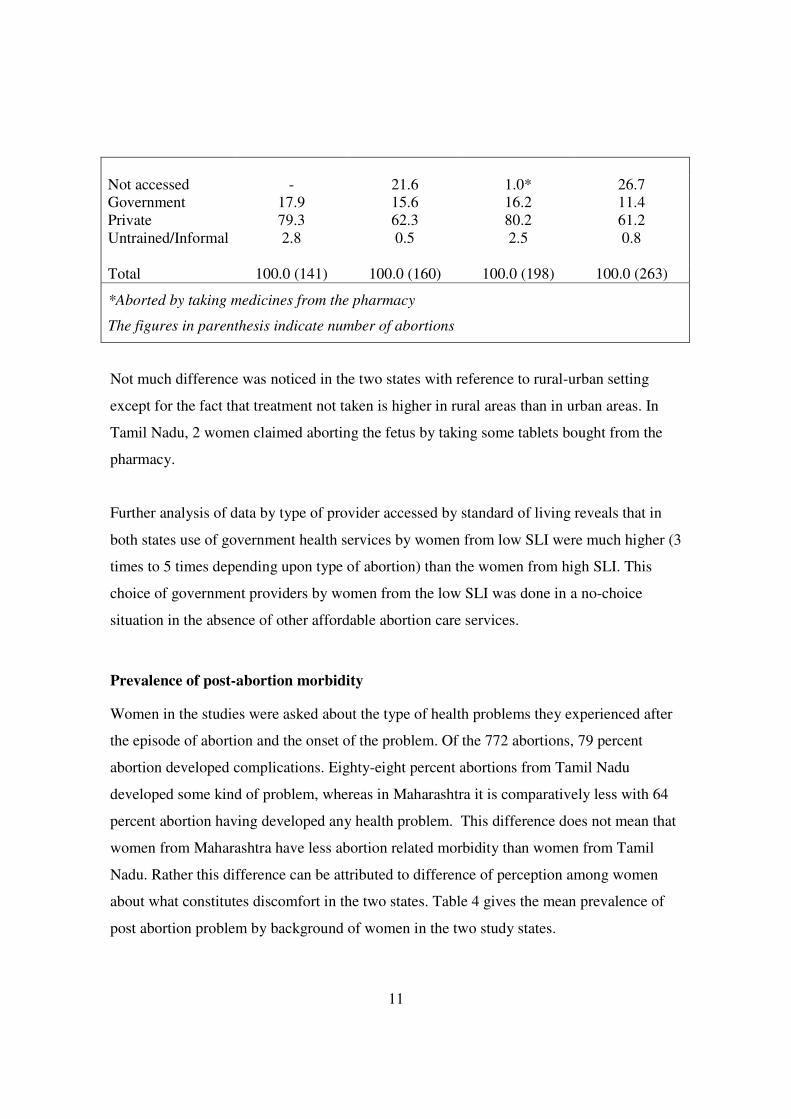
Not accessed - 21.6 1.0* 26.7
Government 17.9 15.6 16.2 11.4
Private 79.3 62.3 80.2 61.2
Untrained/Informal 2.8 0.5 2.5 0.8
Total 100.0 (141) 100.0 (160) 100.0 (198) 100.0 (263)
*Aborted by taking medicines from the pharmacy
The figures in parenthesis indicate number of abortions
Not much difference was noticed in the two states with reference to rural-urban setting
except for the fact that treatment not taken is higher in rural areas than in urban areas. In
Tamil Nadu, 2 women claimed aborting the fetus by taking some tablets bought from the
pharmacy.
Further analysis of data by type of provider accessed by standard of living reveals that in
both states use of government health services by women from low SLI were much higher (3
times to 5 times depending upon type of abortion) than the women from high SLI. This
choice of government providers by women from the low SLI was done in a no-choice
situation in the absence of other affordable abortion care services.
Prevalence of post-abortion morbidity
Women in the studies were asked about the type of health problems they experienced after
the episode of abortion and the onset of the problem. Of the 772 abortions, 79 percent
abortion developed complications. Eighty-eight percent abortions from Tamil Nadu
developed some kind of problem, whereas in Maharashtra it is comparatively less with 64
percent abortion having developed any health problem. This difference does not mean that
women from Maharashtra have less abortion related morbidity than women from Tamil
Nadu. Rather this difference can be attributed to difference of perception among women
about what constitutes discomfort in the two states. Table 4 gives the mean prevalence of
post abortion problem by background of women in the two study states.

12
Table 4: Mean prevalence of post-abortion problem by selected characteristic of women
Maharashtra Tamil Nadu Characteristic of
women Induced
abortion
Spontaneous
abortion
Induced
abortion
Spontaneous
abortion
Place of residence
Rural 1.95 2.79 3.93 3.34
Urban 1.12 1.06 1.27 1.9
Age at abortion
Less than 20 1.94 2.73 3.00 3.10
20-24 1.50 2.05 2.45 1.94
25-29 1.72 1.09 2.22 2.01
30+ 1.04 1.16 2.73 2.79
Length of gestation
8 weeks 1.36 2.29 1.60 2.31
9-12 weeks 1.60 1.85 2.42 2.54
13-20 weeks 2.0 2.31 3.15 2.23
21-28 weeks 0.86 2.40 2.73 2.79
Pregnancy order
1 0.86 2.31 2.72 2.54
2 1.81 2.32 1.97 1.99
3-4 1.53 1.83 2.60 2.98
5+ 1.38 1.70 3.11 2.40
Asset index
Low 2.23 2.71 2.73 2.98
Medium 1.41 2.04 2.61 2.60
High 1.62 1.86 2.50 1.62
Type of health care provider
Treatment not
taken/Self
NA 0.8 0.0 0.9
Government 1.38 2.38 2.54 2.25
Private 1.51 2.35 2.71 2.32
Untrained 2.31 3.00 3.30 4.7
Total 1.54 (141) 2.13 (160) 2.60 (198) 2.46 (263)
The figures in parenthesis indicate number of abortions.
13
As evident from table 4, rural women faced more problems per abortion than women
from the urban areas in both the states for both types of abortion. Though no direct
association could be observed between age at abortion and number of post-abortion
problems reported by women, yet one could see that women who were less than 20
years and above 30, reported more number of problems per abortion than women in
their 20s. Clearly there is association between gestational age and chance of post-
abortion complication. The incidence of post-abortion complication was more among
women who had an abortion after 13 weeks. This association was more pronounced
among women who had an induced abortion.
No systemic relationship could be found between standard of living and pregnancy
order to the incidence of post-abortions problems reported by women. For that matter
there was no difference in the incidence of complication following spontaneous
abortion between public or private health care provider who had been approached by
woman for checkup. The incidence of post-abortion complications was less among
those who did not seek medical help soon after spontaneous abortion compared to those
who sought medical service. This does not mean that medical assistance is responsible
for post-abortion complications. But it is selectivity problem that those who had some
severe complication resorted to medical help. Another important finding which has
implication for quality of care is in case of induced abortion, women who went to the
government providers reported more incidence of post abortion problem than those who
went to the private providers. As expected, women who went to the untrained providers
reported significantly more incidence of post-abortion morbidity, with as many as 5
health problems per women in Tamil Nadu having spontaneous abortions.
As states earlier post-abortion problem can occur at different time periods, the data on
morbidity was further analyzed by type of symptoms reported by women at different time
periods. As retrospective self-reported survey data does not allow classification of
symptoms to a particular illness, therefore the data here is presented in terms of
sufferings/problems that women have reported.
14
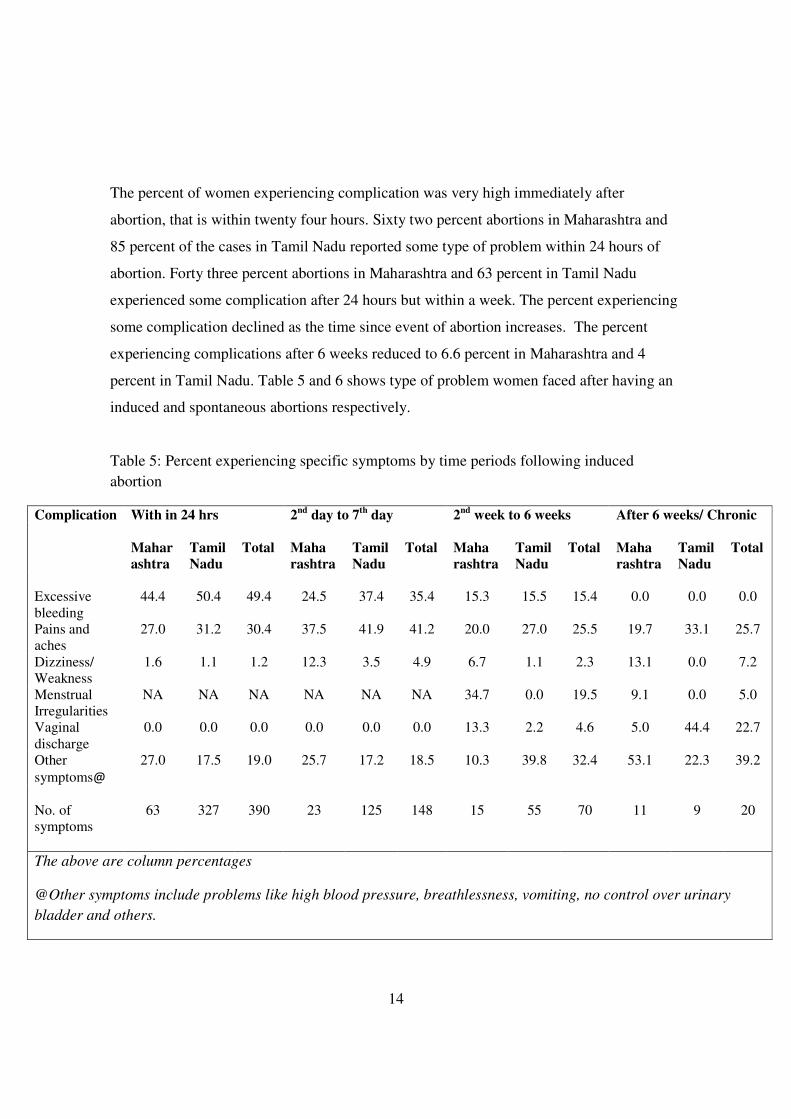
The percent of women experiencing complication was very high immediately after
abortion, that is within twenty four hours. Sixty two percent abortions in Maharashtra and
85 percent of the cases in Tamil Nadu reported some type of problem within 24 hours of
abortion. Forty three percent abortions in Maharashtra and 63 percent in Tamil Nadu
experienced some complication after 24 hours but within a week. The percent experiencing
some complication declined as the time since event of abortion increases. The percent
experiencing complications after 6 weeks reduced to 6.6 percent in Maharashtra and 4
percent in Tamil Nadu. Table 5 and 6 shows type of problem women faced after having an
induced and spontaneous abortions respectively.
Table 5: Percent experiencing specific symptoms by time periods following induced
abortion
With in 24 hrs 2nd
day to 7th
day 2nd
week to 6 weeks After 6 weeks/ Chronic
Complication
Mahar
ashtra
Tamil
Nadu
Total Maha
rashtra
Tamil
Nadu
Total Maha
rashtra
Tamil
Nadu
Total Maha
rashtra
Tamil
Nadu
Total
Excessive
bleeding
44.4 50.4 49.4 24.5 37.4 35.4 15.3 15.5 15.4 0.0 0.0 0.0
Pains and
aches
27.0 31.2 30.4 37.5 41.9 41.2 20.0 27.0 25.5 19.7 33.1 25.7
Dizziness/
Weakness
1.6 1.1 1.2 12.3 3.5 4.9 6.7 1.1 2.3 13.1 0.0 7.2
Menstrual
Irregularities
NA NA NA NA NA NA 34.7 0.0 19.5 9.1 0.0 5.0
Vaginal
discharge
0.0 0.0 0.0 0.0 0.0 0.0 13.3 2.2 4.6 5.0 44.4 22.7
Other
symptoms@
27.0 17.5 19.0 25.7 17.2 18.5 10.3 39.8 32.4 53.1 22.3 39.2
No. of
symptoms
63 327 390 23 125 148 15 55 70 11 9 20
The above are column percentages
@Other symptoms include problems like high blood pressure, breathlessness, vomiting, no control over urinary
bladder and others.
15
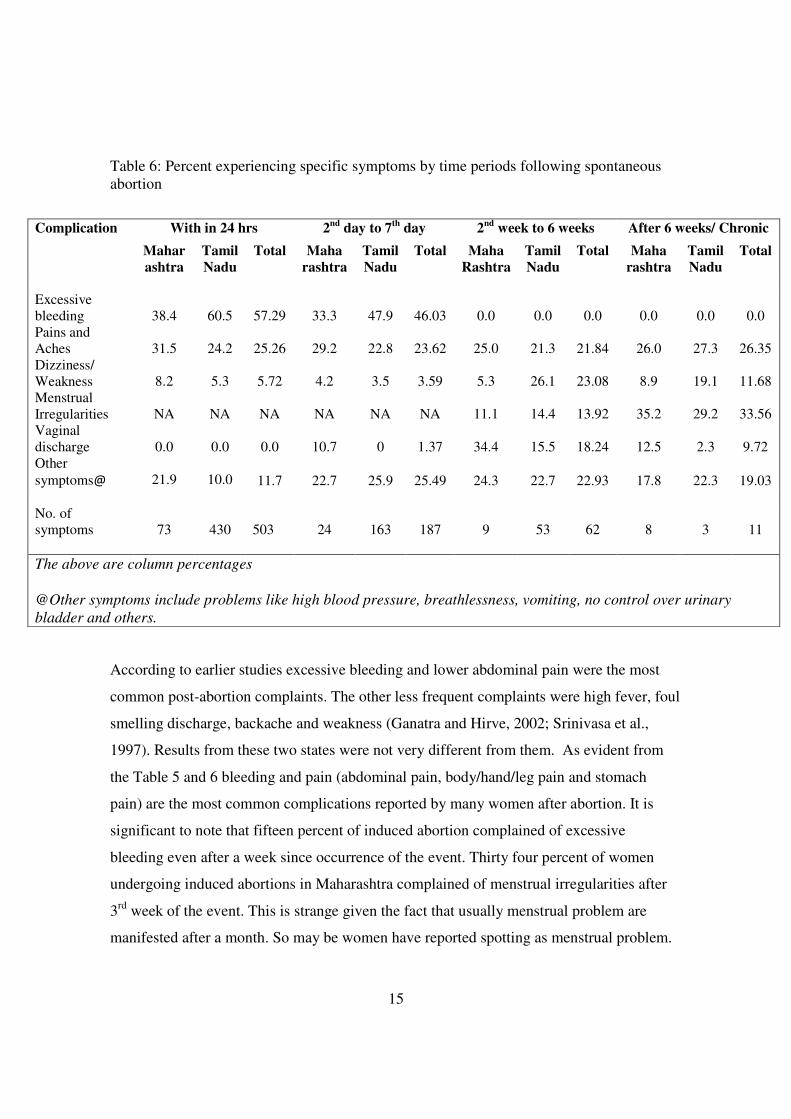
Table 6: Percent experiencing specific symptoms by time periods following spontaneous
abortion
According to earlier studies excessive bleeding and lower abdominal pain were the most
common post-abortion complaints. The other less frequent complaints were high fever, foul
smelling discharge, backache and weakness (Ganatra and Hirve, 2002; Srinivasa et al.,
1997). Results from these two states were not very different from them. As evident from
the Table 5 and 6 bleeding and pain (abdominal pain, body/hand/leg pain and stomach
pain) are the most common complications reported by many women after abortion. It is
significant to note that fifteen percent of induced abortion complained of excessive
bleeding even after a week since occurrence of the event. Thirty four percent of women
undergoing induced abortions in Maharashtra complained of menstrual irregularities after
3rd
week of the event. This is strange given the fact that usually menstrual problem are
manifested after a month. So may be women have reported spotting as menstrual problem.
With in 24 hrs 2nd
day to 7th
day 2nd
week to 6 weeks After 6 weeks/ Chronic Complication
Mahar
ashtra
Tamil
Nadu
Total Maha
rashtra
Tamil
Nadu
Total Maha
Rashtra
Tamil
Nadu
Total Maha
rashtra
Tamil
Nadu
Total
Excessive
bleeding
38.4
60.5
57.29
33.3
47.9
46.03
0.0
0.0
0.0
0.0
0.0
0.0
Pains and
Aches 31.5 24.2 25.26 29.2 22.8 23.62 25.0 21.3 21.84 26.0 27.3 26.35
Dizziness/
Weakness 8.2 5.3 5.72 4.2 3.5 3.59 5.3 26.1 23.08 8.9 19.1 11.68
Menstrual
Irregularities NA NA NA NA NA NA 11.1 14.4 13.92 35.2 29.2 33.56
Vaginal
discharge
0.0
0.0 0.0 10.7 0 1.37 34.4 15.5 18.24 12.5 2.3 9.72
Other
symptoms@
21.9
10.0 11.7 22.7 25.9 25.49 24.3 22.7 22.93 17.8 22.3 19.03
No. of
symptoms
73
430
503
24
163
187
9
53
62
8
3
11
The above are column percentages
@Other symptoms include problems like high blood pressure, breathlessness, vomiting, no control over urinary
bladder and others.

16
In contrast, very less women from Tamil Nadu having induced abortion complained of
menstrual irregularities, though they reported more (44%) vaginal discharge. About 25
percent of both induced and spontaneous abortions developed back/hip pain as a permanent
problem.
Management of abortion
The type of treatment received is an important element of care. The data for type of
treatment received for spontaneous and induced abortions is suggestive of the difference in
type of treatment received for the two types of abortions. In the survey attempt was made to
get data separately for managing the event of abortion and for treating for post-abortion
complications, but as stated earlier most of the complications occurred within 24 hours, and
therefore was difficult for the women to separately state the two information. Therefore
interventions mentioned by women may not all necessarily be for inducing abortion but
also for treatment of abortion related morbidity or diagnostic tests. Table 7 gives the details
of the type of treatment adopted by providers for management of abortions.
Table 7: Percentage distribution of type of abortion by treatment given
Induced abortion Spontaneous abortion Type of
treatment Maha
rashtra
Tamil
Nadu
Total Maha
rashtra
Tamil
Nadu
Total
Done D&C 56.7 88.3 75.1 34.5 62.0 51.4
Given injections 20.2 7.7 12.9 33.7 27.5 29.9
Given medicines
and check-up
21.9 3.0 11.5 28.1 4.5 14.8
Treatment not
given
1.0 0.0 0.4 3.6 4.0 3.8
No of abortions 141 197* 338 126 200 326
All figures are column percentages
*One woman refused to name the service provider and the method used
17
Dilatation and Curettage (D&C) was done on 75 percent of induced abortion despite 65
percent of abortions being first trimester abortions. There is some sort of obsession with
curettage, and hence a practice like check curettage was fairly common even when manual
vacuum aspiration can done as early as six weeks. This not only raises the cost of abortion
but also expose women to risks like perforation and infections. D&C seemed to be the only
line of treatment followed by both private and government doctors in Tamil Nadu in
contrast to Maharashtra where D&C was comparatively less by government doctors.
Apart from D&C women were unable to identify other methods properly and reported
injections and oral medications as interventions for abortion. No considerable difference
was noticed when it comes to giving injections or medicines, though the percentage of
giving medicines were considerably higher for the category of ‘other provider’ in
Maharashtra. It is noteworthy to state here that these studies were done when medical
abortion was not yet legal in India.
For spontaneous abortions, as stated earlier, in as many as 22 and 27 percent of
spontaneous abortions treatment was not sought in Maharashtra and Tamil Nadu
respectively. So for analysis on treatment taken for spontaneous abortions, these were not
taken into account. Fifty percent of spontaneous abortions underwent D&C followed by
injections and medicines. In as much as 62 percent of spontaneous abortions in Tamil
Nadu, D&C was done. It is significant to note that in 4 percent of spontaneous abortions,
any medical advice were not given even after approaching a health facility and this
observation was more prevalent among women who approached public health facilities for
treatment.
Cost of abortion: Cost of abortion is an important aspect in post abortion care given the
importance of purchasing power in getting quality abortion services. Women were asked
cost incurred by them for different components like hospital/provider, medicine, tests,
blood transfusion, travel and food and stay. All these component cost were taken together
18
for analysis. The average out-of-pocket cost per abortion in Maharashtra was Rs. 1746.52
for induced abortions and Rs. 1113.71 for spontaneous abortions. The median cost was
Rs.1220 and Rs. 494.42, respectively. In Tamil Nadu average cost for induced abortion was
less than Maharashtra at Rs 1335. Average expenditure for spontaneous abortion was
almost same in both the states (Rs 1113 for Maharashtra and Rs 1134 for Tamil Nadu),
though a difference was observed in the median cost, with Maharashtra registering a lower
expenditure (Rs 494 for Maharashtra and Rs 600 for Tamil Nadu). So with high abortion
cost involved in seeking abortion care from formal health systems it is not unnatural for
women to resort to untrained providers for easy abortion services many times at the cost of
irreversible damage to their health.
Type of treatment received by standard of living index: The hypothesis that the type of
treatment administered is dictated by concerns other than medical knowledge is further
supported when the data was analyzed by asset index of the abortion seeker. For both
induced and spontaneous abortions, D&C was administered more among women of
medium and high SLI than on women belonging to low SLI. Investigative tests too were
advised more for women belonging to medium and high SLI than for women of low SLI. In
fact, the data shows that women belonging to high SLI were subjected the most to D&C
and investigative tests. Thus, for both types of abortions, it is the purchasing power of the
service seeker that is a determinant of the type of treatment received.
Dimensions of care specific to induced abortion
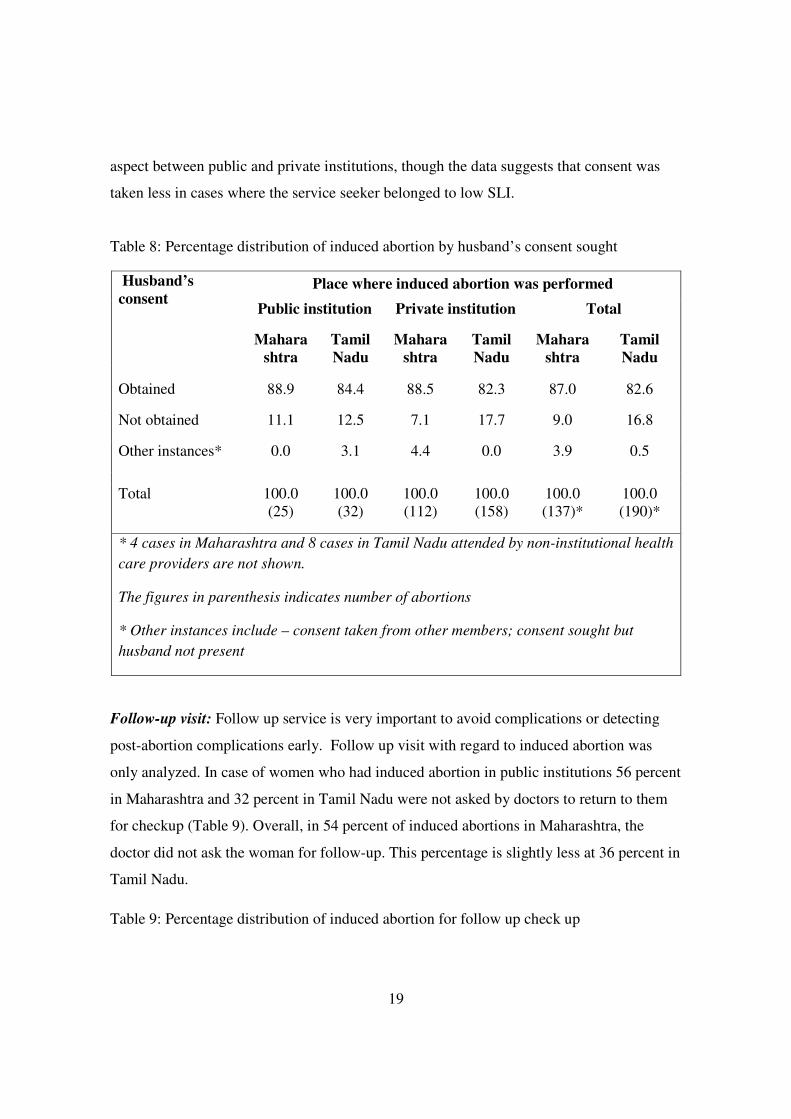
Husbands consent: Consent from husband of a woman seeking abortion is not required by
the MTP Act, but service providers routinely seek husband’s consent. In both public and
private institutions consent from husbands of women who approached for induced abortion
were obtained from more than four-fifths of the cases before performing abortion as
reported by women (Table 8). The practice of obtaining consent from family members is
more in Maharashtra (91%) than in Tamil Nadu (83%). There is not much difference in this
19
aspect between public and private institutions, though the data suggests that consent was
taken less in cases where the service seeker belonged to low SLI.
Table 8: Percentage distribution of induced abortion by husband’s consent sought
Place where induced abortion was performed
Public institution Private institution Total
Husband’s
consent
Mahara
shtra
Tamil
Nadu
Mahara
shtra
Tamil
Nadu
Mahara
shtra
Tamil
Nadu
Obtained 88.9 84.4 88.5 82.3 87.0 82.6
Not obtained 11.1 12.5 7.1 17.7 9.0 16.8
Other instances* 0.0 3.1 4.4 0.0 3.9 0.5
Total 100.0
(25)
100.0
(32)
100.0
(112)
100.0
(158)
100.0
(137)*
100.0
(190)*
* 4 cases in Maharashtra and 8 cases in Tamil Nadu attended by non-institutional health
care providers are not shown.
The figures in parenthesis indicates number of abortions
* Other instances include – consent taken from other members; consent sought but
husband not present
Follow-up visit: Follow up service is very important to avoid complications or detecting
post-abortion complications early. Follow up visit with regard to induced abortion was
only analyzed. In case of women who had induced abortion in public institutions 56 percent
in Maharashtra and 32 percent in Tamil Nadu were not asked by doctors to return to them
for checkup (Table 9). Overall, in 54 percent of induced abortions in Maharashtra, the
doctor did not ask the woman for follow-up. This percentage is slightly less at 36 percent in
Tamil Nadu.
Table 9: Percentage distribution of induced abortion for follow up check up

20
Public
institution
Private
institution Total
Asked for checkup
Maha
rashtra
Tamil
Nadu
Maha
rashtra
Tamil
Nadu
Maha
rashtra
Tamil
Nadu
Doctor did not ask 55.6 31.2 47.4 36.7 54.2 (25) 35.8(68)
Doctor asked 44.4 68.8 52.6 63.3 45.8 (125) 64.2 (122)
* 4 cases in Maharashtra and 8 cases in Tamil Nadu attended by non-institutional health
care providers are not shown.
The figures in parenthesis indicates number of abortions
The above figures are column percentages.
There is not much of difference in the proportion of women returning for checkup among
those who were asked to come back between public and private institutions in both the
states. Among those who were requested by doctors to come back for checkup 27 percent
of those who had induced abortion in public institutions did not go back for checkup, this
percentage is 25 among those who had abortion in private institutions. Women were asked
about the precautionary care suggested by doctor soon after induced abortion. Refraining
from arduous tasks, abstaining from sex and use of some contraception are the only
suggestions listed by the respondents.
Post abortion family support
An abortion episode/ event many a times weaken a woman both physically and mentally.
Therefore amount of rest a woman gets after an abortion procedure assumes importance.
Possibly for the first time these community based studies have tried to collect data on
amount of rest an woman received after abortion. It was left to the woman to interpret what
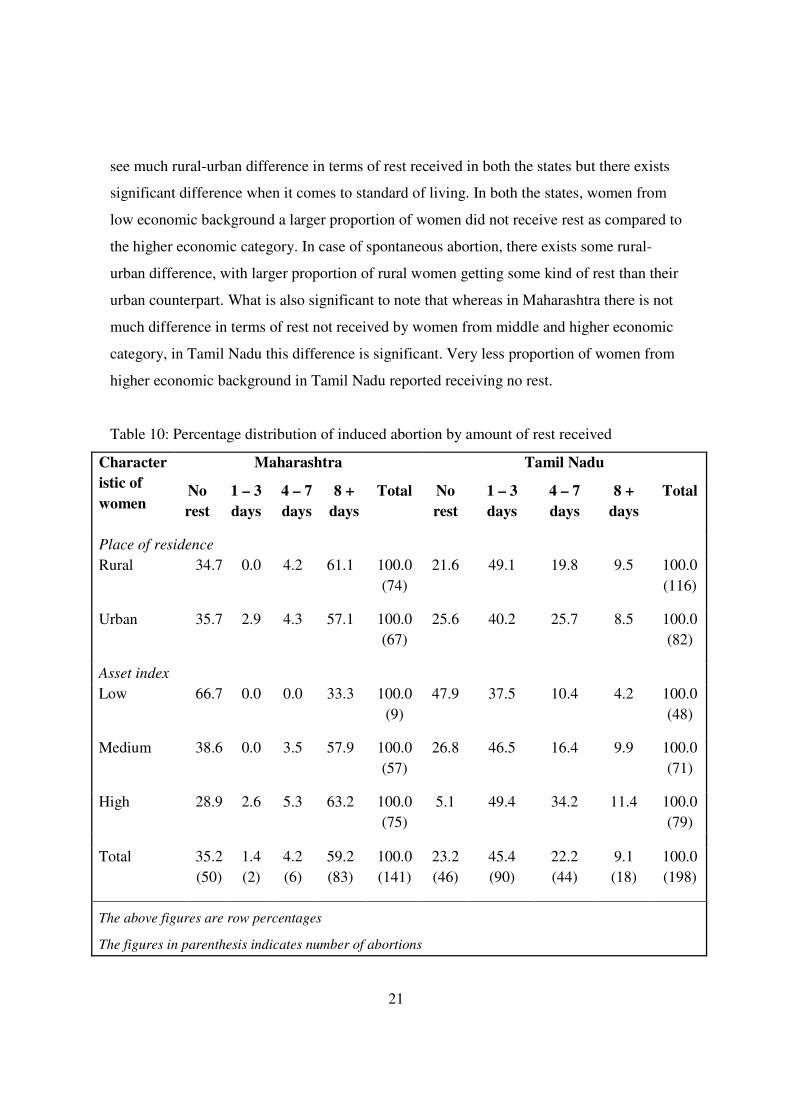
she understood by “rest”. Data (Table 10) reveal that overall for induced abortion more
than 35 percent of woman in Maharashtra and 23 percent in Tamil Nadu did not get any
rest after the procedure. When the data is disaggregated by place of residence one does not
21
see much rural-urban difference in terms of rest received in both the states but there exists
significant difference when it comes to standard of living. In both the states, women from
low economic background a larger proportion of women did not receive rest as compared to
the higher economic category. In case of spontaneous abortion, there exists some rural-
urban difference, with larger proportion of rural women getting some kind of rest than their
urban counterpart. What is also significant to note that whereas in Maharashtra there is not
much difference in terms of rest not received by women from middle and higher economic
category, in Tamil Nadu this difference is significant. Very less proportion of women from
higher economic background in Tamil Nadu reported receiving no rest.
Table 10: Percentage distribution of induced abortion by amount of rest received
Maharashtra Tamil Nadu Character
istic of
women No
rest
1 – 3
days
4 – 7
days
8 +
days
Total No
rest
1 – 3
days
4 – 7
days
8 +
days
Total
Place of residence
Rural 34.7 0.0 4.2 61.1 100.0
(74)
21.6 49.1 19.8 9.5 100.0
(116)
Urban 35.7 2.9 4.3 57.1 100.0
(67)
25.6 40.2 25.7 8.5 100.0
(82)
Asset index
Low 66.7 0.0 0.0 33.3 100.0
(9)
47.9 37.5 10.4 4.2 100.0
(48)
Medium 38.6 0.0 3.5 57.9 100.0
(57)
26.8 46.5 16.4 9.9 100.0
(71)
High 28.9 2.6 5.3 63.2 100.0
(75)
5.1 49.4 34.2 11.4 100.0
(79)
Total 35.2
(50)
1.4
(2)
4.2
(6)
59.2
(83)
100.0
(141)
23.2
(46)
45.4
(90)
22.2
(44)
9.1
(18)
100.0
(198)
The above figures are row percentages
The figures in parenthesis indicates number of abortions
22
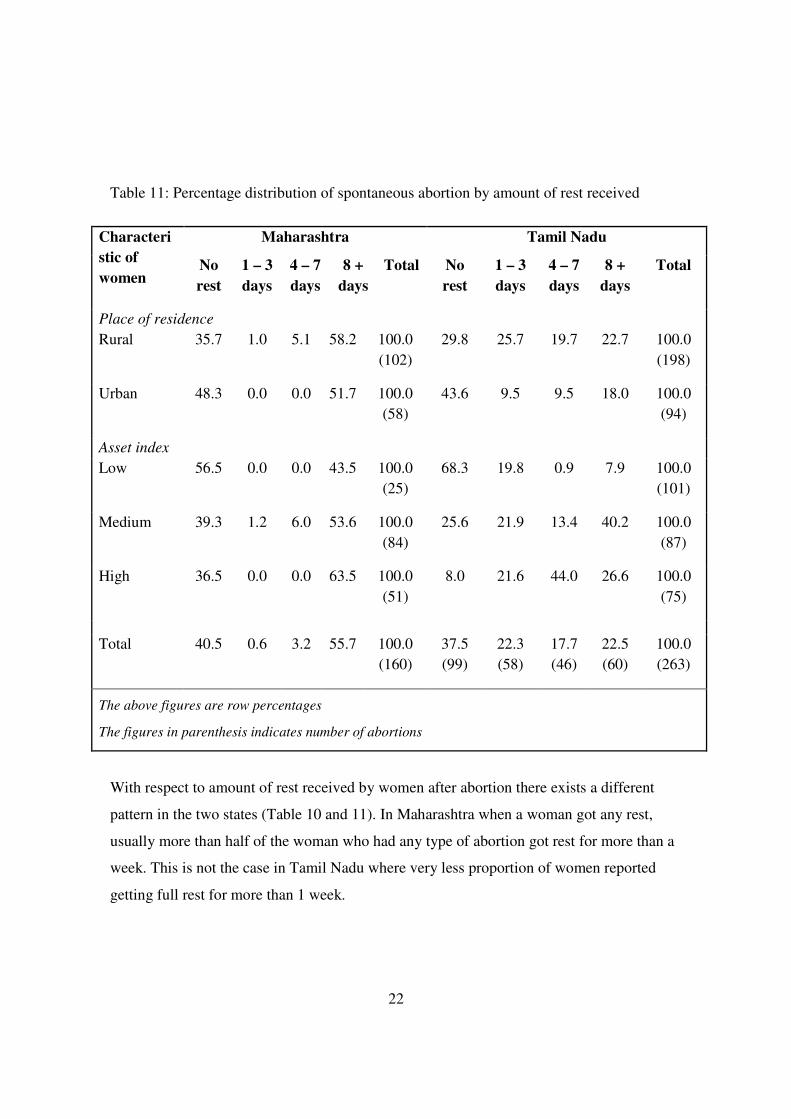
Table 11: Percentage distribution of spontaneous abortion by amount of rest received
Maharashtra Tamil Nadu Characteri
stic of
women No
rest
1 – 3
days
4 – 7
days
8 +
days
Total No
rest
1 – 3
days
4 – 7
days
8 +
days
Total
Place of residence
Rural 35.7 1.0 5.1 58.2 100.0
(102)
29.8 25.7 19.7 22.7 100.0
(198)
Urban 48.3 0.0 0.0 51.7 100.0
(58)
43.6 9.5 9.5 18.0 100.0
(94)
Asset index
Low 56.5 0.0 0.0 43.5 100.0
(25)
68.3 19.8 0.9 7.9 100.0
(101)
Medium 39.3 1.2 6.0 53.6 100.0
(84)
25.6 21.9 13.4 40.2 100.0
(87)
High 36.5 0.0 0.0 63.5 100.0
(51)
8.0 21.6 44.0 26.6 100.0
(75)
Total 40.5 0.6 3.2 55.7 100.0
(160)
37.5
(99)
22.3
(58)
17.7
(46)
22.5
(60)
100.0
(263)
The above figures are row percentages
The figures in parenthesis indicates number of abortions
With respect to amount of rest received by women after abortion there exists a different
pattern in the two states (Table 10 and 11). In Maharashtra when a woman got any rest,
usually more than half of the woman who had any type of abortion got rest for more than a
week. This is not the case in Tamil Nadu where very less proportion of women reported
getting full rest for more than 1 week.
23
Overall, in cases where woman have not been able to take any rest after an abortion it is
mostly due to unavailability of help (in 79% and 69% of cases of induced and spontaneous
abortions respectively).
DISCUSSION AND CONCLUSION
The two studies reveal that induced abortion is on the rise and the increase has been very
sharp in recent years. Across classes there is wide variation in the rate of induced abortion,
indicating barriers to access for the poorer groups who have limited purchasing capacities
and who also have to depend on private abortion facilities because of inadequate numbers
of public facilities.
While life threatening morbidity from abortions did not emerge as a major issue of concern,
in these two studies, but large proportion of women did experience discomfort that affected
their daily lives following abortion procedure. The study also brings forth the relationship
between purchasing power and access to quality abortion care. Hence the decision to
seek abortion services, especially induced abortion, depends substantially on access to
resources. Data from both the states proves that better off groups were able to access
abortion services far more easily because of the nature of abortion economy wherein
dependence of private providers is extremely high. Thus the share of better off groups
in total induced abortion is substantially high in both the states. Thus it is not surprising
that women from low economic status either went ahead with the pregnancy instead of
inducing or went to untrained providers and thus reported significantly more incidence
of post-abortion morbidity. The private sector, being a larger player, should be
regulated for its quality and affordability.
Skewed distribution of abortion care services with an advantage towards urban areas needs
to be changed with a more even geographical distribution. This would also mean that
abortion services in public health facilities like Primary Health Centers, which are
physically within reasonable access to rural women, need substantial strengthening. Given

24
the poor quality of existing abortion services in the country, establishing service delivery
guidelines regarding technical standards of service, patient-provider interaction,
confidentiality, pre- and post-abortion counseling and care is critically needed. All existing
MTP facilities should be regularly monitored and evaluated. In the last few years some
ground has been covered in improving the abortion scenario in the country. The MTP Act
has been amended to simplify the registration process and now certification is provided at
the district level itself. Medical abortion is also now covered under the MTP Act.
Access to safe abortion goes beyond an enabling policy environment. Many administrative
barriers like spousal consent, judgmental attitudes, and conscientious objection to abortion
by providers, not dictated by law evolve simply as a way of practice and get misinterpreted
as ‘required by law’. Therefore measures need to be taken to end such misguided practices,
starting from reorienting the members of the MTP implementing bodies. The Ministry of
Health and Family Welfare should make provision of safe and legal abortion a priority
which should reflect in its budgetary requirements and program plans. For a liberalized law
to be effective in providing free, safe and humane abortions on demand, it needs to be
accompanied by other social inputs like greater empowerment of women especially in their
control over their bodies and their sexuality.
ACKNOWLEDGEMENT
The author duly acknowledges Centre for Health and Allied Themes (CEHAT) for allowing
to analyze the data collected by CEHAT in Maharashtra and by Bharathiar University in
Tamil Nadu under the aegis of Abortion Assessment Project – India. Author is indebted to
Dr Sunita Bandewar and Ms Sugandha More for providing inputs during analysis of the
data during the project period.

25
REFERENCES
Aahman, E. and I. Shah. 2004. Unsafe abortion: global and regional estimates of unsafe
abortion and associated mortality in 2000. Geneva, WHO.
Duggal, R. 2003. Abortion Economics, Seminar 532. http://www.india-
seminar.com/2003/532/532%20ravi%20duggal.htm
Ganatra, B. and S. Hirve. 2002. Induced abortions among adolescent women in rural
Maharashtra, India. Reproductive Health Matters 10(19): 76-85.
Hirve, S. 2004. Abortion Policy In India: Lacunae And Future Challenges, Policy review,
Abortion Assessment Project – India, CEHAT and Health Watch, Mumbai.
Johnston, H.B. 2002. Abortion Practice in India: A Review of Literature, Working paper,
Abortion Assessment Project – India, CEHAT and Health Watch, Mumbai.
Khan, M. E., S. Rajagopal, S. Barge, and N. Kumar. 1998. Situation analysis of Medical
Termination of Pregnancy (MTP) services in Gujarat, Maharashtra, Tamil Nadu and Uttar
Pradesh, Centre for Operation Research and Training (CORT), Baroda. Paper presented at
Global Meeting on Post-abortion Care and Operations Research, organised by Population
Council, New York, USA, 19-21 January 1998.
Ravindran, T.K.S. 2002. Gender Gaps in Research on Abortion in India: A Critical Review
of Selected Studies, CREA, New Delhi.
Registrar General of India (RGI). 2000. Survey of Causes of Death (Rural) India, 1991-95.
Vital Statistics Division, Government of India, New Delhi.
Saha, S. 2003. Estimating Abortion Rate through Community Based Studies-
Methodological Issues, Working Paper, Abortion Assessment Project – India (AAP-I),
CEHAT and Health Watch, Mumbai.
Saha, S., R. Duggal and M. Mishra. 2004. Abortion in Maharashtra: Incidence, care and
cost. Centre for Enquiry into Health and Allied Themes (CEHAT), Mumbai. pp 1-16.
Singh, S., D. Wulf, and H. Jones. 1997. Health Professionals Perceptions about Induced
Abortions in South Central and Southeast Asia, International Family Planning Perspective,
Vol 23 (2), pp. 59-67.
Srinivasa, D.K., K.A. Narayan, A. Oumachigui, and G.Roy. 1997. Prevalence of maternal
morbidity and health seeking behaviour in a south Indian community. Pondicherry:
Jawaharlal Institute of Postgraduate Medical Education and Research.

26
i The Abortion Assessment Project-India (AAP-I), an all-India research study was commenced in August
2000, with the objective of assessing ground realities with regard to various aspects of abortion through
rigorous research. The policy review, working papers and various studies undertaken in 18 states highlighted
the inadequate attention given to abortion within the health and population policy of the country and reiterated
the often voiced concern that Reproductive and Child Health programme, initiated by GOI in 1997, has failed
to address issues related to abortion.
Source: Duggal, R. and Ramachandran, V. (2004) The Abortion Assessment Project – India: Key Findings
and Recommendation. Reproductive Health Matters 12(supplement 24): 122-129
ii A detailed documentation of ethical dilemmas involved with this study is available in the book “Research
Ethics in Practice: A Documentation of Study design and Methodology” by Bandewar, S., Saha, S. and
Khaire, B. CEHAT, 2004.