Embed Size (px)
Citation preview
Zheng Jiao, PhDHuashan Hospital, Fudan University, ChinaEmail: [email protected]
Population PK/PD modeling for Individualized drug therapy: immunosuppressive agents
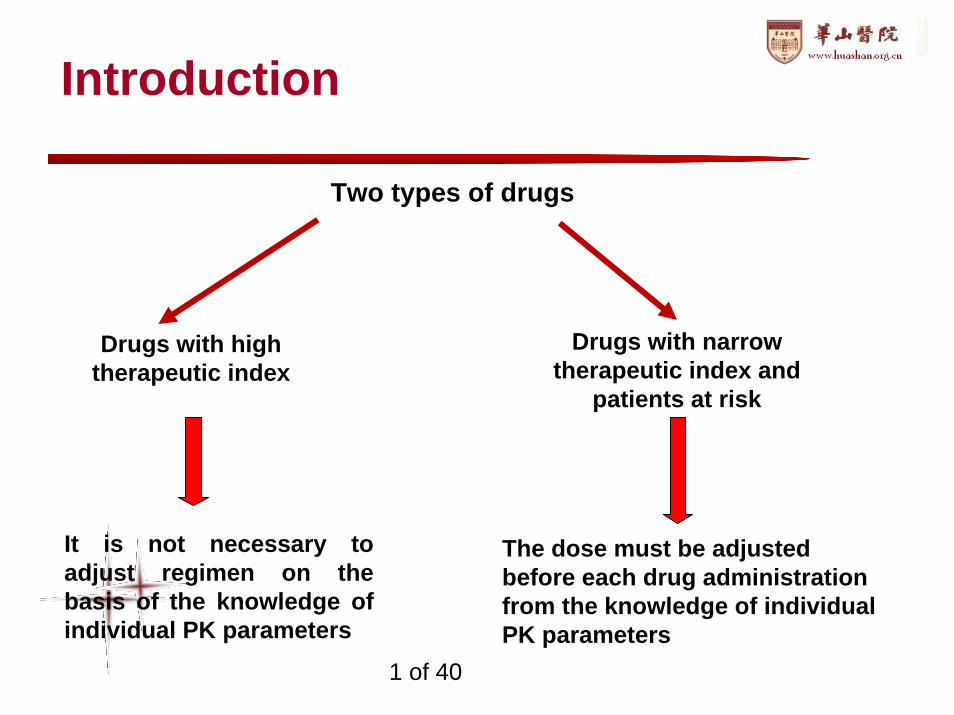
Two types of drugs
Drugs with high therapeutic index
Drugs with narrowtherapeutic index and
patients at risk
It is not necessary to adjust regimen on the basis of the knowledge of individual PK parameters
The dose must be adjusted before each drug administration from the knowledge of individual PK parameters
Introduction
1 of 40
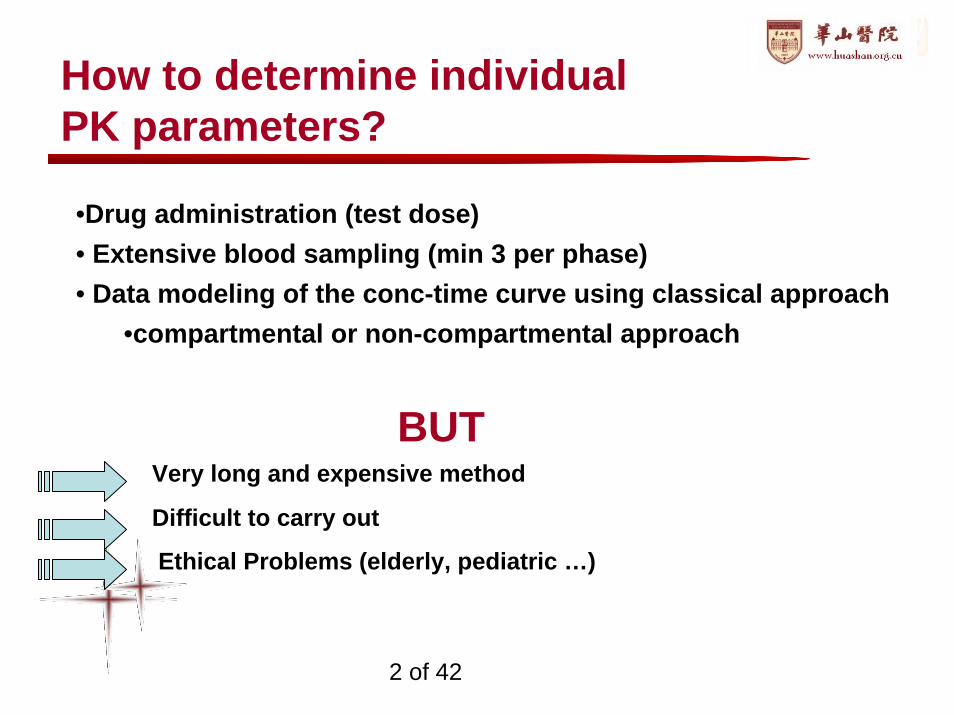
•Drug administration (test dose)• Extensive blood sampling (min 3 per phase)• Data modeling of the conc-time curve using classical approach
•compartmental or non-compartmental approach
BUTVery long and expensive method
Difficult to carry out
Ethical Problems (elderly, pediatric …)
How to determine individual PK parameters?
2 of 42
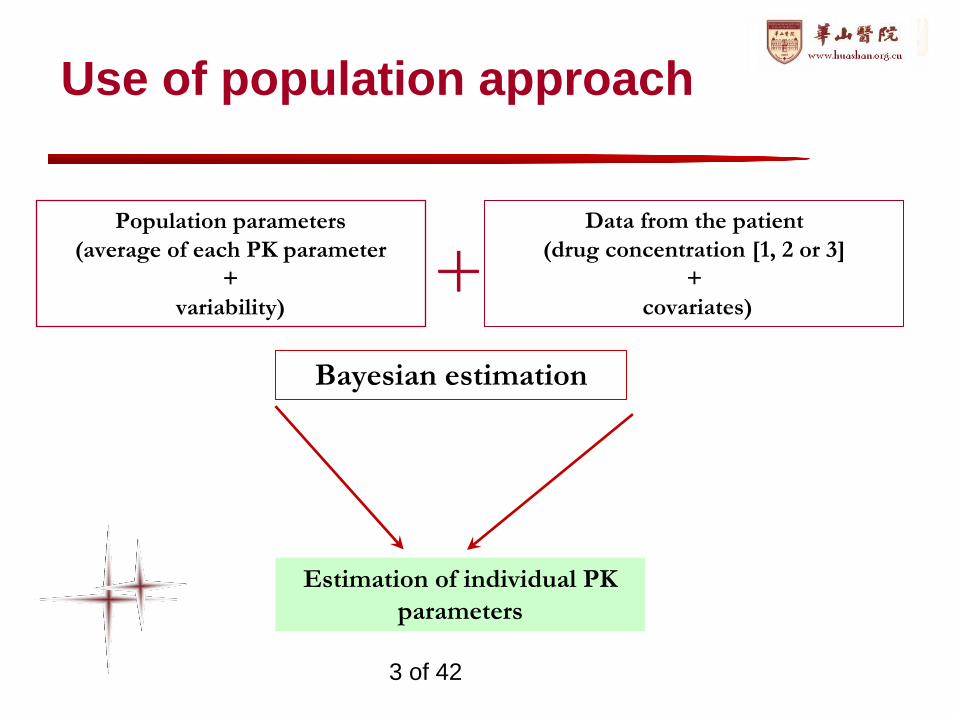
Population parameters (average of each PK parameter
+ variability)
Data from the patient (drug concentration [1, 2 or 3]
+covariates)
Bayesian estimation
Estimation of individual PK parameters
Use of population approach
+
3 of 42
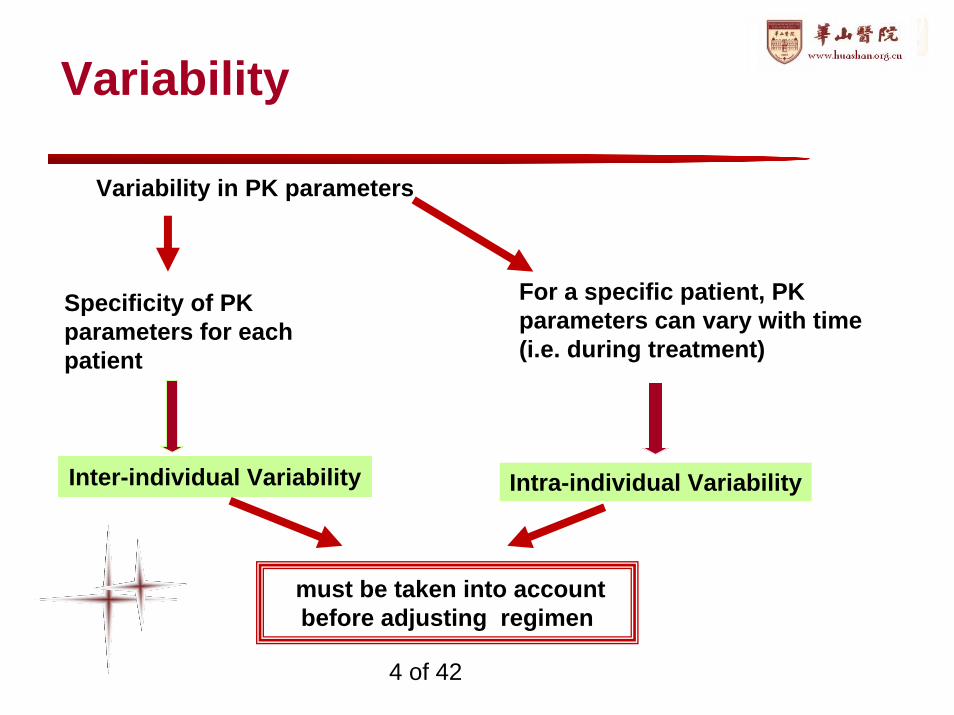
Variability in PK parameters
Inter-individual Variability
Specificity of PK parameters for each patient
For a specific patient, PK parameters can vary with time (i.e. during treatment)
Intra-individual Variability
must be taken into account before adjusting regimen
Variability
4 of 42
Definition of Population PK
FDA Guidance:“Population pharmacokinetics seeks to identify the measurable pathophysiologic factors that cause changes in the dose-concentration relationship and the extent of these changes so that, if such changes are associated with clinically significant shifts in the therapeutic index, dosage can be appropriately modified.”
5 of 42
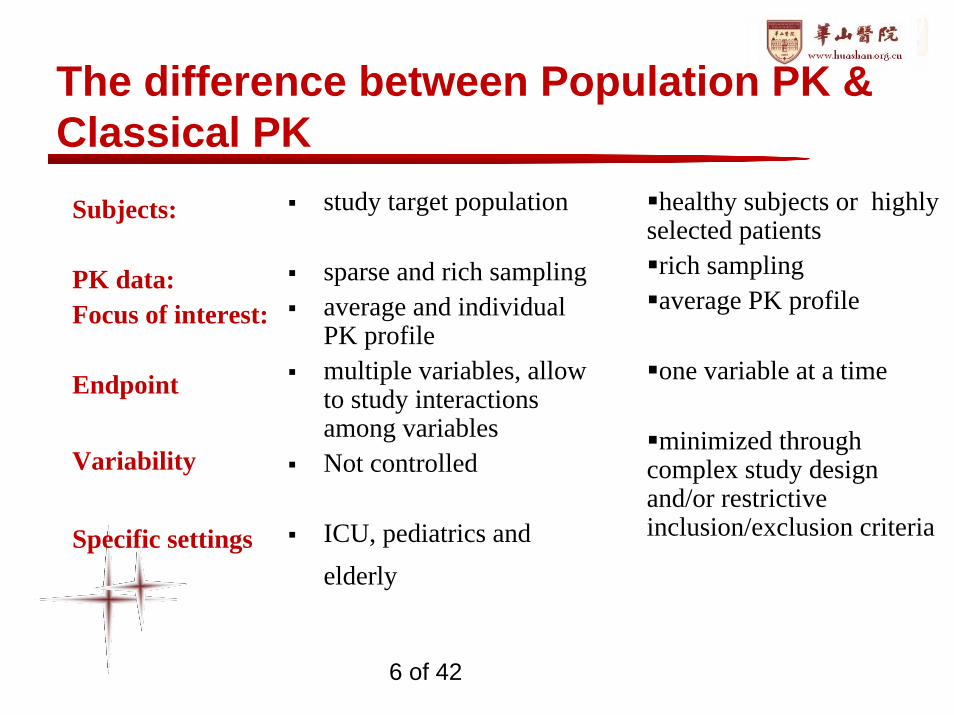
The difference between Population PK & Classical PK
healthy subjects or highly selected patientsrich sampling average PK profile
one variable at a time
minimized through complex study design and/or restrictive inclusion/exclusion criteria
Subjects:
PK data: Focus of interest:
Endpoint
Variability
Specific settings
study target population
sparse and rich samplingaverage and individual PK profilemultiple variables, allow to study interactions among variablesNot controlled
ICU, pediatrics and elderly
6 of 42
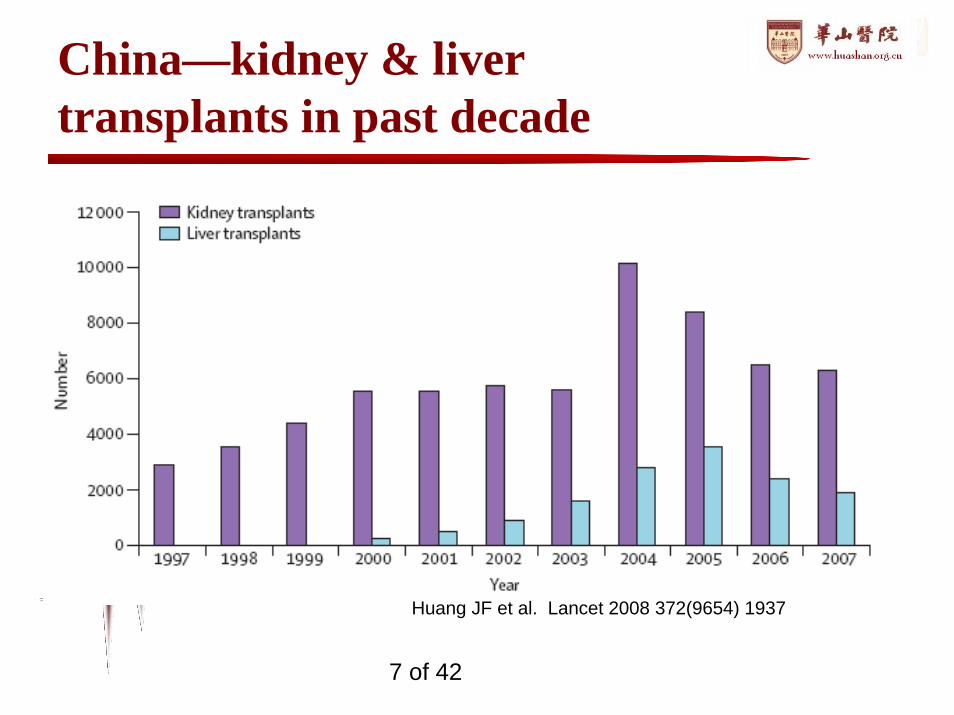
China—kidney & liver transplants in past decade
Huang JF et al. Lancet 2008 372(9654) 1937
7 of 42
Population analysis for immunosuppressive agents
• Optimal dose is important to – Prevent acute rejection– Try and prolong graft (and patient) survival
• Case studies by population analysis– Mycophenolic acid (MPA)– Tacrolimus (TAC)– Sirolimus (SRL)
8 of 42
Population PK of mycophenolic acid in Chinese
Case Study 1
9 of 42
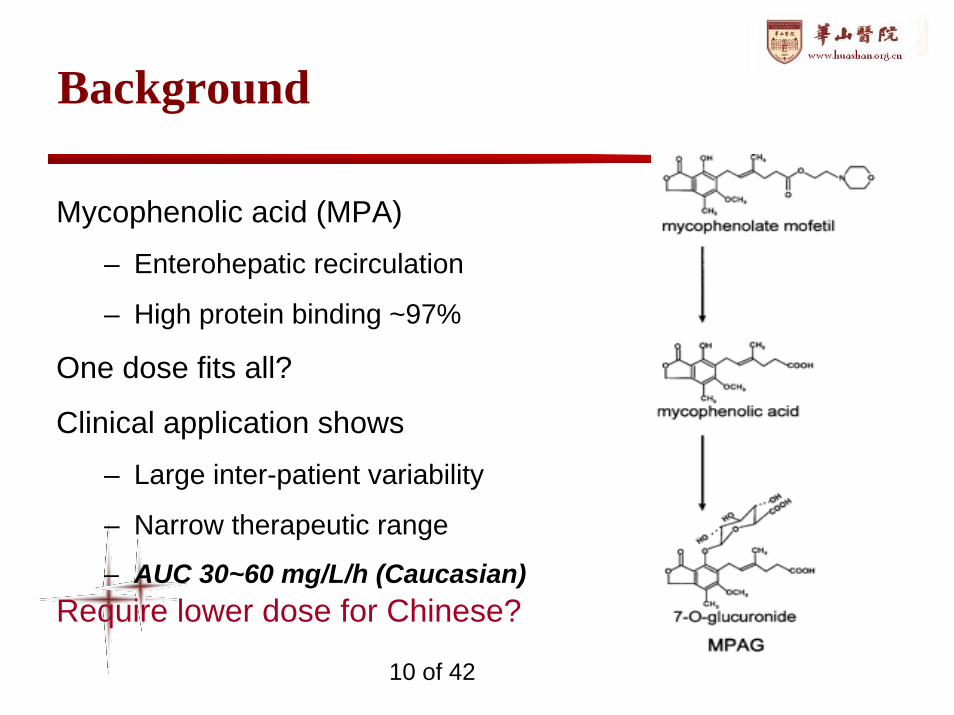
Background
Mycophenolic acid (MPA)
– Enterohepatic recirculation
– High protein binding ~97%
One dose fits all?
Clinical application shows
– Large inter-patient variability
– Narrow therapeutic range
– AUC 30~60 mg/L/h (Caucasian)Require lower dose for Chinese?
10 of 42
Objective
To characterize the PK of MPA in Chinese
– typical value, variability & covariates
– healthy subjects & transplant patients
To design individualized medication in Chinese renal
transplant patients
11 of 42
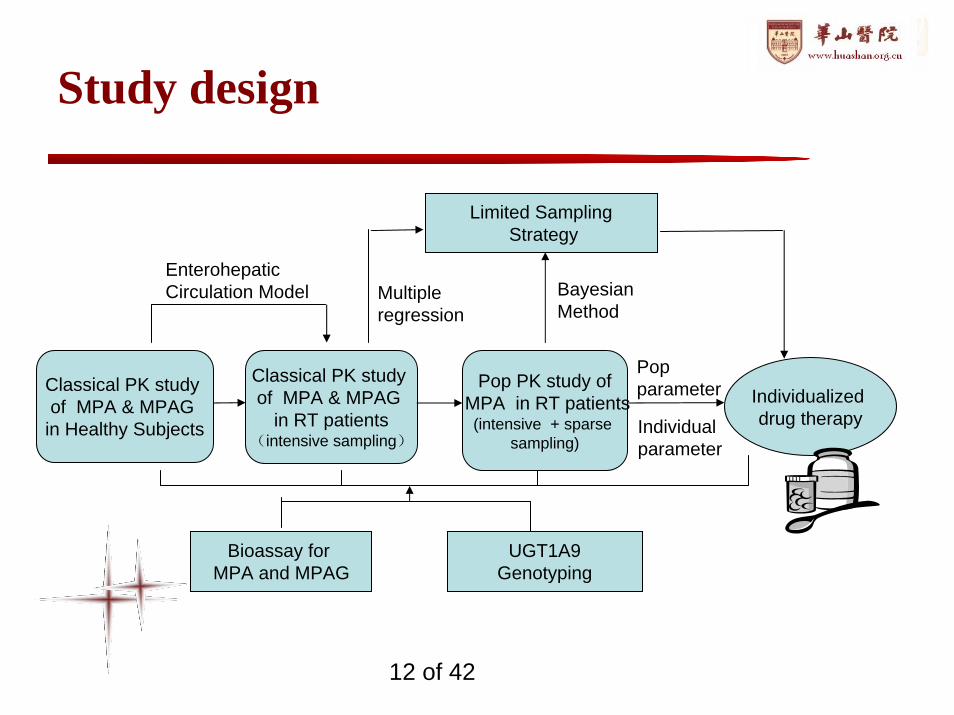
Study design
Classical PK study of MPA & MPAG
in Healthy Subjects
Classical PK study of MPA & MPAG
in RT patients(intensive sampling)
Pop PK study ofMPA in RT patients(intensive + sparse
sampling)
Individualized drug therapy
EnterohepaticCirculation Model
Limited SamplingStrategy
Multiple regression
Bayesian Method
Pop parameter
Individual parameter
Bioassay for MPA and MPAG
UGT1A9Genotyping
12 of 42
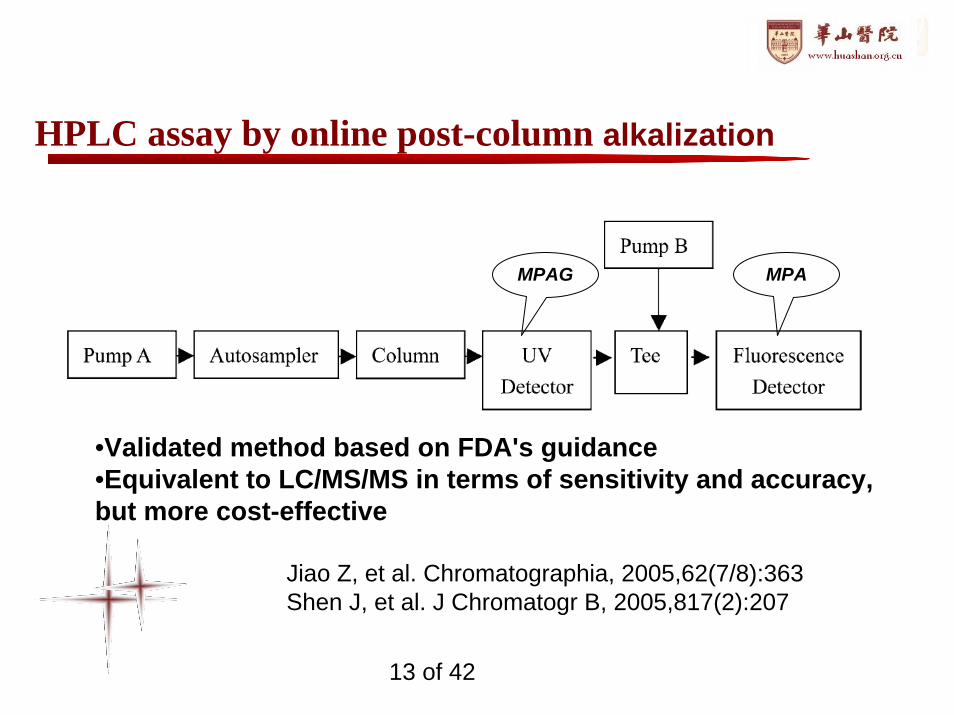
HPLC assay by online post-column alkalization
MPAG MPA
•Validated method based on FDA's guidance•Equivalent to LC/MS/MS in terms of sensitivity and accuracy, but more cost-effective
Jiao Z, et al. Chromatographia, 2005,62(7/8):363Shen J, et al. J Chromatogr B, 2005,817(2):207
13 of 42
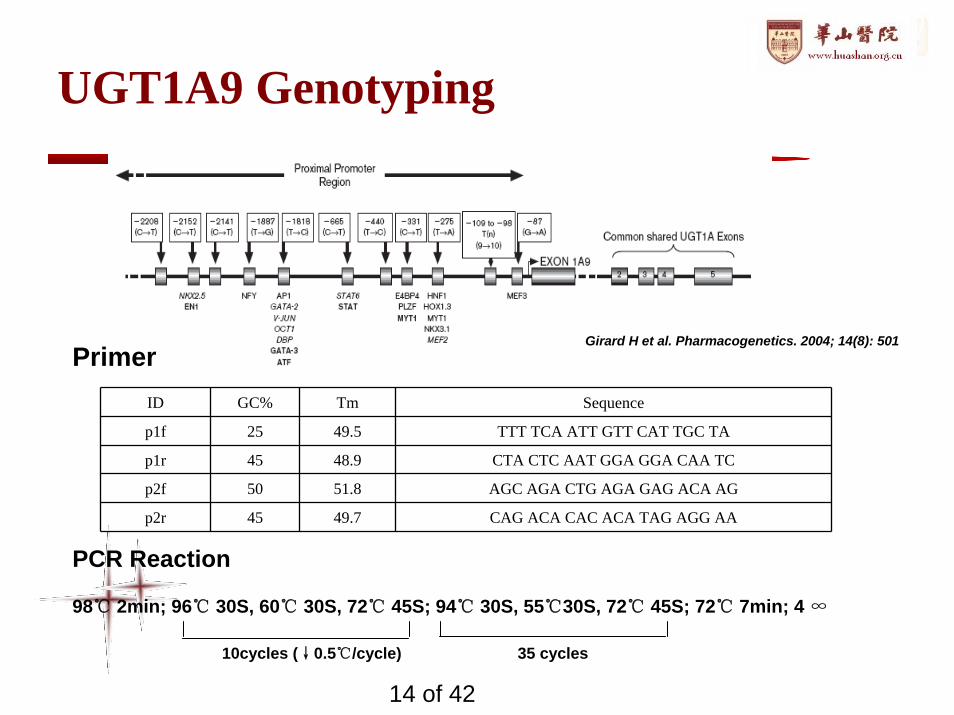
UGT1A9 Genotyping
ID GC% Tm Sequence
p1f 25 49.5 TTT TCA ATT GTT CAT TGC TA
p1r 45 48.9 CTA CTC AAT GGA GGA CAA TC
p2f 50 51.8 AGC AGA CTG AGA GAG ACA AG
p2r 45 49.7 CAG ACA CAC ACA TAG AGG AA
Primer
PCR Reaction
98℃ 2min; 96℃ 30S, 60℃ 30S, 72℃ 45S; 94℃ 30S, 55℃30S, 72℃ 45S; 72℃ 7min; 4 ∞
10cycles (↓0.5℃/cycle) 35 cycles
Girard H et al. Pharmacogenetics. 2004; 14(8): 501
14 of 42
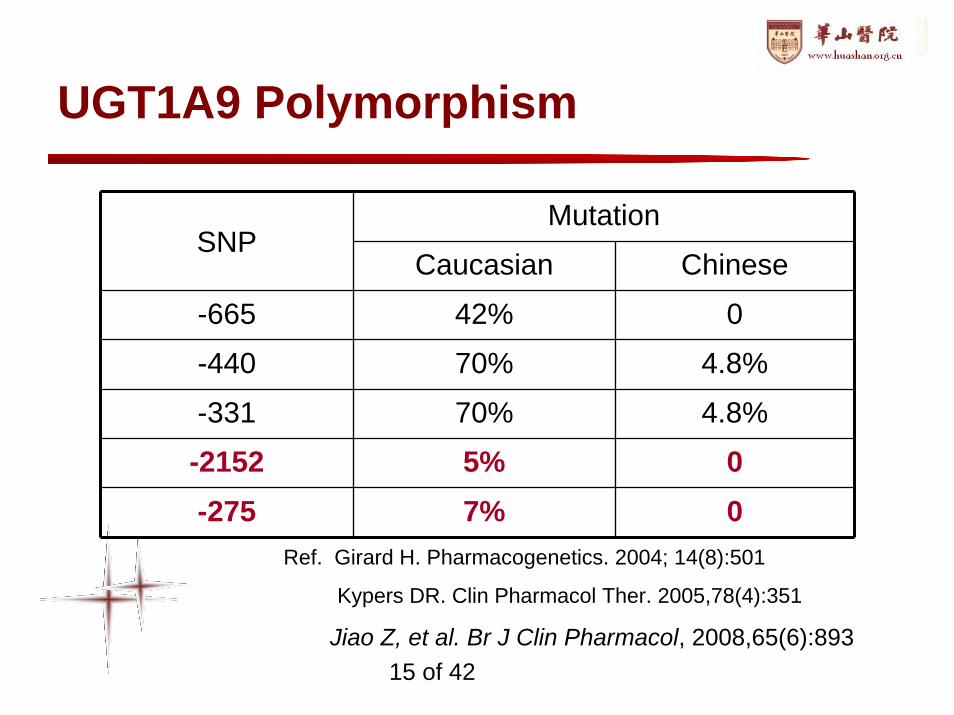
UGT1A9 Polymorphism
MutationSNP
Caucasian Chinese
-665 42% 0
-440 70% 4.8%
-331 70% 4.8%
-2152 5% 0-275 7% 0
Ref. Girard H. Pharmacogenetics. 2004; 14(8):501
Kypers DR. Clin Pharmacol Ther. 2005,78(4):351
Jiao Z, et al. Br J Clin Pharmacol, 2008,65(6):89315 of 42
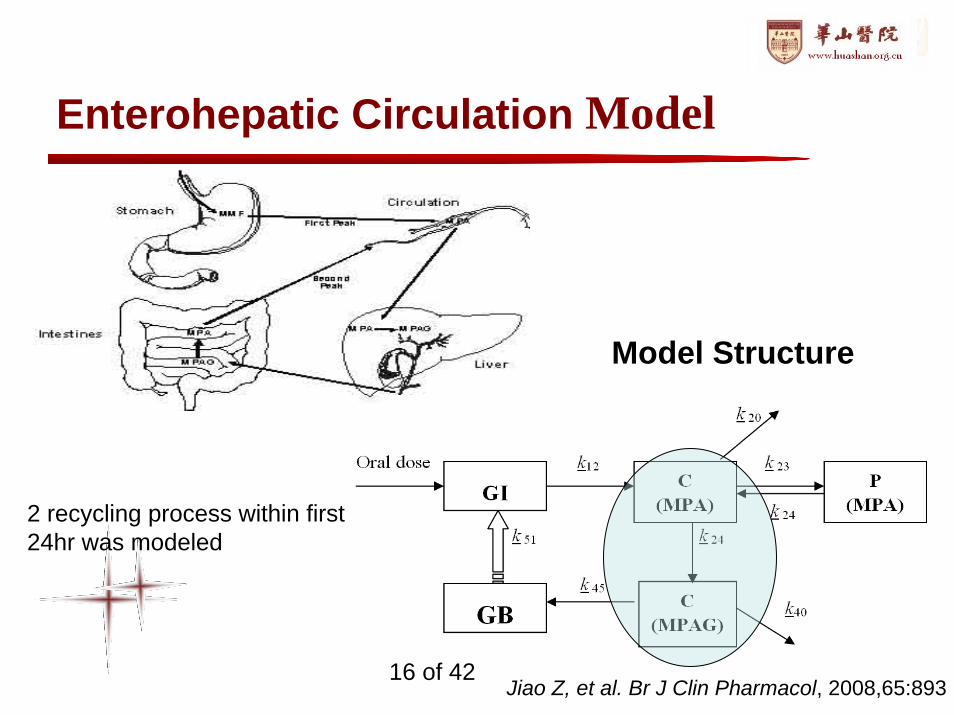
Enterohepatic Circulation Model
Model Structure
2 recycling process within first 24hr was modeled
Jiao Z, et al. Br J Clin Pharmacol, 2008,65:89316 of 42
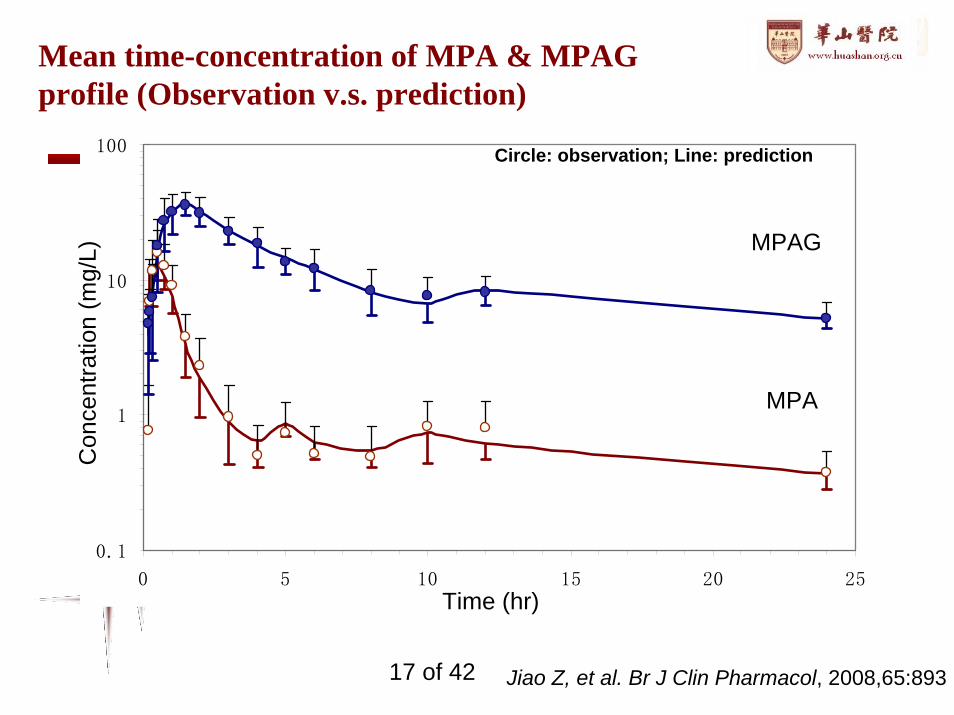
Mean time-concentration of MPA & MPAG profile (Observation v.s. prediction)
0.1
1
10
100
0 5 10 15 20 25
MPAG
MPA
Circle: observation; Line: prediction
Time (hr)
Con
cent
ratio
n (m
g/L)
Jiao Z, et al. Br J Clin Pharmacol, 2008,65:89317 of 42
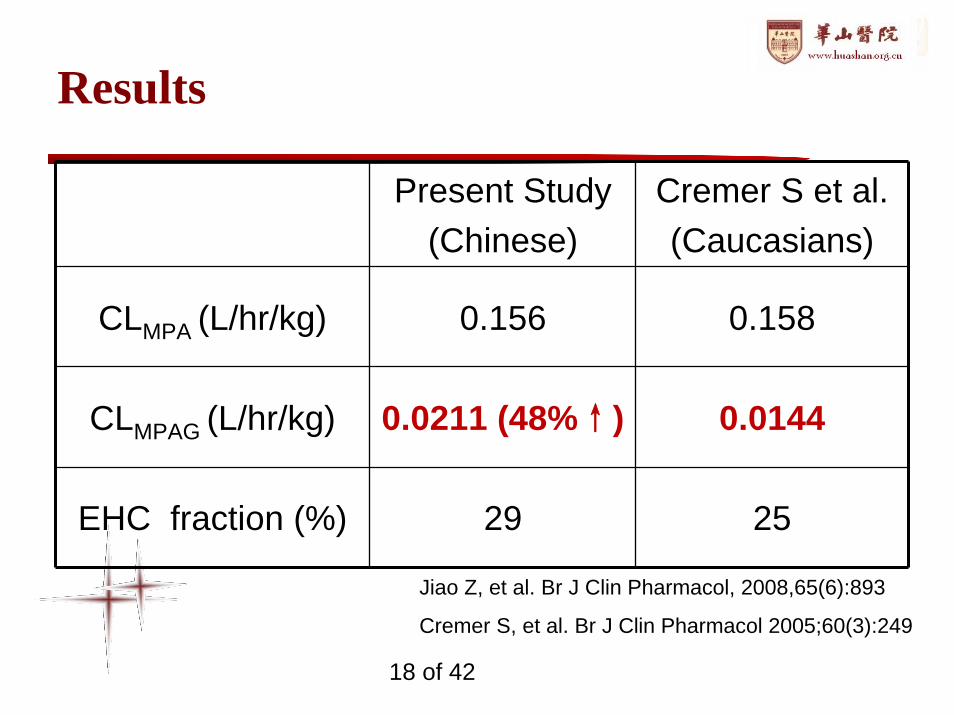
Results
Present Study(Chinese)
Cremer S et al.(Caucasians)
CLMPA (L/hr/kg) 0.156 0.158
CLMPAG (L/hr/kg) 0.0211 (48%↑) 0.0144
EHC fraction (%) 29 25
Jiao Z, et al. Br J Clin Pharmacol, 2008,65(6):893
Cremer S, et al. Br J Clin Pharmacol 2005;60(3):249
18 of 42
0.001
0.010
0.100
1.000
10.000
100.000
1000.000
0 2 4 6 8 10 12Time (hr)
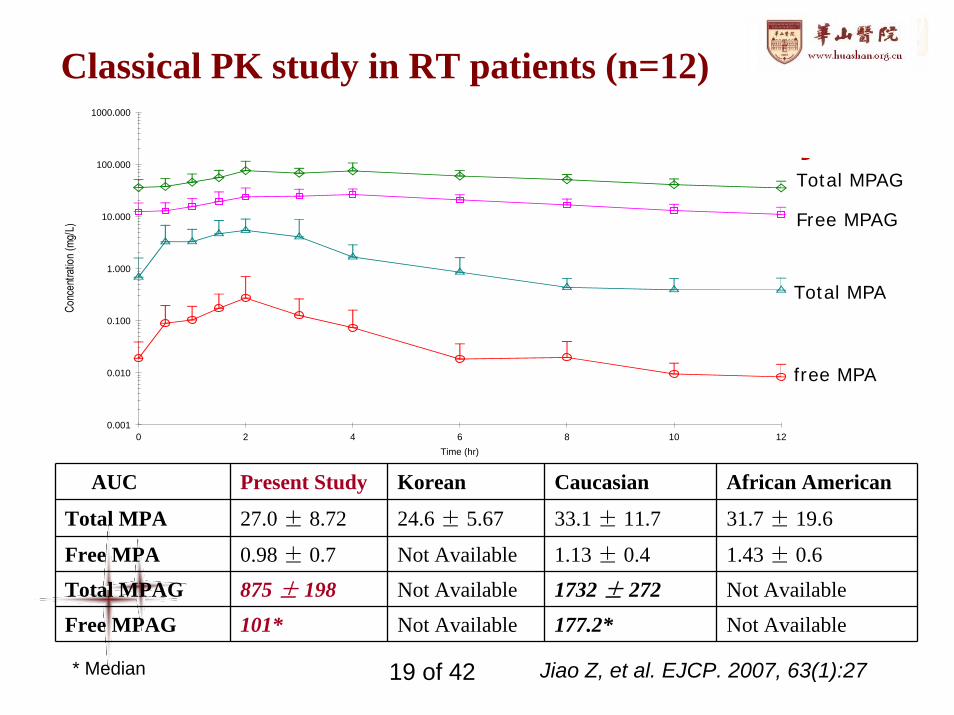
Classical PK study in RT patients (n=12)
AUC Present Study Korean Caucasian African American
Total MPA 27.0 ± 8.72 24.6 ± 5.67 33.1 ± 11.7 31.7 ± 19.6
Free MPA 0.98 ± 0.7 Not Available 1.13 ± 0.4 1.43 ± 0.6
Total MPAG 875 ± 198 Not Available 1732 ± 272 Not Available
Free MPAG 101* Not Available 177.2* Not Available
* Median
free MPA
Total MPA
Total MPAG
Free MPAG
Jiao Z, et al. EJCP. 2007, 63(1):2719 of 42
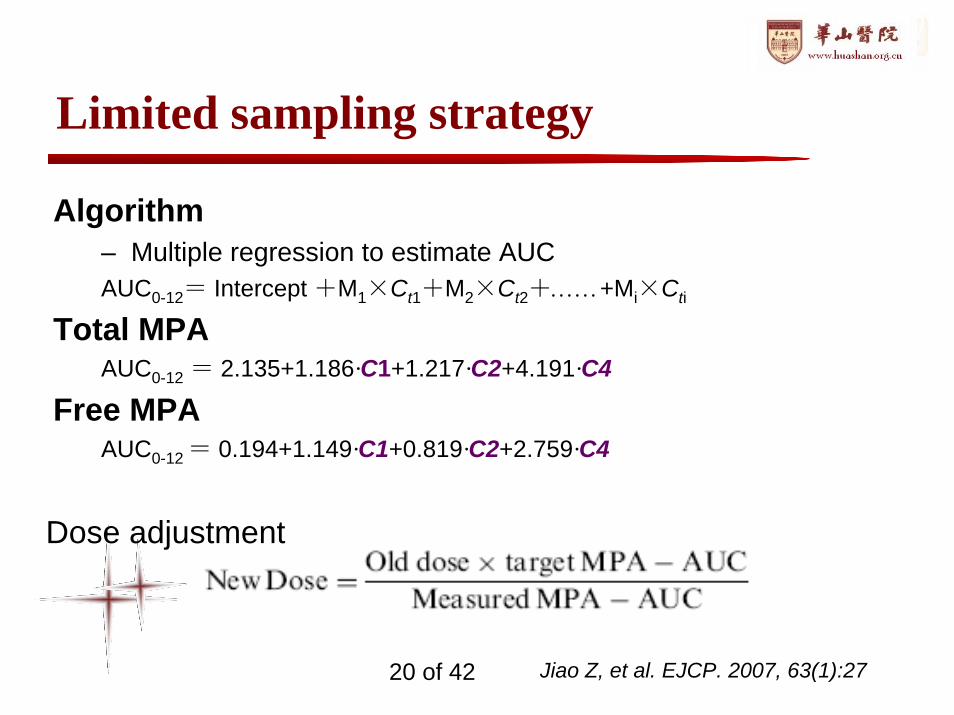
Limited sampling strategy
Algorithm– Multiple regression to estimate AUCAUC0-12= Intercept +M1×Ct1+M2×Ct2+……+Mi×Cti
Total MPAAUC0-12 = 2.135+1.186·C1+1.217·C2+4.191·C4
Free MPAAUC0-12 = 0.194+1.149·C1+0.819·C2+2.759·C4
Dose adjustment
Jiao Z, et al. EJCP. 2007, 63(1):2720 of 42
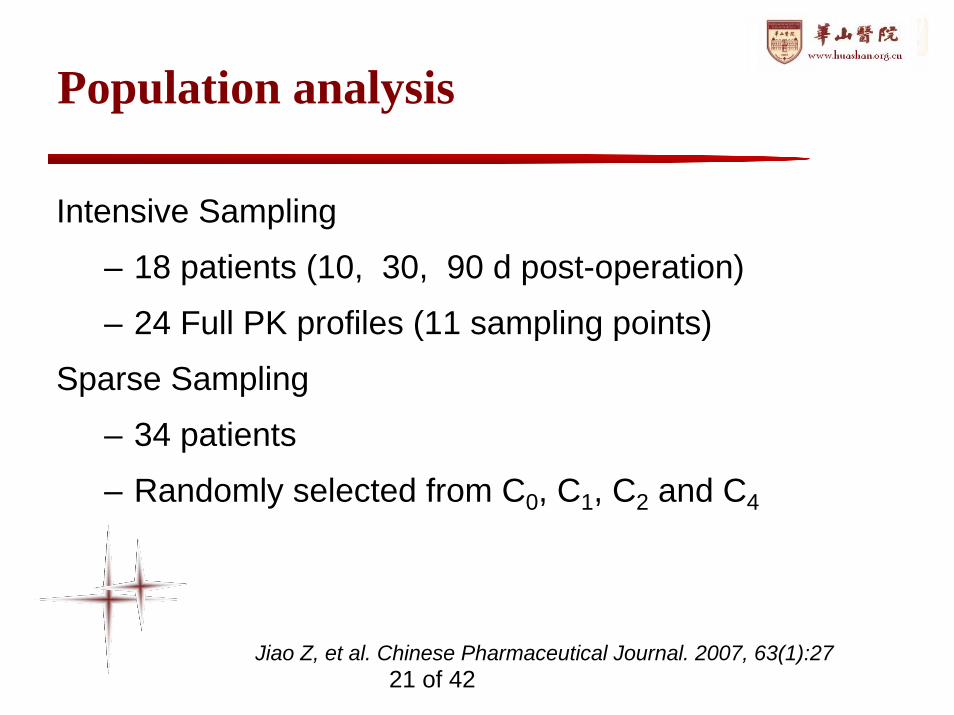
Population analysis
Intensive Sampling
– 18 patients (10, 30, 90 d post-operation)
– 24 Full PK profiles (11 sampling points)
Sparse Sampling
– 34 patients
– Randomly selected from C0, C1, C2 and C4
Jiao Z, et al. Chinese Pharmaceutical Journal. 2007, 63(1):2721 of 42
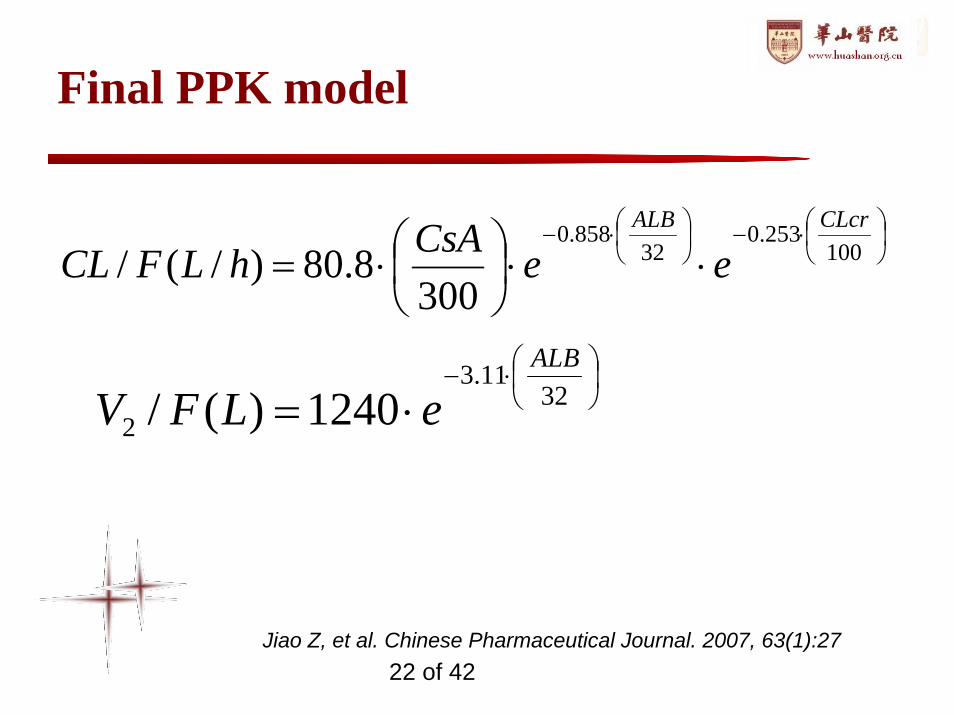
Final PPK model
⎟⎠⎞
⎜⎝⎛⋅−⎟
⎠⎞
⎜⎝⎛⋅−
⋅⋅⎟⎠⎞
⎜⎝⎛⋅= 100
253.032
858.0
3008.80)/(/
CLcrALB
eeCsAhLFCL
⎟⎠⎞
⎜⎝⎛⋅−
⋅= 3211.3
2 1240)(/ALB
eLFV
Jiao Z, et al. Chinese Pharmaceutical Journal. 2007, 63(1):2722 of 42
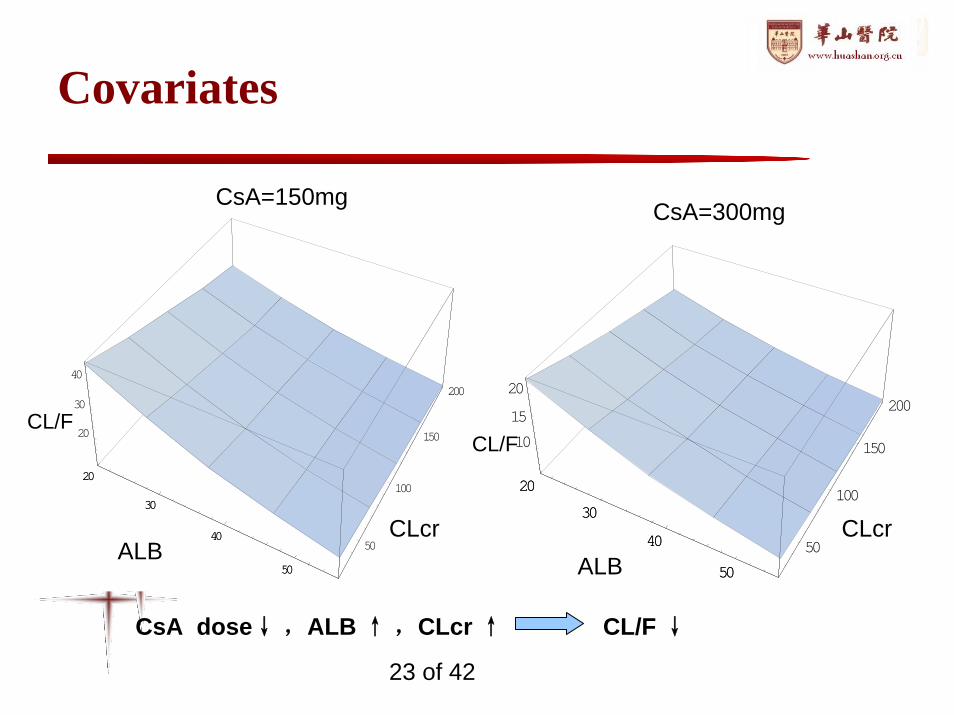
Covariates
20
30
40
50
50
100
150
200
20
30
40
20
30
40
50
20
30
40
50
50
100
150
200
10
15
20
20
30
40
50ALB ALB
CLcr CLcr
CL/FCL/F
CsA=150mg CsA=300mg
CsA dose↓ ,ALB ↑ ,CLcr ↑ CL/F ↓
23 of 42
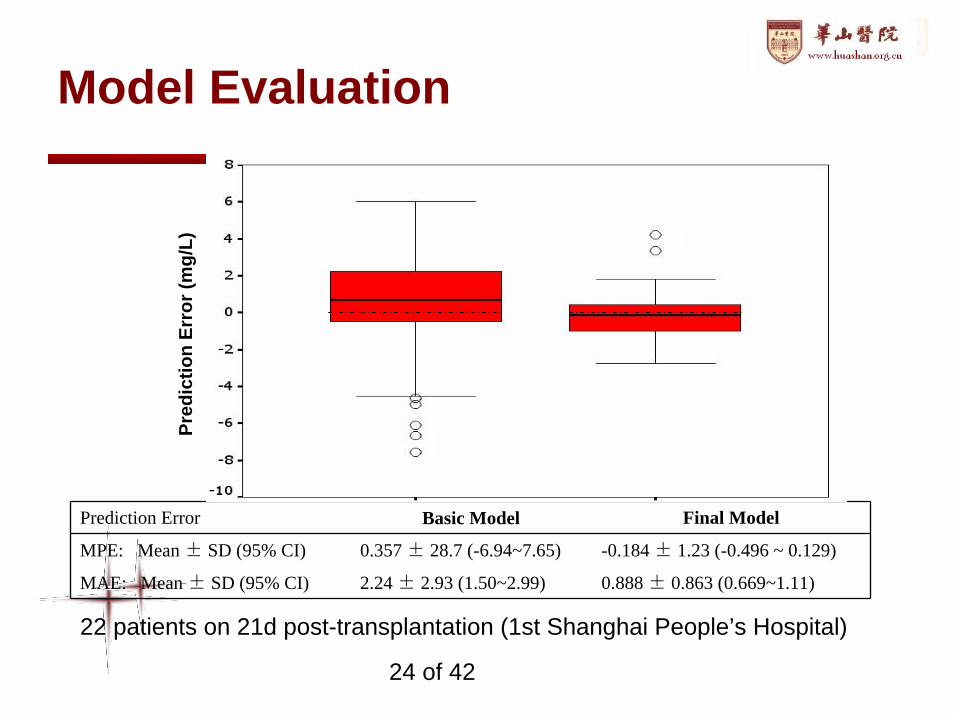
Model Evaluation
Prediction Error Basic Model Final Model
MPE: Mean ± SD (95% CI) 0.357 ± 28.7 (-6.94~7.65) -0.184 ± 1.23 (-0.496 ~ 0.129)
MAE: Mean ± SD (95% CI) 2.24 ± 2.93 (1.50~2.99) 0.888 ± 0.863 (0.669~1.11)
Pred
ictio
n Er
ror (
mg/
L)
22 patients on 21d post-transplantation (1st Shanghai People’s Hospital)
24 of 42
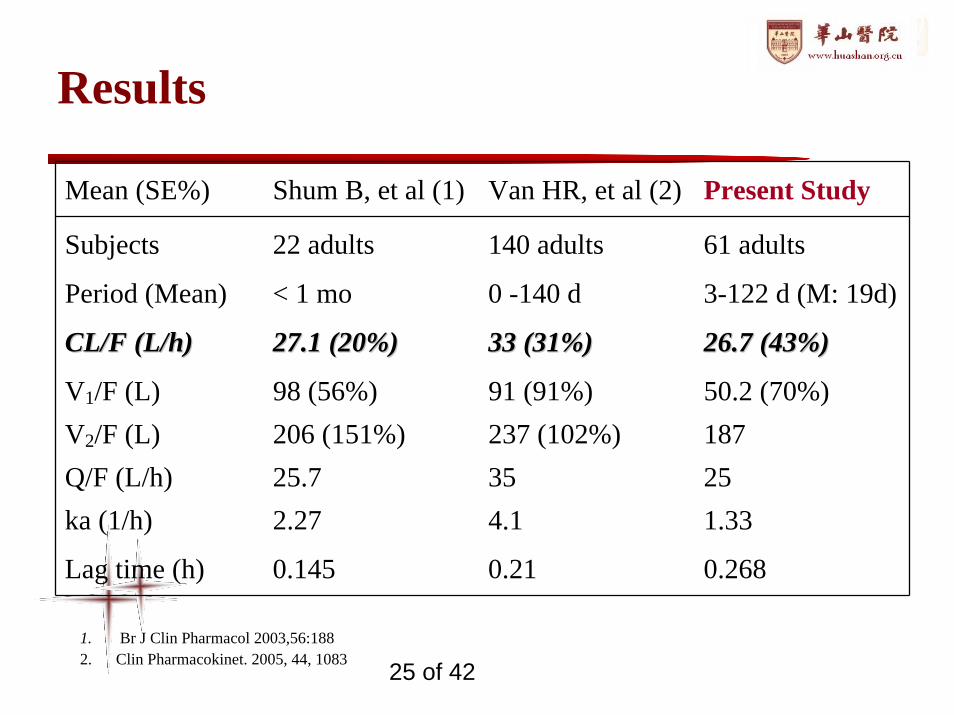
Results
Mean (SE%) Shum B, et al (1) Van HR, et al (2) Present Study
Subjects 22 adults 140 adults 61 adults
Period (Mean) < 1 mo 0 -140 d 3-122 d (M: 19d)
CL/F (L/h)CL/F (L/h) 27.1 (20%)27.1 (20%) 33 (31%)33 (31%) 26.7 (43%)26.7 (43%)
V1/F (L) 98 (56%) 91 (91%) 50.2 (70%)V2/F (L) 206 (151%) 237 (102%) 187Q/F (L/h) 25.7 35 25ka (1/h) 2.27 4.1 1.33
Lag time (h) 0.145 0.21 0.268
1. Br J Clin Pharmacol 2003,56:1882. Clin Pharmacokinet. 2005, 44, 1083 25 of 42
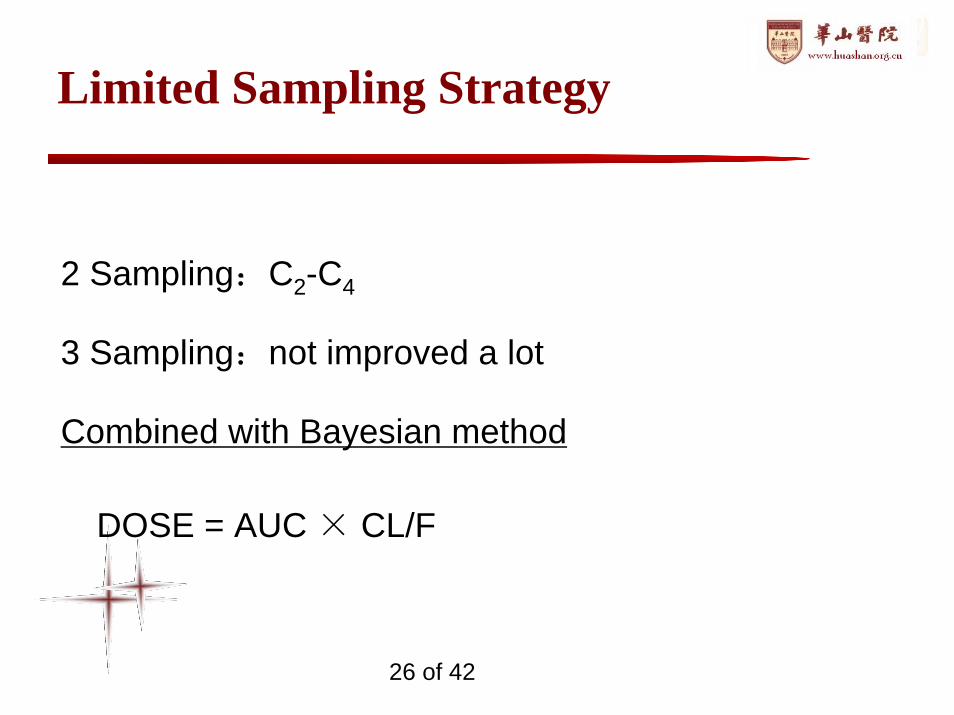
Limited Sampling Strategy
2 Sampling:C2-C4
3 Sampling:not improved a lot
Combined with Bayesian method
DOSE = AUC × CL/F
26 of 42
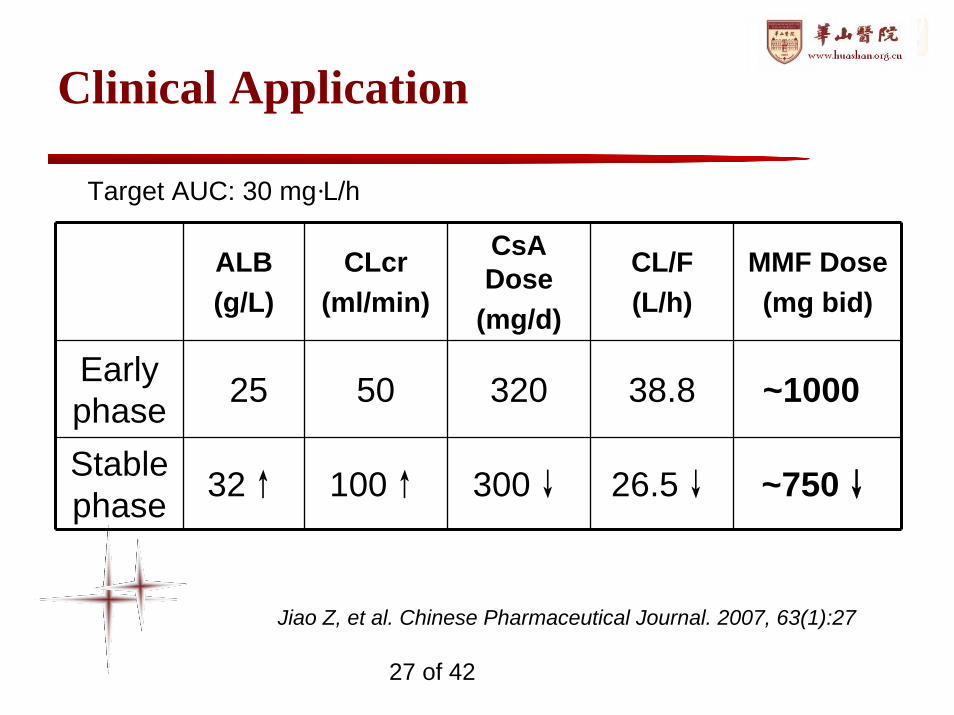
Clinical Application
ALB(g/L)
CLcr(ml/min)
CsADose
(mg/d)
CL/F(L/h)
MMF Dose(mg bid)
Early phase 25 50 320 38.8 ~1000
Stable phase 32↑ 100↑ 300↓ 26.5↓ ~750↓
Target AUC: 30 mg·L/h
Jiao Z, et al. Chinese Pharmaceutical Journal. 2007, 63(1):27
27 of 42
Conclusion
• There was no obvious PK difference in MPA (but MPAG) between Chinese and Caucasians
• 1000 mg bid in the early phase– <~ 1 month
• 750 mg bid in the stable phase– >~ 1 month
• Limited sampling strategy: C2-C4• The findings of this study & clinical outcomes resulted in
the revision of clinical pathway of the hospital
28 of 42
Association of ABCB1, CYP3A4*18Band CYP3A5*3 Genotypes on the PK of Tacrolimus in Healthy Chinese: a Population PK Analysis
Case Study 2
J Clin Pharm Ther (in press)
29 of 42
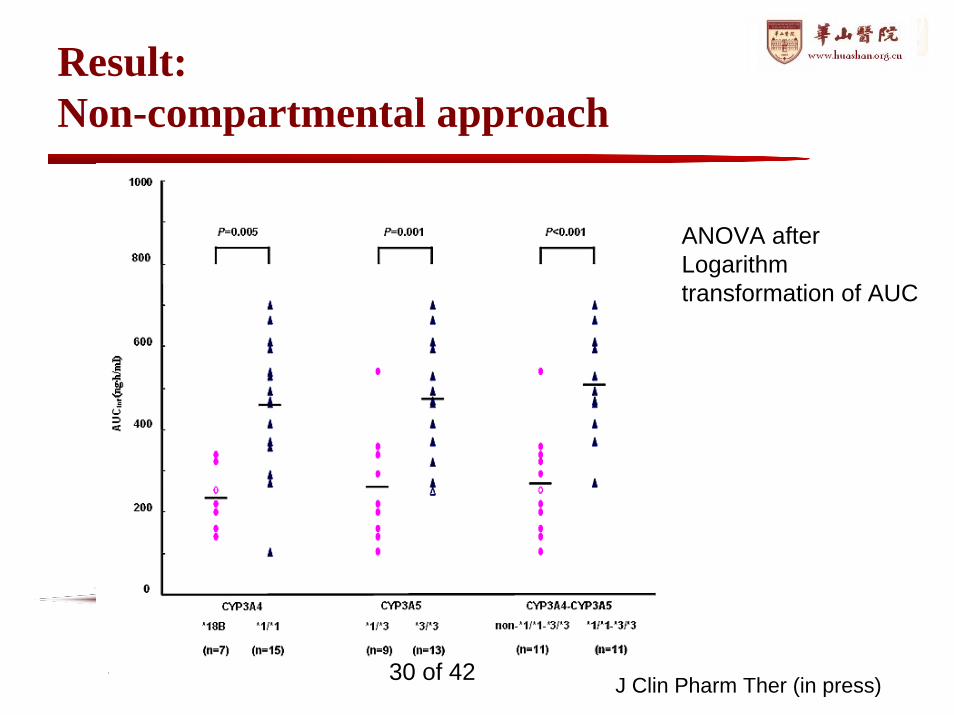
Result:Non-compartmental approach
J Clin Pharm Ther (in press)
ANOVA after Logarithm transformation of AUC
30 of 42
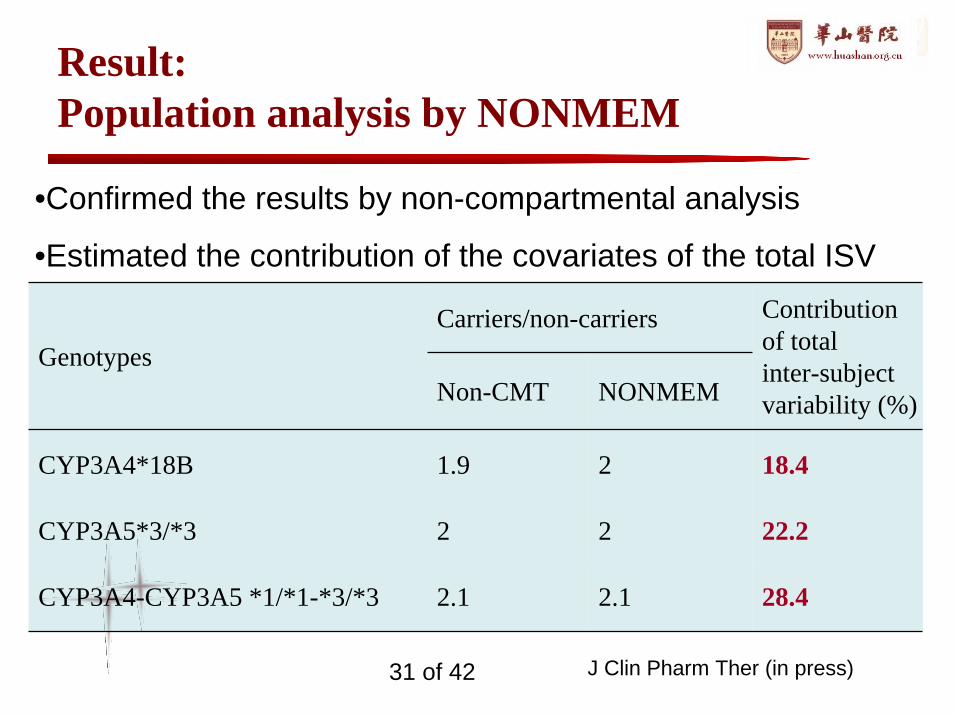
Result:Population analysis by NONMEM
Carriers/non-carriersGenotypes
Non-CMT NONMEM
Contribution of totalinter-subject variability (%)
CYP3A4*18B 1.9 2 18.4
CYP3A5*3/*3 2 2 22.2
CYP3A4-CYP3A5 *1/*1-*3/*3 2.1 2.1 28.4
•Confirmed the results by non-compartmental analysis
•Estimated the contribution of the covariates of the total ISV
J Clin Pharm Ther (in press)31 of 42
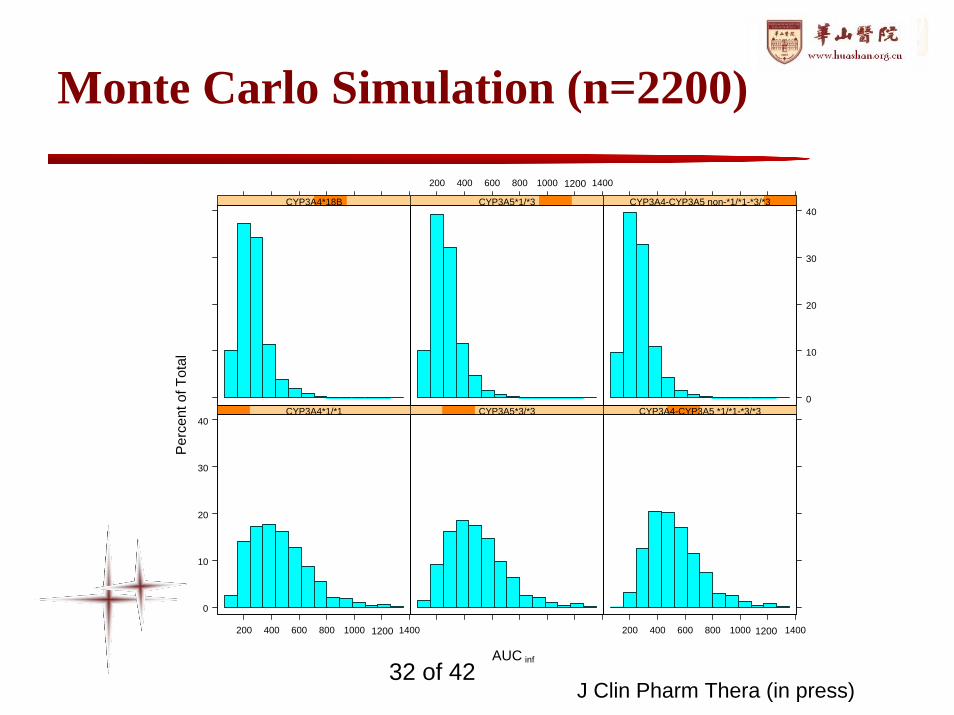
Monte Carlo Simulation (n=2200)
0
10
20
30
40
200 400 600 800 1000 1400
CYP3A4*1/*1 CYP3A5*3/*3
200 400 600 800 1000 1400
CYP3A4-CYP3A5 *1/*1-*3/*3
CYP3A4*18B
200 400 600 800 1000 1400
CYP3A5*1/*3
0
10
20
30
40CYP3A4-CYP3A5 non-*1/*1-*3/*3
AUC
Per
cent
of T
otal
1200
12001200
inf
J Clin Pharm Thera (in press)32 of 42
Population PK-PD Modeling of Sirolimus and Its Impact on Lipids in Chinese Renal Transplant Patients
Case study 3
Jiao Z et al. BJCP. 2009 68:4733 of 42
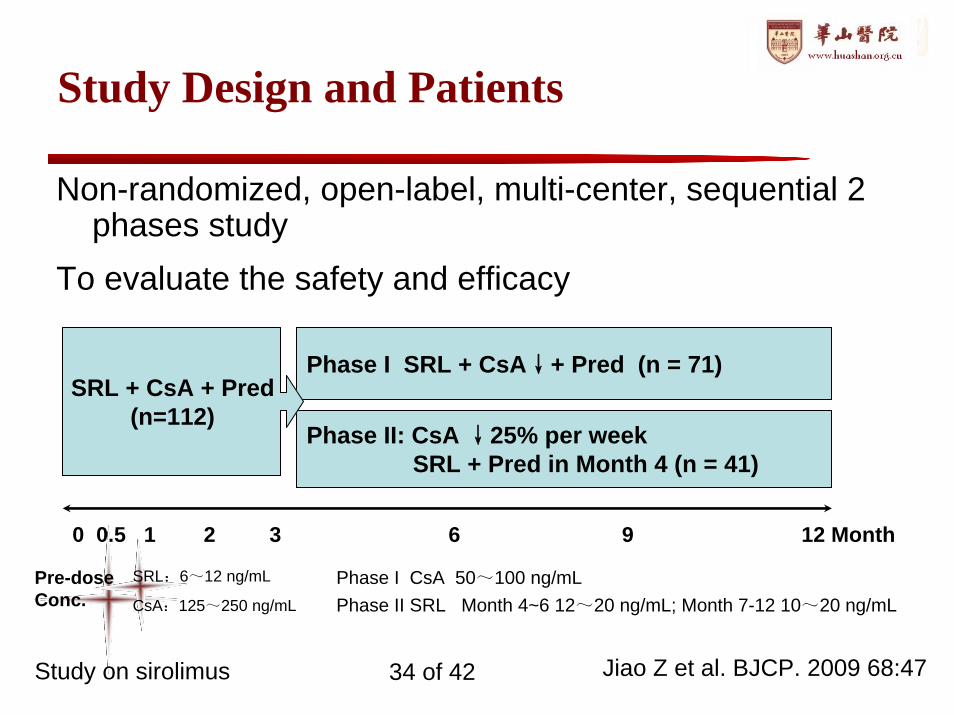
Study Design and Patients
Non-randomized, open-label, multi-center, sequential 2 phases study
To evaluate the safety and efficacy
SRL:6~12 ng/mL
CsA:125~250 ng/mL
Phase I CsAPhase II SRL M
50~100 ng/mLonth 4~6 12~20 ng/mL; Month 7-12 10~20 ng/mL
0 0.5 1 2 3 6 9 12 Month
Phase I SRL + CsA↓+ Pred (n = 71)
Phase II: CsA ↓25% per week SRL + Pred in Month 4 (n = 41)
SRL + CsA + Pred(n=112)
Pre-dose Conc.
Jiao Z et al. BJCP. 2009 68:47 Study on sirolimus 34 of 42
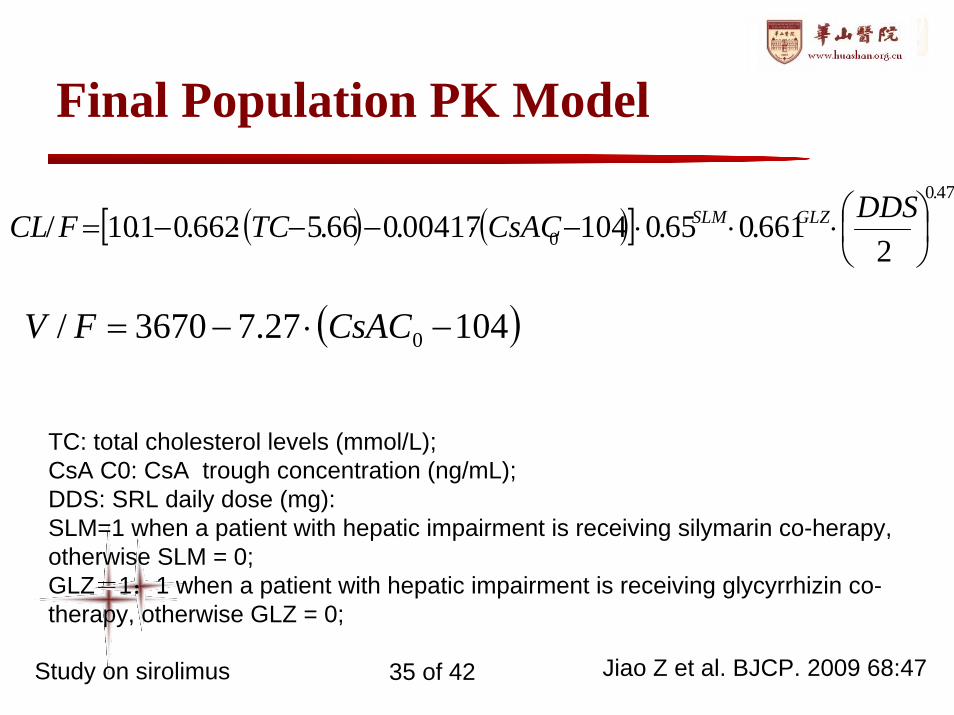
Final Population PK Model
( ) ( )[ ]479.0
0 2661.065.010400417.066.5662.01.10/ ⎟
⎠⎞
⎜⎝⎛⋅⋅⋅−⋅−−⋅−=DDSCsACTCFCL GLZSLM
( )10427.73670/ 0 −⋅−= CsACFV
TC: total cholesterol levels (mmol/L);CsA C0: CsA trough concentration (ng/mL); DDS: SRL daily dose (mg): SLM=1 when a patient with hepatic impairment is receiving silymarin co-herapy, otherwise SLM = 0;GLZ=1:1 when a patient with hepatic impairment is receiving glycyrrhizin co-therapy, otherwise GLZ = 0;
Jiao Z et al. BJCP. 2009 68:47 Study on sirolimus 35 of 42
Silymarin → ~30%↓in CL
• Silymarin– hepatoprotection drug widely use around the world – a flavonolignan from the ‘milk thistle’– Added when patients have abnormal liver function
indices• Cotherapy with Silymarin → CL ↓
– Silymarin itself– Abnormal liver function– Silymarin + Abnormal liver function
Jiao Z et al. BJCP. 2009 68:47 Study on sirolimus 36 of 42
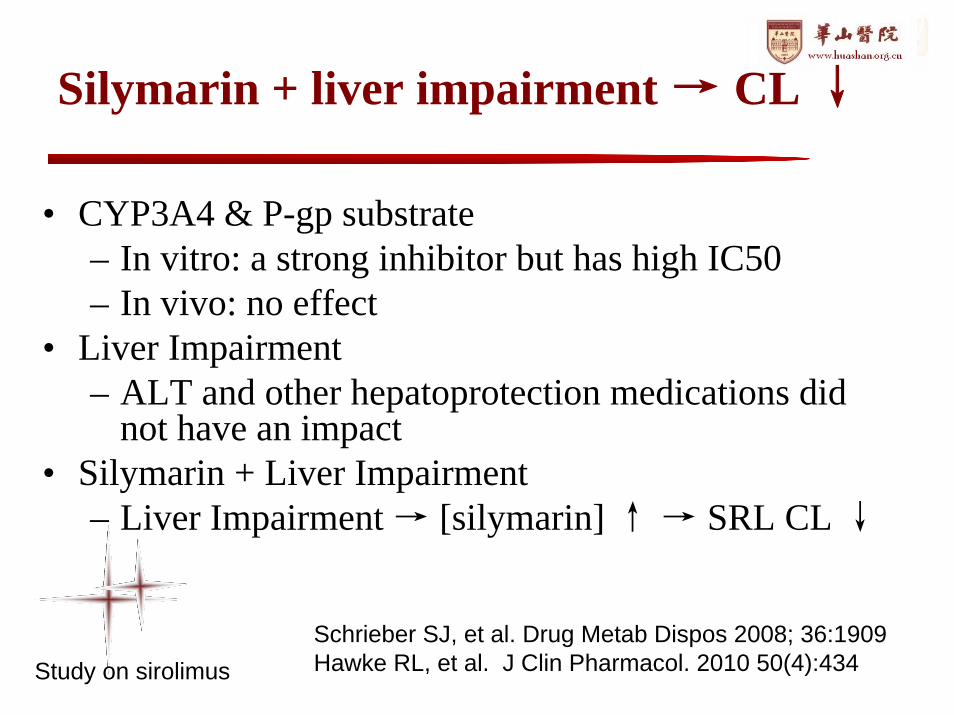
Silymarin + liver impairment → CL ↓
• CYP3A4 & P-gp substrate– In vitro: a strong inhibitor but has high IC50 – In vivo: no effect
• Liver Impairment– ALT and other hepatoprotection medications did
not have an impact• Silymarin + Liver Impairment
– Liver Impairment → [silymarin] ↑→ SRL CL ↓
Schrieber SJ, et al. Drug Metab Dispos 2008; 36:1909Hawke RL, et al. J Clin Pharmacol. 2010 50(4):434Study on sirolimus
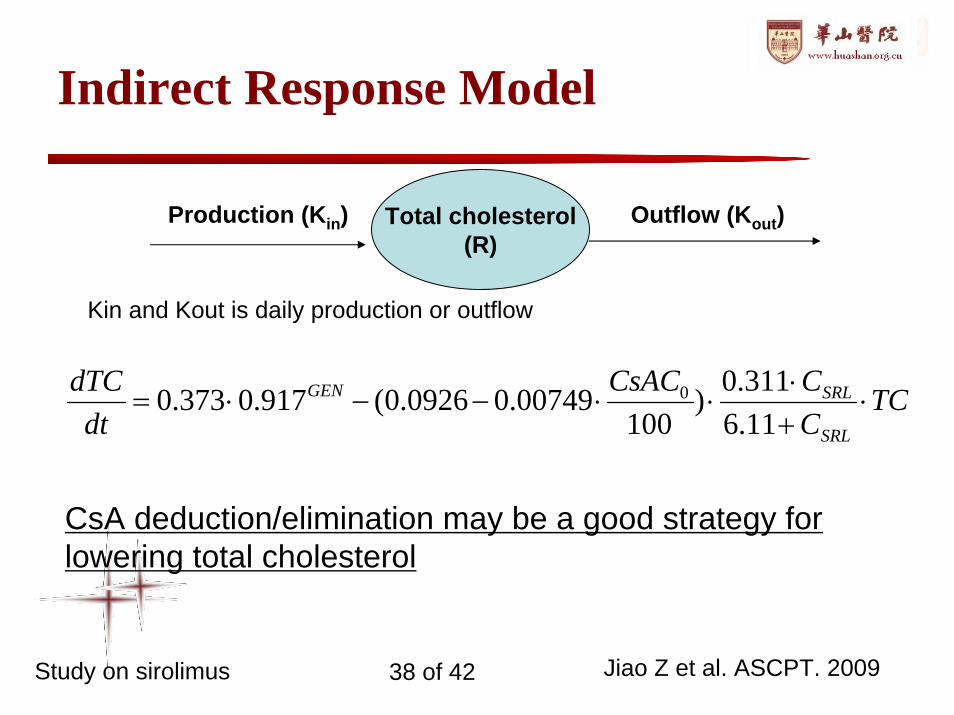
Total cholesterol(R)
Production (Kin) Outflow (Kout)
Indirect Response Model
Kin and Kout is daily production or outflow
Jiao Z et al. ASCPT. 2009
TCCCCsAC
dtdTC
SRL
SRLGEN ⋅+⋅
⋅⋅−−⋅=11.6311.0)
10000749.00926.0(917.0373.0 0
CsA deduction/elimination may be a good strategy for lowering total cholesterol
Study on sirolimus 38 of 42
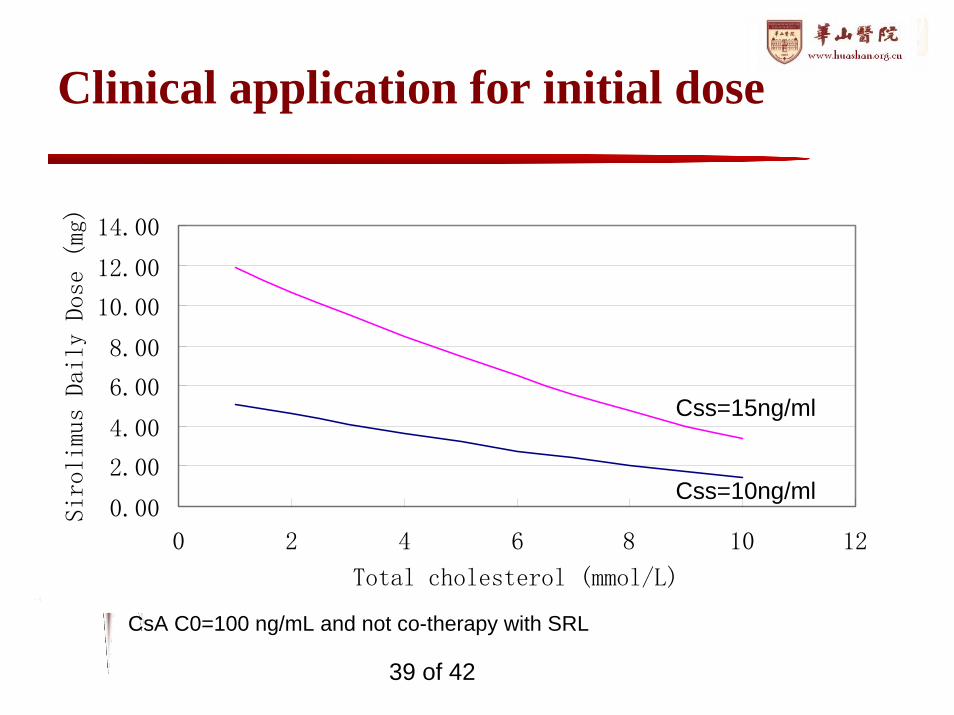
Clinical application for initial dose
0.00
2.00
4.00
6.00
8.00
10.00
12.00
14.00
0 2 4 6 8 10 12
Total cholesterol (mmol/L)
Sirolimus Daily Dose (mg)
CsA C0=100 ng/mL and not co-therapy with SRL
Css=10ng/ml
Css=15ng/ml
39 of 42
Summary
• To estimate relevant pharmacokinetic or PK/PD parameters •in the target patient population
• To identify and measure potential sources of variability•demographic & patho-physiological•environmental & genetic
• To quantify the unexplained variability•variability within an individual•measurement error, model misspecification, etc
40 of 42
Acknowledgement
Transplantation Center, Huashan Hospital– Dr. Ming Zhang, Dr. Jian-yongZhong & Dr.
Fu-ming Lu– All nurses and staffs
Clinical Pharmacy Laboratory– Prof. Ming-kang Zhong; Prof Xiao-jin Shi; – Dr Xian-yan Qiu
41 of 42

Thank you for your attention!