Embed Size (px)
Citation preview
International Journal of Scientific and Research Publications, Volume 7, Issue 8, August 2017 169
ISSN 2250-3153
Population, Incipient Desertification and Prediction of
Household Agroforestry Uptake in Tabora Region,
Tanzania
George Felix Masanja
Department of Geography, St. Augustine University of Tanzania, Box 307, Mwanza, Tanzania
Abstract- Environmental conservation in the world presents a daunting task due to population increase. In Tanzania, environmental
degradation has occurred at an alarming rate in specific areas including Tabora. The continued burgeoning of the human population
has resulted in changes in land use, increasing demand for resources and excision of forests. This study employed the theory of
planned behaviour to predict on-farm tree planting behaviour of farmers. A sample size of 288 farmers drawn from Nzega and
Sikonge districts in Tabora region was interviewed to measure standard theory of planned behaviour constructs. The data and
hypotheses were examined using structural equation modeling performed in partial least squares algorithms. Results from the
maximum likelihood estimation showed that attitudes, subjective norms and perceived behavioural controls were significantly and
positively associated with stronger intention and related to farmers’ behaviours in farming decisions. Farmers saw hindrance in tree
planting operations being a result of cultural beliefs which yielded negative impacts. However, these were outweighed by perceptions
of positive impacts. The drivers of these constructs can be harnessed by policy makers by directing farmers’ intentions and behaviours
toward conserving and sustaining fragile eco-environmentally areas against a threatening population growth in the region through
agroforestry uptake programs.
Index Terms- Population growth, Deforestation, Tree planting, Gender, Theory of planned behaviour.
1. INTRODUCTION
Population increase, agricultural productivity and environmental degradation have characterised many developing countries including
Tanzania. These trends have negatively impacted on the development and natural resources, amidst the increasing demand for
resources in the wake of ever increasing population. Environmental degradation in several parts ofTanzania not only affects
biodiversity but also has a direct impact on water quantity and quality, livelihood, poverty and development of a nation.
The Tanzanian population grew from about 12 million people in 1967 to 44.9 million in 2012, almost four times. With the annual
population growth rate of 2.7 percent, Tanzania’s population is projected to go up to 69.1 and 129.1 million in 2025 and 2050
respectively [1]. Population growth, in both rural and urban areas, is the underlying factor behind rapid rates of deforestation in
Tanzania. Population growth intensifies the necessities for basic needs such as food, shelter, infrastructure development, fuelwood,
furniture, construction materials and other products. In meeting these accumulating demands, deforestation is inevitable. The impact
of population growth on deforestation is worsened by the reality that the growing population remains in poverty with limited
livelihood strategies and, therefore, compelled to undertake unsustainable economic options including deforestation.
Tanzania is facing an exceptional loss of its forests and other woodlands. Over the last three decades, blocks of forests in Tanzania
have been heavily impacted by official forest excisions as well as illegal, irregular and unplanned settlements. Evaluation of
vegetation cover change based on time-series satellite images and repeated aerial surveys showed that between 1990 and 2010, the
country lost an average of 403,350 ha or 0.97 percent per year and also, between 1990 and 2010 the total loss was estimated to be 19.4
percent (about 8,067,000 ha) of the forest cover [2]. Within this timespan, Tanzania was, among the ten countries that had the largest
annual net loss of forest area. A recent report indicates that the country had already lost about 38 percent of its forest cover [3].
According to the report, the rate of loss is 400,000 ha per year and the risk considered to be high as the country’s entire forests are
likely to be depleted within the next 50 to 80 years if the current trend remains persistent.
Although there are information gaps for some disciplines on a sustained basis, already links have been suggested between population
growth, land cover change, land degradation and an acute shortage of water [4]. Among the reasons for desertification caused by
population growth are deforestation, overgrazing and over cultivation. Expansion of agriculture, especially the massive clearance of
www.ijsrp.org
International Journal of Scientific and Research Publications, Volume 7, Issue 8, August 2017 ISSN 2250-3153
170
www.ijsrp.org
land for cultivation of cash crops such as cotton and tobacco to increase export earnings has been mentioned as one of the leading
causes of deforestation in Tanzania [5].
While data for various land vegetation in Tanzania from 1990 to 2010 displays a declining trend for forests and other wooded lands,
subsistence agriculture alone is accountable for 48 percent of deforestation while commercial agriculture contributes 32 percent [6]. In
Tanzania, the impact of agriculture on deforestation (see figure 1) is affected by a number of factors including human population
growth, poverty and unfavourable government policies. Human population increase translates into the expansion of land under
agriculture in forest areas in order to meet the growing demand for food and income. As pointed out earlier, poverty is linked to
incapability to afford the agricultural inputs for bumper crop production. As a consequence, people are forced to leave the existing
farms and clear virgin forests for new farms, the practice commonly known as shifting cultivation. To farmers, virgin lands have a
number of advantages, making it less laborious. Virgin forest soils are easy to work with; fresh farms have fewer weeds for about two
seasons. Therefore, weeding is very much lessened; new farms are less infested by pests; fresh forest soils are well drained and require
minimum tillage before planting [7].
With reference to the 2002-2012 intercensal period, Tabora region's 2.9 percent average annual population growth rate was the 9th
highest in the country [8]. It was also the 24th
most densely populated region with 30 people per square kilometre. Census data for the
last two decades indicate a dramatic population increase in Tabora region. The projections show that population growth rate will
increase from 3.8 percent in 2003 (with a population of 1,777,437) to 3.9 percent in 2025 (with a population of 4,181,327) [9]. The
rapid population increase since 1980 has occurred mainly due to the influx of farmers, attracted by fertile forest soils and improving
infrastructure. The demand for water and other natural resources to serve basic needs is growing steadily as the population continues
to increase. This is putting tremendous pressure on what are already scarce and highly vulnerable natural resources. Tabora region’s
land converted from natural vegetation to cultivated land (see figure 1) between 1984 and 1995 was 4.7 percent compared to 11.2
percent that was converted between 1995 and 2000 [10]. There is a total of 33 Forest Reserves which have a total area of 3,422,500
hectares out of which about 119,691 hectares are catchment forests, and as of now, about 201,017 hectares have disappeared through
encroachment [11]. As a result of the high deforestation rate and subsequent fire-based agricultural land preparation with little or no
fertiliser input, soil fertility has declined tremendously in the area. Natural secondary succession in the left bushlands and grasslands is
also prevented by a constant annual recurrence of fire.
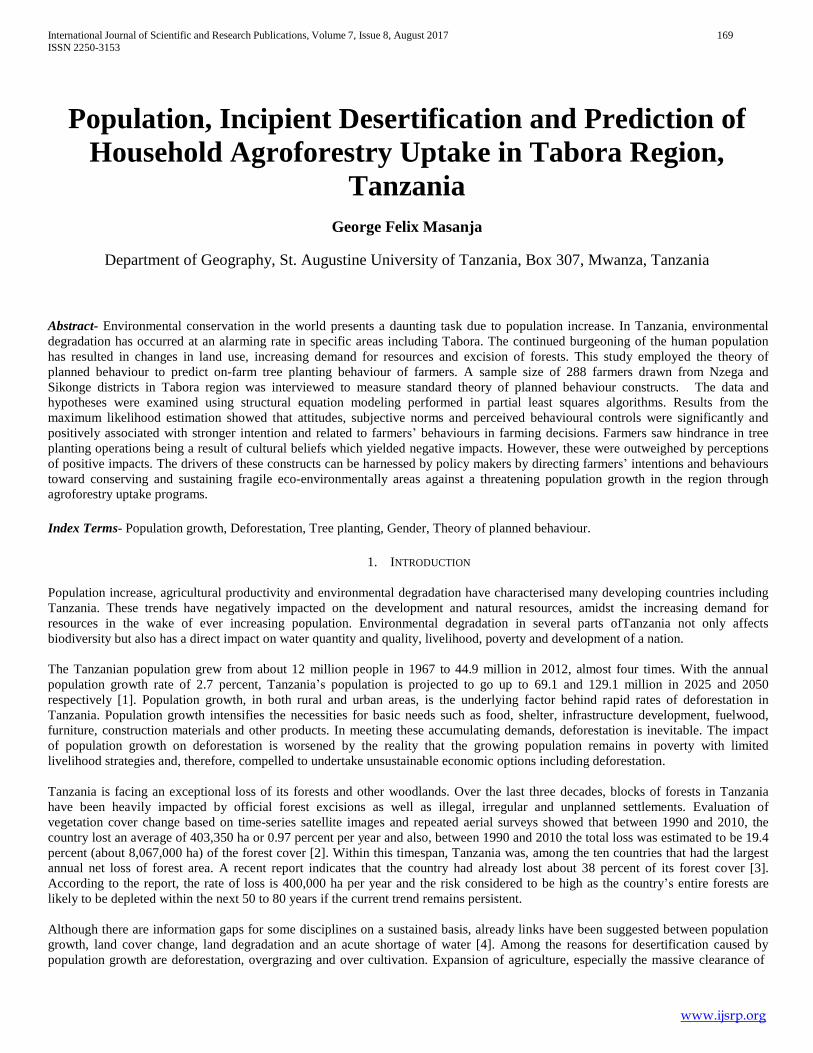
Fig 1.Miombo woodland invasion in Mitowo Village, Sikonge District, Tabora region
Source: Author, December, 2016
Agroforestry and reforestation practices, when appropriately directed toward biophysical and socio-economic conditions, have the
potential to solve some of the problems of poverty, food insecurity and environmental degradation. Tree planting is essential to reduce
the pressure on natural forests. It has been demonstrated that agroforestry and reforestation of public lands can augment the ability of
farmers to face the effects of climate change [12], improve soil fertility and boost crop yields [13]. In Tanzania, several studies have
International Journal of Scientific and Research Publications, Volume 7, Issue 8, August 2017 ISSN 2250-3153
171
www.ijsrp.org
reported increased yields in agroforestry systems compared to monoculture crops [14]. Bumper crop yields coupled with the sale of
tree products such as fruits, firewood and poles can increase income, as has been demonstrated in Tanzania, Nigeria and Zambia [15,
16, 17] respectively.
Although it is anticipated that recognition of the importance of forests is likely to increase tree planting, this has not always been the
case with reference to Nzega and Sikonge districts of Tabora region. There are other factors which intervene and discourage farmers
from planting trees within and surrounding their farms and compounds. Despite the multiple benefits associated with tree planting
activities, it has been argued that agroforestry uptake has lagged behind [18]. The need to look for alternative approaches to reduce
deforestation in Tabora region is widely acknowledged [19, 20]. However, there have been serious constraints in tree establishment on
farmers’ fields or on marginal lands because of various reasons.
Several studies have examined the challenges facing the uptake of agroforestry, yet conventional adoption studies have had a tendency
to look at personal, social and economic variables when explaining agroforestry adoption [21, 22, 23, 24, 25].
Cultural beliefs, particularly in the Tanzanian context, have a strong influence on tree planting adoption. It is not easy to generalise
about cultural norms and customary rulings because they differ from different people in various areas. In western Kenya, for example,
tree planting activities are dominated by men and the concept of tree owners has been effectively sustained through well manipulated
cultural practices (taboos) resulting in fewer women than men participating in tree activities [26, 27]. Cultural taboos observable in
western Kenya are gender-bound such that a woman is feared to become barren or her husband is more likely to die if she dares
planting a tree [28].
Traditionally, farmers in Tabora region do not grow trees because until recently, wood was regarded as plentiful and because they
lacked information on tree planting and germplasm [29]. Therefore, farmer's knowledge on planting and management of trees in the
region is limited. Even after the introduction of communal woodlots in the region, earliest efforts were not successful owing to among
other things, farmers disliking the species (e.g. eucalyptus). Of more importance, farmers were unwilling to cooperate in the
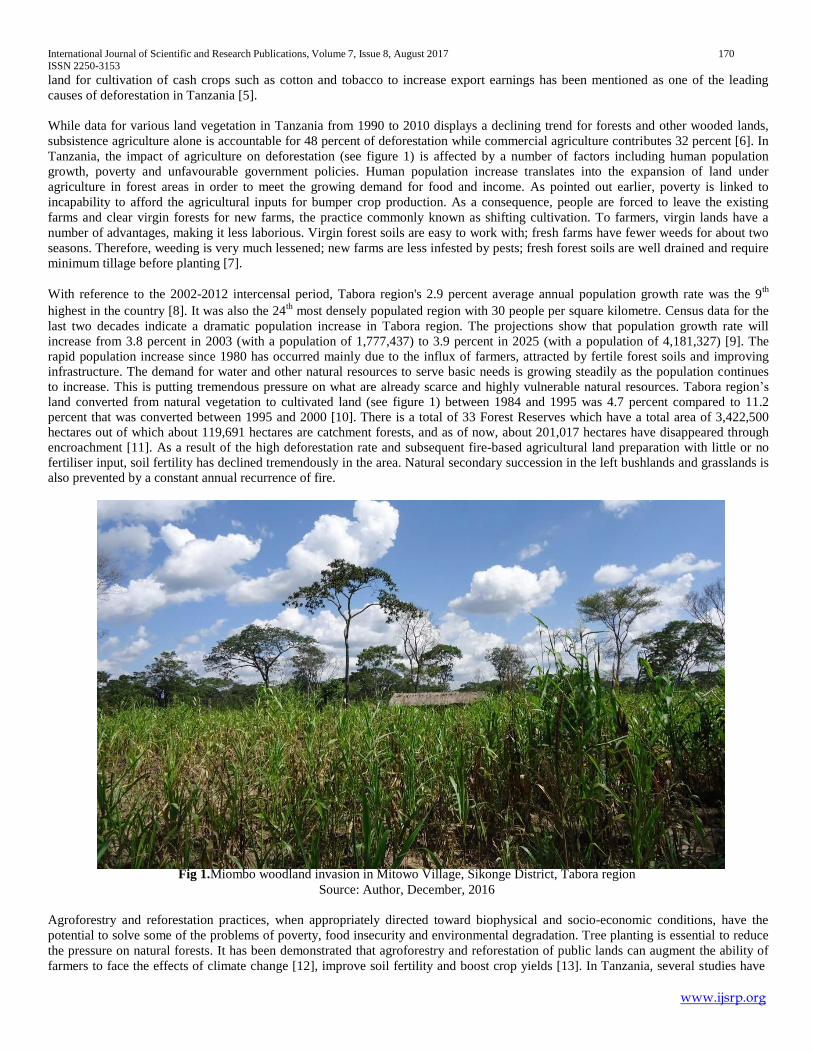
establishment of communal woodlots because of the perceived and actual implications of woodlots planting. As of recent (see figure
2), these woodlots have slowly been found to be economically and ecologically and socially sound in Tabora region [30].
Fig 2. Agroforestry in Ngwatu Village, Nzega District, Tabora region
Source: Author, December, 2016
More recent studies have also looked at socio-psychological factors, such as perceptions and attitudes, to explain adoption behaviour
in relation to farm level tree planting [31, 32, 33, 13, and 25]. [34] for example studied the perceptions and attitudes of farmers in
Pakistan and found that willingness to grow trees on the farms was a function of their attitudes towards the benefits and challenges of
growing trees. [35] looked at the role of self-efficacy in the decision-making process of agroforestry adoption in Brazil and concluded
that perceived behavioural control, attitudes about conservation and available labour contributed significantly to the intention to adopt
International Journal of Scientific and Research Publications, Volume 7, Issue 8, August 2017 ISSN 2250-3153
172
www.ijsrp.org
or maintain agroforestry and reforestation. Likewise, [36] claimed that socio-psychological factors of farmers need to be taken into
consideration when planning socially acceptable agroforestry programs in the Western Himalayas.
Overall, these studies demonstrate that socio-psychological factors such as perceptions and attitudes can explain the incidence and
extent of tree planting activities; however, many existing analyses have not taken into account the perspectives harnessed from local
farmers [37, 38]. Specifically, relatively few studies have looked at the role of socio-psychological factors in explaining agroforestry
and reforestation adoption. Owing to the methodological difficulties related to studying tree planting behaviour, it is unclear whether
socio-psychological factors such as beliefs, norms, attitudes, and intentions are responsible for tree planting behaviour in Tabora
region and Tanzania in general. The general objective of this study was to identify and evaluate the influential factors on attitudes
toward participation in tree planting among households in selected community sub-samples drawn from the two districts of Tabora
region, Tanzania. The specific objectives of this study were threefold. First to identify and analyse the factors that underlie farmers’
decisions to engage in farm forestry. Secondly, to examine the gender differences in tree planting between farmers in the northern and
southern districts of Tabora region and thirdly, to assess the utility and efficacy of the Theory of Planned Behaviour (TPB) (see figure
4) to explain farmers’ intention to adopt agroforestry as an aid to the provision of practical information which may lead to curtailing
deforestation and poverty.
Theoretical Framework and Research Hypotheses
Theory of Planned Behavior (TPB)
A modified TPB [39] was used in this study to predict and analyse farmers’ socio-psychological factors toward tree planting. [39]
TPB presents a theoretical framework for analysing in an orderly manner the behaviour concerning tree planting. In accordance with
the theory, a person’s behaviour is based on his or her preparedness to execute that behaviour (i.e. intention). This intention is
primarily anchored on three antecedent determinants: (1) attitude (A), which is purely a personal positive or negative perception of
executing a behaviour. An attitude is defined as “a person’s favourable or unfavourable evaluation of the behaviour and is formed by
the beliefs about the likely outcomes of the behaviour (salient beliefs) and the evaluations of these outcomes” [40]. (2) Subjective
norm (SN), which is the individual’s perception of social pressure to engage or not in a behaviour and is constructed by beliefs about
the perceived behavioural control which reflects the extent to which the individual feels he or she can actually carry out the behaviour
(normative beliefs) and the motivation to comply with these expectations. It refers to a person’s understanding of other people’s social
pressure to execute or not to execute the behaviour [40]. Influence may stem from social referents like peers and (3) perceived
behavioural control (PCB), which is a personal understanding of his or her ability to execute a given behaviour. It refers to the
individual’s perception of the fact that there exists personal and situational impediments to the performance of the behaviour. It
reflects the extent to which the individual feels he or she can actually carry out the behaviour, which is based on beliefs and the
perceived power of these factors [39]. In sum, the combination of the attitude toward the behaviour, the subjective norm, and the
perception of behavioural control leads to the establishment of a behavioural intention, which consequently leads to the execution of
the behaviour [39]. The TPB has been used to study the attitudes, intentions and behaviour in relation to farm-level tree planting and
has been found to be a suitable model to understand such attitudes and behaviour [35] and [34].
Within the context of the TPB, more concentration is given to the identification of the underlying factors that influence separation
behaviours. Several studies have recommended for additional variables to improve the predicting validity of the theory. A supportive
example is drawn from Sao Paulo where moral obligation had a meaningful influence on the prevention behaviours among households
[41]. Davis proposed that situational factors should also be added as a variable in the model [42]. This variable could be measured by
evaluating the extent to which the respondents understand situational factors as impediments to performing tree planting behaviour.
Ramayah put environmental knowledge as an additional variable to his model [43]. This particular study added situational factors in
the model.
Research Hypotheses
The specific hypotheses tested by this study on the uptake of tree planting are stated below.
HI: Socio-demographic variables significantly and positively influence the TPB constructs which differ by gender and geographic
locations.
H2: Farmers’ attitudes toward tree planting significantly and positively influence their intentions to adopt on-farm tree planting.
H3: Farmers’ subjective norms significantly and positively influence their intentions to adopt on-farm tree planting.
H4: Farmers’ perceived behavioural control over tree planting significantly and positively influence their intentions to adopt on-farm
tree planting.
International Journal of Scientific and Research Publications, Volume 7, Issue 8, August 2017 ISSN 2250-3153
173
www.ijsrp.org
H5: Farmers’ intentions toward tree planting have a positive effect on on-farm tree planting behaviour.
H6: Situational factors have a significant influence on on-farm tree planting behaviour.
II. MATERIALS AND METHODS
Study area
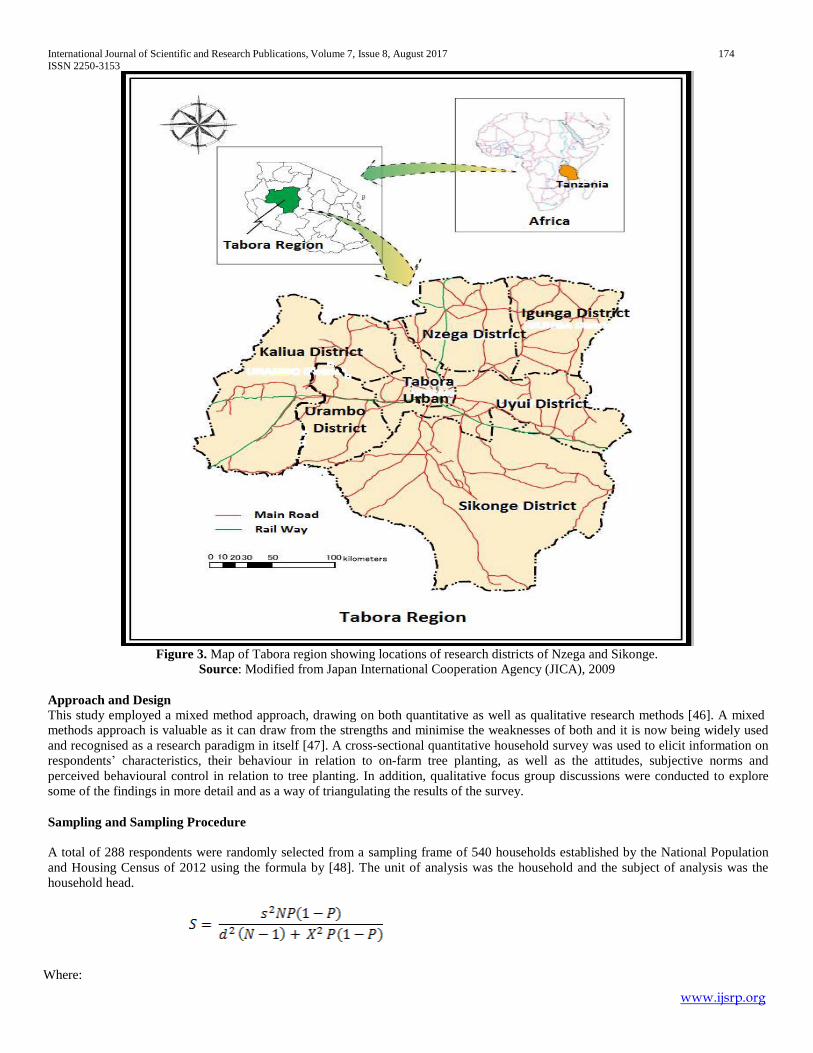
Tabora Region is located in mid-western Tanzania on the central plateau, between latitudes 4°- 7°south and longitudes 31°- 34°east
(Figure 3). The region covers an area of 76,150 km2, representing 9 percent of mainland Tanzania, and lies at an altitude of between
1000 and 1800 metres above mean sea level. The area is bounded to the north by the Manonga Valley, to the east by Wembere River,
to the south by the Ugalla River and the west by the Malagarasi swamps. Tabora region is located on an east-west trending regional
watershed.
This study focused on two study sites in Tabora Region: the northern district Nzega and the southern district Sikonge. Nzega District is one of the seven districts of the Tabora region of Tanzania. It is bordered to the north by Shinyanga region, to the south and south-
west by the Uyui District and to the east by the Igunga District. Its coordinates are 4°19’60” N and 33°4’60” E in degrees, minutes and
seconds, [44]. Nzega district has a total land area of 6,961 square kilometres. Of these, 4,296 square kilometres are either forest reserves or natural forest. Its headquarters is in Nzega township. According to the 2002 Tanzania National Population and Housing
Census, the population of the Nzega district was 417,097 and again according to the 2012 Tanzania Population and Housing Census,
the population had increased to 502,252. The district of Sikonge, on the other hand, has its administrative seat in Sikonge township.
The district, with geographical coordinates of 50 38’ 0” S and 320 46’ 0” N has an area of 27, 873 km2
but 26,834 km2
of it is
occupied by forest and game reserves. It is bordered to the northwest by Urambo district, to the north by Uyui district, to the east by
Manyoni district of Singida region, to the south by Chunya district of Mbeya region, and to the south-west by Mlele district of Katavi region. The population of Sikonge district was 133, 388 by 2002 and by 2012, it had risen to 179, 883 [45]. Sikonge District is
characterised by relatively high levels of forest cover and low population densities. In contrast, most forests have disappeared in
Nzega District, where population densities are high.
www.ijsrp.org
International Journal of Scientific and Research Publications, Volume 7, Issue 8, August 2017 ISSN 2250-3153
174
Figure 3. Map of Tabora region showing locations of research districts of Nzega and Sikonge.
Source: Modified from Japan International Cooperation Agency (JICA), 2009
Approach and Design This study employed a mixed method approach, drawing on both quantitative as well as qualitative research methods [46]. A mixed methods approach is valuable as it can draw from the strengths and minimise the weaknesses of both and it is now being widely used
and recognised as a research paradigm in itself [47]. A cross-sectional quantitative household survey was used to elicit information on
respondents’ characteristics, their behaviour in relation to on-farm tree planting, as well as the attitudes, subjective norms and
perceived behavioural control in relation to tree planting. In addition, qualitative focus group discussions were conducted to explore
some of the findings in more detail and as a way of triangulating the results of the survey.
Sampling and Sampling Procedure
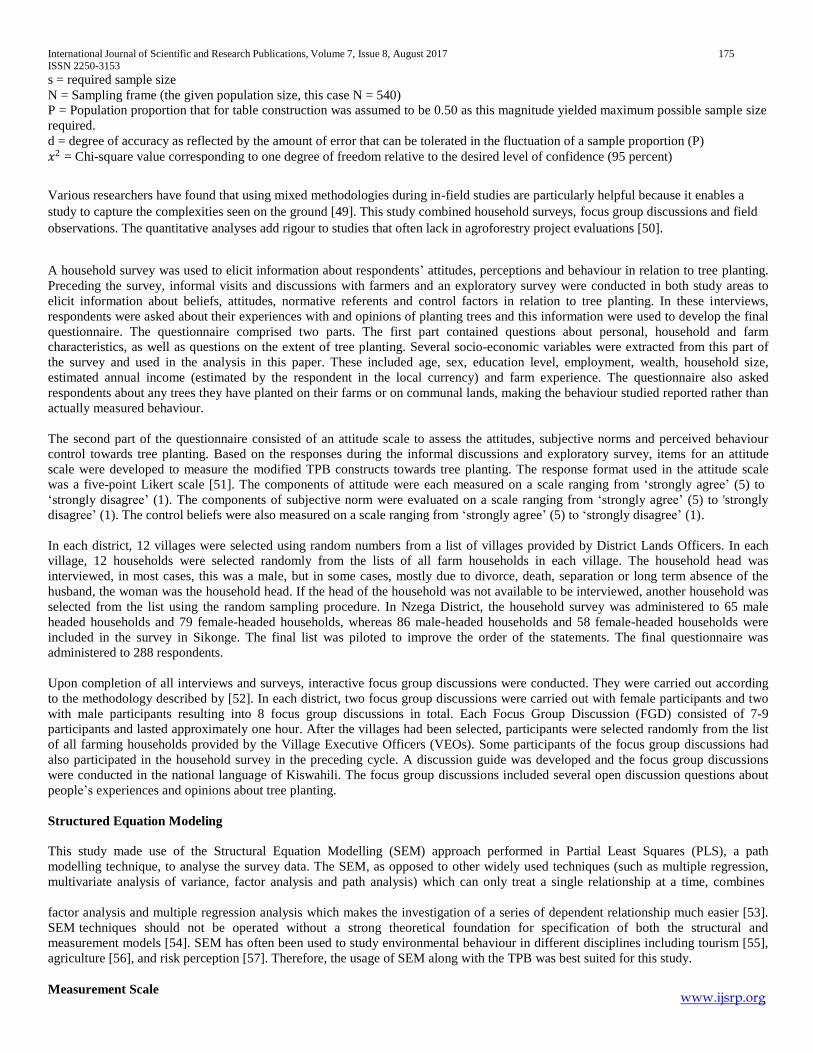
A total of 288 respondents were randomly selected from a sampling frame of 540 households established by the National Population
and Housing Census of 2012 using the formula by [48]. The unit of analysis was the household and the subject of analysis was the
household head.
Where:
www.ijsrp.org
International Journal of Scientific and Research Publications, Volume 7, Issue 8, August 2017 ISSN 2250-3153
175
s = required sample size
N = Sampling frame (the given population size, this case N = 540) P = Population proportion that for table construction was assumed to be 0.50 as this magnitude yielded maximum possible sample size
required.
d = degree of accuracy as reflected by the amount of error that can be tolerated in the fluctuation of a sample proportion (P)
𝑥2 = Chi-square value corresponding to one degree of freedom relative to the desired level of confidence (95 percent)
Various researchers have found that using mixed methodologies during in-field studies are particularly helpful because it enables a
study to capture the complexities seen on the ground [49]. This study combined household surveys, focus group discussions and field
observations. The quantitative analyses add rigour to studies that often lack in agroforestry project evaluations [50].
A household survey was used to elicit information about respondents’ attitudes, perceptions and behaviour in relation to tree planting.
Preceding the survey, informal visits and discussions with farmers and an exploratory survey were conducted in both study areas to
elicit information about beliefs, attitudes, normative referents and control factors in relation to tree planting. In these interviews,
respondents were asked about their experiences with and opinions of planting trees and this information were used to develop the final
questionnaire. The questionnaire comprised two parts. The first part contained questions about personal, household and farm
characteristics, as well as questions on the extent of tree planting. Several socio-economic variables were extracted from this part of
the survey and used in the analysis in this paper. These included age, sex, education level, employment, wealth, household size,
estimated annual income (estimated by the respondent in the local currency) and farm experience. The questionnaire also asked
respondents about any trees they have planted on their farms or on communal lands, making the behaviour studied reported rather than
actually measured behaviour.
The second part of the questionnaire consisted of an attitude scale to assess the attitudes, subjective norms and perceived behaviour
control towards tree planting. Based on the responses during the informal discussions and exploratory survey, items for an attitude
scale were developed to measure the modified TPB constructs towards tree planting. The response format used in the attitude scale
was a five-point Likert scale [51]. The components of attitude were each measured on a scale ranging from ‘strongly agree’ (5) to
‘strongly disagree’ (1). The components of subjective norm were evaluated on a scale ranging from ‘strongly agree’ (5) to 'strongly
disagree’ (1). The control beliefs were also measured on a scale ranging from ‘strongly agree’ (5) to ‘strongly disagree’ (1).
In each district, 12 villages were selected using random numbers from a list of villages provided by District Lands Officers. In each
village, 12 households were selected randomly from the lists of all farm households in each village. The household head was
interviewed, in most cases, this was a male, but in some cases, mostly due to divorce, death, separation or long term absence of the
husband, the woman was the household head. If the head of the household was not available to be interviewed, another household was
selected from the list using the random sampling procedure. In Nzega District, the household survey was administered to 65 male
headed households and 79 female-headed households, whereas 86 male-headed households and 58 female-headed households were
included in the survey in Sikonge. The final list was piloted to improve the order of the statements. The final questionnaire was
administered to 288 respondents.
Upon completion of all interviews and surveys, interactive focus group discussions were conducted. They were carried out according
to the methodology described by [52]. In each district, two focus group discussions were carried out with female participants and two
with male participants resulting into 8 focus group discussions in total. Each Focus Group Discussion (FGD) consisted of 7-9
participants and lasted approximately one hour. After the villages had been selected, participants were selected randomly from the list
of all farming households provided by the Village Executive Officers (VEOs). Some participants of the focus group discussions had
also participated in the household survey in the preceding cycle. A discussion guide was developed and the focus group discussions
were conducted in the national language of Kiswahili. The focus group discussions included several open discussion questions about
people’s experiences and opinions about tree planting.
Structured Equation Modeling
This study made use of the Structural Equation Modelling (SEM) approach performed in Partial Least Squares (PLS), a path
modelling technique, to analyse the survey data. The SEM, as opposed to other widely used techniques (such as multiple regression,
multivariate analysis of variance, factor analysis and path analysis) which can only treat a single relationship at a time, combines
factor analysis and multiple regression analysis which makes the investigation of a series of dependent relationship much easier [53].
SEM techniques should not be operated without a strong theoretical foundation for specification of both the structural and
measurement models [54]. SEM has often been used to study environmental behaviour in different disciplines including tourism [55],
agriculture [56], and risk perception [57]. Therefore, the usage of SEM along with the TPB was best suited for this study.
Measurement Scale
www.ijsrp.org
International Journal of Scientific and Research Publications, Volume 7, Issue 8, August 2017 ISSN 2250-3153
176
Sikonge
A measurement scale was developed for each major variable consisting of multiple items (indicators) borrowed from previous studies.
Guided by the theoretical understanding derived from the literature, questionnaire items that were relevant to the constructs in this
study were identified. The principal constructs were developed based on existing measures where possible or were adapted from
similar scales. Measures for attitude (A), perceived behavioural control (PBC), and subjective norms (SN) (societal norms and social
influences) were based on empirical studies of [25], [24], and [18]. Although most items were based on previous empirical studies,
actual measurement scales were developed to capture the context of this study. The questionnaire items were then modified to match
this study of on-farm tree planting in Tabora region.
Analytic Framework
The quantitative survey data collected was analysed using non-parametric statistical techniques to detect associations and differences
between respondents of the two study sites and between male and female household heads. First, the psychometric quality of the
measures was assessed by calculating their validity and reliability. Second, the theoretical relationship between the variables was
tested by estimating structural models. To obtain more accurate results, the SEM technique using the PLS algorithms was applied to
evaluate the measurement model and structural model simultaneously. To conduct a quantitative study on practical problems, the SEM
assesses the theoretical model according to the extent of consistency between the theoretical model and the actual data. The use of the
SEM is mainly justified in the social sciences due to its capacity to impute relationships between unobserved (latent variables) and
observable constructs.
This approach lends itself to this research because SEM answers a set of interrelated research questions in a single, systematic, and
comprehensive analysis [58]. It also accommodates latent variables (LV) that are unobservable and cannot be directly measured.
Therefore, the use of LVs in this study has the potential to model theoretical constructs such as intentions, attitudes, and perceptions
that are difficult to measure directly. Analysis of Variance (ANOVA) was used to test if attitudes, subjective norms and perceived
behavioural control were different among the respondents. The test was performed in order to assess whether the TPB constructs
explain significant variance in tree planting behaviour among farmers. This step was necessary because there was no prior knowledge
of potential multicollinearity among variables. It was necessary to use this test to explain variations in tree planting behaviour. SEM
techniques were performed with the aid of Analysis of Moment Structure (AMOS) version 19 [59] software package. Focus group
discussions were transcribed verbatim and coded according to a thematic framework and presented in narrative summaries. The
software used for the Tran blocked ions was f4 (Windows). Data were analysed using the Software Atlas.ti v 6.2.26.
III. RESULTS
Response rate
Two hundred and ninety questionnaires were administered to household heads in selected villages of Nzega and Sikonge Districts of
Tabora region, Tanzania. The respondents’ response rate was 100 percent, with 288 valid questionnaires, which was accepted
adequate for testing the stated hypotheses. Sample size plays a major role in the estimation and interpretation of SEM results [60]. In
general, the literature suggests that sample sizes for structural equation models commonly run in the 200 to 400 range. This study
sample size is reasonable enough to analyse descriptive statistics, multivariate analysis and structural equation model. There are
several studies using less than 300 of sample size, such as seatbelt use (N=277) by [61], motorcyclists’ intention to speed (N=110) by
[62], drivers’ decision speed (N=250) by [60], and truck driver behaviour (N=232) by [63].
Socio-demographic Characteristics of the Respondents
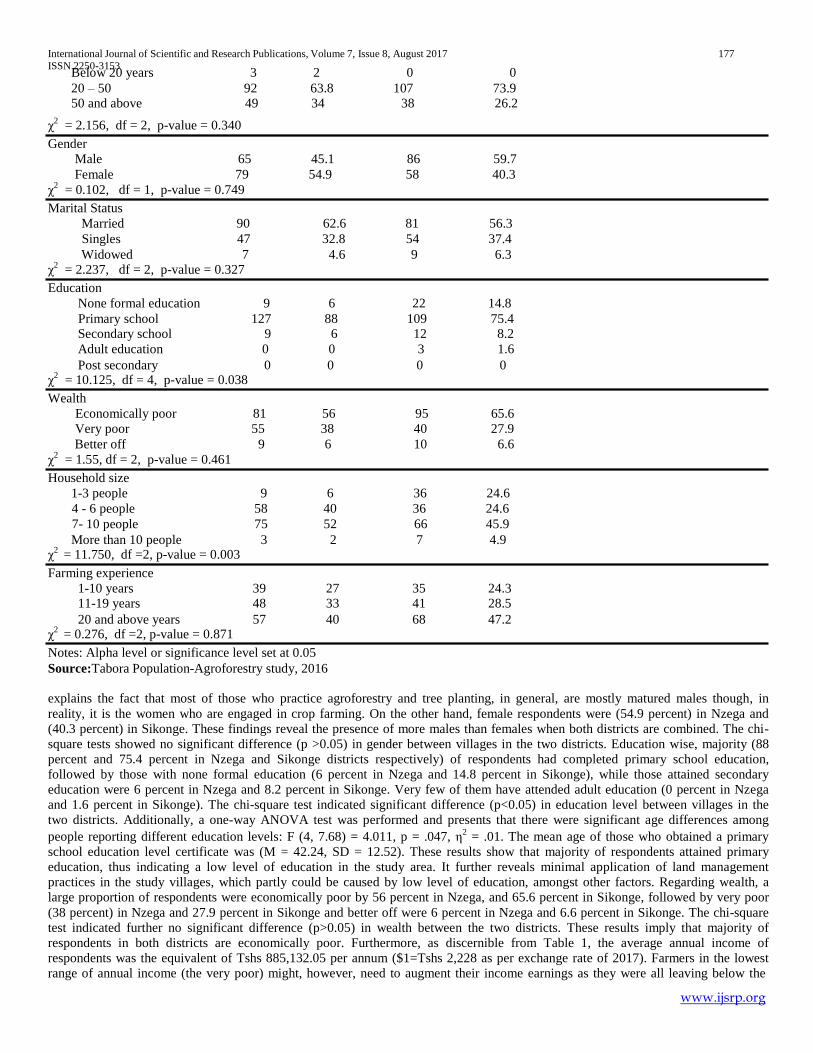
The socio-demographic characteristics of the sample are summarised in Table 1 and the parameters included are age, sex, education,
household size, wealth and farming experience. Referring to the age of the respondents, most of them laid between 20 to 50 years (64
percent and 73.8 percent in Nzega and Sikonge districts respectively), then followed by those aged below 20 years and above 50 years
by (2 percent and 0 percent) and (34 percent and 26.2 percent) for Nzega and Sikonge districts respectively. The mean age was 39.4
years (SD = 11.7, range = 18 – 63) while only a few of the respondents were above sixty-five years of age. The larger number of a
young population could imply increased pressure on agricultural land and therefore momentously affect its economic value. The chi-
square tests indicated no significant (p>0.05) difference in age between villages in the two districts. As regards, gender, out of the total
sample, (45.1 percent) and (59.7 percent) of the respondents were males in Nzega and Sikonge districts respectively. The majority of
the sample was male (52.4 percent). In this respect, this proportion
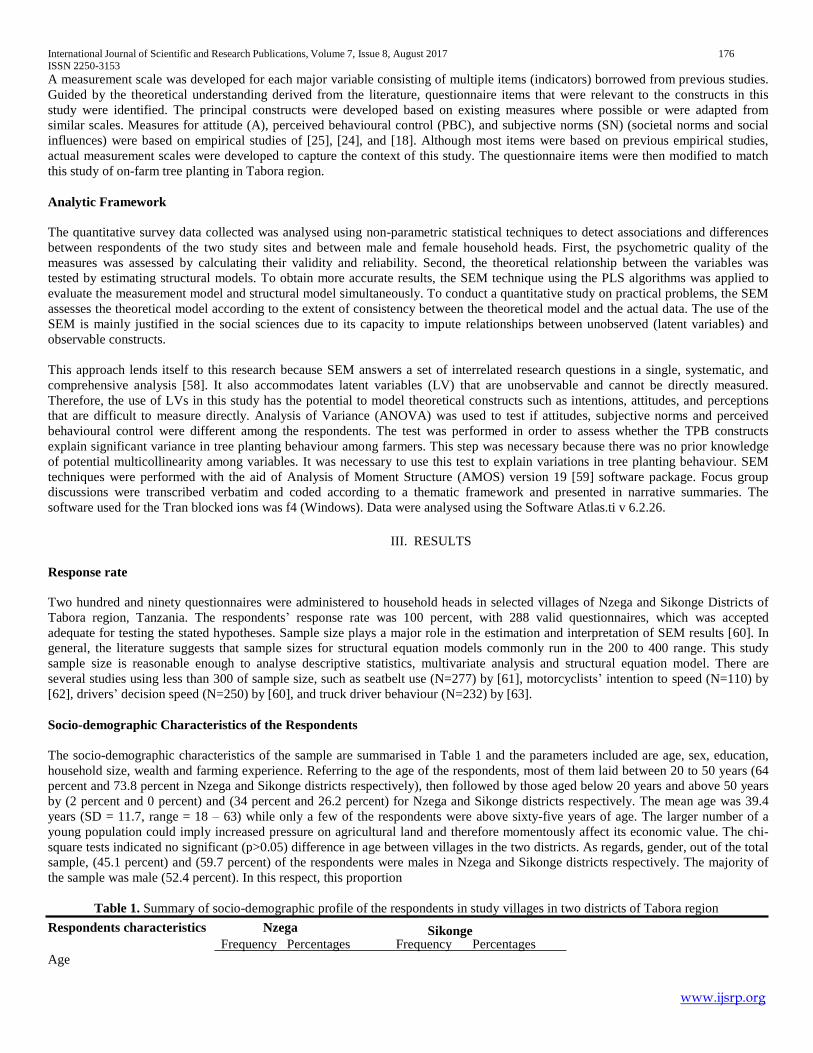
Table 1. Summary of socio-demographic profile of the respondents in study villages in two districts of Tabora region
Respondents characteristics Nzega
Age
Frequency Percentages Frequency Percentages
www.ijsrp.org
International Journal of Scientific and Research Publications, Volume 7, Issue 8, August 2017 ISSN 2250-3153
177
Below 20 years 3 2 0 0 20 – 50 92 63.8 107 73.9 50 and above 49 34 38 26.2
χ2
= 2.156, df = 2, p-value = 0.340
Gender
Male 65 45.1 86 59.7
Female 79 54.9 58 40.3
χ2
= 0.102, df = 1, p-value = 0.749
Marital Status
Married 90 62.6 81 56.3
Singles 47 32.8 54 37.4
Widowed 7 4.6 9 6.3
χ2
= 2.237, df = 2, p-value = 0.327
Education
None formal education 9 6 22 14.8
Primary school 127 88 109 75.4 Secondary school 9 6 12 8.2
Adult education 0 0 3 1.6
Post secondary 0 0 0 0
χ2
= 10.125, df = 4, p-value = 0.038
Wealth
Economically poor 81 56 95 65.6
Very poor 55 38 40 27.9
Better off 9 6 10 6.6
χ2
= 1.55, df = 2, p-value = 0.461
Household size
1-3 people 9 6 36 24.6
4 - 6 people 58 40 36 24.6
7- 10 people 75 52 66 45.9
More than 10 people 3 2 7 4.9
χ2
= 11.750, df =2, p-value = 0.003
Farming experience
1-10 years 39 27 35 24.3 11-19 years 48 33 41 28.5
20 and above years 57 40 68 47.2
χ2
= 0.276, df =2, p-value = 0.871
Notes: Alpha level or significance level set at 0.05
Source:Tabora Population-Agroforestry study, 2016
explains the fact that most of those who practice agroforestry and tree planting, in general, are mostly matured males though, in
reality, it is the women who are engaged in crop farming. On the other hand, female respondents were (54.9 percent) in Nzega and
(40.3 percent) in Sikonge. These findings reveal the presence of more males than females when both districts are combined. The chi-
square tests showed no significant difference (p >0.05) in gender between villages in the two districts. Education wise, majority (88
percent and 75.4 percent in Nzega and Sikonge districts respectively) of respondents had completed primary school education,
followed by those with none formal education (6 percent in Nzega and 14.8 percent in Sikonge), while those attained secondary
education were 6 percent in Nzega and 8.2 percent in Sikonge. Very few of them have attended adult education (0 percent in Nzega
and 1.6 percent in Sikonge). The chi-square test indicated significant difference (p<0.05) in education level between villages in the
two districts. Additionally, a one-way ANOVA test was performed and presents that there were significant age differences among
people reporting different education levels: F (4, 7.68) = 4.011, p = .047, η2
= .01. The mean age of those who obtained a primary
school education level certificate was (M = 42.24, SD = 12.52). These results show that majority of respondents attained primary
education, thus indicating a low level of education in the study area. It further reveals minimal application of land management
practices in the study villages, which partly could be caused by low level of education, amongst other factors. Regarding wealth, a
large proportion of respondents were economically poor by 56 percent in Nzega, and 65.6 percent in Sikonge, followed by very poor
(38 percent) in Nzega and 27.9 percent in Sikonge and better off were 6 percent in Nzega and 6.6 percent in Sikonge. The chi-square
test indicated further no significant difference (p>0.05) in wealth between the two districts. These results imply that majority of
respondents in both districts are economically poor. Furthermore, as discernible from Table 1, the average annual income of
respondents was the equivalent of Tshs 885,132.05 per annum ($1=Tshs 2,228 as per exchange rate of 2017). Farmers in the lowest
range of annual income (the very poor) might, however, need to augment their income earnings as they were all leaving below the
www.ijsrp.org
International Journal of Scientific and Research Publications, Volume 7, Issue 8, August 2017 ISSN 2250-3153
178
poverty line by earning below Tshs 2,300 which is approximately $1 per day. This confirms the prevalence of poverty among rural
farmers in Tabora region and Tanzania in general.
On household size, the majority of respondents in Nzega (52 percent) and Sikonge (45.9 percent) had a household size ranging from 7
to 10 household members. 1 to 3 households’ members were 6 percent in Nzega and 24.6 percent in Sikonge, while 58 (40 percent) in
Nzega and 36 (2.6 percent) in Sikonge had 4 to 6 households’ members. Few respondents by 2 percent in Nzega and 4.9 percent in
Sikonge had more than 10 households’ members. Overall 59.52 percent of the respondents have an average household size of 5 people
with a Standard Deviation (SD) of ± 2 in both areas. Chi-square tests indicated high significant difference (p<0.05) in the size of
households between the two districts.
As regards marital status, the majority of the sample included couples (62.6 percent), followed by singles (32.8 percent), and widowed
(4.6 percent) for Nzega and 56.3 percent for the married, followed by singles (37.4 percent) and widowed (6.3 percent) for Sikonge.
The chi- square tests for marital status indicated no significant (p>0.05) difference in age between villages in the two districts. The
farming experience of the respondents ranged from 14 - 51 with a mean of 31.19 (+18.09) years. Furthermore, 35.72 percent of
farmers had an average total farm size of 0.74 (SD 0.64) hectare in Nzega and 2.37 hectares (SD 2.29) in Sikonge. This goes to
confirm that land holdings in the rural areas are usually small and is obtained mostly through inheritance. Almost all households (98
percent) own land, and some respondents (11 percent) said they rented additional land for farming. In the bivariate (chi-square) test,
farm experience and tree planting yielded insignificant results at p = 0.871.
Assessment of validity and reliability of the measurement items
As a first step, construct reliability and validity was assessed. The interpretation of the resultant coefficient takes into account the
actual factor loadings rather than assuming that each item is equally weighted in the composite load determination. In this study,
construct reliability was measured using [64], with a value of 0.7 or higher being recommended [65]. Construct reliability for all the
factors in this study’s measurement model were above 0.7 an acceptable threshold representing strong reliability. [53] recommended a
factor loading of 0.5 and above to be an acceptable indicator of validity at the item level. Construct validity for the measurement
scales was assessed from their convergent and discriminant validity values. Convergent validity which indicates how each
measurement item strongly correlated with its specific theoretical construct was determined from the constructs’ respective Average
Variance Explained (AVE) values. Convergent validity was evaluated for the measurement scales using three criteria suggested by
[66]: (1) all indicator factor loadings should be significant and exceed 0.7, (2) construct reliabilities should exceed 0.7, and (3) the
square root of the average variance explained (AVE) by each construct should exceed the variance due to measurement error for that
construct (i.e., AVE should exceed 0.50). All values in the Confirmatory Factor Analysis (CFA) model exceeded 0.7 and were
significant at p = 0.001. Composite reliabilities of constructs ranged between 0.78 and 0.93. AVE ranged from 0.58 to 0.87 indicating
that on average, all Latent Variables (LVs) were able to explain more than half of the variance of their respective indicators and thus
demonstrated sufficient convergent validity. Therefore, all three conditions for convergent validity were met.
Evaluation of the Measurement Model (outer model)
The measurement model specifies the relationships between the constructs and the associated indicators. The parameters in the SEM
were estimated by maximum likelihood (ML) method using the computer software program AMOS version 19. A variety of indices
was used in this study. Absolute fit indices that measure how best the proposed model replicates the data were included. In other
words, the fit indices assess the overall discrepancy between the implied and observed covariance matrices.
Absolute, incremental, and parsimonious indices of fit were included in the measures of the overall model fit. The commonly known
index of absolute fit is the Chi-square (χ2). Despite the fact that the χ
2 statistic has been found to be sensitive to sample sizes, two other
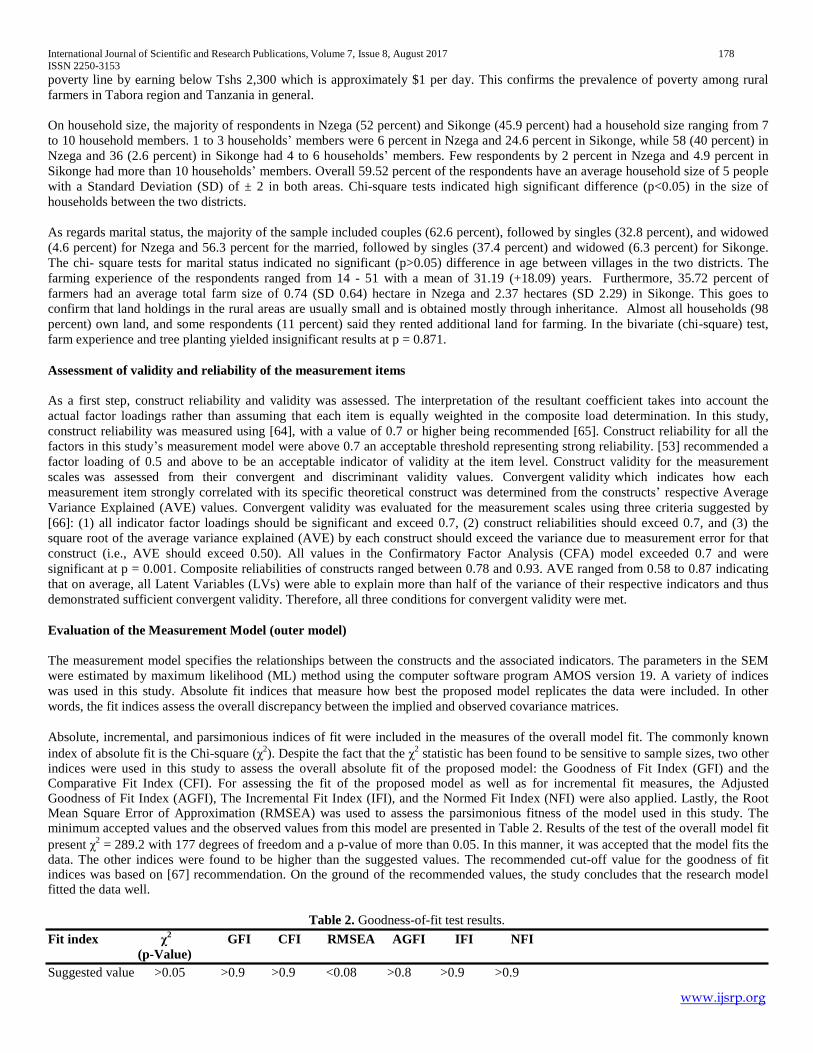
indices were used in this study to assess the overall absolute fit of the proposed model: the Goodness of Fit Index (GFI) and the Comparative Fit Index (CFI). For assessing the fit of the proposed model as well as for incremental fit measures, the Adjusted Goodness of Fit Index (AGFI), The Incremental Fit Index (IFI), and the Normed Fit Index (NFI) were also applied. Lastly, the Root Mean Square Error of Approximation (RMSEA) was used to assess the parsimonious fitness of the model used in this study. The minimum accepted values and the observed values from this model are presented in Table 2. Results of the test of the overall model fit
present χ2
= 289.2 with 177 degrees of freedom and a p-value of more than 0.05. In this manner, it was accepted that the model fits the data. The other indices were found to be higher than the suggested values. The recommended cut-off value for the goodness of fit indices was based on [67] recommendation. On the ground of the recommended values, the study concludes that the research model fitted the data well.
Table 2. Goodness-of-fit test results.
Fit index χ2
GFI CFI RMSEA AGFI IFI NFI
(p-Value)
Suggested value >0.05 >0.9 >0.9 <0.08 >0.8 >0.9 >0.9
www.ijsrp.org
International Journal of Scientific and Research Publications, Volume 7, Issue 8, August 2017 ISSN 2250-3153
179
Gender 0.610 0.483 0.660 0.711 0.164 0.264 Age 0.589 0.391 0.372 0.703 0.314 0.405 Education 0.027 0.043 0.036 0.033 0.221 0.049 Household size 0.006 0.027 0.002 0.046 0.331 0.039 Income 0.803 0.344 0.534 0.360 0.522 0.662 Farming experience 0.069 0.211 0.257 0.077 0.311 0.682
Observed value 0.061 0.902 0.973 0.022 0.837 0.911 0.902
Conclusion Accepted Good fit Good fit Good fit Good fit Good fit Good fit
Source:Tabora Population-Agroforestry study, 2016
3.5 Evaluation of Structural Model (inner model)
The structural model represents the relationship between the constructs. It specifies the relationships between the latent variables. Latent variables can play the role of predicting. A latent variable which is never predicted is called an exogenous variable. Otherwise,
it is called endogenous variable. This section presents results of the test of the structural model (in which research hypotheses are
embodied). The structural model was tested using the structural equation modelling (SEM) approach performed in PLS. This approach is particularly appropriate for testing theoretically justified models [68]. Each indicator (manifest variable) was modelled in a
reflective manner which means a variation of the construct yields a variation in the measures. As a result, the direction of causality is
from the construct to the indicator. Each manifest variable represents the corresponding latent variable, which is linked to the latent variable using a simple regression model. The six constructs comprise four exogenous variables (attitudes, subjective norms,
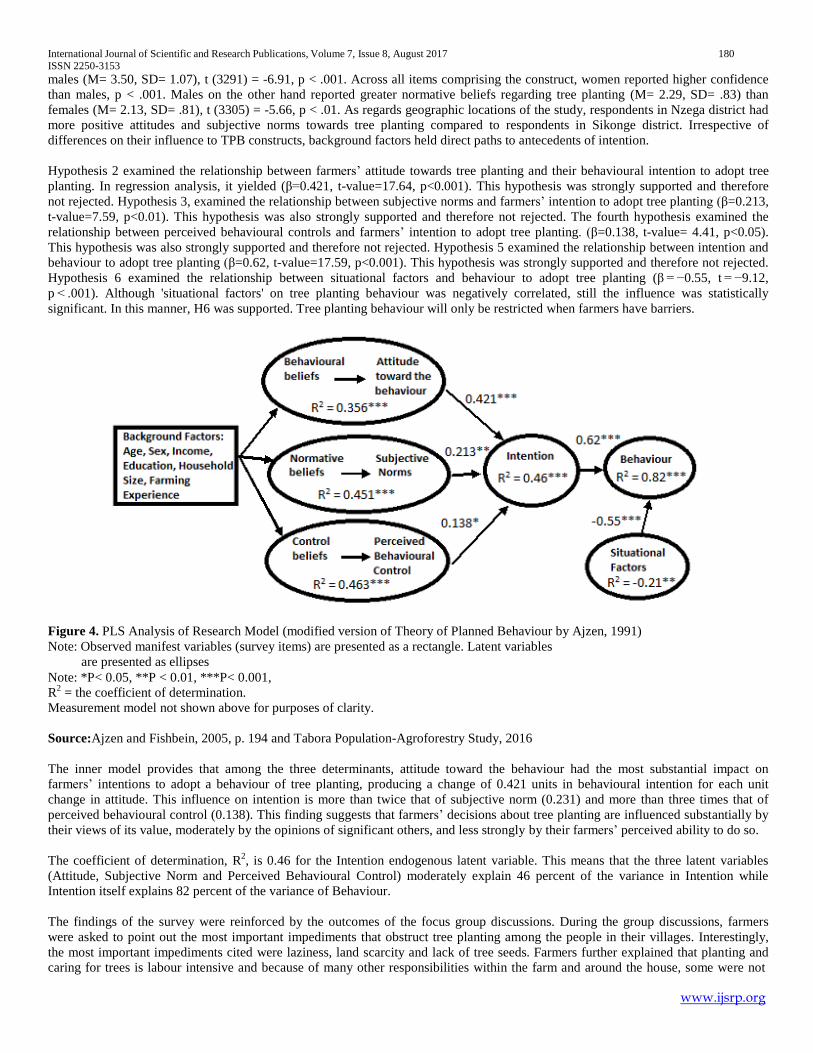
perceived behaviour control, and situational factors and two endogenous variables (intention and behaviour). All of these were linked as hypothesised (see Figure 4), and model estimation was done by assessing the path coefficients that indicate the strength of the
hypothesised relationship between the exogenous and the endogenous variables and the variance explained (R2
value) by each path.
Figure 4 presents the standardised path coefficients as well as the path significance as reported by PLS. The betas were used to
determine the relative weights of each factor.
The sample size of n=288 was sufficient because the required number of cases for this PLS analysis is only ten times the number of
indicators in the reflective constructs [69]. The modified model derived from the Theory of Planned Behavior was made up of all
reflective constructs that are influenced by the prime latent indicators [70]. These reflective latent constructs (attitude, subjective
norms, perceived behavioural control, intention situational factors, and behaviour), are characterised by the fact that changes in the
underlying latent construct will be reflected in changes in their corresponding measurement indicators. Since the indicators in a
reflective construct represent the construct in a reflective model, a high degree of correlation between the indicators was expected to
be seen.
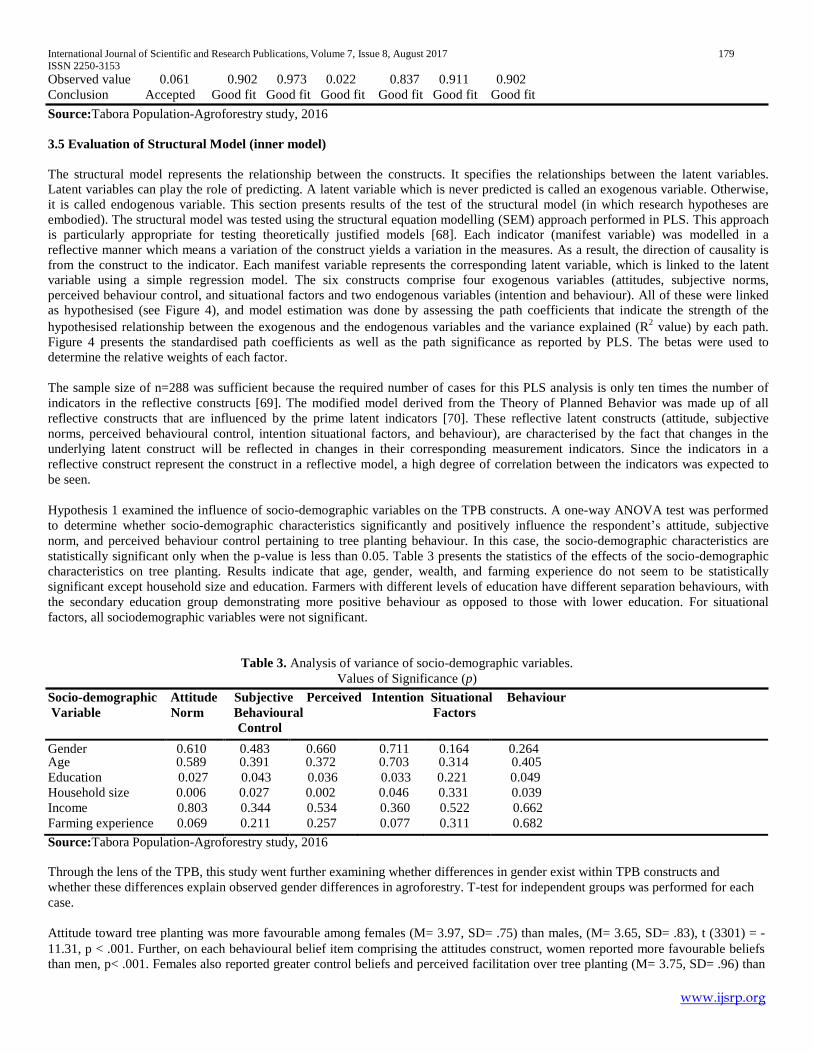
Hypothesis 1 examined the influence of socio-demographic variables on the TPB constructs. A one-way ANOVA test was performed
to determine whether socio-demographic characteristics significantly and positively influence the respondent’s attitude, subjective
norm, and perceived behaviour control pertaining to tree planting behaviour. In this case, the socio-demographic characteristics are
statistically significant only when the p-value is less than 0.05. Table 3 presents the statistics of the effects of the socio-demographic
characteristics on tree planting. Results indicate that age, gender, wealth, and farming experience do not seem to be statistically
significant except household size and education. Farmers with different levels of education have different separation behaviours, with
the secondary education group demonstrating more positive behaviour as opposed to those with lower education. For situational
factors, all sociodemographic variables were not significant.
Table 3. Analysis of variance of socio-demographic variables.
Values of Significance (p)
Socio-demographic Attitude Subjective Perceived Intention Situational Behaviour
Variable Norm Behavioural Factors Control
Source:Tabora Population-Agroforestry study, 2016
Through the lens of the TPB, this study went further examining whether differences in gender exist within TPB constructs and
whether these differences explain observed gender differences in agroforestry. T-test for independent groups was performed for each
case.
Attitude toward tree planting was more favourable among females (M= 3.97, SD= .75) than males, (M= 3.65, SD= .83), t (3301) = -
11.31, p < .001. Further, on each behavioural belief item comprising the attitudes construct, women reported more favourable beliefs
than men, p< .001. Females also reported greater control beliefs and perceived facilitation over tree planting (M= 3.75, SD= .96) than
www.ijsrp.org
International Journal of Scientific and Research Publications, Volume 7, Issue 8, August 2017 ISSN 2250-3153
180
males (M= 3.50, SD= 1.07), t (3291) = -6.91, p < .001. Across all items comprising the construct, women reported higher confidence
than males, p < .001. Males on the other hand reported greater normative beliefs regarding tree planting (M= 2.29, SD= .83) than
females (M= 2.13, SD= .81), t (3305) = -5.66, p < .01. As regards geographic locations of the study, respondents in Nzega district had
more positive attitudes and subjective norms towards tree planting compared to respondents in Sikonge district. Irrespective of
differences on their influence to TPB constructs, background factors held direct paths to antecedents of intention.
Hypothesis 2 examined the relationship between farmers’ attitude towards tree planting and their behavioural intention to adopt tree
planting. In regression analysis, it yielded (β=0.421, t-value=17.64, p<0.001). This hypothesis was strongly supported and therefore
not rejected. Hypothesis 3, examined the relationship between subjective norms and farmers’ intention to adopt tree planting (β=0.213,
t-value=7.59, p<0.01). This hypothesis was also strongly supported and therefore not rejected. The fourth hypothesis examined the
relationship between perceived behavioural controls and farmers’ intention to adopt tree planting. (β=0.138, t-value= 4.41, p<0.05).
This hypothesis was also strongly supported and therefore not rejected. Hypothesis 5 examined the relationship between intention and
behaviour to adopt tree planting (β=0.62, t-value=17.59, p<0.001). This hypothesis was strongly supported and therefore not rejected.
Hypothesis 6 examined the relationship between situational factors and behaviour to adopt tree planting (β = −0.55, t = −9.12,
p < .001). Although 'situational factors' on tree planting behaviour was negatively correlated, still the influence was statistically
significant. In this manner, H6 was supported. Tree planting behaviour will only be restricted when farmers have barriers.
Figure 4. PLS Analysis of Research Model (modified version of Theory of Planned Behaviour by Ajzen, 1991)
Note: Observed manifest variables (survey items) are presented as a rectangle. Latent variables
are presented as ellipses
Note: *P< 0.05, **P < 0.01, ***P< 0.001,
R2
= the coefficient of determination.
Measurement model not shown above for purposes of clarity.
Source:Ajzen and Fishbein, 2005, p. 194 and Tabora Population-Agroforestry Study, 2016
The inner model provides that among the three determinants, attitude toward the behaviour had the most substantial impact on
farmers’ intentions to adopt a behaviour of tree planting, producing a change of 0.421 units in behavioural intention for each unit
change in attitude. This influence on intention is more than twice that of subjective norm (0.231) and more than three times that of
perceived behavioural control (0.138). This finding suggests that farmers’ decisions about tree planting are influenced substantially by
their views of its value, moderately by the opinions of significant others, and less strongly by their farmers’ perceived ability to do so.
The coefficient of determination, R2, is 0.46 for the Intention endogenous latent variable. This means that the three latent variables
(Attitude, Subjective Norm and Perceived Behavioural Control) moderately explain 46 percent of the variance in Intention while
Intention itself explains 82 percent of the variance of Behaviour.
The findings of the survey were reinforced by the outcomes of the focus group discussions. During the group discussions, farmers
were asked to point out the most important impediments that obstruct tree planting among the people in their villages. Interestingly,
the most important impediments cited were laziness, land scarcity and lack of tree seeds. Farmers further explained that planting and
caring for trees is labour intensive and because of many other responsibilities within the farm and around the house, some were not
www.ijsrp.org
International Journal of Scientific and Research Publications, Volume 7, Issue 8, August 2017 ISSN 2250-3153
181
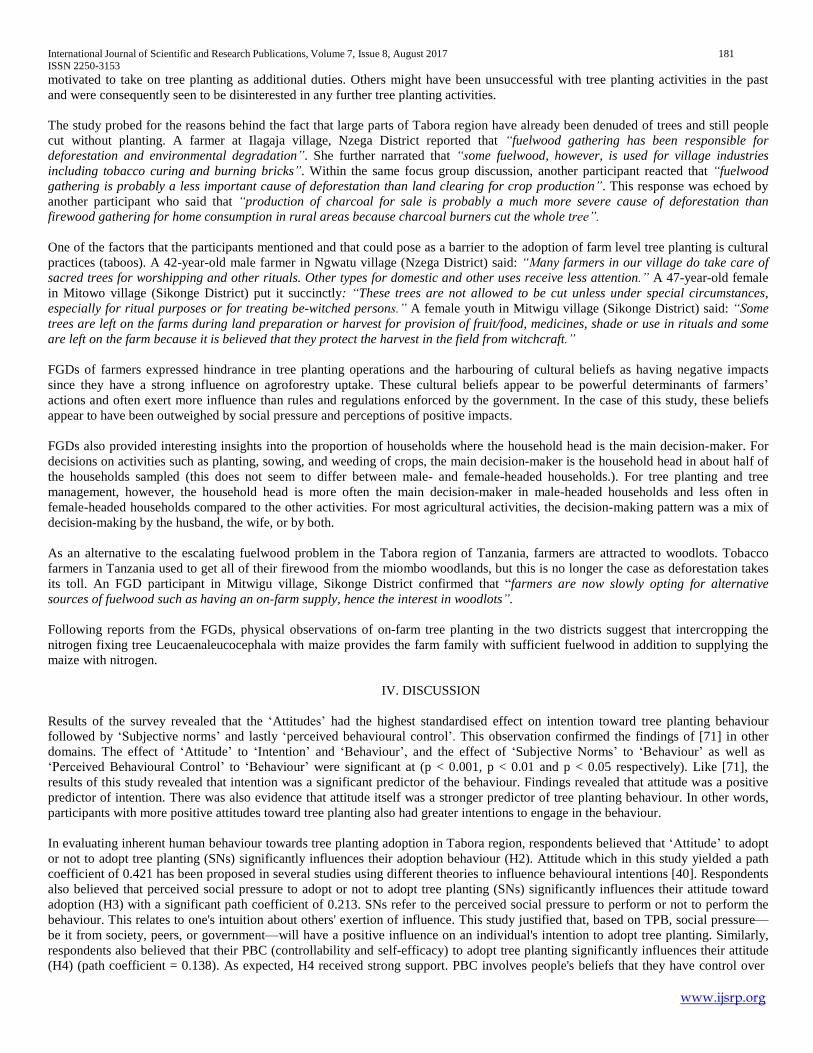
motivated to take on tree planting as additional duties. Others might have been unsuccessful with tree planting activities in the past
and were consequently seen to be disinterested in any further tree planting activities.
The study probed for the reasons behind the fact that large parts of Tabora region have already been denuded of trees and still people
cut without planting. A farmer at Ilagaja village, Nzega District reported that “fuelwood gathering has been responsible for
deforestation and environmental degradation”. She further narrated that “some fuelwood, however, is used for village industries
including tobacco curing and burning bricks”. Within the same focus group discussion, another participant reacted that “fuelwood
gathering is probably a less important cause of deforestation than land clearing for crop production”. This response was echoed by
another participant who said that “production of charcoal for sale is probably a much more severe cause of deforestation than
firewood gathering for home consumption in rural areas because charcoal burners cut the whole tree”.
One of the factors that the participants mentioned and that could pose as a barrier to the adoption of farm level tree planting is cultural
practices (taboos). A 42-year-old male farmer in Ngwatu village (Nzega District) said: “Many farmers in our village do take care of
sacred trees for worshipping and other rituals. Other types for domestic and other uses receive less attention.” A 47-year-old female
in Mitowo village (Sikonge District) put it succinctly: “These trees are not allowed to be cut unless under special circumstances,
especially for ritual purposes or for treating be-witched persons.” A female youth in Mitwigu village (Sikonge District) said: “Some
trees are left on the farms during land preparation or harvest for provision of fruit/food, medicines, shade or use in rituals and some
are left on the farm because it is believed that they protect the harvest in the field from witchcraft.”
FGDs of farmers expressed hindrance in tree planting operations and the harbouring of cultural beliefs as having negative impacts
since they have a strong influence on agroforestry uptake. These cultural beliefs appear to be powerful determinants of farmers’
actions and often exert more influence than rules and regulations enforced by the government. In the case of this study, these beliefs
appear to have been outweighed by social pressure and perceptions of positive impacts.
FGDs also provided interesting insights into the proportion of households where the household head is the main decision-maker. For
decisions on activities such as planting, sowing, and weeding of crops, the main decision-maker is the household head in about half of
the households sampled (this does not seem to differ between male- and female-headed households.). For tree planting and tree
management, however, the household head is more often the main decision-maker in male-headed households and less often in
female-headed households compared to the other activities. For most agricultural activities, the decision-making pattern was a mix of
decision-making by the husband, the wife, or by both.
As an alternative to the escalating fuelwood problem in the Tabora region of Tanzania, farmers are attracted to woodlots. Tobacco
farmers in Tanzania used to get all of their firewood from the miombo woodlands, but this is no longer the case as deforestation takes
its toll. An FGD participant in Mitwigu village, Sikonge District confirmed that “farmers are now slowly opting for alternative
sources of fuelwood such as having an on-farm supply, hence the interest in woodlots”.
Following reports from the FGDs, physical observations of on-farm tree planting in the two districts suggest that intercropping the
nitrogen fixing tree Leucaenaleucocephala with maize provides the farm family with sufficient fuelwood in addition to supplying the
maize with nitrogen.
IV. DISCUSSION
Results of the survey revealed that the ‘Attitudes’ had the highest standardised effect on intention toward tree planting behaviour
followed by ‘Subjective norms’ and lastly ‘perceived behavioural control’. This observation confirmed the findings of [71] in other
domains. The effect of ‘Attitude’ to ‘Intention’ and ‘Behaviour’, and the effect of ‘Subjective Norms’ to ‘Behaviour’ as well as
‘Perceived Behavioural Control’ to ‘Behaviour’ were significant at (p < 0.001, p < 0.01 and p < 0.05 respectively). Like [71], the
results of this study revealed that intention was a significant predictor of the behaviour. Findings revealed that attitude was a positive
predictor of intention. There was also evidence that attitude itself was a stronger predictor of tree planting behaviour. In other words,
participants with more positive attitudes toward tree planting also had greater intentions to engage in the behaviour.
In evaluating inherent human behaviour towards tree planting adoption in Tabora region, respondents believed that ‘Attitude’ to adopt
or not to adopt tree planting (SNs) significantly influences their adoption behaviour (H2). Attitude which in this study yielded a path
coefficient of 0.421 has been proposed in several studies using different theories to influence behavioural intentions [40]. Respondents
also believed that perceived social pressure to adopt or not to adopt tree planting (SNs) significantly influences their attitude toward
adoption (H3) with a significant path coefficient of 0.213. SNs refer to the perceived social pressure to perform or not to perform the
behaviour. This relates to one's intuition about others' exertion of influence. This study justified that, based on TPB, social pressure—
be it from society, peers, or government—will have a positive influence on an individual's intention to adopt tree planting. Similarly,
respondents also believed that their PBC (controllability and self-efficacy) to adopt tree planting significantly influences their attitude
(H4) (path coefficient = 0.138). As expected, H4 received strong support. PBC involves people's beliefs that they have control over
www.ijsrp.org
International Journal of Scientific and Research Publications, Volume 7, Issue 8, August 2017 ISSN 2250-3153
182
the behaviour; performance or non-performance of the behaviour is up to them [72]. Several studies support the direct effect of PBC
on intended and/or actual usage [73,74].
In H5, this study posited that farmers' intention toward tree planting positively influences their behaviour to adopt on-farm tree
planting. The model strongly supported this hypothesis. The results were not surprising because the intention is proposed to influence
behaviour. This theoretical prediction has received considerable empirical support in a variety of settings [75,76]. The intention is an
overall evaluation of an individual's perception of tree planting adoption. Additionally, an intention is the cognitive representation of a
person’s preparedness to perform a given behaviour, and it is taken to be the immediate antecedent of behaviour.
Therefore, following the TPB, a positive intention undoubtedly affects the individual's behaviour to engage tree planting activities.
Consequently, the application of TPB offers a theoretical foundation for the consideration of behavioural attributes in tree planting
uptake. By relating the three constructs (attitude, subjective norm and perceived behavioural control) to tree planting, a farmer is likely
to gather information, share the information and ultimately utilise the information for the purpose of enhancing on-farm tree planting
in the region and country in general. The tree planting achievements tend to be incremental (at the individual level) and transformative
(at the community level). According to [77] incremental changes eventually lead to stable transformative community development.
The findings of the survey were reinforced by the outcomes of the focus group discussions, which besides noting the view that on-
farm tree planting and tree management are mostly a task for husbands, the focus group discussions revealed that women still
participated in the implementation of tree planting, and there were some gender-specific roles for women, which is in agreement with
previous studies [78, 79].
V. CONCLUSION
Continuing degradation of existing forest cover driven by rapid population growth and anthropogenic activities are serious threats to
the sustainability of forestry in Tabora region. Farm and community land forestry uptake has been identified as a feasible solution.
Given this scenario, results of this study have shown that farmers' intention and behaviour toward conserving ecological achievements
have been explained well by TPB. The farmers' behaviour was significantly positively influenced by their intention toward conserving
ecological achievements, and their intention significantly predicted their attitude (positive or negative value of performance), followed
by the subjective norm (social pressure in engaging behaviour), and least by perceived behavioural control (perceptions of their
ability). The farmers' degree of support for agroforestry uptake and its recognition of environmental effects is the main factor that
most influenced the farmers' attitude.
Guided by these findings and in response to the demonstrated need for sustainable agroforestry in Tanzanian villages, this study has
adequately addressed its key objective of testing the explanatory ability of the TPB on farmers’ intention to adopt on-farm tree
planting behaviour and has also illuminated the factual evidence gathered from them. The application of this theory in the two selected
districts of Tabora region provides an insight on farmers’ behaviour towards growing trees on their farms. The achievement of on-
farm tree planting is a function of the three TPB constructs. These findings can assist in developing tailored forestry programmes, to
increase attitudes and foster behavioural change, in order to speed up agroforestry in the region. This approach can successfully
engage farmers to support the sustainability of the ecology and environment against the uncontrolled agricultural expansion and
demand for rural energy fuelled by population growth in the region.
ACKNOWLEDGEMENTS
Sincere appreciation is extended to the District council authorities of Nzega and Sikonge for a very close collaboration with the
researcher during this study. Special thanks are also extended to the Village Executive Officers and respondents in sampled villages in
Nzega and Sikonge Districts for availing their time during the data collection and consultative workshops. Finally, I express my
gratitude to all those who provided support in one way or another.
REFERENCES
1. PRB (Population Reference Bureau). (2013) World Population Sheet. Washington, DC 2013; www.prb.org
2. FAO, (2010a) FAO Global Forest resources assessment 2010 Food and AgricultureOrganization of the United Nations, Rome.
3. United Republic of Tanzania (2014) Fifth National Report on the Implementation of the Convention on Biological Diversity; Vice President’s Office, Division of Environment, United Republic of Tanzania (URT), Dar es Salaam 2014
4. Bremer, J., L.C. David., L. Suter., and J. Davis (2010) Population, Poverty, Environmentand Climate Dynamics in the Developing World; Interdisciplinary
EnvironmentalReview, Vol. 11 Nos 2/3 5. OSSREA (n.d.) Deforestation in Tanzania: A Development Crisis? www.ossrea.net/publications/images/stories/ossrea/ssrr/ssrr-series-13.pdf
6. Miya, M., Ball S.M.J., and Nelson F.D., Ball S.M.J., and Nelson F.D., (2012). Drivers of deforestation and forest degradation in Kilwa District. MCDI.
http://www.mpingoconservation.org/fileadmin/downloads/redd/Drivers_of_Deforestation_and_Forest_Degradation_in_ Kilwa_District.pdf
www.ijsrp.org
International Journal of Scientific and Research Publications, Volume 7, Issue 8, August 2017 ISSN 2250-3153
183
7. Kideghesho, j. (2015) Realities on Deforestation in Tanzania — Trends, Drivers, Implications and the Way Forward in MiodragZlatic (ed) Precious Forests
- Precious Earth. DOI: 10.5772/61002
8. URT (2013) Population Distribution by Administrative Units; National Bureau of Statistics, Dares Salaam
9. Mkai, P.B., Kaimu, A. M., Aboud, S., Chuwa, A. A., Amour, B. H., Ntimba, G. L., Mbonile, M., Ngalinda, I., Naimani; G. M. and Chuma, A. (2006)
Tabora Regional and District Projections. UNSPECIFIED. (Unpublished) 10. Yanda P.Z. (2010). Impact of small scale tobacco growing on the spatial and temporaldistribution of Miombo woodlands in Western Tanzania. J. Ecol.
Nat. Environ. 2: 10-16
11. National Bureau of Statistics (2012) Tabora Regional Statistical Abstract (2011) Ministry of Finance, Dar es Salaam
12. Verchot L.V., Noordwijk M.V., Kandji S., Tomich T., Ong C., Albrecht A., Mackensen J., Bantilan C., Anupama K., and Palm C. (2007). Climate change: linking adaptation and mitigation through agroforestry. Mitigation and Adaptation Strategies for Global Change 12:901-18.
13. Sileshi G., Akinnifesi F., Ajayi O., and Place F. (2008). Meta-analysis of maize yield response to woody and herbaceous legumes in sub-Saharan Africa. Plant & Soil 307(1): 1-19.
14. Mbwambo, J; P. Saruni, P; and G. Masawe (2013) Agroforestry as a solution to poverty in rural Tanzania. Lessons from Musoma Rural District, Mara
Region, Tanzania; Kivukoni Journal Vol. 1 no. 2, 2013: 15-30
15. Ngambeki, D.S., (1985) Economic-evaluation of alley cropping Leucaena with maize-maize and maize-cowpea in Southern Nigeria. Agricultural Systems, 17 (4) (1985), pp. 243–258
16. Reyes, T., R. Quiroz, S. Msikula (2005) Socio-economic comparison between traditional and improved cultivation methods in agroforestry systems, East
Usambara Mountains, Tanzania Environmental Management, 36 (5) (2005), pp. 682–690
17. Ajayi, O.C., F.K. Akinnifesi, G.W. Sileshi, W. Kanjipite (2009). Labour inputs and financial profitability of conventional and agroforestry-based soil
fertility management practices in ZambiaAgrekon, 48 (3), pp. 276-292, 10.1080/03031853.2009.9523827 18. Mercer, D.E. (2004) Adoption of agroforestry innovations in the tropics: a review of Agroforestry Systems, 61 (1), pp. 311–328
19. Temu A. B. Fuelwood scarcity and other problems associated with tobacco production in Tabora region, Tanzania. Morogoro:University of Dar es Salaam, Faculty of Agriculture, Forestry and Veterinary Science, 1979
20. Solon L. B. and Krishna B. (1996) Deforestation in Tanzania Beyond SimplisticGeneralizations; Ecologist, Vol. 26, No. 3 21. Franzel, S., R. Coe., P. Cooper., F. Place., and S.J. Scherr (2001) Assessing the adoption potential of agroforestry practices in sub-Saharan Africa;
Agricultural Systems, 69 (1–2), pp. 37–62
22. Keil,A, M. Zeller, S. Franzel (2005) Improved tree fallows in smallholder maize production in Zambia: do initial testers adopt the technology?
Agroforestry Systems, 64 (3) (2005), pp. 225–23
23. Kiptot, E., P. Hebinck, S. Franzel, P. Richards (2007) Adopters, testers or pseudo-adopters? Dynamics of the use of improved tree fallows by farmers in
western Kenya, Agricultural Systems, 94 (2) (2007), pp. 509–519 24. Ajayi and Catacutan, ( 2012) Role of externality in the adoption of smallholder agroforestry: case studies from Southern Africa and Southeast Asia S.
Sunderasan (ed.), Externality: economics, management and outcomes, NOVA Science Publishers, New York pp. 167–188
25. Meijer, S.S., D. Catacutan, O.C. Ajayi, G.W. Sileshi, M. Nieuwenhuis (2015) The role of knowledge, attitudes and perceptions in the uptake of agricultural
and agroforestry innovations among smallholder farmers in sub-Saharan Africa; International Journal of Agricultural Sustainability, 13 (1) (2015), pp. 40– 5
26. Chavangi N (1994) Cultural aspects of fuelwood procurement in Kakamega district. KWDP Working Paper No. 4. KWDP/The Beijer Institute, Nairobi,
Kenya 27. Nair, R. and Garrily, D. (2012): Agroforestry-the future of global Lands. New York. Springer, Dordrecht.
28. Kiptot, E and Franzel, S. (2011). Gender and Agroforestry in Africa: Are Women Participating? Available at http://www.worldagroforestry.org/.Retrieved
on May 10, 2017. 29. NATF (National Agroforestry Task Force). 1988. A Blueprint for Agroforestry Research in the Uni-modal Upland Plateau of Tanzania. AFRENA Report
No. 6. ICRAF, Nairobi, Kenya, 30 pp.
30. Ramadhani, T., Otsyna, R. and Franzel, S. (2002). Improving household incomes and reduce deforestation using Rotational Woodlots in Tabora District, Tanzania. Agriculture Ecosystems and Environment 89: 229 - 239.
31. Douthwaite, V.M., Manyong, J.D.H., and Keatinge, J. Chianu (2002) The adoption of alley farming and Mucuna: lessons for research, development and
extension; Agroforestry Systems, 56 (3) (2002), pp. 193–202 32. Fischer, A., and L. Vasseur (2002) Smallholder perceptions of agroforestry projects in Panama; Agroforestry Systems, 54 (2) (2002), pp. 103–113
33. Mekoya, A., S.J. Oosting, S. Fernandez-Rivera, A.J. Van der Zijpp (2008) Farmers' perceptions about exotic multipurpose fodder trees and constraints to
their adoption; Agroforestry Systems, 73 (2) (2008), pp. 141–153 34. Zubair, M., and C. Garforth (2006) Farm level tree planting in Pakistan: the role of farmers' perceptions and attitudes; Agroforestry Systems, 66 (3) (2006),
pp. 217–22
35. McGinty, M.M., M.E. Swisher, J. Alavalapati (2008) Agroforestry adoption and maintenance: self-efficacy, attitudes and socio-economic factors; Agroforestry Systems, 73 (2) (2008), pp. 99–108
36. Sood, K.K., and C.P. Mitchell (2004) Do socio-psychological factors matter in agroforestry planning? Lessons from smallholder traditional agroforestry
systems; Small-Scale Forestry, 3 (2) (2004), pp. 239–255 37. Pritchett L, Woolcock M. (2004) Solutions when the solution is the problem: arraying the disarray in development. World Dev 32(2): 191-212. 38. Scoones I, deGrassi A, Devereux S, Haddad L. (2005). New directions for African agriculture. London: Institute of Development Studies. IDS Bulletin 36.2
39. Ajzen, I (1991) The theory of planned behavior; Organizational Behavior and Human Decision Processes, 50 (2) (1991), pp. 179–211
40. Fishbein, M., I.Ajzen (1975) Belief, attitude, intention, and Behavior: An introduction to theory and research; Addison-Wesley, Reading, M A Addison- Wesley.
41. Bortoleto, A. P., Kurisu, K. H., &Hanaki, K. (2012). Model development for household waste prevention behaviour. Waste Management, 32(12) 2195– 2207.
42. Davis, F. D. (1989). Perceived usefulness, perceived ease of use, and user acceptance of information technology. MIS Quarterly, 13(3), 319–340.
43. Ramayah, T., Lee, J. W. C., & Lim, S. (2012). Sustaining the environment through recycling: An empirical study. Journal of Environmental Management, 102, 141-147
44. The Planning Commission and Tabora Regional Comissioner’s office (2005) Tabora region Socio-economic Profile,
http://www.tzonline.org/pdf/Tabora.pdf
45. NBS (2012) The 2012 Tanzania Population and Housing Census; Population Distribution by Age and Sex; National Bureau of StatisticsMinistry of
FinanceDar es Salaam and Office of Chief Government StatisticianPresident’s Office, Finance, Economy andDevelopment PlanningZanzibar p 283 46. Johnson, R. B., &Onwuegbuzie, A. J. (2004). Mixed Methods Research: A Research Paradigm Whose Time Has Come. Educational Researcher, 33(7),
14-26. 47. Johnson, R. B., Onwuegbuzie, A. J., & Turner, L. A. (2007). Toward a definition mixed methods research. Journal of Mixed Methods Research, 1, 112-
133.
48. Kathuri, N.J., and Pals, D.A. (1993) Introduction to Environmental Research, EgertonUniversity Njoro.
www.ijsrp.org
International Journal of Scientific and Research Publications, Volume 7, Issue 8, August 2017 ISSN 2250-3153
184
49. Sieber, D.S (1973) The Integration of Fieldwork and Survey Methods. The American Journal of Sociology, Vol. 78, No. 6, 1335–1359.
50. Franzel S., Scherr S.J., (2002b) “Assessing the Adoption Potential: Lessons Learned and Future Directions” in Trees on the Farm: Assessing the Adoption
Potential of Agroforestry Practices in Africa, Wallington, Oxon, UK; New York: CABI Pub in association with the International Centre for Research in
Agroforestry, 2002. 169-182
51. Likert, R. (1931) A technique for the measurement of attitudes, Columbia University Press, New York 52. Hennink, Monique M. (2007). International focus group research. Cambridge: Cambridge University Press.
53. Hair, J., Black, W., Babin, B., Anderson, R., & Tatham, R. (2006). Multivariate data analysis (6th ed.). Uppersaddle River, N.J.: Pearson Prentice Hall
54. Hair, J. Black, W, Babin, B, Anderson, R, & Tatham, R. (2010). Multivariate data Analysis (7 ed.). Upper Saddle River, NJ: Prentice Hall.
55. Ramkissoon, H.; Graham, S.L.D.; Weiler, B. (2013) Testing the dimensionality of place attachment and its relationships with place satisfaction and pro- environmental behaviours: A structural equation modelling approach. Tourism Manage. 36, 552–566.
56. Bayard, B.; Jolly, C. (2007) Environmental behavior structure and socio-economic conditions of hillside farmers: A multiple-group structural equation modeling approach. Ecol. Econ. 62, 433–440.
57. Sparrevik, M.; Ellen, G.J.; Duijn, M. (2011) Evaluation of factors affecting stakeholder risk perception of contaminated sediment disposal in Oslo Harbor. Environ. Sci. Technol. 2011, 45, 118–124.
58. Gefen, D., D. Straub, and M. Boudreau (2000) "Structural Equation Modeling Techniques and Regression: Guidelines for Research Practice,"
Communications of the Association for Information Systems (7)7 August, pp. 1-78.
59. Arbuckle, J. (2010b). IBM SPSS Amos 19 User's Guide. Chicago: Amos DevelopmentCorporation.
60. Simsekoglu, O and T. Lajunen. (2008). Social psychology of seat belt use: a comparison of Theory of Planned Behavior and Health Belief Model,
Transportation Research Part F11, 181-191.
61. Elliot. M.A. (2010). Predicting Motorcyclists’ intentions to speed: effects of selected cognitions from the Theory of Planned Behaviour, Self-Identity and Social Identity. Accident Analysis and Prevention, 42, 718-725.
62. Warner, H. W., & Aberg, L. (2006). Drivers' decision to speed: A study inspired by the theory of planned behavior. Transportation Research Part F, 9, 427-
433.
63. Poulter, M.O., Du, L., Weaver, I.C., Palkovits, M., Faludi, G., Merali, Z., et al. (2008). GABAA receptor promoter hypermethylation in suicide brain:
implications for the involvement of epigenetic processes. Biol. Psychiatry 64, 645-652. Doi: 10.1016/j.biopsych.2008.05.028
64. Cronbach L. Coefficient alpha and the internal structure of tests. Psychomerika. 1951;16: 297-334.
65. Nunnally, J.C., & Bernstein, I.H., (1994). Psychometric Theory, (3rd ed) New York, McGraw-Hill 66. Fornell, C., Larcker, D.F., (1981). Evaluating structural equation models with unobservable variables and measurement error. Journal of Marketing
Research 18 (1), 39-50.
67. Hu, L. and Bentler, P. M. (1999). Cutoff Criteria for Fit Indexes in Covariance Structure Analysis: Conventional Criteria versus New Alternatives. Struct.
Equat. Model., 6: 1-55. 68. Jöreskog, K. and Sörbom, D. (1993), LISREL 8: Structural Equation Modeling with theSIMPLIS Command Language. Chicago, IL: Scientific Software
International Inc.
69. Chin WW (1998). “The Partial Least Squares Approach for Structural Equation Modeling.” In GA Marcoulides (ed.), Modern Methods for Business
Research, pp. 295-336. Lawrence Erlbaum Associates, London.
70. Freeze, R. D. and Raschke, R. L. (2008). An assessment of formative and reflective constructs in research. MIS Quarterly 29 (3), 427-459.
71. Wauters, E., Bielders, C., Poesen, J., Govers, G. and Mathijs, E. (2010). Adoption of soil conservation practices in Belgium: An examination of the theory of planned behaviour in the agri-environmental domain. Land Use Policy 27(1): 86-94.
72. Ajzen, I. (2002b). Construction of a standard questionnaire for the theory of planned behavior. http://www-unix.oit.umass.edu/~aizen. Accessed May,
2017. 73. Taylor S, Todd PA (1995). Understanding Information Technology Usage: A Test of Competing Models. inf. syst. Res., 6 (2):144 –176.
74. Chau, P. Y. K., and Hu, P. J. (2002). Examining a model of information technology acceptance by individual professionals: An exploratory study. Journal
of Management Information Systems,18(4), 191–229. 75. Madden, Thomas J., Pamela Scholder Ellen and IcekAjzen (1992). "A Comparison of the Theory of Planned Behavior and the Theory of Reasoned
Action," Personality and Social Psychology Bulletin, 18 (1), 3B9.
76. Akram M.S, and Malik, A. (2012). Evaluating citizens’ readiness to embrace e-government services. Proceedings of the 13th Annual International
Conference on digital government research
77. Perkins, D. D., Bess, K. D., Cooper, D. G., Jones, D. L., Armstead, T., & Speer, P. W. (2007). Community organizational learning: Case studies illustrating
a three-dimensional model of levels and orders of change. Journal of Community Psychology, 35(3), 303–328. doi: 10.1002=jcop.20150 78. German, G., F. K. Akinnifesi, A. K. Edriss, G. Sileshi, C. Masangano3 and O. C. Ajayi. (2009). Influence of property rights on farmers’ willingness to
plant indigenous fruit trees in Malawi and Zambia. African Journal of Agricultural Research 4 (5), pp. 427-437
79. Kiptot, E. and S. Franzel. (2012). Effectiveness of the Farmer Trainers Approach in Dissemination of Livestock Feed Technologies: A Survey of Volunteer
Farmer Trainers in Kenya. Nairobi: East African Dairy Development Project.
AUTHORS
First Author –George Felix Masanja is a Senior Lecturer in the Department of Geography, St. Augustine University of Tanzania.


![Bottle Reforestation[1]](https://img.pdfslide.us/doc/110x75/577d39321a28ab3a6b994460/bottle-reforestation1.jpg)