Embed Size (px)
Citation preview
Journal of
Ecology
2007
95
, 1346–1359
© 2007 The AuthorsJournal compilation© 2007 British Ecological Society
Blackwell Publishing Ltd
Population dynamics in
Digitalis purpurea
: the interaction of disturbance and seed bank dynamics
NINA SLETVOLD*† and KNUT RYDGREN‡
†
Department of Biology, University of Oslo, PO Box 1066 Blindern, N-0316 Oslo, Norway, and
‡
Sogn og Fjordane
University College, Faculty of Science, PO Box 133, N-6851 Sogndal, Norway
Summary
1.
Plant ecologists have long since realized that the persistence of many facultativebiennial plants depends upon disturbance. However, we still have a limited knowledgeof the population-level effects of disturbance, and the connection between adult andseed bank dynamics.
2.
Using data from a 3-year demographic study combined with experimental gap-openingin a large population of
Digitalis purpurea
, we parameterized stochastic transitionmatrix models in ‘disturbed’ vs. ‘undisturbed’ areas. We simulated different gap sizes(fraction of population that was disturbed) and temporal disturbance patterns(constant, random, regular and irregular return intervals) and evaluated the effects onpopulation growth rate and seed bank dynamics. To explore seed bank importance weused two alternatives for seed bank survival rate (0.75/0.35) and three alternatives forseed bank recruitment fraction (0.9/0.5/0.1).
3.
Observed background recruitment levels were insufficient to ensure a positivepopulation growth rate. Increased amounts of gap-opening led to higher growth rates,and population persistence was predicted at moderate disturbance levels if seed banksurvival was high (0.75).
4.
Temporal disturbance pattern affected model results; random and interval scenariosresulted in lower population growth rates and higher extinction risks than constantscenarios of the same average disturbance level. Small and frequent disturbances led toconsiderably higher growth rates than large and rare disturbances.
5.
Stochastic elasticity analyses identified the seed bank as the most important life cyclestage with respect to population growth and persistence in most scenarios, and itsrelative impact was positively related to seed bank survival rate and negatively related todisturbance level. Variation in the recruitment fraction from seed bank vs. seed rainaffected both population growth rate and elasticity patterns, indicating the large impactof spatial variation in seed bank density.
6.
Synthesis
: Despite the existence of a large seed bank, our data suggest that recruitmentmay be locally seed-limited due to a patchy seed bank structure. Local population devel-opment may consequently differ widely from gap to gap. These results illustrate howspatial structures in both seed bank, adult population and gap formation interact to shapeplant population dynamics, as well as the occurrence of microsite- vs. seed-limitation.
Key-words
: disturbance, elasticity, facultative biennial, gap dynamics, matrix populationmodels, monocarpic perennial, seed bank, stochastic growth rate
Journal of Ecology
(2007)
95
, 1346–1359 doi: 10.1111/j.1365-2745.2007.01287.x
Introduction
Disturbances are in many systems crucial for thepersistence of plant populations (Takenaka
et al
. 1996;Hoffmann 1999; Lennartsson & Oostermeijer 2001),and their extent, return interval and regularity may
*Author to whom correspondence should be addressed:N. Sletvold, Department of Biology, Realfagbygget, NTNU,N-7491 Trondheim, Norway. Tel.:
+
47 735 96090. Fax:
+
47 735 96100. E-mail: [email protected].

1347
Disturbance and
population
dynamics
© 2007 The AuthorsJournal compilation © 2007 British Ecological Society,
Journal of Ecology
,
95
, 1346–1359
have a large impact on population dynamics (Gross
et al
. 1998; Rydgren
et al
. 2001; Menges & Quintana-Ascencio 2004). Facultative biennials are typicallyfound in intermittent habitats (Grime 1979), andmost of them depend on some kind of habitat-openingto enable recruitment (Gross 1980; de Jong &Klinkhamer 1988). As a result, local population extinc-tion is frequent (Harper 1977), and persistence at alarger scale demands new establishment through seeddispersal. Although these species have been extensivelystudied in the modelling of flowering strategies inrecent years (reviewed in Metcalf
et al
. 2003), theirpopulation dynamics have received less attention.
Several of the facultative biennials share a ‘seedbank-oriented’ life history (Kachi 1990), where theseed bank allows the species to ‘bridge’ over years (oreven decades) failing recruitment. Such populationsare expected to be limited by the availability of safe-sitesfor germination rather than seed abundance. However,the relative importance of these two factors may varyboth temporally and spatially (Eriksson & Ehrlén1992), reflecting variability in seed production, seedbank size and conditions triggering germination. Aslarge areas are rendered suitable for germination,episodic seed limitation may occur in species that usuallylack a strong link between seed availability and recruit-ment (Maron & Gardner 2000). Likewise, small-scalegap-opening may create local seed-limitation withindisturbed areas in a population. A key to determiningthe impact of disturbance on a population is under-standing how both spatial and temporal variation inthe degree of disturbance interacts with seed bankdynamics to mediate the population’s response.
It is not clear whether assumptions on the relativegermination fractions from seed rain vs. seed bankgenerally influence predicted population development(Alexander & Schrag 2003). Such effects have rarelybeen addressed. Indeed, they should be of particularinterest in species such as biennials, where the relativecontributions from current seed production vs. seedbank are probably highly variable in both space andtime, due to patchy seed bank distributions (Benoit
et al
. 1992) and variable seed production (Klinkhamer
et al
. 1988).While theory emphasizes the importance of seed
banks in plant population dynamics (e.g. Harper 1977;Venable 1989; Rees 1997), empirical estimates of thelink between seed bank and above-ground dynamicsare scarce (but see, for example, Kalisz & McPeek 1992;Cabin
et al
. 2000). Matrix population models accompaniedby elasticity analyses allow predictions of populationdevelopment as well as quantification of the relativeimportance of different life cycle stages (Caswell 2001),and simulations have demonstrated that disturbancesmay assure persistence of monocarpic perennials(Giho & Seno 1997; Seno & Nakajima 1999). However,few studies have applied these models to real populationsof monocarpic perennials (but see Werner & Caswell1977; Bullock
et al
. 1994; Löfgren
et al
. 2000; Jongejans
et al
. 2006), and we know of none that have includedspecies with a persistent seed bank.
In the present study we focus on the populationdynamics of the facultative biennial
Digitalis purpurea
L., a species exhibiting large variation in populationdevelopment. It is usually considered a transient biennial,establishing very large but short-lived populationsfrom the persistent seed bank after, for example,clear-cuttings (Harper 1977; van Baalen & Prins 1983).
D. purpurea
is also frequently found in grasslands,where small-scale disturbances create gaps that enablepopulations to persist for long time intervals. In theinitial phases in short-lived populations,
D. purpurea
can have an extremely high growth rate (
λ
of 11.8;Silvertown
et al
. 1993; based on data from van Baalen1982; van Baalen & Prins 1983), but in longer perspec-tives as well as in more persistent populations, suchgrowth rates are unrealistic. Germination is restrictedto bare soil (van Baalen 1982), and variation in thepattern of gap-formation should be decisive in terms ofpopulation growth. We use experimental gap-openingcombined with 3-year demographic data from a large,grassland population to construct and parameterizetransition matrices for
D. purpurea
in ‘disturbed’ vs.‘undisturbed’ areas. Variation in disturbance level(gap size) is simulated by varying the fraction of thepopulation allotted to the disturbance matrix, andtemporal variation in disturbance level is simulatedby using four different yearly disturbance patterns:(i) constant, (ii) randomly varying, (iii) regular returnintervals, and (iv) irregular return intervals. We usestochastic matrix models to evaluate the effect of variationin disturbance level and temporal disturbance patternon population growth and seed bank size. Our mainobjectives are to evaluate which disturbance conditionspermit population persistence (above-ground and seedbank), whether seed bank impact decreases at higherdisturbance levels, and whether different assumptionsabout seed bank survival and the fraction recruitingfrom seed bank vs. seed rain affect model predictions.
Methods
study species
Digitalis purpurea
L. (Plantaginaceae) is a facultativebiennial herb, widespread in coastal areas of south-western Norway. The species has a persistent seed bankfrom which abundant germination takes place after soildisturbance (van Baalen 1982). Seeds mainly germinatein spring, and individuals grow basal rosettes duringthe first summer. An obligate vernalization require-ment exists in Norwegian populations (N. Sletvold,unpublished data). Plants may produce a floweringstem during the second summer, but often delay flow-ering for several seasons (van Baalen & Prins 1983).Flowering is strongly size-dependent, but there is largewithin- and among-year variation in reproductive size(Sletvold 2002; Sletvold & Grindeland 2007). Flowering
1348
N. Sletvold &
K. Rydgren
© 2007 The AuthorsJournal compilation © 2007 British Ecological Society,
Journal of Ecology
,
95
, 1346–1359
starts in mid June, and the average flowering period isbetween 3 and 4 weeks. Seeds ripen during the monthafter flowering, and the minute seeds are dispersedballistically. Most seeds probably fall within a fewmetres of the maternal plant (van Baalen 1982), eithergerminating next spring or accumulating in the seedbank. After dispersal and soil contact an obligatorylight requirement for germination is induced, and seedsmay escape the seed bank only after daylight exposurefollowing soil disturbance (van Baalen 1982). Initial seedbank survival is high; van Baalen (1982) found no reduc-tion in viability during the first 2 years after dispersal.
field population
This study was conducted in a large, establishedpopulation in a sheep-grazed pasture located at Ulvik(Hordaland County, about 100 km ENE of Bergen), insouth-west Norway. The pasture was located on thesteep, south-facing slopes towards the Hardangerfjord(5–60 m a.s.l.). Grazing was confined to spring andearly autumn, and grazing intensity was low during thestudy years (
<
10 animals). Natural gaps were pre-dominantly formed by plant death following flowering,or by sheep trampling/scraping in the grass turf. Bothdisturbance types usually resulted in small areas ofbare ground (
c
. 0.04 m
2
), but sheep occasionally createdsomewhat larger gaps. Natural gap-opening was roughlyestimated (by eyesight only) to yield 0.05% to 0.35%open area during the study years.
D. purpurea
population density varied continuouslyfrom low (less than 1 ind. m
–2
) where the grasslandvegetation was closed, to high (up to several hundredind. m
–2
) in disturbed areas. Patches of varying densityand size (
c
. 0.01–25 m
2
) were randomly chosen within thepopulation. Patch boundaries followed the approximatelocal distribution of the focal species, and all individualswithin a patch were included in the study. Small individualswere tagged with numbered flags, while larger ones weremarked with a numbered tag attached to a wire tiedloosely around the rosette/upper part of the root. Indi-viduals were censused in August/September each year from1998 to 2000. In each census the number of leaves andthe length of the longest leaf from the base to the apexwere recorded on each
D. purpurea
individual. Thissimple parameter (leaf length) was the field estimatethat correlated best with dry weight for
D. purpurea
ina preliminary study in 1997 (
r
s
=
0.97,
P
<
0.0001,
n
=
200). The number of capsules was counted on allreproductive individuals. New patches with vegetativeplants present were added in autumn to compensate forlosses due to mortality and flowering. ‘Old’ patcheswere still surveyed, but some lacked new recruitment;the resulting total study area was
c
. 6000 m
2
in all years.
seed bank and recruitment
Artificial disturbance plots were created to determinemaximum levels of recruitment in newly opened gaps.
Plots were situated at varying distances from floweringindividuals (
c
. 0–15 m), and above-ground populationdensity ranged from zero to high. In 10 60
×
30 cmplots, the vegetation and litter layer were removed, andthe upper soil layer was disturbed by raking in summer1998 (after normal germination time, but prior to seeddispersal). To determine if there was less recruitment inareas lacking current seed input, each plot was splitinto two 30
×
30 cm subplots, and one of the subplotswas covered with a frame of fine meshed nylon to pre-vent any seed input from the mature population. Theseframes were removed in late autumn 1998, after normalseed dispersal time. Plot positions ensured that sur-face rainwater would drain seeds out of, rather thanbetween, subplots. However, some minor transportationof surface seeds may still have occurred betweensubplots due to wind or trampling during winter.Individuals emerging in the next season were taggedand subsequently surveyed, as per the rest of thepopulation.
Soil samples for seed bank analyses were takenadjacent to the 10 disturbance plots prior to seeddispersal in summer 1998. Two samples each of15
×
15 cm, and of approximately 10 cm depth, werecollected and brought to the laboratory. Soil sampleswere stored in a dark room at 2
°
C for 5 months. Visibleplant parts were removed and the samples spread outon a layer of sterilized soil in trays in the glasshouse(soil layer was 1–2 cm deep). Trays were regularlywatered, and the temperature was 20
°
C/15
°
C during18 h day/6 h night, respectively. Additional light wassupplied during the day.
D. purpurea
seeds germinatereadily under light treatments, generally reachingvery high germination percentages (van Baalen 1982;Sletvold 2002). Seedling emergence was monitoredtwice a week for 14 weeks, and seedlings were removedafter species identification. After 10 weeks the upper-most layer of the soil was perturbed to promote furthergermination. No seedlings appeared after the 11thweek. Average germination from the two 15
×
15 cmsoil samples was multiplied by four and assumed toequalize viable seed bank size in each 30
×
30 cm subplot.This was then used to calculate recruitment rates andinitial seed bank size in the total population.
data analyses
The life cycle of
D. purpurea
(Fig. 1) has three clearlydelimited stages: seeds in the seed bank, vegetativeindividuals, and flowering individuals. Survival andfecundity is strongly size-dependent (Sletvold 2002,2005), and class limits were chosen on the basis of theserelations. Individuals were divided into four vegetativeclasses (dependent upon maximum length of long-est leaf), and one reproductive class. The smallestobserved threshold size for vernalization (4 cm) wasused as one vegetative class limit. Individuals belowthis size (i.e. individuals too small to flower nextautumn) were divided into ‘tiny rosettes’ (0.1–1.9 cm,
1349
Disturbance and
population
dynamics
© 2007 The AuthorsJournal compilation © 2007 British Ecological Society,
Journal of Ecology
,
95
, 1346–1359
<
30% winter survival probability) and ‘small rosettes’(2–3.9 cm, 30–50% winter survival probability). Indi-viduals above this size were divided into ‘mediumrosettes’ (4–8.9 cm,
>
50% winter survival probabilityand
<
50% flowering probability next year) and ‘largerosettes’ (
≥
9 cm,
>
50% winter survival probabilityand
>
50% flowering probability next year). Seedlingswere included in the class of ‘tiny rosettes’ as the stagehad short duration and was rarely observed.
Transition probabilities between the vegetative andflowering stages were calculated from data in fieldpopulation plots for the two time intervals 1998–99 and1999–2000 (Appendix S1 in Supplementary Material).Transitions between vegetative and flowering stageswere assumed to be unaffected by disturbances. Thisapproximation is justified by the fact that new gaps arepredominantly formed by the death of older plants orsheep trampling/scraping the grass turf in spring, andwill hold as long as disturbance levels are moderate.Seed number was calculated from the number of capsulesproduced in tagged individuals (Log
10
seeds
=
1.37
×
Log
10
capsules
+
2.07,
r
2
=
0.93,
n
=
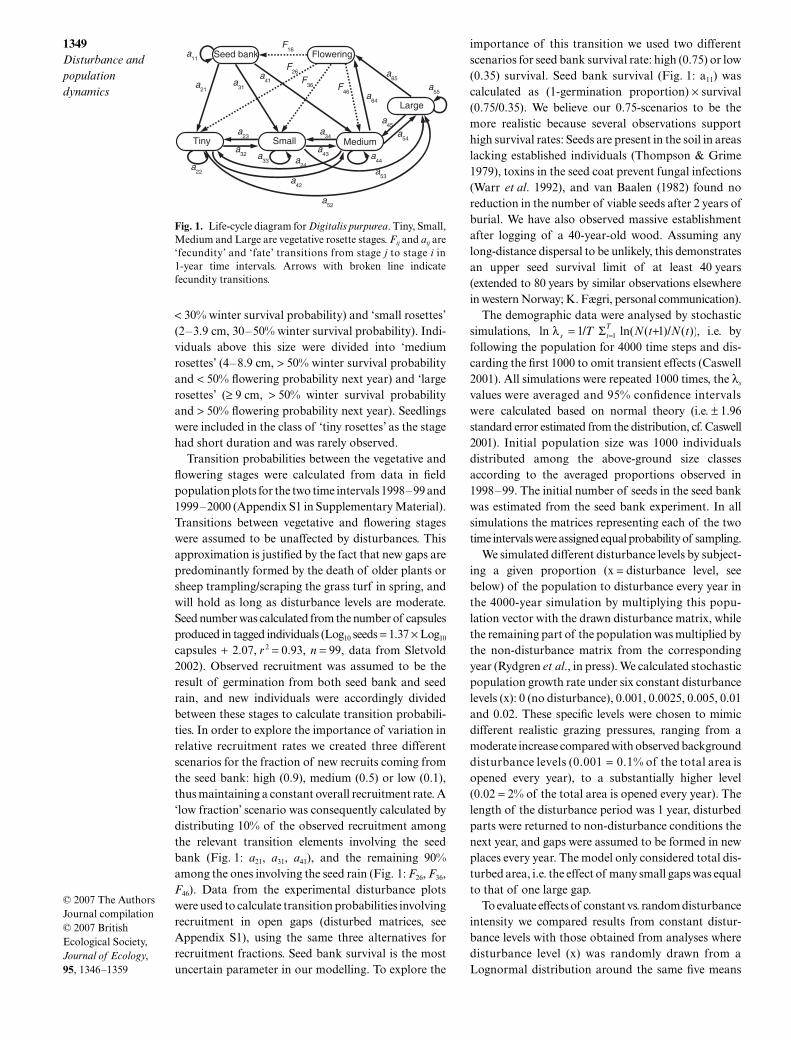
99, data from Sletvold2002). Observed recruitment was assumed to be theresult of germination from both seed bank and seedrain, and new individuals were accordingly dividedbetween these stages to calculate transition probabili-ties. In order to explore the importance of variation inrelative recruitment rates we created three differentscenarios for the fraction of new recruits coming fromthe seed bank: high (0.9), medium (0.5) or low (0.1),thus maintaining a constant overall recruitment rate. A‘low fraction’ scenario was consequently calculated bydistributing 10% of the observed recruitment amongthe relevant transition elements involving the seedbank (Fig. 1:
a
21
,
a
31
,
a
41
), and the remaining 90%among the ones involving the seed rain (Fig. 1:
F
26
,
F
36
,
F
46
). Data from the experimental disturbance plotswere used to calculate transition probabilities involvingrecruitment in open gaps (disturbed matrices, seeAppendix S1), using the same three alternatives forrecruitment fractions. Seed bank survival is the mostuncertain parameter in our modelling. To explore the
importance of this transition we used two differentscenarios for seed bank survival rate: high (0.75) or low(0.35) survival. Seed bank survival (Fig. 1: a
11
) wascalculated as (1-germination proportion)
×
survival(0.75/0.35). We believe our 0.75-scenarios to be themore realistic because several observations supporthigh survival rates: Seeds are present in the soil in areaslacking established individuals (Thompson & Grime1979), toxins in the seed coat prevent fungal infections(Warr
et al
. 1992), and van Baalen (1982) found noreduction in the number of viable seeds after 2 years ofburial. We have also observed massive establishmentafter logging of a 40-year-old wood. Assuming anylong-distance dispersal to be unlikely, this demonstratesan upper seed survival limit of at least 40 years(extended to 80 years by similar observations elsewherein western Norway; K. Fægri, personal communication).
The demographic data were analysed by stochasticsimulations, , i.e. byfollowing the population for 4000 time steps and dis-carding the first 1000 to omit transient effects (Caswell2001). All simulations were repeated 1000 times, the
λ
s
values were averaged and 95% confidence intervalswere calculated based on normal theory (i.e.
±
1.96standard error estimated from the distribution, cf. Caswell2001). Initial population size was 1000 individualsdistributed among the above-ground size classesaccording to the averaged proportions observed in1998–99. The initial number of seeds in the seed bankwas estimated from the seed bank experiment. In allsimulations the matrices representing each of the twotime intervals were assigned equal probability of sampling.
We simulated different disturbance levels by subject-ing a given proportion (x
=
disturbance level, seebelow) of the population to disturbance every year inthe 4000-year simulation by multiplying this popu-lation vector with the drawn disturbance matrix, whilethe remaining part of the population was multiplied bythe non-disturbance matrix from the correspondingyear (Rydgren
et al
., in press). We calculated stochasticpopulation growth rate under six constant disturbancelevels (x): 0 (no disturbance), 0.001, 0.0025, 0.005, 0.01and 0.02. These specific levels were chosen to mimicdifferent realistic grazing pressures, ranging from amoderate increase compared with observed backgrounddisturbance levels (0.001
=
0.1% of the total area isopened every year), to a substantially higher level(0.02
=
2% of the total area is opened every year). Thelength of the disturbance period was 1 year, disturbedparts were returned to non-disturbance conditions thenext year, and gaps were assumed to be formed in newplaces every year. The model only considered total dis-turbed area, i.e. the effect of many small gaps was equalto that of one large gap.
To evaluate effects of constant vs. random disturbanceintensity we compared results from constant distur-bance levels with those obtained from analyses wheredisturbance level (x) was randomly drawn from aLognormal distribution around the same five means
Fig. 1. Life-cycle diagram for Digitalis purpurea. Tiny, Small,Medium and Large are vegetative rosette stages. Fij and aij are‘fecundity’ and ‘fate’ transitions from stage j to stage i in1-year time intervals. Arrows with broken line indicatefecundity transitions.
ln / ln( ( )/ ( ))λ s t
TT N t N t= +=1 11Σ
1350
N. Sletvold &
K. Rydgren
© 2007 The AuthorsJournal compilation © 2007 British Ecological Society,
Journal of Ecology
,
95
, 1346–1359
(0.001, 0.0025, 0.005, 0.01, 0.02). In each scenario,minimum disturbance level was 0, and maximumdisturbance level was 10 times the mean (see Table 1).The Lognormal distribution was chosen to obtainscenarios where small disturbances were frequent, andlarge disturbances rare. To further determine theinfluence of temporal variation in disturbance patternwe performed analyses with three fixed disturbance levels(x) of 0.01, 0.05 and 0.10 under regular and irregularreturn intervals of 2–100 years, where irregularintervals had the same mean return time as the cor-responding regular analysis. Irregular intervals weregenerated by dividing total generations on averageinterval length, and randomly distributing the result-ing number of disturbed years (e.g. 4000 years/5 yearsinterval
=
800 disturbed years randomly assignedacross total time). This wide range in interval periodsallowed modelling of the different types of disturbancedynamics
D. purpurea
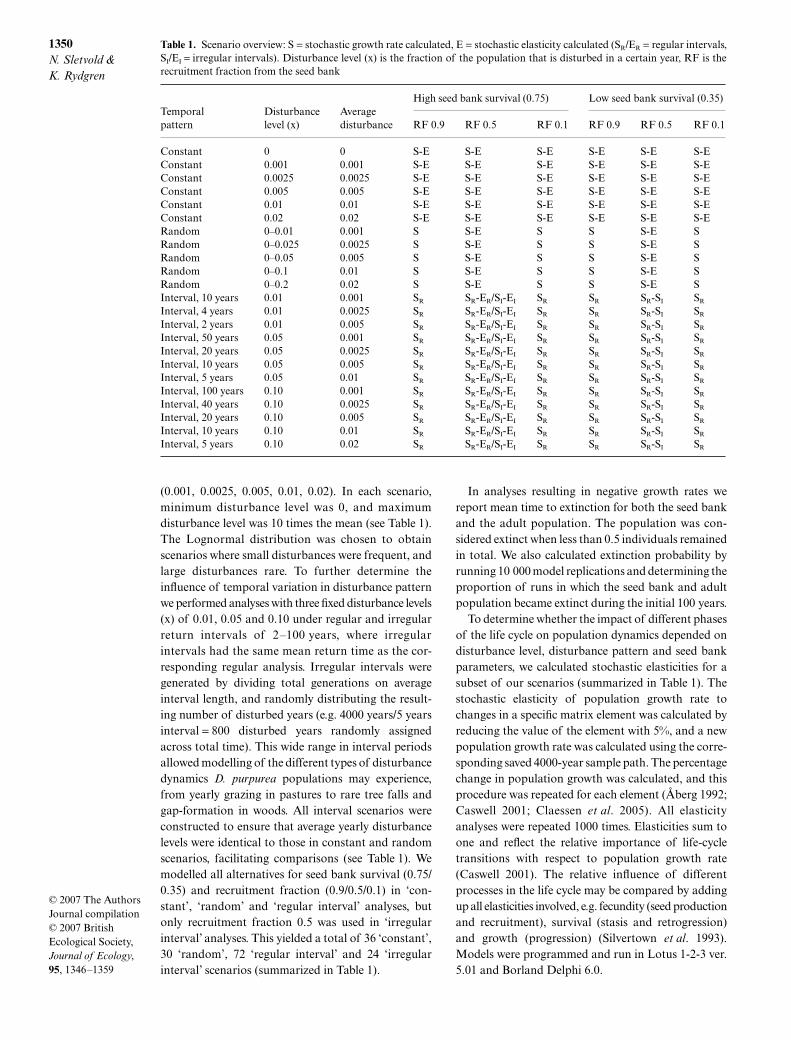
populations may experience,from yearly grazing in pastures to rare tree falls andgap-formation in woods. All interval scenarios wereconstructed to ensure that average yearly disturbancelevels were identical to those in constant and randomscenarios, facilitating comparisons (see Table 1). Wemodelled all alternatives for seed bank survival (0.75/0.35) and recruitment fraction (0.9/0.5/0.1) in ‘con-stant’, ‘random’ and ‘regular interval’ analyses, butonly recruitment fraction 0.5 was used in ‘irregularinterval’ analyses. This yielded a total of 36 ‘constant’,30 ‘random’, 72 ‘regular interval’ and 24 ‘irregularinterval’ scenarios (summarized in Table 1).
In analyses resulting in negative growth rates wereport mean time to extinction for both the seed bankand the adult population. The population was con-sidered extinct when less than 0.5 individuals remainedin total. We also calculated extinction probability byrunning 10 000 model replications and determining theproportion of runs in which the seed bank and adultpopulation became extinct during the initial 100 years.
To determine whether the impact of different phasesof the life cycle on population dynamics depended ondisturbance level, disturbance pattern and seed bankparameters, we calculated stochastic elasticities for asubset of our scenarios (summarized in Table 1). Thestochastic elasticity of population growth rate tochanges in a specific matrix element was calculated byreducing the value of the element with 5%, and a newpopulation growth rate was calculated using the corre-sponding saved 4000-year sample path. The percentagechange in population growth was calculated, and thisprocedure was repeated for each element (Åberg 1992;Caswell 2001; Claessen
et al
. 2005). All elasticityanalyses were repeated 1000 times. Elasticities sum toone and reflect the relative importance of life-cycletransitions with respect to population growth rate(Caswell 2001). The relative influence of differentprocesses in the life cycle may be compared by addingup all elasticities involved, e.g. fecundity (seed productionand recruitment), survival (stasis and retrogression)and growth (progression) (Silvertown et al. 1993).Models were programmed and run in Lotus 1-2-3 ver.5.01 and Borland Delphi 6.0.
Table 1. Scenario overview: S = stochastic growth rate calculated, E = stochastic elasticity calculated (SR/ER = regular intervals,SI/EI = irregular intervals). Disturbance level (x) is the fraction of the population that is disturbed in a certain year, RF is therecruitment fraction from the seed bank
Temporal pattern
Disturbancelevel (x)
Averagedisturbance
High seed bank survival (0.75) Low seed bank survival (0.35)
RF 0.9 RF 0.5 RF 0.1 RF 0.9 RF 0.5 RF 0.1
Constant 0 0 S-E S-E S-E S-E S-E S-EConstant 0.001 0.001 S-E S-E S-E S-E S-E S-EConstant 0.0025 0.0025 S-E S-E S-E S-E S-E S-EConstant 0.005 0.005 S-E S-E S-E S-E S-E S-EConstant 0.01 0.01 S-E S-E S-E S-E S-E S-EConstant 0.02 0.02 S-E S-E S-E S-E S-E S-ERandom 0–0.01 0.001 S S-E S S S-E SRandom 0–0.025 0.0025 S S-E S S S-E SRandom 0–0.05 0.005 S S-E S S S-E SRandom 0–0.1 0.01 S S-E S S S-E SRandom 0–0.2 0.02 S S-E S S S-E SInterval, 10 years 0.01 0.001 SR SR-ER/SI-EI SR SR SR-SI SR
Interval, 4 years 0.01 0.0025 SR SR-ER/SI-EI SR SR SR-SI SR
Interval, 2 years 0.01 0.005 SR SR-ER/SI-EI SR SR SR-SI SR
Interval, 50 years 0.05 0.001 SR SR-ER/SI-EI SR SR SR-SI SR
Interval, 20 years 0.05 0.0025 SR SR-ER/SI-EI SR SR SR-SI SR
Interval, 10 years 0.05 0.005 SR SR-ER/SI-EI SR SR SR-SI SR
Interval, 5 years 0.05 0.01 SR SR-ER/SI-EI SR SR SR-SI SR
Interval, 100 years 0.10 0.001 SR SR-ER/SI-EI SR SR SR-SI SR
Interval, 40 years 0.10 0.0025 SR SR-ER/SI-EI SR SR SR-SI SR
Interval, 20 years 0.10 0.005 SR SR-ER/SI-EI SR SR SR-SI SR
Interval, 10 years 0.10 0.01 SR SR-ER/SI-EI SR SR SR-SI SR
Interval, 5 years 0.10 0.02 SR SR-ER/SI-EI SR SR SR-SI SR
1351Disturbance and
population
dynamics
© 2007 The AuthorsJournal compilation © 2007 British Ecological Society, Journal of Ecology, 95, 1346–1359
Results
seed bank size and recruitment in experimental gaps
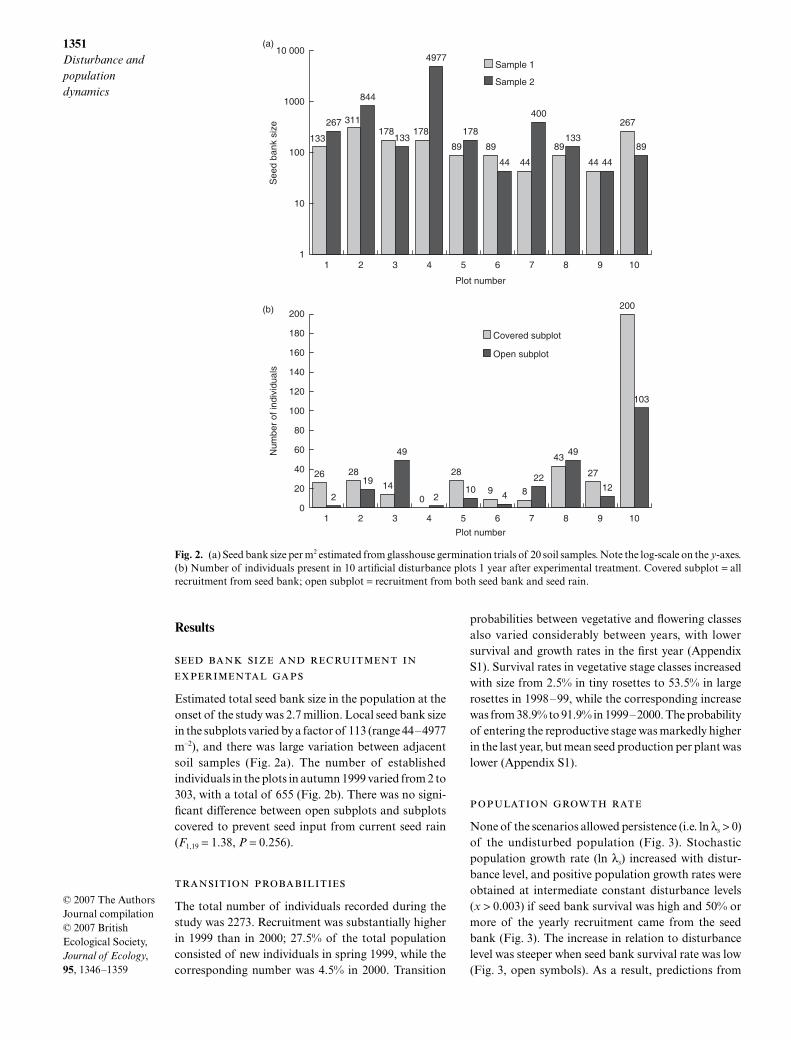
Estimated total seed bank size in the population at theonset of the study was 2.7 million. Local seed bank sizein the subplots varied by a factor of 113 (range 44–4977m–2), and there was large variation between adjacentsoil samples (Fig. 2a). The number of establishedindividuals in the plots in autumn 1999 varied from 2 to303, with a total of 655 (Fig. 2b). There was no signi-ficant difference between open subplots and subplotscovered to prevent seed input from current seed rain(F1,19 = 1.38, P = 0.256).
transition probabilities
The total number of individuals recorded during thestudy was 2273. Recruitment was substantially higherin 1999 than in 2000; 27.5% of the total populationconsisted of new individuals in spring 1999, while thecorresponding number was 4.5% in 2000. Transition
probabilities between vegetative and flowering classesalso varied considerably between years, with lowersurvival and growth rates in the first year (AppendixS1). Survival rates in vegetative stage classes increasedwith size from 2.5% in tiny rosettes to 53.5% in largerosettes in 1998–99, while the corresponding increasewas from 38.9% to 91.9% in 1999–2000. The probabilityof entering the reproductive stage was markedly higherin the last year, but mean seed production per plant waslower (Appendix S1).
population growth rate
None of the scenarios allowed persistence (i.e. ln λs > 0)of the undisturbed population (Fig. 3). Stochasticpopulation growth rate (ln λs) increased with distur-bance level, and positive population growth rates wereobtained at intermediate constant disturbance levels(x > 0.003) if seed bank survival was high and 50% ormore of the yearly recruitment came from the seedbank (Fig. 3). The increase in relation to disturbancelevel was steeper when seed bank survival rate was low(Fig. 3, open symbols). As a result, predictions from
Fig. 2. (a) Seed bank size per m2 estimated from glasshouse germination trials of 20 soil samples. Note the log-scale on the y-axes.(b) Number of individuals present in 10 artificial disturbance plots 1 year after experimental treatment. Covered subplot = allrecruitment from seed bank; open subplot = recruitment from both seed bank and seed rain.

1352N. Sletvold &
K. Rydgren
© 2007 The AuthorsJournal compilation © 2007 British Ecological Society, Journal of Ecology, 95, 1346–1359
the two seed bank survival scenarios differed more atlow disturbance levels. Assumptions about the recruit-ment fraction (RF) from seed bank vs. seed rain alsohad strong effects on predicted population growth.Stochastic growth rate was positively related to thefraction recruiting from the seed bank, and the increasein population growth rate in relation to constant levelsof gap-opening was steeper when the seed bankfraction was high (Fig. 3, diamond symbols). As aresult, predictions from the three recruitment scenariosdiffered more at high disturbance levels.
Scenarios with random variation in yearly disturbancedegree resulted in lower stochastic growth rates com-pared with constant scenarios (Fig. 4). If disturbancesof a fixed level occurred at regular intervals the growthrate was further lowered (with the exception of scenarioswith 2-year intervals; Fig. 4). Small and frequent dis-turbances were favourable to large and rare ones; as
interval length and disturbance level increased, growthrate invariably decreased (Fig. 4). Scenarios withregular interval length always resulted in higher growthrates compared with scenarios with irregular intervals(with the same mean return-time), and the differencesbecame larger as disturbance level increased(Fig. 4, x = 0.02). Different temporal disturbancepatterns of the same average level could yield quitediverse results; opening 1% of the area every secondyear resulted in a positive growth rate of 0.031, while10% every 20th year gave a negative growth rate of–0.069 (Fig. 4, x = 0.005). A summary of the resultsfrom all scenarios is shown in Table S1.
extinction risk
Time to extinction always increased with disturbancelevel, and was 1.5–3 times longer for the seed bank than
Fig. 3. Stochastic population growth rate (ln λs, mean with 95% CI) in relation to constant disturbance level for 36 differentscenarios using two seed bank survival rates (0.75/0.35) and three recruitment fractions from the seed bank (high = 0.9/medium = 0.5/low = 0.1).
Fig. 4. Stochastic population growth rate (ln λs, mean with 95% CI) for ‘constant’, ‘random’, ‘regular interval’ and ‘irregularinterval’ scenarios resulting in five average disturbance levels. All scenarios are based on high seed bank survival rate (0.75) andmedium recruitment fraction (0.5) from the seed bank.
1353Disturbance and
population
dynamics
© 2007 The AuthorsJournal compilation © 2007 British Ecological Society, Journal of Ecology, 95, 1346–1359
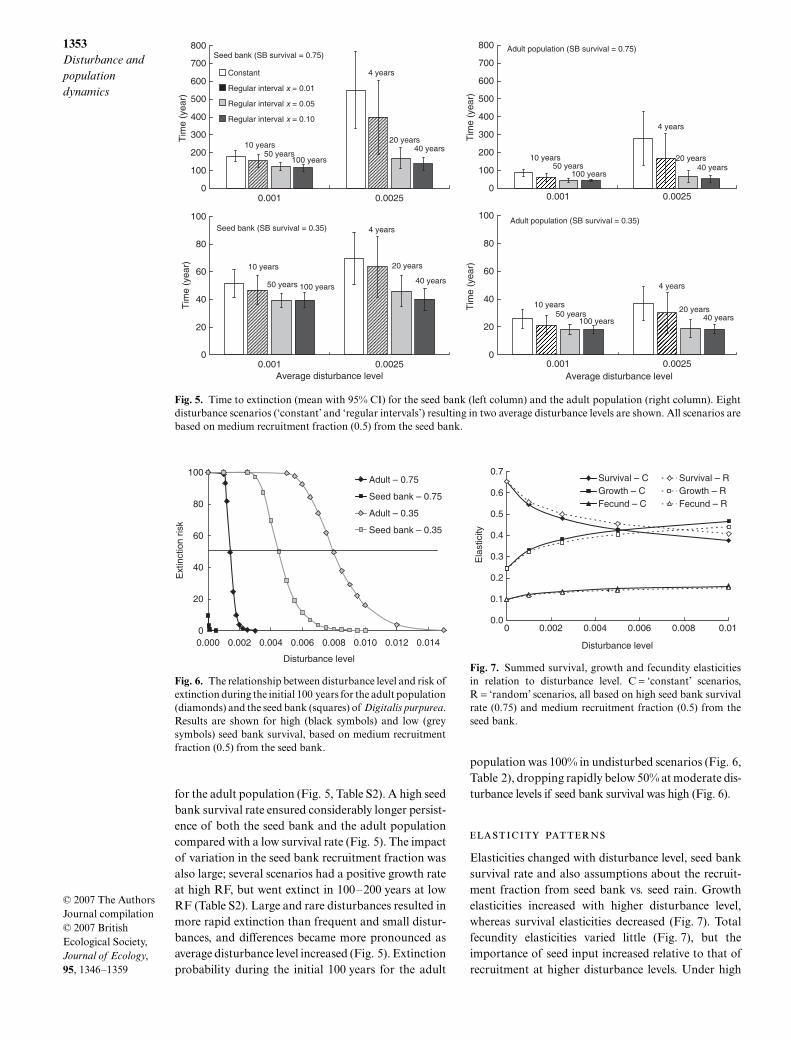
for the adult population (Fig. 5, Table S2). A high seedbank survival rate ensured considerably longer persist-ence of both the seed bank and the adult populationcompared with a low survival rate (Fig. 5). The impactof variation in the seed bank recruitment fraction wasalso large; several scenarios had a positive growth rateat high RF, but went extinct in 100–200 years at lowRF (Table S2). Large and rare disturbances resulted inmore rapid extinction than frequent and small distur-bances, and differences became more pronounced asaverage disturbance level increased (Fig. 5). Extinctionprobability during the initial 100 years for the adult
population was 100% in undisturbed scenarios (Fig. 6,Table 2), dropping rapidly below 50% at moderate dis-turbance levels if seed bank survival was high (Fig. 6).
elasticity patterns
Elasticities changed with disturbance level, seed banksurvival rate and also assumptions about the recruit-ment fraction from seed bank vs. seed rain. Growthelasticities increased with higher disturbance level,whereas survival elasticities decreased (Fig. 7). Totalfecundity elasticities varied little (Fig. 7), but theimportance of seed input increased relative to that ofrecruitment at higher disturbance levels. Under high
Fig. 5. Time to extinction (mean with 95% CI) for the seed bank (left column) and the adult population (right column). Eightdisturbance scenarios (‘constant’ and ‘regular intervals’) resulting in two average disturbance levels are shown. All scenarios arebased on medium recruitment fraction (0.5) from the seed bank.
Fig. 6. The relationship between disturbance level and risk ofextinction during the initial 100 years for the adult population(diamonds) and the seed bank (squares) of Digitalis purpurea.Results are shown for high (black symbols) and low (greysymbols) seed bank survival, based on medium recruitmentfraction (0.5) from the seed bank.
Fig. 7. Summed survival, growth and fecundity elasticitiesin relation to disturbance level. C = ‘constant’ scenarios,R = ‘random’ scenarios, all based on high seed bank survivalrate (0.75) and medium recruitment fraction (0.5) from theseed bank.

1354N. Sletvold &
K. Rydgren
© 2007 The AuthorsJournal compilation © 2007 British Ecological Society, Journal of Ecology, 95, 1346–1359
Fig. 8. Effects of disturbance level (top, x = 0; middle, x = 0.0025; bottom, x = 0.01) and recruitment fraction (high = 0.9/low = 0.1) on elasticity patternsunder high (a) and low (b) seed bank survival rate. Dark grey bars correspond to survival transitions, light grey bars to growth transitions, and white barsto fecundity transitions. S1 = seed bank, S2 = tiny rosettes, S3 = small rosettes, S4 = medium rosettes, S5 = large rosettes, S6 = flowering rosettes.
seed bank survival, λs invariably was most sensitive tothe proportion of seeds surviving in the seed bank(Fig. 8a, S1-S1). In the undisturbed population thistransition contributed 56.0% (0.9 RF) vs. 78.0% (0.1RF) to changes in λs. The second most importanttransition was always the number of seeds entering theseed bank, contributing 10.8% (0.9 RF) vs. 3.7% (0.1RF) to λs in the undisturbed population (Fig. 8a, S6–S1).Disturbance-dependent changes were more pro-
nounced at high recruitment fractions from the seedbank. Single elements contributing more to λs at higherdisturbance levels were the transitions from seed bankto rosettes, the probability of entering or staying in themedium or large rosette stage, and the probability ofentering the reproductive stage (Fig. 8a).
Under low seed bank survival, elasticity patternswere more complex, and relative ranking of the differenttransitions changed with both disturbance level and
Table 2. Extinction probability during the initial 100 years for the seed bank (SB) and the adult population (A) in relation to seedbank survival rate, seed bank recruitment fraction (RF) and constant disturbance level (Dist.)
RFDist.
High seed bank survival (0.75) Low seed bank survival (0.35)
0.9 0.5 0.1 0.9 0.5 0.1
SB A SB A SB A SB A SB A SB A
0 0 100 9.6 100 100 100 100 100 100 100 100 1000.001 0 0 0 98.8 100 100 100 100 100 100 100 1000.0025 0 0 0 0.6 73.1 100 37.9 99.8 99.9 100 100 1000.005 0 0 0 0 0.4 100 0.4 24.7 31.6 99.5 100 1000.01 0 0 0 0 0 66.3 0 0 0 15.9 100 1000.02 0 0 0 0 0 0.2 0 0 0 0 81.8 100
1355Disturbance and
population
dynamics
© 2007 The AuthorsJournal compilation © 2007 British Ecological Society, Journal of Ecology, 95, 1346–1359
recruitment fraction (Fig. 8b). However, elasticityvalues within a matrix varied less, with no single elementcontributing more than 20% to λs. At high recruitmentfractions from the seed bank, λs was most sensitive tothe proportion of seeds surviving in the seed bank(S1-S1) and the number of new seeds entering the seedbank (S6-S1). Together these two transitions contributed31–37% to λs, with the importance of seed bank survivalrelative to seed bank input decreasing with increasingdisturbance level. At low recruitment fractions fromthe seed bank, the single transition contributing mostto λs in the undisturbed population was stasis in themedium vegetative class (13.8%; Fig. 8b, S4-S4).
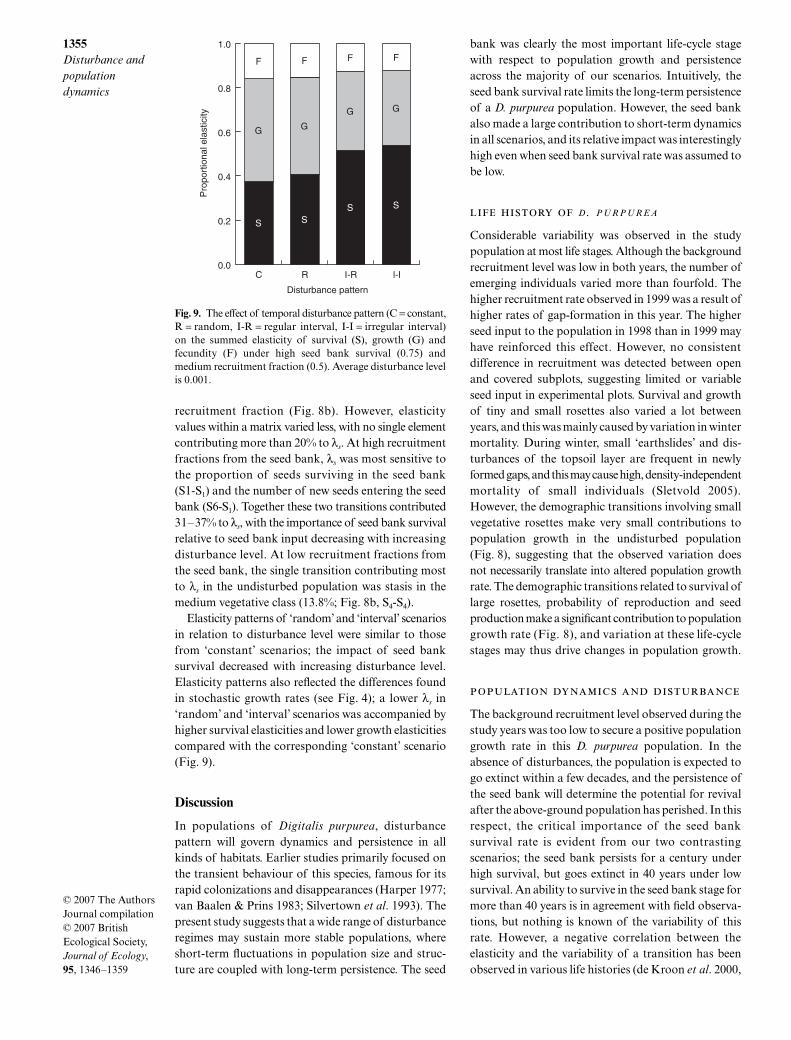
Elasticity patterns of ‘random’ and ‘interval’ scenariosin relation to disturbance level were similar to thosefrom ‘constant’ scenarios; the impact of seed banksurvival decreased with increasing disturbance level.Elasticity patterns also reflected the differences foundin stochastic growth rates (see Fig. 4); a lower λs in‘random’ and ‘interval’ scenarios was accompanied byhigher survival elasticities and lower growth elasticitiescompared with the corresponding ‘constant’ scenario(Fig. 9).
Discussion
In populations of Digitalis purpurea, disturbancepattern will govern dynamics and persistence in allkinds of habitats. Earlier studies primarily focused onthe transient behaviour of this species, famous for itsrapid colonizations and disappearances (Harper 1977;van Baalen & Prins 1983; Silvertown et al. 1993). Thepresent study suggests that a wide range of disturbanceregimes may sustain more stable populations, whereshort-term fluctuations in population size and struc-ture are coupled with long-term persistence. The seed
bank was clearly the most important life-cycle stagewith respect to population growth and persistenceacross the majority of our scenarios. Intuitively, theseed bank survival rate limits the long-term persistenceof a D. purpurea population. However, the seed bankalso made a large contribution to short-term dynamicsin all scenarios, and its relative impact was interestinglyhigh even when seed bank survival rate was assumed tobe low.
life history of D. P U R P U R E A
Considerable variability was observed in the studypopulation at most life stages. Although the backgroundrecruitment level was low in both years, the number ofemerging individuals varied more than fourfold. Thehigher recruitment rate observed in 1999 was a result ofhigher rates of gap-formation in this year. The higherseed input to the population in 1998 than in 1999 mayhave reinforced this effect. However, no consistentdifference in recruitment was detected between openand covered subplots, suggesting limited or variableseed input in experimental plots. Survival and growthof tiny and small rosettes also varied a lot betweenyears, and this was mainly caused by variation in wintermortality. During winter, small ‘earthslides’ and dis-turbances of the topsoil layer are frequent in newlyformed gaps, and this may cause high, density-independentmortality of small individuals (Sletvold 2005).However, the demographic transitions involving smallvegetative rosettes make very small contributions topopulation growth in the undisturbed population(Fig. 8), suggesting that the observed variation doesnot necessarily translate into altered population growthrate. The demographic transitions related to survival oflarge rosettes, probability of reproduction and seedproduction make a significant contribution to populationgrowth rate (Fig. 8), and variation at these life-cyclestages may thus drive changes in population growth.
population dynamics and disturbance
The background recruitment level observed during thestudy years was too low to secure a positive populationgrowth rate in this D. purpurea population. In theabsence of disturbances, the population is expected togo extinct within a few decades, and the persistence ofthe seed bank will determine the potential for revivalafter the above-ground population has perished. In thisrespect, the critical importance of the seed banksurvival rate is evident from our two contrastingscenarios; the seed bank persists for a century underhigh survival, but goes extinct in 40 years under lowsurvival. An ability to survive in the seed bank stage formore than 40 years is in agreement with field observa-tions, but nothing is known of the variability of thisrate. However, a negative correlation between theelasticity and the variability of a transition has beenobserved in various life histories (de Kroon et al. 2000,
Fig. 9. The effect of temporal disturbance pattern (C = constant,R = random, I-R = regular interval, I-I = irregular interval)on the summed elasticity of survival (S), growth (G) andfecundity (F) under high seed bank survival (0.75) andmedium recruitment fraction (0.5). Average disturbance levelis 0.001.

1356N. Sletvold &
K. Rydgren
© 2007 The AuthorsJournal compilation © 2007 British Ecological Society, Journal of Ecology, 95, 1346–1359
and references therein), suggesting that traits with largeinfluence on fitness may be buffered against variation(Pfister 1998).
Increasing the disturbance level had a direct,positive effect on stochastic population growth rate,and the pattern was qualitatively consistent across seedbank survival and recruitment scenarios (Fig. 3).A moderate increase (c. 0.3% yearly gap-opening) ingrazing pressure in comparison with background levelsled to quite stable dynamics with ln λs fluctuatingaround zero. Our highest constant disturbance levelmimics a considerable increase in grazing pressure (2%yearly gap-opening), and this scenario led to rapidpopulation growth (ln λs = 0.21). As stochastic growthrate increased with disturbance level there was a shift inelasticities; the importance of seed bank survivaldecreased, and that of adult growth, survival andfecundity increased. In populations with low disturbancerate and scarce recruitment, seed bank longevity is thekey to persistence. In highly disturbed populations,recruitment will be high, rapidly depleting the seedbank in the absence of new seed production. Reproduc-tion then becomes vital to secure replenishment of theseed bank, and this is reflected in the rising elasticitiesof seed production, growth of small rosettes, andsurvival and probability of flowering of large rosettes(Fig. 8). Similar elasticity shifts among life-historystages have been found in riparian species in relation toflooding (Smith et al. 2005; Elderd & Doak 2006),stressing the importance of the seed bank as a bufferagainst unfavourable conditions. The fact that seedbank survival rate had the highest elasticity even indisturbed populations suggests that selection for seedlongevity is stronger than selection acting on any otherlife-history stage regardless of disturbance pattern.This is in agreement with the notion that seed survivalis already high in D. purpurea.
Elasticities are local characteristics of a matrix(Caswell 2001), as demonstrated by the elasticitypatterns from our two seed survival scenarios. Thepattern from a ‘high-survival’ population tends tobecome more like that from a ‘low-survival’ populationas disturbance level increases (Fig. 8), reflecting thatthe impact of a transition depends both on its internalvalue and external setting (de Kroon et al. 2000). Thisbecomes even more evident when comparing the presentstudy with that of Silvertown et al. (1993), who built apopulation matrix model for D. purpurea parameter-ized with demographic data collected in populations inearly successional stages by van Baalen (1982) and vanBaalen & Prins (1983). The population growth rate andelasticity values of their model contrast strongly withthe results obtained in the present study: deterministicλ was 11.8, and the summed elasticity of recruitmentand growth contributed 95% to changes in λ, whereasthe seed bank only contributed 4%. The elasticitypattern found in our grassland population is almostreversed, and suggests that the relative importance ofdifferent life-history stages may vary dramatically
among local populations of D. purpurea. In the initialphases of a short-lived population type, rapid estab-lishment from the seed bank boosts population growthrate, and this is reflected in the high importance ofrecruitment and growth in the study of Silvertown et al.(1993). As the population starts to decline, the impor-tance of survival and stasis is expected to increase. Suchsystematic variation in elasticity values with populationgrowth rate has been found in several species (Silver-town et al. 1996; Valverde & Silvertown 1998; Liu et al.2005), and is confirmed by the positive correlationbetween stochastic growth rate, disturbance andgrowth elasticities in the present study.
temporal disturbance pattern
Stochastic population growth rate and extinction riskwas, to a large degree, determined by disturbanceintensity in this D. purpurea population; however,variation in temporal disturbance pattern also hadsignificant effects. Model scenarios with randomvariation in yearly gap-opening probably represent thebest approximation of natural disturbance patterns inthe studied population, and random disturbance intensityalways resulted in lower population growth thanconstant disturbance, with non-overlapping CIs exceptat the lowest disturbance level (x = 0.001). This isexpected, as random scenarios will include consecutiveyears without disturbance. The impact of stretches ofyears without disturbance became more evident inregular interval scenarios; the threshold average dis-turbance level for population persistence increaseswith interval length (Fig. 4, Table S1). This implies thatfrequent, small-scale disturbances are favourable torare and large-scale ones for D. purpurea, and thattypical grassland populations are less likely to goextinct than populations persisting in wood-gaps, evenif average disturbance levels are identical. Elasticityanalyses demonstrate that survival elasticities increasewith interval length, whereas growth and fecundityelasticities decrease, reflecting the high importance ofthe seed bank in bridging periods between rare dis-turbances. In fact, scenarios where 10% of the area wasopened every hundred years had almost identicalelasticity patterns as the undisturbed population. Theregularity of disturbances also influenced the populationgrowth rate in some scenarios. Irregular return inter-vals always led to lower population growth rate thanthe corresponding regular return times, but CIs wereoverlapping at low average disturbance levels (Fig. 4,Table S1). Differences became quite large at thehighest average disturbance level, due to occasionallong runs between disturbances in the irregularscenario compared with the regular one.
seed bank dynamics
The estimation of seed bank rates in species withlong-lived, small seeds is notoriously difficult, and it is

1357Disturbance and
population
dynamics
© 2007 The AuthorsJournal compilation © 2007 British Ecological Society, Journal of Ecology, 95, 1346–1359
interesting that variation in survival and recruitmentfraction had such a large impact on our model results.The large plot variation in estimated seed bank sizesuggests that seed bank density and seed bank-derivedgermination fractions vary on a very local scale in thestudied population, and the small seed bank size foundin some plots indicates that recruitment actually maybe seed-limited if there are no reproductive plantsnearby. The relative impact of different life-cycle stageson population development may consequently also varyon a very local scale. These results restate the conclusionsof Kalisz & McPeek (1992), who found that projectedpopulation dynamics in the winter annual Collinsia
verna could differ widely due to spatial variation in seedbank structure. However, although seed bank recruitmentfractions in any given year and site may vary from zeroto one, our scenarios using RF = 0.5 should represent apopulation average through time.
model relevance
Our modelling approach does not consider the exactspatial pattern of disturbed area in the population, anddynamics may also depend on complex effects of gapsize-variation on recruitment rates and performance (e.g.Bullock et al. 1995). However, our recruitment data fromexperimental gaps include self-thinning, and are reason-able for a wide range of naturally occurring gap sizes,both smaller (NS, unpublished data) and larger (Sletvold2005) than the experimentally created ones. The modelalso tests for effects of variation in both magnitude andfrequency of gap-formation, and the 3 years of surveydata allow stochastic models to be used. In total, webelieve that this approach provides insight into the majorfactors governing the variable dynamics of D. purpurea
populations. However, results from scenarios withlarge disturbance intensities should be viewed withsome caution. Higher sheep density would probablyaffect established plants in addition to recruitmentrates, as sheep occasionally destroy rosettes or flower-ing stalks by trampling. The timing of grazing couldalso be important; damage to flowering plants wasunimportant in our study years due to the fact thatgrazing mainly took place in spring. The spatial patternof disturbances may also turn less random with highersheep densities, as the animals start making distinctpaths and resting sites. The population-level effects ofhigher adult mortality would further be reinforced bythe fact that adult survival and fecundity contributes moreto population growth in highly disturbed populations.
concluding remarks
The estimation of disturbance-effects on seed bankrates and their subsequent incorporation into quanti-tative population models are necessary to understandhow population dynamics are influenced by dis-turbances in species with persistent seed banks. Ingeneral, plants with large seed banks are expected to be
microsite-limited rather than seed-limited, because seedsfrom the seed bank will saturate all gaps created (Crawley1983). Due to its very large and persistent seed bank,D. purpurea has been used as a typical example of thistype of life history (Harper 1977; van der Meijden et al.1992). However, our study suggests that ‘local’ seed-limitation may occur even in D. purpurea, due to amosaic seed bank resulting from large spatial variationin both seed production and germination. If gap-formation in the population is completely random,such spatial structure should be swamped over timedue to the gradual build-up of the long-lived seed bank.This is apparently not the case in the studied population,but whether this is due to insufficient time or non-random disturbance patterns is unknown. Ultimately,population growth of D. purpurea will always bemicrosite-limited, because seeds require bare soil togerminate (van Baalen 1982). However, our resultssuggest that this does not necessarily preclude theoccurrence of seed-limitation. The spatial pattern ofgap opening in relation to both seed bank and adultplant density will determine whether the species is ableto take advantage of every unpredictable opportunityoffered. In summary, D. purpurea seems to exhibitconsiderable flexibility towards variation in temporaldisturbance patterns, something that also has beenfound for several shrubland species in relation to fireregimes (e.g. Satterthwaite et al. 2002; Menges et al.2006). Nevertheless, as disturbances become increasinglyrare and/or unpredictable, extinction risk increases andseed bank survival will be crucial.
Acknowledgements
We thank J. Ågren, J. Ehrlén, Ø. Totland, P. Zuidemaand two anonymous reviewers for comments on themanuscript, J. M. Grindeland for programming inDelphi, and the Norwegian Research Council (grantno. 123845/410 to NS) and the Nansen Foundation ofthe Norwegian Academy of Sciences (grant no. 73/99to NS) for their funding support.
References
Åberg, P. (1992) Size-based demography of the seaweedAscophyllum nodosum in stochastic environments. Ecology,73, 1488–1501.
Alexander, H.M. & Schrag, A.M. (2003) Role of soil seedbanks and newly dispersed seeds in population dynamics ofthe annual sunflower, Helianthus annuus. Journal of Ecology,91, 987–998.
van Baalen, J. (1982) Germination ecology and seed popula-tion dynamics of Digitalis purpurea. Oecologia, 53, 61–67.
van Baalen, J. & Prins, E.G.M. (1983) Growth and reproductionof Digitalis purpurea in different stages of succession.Oecologia, 58, 84–91.
Benoit, D.L., Derksen, D.A. & Panneton, B. (1992) Innovativeapproaches to seedbank studies. Weed Science, 40, 660–669.
Bullock, J.M., Clear Hill, B. & Silvertown, J. (1994) Demo-graphy of Cirsium vulgare in a grazing experiment. Journal of
Ecology, 82, 101–111.
1358N. Sletvold &
K. Rydgren
© 2007 The AuthorsJournal compilation © 2007 British Ecological Society, Journal of Ecology, 95, 1346–1359
Bullock, J.M., Clear Hill, B., Silvertown, J. & Sutton, M.(1995) Gap colonization as a source of grassland communitychange – effects of gap size and grazing on the rate andmode of colonization by different species. Oikos, 72, 273–282.
Cabin, R.J., Marshall, D.L. & Mitchell, R.J. (2000) The demo-graphic role of soil seed banks. II. Investigations of the fateof experimental seeds of the desert mustard Lesquerella fendleri.Journal of Ecology, 88, 293–302.
Caswell, H. (2001) Matrix Population Models: Construction,
Analysis, and Interpretation, 2nd edn. Sinauer Associates,Sunderland, MA.
Claessen, D., Gilligan, C.A., Lutman, P.J.W. & van den Bosch,F. (2005) Which traits promote persistence of feral GMcrops? Part 1: implications of environmental stochasticity.Oikos, 110, 20–29.
Crawley, M. (1983) Herbivory. The Dynamics of Animal–Plant
Interactions. Blackwell Scientific, Oxford.Elderd, B. & Doak, D.F. (2006) Comparing the direct and
community-mediated effects of disturbance on plant popu-lation dynamics: flooding, herbivory and Mimulus guttatus.Journal of Ecology, 94, 656–669.
Eriksson, O. & Ehrlén, J. (1992) Seed and microsite limitationof recruitment in plant populations. Oecologia, 91, 360–364.
Giho, H. & Seno, H. (1997) Transition matrix modelling ondisturbance-controlled persistence of plant population.Ecological Modelling, 94, 207–219.
Grime, J.P. (1979) Plant Strategies and Vegetation Processes.Wiley, Chichester.
Gross, K.L. (1980) Colonization by Verbascum thapsus of anold-field in Michigan: experiments on the effects of vegetation.Journal of Ecology, 68, 919–927.
Gross, K., Lockwood, J.R. III, Frost, C.C. & Morris, W.F.(1998) Modeling controlled burning and trampling reductionfor conservation of Hudsonia montana. Conservation Biology,12, 1291–1301.
Harper, J.L. (1977) Population Biology of Plants. AcademicPress, London.
Hoffmann, W.A. (1999) Fire and population dynamics ofwoody plants in neotropical savanna: matrix model pro-jections. Ecology, 80, 1354–1369.
de Jong, T.J. & Klinkhamer, P.G.L. (1988) Population ecologyof the biennials Cirsium vulgare and Cynoglossum officinale
in a coastal sand-dune area. Journal of Ecology, 76, 366–382.
Jongejans, E., Sheppard, A.W. & Shea, K. (2006) What controlsthe population dynamics of the invasive thistle Carduus
nutans in its native range? Journal of Applied Ecology, 43,877–886.
Kachi, N. (1990) Evolution of size-dependent reproductionin biennial plants: a demographic approach. Ecological
Approaches and Evolutionary Trends in Plants (ed. S.Kawano), pp. 367–385. Academic Press, New York.
Kalisz, S. & McPeek, M.A. (1992) Demography of an age-structured annual: resampled projection matrices, elasticityanalyses and seed bank effects. Ecology, 73, 1082–1093.
Klinkhamer, P.G.L., de Jong, T.J. & van der Meijden, E.(1988) Production, dispersal and predation of seeds in thebiennial Cirsium vulgare. Journal of Ecology, 76, 403–414.
de Kroon, H., van Groenendael, J. & Ehrlén, J. (2000) Elastici-ties: a review of methods and model limitations. Ecology,81, 607–618.
Lennartsson, T. & Oostermeijer, J.G.B. (2001) Demographicvariation and population viability in Gentianella campes-
tris: effects of grassland management and environmentalstochasticity. Journal of Ecology, 89, 451–463.
Liu, H., Menges, E.S. & Quintana-Ascencio, P.F. (2005)Population viability analyses of Chamaecrista keyensis:effects of fire season and frequency. Ecological Applications,15, 210–221.
Löfgren, P., Eriksson, O. & Lehtilä, K. (2000) Populationdynamics and the effect of disturbance in the monocarpicherb Carlina vulgaris (Asteraceae). Annales Botanica
Fennici, 37, 183–192.Maron, J.L. & Gardner, S.N. (2000) Consumer pressure, seed
versus safe-site limitation, and plant population dynamics.Oecologia, 124, 260–269.
van der Meijden, E., Klinkhamer, P.G.L., de Jong, T.J. & vanWijk, C.A.M. (1992) Meta-population dynamics ofbiennial plants: how to exploit temporary habitats. Acta
Botanica Neerlandica, 41, 249–270.Menges, E.S. & Quintana-Ascencio, P.F. (2004) Population
viability with fire in Eryngium cuneifolium: deciphering adecade of demographic data. Ecological Monographs, 74,79–99.
Menges, E.S., Quintana-Ascencio, P.F., Weekley, C.W. &Gaoue, O.G. (2006) Population viability analysis and firereturn intervals for an endemic Florida scrub mint. Biological
Conservation, 127, 115–127.Metcalf, J.C., Rose, K.E. & Rees, M. (2003) Evolutionary
demography of monocarpic perennials. Trends in Ecology
and Evolution, 18, 471–480.Pfister, C.A. (1998) Patterns of variance in stage-structured
populations: evolutionary predictions and ecologicalimplications. Proceedings of the National Academy of Sciences,95, 213–218.
Rees, M. (1997) Seed dormancy. Plant Ecology (ed. M.J.Crawley), pp. 214–238. Blackwell Science, Oxford.
Rydgren, K., de Kroon, H., Økland, R.H. & van Groenen-dael, J. (2001) Effects of fine-scale disturbances on thedemography and population dynamics of the clonalmoss Hylocomium splendens. Journal of Ecology, 89, 395–405.
Rydgren, K., Økland, R.H., Picó, F.X. & de Kroon, H. (2007)Moss species benefits from breakdown of cyclic rodentdynamics in boreal forests. Ecology, in press.
Satterthwaite, W., Menges, E.S. & Quintana-Ascencio, P.F.(2002) Demography and population viability of scrubbuckwheat (Eriogonum longifolium var. gnaphalifolium) inrelation to fire. Ecological Applications, 12, 1672–1687.
Seno, H. & Nakajima, H. (1999) Transition matrix model forpersistence of monocarpic perennial plant populationunder periodically ecological disturbance. Ecological
Modelling, 117, 65–80.Silvertown, J., Franco, M. & Menges, E. (1996) Interpretation
of elasticity matrices as an aid to the management of plantpopulations for conservation. Conservation Biology, 10,591–597.
Silvertown, J., Franco, M., Pisanty, I. & Mendoza, A. (1993)Comparative plant demography – relative importance oflife-cycle components to the finite rate of increase in woodyand herbaceous perennials. Journal of Ecology, 81, 465–476.
Sletvold, N. (2002) Effects of plant size on reproductiveoutput and offspring performance in the facultativebiennial Digitalis purpurea. Journal of Ecology, 90, 958–966.
Sletvold, N. (2005) Density-dependent growth and survival ina natural population of the facultative biennial Digitalis
purpurea. Journal of Ecology, 93, 727–736.Sletvold, N. & Grindeland, J.M. (2007) Fluctuating selection
on reproductive timing in Digitalis purpurea. Oikos, 116,473–481.
Smith, M., Caswell, H. & Mettler-Cherry, P. (2005) Stochasticflood and precipitation regimes and the population dynamicsof a threatened floodplain plant. Ecological Applications,15, 1036–1052.
Takenaka, A., Washitani, I., Kuramuto, N. & Inoue, K.(1996) Life history and demographic features of Aster
kantoensis, an endangered local endemic of floodplains.Biological Conservation, 78, 345–352.
1359Disturbance and
population
dynamics
© 2007 The AuthorsJournal compilation © 2007 British Ecological Society, Journal of Ecology, 95, 1346–1359
Thompson, K. & Grime, J.P. (1979) Seasonal variation in theseed banks of herbaceous species in ten contrasting habitats.Journal of Ecology, 67, 893–921.
Valverde, T. & Silvertown, J. (1998) Variation in the demog-raphy of a woodland understorey herb (Primula vulgaris)along the forest regeneration cycle: projection matrixanalysis. Journal of Ecology, 86, 545–562.
Venable, D.L. (1989) Modeling the evolutionary ecology ofseed banks. Ecology of Soil Seed Banks (eds M.A. Lack,V.T. Parker & R.L. Simpson), pp. 67–87. Academic Press,San Diego, California.
Warr, S.J., Thompson, K. & Kent, M. (1992) Antifungalactivity in seed coat extracts of woodland plants. Oeco-
logia, 92, 296–298.Werner, P.A. & Caswell, H. (1977) Population growth rates
and age versus stage-distribution models for teasel (Dipsacus
sylvestris Huds.). Ecology, 58, 1103–1111.
Received 20 March 2007; accepted 28 June 2007
Handling Editor: Pieter Zuidema
Supplementary material
The following supplementary material is available forthis article.
Appendix S1. Size-structured transition matrices ofDigitalis purpurea.
Table S1. Stochastic growth rate in relation to distur-bance pattern, seed bank survival rate and seed bankrecruitment fraction (138 scenarios).
Table S2. Mean time to extinction of seed bank andadult population in relation to disturbance pattern,seed bank survival rate and seed bank recruitmentfraction (138 scenarios).
This material is available as part of the online articlefrom: http://www.blackwell-synergy.com/doi/abs/10.1111/j.1365-2745.2007.01287.x(This link will take you to the article abstract).
Please note: Blackwell Publishing is not responsible forthe content or functionality of any supplementarymaterials supplied by the authors. Any queries (otherthan missing material) should be directed to thecorresponding author for the article.