Embed Size (px)
Citation preview
POPULATION AND VITAL STATISTICS
REPUBLIC OF MAURITIUS, YEAR 2016
1. Introduction
This issue of Economic and Social Indicators presents population estimates as at December 2016 and
vital statistics including rates for the year 2016.
Statistics Mauritius compiles vital statistics from data obtained from the computerised system in
place at the Central Civil Status Office.
Definitions of terms used are given at Annex.
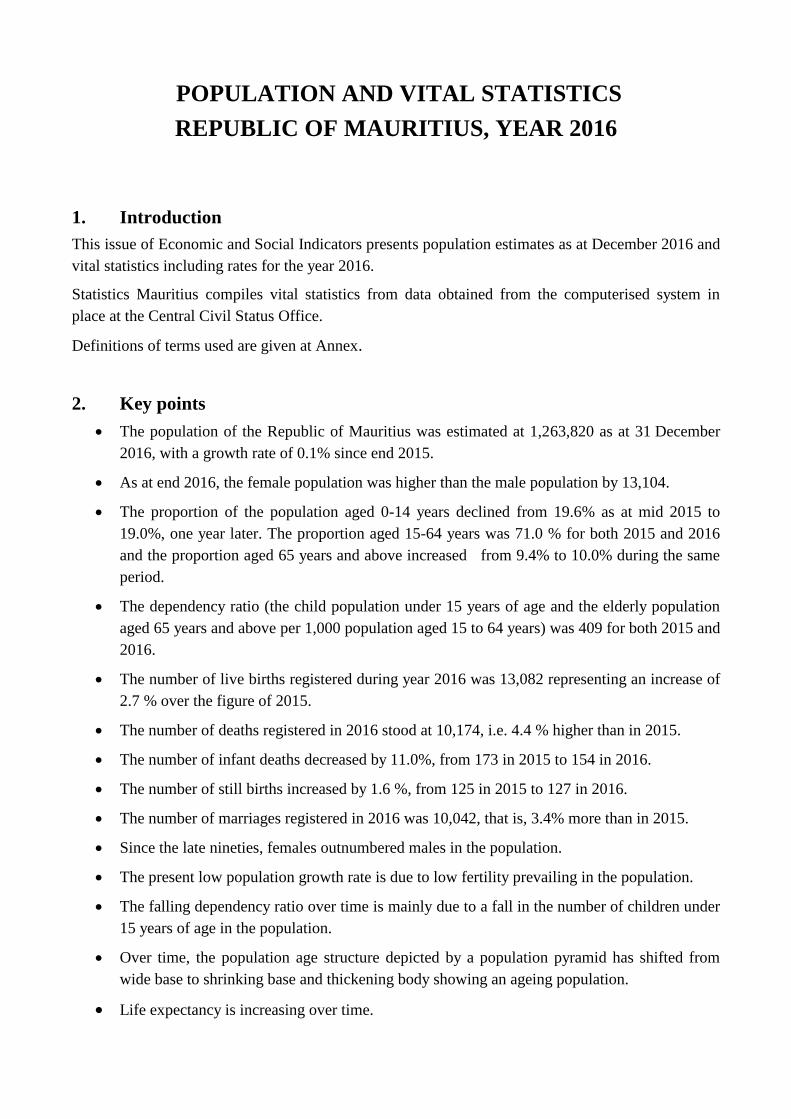
2. Key points
The population of the Republic of Mauritius was estimated at 1,263,820 as at 31 December
2016, with a growth rate of 0.1% since end 2015.
As at end 2016, the female population was higher than the male population by 13,104.
The proportion of the population aged 0-14 years declined from 19.6% as at mid 2015 to
19.0%, one year later. The proportion aged 15-64 years was 71.0 % for both 2015 and 2016
and the proportion aged 65 years and above increased from 9.4% to 10.0% during the same
period.
The dependency ratio (the child population under 15 years of age and the elderly population
aged 65 years and above per 1,000 population aged 15 to 64 years) was 409 for both 2015 and
2016.
The number of live births registered during year 2016 was 13,082 representing an increase of
2.7 % over the figure of 2015.
The number of deaths registered in 2016 stood at 10,174, i.e. 4.4 % higher than in 2015.
The number of infant deaths decreased by 11.0%, from 173 in 2015 to 154 in 2016.
The number of still births increased by 1.6 %, from 125 in 2015 to 127 in 2016.
The number of marriages registered in 2016 was 10,042, that is, 3.4% more than in 2015.
Since the late nineties, females outnumbered males in the population.
The present low population growth rate is due to low fertility prevailing in the population.
The falling dependency ratio over time is mainly due to a fall in the number of children under
15 years of age in the population.
Over time, the population age structure depicted by a population pyramid has shifted from
wide base to shrinking base and thickening body showing an ageing population.
Life expectancy is increasing over time.
2
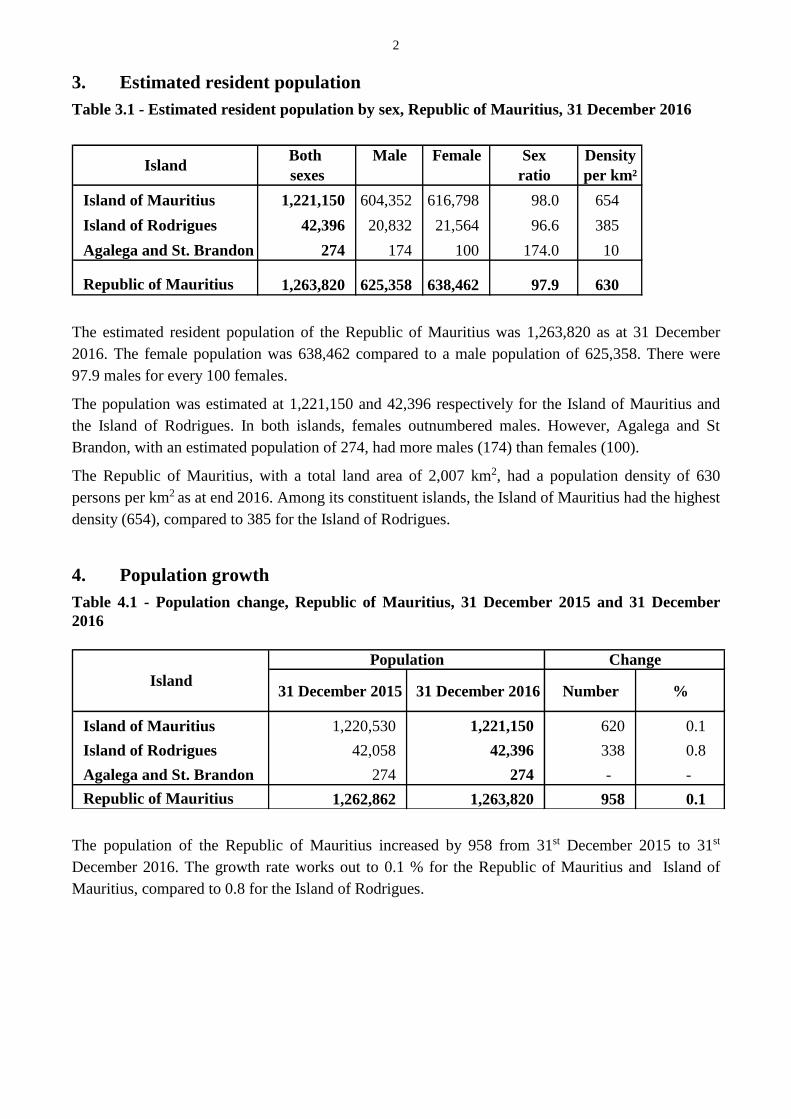
3. Estimated resident population
Table 3.1 - Estimated resident population by sex, Republic of Mauritius, 31 December 2016
Both Male Female Sex Density
sexes ratio per km²
Island of Mauritius 1,221,150 604,352 616,798 98.0 654
Island of Rodrigues 42,396 20,832 21,564 96.6 385
Agalega and St. Brandon 274 174 100 174.0 10
Republic of Mauritius 1,263,820 625,358 638,462 97.9 630
Island
The estimated resident population of the Republic of Mauritius was 1,263,820 as at 31 December
2016. The female population was 638,462 compared to a male population of 625,358. There were
97.9 males for every 100 females.
The population was estimated at 1,221,150 and 42,396 respectively for the Island of Mauritius and
the Island of Rodrigues. In both islands, females outnumbered males. However, Agalega and St
Brandon, with an estimated population of 274, had more males (174) than females (100).
The Republic of Mauritius, with a total land area of 2,007 km2, had a population density of 630
persons per km2 as at end 2016. Among its constituent islands, the Island of Mauritius had the highest
density (654), compared to 385 for the Island of Rodrigues.
4. Population growth
Table 4.1 - Population change, Republic of Mauritius, 31 December 2015 and 31 December
2016
31 December 2015 31 December 2016 Number %
Island of Mauritius 1,220,530 1,221,150 620 0.1
Island of Rodrigues 42,058 42,396 338 0.8
Agalega and St. Brandon 274 274 - -
Republic of Mauritius 1,262,862 1,263,820 958 0.1
Island
Population Change
The population of the Republic of Mauritius increased by 958 from 31st December 2015 to 31st
December 2016. The growth rate works out to 0.1 % for the Republic of Mauritius and Island of
Mauritius, compared to 0.8 for the Island of Rodrigues.
3
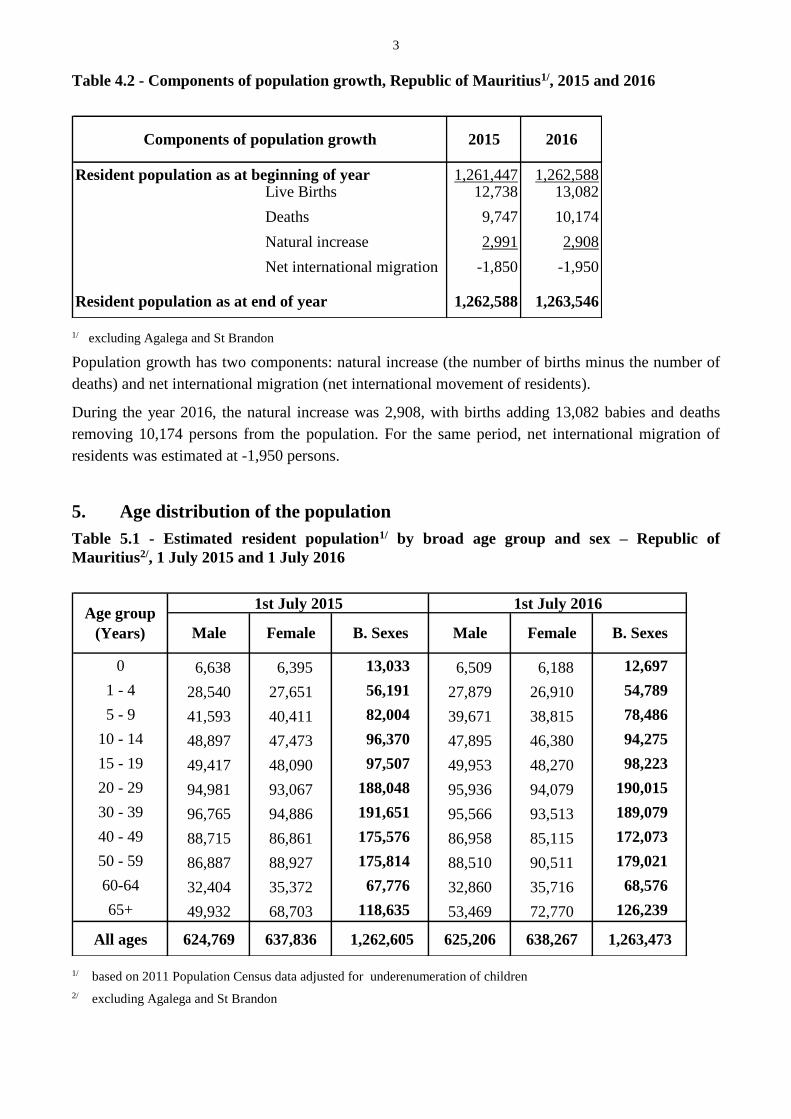
Table 4.2 - Components of population growth, Republic of Mauritius1/, 2015 and 2016
Resident population as at beginning of year 1,261,447 1,262,588Live Births 12,738 13,082
Deaths 9,747 10,174
Natural increase 2,991 2,908
Net international migration -1,850 -1,950
Resident population as at end of year 1,262,588 1,263,546
Components of population growth 2015 2016
1/ excluding Agalega and St Brandon
Population growth has two components: natural increase (the number of births minus the number of
deaths) and net international migration (net international movement of residents).
During the year 2016, the natural increase was 2,908, with births adding 13,082 babies and deaths
removing 10,174 persons from the population. For the same period, net international migration of
residents was estimated at -1,950 persons.
5. Age distribution of the population
Table 5.1 - Estimated resident population1/ by broad age group and sex – Republic of
Mauritius2/, 1 July 2015 and 1 July 2016
1st July 2015 1st July 2016
0 6,638 6,395 13,033 6,509 6,188 12,697
1 - 4 28,540 27,651 56,191 27,879 26,910 54,789
5 - 9 41,593 40,411 82,004 39,671 38,815 78,486
10 - 14 48,897 47,473 96,370 47,895 46,380 94,275
15 - 19 49,417 48,090 97,507 49,953 48,270 98,223
20 - 29 94,981 93,067 188,048 95,936 94,079 190,015
30 - 39 96,765 94,886 191,651 95,566 93,513 189,079
40 - 49 88,715 86,861 175,576 86,958 85,115 172,073
50 - 59 86,887 88,927 175,814 88,510 90,511 179,021
60-64 32,404 35,372 67,776 32,860 35,716 68,576
65+ 49,932 68,703 118,635 53,469 72,770 126,239
All ages 624,769 637,836 1,262,605 625,206 638,267 1,263,473
B. SexesFemale
Age group
(Years) Male Female MaleB. Sexes
1/ based on 2011 Population Census data adjusted for underenumeration of children 2/ excluding Agalega and St Brandon
4
The proportion of the population aged 0-14 years declined from 19.6% as at mid 2015 to 19.0%, one
year later. The proportion aged 15-64 years was 71.0 % for both 2015 and 2016 and the proportion
aged 65 years and above increased from 9.4% to 10.0% during the same period.
6. Vital statistics and rates
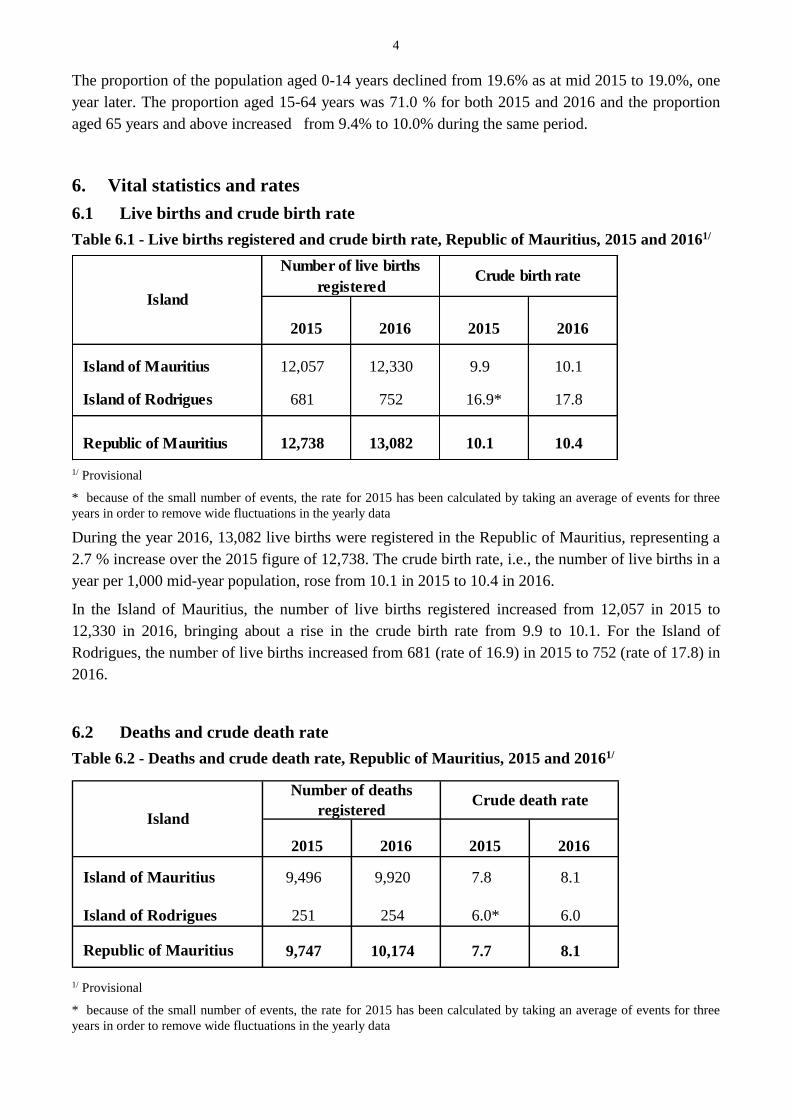
6.1 Live births and crude birth rate
Table 6.1 - Live births registered and crude birth rate, Republic of Mauritius, 2015 and 20161/
2015 2016 2015 2016
Island of Mauritius 12,057 12,330 9.9 10.1
Island of Rodrigues 681 752 16.9* 17.8
Republic of Mauritius 12,738 13,082 10.1 10.4
Number of live births
registeredCrude birth rate
Island
1/ Provisional
* because of the small number of events, the rate for 2015 has been calculated by taking an average of events for three
years in order to remove wide fluctuations in the yearly data
During the year 2016, 13,082 live births were registered in the Republic of Mauritius, representing a
2.7 % increase over the 2015 figure of 12,738. The crude birth rate, i.e., the number of live births in a
year per 1,000 mid-year population, rose from 10.1 in 2015 to 10.4 in 2016.
In the Island of Mauritius, the number of live births registered increased from 12,057 in 2015 to
12,330 in 2016, bringing about a rise in the crude birth rate from 9.9 to 10.1. For the Island of
Rodrigues, the number of live births increased from 681 (rate of 16.9) in 2015 to 752 (rate of 17.8) in
2016.
6.2 Deaths and crude death rate
Table 6.2 - Deaths and crude death rate, Republic of Mauritius, 2015 and 20161/
2015 2016 2015 2016
Island of Mauritius 9,496 9,920 7.8 8.1
Island of Rodrigues 251 254 6.0* 6.0
Republic of Mauritius 9,747 10,174 7.7 8.1
Number of deaths
registeredCrude death rate
Island
1/ Provisional
* because of the small number of events, the rate for 2015 has been calculated by taking an average of events for three
years in order to remove wide fluctuations in the yearly data
5
The number of deaths registered in the Republic of Mauritius in 2016 was 10,174, representing a
4.4% increase over the figure of 9,747 for 2015. The crude death rate, i.e., the number of deaths in a
year per 1,000 mid-year population was 8.1 in 2016 compared to 7.7 in 2015.
The Island of Mauritius registered an increase in the number of deaths, from 9,496 in 2015 (rate of
7.8) to 9,920 in 2016 (rate of 8.1). During the same period, the number of deaths in Rodrigues
increased from 251 to 254, with a rate of 6.0 for both 2015 and 2016.
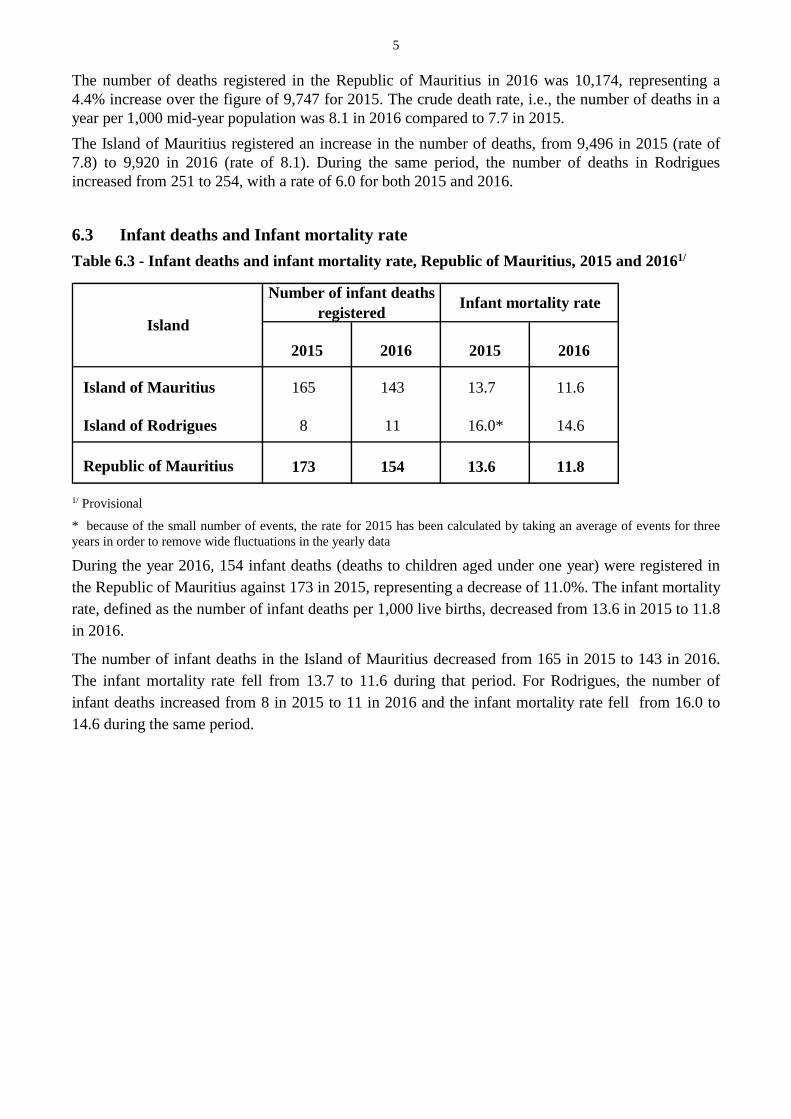
6.3 Infant deaths and Infant mortality rate
Table 6.3 - Infant deaths and infant mortality rate, Republic of Mauritius, 2015 and 20161/
2015 2016 2015 2016
Island of Mauritius 165 143 13.7 11.6
Island of Rodrigues 8 11 16.0* 14.6
Republic of Mauritius 173 154 13.6 11.8
Number of infant deaths
registeredInfant mortality rate
Island
1/ Provisional
* because of the small number of events, the rate for 2015 has been calculated by taking an average of events for three
years in order to remove wide fluctuations in the yearly data
During the year 2016, 154 infant deaths (deaths to children aged under one year) were registered in
the Republic of Mauritius against 173 in 2015, representing a decrease of 11.0%. The infant mortality
rate, defined as the number of infant deaths per 1,000 live births, decreased from 13.6 in 2015 to 11.8
in 2016.
The number of infant deaths in the Island of Mauritius decreased from 165 in 2015 to 143 in 2016.
The infant mortality rate fell from 13.7 to 11.6 during that period. For Rodrigues, the number of
infant deaths increased from 8 in 2015 to 11 in 2016 and the infant mortality rate fell from 16.0 to
14.6 during the same period.
6
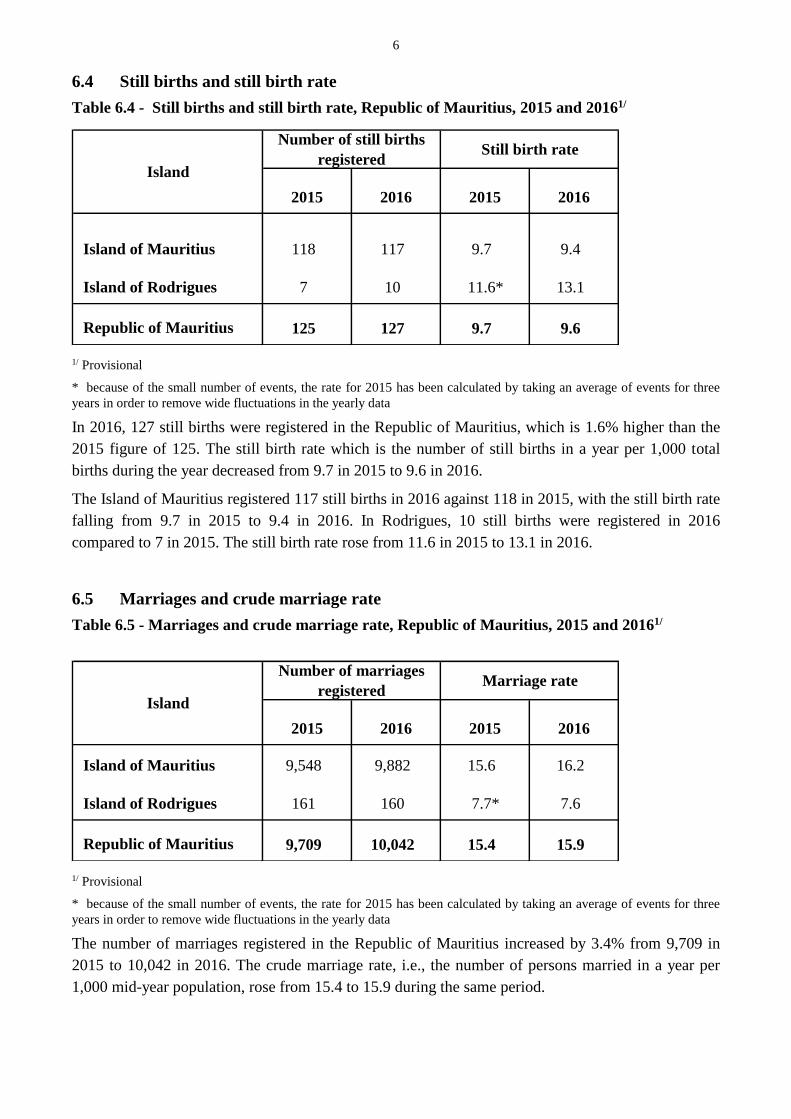
6.4 Still births and still birth rate
Table 6.4 - Still births and still birth rate, Republic of Mauritius, 2015 and 20161/
2015 2016 2015 2016
Island of Mauritius 118 117 9.7 9.4
Island of Rodrigues 7 10 11.6* 13.1
Republic of Mauritius 125 127 9.7 9.6
Number of still births
registeredStill birth rate
Island
1/ Provisional
* because of the small number of events, the rate for 2015 has been calculated by taking an average of events for three
years in order to remove wide fluctuations in the yearly data
In 2016, 127 still births were registered in the Republic of Mauritius, which is 1.6% higher than the
2015 figure of 125. The still birth rate which is the number of still births in a year per 1,000 total
births during the year decreased from 9.7 in 2015 to 9.6 in 2016.
The Island of Mauritius registered 117 still births in 2016 against 118 in 2015, with the still birth rate
falling from 9.7 in 2015 to 9.4 in 2016. In Rodrigues, 10 still births were registered in 2016
compared to 7 in 2015. The still birth rate rose from 11.6 in 2015 to 13.1 in 2016.
6.5 Marriages and crude marriage rate
Table 6.5 - Marriages and crude marriage rate, Republic of Mauritius, 2015 and 20161/
2015 2016 2015 2016
Island of Mauritius 9,548 9,882 15.6 16.2
Island of Rodrigues 161 160 7.7* 7.6
Republic of Mauritius 9,709 10,042 15.4 15.9
Number of marriages
registeredMarriage rate
Island
1/ Provisional
* because of the small number of events, the rate for 2015 has been calculated by taking an average of events for three
years in order to remove wide fluctuations in the yearly data
The number of marriages registered in the Republic of Mauritius increased by 3.4% from 9,709 in
2015 to 10,042 in 2016. The crude marriage rate, i.e., the number of persons married in a year per
1,000 mid-year population, rose from 15.4 to 15.9 during the same period.
7
The number of marriages in the Island of Mauritius rose from 9,548 in 2015 (rate of 15.6) to 9,882 in
2016 (rate of 16.2). The Island of Rodrigues registered a decrease in the number of marriages from
161 in 2015 (rate of 7.7) to 160 in 2016 (rate of 7.6).
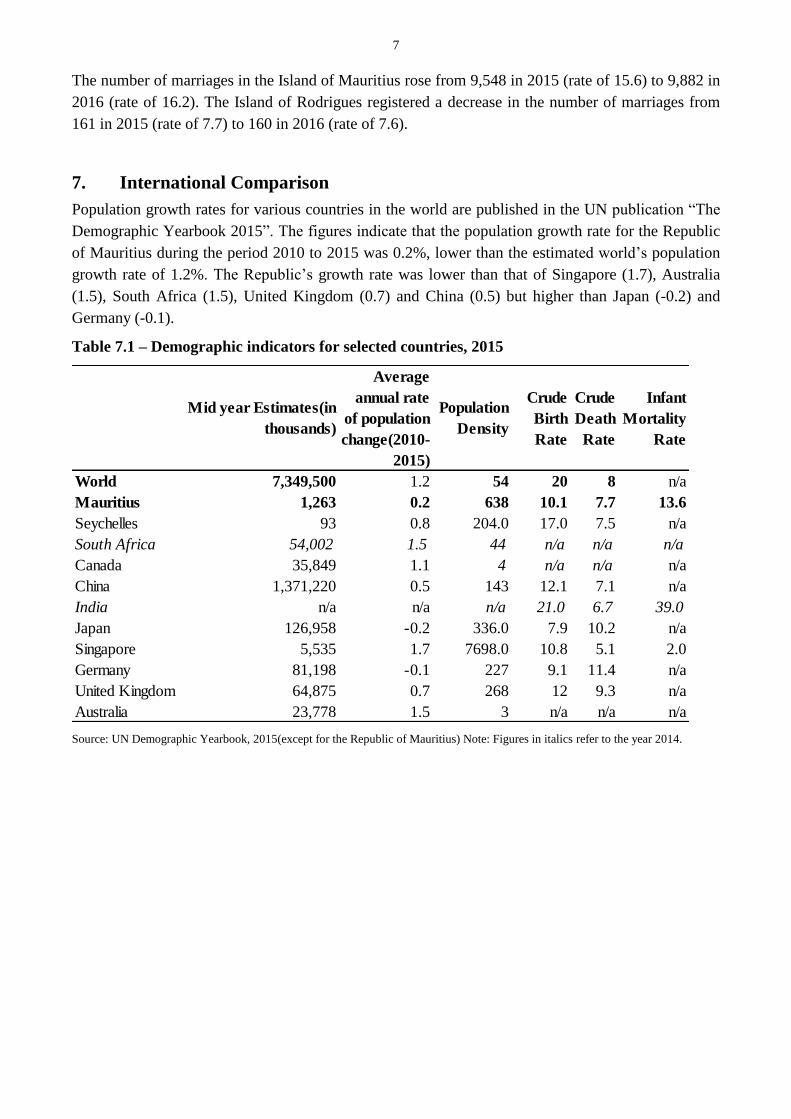
7. International Comparison
Population growth rates for various countries in the world are published in the UN publication “The
Demographic Yearbook 2015”. The figures indicate that the population growth rate for the Republic
of Mauritius during the period 2010 to 2015 was 0.2%, lower than the estimated world’s population
growth rate of 1.2%. The Republic’s growth rate was lower than that of Singapore (1.7), Australia
(1.5), South Africa (1.5), United Kingdom (0.7) and China (0.5) but higher than Japan (-0.2) and
Germany (-0.1).
Table 7.1 – Demographic indicators for selected countries, 2015
Mid year Estimates(in
thousands)
Average
annual rate
of population
change(2010-
2015)
Population
Density
Crude
Birth
Rate
Crude
Death
Rate
Infant
Mortality
Rate
World 7,349,500 1.2 54 20 8 n/a
Mauritius 1,263 0.2 638 10.1 7.7 13.6
Seychelles 93 0.8 204.0 17.0 7.5 n/a
South Africa 54,002 1.5 44 n/a n/a n/a
Canada 35,849 1.1 4 n/a n/a n/a
China 1,371,220 0.5 143 12.1 7.1 n/a
India n/a n/a n/a 21.0 6.7 39.0
Japan 126,958 -0.2 336.0 7.9 10.2 n/a
Singapore 5,535 1.7 7698.0 10.8 5.1 2.0
Germany 81,198 -0.1 227 9.1 11.4 n/a
United Kingdom 64,875 0.7 268 12 9.3 n/a
Australia 23,778 1.5 3 n/a n/a n/a
Source: UN Demographic Yearbook, 2015(except for the Republic of Mauritius) Note: Figures in italics refer to the year 2014.
8
8. Demographic trends
8.1 Sex ratio
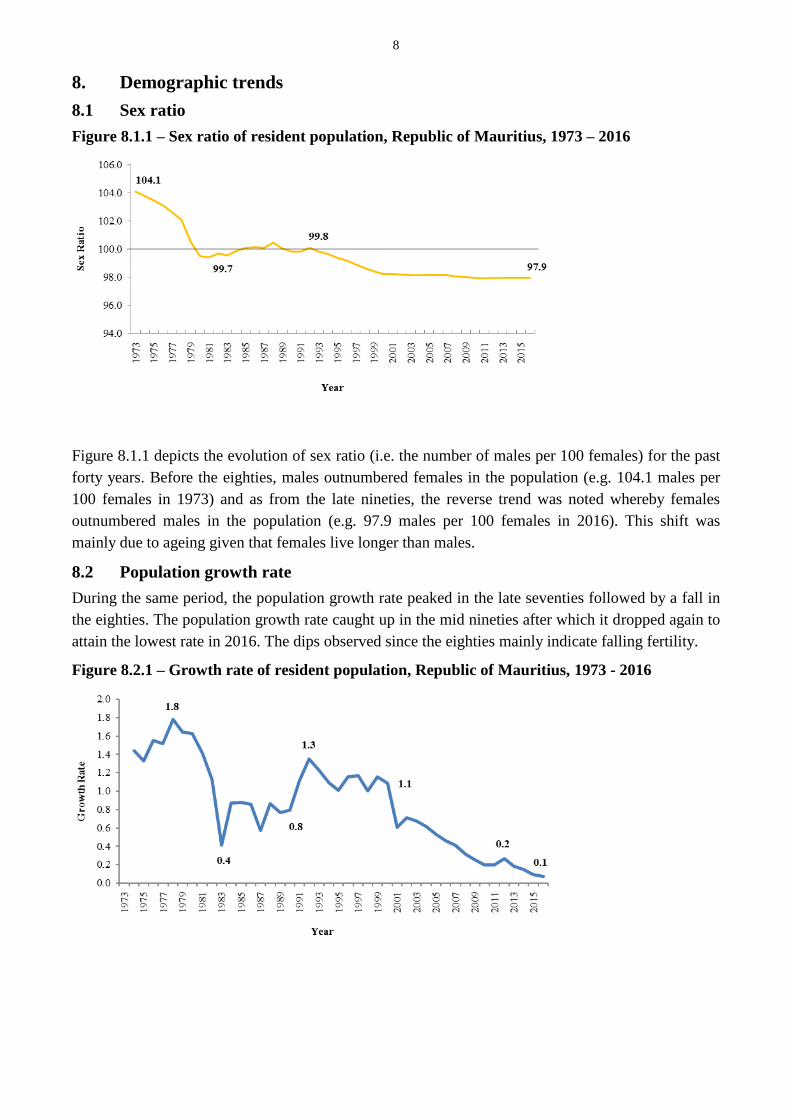
Figure 8.1.1 – Sex ratio of resident population, Republic of Mauritius, 1973 – 2016
Figure 8.1.1 depicts the evolution of sex ratio (i.e. the number of males per 100 females) for the past
forty years. Before the eighties, males outnumbered females in the population (e.g. 104.1 males per
100 females in 1973) and as from the late nineties, the reverse trend was noted whereby females
outnumbered males in the population (e.g. 97.9 males per 100 females in 2016). This shift was
mainly due to ageing given that females live longer than males.
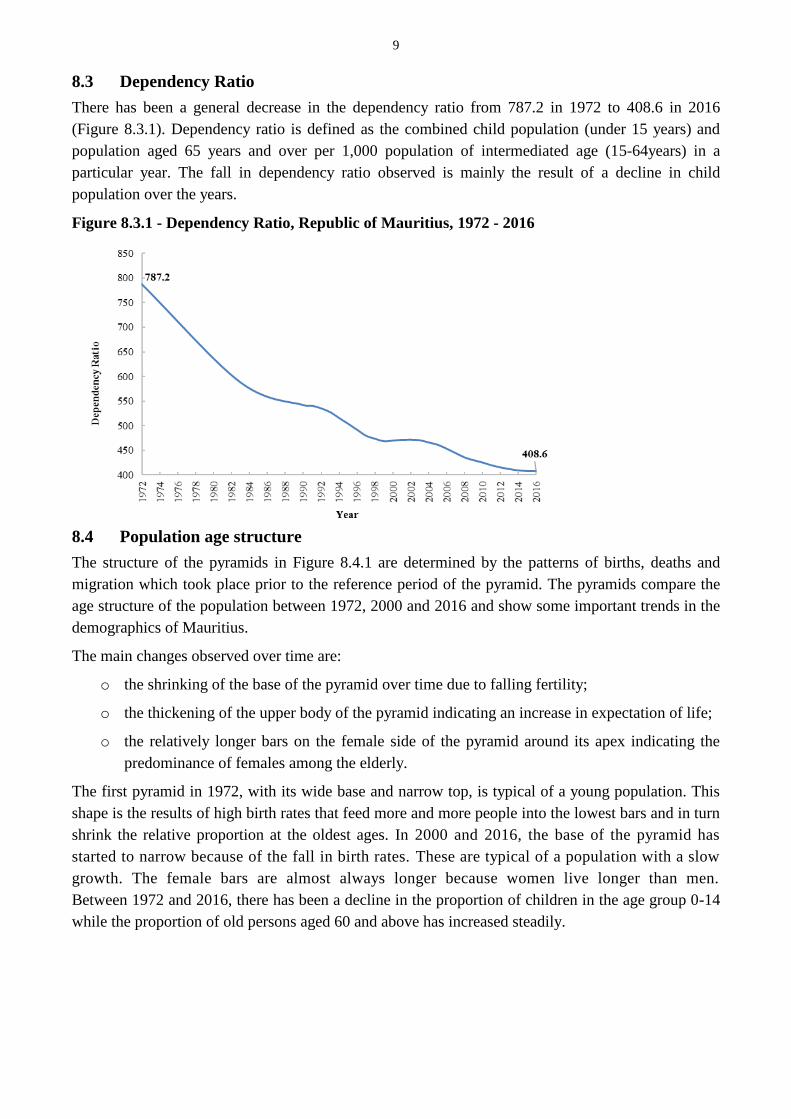
8.2 Population growth rate
During the same period, the population growth rate peaked in the late seventies followed by a fall in
the eighties. The population growth rate caught up in the mid nineties after which it dropped again to
attain the lowest rate in 2016. The dips observed since the eighties mainly indicate falling fertility.
Figure 8.2.1 – Growth rate of resident population, Republic of Mauritius, 1973 - 2016
9
8.3 Dependency Ratio
There has been a general decrease in the dependency ratio from 787.2 in 1972 to 408.6 in 2016
(Figure 8.3.1). Dependency ratio is defined as the combined child population (under 15 years) and
population aged 65 years and over per 1,000 population of intermediated age (15-64years) in a
particular year. The fall in dependency ratio observed is mainly the result of a decline in child
population over the years.
Figure 8.3.1 - Dependency Ratio, Republic of Mauritius, 1972 - 2016
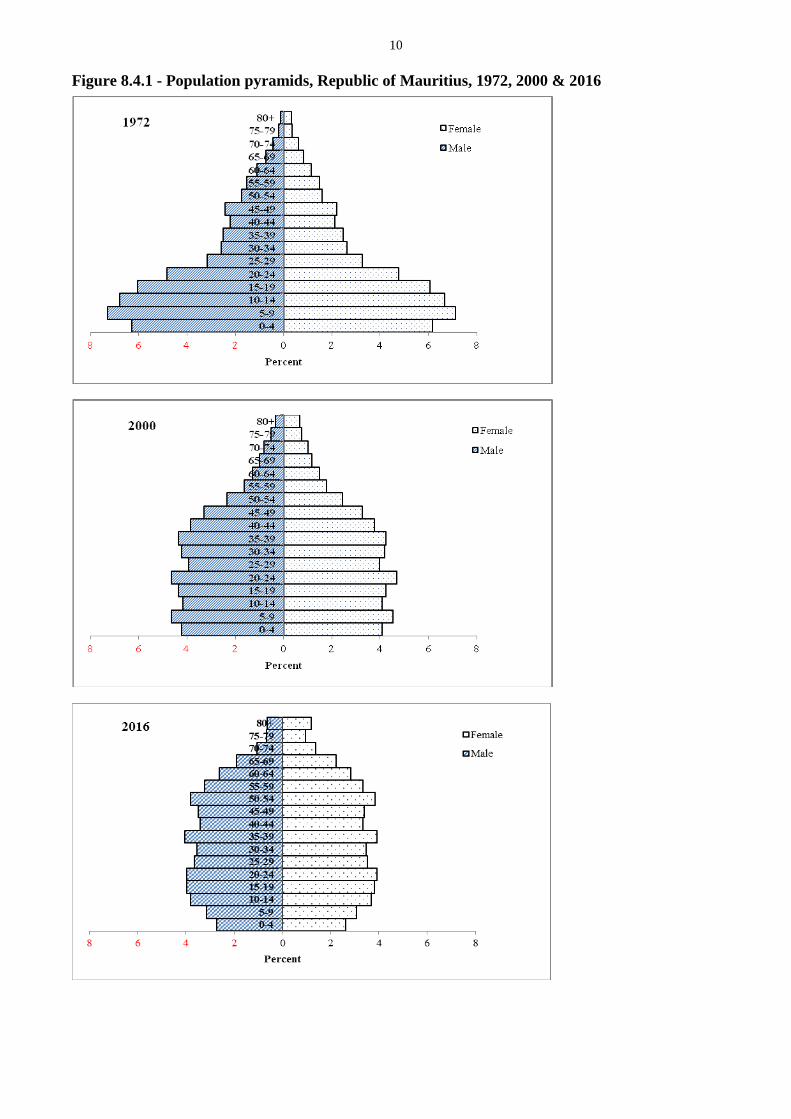
8.4 Population age structure
The structure of the pyramids in Figure 8.4.1 are determined by the patterns of births, deaths and
migration which took place prior to the reference period of the pyramid. The pyramids compare the
age structure of the population between 1972, 2000 and 2016 and show some important trends in the
demographics of Mauritius.
The main changes observed over time are:
o the shrinking of the base of the pyramid over time due to falling fertility;
o the thickening of the upper body of the pyramid indicating an increase in expectation of life;
o the relatively longer bars on the female side of the pyramid around its apex indicating the
predominance of females among the elderly.
The first pyramid in 1972, with its wide base and narrow top, is typical of a young population. This
shape is the results of high birth rates that feed more and more people into the lowest bars and in turn
shrink the relative proportion at the oldest ages. In 2000 and 2016, the base of the pyramid has
started to narrow because of the fall in birth rates. These are typical of a population with a slow
growth. The female bars are almost always longer because women live longer than men.
Between 1972 and 2016, there has been a decline in the proportion of children in the age group 0-14
while the proportion of old persons aged 60 and above has increased steadily.
10
Figure 8.4.1 - Population pyramids, Republic of Mauritius, 1972, 2000 & 2016
11
9. How has life expectancy changed over time?
Life expectancy at birth is defined as the average number of years that a newborn could expect to live
if he/she were to pass through life subject to the age specific mortality rates of a given period. For
example, a girl born in 2014 is expected to reach age 78, however a woman who was 60 years old
already in 2014 was expected to live a further 22 years, that is until she is 82. Life expectancy at birth
is a summary indicator of mortality conditions and, by proxy, of health conditions. It summarizes
mortality risks and trends across all age groups, including older people. Measurement of life
expectancy at birth also allows for reporting of life expectancy at other ages to track health
improvements for specific age groups in populations.
Calculation of life expectancy at birth is based on age-specific death rates for a particular calendar
period and is presented in the form of a life table. The death rates are commonly tabulated for ages
below 0 years, 1 to 4 years, and for 5-year age groups for ages 5 and above. Life expectancy may be
calculated separately for males and females, or for both sexes combined, and can also be presented
for particular ages after birth. These rates are derived directly from registered deaths and population
counts.
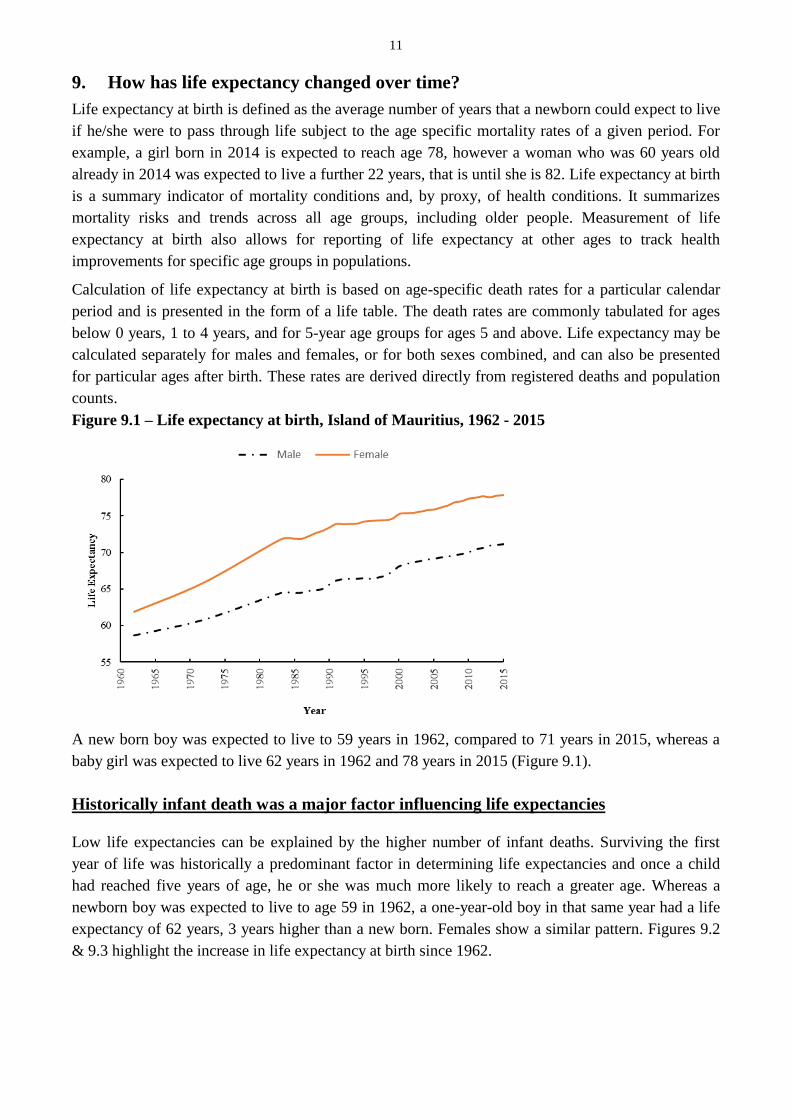
Figure 9.1 – Life expectancy at birth, Island of Mauritius, 1962 - 2015
A new born boy was expected to live to 59 years in 1962, compared to 71 years in 2015, whereas a
baby girl was expected to live 62 years in 1962 and 78 years in 2015 (Figure 9.1).
Historically infant death was a major factor influencing life expectancies
Low life expectancies can be explained by the higher number of infant deaths. Surviving the first
year of life was historically a predominant factor in determining life expectancies and once a child
had reached five years of age, he or she was much more likely to reach a greater age. Whereas a
newborn boy was expected to live to age 59 in 1962, a one-year-old boy in that same year had a life
expectancy of 62 years, 3 years higher than a new born. Females show a similar pattern. Figures 9.2
& 9.3 highlight the increase in life expectancy at birth since 1962.
12
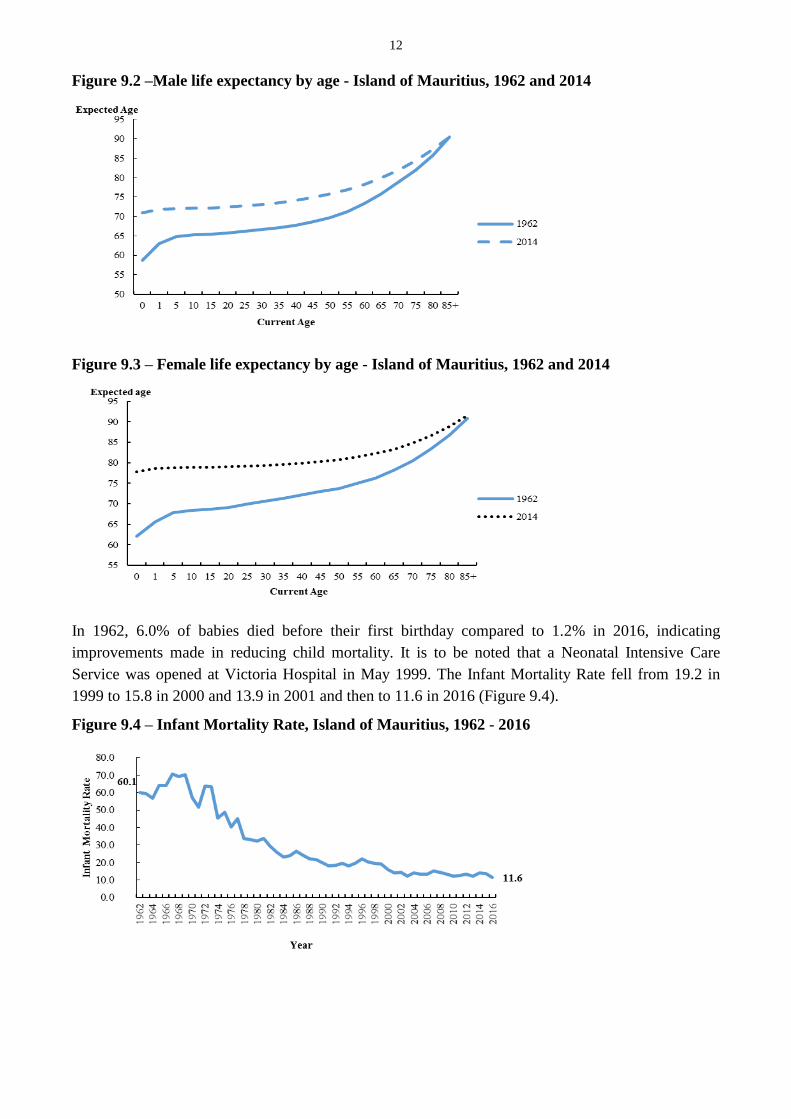
Figure 9.2 –Male life expectancy by age - Island of Mauritius, 1962 and 2014
Figure 9.3 – Female life expectancy by age - Island of Mauritius, 1962 and 2014
In 1962, 6.0% of babies died before their first birthday compared to 1.2% in 2016, indicating
improvements made in reducing child mortality. It is to be noted that a Neonatal Intensive Care
Service was opened at Victoria Hospital in May 1999. The Infant Mortality Rate fell from 19.2 in
1999 to 15.8 in 2000 and 13.9 in 2001 and then to 11.6 in 2016 (Figure 9.4).
Figure 9.4 – Infant Mortality Rate, Island of Mauritius, 1962 - 2016
13
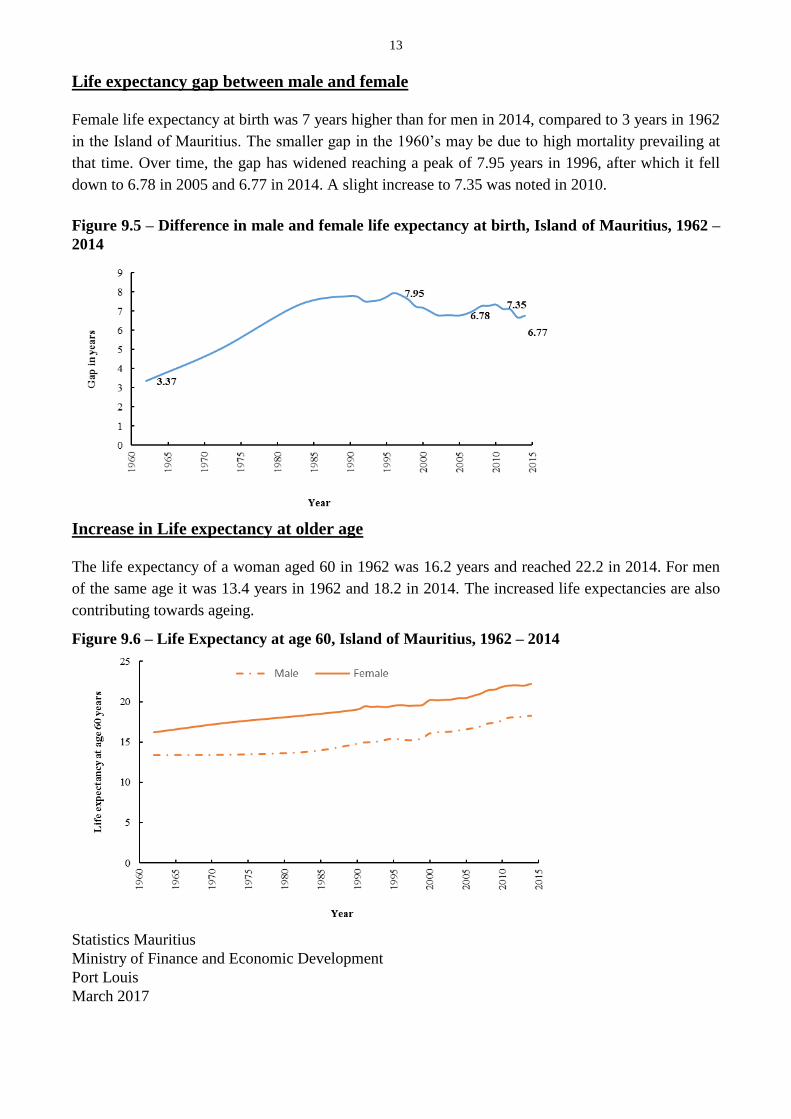
Life expectancy gap between male and female
Female life expectancy at birth was 7 years higher than for men in 2014, compared to 3 years in 1962
in the Island of Mauritius. The smaller gap in the 1960’s may be due to high mortality prevailing at
that time. Over time, the gap has widened reaching a peak of 7.95 years in 1996, after which it fell
down to 6.78 in 2005 and 6.77 in 2014. A slight increase to 7.35 was noted in 2010.
Figure 9.5 – Difference in male and female life expectancy at birth, Island of Mauritius, 1962 –
2014
Increase in Life expectancy at older age
The life expectancy of a woman aged 60 in 1962 was 16.2 years and reached 22.2 in 2014. For men
of the same age it was 13.4 years in 1962 and 18.2 in 2014. The increased life expectancies are also
contributing towards ageing.
Figure 9.6 – Life Expectancy at age 60, Island of Mauritius, 1962 – 2014
Statistics Mauritius
Ministry of Finance and Economic Development
Port Louis
March 2017

14
Annex
Contact person:
Mr C. K. Arianaick, Senior Statistician
Mrs. C. Martial, Statistician
Mrs. R. Boolakey, Senior Statistical Officer
Demography Unit
Statistics Mauritius
LIC Centre
John Kennedy Street
Port Louis
Tel: 208 0859
Email: [email protected]
15
Annex
1. Vital Statistics: The statistics pertaining to vital events which include
live births, deaths, still births, marriages and divorces
2. Population density: The number of persons per square kilometre
3. Dependency ratio: The child population under 15 years of age and the elderly
population aged 65 years and above per 1,000 population aged
15 to 64 years.
4. Child Dependency ratio The child population under 15 years of age per 1,000
population aged 15 to 64 years.
5. Old age Dependency ratio The elderly population aged 65 years and above per 1,000
population aged 15 to 64 years.
6. Median age The age which divides the population into two equal size
groups, one of which is younger and the other older than the
median.
7. Sex ratio: The number of males to every 100 females.
8. Natural increase: The excess of live births over deaths.
9. Crude birth rate: The number of live births in a year per 1,000 mid-year
population.
10. Crude death rate: The number of deaths in a year per 1,000 mid-year population.
11. Infant mortality rate: The number of deaths in a year of infants aged under one year
per 1,000 live births during the year.
12. Still birth rate: The number of still births in a year per 1,000 total births (live
births and still births) during the year.
13. Marriage rate: The number of persons married in a year per 1,000 mid-year
population.
Note: The vital rates for Rodrigues are usually calculated as an average for three years in order to
remove wide fluctuations in the yearly data. The rates for year 2016 are however calculated on the
basis of data for the year only.