Embed Size (px)
Citation preview

A publication of the Health Statistics Unit, Ministry of Health & Quality of Life
Website: http://health.gov.mu
Republic of Mauritius

FORWORD
The Health Statistics Unit of the Ministry of Health and Quality of Life has been publishing, since 1975, an annual report on health statistics pertaining to the Island of Mauritius and since 1988, one pertaining to the Island of Rodrigues.
2. This report contains information on population and vital statistics, infrastructure and personnel, morbidity, mortality and the activities of almost all health services pertaining to the Island of Mauritius and to the Island of Rodrigues. A few data relates to the Republic of Mauritius.
3. An Executive Summary, new tables, charts and further analysis have been added to this edition. They include trend data on mortality due to main Non-Communicable Diseases, causes of maternal death, incidence rate of certain communicable diseases and non-traumatic amputations. For the first time, data on risk factors, namely on cigarettes and alcoholic products, have been documented.
4. Health Statistics included in this report is based on data available as at the end of May 2013. Consequently, a few figures may be
subject to amendment. Similarly, figures appearing in previous reports may also be revised in light of additional data obtained afterward.
5. Based on information obtained from other sources or otherwise, a few data pertaining to certain health services, including in the private sector, have been adjusted for under or over reporting, mainly for trend analysis. 6. The data relating to population, including those required to compile most vital statistics, the main source of which is the Civil Status Office, have been obtained from Statistics Mauritius. Other data have been either collected directly by the Health Statistics Unit, or obtained mostly from the Health Records Division and other Sections/Units/Divisions of the Ministry of Health & Quality of Life and the Commission for Health in Rodrigues.
7. The valuable assistance from the various sectors and the spirit of team work among the staff of Health Statistics Unit are gratefully acknowledged.

N. JeeanodyJune, 2013 Chief Health Statistician

TABLE OF CONTENTS
Executive SummaryPart I : Island/Republic of Mauritius
SELECTED HEALTH VARIABLES AND INDICATORS i
HEALTH SITUATION ANALYSIS 1-18
TIME SERIES AND CHART ON:Selected indicators pertaining to the Republic of Mauritius 19 * - Crude Birth Rate 1990-2012 20 * - Crude Death Rate 1990-2012 21 * - Stillbirth Rate 1990-2012 22 * - Infant Mortality Rate 1990-2012 23 * - Under 5 Mortality Rate 1990-2012 24 * - Maternal Mortality Ratio 1990-2012 25 * - Low Birth Weight 1990-2012 26 *Complications following abortions ( including spontaneous ) 27Admissions due to Selected diseases 28First attendances at Primary Health Care Centres for Selected diseases 29Incidence rates of certain communicable diseases 30 *Mortality due to main Non-Communicable diseases 30Deaths by month of registration 31
POPULATION AND VITAL STATISTICS Population and vital statistics (numbers) 1984 - 2012 32Population and vital statistics (rates) 1984 - 2012 33Stillbirths and infant deaths (numbers and rates) 1984 - 2012 34Population growth rates and ageing population 35 *Population and vital statistics by district (numbers) - 2012 36 *Population and vital statistics by district (rates) - 2012 36 *Life expectancy (Republic of Mauritius) 1990 - 2012 36 *Population of towns and large villages as at mid-year 2012 37Fertility rates 2008 - 2012 37Life expectancy (Island of Mauritius) 2006 - 2012 37Population by age-group and sex as at mid-year 2012 38
INFRASTRUCTURE AND PERSONNELHealth services as at 31.12.2012 39Bed situation as at 31.12.2012 39Health manpower 2002- 2012 40 *Health manpower (additional data) 2012 41
MATERNAL AND CHILD HEALTHMaternal and child health activities 2012 42 *Expanded Programme on Immunization 2012 42 *Maternal and child health activities by district - 43

2012Maternal and child health activities by district (additional data) - 2012 44Activities of the Expanded Programme on Immunization by district - 2012 44Indicators related to antenatal care 45* Page relates to data pertaining either to the Republic of Mauritius or to the Island of Mauritius and Island of Rodrigues separately.
IMMUNIZATIONSImmunizations reported 2008 - 2012 46Immunizations coverage rates - 2012 47 *Immunizations coverage rates 1994-2012 48 *Immunizations reported by population covered - 2012 49OTHER ACTIVITIES Work performed in hospitals - 2012 50Haemodialysis, CT-Scan and MRI in Regional Hospitals - 2012 51Non-traumatic amputations 51Deliveries performed in general hospitals 2000 - 2012 52Livebirths registered among teenagers 52Activity of the X-Ray Department - 2012 53Out-patient attendances at Specialist Clinics - 2012 53Out-patient attendances at certain ancilliary services 2010-2012 53Attendances at Primary Health Care Centres - 2012 54Summary on pre-primary and primary school health service by district - 2012 55 *Primary school health statistics by standard - 2012 56 *NCD mobile Screening Service 57Cash gift coupons distributed 57 *Noise monitoring 57Screening of primary and pre-primary school children - 2012 58Dental health service activities (Preventive service) 2009 - 2012 58Dental health service activities (Curative service) 2008 - 2012 59Pathological tests by category - 2012 60 *Pathological tests (positivity rates) - 2010 - 2012 61 *Basic Sanitation and Food Hygiene Statistics 2008 - 2012 62Statistics on Cigarettes and alcoholic products 62 *Activities of the Community Based Rehabilitation Programme 2008-2012 63NOTIFIABLE DISEASESNotifiable diseases reported 1993 - 2012 64 *Notifiable diseases reported by month - 2012 65Notifiable diseases reported by district - 2012 66Certain notifiable diseases reported by age-group and sex - 2012 67Selected Laboratory confirmed cases of communicable diseases 2003-2012 68Acute Flaccid Paralysis (AFP) surveillance 2005-2012 68 *Diseases Surveillance at hospital level - 2012 68New cases of specific diseases attending Area & Community Health Centre 2012 68HIV/AIDS statistics by sex 1987 - 2012 69 *HIV tests carried out 2010 - 2012 69 *PRIVATE HEALTH INSTITUTIONS
Selected statistics 2000- 2012 70Admissions and other attendances by quarter - 2012 70Deliveries - 2012 70Admissions and other attendances by cause and sex - 2012 71Surgical operations and procedures - 2012 72* Page relates to data pertaining either to the Republic of Mauritius or to the Island of Mauritius and Island of Rodrigues separately.
MORBIDITYHospital discharges by cause and sex - 2012 73Hospital discharges by ICD chapter and sex - 2012 74Hospital discharges by ICD chapter, age-group and sex - 2012 75Hospital discharges of children under one year-2012 76Hospital discharges due to neoplasm by type and sex - 2012 77Hospital discharges due to diseases of the circulatory system by age group and sex -2012 78Hospital discharges due to injury & poisoning and sex - 2012 79First Attendances at AHC and CHC by cause and sex - 2012 80First Attendances at AHC and CHC by ICD chapter and sex - 2012 81S. Bharati (eye) Hospital, discharges by cause and sex - 2012 82Poudre D'or (chest) Hospital, discharges by cause and sex - 2012 83Chest diseases, new cases at out-patient specialist clinics by sex - 2012 83Brown Sequard Hospital discharges by cause and sex - 2012 84Dermatology, new cases at out-patient specialist clinics by quarter - 2012 85E.N.T. , new cases seen by specialists at OPD clinics by quarter - 2012 86E.N.T. Centre,cases treated as in-patients - 2012 87E.N.T. Centre,Operations on in-patients - 2012 87Cardiac Centre,cases treated on in-patients - 2012 88New cases of sexually transmitted diseases treated by age and sex - 2012 89National Day Care Centres for the Immuno-suppressed, attendances by sex - 2012 89Occupational health clinics, new cases seen by sex 2012 90Home Nursing Care Services 90Attendances at Ayurvedic Clinics - 2012 91Common cases of cancer 92 *
INFANT AND CHILD MORTALITYDischarges from Neonatal Intensive Care Unit by sex - 2012 93Infant deaths by age and sex - 2012 94Breakdown of infant deaths - 2012 95Infant deaths by cause and sex - 2012 96Deaths among children aged 0-4 years by cause and sex - 2012 96
MORTALITY (ALL AGES)Deaths by ICD chapter and sex - 2012 97Deaths by ICD chapter and age-group - 2012 98Deaths by principal cause and sex - 2012 99
Deaths by principal cause, sex and age-group - 2012100
Chapter-specific death rates - 2012
101 *
Age-specific death rates by sex - 2012102
Deaths due to diseases of the circulatory system by age-group and sex - 2012103
Deaths due to neoplasms by type and sex - 2012 104
Deaths due to injury and poisoning by external cause, age group and sex - 2012 10
5
* Page relates to data pertaining either to Republic of Mauritius or to the Island of Mauritius and Island of Rodrigues separately
Part II : Island of Rodrigues
SELECTED HEALTH VARIABLES AND INDICATORS 107
HEALTH SITUATION ANALYSIS 109
POPULATION AND VITAL STATISTICSPopulation and Vital Statistics (Numbers) 1990 - 2012 114Population and Vital Statistics (Rates) 1990- 2012 115Stillbirths and Infant Deaths (Numbers and Rates) 1990 - 2012 116Fertility Rates 2003 - 2012 117Life Expectancy at Birth - Periods 2003 - 2012 117Population by Age and Sex as at mid-year 2012 118
HEALTH PERSONNELSelected Health Manpower Statistics as at end-of-year 2010- 2012 119
SERVICE STATISTICSSummary of work performed in hospital/Health Centres-2012 120Work performed in Maternity Sections-2012 120Out-patient attendances at hospital/Health Centre - 2012 121Out-patient attendances at Community Health Centres by quarter - 2012 121Activities of the Physiotherapy Department of Queen Elizabeth Hospital - 2012 122Activities of the Radiological Department of Queen Elizabeth Hospital - 2012 122Activities at the Haemodialysis Unit - 2012 122Maternal & Child Health Activities - 2012 123Expanded Programme of Immunisation 124Basic Sanitation and Food hygiene 124Activities of the Dental Health Service 2008 - 2012 125
MORBIDITYDistribution of Notifiable Diseases 1992 - 2012 126Principal Causes of Hospital and Health Centres Discharges by Sex - 2012 127Hospital and Health Centres Discharges by I.C.D. Chapter & Sex - 2012 128Principal Causes of First Attendances at C.H.C by Sex - 2012 129First Attendances at Community Health Centres by I.C.D. Chapter & Sex- 2012 130
INFANT AND CHILD MORTALITYCauses of Infant Deaths - 2012 131Causes of Child Deaths - 2012 132Infant Deaths by Sex and Age - 2012 132

MORTALITY (ALL AGES)Principal Causes of Death by Sex - 2012 133Deaths by I.C.D. Chapter and Sex - 2012 134Deaths by Age-group and Sex - 2012 135
GLOSSARY 136
Health Statistics Report 2012
Executive Summary
Every year, the Ministry of Health and Quality of Life publishes a report on health statistics. The Report contains information on population and vital statistics, infrastructure and personnel, morbidity (illness), mortality (cause of death), and the activities of almost all health services pertaining to the Island of Mauritius and to the Island of Rodrigues. The salient features of the 2012 Report are as follows:
ISLAND OF MAURITIUS
the Infant Mortality Rate, which was 15.3 per 1,000 live births in 2007,decreased to 12.4 in 2010. The figure slightly increased from 12.6 in 2011 to 13.4 in 2012;
in 2012, nine maternal deaths were registered for a Maternal Mortality Ratio of 0.65 per 1,000 live births compared to 0.36 in 2011. This ratio has followed an erratic trend since 2008 when it was 0.38;
in the period 2000 to 2012, life expectancy at birth increased by 2.8 years for men (from 67.4 to 70.2 years) and by 2.7 years for women (from 74.6 to 77.3years);
the number of Doctors working in the Ministry of Health and Quality of Life increased from 777 at the end of 2005 to 1000 in 2012;
at the end of 2012, 3,051 qualified Nurses and Midwives were in post in the public sector compared to 2,732 in 2005;
in 2012, the daily available beds in Government Hospitals was 3,512 with an average occupancy rate of 75.0%;

the number of in-patients in Government Hospitals in 2012 was 204,736 compared to 205,156 in 2011 and the number of operations performed on them was 40,451 and 40,699 respectively;
in 2012, a total of 10,764 births occurred in Government Hospitals, that is, 77.5% of all births registered in the island compared to 84.0% in 2005;
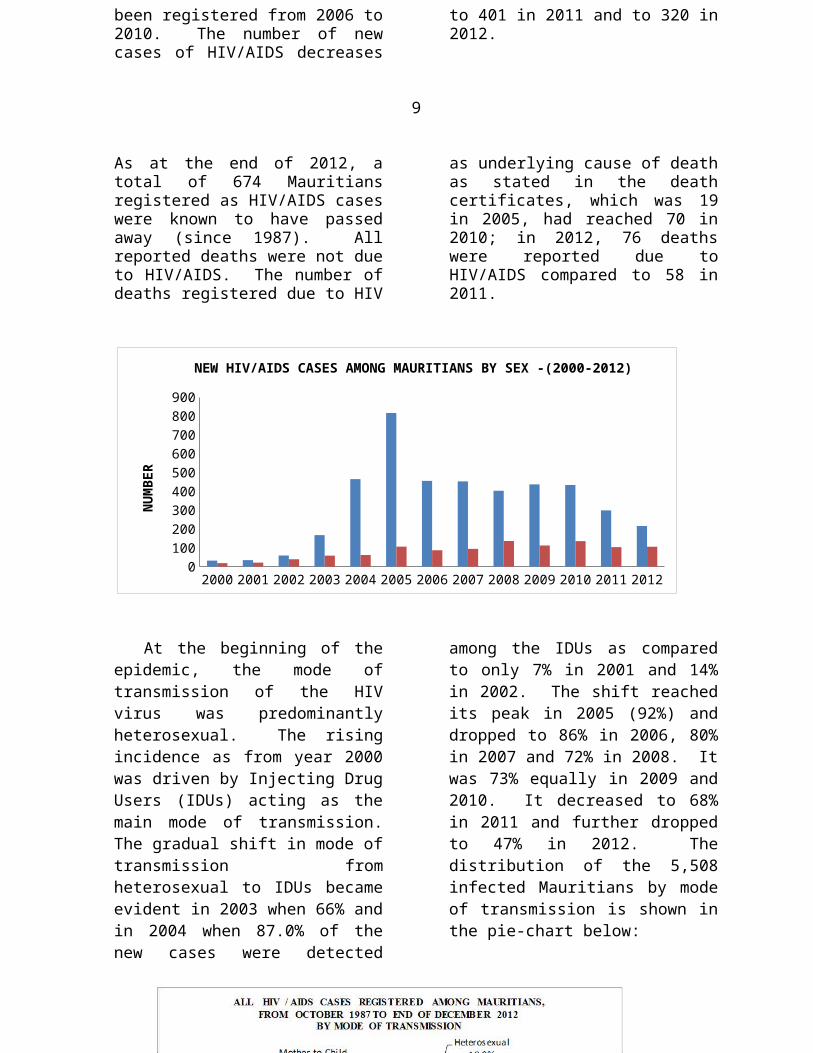
the number of newly detected HIV/AIDS cases among Mauritians, which almost doubled every year between 2001-2005 (55 in 2001, 98 in 2002, 225 in 2003, 525 in 2004 and 921 in 2005), dropped to 542 in 2006. The number decreased from 568 in 2010 to 401 in 2011 and to 320 in 2012;
33 cases of malaria, 13 cases of dengue and 1 case of chikungunya, all imported or introduced, have been reported in 2012.The numbers in 2011 were 54, 8 and 1 respectively;
1 of 2 the number of scabies cases attending Area and Community Health Centres has
continued to decrease from 29,630 in 2009 to 8,522 in 2012 with a yearly average decrease of 33%;
the percentage of cases treated as in-patient in government general hospitals due to cardiovascular diseases or diabetes as main condition has decreased from 15.1% in 2005 to 13.7% in 2012;
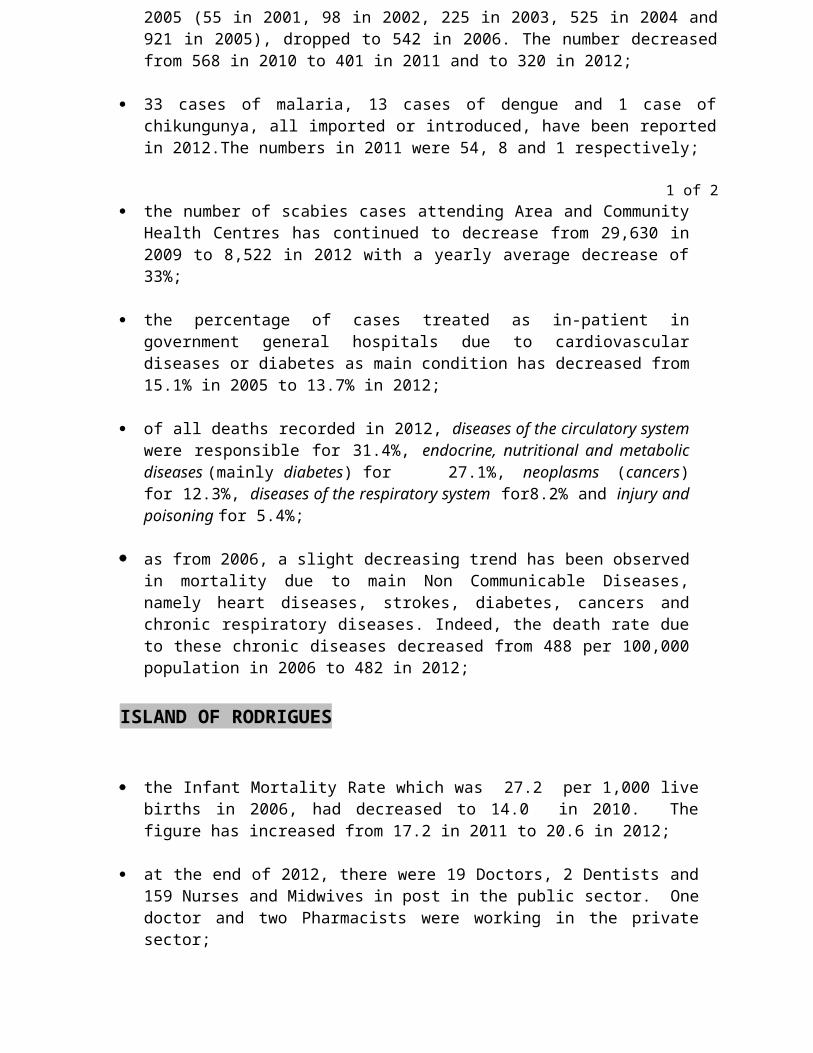
of all deaths recorded in 2012, diseases of the circulatory system were responsible for 31.4%, endocrine, nutritional and metabolic diseases (mainly diabetes) for 27.1%, neoplasms (cancers) for 12.3%, diseases of the respiratory system for8.2% and injury and poisoning for 5.4%;
as from 2006, a slight decreasing trend has been observed in mortality due to main Non Communicable Diseases, namely heart diseases, strokes, diabetes, cancers and chronic respiratory diseases. Indeed, the death rate due to these chronic diseases decreased from 488 per 100,000 population in 2006 to 482 in 2012;
ISLAND OF RODRIGUES
the Infant Mortality Rate which was 27.2 per 1,000 live births in 2006, had decreased to 14.0 in 2010. The figure has increased from 17.2 in 2011 to 20.6 in 2012;
at the end of 2012, there were 19 Doctors, 2 Dentists and 159 Nurses and Midwives in post in the public sector. One doctor and two Pharmacists were working in the private sector;
the number of inpatients treated in the Government Hospital and the two Health Centres was 12,236 in 2012 compared to 9,779 in 2011;
the number of attendances for the treatment of diseases and injuries at the outpatient departments of the Hospital and Health Centres, and the Community Health Centres, which had decreased from 253,437 in 2010 to 236,282 in 2011,was 236,128 in 2012;
in 2012, 5 cases of HIV/AIDS were registered compared to 9 cases in 2011;
of all deaths recorded in 2012, diseases of the circulatory system were responsible for 32.9%, endocrine, nutritional and metabolic diseases (mainly diabetes) for 18.8%, neoplasms (cancers) for 17.1%, diseases of the respiratory system for 7.5% and injury and poisoning for 6.7%.
The Health Statistics Reports, which provide a wealth of information on health indicators such as Population and Vital Statistics, Infrastructure and Personnel, Services, Morbidity and Mortality, are available on the website of the Ministry of Health & Quality of Life (http://health.gov.mu).
2 of 2
i
SELECTED HEALTH VARIABLES AND INDICATORSISLAND OF MAURITIUS - 2012
Variable / Indicator Number/Value Denominator
POPULATION AND VITAL STATISTICS Estimated mid-year resident population 1,253,00
0
Population density 672 per square kilometreEstimated mid-year resident population by sex: male 616,956 female 636,044
sex ratio 970 males per 1000 femalesEstimated end-of-year resident population 1,255,01
1
Population density 673 per square kilometreEstimated female mid-year resident population 15-49 years 341,912 Percentage of total female population 53.8 Percentage of total population (both sexes) 27.3 Estimated mid-year population 60 years and over 154,369 Percentage of total population 12.3 Estimated mid-year population 65 years and over 95,898 Percentage of total population 7.7 Live births 13,766 Crude birth rate 11.0 per 1000 mid-year populationDeaths (all ages) 9,103 Crude death rate 7.3 per 1000 mid-year populationStillbirths 132 Stillbirth rate 9.5 per 1000 total birthsPerinatal deaths 225 Perinatal mortality rate 16.2 per 1000 total birthsInfant deaths 184 Infant mortality rate 13.4 per 1000 live birthsDeaths under five years 211 Under-five mortality rate 15.3 per 1000 live birthsMaternal deaths 9 Maternal mortality ratio 0.65 per 1000 live birthsLife expectancy at birth (years) :
Male 70.2 Female 77.3
Both Sexes 73.7

INFRASTRUCTURE AND PERSONNEL
Beds - public & private sectors4,27
1
Population : bed ratio 294 inhabitants per bedDoctors - public & private sectors* 1,72
2
Population : doctor ratio 751 inhabitants per doctorDentists - public & private sectors* 301 Population : dentist ratio 4,29
7 inhabitants per dentist
Pharmacists - public & private sectors* 432 Population : pharmacist ratio 2,99
4 inhabitants per pharmacist
Nurses (including midwives) - public & private sectors* 3,737
Population : nurse ratio 346 inhabitants per nurse * Variables and indicators relating to personnel refer to the Republic of Mauritius
iiSELECTED HEALTH VARIABLES AND INDICATORS
ISLAND OF MAURITIUS - 2012Variable / Indicator Number/value Denominator
MATERNAL AND CHILD HEALTH Births attended by qualified personnel 13,828 Percentage of all births (registered=13,898) 99.5 Children with a birthweight of less than 2.5 kg 2,359 Percentage of live births (in hospitals & private clinics=13,696)
17.2
Total Fertility Rate 1.41 Net Reproduction Rate 0.67 IMMUNIZATION ( PUBLIC SECTOR ONLY) Children immunized against tuberculosis 11,845 Immunization coverage 87.2 per 100 surviving infantsChildren immunized against diphtheria, whooping cough, tetanus, hepatitis B, Hib and poliomyelitis (3rd dose) 11,754 Immunization coverage 86.6 per 100 surviving infantsChildren immunized against measles/mumps/rubella (MMR) 12,009 Immunization coverage 88.5 per 100 surviving infantsPregnant women immunized against tetanus (2nd or higher dose) 9,687 Immunization coverage 70.7 per 100 surviving infantsNOTIFIABLE DISEASES (REPUBLIC OF MAURITIUS)Cases of tuberculosis reported 130 Incidence rate 10.1 per 100,000 mid-year
populationCases of malaria reported : [all imported/introduced ] 33 Incidence rate 2.6 per 100,000 mid-year
populationCases of HIV \ AIDS reported (Mauritians) 320 Incidence rate 24.8 per 100,000 mid-year
populationCAUSE OF DEATH

Deaths due to diseases of the circulatory system 2,854 Percentage of total deaths 31.4 Disease-specific death rate 22.8 per 10,000 mid-year populationDeaths due to endocrine, nutritional and metabolic diseases 2,471 Percentage of total deaths 27.1 Disease-specific death rate 19.7 per 10,000 mid-year populationDeaths due to neoplasms 1,118 Percentage of total deaths 12.3 Disease-specific death rate 8.9 per 10,000 mid-year populationDeaths due to diseases of the respiratory system 750 Percentage of total deaths 8.2 Disease-specific death rate 6.0 per 10,000 mid-year populationDeaths due to injury and poisoning 491 Percentage of total deaths 5.4 Disease-specific death rate 3.9 per 10,000 mid-year population
1
AN ANALYSIS OF THE HEALTH SITUATION
This analysis of the health situation in Mauritius includes discussion on population and related vital events, on health delivery system, services and personnel, and on activities carried out in public and private health institutions. The morbidity patterns and mortality trends have also been discussed. A few parts refer to the Republic of Mauritius and for that pertaining to Rodrigues is given at Page 109.
POPULATION AND VITAL STATISTICS
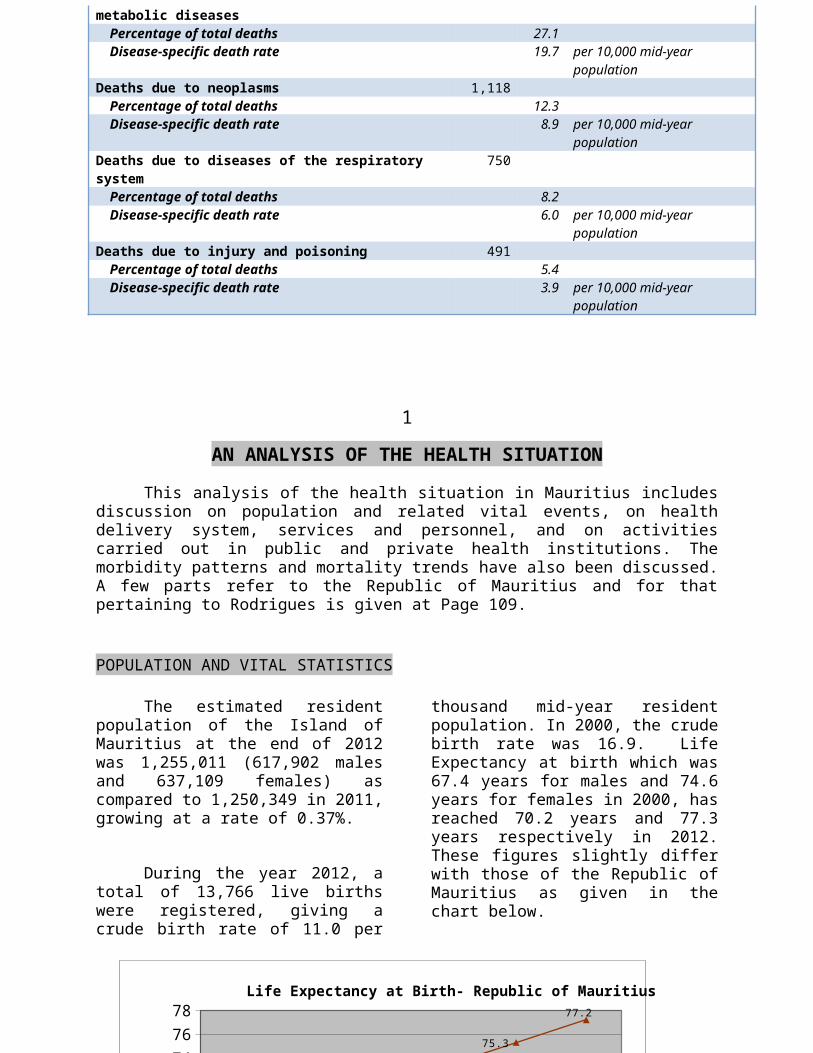
The estimated resident population of the Island of Mauritius at the end of 2012 was 1,255,011 (617,902 males and 637,109 females) as compared to 1,250,349 in 2011, growing at a rate of 0.37%.
During the year 2012, a total of 13,766 live births were registered, giving a
crude birth rate of 11.0 per thousand mid-year resident population. In 2000, the crude birth rate was 16.9. Life Expectancy at birth which was 67.4 years for males and 74.6 years for females in 2000, has reached 70.2 years and 77.3 years respectively in 2012. These figures slightly differ with those of the Republic of Mauritius as given in the chart below.
1962 1972 1983 1990 2000 20125860626466687072747678
58.7
61.0
64.465.6
68.2
70.3
62
65.9
71.7
73.39
75.3
77.2
Life Expectancy at Birth- Republic of Mauritius
Men (years) Women (years)
YEAR
NO
OF
YE
AR
S

2
The number of deaths registered in
2012 was 9,103, corresponding to a crude death rate of 7.3 per thousand mid-year resident population as compared to 6.8 in 2000. Every year, mortality in Mauritius increases during the winter season with higher number of death occurring in the month of July, August and to a lesser extent, September.
The number of infant deaths, that is deaths among children aged under one year, registered in 2012 was 184, corresponding
to an infant mortality rate (IMR) of 13.4 per thousand live births as compared to 12.6 in 2011. The IMR which was 19.6 in 1995 increased to 22.2 in 1996. Following the opening of the Neonatal Intensive Care Service at Victoria Hospital in May 1999, the IMR drastically fell from 19.2 in 1999 to 15.8 in 2000. The lowest IMR (12.4) was recorded in 2003 and in 2010. As shown in the chart below, a decreasing trend has been noted in stillbirth rate from 13.4 per 1,000 total births in 2000 to 6.6 in 2010. However, in 2011 and 2012, it increased to 9.6 and 9.5 respectively.
1962 1972 1983 1990 2000 20125860626466687072747678
58.7
61.0
64.465.6
68.2
70.3
62
65.9
71.7
73.39
75.3
77.2
Life Expectancy at Birth- Republic of Mauritius
Men (years) Women (years)
YEAR
NO
OF
YE
AR
S
1996
1997
1998
1999
2000
2001
2002
2003
2004
2005
2006
2007
2008
2009
2010
2011
2012
0
5
10
15
20
2522.2
20.319.4 19.2
15.813.9 14.5
12.414 13.2
13.515.3
14.313.3
12.412.6
13.413
12.911.7 11.1
13.412.2
10.2 10.9
9.19.6
89.6
10.19
6.6
9.69.5
INFANT MORTALITY RATE STILLBIRTH RATE
RA
TE
Opening of NICU
The number of maternal deaths registered in 2012 was 9 as compared to 4 in 2010 and 5 in 2011. The maternal mortality ratio per 1,000 live births was 0.65 in 2012 compared to 0.36 in 2011.
3
HEALTH DELIVERY SYSTEM
In the Island of Mauritius, as at the end of 2012, there were five regional hospitals with a total of 2,538 beds and two district hospitals namely Souillac Hospital with 48 beds and Mahebourg Hospital with 60 beds. There were also a psychiatric hospital with a bed complement of 680, and other specialised hospitals for chest diseases (61 beds), eye diseases (59 beds), ear, nose, and throat (E.N.T.) diseases (53 beds) and heart diseases (67 beds). This brought the total number of beds in government institutions to 3,566 in 2012 as compared to 3,819 in 2000.
In the private sector there were, as at the end of 2012, seventeen private health institutions with a total of 705 beds. The total number of beds in the public and private sectors as at the end of 2012 was thus 4,271, that is, 294 inhabitants per bed. In 2000, the corresponding ratio was 264.
All regional and district hospitals
and four of the 5 specialised hospitals, namely, the Psychiatric, Eye, E.N.T and Cardiac hospitals have an out-patient department. Out-patient services were also delivered in two community hospitals, three medi-clinics, 20 Area Health Centres (AHC) and 116 Community Health Centres (CHC). The basic services delivered at CHC include the treatment of common diseases and
injuries, maternal and child care, and family planning. In addition to these services, AHC also provide dental care. This service was also delivered in a few CHC’s. 5 Ayurvedic Clinics were providing outpatient care. Out-patient care was also provided in the private sector, including clinics and dispensaries on sugar estates. There were also a chest clinic and four day care centres for the Immuno-Suppressed in operation as at the end of 2012.
HEALTH PERSONNEL
At the end of 2012, there were 1,722 doctors registered with the Medical Council of the Republic of Mauritius, that is 13.3 doctors per 10,000 population. Of those doctors, 1000 (58.1%) were employed in the public sector, including 284 specialists.
There were 301 dentists, of whom
59 in the public sector, at the end of 2012. The corresponding number of pharmacists was 432 and 23 respectively. The number of qualified nurses and midwives in the public & private sectors was 3,737 of whom 686 were in the private sector.
INPATIENT SERVICE

In 2012, the number of admissions (including re-admissions) to government hospitals in the Island of Mauritius were 204,736 of which 183,826 (89.8%) was in
general hospitals. Bed occupancy in the public sector was 75.0% as compared to 73.5% in 2010 and 69.9 % in 2000.
4
OUT-PATIENT SERVICE
In 2012, a total of 5.1 million cases have been seen by doctors at the out-patient service points in the public sector, comprising of general and specialized hospitals (59.4%) and primary health care centres (40.6%). The number of consultations at hospitals (excluding in wards) was 3,049,213 in 2012 compared to 2,986,912 in 2007 whereas that at
primary health centres was 2,087,144 and 1,943,031 respectively. An average of 4,069 patients was seen daily at the Accidents and Emergency Departments of government hospitals in 2012 (excluding L.Mountain and Y.Cantin Community Hospitals).
In 2012, attendances for the treatment of common diseases and injuries at the community hospitals, mediclinics, area & community health centres were 4.20 million, as compared to 2.83 million in 2000 and 4.05 million in 2011. An increase of 3.8% has been noted in the number of attendances from 2011 to 2012.
In 2004, the monthly average attendances at the primary health care centres due to scabies was 1,001 compared to 1,287 for the period 2000 to 2003. Afterwards, an increasing trend in the incidence of the disease was observed when the monthly average rose from

1,331 cases in 2005 to reach 2,469 cases in 2009. Following the setting up of an enhanced surveillance system, the increasing trend has been reversed. The monthly average for the year 2010
dropped to 1,276, representing a 48% decrease when compared to that of 2009. The figure which had reached 959 in 2011 has further gone down to 710 in 2012. (see chart below).
5
Available data indicate that the number of cases which have been treated for Upper Respiratory Tract Infections (URTI) at all public health institutions drastically increased from 414,600 in 2008 to 608,000 in 2009 and 709,000 in 2010. In 2012, the figure stood at
656,100 compared to 603,000 in 2011. The AH1N1 virus has probably contributed to these significant increases. Monthly attendances due to URTI in the period 2010-2012 are given in the chart below.
MATERNAL AND CHILD HEALTH
The number of first attendances for antenatal examinations by the M.C.H staff at government clinics was 15,963 in 2000, 11,214 in 2010 and 10,085 in 2012. The total number of first and subsequent
attendances for antenatal and postnatal examinations and children under 5 years seen at Well Baby clinics which increased from 292,253 in 2006 to 327,182 in 2007 mainly due to enhanced activities related to growth monitoring was 292,557 in 2011 and 284,386 in 2012.
JAN FEB MAR APR MAY JUN JUL AUG SEP OCT NOV DEC20,000
40,000
60,000
80,000
100,000
120,000
140,000
160,000
CASES OF UPPER RESPIRATORY TRACT INFECTION ATTENDING PUBLIC HEALTH IN-STITUTIONS
MO
NTH
LY A
TTEN
DAN
CES

The percentage of low birth weight (less than 2,500 grammes) among live births in the public sector, which increased from 14.3% in 2000 to 19.2% in 2010, has remained unchanged in 2011 and
in 2012. The percentage of deliveries by caesarian section occurring in government hospitals increased from 26.8% in 2000 to 42.4% in 2009; since then, it has stabilized between 40.4% and 41.5% (41.0% in 2012).
6
The number of babies immunized against tuberculosis (B.C.G.) by M.C.H. staff in 2012 was 11,845. The number of children immunized against diphtheria, whooping cough, tetanus, hepatitis B and HIB (3rd dose) was 11,754. Those immunized against poliomyelitis (3rd dose) was 11,904 and against measles/mumps/rubella (MMR) was 12,009. The figures refer to the activities of M.C.H. staff at government vaccination centres.
SCHOOL HEALTH
During the year 2012, the nursing staff responsible for school health visited 615 pre-primary schools and screened 19,093 children. 5.0% of these children were reported to have nits and lice. The nursing staff also visited 283 primary schools and screened 59,547 pupils. 29,471 pupils of Standards III, V and VI were submitted to vision tests and 939 of the
1,220 children with defective vision were referred to specialist. 13,619 of the new entrants to primary schools were immunized against diphtheria & tetanus (D.T.) and poliomyelitis. 13,886 of them were also immunized against MMR and 15,628 primary school leavers were immunized against tetanus.
CIGARETTE AND ALCOHOLIC PRODUCTS
Data obtained from the Mauritius Revenue Authority (MRA) indicate that the number of imported cigarette sticks was 1 billion in 2012 compared to 1.3 billion in 2009. As indicated in the chart below, the estimated yearly per capita cigarette consumption has decreased from 1,056 sticks to 799 sticks during the last 3 years, that is, an average annual decrease of 8%.

2009 2010 2011 20120.0
200.0
400.0
600.0
800.0
1000.0
1200.01055.9
846.7 859.6 798.5
Yearly* per capita cigarette** sticks consumption 2009-2012 in Mauritius
based on data from January to December ** imported + produced
7
Data submitted by the MRA indicate that the number of litres of imported or locally produced alcoholic products has increased from 54.8 million in 2009 to 56.0 million in 2011. However, a 5% decrease has been observed in 2012 when the figure went down to 53.3 million. The estimated yearly per capita litres of alcohol intake followed a decreasing trend from 44.9 litres to 42.6 litres between 2011 and 2012.
* based on data from January to December ** imported + produced
DENTAL HEALTH The total number of attendances at government dental clinics (static and mobile)
2009 2010 2011 201241.041.542.042.543.043.544.044.545.045.5
44.3
44.9 44.9
42.6
Yearly* per capita litres of alcohol intake** 2009-2012 in Mauritius

in 2012 was 332,943, out of which 72,019, that is 21.6%, were among children aged under 12 years; 22,622 (6.8%) were cases seen by dental specialists. The number of cases treated for paradontal diseases was 34,573 and
the number of surgical operations on jaws, including surgical extractions of roots and impacted teeth, was 7,817. A total of 41,695 children and adults were exposed to oral health education.
PRIVATE HEALTH INSTITUTIONS WITH IN-PATIENT SERVICE
The total number of cases seen for
treatment, including admissions, at the 17 private hospitals and clinics in 2012 was 187,152. 21,869 of these cases have undergone surgical operations and procedures. 3,064 live births and stillbirths that occurred in these institutions represented 22.0% of total births registered in the whole island compared
to 13.7% in 2000. 10.5% of live births had low birth weight (less than 2,500 grammes); the corresponding figure was 4.7% in 2000. The percentage of caesarian section on total births has increased from 35.3 in 2000 to 56.3 in 2011. A decrease has been noted in 2012 with a rate of 53.3%.
8
MORBIDITY
The first case of AIDS in the Republic of Mauritius was notified in October 1987. As at the end of 2012, a total of 5,720 cases of HIV/AIDS were detected, of whom 5,508 (4,375 males, 1,133 females) were Mauritians. 74.8% of the 5,508 HIV infected Mauritians were in the age-group 25 to 49 years and
17.2% in the age-group 15 to 24 years. As shown on the chart that follows, the number of new HIV/AIDS cases is more significant among the male than among the female. However, the proportion of females increased from 11.6% in 2004 to 25.3% in 2008, and to 32.8% in 2012.
Distribution of HIV/AIDS cases # by sex and age * group(1987 – 2012)
Age group
(Years)
Male Female TOTAL
<5 17 12 29
5 -14 5 7 12
15 - 19 76 107 183
20 - 24 531 236 767
25 - 29 924 228 1,152
30 - 34 833 181 1,014
35 - 39 651 137 788
40 - 44 605 104 709
45 - 49 400 56 456
50 & above 333 65 398
TOTAL 4,375 1,133 5,508
*Age at detection # Mauritians
Prior to 2000 the incidence was fairly low with 20 to 30 new HIV cases being reported annually. Over the period 2001 - 2005 the number had increased by nearly two folds annually: 55 in 2001, 98 in 2002, 225 in 2003, 525 in 2004 and 921 in 2005. The upward trend observed during these years could be partly explained by enhanced surveillance and
testing facilities at various points across the country and scaling up of outreach Voluntary Counselling and Testing (VCT) sessions among the most at risk groups. An average of 548 cases has been registered from 2006 to 2010. The number of new cases of HIV/AIDS decreases to 401 in 2011 and to 320 in 2012.
9
As at the end of 2012, a total of 674 Mauritians registered as HIV/AIDS cases were known to have passed away (since 1987). All reported deaths were not due to HIV/AIDS. The number of deaths registered due to HIV as underlying cause
of death as stated in the death certificates, which was 19 in 2005, had reached 70 in 2010; in 2012, 76 deaths were reported due to HIV/AIDS compared to 58 in 2011.
At the beginning of the epidemic, the
mode of transmission of the HIV virus was predominantly heterosexual. The rising incidence as from year 2000 was driven by Injecting Drug Users (IDUs)
acting as the main mode of transmission. The gradual shift in mode of transmission from heterosexual to IDUs became evident in 2003 when 66% and in 2004 when 87.0% of the new cases were
2000 2001 2002 2003 2004 2005 2006 2007 2008 2009 2010 2011 20120
100200300400500600700800900
NEW HIV/AIDS CASES AMONG MAURITIANS BY SEX -(2000-2012)
NUM
BER

detected among the IDUs as compared to only 7% in 2001 and 14% in 2002. The shift reached its peak in 2005 (92%) and dropped to 86% in 2006, 80% in 2007 and 72% in 2008. It was 73% equally in
2009 and 2010. It decreased to 68% in 2011 and further dropped to 47% in 2012. The distribution of the 5,508 infected Mauritians by mode of transmission is shown in the pie-chart below:
10
10
After the epidemic of chikungunya in 2005 and 2006, only 8 cases, all imported, have been reported between 2007 and 2012; one in 2007, five in 2010, one in 2011 and one in 2012. Eleven cases of dengue were reported in 2010 compared to 252 cases in 2009. In 2011 and 2012, 8 cases and 13 cases have been reported respectively, all of which were imported.
Active surveillance for all “Acute Flaccid Paralysis” cases started in August 2003 in the Republic of Mauritius, covering both the public and private sectors. The objective of the AFP Surveillance, as set by the World Health Organisation, is to detect any possible presence of polio virus in view to its eradication from the globe. The target for certification is a non-polio AFP detection rate of >2 cases/100,000 population aged <15 years. A total of 45 cases among children less than 15 years of age have been detected in the country between August 2003 and December 2012; of whom 20 (44%) were less than 5 years old. The AFP Rate per 100,000 children (<15 years), which had increased from 0.6 in 2004 to 2.7 in 2007, dropped to 1.7 in 2008 and has remained below 2 cases in the period 2009-2011. In 2012 it has gone up to 2.3.
Deliveries constituted 6.2% of all cases treated as in-patients in government general hospitals in 2012. Among other principal causes of discharges, there were Diabetes Mellitus with 4.2%, Diarrhoea and gastroenteritis with 3.3%, Acute Upper Respiratory Infections with 4.2%, Gastritis and duodenitis with 2.8%, Hypertensive Diseases with 2.6% and Acute Myocardial Infarction and other Ischaemic Heart Diseases with 2.6%. The distribution by ICD-10 chapters indicates that 12.5% of all cases treated were due to “Pregnancy, childbirth and the puerperium”, 10.9% due to “Injury and Poisoning” 10.1% due to “Diseases of the Respiratory System” and 9.5% due to “Disease of the Circulatory System”.
In 2012, of the 18,444 cases (11,594 males and 6,850 females) treated as in-patients in government general hospitals due to consequences of external causes, 7,308 (39.6%) were following “Falls”, 2,016 (10.9%) following “Transport Accidents” and 1,974 (10.7 %) following “Assaults”. Of the 1,023 (5.5%) cases treated as in-patients following “Attempted suicides”, 560 (54.7%) were females.

Admissions due to respiratory diseases in government general hospitals had significantly increased from 6.2% of all admissions in 2005 to 10.1% in 2009, the year of the AH1N1 epidemic. After a decrease in 2010 (9.5%) and 2011 (9.4%), it went up to 10.1% in 2012.
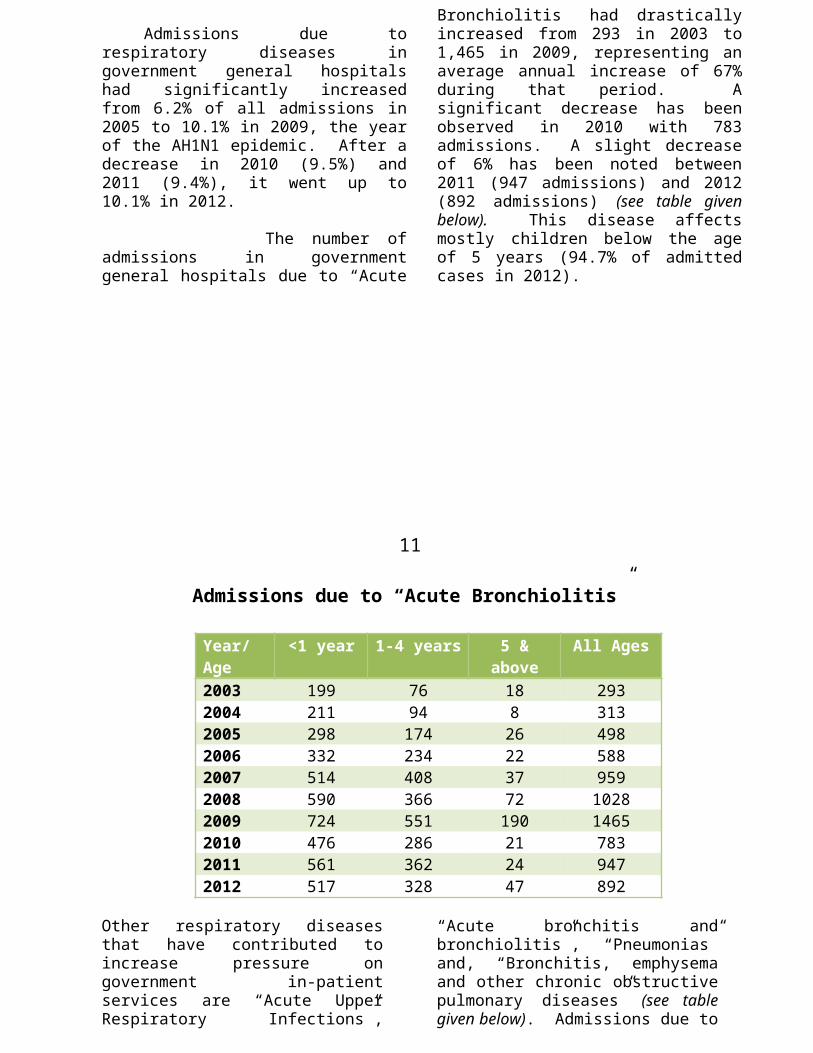
The number of admissions in government general hospitals due to “Acute Bronchiolitis”
had drastically increased from 293 in 2003 to 1,465 in 2009, representing an average annual increase of 67% during that period. A significant decrease has been observed in 2010 with 783 admissions. A slight decrease of 6% has been noted between 2011 (947 admissions) and 2012 (892 admissions) (see table given below). This disease affects mostly children below the age of 5 years (94.7% of admitted cases in 2012).
11
Admissions due to “Acute Bronchiolitis”
Year/Age
<1 year 1-4 years 5 & above All Ages
2003 199 76 18 2932004 211 94 8 3132005 298 174 26 4982006 332 234 22 5882007 514 408 37 9592008 590 366 72 10282009 724 551 190 14652010 476 286 21 7832011 561 362 24 9472012 517 328 47 892
Other respiratory diseases that have contributed to increase pressure on government in-patient services are “Acute Upper Respiratory Infections”, “Acute bronchitis and bronchiolitis”, “Pneumonias” and, “Bronchitis, emphysema and other chronic obstructive pulmonary diseases” (see table given
below). Admissions due to these diseases have increased during the last 9 years, whereas admissions due to “Asthma” have decreased between 2007 and 2012, probably because many patients may have access to nebulisers at primary health care centre level.
Admissions due to certain respiratory diseasesDiseases Sex 2003 2007 2011 2012
Acute upper respiratory infections
Male 1,918 2,021 3,079 3624Female 1,547 1,896 3,008 3479

Total 3,465 3,917 6,087 7103Acute bronchitis and bronchiolitis
Male 241 843 891 822Female 167 550 622 647Total 408 1,393 1,513 1469
Pneumonia Male 269 233 247 280Female 211 161 227 276Total 480 394 474 556
Bronchitis, emphysema and other chronic obstructive pulmonary diseases
Male 550 336 657 914Female 408 300 693 816Total 958 636 1,350 1730
Asthma Male 1,538 1,650 1,238 1098
Female 1,735 1,693 1,518 1403
Total 3,273 3,343 2,756 2501
12
In 2012, of the 3,101 cases treated as in-patient at the Cardiac Centre, 1,670 (53.9%) were for “Angina pectoris”, 706 (22.8%) for “Chronic Ischaemic heart diseases” and 86 (2.8%) for “Mitral stenosis and other rheumatic mitral valve diseases”. A total of 1,326 operations were performed at the Centre, including re-opening cases, of which 646 (48.7 %) were cardiac surgeries.
Cataract was responsible for 4,470 of the 6,816 cases treated as in-patients at S.Bharati (Eye) Hospital in 2012 (that is 65.6%). Among the cataract cases, 4,372 (97.8%) were operated upon. 479 cases were treated as in-patient at the hospital for “injuries and other consequences of external causes”.
During the year 2012, 899 in-patients were treated at the Poudre d’Or (Chest) Hospital. 48 patients died at the Hospital, giving a fatality rate of 5.3%. Of the 899 patients, 578 (64.3%) were males. Pulmonary tuberculosis was the morbid condition for 215 patients (135 males, 80 females), that is 23.9% of the total followed by asthma with 214 patients (124 males, 90 females), that is 23.8% of the total.
Of the 981 new cases diagnosed at the out-patient specialist clinics in chest
diseases during the year 2012, 83 (8.5%) were diagnosed with tuberculosis, of which 79 pulmonary. Among the non-tuberculous diseases, asthma was in first place with 410 new cases, that is, 41.8% of all new cases diagnosed.
Of the 4,344 in-patients treated at Brown Sequard Hospital in 2012, mental and behavioural disorders due to the use of alcohol accounted for 1,848 cases (1,624 males, 224 females), that is 42.5%, followed by Schizophrenia with 1,346 cases (31.0%).
Of the 346 cases treated as in-
patients in 2012 at the Neonatal Intensive Care Unit, located in the complex of Victoria Hospital and SSRN Hospital, 197 (56.9%) were for disorders related to length of gestation and fetal growth, 50 (14.5%) for respiratory and cardiovascular disorders specific to the perinatal period and 46 (13.3%) for infections specific to the perinatal period. There were 93 deaths among those 346 cases, giving a fatality rate of 26.9%. The fatality rate has slightly decreased from 28.1% in 2011 to 26.9% in 2012.
The number of new cases diagnosed at the specialist clinics in dermatology in 2012 were 13,911 of which 4,198 (30.2%)
were skin infections (1,722 of fungal and 924 of parasitic origin). 17.8% of new cases were treated for eczema, 8.1% for psoriasis and similar disorders, and 7.7% for acne.
Of the 5,816 cases treated as in-patients at the E.N.T Hospital in 2012, 1,114 (19.2%) were for “acute tonsilitis”,
1231 (21.2%) for “acute pharyngitis” and 458 (7.9%) for “otalgia and effusion of ear”. Another 5.5% of the in-patients were treated for “localized swelling mass and lump of skin and subcutaneous tissue mainly of head and neck”. A total of 1,600 operations were performed on in-patients at the centre, of which 547 (34.2%) were “excision on tonsils and adenoids”.
13The number of new cases diagnosed
at out-patient specialised clinics in ENT in 2012 was 7,473 representing a 10.9% decrease when compared to 8,384 in 2011. Diseases and conditions of ear accounted for 2,947 new cases (39.4% of the total new cases diagnosed) followed by diseases and conditions of nose for 2,399 (32.1%) and diseases and conditions of throat for 2,057 (27.5%). Tonsilitis (acute or chronic), pharyngitis (acute, chronic or granular), allergic rhinitis, sinusitis (acute or chronic), sensorineural deafness, tinnitus and otitis externa were the most common diseases diagnosed at the centre.
In 2012, the number of reported cases of sexually transmitted infections diagnosed at the skin disease clinic of regional hospitals was 229 (188 males, 41 females). 139 cases of “gonococcal infections”, 60 “venereal warts”, 16 “syphilis” and 12 “herpes simplex” were reported. In 2012, four Day Care Centres for the immuno-suppressed were operational, namely at the Volcy Pougnet Health Centre and Victoria, SSRN, and J.Nehru hospitals. 405 new HIV/AIDS patients were seen in 2012. Another 340 persons received the “Post-HIV Exposure Prophylaxis” and
1,425 persons were seen for “voluntary counselling”.
The disease responsible for the greatest number of first attendances at the community hospitals, mediclinics, area and community health centres for the treatment of common diseases and injuries in 2012 was tonsillitis, laryngitis, nasopharyngitis, sore throat and URTI with 17.8%. Other common causes of first attendances were superficial injury, open wound, sprain/strain, fractures, burns and other injuries with 7.7% and cough, pain in throat, chest pain, wheezing, hiccough, sneezing with 7.2%. Another 6.8% were treated for fever/pain all over.
The distribution by ICD chapters shows that 27.4% of first attendances at the above mentioned dispensary service points were due to “Diseases of Respiratory System” and 10.0% due to “Diseases of the musculoskeletal system and connective tissue”. They were followed by the “Injuries” with 7.8%, “Diseases of digestive system” with 6.2% “, Diseases of the skin and subcutaneous tissue” with 5.2% and “Infectious and parasitic diseases” with 4.9%.

In the period 2009-2011, an annual average of 1,669 new cases of cancer were registered in the Republic of Mauritius compared to 1,392 in the period 2005-2008. Of every 5 new cases registered during 2009-2011, 3 were among women. In the
same period, the most common sites among men were colon/rectum (13.5%), prostate (11.7%), Trachea/Bronchus/Lung (8.1%) and skin (8.1%); among women, they were breast (38.6%), cervix uteri (8.8%) and colon/rectum (8.6%).
14
CAUSE OF DEATH
Heart diseases and Diabetes mellitus were the first two principal underlying causes of mortality in 2012, with 1,626 (17.9%) and 2,416 (26.5%) deaths respectively; Cancer and other Neoplasm of all sites taken together was in the third position with 1,118 (12.3%) deaths. Deaths due to Cerebrovascular diseases which amounted to 687 (7.5%) was in the fourth position followed by Hypertensive Diseases with 497 deaths (5.5%).
The distribution of deaths by Chapter of the International Classification of Diseases (10th Revision) showed that Diseases of the Circulatory System (Chapter IX) were responsible for 31.4% of all deaths in 2012. Endocrine nutritional and metabolic diseases (Chapter 1V) with 27.1% were in second place followed by Neoplasms (Chapter II) with 12.3%.
Of the 2,854 deaths due to Diseases of the Circulatory System in 2012, 1,626 (57.0%) were due to Heart diseases. Stroke and other Cerebrovascular diseases
accounted for another 687 (24.1%) deaths. 23.3% of the 2,854 deaths occurred among persons aged less than 60 years.
Of the 1,118 deaths due to Neoplasms in 2012, the most common types of cancer were that of trachea, bronchus and lung and female breast with 12.5% and 12.4% respectively, stomach with 7.8% and colon with 6.6%. 41 persons died due to leukaemia (3.7%)
Of the 491 deaths due to external causes in 2012, 34.2% were due to transport accidents, 23.4% due to suicides, 8.1% due to accidental drowning and submersion, 6.3% due to assaults, and 3.3% due to exposure to smoke, fire and flames.
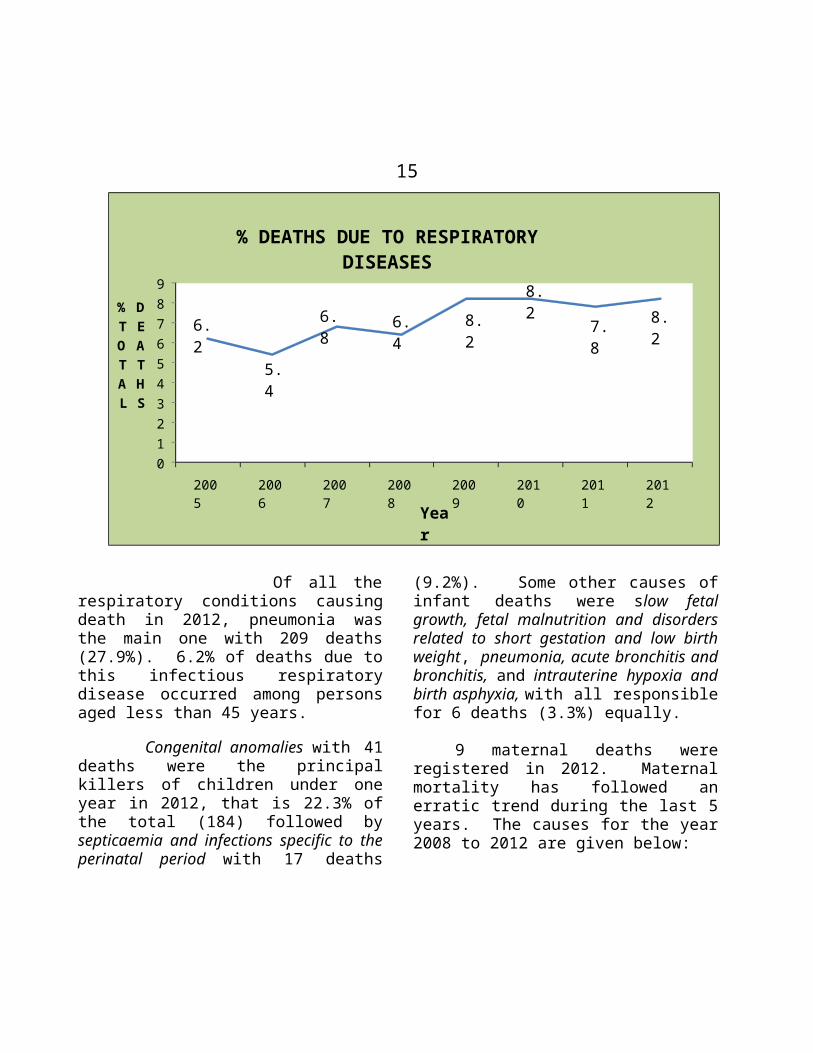
In 2012, a total of 750 (8.2%) deaths were attributable to respiratory diseases. The yearly percentages of deaths due to these diseases indicate an increasing trend between 2006 and 2009. Since then, it has stabilised at 8.2% except in 2011 when it was 7.8% (see chart given below).
6.2
5.4
6.8 6.4 8.2
8.2
7.8 8.2
0123456789
2005 2006 2007 2008 2009 2010 2011 2012
%TOTAL
DEATHS
Year
% DEATHS DUE TO RESPIRATORY DISEASES
15
Of all the respiratory conditions causing death in 2012, pneumonia was the main one with 209 deaths (27.9%). 6.2% of deaths due to this infectious respiratory disease occurred among persons aged less than 45 years.
Congenital anomalies with 41 deaths were the principal killers of children under one year in 2012, that is 22.3% of the total (184) followed by septicaemia and infections specific to the perinatal period with 17 deaths (9.2%). Some other causes of infant deaths were slow
fetal growth, fetal malnutrition and disorders related to short gestation and low birth weight, pneumonia, acute bronchitis and bronchitis, and intrauterine hypoxia and birth asphyxia, with all responsible for 6 deaths (3.3%) equally.
9 maternal deaths were registered in 2012. Maternal mortality has followed an erratic trend during the last 5 years. The causes for the year 2008 to 2012 are given below:

16
No Age at death No Age at
death No Age at death No Age at
death No Age at death
Postpartum haemorrhage 2 23 32 1 40 1 32@ - - - -
Antepartum or intrapartum haemorrhage (with coagulation defect)
1 20@ 3 28@
30 39
- - - - - -
Complications following abortion 1 40 1 38 - - - - 2 37,39
Eclampsia and other maternal hypertension 1 35@ - - - - - - 2 25
28@
Amniotic fluid, pulmonary and other obstetric embolism 1 31 2 19
38 1 23 322 @
21 @
37 @1 33
Diseases of the Circulatory System complicating pregnancy, childbirth and puerperium
- - - - 1 28 1 35 @ 1 19
Placental Disorders - - 1 24 - - - - - -Abdominal or ectopic pregnancy - - 2 32
38 1 31 - - - -
Diseases of the Resp. System compl. pregnancy, childbirth and puerperium
- - - - - - 1 31@ 1 25
Diseases of the digestive System compl. pregnancy, childbirth and puerperium
- - - - - - - - 1 21
Death from any obstetric cause occuring more than 42 days
- - - - - - - - 1 47
TOTAL 6 10 4 5 9 @ Caesarean Section done
Maternal Deaths by cause with age-at-death (years)20122011201020092008
Causes
Year
TRENDS IN CAUSE-SPECIFIC MORTALITY
In 2005, Mauritius adopted the 10th Revision of the International Classification of Diseases (ICD-10) for mortality coding. This shift and other improvements in the coding process have resulted into discontinuities in trends of certain specific causes of death. Percentages of death due to a few major diseases relating to previous years have been adjusted.

17
% underlying cause of death over total death registered
ICD-9 ICD-10
Year 1990 1995 2000 2005 2010 2011 2012
Total Deaths 6,854 7,298 7,806 8,422 8,891 8,951 9,103
CAUSE: Heart Diseases (%) 20.4 21.5 21.8 22.8 18.1 17.2 17.9
Cerebrovascular Diseases (%)
9.3 9.6 9.8 10.8 8.4 8.4 7.5
Other Diseases of Circulatory system (%)
3.8 4.2 4.2 3.7 5.7 5.5 5.9
All Circulatory (%) 33.5 35.3 35.8 37.3 32.2 31.1 31.4
Diabetes Mellitus(%) 12.2 14.8 19.0 21.1 23.6 25.4 26.5
Total Circulatory and DM (%)
45.7 50.1 54.8 58.4 55.8 56.5 57.9
The above table indicates that there has been a slow increase in the percentages of death due to “Heart diseases” till 2005. Since then, a decreasing trend has been noted. On the other hand, a more rapid increase has been noted in regards to “Diabetes mellitus” over the past two decades.
It has to be noted that W.H.O guidelines are applied for the selection of the underlying cause of death
according to the ICD-10. Of all persons whose cause of death have been assigned to “Diabetes Mellitus”, around 40% ultimately died with “Heart Diseases” and another 30% with “Strokes” as direct cause of death.
1,118 persons died due to cancers in 2012. Mortality from this group of diseases has increased from 9.4% of total deaths in 2000 to 12.3% in 2012.

18
As from 2006, a slight decreasing trend has been observed in mortality due to main
Non Communicable Diseases, namely heart diseases, strokes, diabetes, cancers and chronic respiratory diseases, as depicted by the above chart. Indeed, the death rate due to these chronic diseases decreased from 488 per 100,000 population in 2006 to 463 in 2011. However, in 2012, the rate rose to 482.
TRENDS IN SELECTED HEALTH INDICATORS
Figures related to the following health indicators for the Islands of Mauritius and Rodrigues as well as for the Republic of Mauritius, together with charts, are given at page 20-26: Crude Birth Rates, Crude Deaths Rates, Stillbirth Rates, Infant Mortality Rates, Under-5 Mortality Rates, Maternal Mortality Ratios and % Low Birth Weight.
As indicated by the specific line graphs, general decreasing trends have been observed in Mauritius as from 1990 in regards to Stillbirth, Infant Mortality, Under-5 Mortality and Maternal Mortality. However, since 2005
or 2006, erratic trends have been noted in these indicators
The percentage of low birth weight (< 2.5 Kg) among live births that occurred in public and private health institutions, which was 7.9% in 1990 in the Island of Mauritius, has continued to increase to reach 17.4% in 2010 then slightly decreased to 17.2% in 2012. The same trend was observed in Rodrigues where it increased from 5.6% in 1990 to 14.3% in 2006; since then, this rate has followed an erratic trend with a peak of 15.5% in 2011.
***************************************
2006 2007 2008 2009 2010 2011 2012430
440
450
460
470
480
490
500
488.2
453.0
472.8 471.1
460.5
462.9
482.0
Death Rate per 100,000 population due to NCD's in Mauritius
Year
Rate
Trend line
Health Indicators - Republic of Mauritius
Unit 1990 2000 2001 2002 2003 2004 2005 2006 2007 2008 2009 2010 2011 2012
Crude birth rate Per 1,000 Mid Year Population
21.3 17.0 16.4 16.5 15.8 15.6 15.1 14.1 13.5 12.9 12.0 11.7 11.4 11.2
Crude death rate 6.6 6.7 6.7 6.9 7.0 6.9 7.0 7.3 6.7 7.1 7.2 7.1 7.1 7.2
Infant mortality rate Per 1,000 Live Births
20.4 15.9 14.3 14.9 12.9 14.4 13.2 14.1 15.3 14.4 13.4 12.5 12.9 13.7
Maternal mortality ratio 0.66 0.20 0.25 0.15 0.21 0.16 0.21 0.17 0.36 0.37 0.65 0.33 0.34 0.62
Under five mortality rate 23.1 18.2 16.8 17.3 16.0 16.5 15.8 16.9 17.1 16.6 16.1 14.7 15.9 15.7Total fertility rate No.of children
born to an average woman
2.32 1.99 1.91 1.94 1.87 1.87 1.82 1.70 1.66 1.58 1.50 1.47 1.45 1.43
Life expectancy (at birth) Both sexes Years 69.6 71.7 71.8 71.9 72.0 72.2 72.2 72.3 72.6 72.8 72.9 73.1 73.4 73.7
Male 65.6 68.2 68.4 68.6 68.7 68.9 68.9 68.9 69.2 69.3 69.4 69.5 69.8 70.3
Female 73.4 75.3 75.3 75.3 75.4 75.6 75.6 75.7 76.0 76.2 76.6 76.7 77.1 77.2Population per doctor No of
inhabitants1,12
2 1,10
5 1,08
9 1,02
6 1,04
7 950 930 897 876 877 866 855 824 751
Population per dentist 7,613
8,172
8,090
7,798
7,973
7,412
7,258
6,510
5,546
5,412
5,110
4,935
4,807
4,297
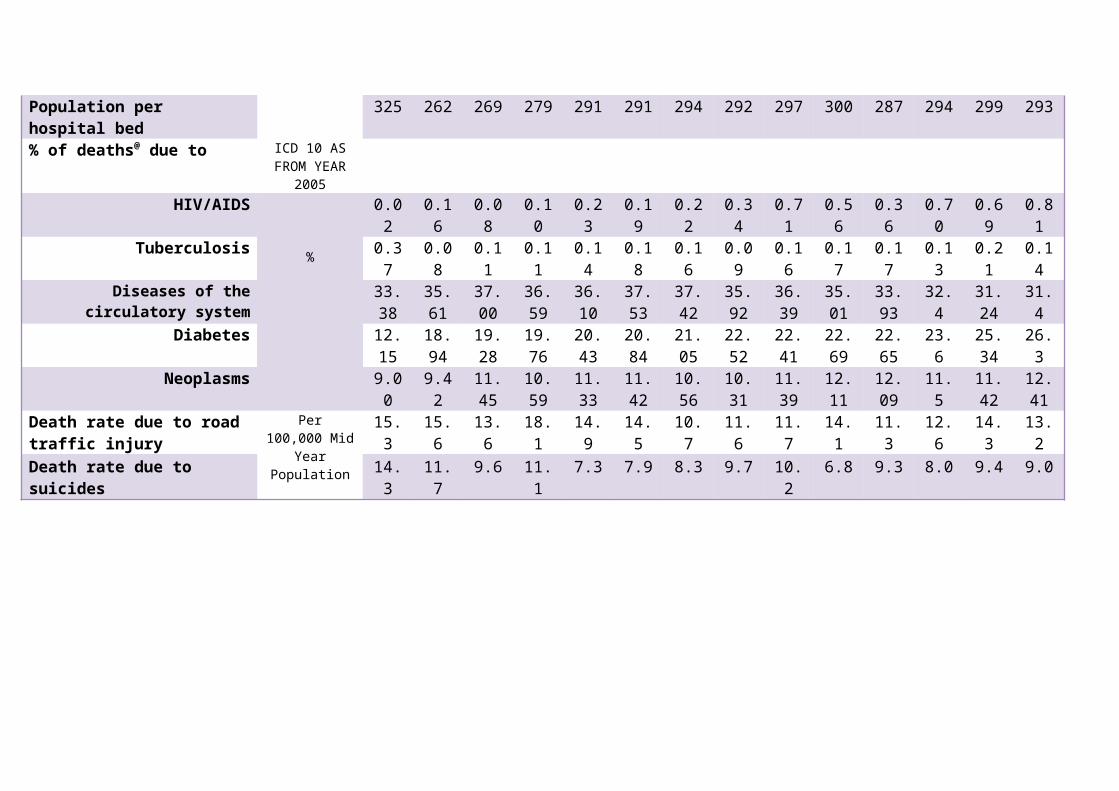
Population per hospital bed 325 262 269 279 291 291 294 292 297 300 287 294 299 293% of deaths@ due to ICD 10 AS
FROM YEAR 2005
HIV/AIDS
%
0.02 0.16 0.08 0.10 0.23 0.19 0.22 0.34 0.71 0.56 0.36 0.70 0.69 0.81Tuberculosis 0.37 0.08 0.11 0.11 0.14 0.18 0.16 0.09 0.16 0.17 0.17 0.13 0.21 0.14
Diseases of the circulatory system 33.38
35.61
37.00
36.59
36.10
37.53
37.42
35.92
36.39
35.01
33.93
32.4 31.24
31.4
Diabetes 12.15
18.94
19.28
19.76
20.43
20.84
21.05
22.52
22.41
22.69
22.65
23.6 25.34
26.3
19
Neoplasms 9.00 9.42 11.45
10.59
11.33
11.42
10.56
10.31
11.39
12.11
12.09
11.5 11.42
12.41
Death rate due to road traffic injury
Per 100,000 Mid Year Population
15.3 15.6 13.6 18.1 14.9 14.5 10.7 11.6 11.7 14.1 11.3 12.6 14.3 13.2
Death rate due to suicides 14.3 11.7 9.6 11.1 7.3 7.9 8.3 9.7 10.2 6.8 9.3 8.0 9.4 9.0

20NATALITY STATISTICS 1990 - 2012
YEAR ISLAND OF MAURITIUS
ISLAND OF RODRIGUES
REPUBLIC OF MAURITIUS*
No. of Crude No. of Crude No. of Crude
Live Births
Birth Rate #
Live Births
Birth Rate #
Live Births
Birth Rate #
1990 21,799 21.3 803 23.5 22,602 21.31991 21,436 20.7 761 22.2 22,197 20.71992 22,170 21.1 732 21.2 22,902 21.11993 21,667 20.4 662 19.2 22,329 20.31994 21,050 19.5 745 21.5 21,795 19.61995 19,824 18.2 725 20.8 20,549 18.31996 20,049 18.2 714 20.4 20,763 18.31997 19,331 17.4 681 19.4 20,012 17.41998 18,744 16.7 690 19.5 19,434 16.81999 19,543 17.2 768 21.6 20,311 17.32000 19,398 16.9 807 22.6 20,205 17.02001 18,884 16.2 812 22.6 19,696 16.42002 19,169 16.3 814 22.5 19,983 16.52003 18,518 15.6 825 22.6 19,343 15.82004 18,285 15.3 945 25.8 19,230 15.62005 17,924 14.9 896 24.3 18,820 15.12006 16,723 13.8 881 23.8 17,604 14.12007 16,190 13.2 844 22.6 17,034 13.52008 15,590 12.7 782 20.8 16,372 12.92009 14,623 11.8 721 19.1 15,344 12.02010 14,292 11.5 714 18.9 15,006 11.72011 14,002 11.2 699 18.4 14,701 11.42012 13,766 11.0 728 19.1 14,494 11.2
*excluding the outer islands
# per thousand mid-year population

202121
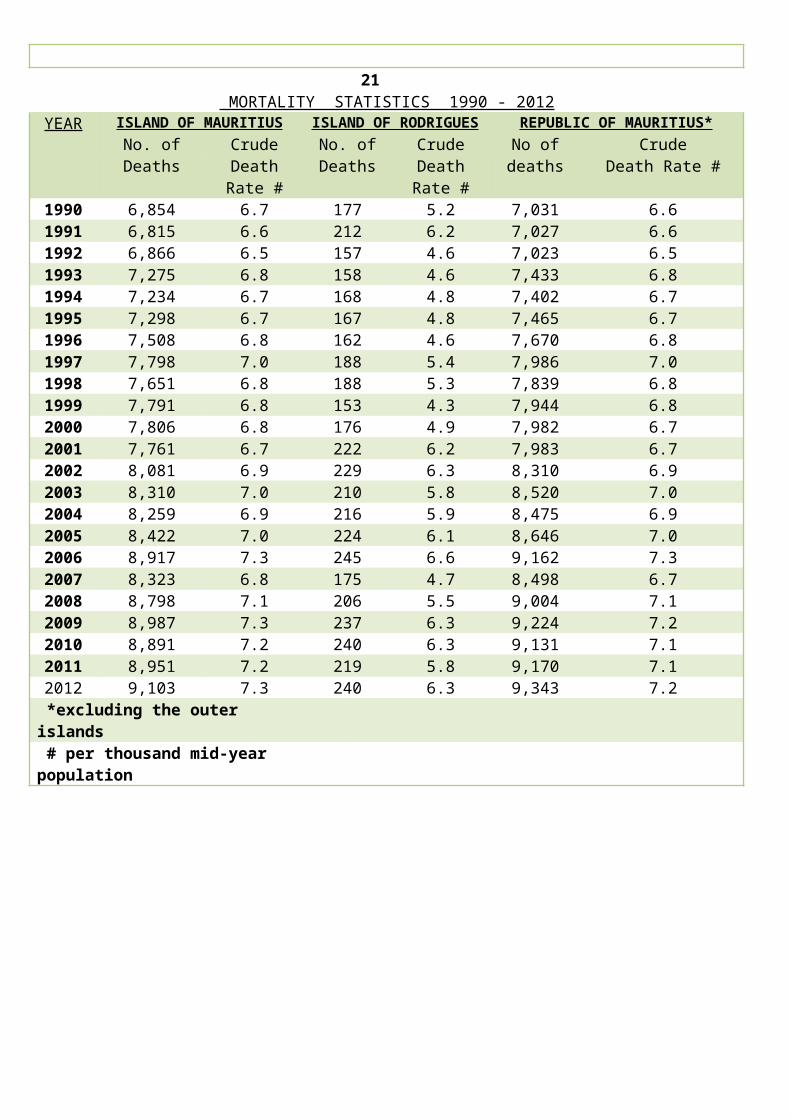
MORTALITY STATISTICS 1990 - 2012YEAR ISLAND OF MAURITIUS ISLAND OF RODRIGUES REPUBLIC OF MAURITIUS*
No. of Crude No. of Crude No of deaths
CrudeDeaths Death Rate
#Deaths Death Rate
#Death Rate #
1990 6,854 6.7 177 5.2 7,031 6.61991 6,815 6.6 212 6.2 7,027 6.61992 6,866 6.5 157 4.6 7,023 6.51993 7,275 6.8 158 4.6 7,433 6.81994 7,234 6.7 168 4.8 7,402 6.71995 7,298 6.7 167 4.8 7,465 6.71996 7,508 6.8 162 4.6 7,670 6.81997 7,798 7.0 188 5.4 7,986 7.01998 7,651 6.8 188 5.3 7,839 6.81999 7,791 6.8 153 4.3 7,944 6.82000 7,806 6.8 176 4.9 7,982 6.72001 7,761 6.7 222 6.2 7,983 6.72002 8,081 6.9 229 6.3 8,310 6.92003 8,310 7.0 210 5.8 8,520 7.02004 8,259 6.9 216 5.9 8,475 6.92005 8,422 7.0 224 6.1 8,646 7.02006 8,917 7.3 245 6.6 9,162 7.32007 8,323 6.8 175 4.7 8,498 6.72008 8,798 7.1 206 5.5 9,004 7.12009 8,987 7.3 237 6.3 9,224 7.22010 8,891 7.2 240 6.3 9,131 7.12011 8,951 7.2 219 5.8 9,170 7.12012 9,103 7.3 240 6.3 9,343 7.2
*excluding the outer islands # per thousand mid-year population

2222
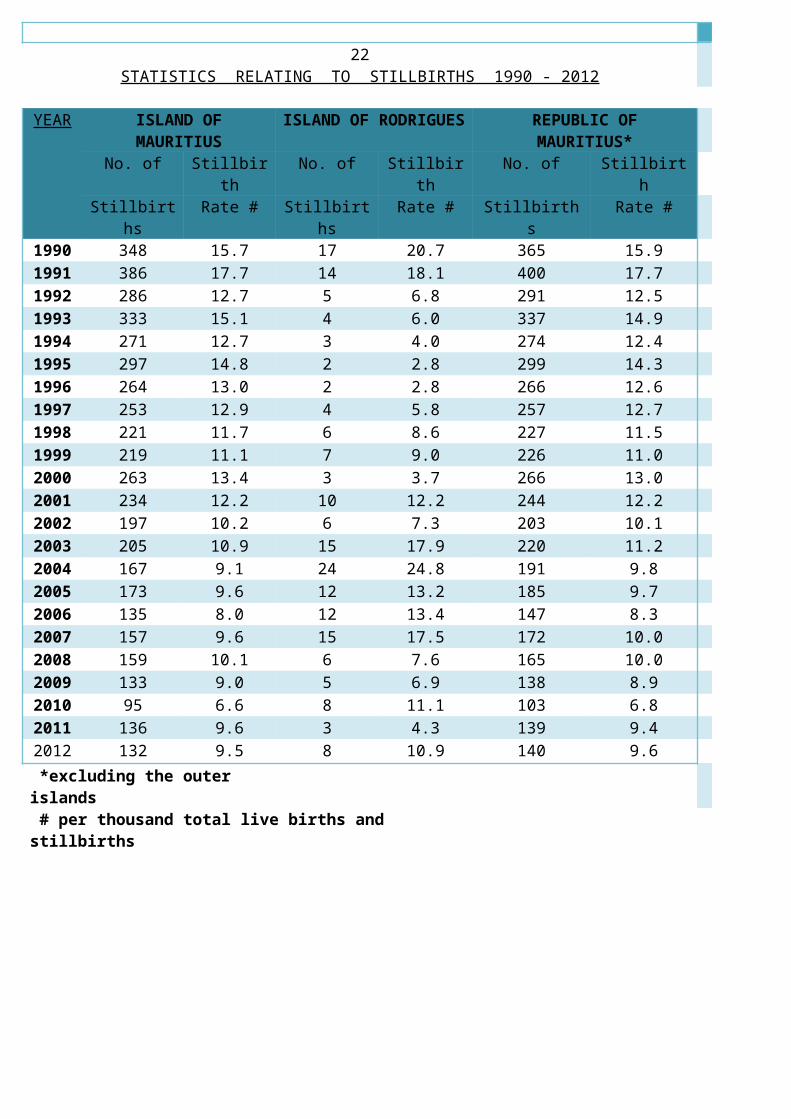
STATISTICS RELATING TO STILLBIRTHS 1990 - 2012
YEAR ISLAND OF MAURITIUS
ISLAND OF RODRIGUES
REPUBLIC OF MAURITIUS*
No. of Stillbirth No. of Stillbirth No. of StillbirthStillbirths Rate # Stillbirths Rate # Stillbirths Rate #
1990 348 15.7 17 20.7 365 15.91991 386 17.7 14 18.1 400 17.71992 286 12.7 5 6.8 291 12.51993 333 15.1 4 6.0 337 14.91994 271 12.7 3 4.0 274 12.41995 297 14.8 2 2.8 299 14.31996 264 13.0 2 2.8 266 12.61997 253 12.9 4 5.8 257 12.71998 221 11.7 6 8.6 227 11.51999 219 11.1 7 9.0 226 11.02000 263 13.4 3 3.7 266 13.02001 234 12.2 10 12.2 244 12.22002 197 10.2 6 7.3 203 10.12003 205 10.9 15 17.9 220 11.22004 167 9.1 24 24.8 191 9.82005 173 9.6 12 13.2 185 9.72006 135 8.0 12 13.4 147 8.32007 157 9.6 15 17.5 172 10.02008 159 10.1 6 7.6 165 10.02009 133 9.0 5 6.9 138 8.92010 95 6.6 8 11.1 103 6.82011 136 9.6 3 4.3 139 9.42012 132 9.5 8 10.9 140 9.6
*excluding the outer islands # per thousand total live births and stillbirths
1990
1991
1992
1993
1994
1995
1996
1997
1998
1999
2000
2001
2002
2003
2004
2005
2006
2007
2008
2009
2010
2011
2012
5
7
9
11
13
15
17
19Stillbirth Rate - Republic of Mauritius
Rat
e

23INFANT MORTALITY STATISTICS 1990- 2012
YEAR ISLAND OF MAURITIUS
ISLAND OF RODRIGUES
REPUBLIC OF MAURITIUS*
No. of Infant No. of Infant No. of InfantInfant Mortality Infant Mortality Infant MortalityDeaths Rate @ Deaths Rate @ Deaths Rate @
1990 434 19.9 28 34.9 462 20.41991 388 18.1 25 32.9 413 18.61992 408 18.4 18 24.6 426 18.61993 424 19.6 14 21.1 438 19.61994 379 18.0 15 20.1 394 18.11995 388 19.6 16 22.0 404 19.71996 445 22.2 14 19.6 459 22.11997 393 20.3 13 19.1 406 20.31998 364 19.4 12 17.4 376 19.31999 375 19.2 21 27.3 396 19.52000 306 15.8 16 19.8 322 15.92001 263 13.9 19 23.4 282 14.32002 278 14.5 19 22.9 297 14.92003 230 12.4 20 24.2 250 12.92004 256 14.0 21 22.2 277 14.42005 237 13.2 11 12.3 248 13.22006 225 13.5 24 27.2 249 14.12007 248 15.3 13 15.4 261 15.32008 223 14.3 13 16.6 236 14.42009 195 13.3 10 13.9 205 13.42010 177 12.4 10 14.0 187 12.52011 177 12.6 12 17.2 189 12.92012 184 13.4 15 20.6 199 13.7
*excluding the outer islands@ per thousand live births
1990
1991
1992
1993
1994
1995
1996
1997
1998
1999
2000
2001
2002
2003
2004
2005
2006
2007
2008
2009
2010
2011
2012
10
12
14
16
18
20
22
24Infant Mortality Rate - Republic of Mauritius
Year
Rat
e
##

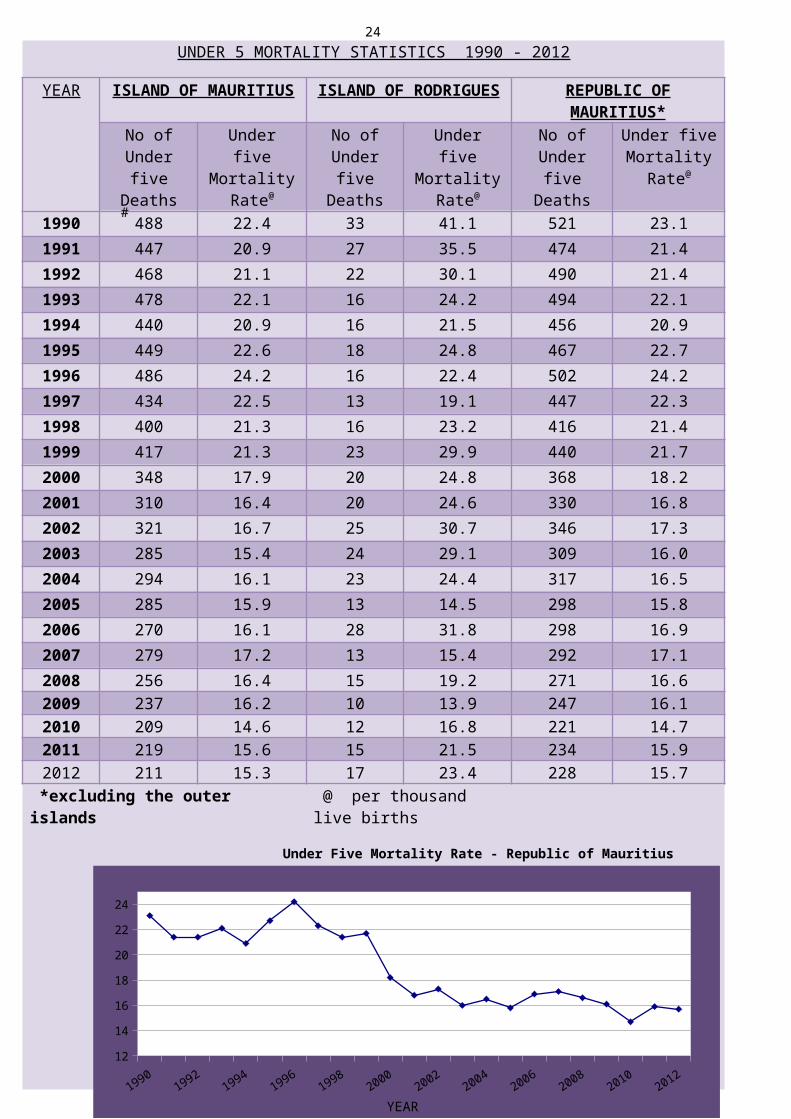
24UNDER 5 MORTALITY STATISTICS 1990 - 2012
YEAR ISLAND OF MAURITIUS ISLAND OF RODRIGUES REPUBLIC OF MAURITIUS*
No of Under five Deaths
Under five Mortality
Rate@
No of Under five Deaths
Under five Mortality
Rate@
No of Under five Deaths
Under five Mortality
Rate@
1990 488 22.4 33 41.1 521 23.11991 447 20.9 27 35.5 474 21.41992 468 21.1 22 30.1 490 21.41993 478 22.1 16 24.2 494 22.11994 440 20.9 16 21.5 456 20.91995 449 22.6 18 24.8 467 22.71996 486 24.2 16 22.4 502 24.21997 434 22.5 13 19.1 447 22.31998 400 21.3 16 23.2 416 21.41999 417 21.3 23 29.9 440 21.72000 348 17.9 20 24.8 368 18.22001 310 16.4 20 24.6 330 16.82002 321 16.7 25 30.7 346 17.32003 285 15.4 24 29.1 309 16.02004 294 16.1 23 24.4 317 16.52005 285 15.9 13 14.5 298 15.82006 270 16.1 28 31.8 298 16.92007 279 17.2 13 15.4 292 17.12008 256 16.4 15 19.2 271 16.62009 237 16.2 10 13.9 247 16.12010 209 14.6 12 16.8 221 14.72011 219 15.6 15 21.5 234 15.92012 211 15.3 17 23.4 228 15.7
*excluding the outer islands @ per thousand live births
Under Five Mortality Rate - Republic of Mauritius
19901992
19941996
19982000
20022004
20062008
20102012
12
14
16
18
20
22
24
YEAR

25 MATERNAL MORTALITY STATISTICS 1990-2012
YEAR ISLAND OF MAURITIUS ISLAND OF RODRIGUES
REPUBLIC OF MAURITIUS @
No.of Maternal Deaths
Matermal Mortality
ratio *
No.of Maternal Deaths
Matermal Mortality
ratio *
No.of Maternal Deaths
Matermal Mortality ratio
*
1990 15 0.69 - - 15 0.661991 15 0.70 2 2.63 17 0.771992 9 0.41 1 1.37 10 0.441993 6 0.28 - - 6 0.271994 15 0.71 - - 15 0.691995 12 0.61 - - 12 0.581996 6 0.30 - - 6 0.291997 10 0.52 - - 10 0.501998 4 0.21 - - 4 0.211999 7 0.36 - - 7 0.342000 3 0.15 1 1.24 4 0.202001 4 0.21 1 1.20 5 0.252002 1 0.05 2 2.50 3 0.152003 4 0.22 - - 4 0.212004 3 0.16 - - 3 0.162005 4 0.22 - - 4 0.212006 3 0.18 - - 3 0.172007 6 0.37 - - 6 0.362008 6 0.38 - - 6 0.372009 10 0.68 - - 10 0.652010 4 0.28 1 1.40 5 0.332011 5 0.36 - - 5 0.342012 9 0.65 - - 9 0.62
* per 1,000 live births @ excluding the outer islands
Maternal Mortality Ratio - Republic Of Mauritius
1990
1991
1992
1993
1994
1995
1996
1997
1998
1999
2000
2001
2002
2003
2004
2005
2006
2007
2008
2009
2010
2011
2012
00.10.20.30.40.50.60.70.80.9
YEAR
RA
TIO
26
LOW BIRTH WEIGHT * (as a percentage of live births with known birthweight) 1990 - 2012
YEAR ISLAND OF MAURITIUS
ISLAND OF RODRIGUES
REPUBLIC OF MAURITIUS@
1990 7.9 5.6 7.81991 9.0 6.6 8.91992 10.4 5.6 10.31993 12.4 4.7 12.21994 11.5 8.3 11.41995 12.9 5.9 12.71996 14.1 7.6 13.91997 13.6 9.7 13.51998 12.8 9.1 12.71999 13.1 9.5 12.92000 13.0 10.6 12.92001 13.0 9.5 12.92002 13.3 7.7 13.02003 13.9 11.3 13.82004 14.6 8.4 14.32005 16.0 11.5 15.82006 14.3 14.3 14.32007 15.9 11.4 15.72008 15.0 12.7 14.92009 16.7 10.0 16.42010 17.4 10.3 17.12011 17.1 15.5 17.02012 17.2 11.5 17.0
@ - excluding the outer islands * - less than 2,500 grammes
19901992
19941996
19982000
20022004
20062008
20102012
0.02.04.06.08.0
10.012.014.016.018.020.0
Low Birth Weight
ISLAND OF MAURITIUS ISLAND OF RODRIGUESyear
%

27
Cases treated for complications following abortion, including spontaneous
Year Government Hospitals
Private Clinics Total
2003 1,532 346 1,878
2004 1,612 572 2,184
2005 1,389 283 1,672
2006 1,269 276 1,545
2007 1,356 279 1,635
2008 1,536 269 1,805
2009 1,390 390 1,780
2010 1,412 481 1,893
2011 1,331 519 1,850
2012 1,293 542 1,835
28ISLAND OF MAURITIUS
2003
2004
2005
2006
2007
2008
2009
2010
2011
2012
0
500
1,000
1,500
2,000
2,500
Cases treated for complications of abortion, including spon-taneous
Government Hospitals Private ClinicsYear
Num
ber
CASES TREATED AS IN-PATIENTS IN GOVERNMENT GENERAL HOSPITALS DUE TO SOME SELECTED DISEASES
Disease / Year
Diabetes Mellitus Hypertensive DiseaseMale Female Total Male Female Total
2000 2,527 3,170 5,697 1,810 2,842 4,652
2001 2,428 3,024 5,452 1,650 2,252 3,902
2002 2,186 2,887 5,073 1,475 2,101 3,576
2003 3,046 3,766 6,812 1,936 2,586 4,522
2004 3,318 3,829 7,147 1,812 2,440 4,252
2005 3,482 4,038 7,520 1,832 2,394 4,226
2006 3,063 3,843 6,906 1,723 2,400 4,123
2007 2,476 2,911 5,387 2,235 3,441 5,676
2008 3,009 3,506 6,515 2,398 3,336 5,734
2009 3,650 4,224 7,874 1,852 2,601 4,453
2010 3,162 3,702 6,864 1,696 2,345 4,041
2011 3,439 3,755 7,194 1,912 2,794 4,706
2012 3,533 3,642 7,175 1,742 2,724 4,466
Disease / Year
Gastro-Enteritis Bronchial AsthmaMale Female Total Male Female Total
2000 3,250
3,417 6,667 1,794 1,893 3,687
2001 2,166
2,330 4,496 1,565 1,616 3,181
2002 2,867
3,027 5,894 1,573 1,667 3,240
2003 2,181
2,378 4,559 1,538 1,735 3,273
2004 2,815
3,037 5,852 1,453 1,689 3,142
2005 2,420
2,734 5,154 1,507 1,668 3,175
2006 3,843
4,100 7,943 1,613 1,577 3,190
2007 3,079
3,245 6,324 1,650 1,693 3,343
2008 3,490
3,756 7,246 1,299 1,469 2,768
2009 2,509
2,967 5,476 1,282 1,387 2,669
2010 2,698
3,200 5,898 1,211 1,354 2,565
2011 3,161
3,978 7,139 1,238 1,518 2,756
2012 2,416
3,245 5,661 1,098 1,404 2,502

29ISLAND OF MAURITIUS
FIRST ATTENDANCES FOR THE TREATMENT OF SOME SELECTED DISEASES AT THE COMMUNITY HOSPITALS, MEDI-CLINICS, AREA HEALTH CENTRES AND COMMUNITY
HEALTH CENTRES
Disease / Year
Gastro-Enteritis Disease of the Respiratory System
Male Female
Total Male Female
Total
2000 24,111
24,687
48,798
197,363
209,389
406,752
2001 23,063
23,562
46,625
184,994
197,563
382,557
2002 30,029
31,746
61,775
193,393
204,064
397,457
2003 27,261
29,009
56,270
190,477
206,008
396,485
2004 29,333
30,663
59,996
178,608
189,064
367,672
2005 29,686
32,045
61,731
183,640
197,766
381,406
2006 32,905
33,700
66,605
181,462
194,913
376,375
2007 29,490
30,955
60,445
184,487
198,061
382,548
2008 33,036
34,576
67,612
212,454
229,970
442,424
2009 27,102
28,536
55,638
247,318
270,233
517,551
2010 28,834
30,171
59,005
223,242
244,812
468,054
2011 30,685
32,108
62,793
210,612
230,452
441,064
2012 29,901
30,347
60,248
232,986
251,708
441,064
Disease / Year
Diabetes Mellitus HypertensionMale Femal
eTotal Male Femal
eTotal
2000 8,721
8,927 17,648
10,720
10,855
21,575
2001 10,797
11,508
22,305
13,500
13,981
27,481
2002 11,169
12,213
23,382
15,447
16,713
32,160
2003 9,649
10,506
20,155
12,522
13,423
25,945
2004 9,137
9,812 18,949
10,818
11,789
22,607
2005 11,717
12,654
24,371
13,006
14,336
27,342
2006 12,311
12,845
25,156
14,296
15,168
29,464
2007 8,238
9,098 17,336
9,283 10,312
19,595
2008 8,297
8,992 17,289
9,290 9,440 18,730
2009 6,529
7,332 13,861
7,486 8,134 15,620
2010 7,159
7,689 14,848
7,621 8,034 15,655

2011 7,589
8,279 15,868
8,586 9,189 17,775
2012 8,104
9,053 17,157
9,736 10,780
20,516

REPUBLIC OF MAURITIUS
INCIDENCE OF SOME COMMUNICABLE DISEASES (REPORTED CASES)
Year 2000 2001 2002 2003 2004 2005 2006 2007 2008 2009 2010 2011 2012
HIV/AIDS (MAURITIANS)
Number 50 55 98 225 525 921 542 546 538 548 568 401 320Incidence Rate * 0.4 0.5 0.8 1.9 4.3 7.4 4.3 4.3 4.2 4.3 4.4 3.1 2.5
MALARIA Number 62 66 39 40 48 36 38 42 27 23 52 54 33Incidence Rate * 0.5 0.6 0.3 0.3 0.4 0.3 0.3 0.3 0.2 0.2 0.4 0.4 0.3
PULMONARY TUBERCULOSIS
Number 139 112 127 121 129 123 111 108 106 113 117 113 128Incidence Rate * 1.2 0.9 1.0 0.9 1.0 1.0 0.9 0.9 0.8 0.9 0.9 0.9 1.0
FOOD POISONING Number 62 23 33 60 160 29 78 766 129 718 156 445 264Incidence Rate * 0.5 0.2 0.3 0.5 1.3 0.2 0.6 6.1 1.0 5.6 1.2 3.5 2.0
* per 10,000 mid-year population
ISLAND OF MAURITIUS
MORTALITY DUE TO MAIN NON-COMMUNICABLE DISEASES
Underlying cause of death: NUMBER OF DEATHS REGISTERED IN WHOLE ISLAND
2000 2001 2002 2003 2004 2005 2006 2007 2008 2009 2010 2011 2012
DIABETES MELLITUS 1,483 1,506 1,608 1,704 1,726 1,778 2,018 1,878 2,004 2,046 2,097 2,277 2,416HEART DISEASES 1,702 1,707 1,802 1,870 1,875 1,921 1,934 1,762 1,724 1,705 1,611 1,545 1,626CEREBROVASCULAR DISEASES
765 636 768 798 735 913 832 769 838 757 744 750 687
HYPERTENSIVE 193 238 286 325 284 299 395 469 490 528 466 453 497
30
DISEASESRENAL FAILURE 242 219 197 174 170 188 187 116 123 141 158 171 123CANCER 736 887 850 925 936 889 914 936 1,049 1,085 1,033 1,022 1,159CHRONIC RESPIRATORY DISEASES
261 244 235 259 210 240 237 195 205 236 239 190 199

31 Deaths by month of registration - Island of Mauritius, 2010 - 2012 (All Causes)
Month 2010 2011 2012
January 711 713 748
February 707 666 732
March 661 726 701
April 672 707 691
May 698 726 747
June 722 729 774
July 908 824 920
August 861 863 849
September 750 832 790
October 709 744 770
November 728 732 663
December 764 689 718
Year 8,891 8,951 9,103

32 ISLAND OF MAURITIUS
POPULATION AND VITAL STATISTICS (NUMBERS) 1984 - 2012
Period
Estimated Mid-Period Population* Civil
Marriages
Live Births
Deaths
Natural Increas
e
Maternal
Deaths
Still-Birth
s
Infant
Deaths +
Child Deaths x
Under five deaths @
Estimated End-of-
Population *
1984
978,658 10,638 19,222 6,417
12,805
18 388 444 90 534 982,780
1985
986,520 11,088 18,520 6,691
11,829
19 368 441 105 546 991,606
1986
994,319 10,337 18,225 6,622
11,603
23 342 480 99 579 1,000,077
1987
1,001,607
11,201 19,151 6,581
12,570
19 344 463 73 536 1,005,921
1988
1,009,332
11,283 20,057 6,699
13,358
9 351 441 69 510 1,015,718
1989
1,017,307
11,040 20,955 6,946
14,009
4 399 452 64 516 1,023,238
1990
1,024,571
11,252 21,799 6,854
14,945
15 348 434 54 488 1,031,526
1991
1,035,936
11,146 21,436 6,815
14,621
15 386 388 59 447 1,043,185
1992
1,049,988
11,246 22,170 6,866
15,304
9 286 408 60 468 1,057,379
1993
1,062,855
11,383 21,667 7,275
14,392
6 333 424 54 478 1,070,679
1994
1,078,148
11,212 21,050 7,234
13,816
15 271 379 61 440 1,082,583
1995
1,087,636
10,430 19,824 7,298
12,526
12 297 388 61 449 1,094,040
1996
1,099,057
10,502 20,049 7,508
12,541
6 264 445 41 486 1,106,888
1997
1,113,144
10,654 19,331 7,798
11,533
10 253 393 41 434 1,120,084
1998
1,125,118
10,650 18,744 7,651
11,093
4 221 364 36 400 1,131,491
1999
1,139,718
11,072 19,543 7,791
11,752
7 219 375 42 417 1,144,721
2000
1,151,094
10,720 19,398 7,806
11,592
3 263 306 42 348 1,157,290
2001
1,163,875
10,414 18,884 7,761
11,123
4 234 263 47 310 1,169,303
2002
1,174,021
10,253 19,169 8,081
11,088
1 197 278 43 321 1,180,189
2003
1,186,363
10,556 18,518 8,310
10,208
4 205 230 55 285 1,191,336
2004
1,196,696
11,138 18,285 8,259
10,026
3 167 256 38 294 1,201,000
2005
1,206,346
11,076 17,924 8,422
9,502 4 173 237 48 285 1,211,302
2006
1,215,619
11,262 16,723 8,917
7,806 3 135 225 45 270 1,219,208
2007
1,223,089
11,361 16,190 8,323
7,867 6 157 248 31 279 1,227,075
2008
1,230,995
11,012 15,590 8,798
6,792 6 159 223 33 256 1,234,042
2009
1,237,283
10,446 14,623 8,987
5,636 10 133 195 42 237 1,239,788
2010
1,243,084
10,370 14,292 8,891
5,401 4 95 177 32 209 1,245,289
2011
1,248,126
10,334 14,002 8,951
5,051 5 136 177 42 219 1,250,349

2012
1,253,000
10,197
13,766 9,103
4,663
9 132 184 27 211 1,255,011
* (Population figures for 1984 and later years refer to the "resident" population + Infant : Less than one year old@ Under five : Less than five years old x Child : Between one and five years

33 ISLAND OF MAURITIUS
POPULATION AND VITAL STATISTICS (RATES) 1984 - 2012
PERIO
D
Mid-period
Population * Per Square
Kilometre $
Rate per 1000 of the Mid-period Population *
Maternal Mortality Ratio +
Still- birth rate @
Infant Mortality Rate +
Child Mortality Rate x
Under five
mortality Rate
+
End-of-Period
Population Density
* Per Square
kilometre $
Marriage Rate
Crude Birth Rate
Crude Death Rate
Rate of Natural Increase
1984 525 21.7 19.6 6.6 13.1 0.94 19.8
23.1 1.0 27.8 527
1985 529 22.5 18.8 6.8 12.0 1.03 19.5
23.8 1.3 29.5 532
1986 533 20.8 18.3 6.7 11.7 1.26 18.4
26.3 1.3 31.8 536
1987 537 22.4 19.1 6.6 12.5 0.99 17.6
24.2 1.0 28.0 539
1988 541 22.4 19.9 6.6 13.2 0.45 17.2
22.0 1.0 25.4 545
1989 546 21.7 20.6 6.8 13.8 0.19 18.7
21.6 0.9 24.6 549
1990 549 22.0 21.3 6.7 14.6 0.69 15.7
19.9 0.7 22.4 553
1991 556 21.5 20.7 6.6 14.1 0.70 17.7
18.1 0.8 20.9 559
1992 563 21.4 21.1 6.5 14.6 0.41 12.7
18.4 0.7 21.1 567
1993 570 21.4 20.4 6.8 13.5 0.28 15.1
19.6 0.7 22.1 574
1994 578 20.8 19.5 6.7 12.8 0.71 12.7
18.0 0.7 20.9 581
1995 583 19.2 18.2 6.7 11.5 0.61 14.8
19.6 0.7 22.6 587
1996 589 19.1 18.2 6.8 11.4 0.30 13.0
22.2 0.5 24.2 594
1997 597 19.2 17.4 7.0 10.4 0.52 12.9
20.3 0.5 22.5 601
1998 603 18.9 16.7 6.8 9.9 0.21 11.7
19.4 0.5 21.3 607
1999 611 19.4 17.2 6.8 10.3 0.36 11.1
19.2 0.5 21.3 614
2000 617 18.6 16.9 6.8 10.1 0.15 13.4
15.8 0.6 17.9 621
2001 624 17.9 16.2 6.7 9.6 0.21 12.2
13.9 0.6 16.4 627
2002 630 17.5 16.3 6.9 9.4 0.05 10.2
14.5 0.6 16.7 633
2003 636 17.8 15.6 7.0 8.6 0.22 10.9
12.4 0.7 15.4 639
2004 642 18.6 15.3 6.9 8.4 0.16 9.1 14.0 0.5 16.1 644 2005 647 18.4 14.9 7.0 7.9 0.22 9.6 13.2 0.6 15.9 650 2006 652 18.5 13.8 7.3 6.4 0.18 8.0 13.5 0.6 16.1 654 2007 656 18.6 13.2 6.8 6.4 0.37 9.6 15.3 0.4 17.2 658 2008 660 17.9 12.7 7.1 5.5 0.38 10.
1 14.3 0.5 16.4 662
2009 663 16.9 11.8 7.3 4.6 0.68 9.0 13.3 0.6 16.2 665

2010 667 16.7 11.5 7.2 4.3 0.28 6.6 12.4 0.5 14.6 668 2011 669 16.6 11.2 7.2 4.0 0.36 9.6 12.6 0.7 15.6 671 2012 672 16.3 11.0 7.3 3.7 0.65 9.5 13.4 0.5 15.3 673 * (Population densities and rates for 1984 and later years are based on the "resident population $ based on an area of 1864.8 square kilometers + rate per 1000 live births x rate per 1000 mid-year population aged between one and five years @ rate per 1000 total births (live births and stillbirths)

34 ISLAND OF MAURITIUS
STILLBIRTHS, PERINATAL, NEONATAL AND INFANT DEATHS 1984 - 2012YEAR STILLBIRTHS EARLY
NEO-NATAL DEATHS
PERINATAL DEATHS
LATE NEO-NATAL
DEATHS
NEONATAL DEATHS
POST-NEONATAL
DEATHS
INFANT DEATHS
NUMBER
RATE @
NUMBER
RATE +
NUMBER
RATE @
NUMBER
RATE +
NUMBER
RATE +
NUMBER
RATE +
NUMBER
RATE +
1984 388 19.8 229 11.9
617 31.5
40 2.1 269 14.0
175 9.1 444 23.1
1985 368 19.5 266 14.4
634 33.6
46 2.5 312 16.8
129 7.0 441 23.8
1986 342 18.4 282 15.5
624 33.6
75 4.1 357 19.6
123 6.7 480 26.3
1987 344 17.6 243 12.7
587 30.1
91 4.8 334 17.4
129 6.7 463 24.2
1988 351 17.2 261 13.0
612 30.0
51 2.5 312 15.6
129 6.4 441 22.0
1989 399 18.7 260 12.4
659 30.9
64 3.1 324 15.5
128 6.1 452 21.6
1990 348 15.7 303 13.9
651 29.4
33 1.5 336 15.4
98 4.5 434 19.9
1991 386 17.7 240 11.2
626 28.7
45 2.1 285 13.3
103 4.8 388 18.1
1992 286 12.7 268 12.1
554 24.7
43 1.9 311 14.0
97 4.4 408 18.4
1993 333 15.1 282 13.0
615 28.0
42 1.9 324 15.0
100 4.6 424 19.6
1994 271 12.7 240 11.4
511 24.0
43 2.0 283 13.4
96 4.6 379 18.0
1995 297 14.8 243 12.3
540 26.8
53 2.7 296 14.9
92 4.6 388 19.6
1996 264 13.0 277 13.8
541 26.6
52 2.6 329 16.4
116 5.8 445 22.2
1997 253 12.9 265 13.7
518 26.5
49 2.5 314 16.2
79 4.1 393 20.3
1998 221 11.7 225 12.0
446 23.5
52 2.8 277 14.8
87 4.6 364 19.4
1999 219 11.1 200 10.2
419 21.2
75 3.9 275 14.1
100 5.1 375 19.2
2000 263 13.4 171 8.8 434 22.1
70 3.6 241 12.4
65 3.4 306 15.8
2001 234 12.2 146 7.7 380 19.9
48 2.5 194 10.2
69 3.7 263 13.9
2002 197 10.2 164 8.6 361 18.6
33 1.7 197 10.3
81 4.2 278 14.5
2003 205 10.9 123 6.6 328 17.5
44 2.4 167 9.0 63 3.4 230 12.4
2004 167 9.1 137 7.5 304 16.5
52 2.8 189 10.3
67 3.7 256 14.0
2005 173 9.6 123 6.9 296 16.4
58 3.2 181 10.1
56 3.1 237 13.2
2006 135 8.0 112 6.7 247 14.7
56 3.3 168 10.0
57 3.4 225 13.5
2007 157 9.6 132 8.2 289 17.7
44 2.7 176 10.9
72 4.4 248 15.3
2008 159 10.1 106 6.8 265 16.8
37 2.4 143 9.2 80 5.1 223 14.3
2009 133 9.0 93 6.4 226 15.3
42 2.9 135 9.2 60 4.1 195 13.3
2010 95 6.6 89 6.2 184 12.8
32 2.2 121 8.5 56 3.9 177 12.4
2011 136 9.6 85 6.1 221 15.6
47 3.4 132 9.4 45 3.2 177 12.6
2012 132 9.5 93 6.8 225 16.2
41 3.0 134 9.7 50 3.6 184 13.4
@ Per 1,000 total births ( live births and stillbirths)
+ Per 1,000 live births

DEFINITIONS1.STILLBIRTHS: Children born dead after 28 weeks of gestation 5.NEONATAL DEATHS: Deaths under 4
weeks2.EARLY NEONATAL DEATHS: Deaths occurring in the 1st week of life
6.POST-NEONATAL DEATHS: Deaths between 4 weeks and 1 year
3.PERINATAL DEATHS: Stillbirths plus early neonatal deaths 7.INFANT DEATHS: Deaths under 1 year
4.LATE NEONATAL DEATHS: Deaths between 1 week and 4 weeks
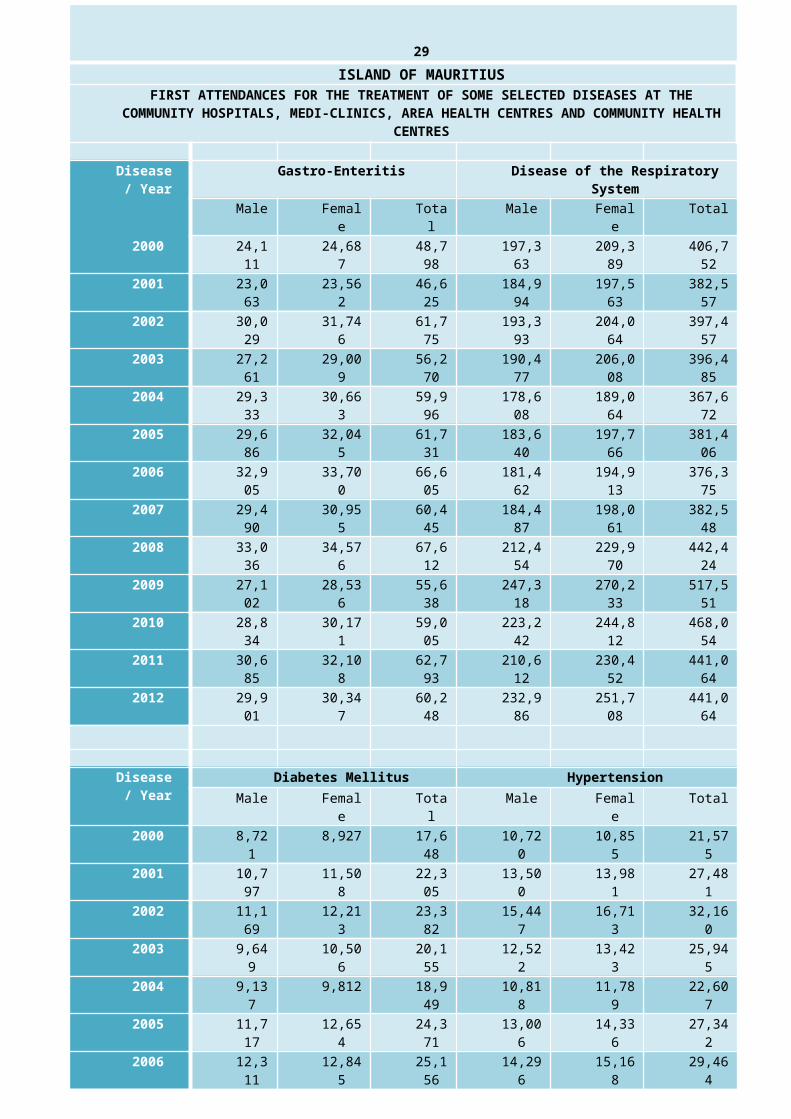
35
REPUBLIC OF MAURITIUSPOPULATION GROWTH RATES AND AGEING POPULATION
Year Mid-Year Resident
Population
Annual Population
Growth Rate (%)
% Population<15
years15-64 years
65 years & over
1990 1,058,775 0.71 29.7 64.9 5.4
1991 1,070,266 1.09 29.5 65.0 5.5
1992 1,084,441 1.32 29.2 65.1 5.7
1993 1,097,374 1.19 28.8 65.4 5.8
1994 1,112,846 1.41 28.2 66.0 5.8
1995 1,122,457 0.86 27.6 66.5 5.9
1996 1,133,996 1.03 27.0 67.0 6.0
1997 1,148,284 1.26 26.5 67.5 6.0
1998 1,160,421 1.06 26.2 67.7 6.1
1999 1,175,267 1.28 25.9 68.0 6.1
2000 1,186,873 0.99 25.7 68.1 6.2
2001 1,199,881 1.10 25.6 68.1 6.3
2002 1,210,196 0.86 25.5 68.1 6.4
2003 1,222,811 1.04 25.2 68.3 6.5
2004 1,233,386 0.86 24.9 68.6 6.5
2005 1,243,253 0.80 24.5 68.9 6.6
2006 1,252,698 0.76 23.9 69.5 6.6
2007 1,260,403 0.62 23.3 69.9 6.8
2008 1,268,565 0.65 22.7 70.5 6.8
2009 1,275,032 0.51 22.2 70.8 7.0
2010 1,280,924 0.46 21.6 71.1 7.3
2011 1,286,051 0.40 21.1 71.5 7.4
2012 1,291,167 0.40 20.6 71.7 7.7

36 REPUBLIC OF MAURITIUS
RESIDENT POPULATION AND VITAL STATISTICS BY DISTRICT (NUMBERS) - 2012
DISTRICT Estimated Mid-Year
Population
Area (Square
Kilometres)
Civil Marriag
es *
Live Births
Deaths
Natural
Increase
Still-birth
s
Infant Death
s
Estimated End-of-Year-
Population
PORT LOUIS 127,767 42.7 783 1,600 1,143 457 22 21 127,454 PAMPLEMOUSSES
140,017 178.7 1,790 1,773 1,002 771 12 36 140,511
RIV. DU REMPART
110,027 147.6 844 1,143 703 440 12 14 110,235
FLACQ 141,310 297.9 1,137 1,567 869 698 13 20 141,586 GRAND PORT 116,101 260.3 1,019 1,198 825 373 12 23 116,211 SAVANNE 70,618 244.8 687 735 542 193 10 6 70,575 PLAINES WILHEMS
386,856 203.3 2,284 3,723 2,955 768 31 40 387,372
MOKA 81,720 230.5 539 897 565 332 9 9 81,820 BLACK RIVER 78,584 259.0 1,114 1,130 499 631 11 15 79,247 RODRIGUES 38,167 104.0 185 728 240 488 8 15 38,242 TOTAL 1,291,1
67 1,968.8 10,382 14,49
4 9,343 5,151 140 199 1,293,253
* By district of residence of bridegroom
RESIDENT POPULATION AND VITAL STATISTICS BY DISTRICT (RATES) - 2012
DISTRICT Mid year Population Density per
Square Kilometres
Rate per 1000 of the Mid-year Population End of year
Population
Density per
Square Kilometr
es
Marriage Rate
Crude Birth Rate
Crude death rate
Rate of natural increa
se#
Stillbirth
Rate@
Infant Mortality Rate+
PORT LOUIS 2,992 12.3 12.5 8.9 3.6 13.6 13.1 2,985PAMPLEMOUSSES
784 25.6 12.7 7.2 5.5 6.7 20.3 786
RIV. DU REMPART
745 15.3 10.4 6.4 4.0 10.4 12.2 747
FLACQ 474 16.1 11.1 6.1 4.9 8.2 12.8 475GRAND PORT 446 17.6 10.3 7.1 3.2 9.9 19.2 446SAVANNE 288 19.5 10.4 7.7 2.7 13.4 8.2 288PLAINES WILHEMS
1,903 11.8 9.6 7.6 2.0 8.3 10.7 1,905
MOKA 355 13.2 11.0 6.9 4.1 9.9 10.0 355BLACK RIVER 303 28.4 14.4 6.3 8.0 9.6 13.3 306RODRIGUES 367 9.7 19.1 6.3 12.8 10.9 20.6 368REPUBLIC 656 16.1 11.2 7.2 4.0 9.6 13.7 657
# apparent discrepancies are due to rounding errors
+ rate per 1000 live births
@ rate per 1000 total births (live births and stillbirths)
LIFE EXPECTANCY AT BIRTH (YEARS)*
Sex 199
0@2000@ 2005 2006 2007 200
8 2009 2010 2011 2012
Male 65.6 68.2 68.9 68.9 69.2 69.3 69.4 69.5 69.8 70.3

Female 73.4 75.3 75.6 75.7 76.0 76.2 76.6 76.7 77.1 77.2 Both Sexes 69.6 71.7 72.2 72.3 72.6 72.7 72.9 73.1 73.4 73.7
* Calculation based on 3 year period
@ based on census data

3737
ISLAND OF MAURITIUSESTIMATED MID-YEAR RESIDENT POPULATION OF TOWNS AND LARGE VILLAGES - 2012
MUNICIPAL COUNCIL AREA@ POPULATION VILLAGE COUNCIL AREA POPULATION
Port Louis 148,160 Triolet 24,340 Beau Bassin-Rose Hill 111,263 Goodlands 21,448 Vacoas-Phoenix 108,974 Central Flacq 18,078 Curepipe 84,967 Bel Air/Riviere Seche 18,035 Quatre Bornes 82,372 Mahebourg 17,143 Saint Pierre 16,500 Le Hochet 15,895 URBAN POPULATION 535,736 Bambous 15,028
(42.8%)
Baie du Tombeau 13,757
Rose Belle 12,695 RURAL POPULATION 717,264 Chemin Grenier 12,542
(57.2%) Riviere du Rempart 11,978
Plaine Magnien 10,844 TOTAL POPULATION 1,253,000 Surinam 10,694
@ according to boundaries subsequent to Proclamations No. 8 of 1990 and No. 15 of 1991
FERTILITY RATES 2008 - 2012
RATE 2008 2009 2010 2011 2012 Crude birth rate 12.7 11.8 11.5 11.2 11.0 General fertility rate 45.08 42.65 41.31 40.63 40.32 Total fertility rate 1.56 1.48 1.44 1.42 1.41 Gross reproduction rate 0.77 0.73 0.72 0.70 0.69 Net reproduction rate 0.75 0.72 0.70 0.69 0.67 Age-specific fertility rates: Age of women (Years) 15 - 19 32.9 31.4 29.3 28.9 28.2 20 - 24 88.4 82.2 77.9 75.0 70.3 25 - 29 96.1 91.1 91.1 89.3 89.2 30 - 34 60.5 59.5 58.4 59.1 61.7 35 - 39 26.5 25.0 25.3 26.0 25.9 40 - 44 6.8 6.7 6.2 5.8 5.8 45 - 49 0.3 0.5 0.3 0.5 0.5
Note : For definitions, see glossary
LIFE EXPECTANCY AT BIRTH (YEARS) *SEX 2006 2007 2008 2009 2010 2011 2012
MALE 68.9 69.1 69.1 69.3 69.4 69.7 70.2 FEMALE 75.7 75.9 76.1 76.5 76.7 77.0 77.3 BOTH SEXES 72.3 72.5 72.6 72.9 73.1 73.3 73.7
* Calculation based on a 3 year period38

ISLAND OF MAURITIUSESTIMATED MID-YEAR RESIDENT POPULATION BY AGE AND SEX - 2012
AGE-GROUP
(YEARS)MALE FEMALE BOTH SEXES
Number % Number % Number %
UNDER 1 6,971 1.1 6,805 1.1 13,776 1.1 1 - 4 29,520 4.8 29,157 4.6 58,677 4.7 5 - 9 44,680 7.2 43,002 6.8 87,682 7.0 10 - 14 47,905 7.8 46,059 7.2 93,964 7.5 15 - 19 50,527 8.2 50,017 7.9 100,544 8.0 20 - 24 51,337 8.3 49,680 7.8 101,017 8.1 25 - 29 45,268 7.3 44,456 7.0 89,724 7.2 30 - 34 54,396 8.8 54,917 8.6 109,313 8.7 35 - 39 46,896 7.6 47,874 7.5 94,770 7.6 40 - 44 44,759 7.3 45,789 7.2 90,548 7.2 45 - 49 48,779 7.9 49,179 7.7 97,958 7.8 50 - 54 42,643 6.9 44,039 6.9 86,682 6.9 55 - 59 36,173 5.9 37,803 5.9 73,976 5.9 60 - 64 27,648 4.5 30,823 4.8 58,471 4.7 65 - 69 16,025 2.6 19,843 3.1 35,868 2.9 70 - 74 10,217 1.7 13,800 2.2 24,017 1.9 75 - 79 7,212 1.2 10,884 1.7 18,096 1.4 80 - 84 3,627 0.6 6,522 1.0 10,149 0.8 85 & OVER 2,373 0.4 5,395 0.8 7,768 0.6 ALL AGES 616,956 100.0 636,044 100.0 1,253,000 100.0 UNDER 5 36,491 5.9 35,962 5.7 72,453 5.8 5 - 11 63,828 10.3 61,512 9.7 125,340 10.0 12 - 19 79,284 12.9 77,566 12.2 156,850 12.5 16 - 18 30,198 4.9 29,804 4.7 60,002 4.8 UNDER 15 129,076 20.9 125,023 19.7 254,099 20.3 UNDER 18 158,582 25.7 154,200 24.2 312,782 25.0 UNDER 21 190,709 30.9 185,559 29.2 376,268 30.0 15 - 49 341,962 55.4 341,912 53.8 683,874 54.6 15 - 59 420,778 68.2 423,754 66.6 844,532 67.4 15 - 64 448,426 72.7 454,577 71.5 903,003 72.1 15 & OVER 487,880 79.1 511,021 80.3 998,901 79.7 18 & OVER 458,374 74.3 481,844 75.8 940,218 75.0 21 & OVER 426,247 69.1 450,485 70.8 876,732 70.0 60 & OVER 67,102 10.9 87,267 13.7 154,369 12.3 65 & OVER 39,454 6.4 56,444 8.9 95,898 7.7 MEAN AGE 34.0 35.6 34.8 MEDIAN AGE 33.0 34.4 33.7 DEPENDENCY RATIO*
375.8 399.2 387.6
* [(Population under 15 + population 65 & over) / Population 15 - 64] x 1000
39
MAIN HEALTH INSTITUTIONS AS AT END OF 2012

PUBLIC SECTOR Island of Mauritius Island of Rodrigues
Regional (Principal) General Hospital
5 -
District General Hospital Ø 2 1 Health Centre (with in-patient service)
- 2
Psychiatric Hospital 1 - Chest Hospital 1 - Eye Hospital 1 - E.N.T. Centre * 1 - Cardiac Centre 1 - Community Hospital *** 2 - Mediclinic + 3 - Area Health Centre+++ 20 3****
Community Health Centre 116 14 Maternal and Child Health Clinic 145# 14###
Vaccination Clinic (babies) 159 15 Family Planning Clinic ## 149 17 Health Office 13 1 Dental Static Clinic (including oral surgery and orthodontics)
56 3
Dental Mobile Clinic 3 - Ayurvedic Clinic 5 - Dialysis Clinic** 6 1 Day Care Centre for the Immuno-suppressed
4 1
Methadone Substitution Therapy Indo Chine Centre++
4 -
Chest Clinic 1 -PRIVATE SECTOR Nursing Home (Private Clinic with in-patient service)
17 -
Pharmaceutical retail outlet 288 2 Dialysis Clinic (including those in private clinic)
7 -
Sugar Estate Dispensary 10 -Ø Souillac, Mahebourg and Q.Elizabeth Hospital
## excluding 16 supply centres
* administratively attached to Victoria Regional Hospital
# excluding 14 additional sub-centres for vaccination (EPI) without MCH services
*** Y. Cantin and Long Mountain ### excluding one centre with EPI service only
+ Belvedère, L'Escalier and Plaine Verte **** at QEH, M.Lubin & La Ferme HC** in Regional Hospital ++ one residential and 3 daycare +++ outside hospital compound
Bed Situation as at end of 2012INSTITUTION Island of
MauritusIsland of
RodriguesRepublic of Mauritius
Government Hospitals 3,566 190 3,756Private Clinics 705 - 705
TOTAL 4,271 190 4,461

REPUBLIC OF MAURITIUSSELECTED HEALTH MANPOWER STATISTICS AS AT END OF YEAR 2003 - 2012
Y E A R 2003 2004 2005 2006 2007 2008 2009 2010 2011 2012GRADE
NUM
BER
PER
10
,000
PO
PULA
TIO
NUM
BER
PER
10
,000
PO
PULA
TIO
NUM
BER
PER
10
,000
PO
PULA
TIO
NUM
BER
PER
10
,000
PO
PULA
TIO
NUM
BER
PER
10
,000
NUM
BER
PER
10
,000
NUM
BER
PER
10
,000
NUM
BER
PER
10
,000
NUM
BER
PER
10
,000
PO
PULA
TIO
NUM
BER
PER
10
,000
PO
PULA
TIO
N
DOCTOR Employed by
Mins. of Health@
765 6.2 775 6.3 777 6.2 856 6.8 844 6.7 852 6.7 887 6.9 967 7.5 970 7.5 1,000 7.7
- of which specialists
(208) (258) (263) (253) (257) (275) (277) (288) (284) (284)
In private practice
408 528 565 544 581 598 588 533 591 722 T O T A L 1,173 9.6 1,30
3 10.5 1,34
2 10.8
1,400
11.1 1,425
11.3
1,450 11.4
1,475 11.5
1,500 11.7
1,561 12.1 1,722 13.3
DENTIST Employed by
Mins. of Health
54 0.4 58 0.5 56 0.4 56 0.4 64 0.5 61 0.5 59 0.5 66 0.5 66 0.5 59 0.5
In private practice
100 109 116 137 164 174 191 194 202 242 T O T A L 154 1.3 167 1.3 172 1.4 193 1.5 228 1.8 235 1.8 250 2.0 260 2.0 268 2.1 301 2.3 PHARMACIST
Employed by Mins. of
Health
20 0.2 20 0.2 22 0.2 22 0.2 22 0.2 20 0.2 19 0.1 19 0.1 23 0.2 23 0.2
In private practice
259 266 266 280 305 328 367 381 385 409 T O T A L 279 2.3 286 2.3 288 2.3 302 2.4 327 2.6 348 2.7 386 3.0 400 3.1 408 3.2 432 3.3 QUALIFIED NURSE & MIDWIFE
Employed by Mins. of Health#
2,799 22.8 2,774 22.4 2,732 21.9 2,905 23.1 3,093 24.5
3,179 25.0
3,187 24.9
3,174 24.7
3,089 24.0 3,051 23.6
In Private practice
159 163 170 182 207 221 313 426 581 686
T O T A L 2,958 24.1 2,937
23.7 2,902
23.2
3,087
24.6 3,300
26.1
3,400 26.7
3,500 27.4
3,600 28.1
3,670 28.5 3,737 28.9
@ excluding doctors (included in figure in private practice) working under the " Bank of Doctors" scheme and Pre-Registration House Officers (333)
# including nurses who are qualified awaiting appointment

Source: Establishment Division/Medical Council/Nursing Council with adjustments for under/over reporting40

41 Selected Health Personnel in post at the Ministry of Health & Q L
as at end of 2012@
Cadre / Grade# Number Cadre / Grade# Number
Administrative Cadre 19 Community Health Development Motivator
5
Human Resource Cadre 30 Community Health Care Officer 124Executive Cadre (incl Senior officer) 52 Sanitary Engineer 4Officer (incl Office Supervisor) 252 Health Engineering Officer 15Confidential Secretary 29 Health Statistician 5Word Processing Cadre 55 Statistical Officer 9Office Care Attendant 60 Demographer 2Finance Cadre 47 Health Analyst 1Procurement & Supply Cadre 139 Hospital Administration Cadre 19
Internal Control Cadre 4 Blood Bank Cadre 18Health Records Cadre 411 Pathological Laboratory Assistant 12
Health Information, Education and Communication Cadre
12 Community Health Rehabilitation Officer
74
Medical Specialist 283 Medical Social Worker 12
Medical Officer (Non specialist) 717 Welfare Assistant 8
Dentist (including specialist) 59 Clinical Scientist (Biochemistry or Virology)
11
Pharmacist 23 Scientific Officer Vector Biology and Control Division
3
Ayurvedic Medical Officer 5 Vector Biology & Control Laboratory Technician (Entomology)
2
Nutritionist 13 Bio-Medical Engineering Technician 7
Occupational Therapy Cadre 25 Government Analyst 5
Speech Therapists & Audiologist 5 Technical Officer (Chemical Laboratory) 8
Speech and Hearing Therapy Assistant
9 Medical Laboratory Technician 208
Clinical Psychologist 5 Pharmacy Technician ( inc. Stores Manager)
223
Hospital Physicist 5 Public Health & Food Safety Inpector 141
Dental Assistant 73 Health Surveillance Officer 74
EEG Technician 1 Insecticide Sprayerman 82
ECG Technician 27 Rodent Control Cadre 7
Physiotherapist 15 Catering Cadre 22
Physiotherapy Assistant 28 Orthopaedic Technician (incl Assistant) 15
Medical Imaging Technologist 100 Surgical Technologist 5
Medical Imaging Assistant 49 Permanencier 15
Radiation Therapist 11 Ambulance Driver 84Nuclear Medicine Technologist 4 Ambulance Attendant 102
Nurse / Midwife Educator 12 Ward Assistant 123
Nursing Cadre (incl Psychiatry) 2,879 Cook 84Midwife 127 Hospital Care Attendant 1,527Public Health Nursing officer 38 Linen Officer 58
Specialised Aids Nurse 7 Laundry Attendant 18
Health Care Assistant (General) 1,012 Mortuary Attendant 8
Source: Establishment Division of the Ministry of Health & Quality of life# for each specified grade, the figures include officers in higher posts (e.g Health Inspector includes Senior, Principal etc.)@ a total of 13,080 officers were holding substantive posts at the Ministry of Health & QL, including hospitals and health centres etc.NB: exclude "Bank of Doctors/Nurses"

42 REPUBLIC OF MAURITIUS
MATERNAL AND CHILD HEALTH ACTIVITIES IN PUBLIC SECTOR - 2012 (excluding activities carried out at Regional Hospitals)
A C T I V I T Y
DOMICILIARY VISITS BY MIDWIFE/NURSE ANTENATAL 1,021 POSTNATAL 4,339 TOTAL DOMICILIARY VISITS 5,360 CASES REFERRED TO HEALTH CENTRES & HOSPITALS BY DOCTOR FOR SPECIALISED TREATMENT 10,835 BY MIDWIFE/NURSE AFTER ANTENATAL VISIT 8 BY MIDWIFE/NURSE AFTER POSTNATAL VISIT 17 TOTAL CASES REFERRED 10,860 EXAMINATIONS CARRIED OUT AT CLINIC ANTENATAL EXAMINATIONS BY MIDWIFE/NURSE First attendances 10,779 Subsequent attendances 50,049 ANTENATAL EXAMINATIONS BY DOCTOR* First attendances 11,429 Subsequent attendances 43,234 POSTNATAL EXAMINATIONS BY DOCTOR First attendances 5,881 Subsequent attendances 1,417 CHILDREN SEEN FOR GROWTH MONITORING Number of attendances 152,857 of whom reported underweight 232 of whom reported overweight 180 EXAM. OF CHILDREN UNDER 5 YEARS BY DOCTOR First attendances 7,944 Subsequent attendances 20,602 TOTAL ATTENDANCES AT
CLINIC 304,192
* of which 1,577 and 6,545 cases examined by specialists at first and subsequent attendances respectively.
STATISTICS RELATING TO THE EXPANDED PROGRAMME ON IMMUNIZATION - 2012
IMMUNIZATIONS PERFORMED BABIES B.C.G. 12,559 M.M.R. 12,674 D.P.T. & H.I.B, HEP. B & O.P.V: 1st dose 12,527 2nd dose 12,611 3rd dose 12,469 Booster dose (excluding Hep B) 11,232 D.T, O.P.V & HEP.B : 1st dose 88 2nd dose 121 3rd dose 150 Booster dose (excluding Hep B) 1,061 ATTENDANCES FOR IMMUNIZATION OF
CHILDREN (a) 75,49
2 PREGNANT WOMEN (including Regional Hospitals) TETANUS TOXOID: 1st dose 9,316 2nd dose 8,218 Booster dose (1 year after 2nd dose) 1,959 ATTENDANCES FOR IMMUNIZATION OF PREGNANT WOMEN (b) 19,49
3 TOTAL ATTENDANCES FOR IMMUNIZATION (a+b) 94,98
5 PRIMARY SCHOOL CHILDREN MMR (std I) 13,619 DT & OPV (std I) 13,886 TETANUS TOXOID (STD VI) 15,628
IMMUNIZATION OF PRIMARY SCHOOL CHILDREN 43,13

3

43 STATISTICS RELATING TO MATERNAL AND CHILD HEALTH ACTIVITIES
AT GOVERNMENT CLINICS BY DISTRICT - 2012 (excluding activities carried out at Regional Hospitals)
PO
RT L
OUIS
PA
MPL
EMOU
SSES
RI
VIER
E D
U RE
MPA
RT
FL
ACQ
GR
AND
POR
T
SA
VANN
E
PL
AINE
S W
ILHE
MS
M
OKA
BL
ACK
RIV
ER
IS
LAN
D O
F M
AURI
TIU
S DISTRICT
ACTIVITY
DOMICILIARY VISITS BY MIDWIFE/NURSE
ANTENATAL 82 150 34 25 271 156 262 18 23 1,021
POSTNATAL 484 934 819 396 263 186 710 283 264 4,339
TOTAL DOMICILIARY VISITS
566 1,084 853 421 534 342 972 301 287 5,360
CASES REFERRED TO HEALTH CENTRES &
HOSPITALS
BY DOCTOR FOR TREATMENT 974 818 1,093 1,138 1,022 764 2,824 493 1,101 10,227BY MIDWIFE/NURSE AFTER ANTENATAL VISIT - - - 2 - - 5 1 - 8BY MIDWIFE/NURSE AFTER POSTNATAL VISIT
- 3 6 1 - 1 3 1 2 17
EXAMINATIONS CARRIED OUT AT CLINIC
ANTENATAL EXAM. BY MIDWIFE/NURSE
First attendances 1,132 1,122 966 1,294 995 640 2,436 684 816 10,085
Subsequent attendances 5,222 5,082 4,876 6,240 3,160 3,044 9,441 3,925 4,139 45,129
ANTENATAL EXAM. BY DOCTOR*
First attendances 1,099 1,125 902 1,269 1,208 1,014 2,385 672 1,061 10,735
Subsequent attendances 4,895 3,597 3,344 5,789 2,801 2,169 9,319 2,880 3,516 38,310
POSTNATAL EXAM. BY DOCTOR
First attendances 609 991 776 1,010 56 125 868 492 373 5,300
Subsequent attendances 56 497 165 24 11 - 17 1 26 797
CHILDREN SEEN FOR GROWTH
MONITORING Total number of
attendances 13,434 18,479 16,111 24,949 11,870 6,807 32,189 12,416 9,455 145,71
0 Reported
underweight 8 2 - 121 22 5 21 30 22 231
Reported Overweight 13 4 - 78 10 2 23 29 21 180
EXAM. OF CHILDREN UNDER 5 YRS
BY DOCTOR First
attendances 763 1,149 922 1,008 944 598 1,478 596 452 7,910 Subsequent
attendances 1,711 3,173 3,212 3,155 1,447 986 4,139 1,336 1,251 20,410
TOTAL ATTENDANCES AT CLINIC
28,921 35,215 31,274 44,738 22,492
15,383
62,272 23,002 21,089
284,386
* includes cases examined by specialist at first and subsequent attendances respectively

44 STATISTICS RELATING TO MATERNAL AND CHILD HEALTH ACTIVITIES
AT GOVERNMENT CLINICS BY DISTRICT - 2012 (excluding activities carried out at Regional Hospitals)
DISTRICT
PORT
LOUI
S
PAM
PLE-
MOU
SSE
S
RIV.
DU
REM
PAR
T
FLAC
Q
GRAN
DPO
RT
SAV-
ANNE
PLAI
NES
WIL
HEM
S
MOK
A
BLAC
KRI
VER
TOTA
L
% ACTIVITY
REGISTRATION OF GESTATIONAL
AGE AT FIRST ATTENDANCE FOR ANTENATAL TREATMENT
3 months or less 333 332 294 328 342 131 793 241 236 3,030 30.0 Between 3 and 6 months 654 693 585 855 542 422 1,331 392 475 5,949 59.0
6 months and over 145 97 87 111 111 87 312 51 105 1,106 11.0 TOTAL FIRST ATTENDANCES 1,13
2 1,122
966 1,294
995 640 2,436
684 816 10,085
100.0
FIRST DETERMINATION OF HAEMOGLOBIN LEVEL (mg/dl) OF ANTENATAL CASES
below 9.0 32 51 68 38 27 26 59 18 32 351 4.09.0 to 9.9 109 100 113 133 52 72 132 30 58 799 9.0
10.0 to 10.9 319 236 212 346 153 148 426 183 193 2,216 25.111.0 to 11.9 337 348 283 402 308 178 691 229 205 2,981 33.7
12.0 or above 244 275 226 199 309 171 709 155 207 2,495 28.2TOTAL FIRST DETERMINATIONS 1,04
1 1,010
902 1,118
849 595 2,017
615 695 8,842 100.0
STATISTICS RELATING TO THE EXPANDED PROGRAMME ON IMMUNIZATION
BY DISTRICT - 2012
DISTRICT
PORT
LOUI
S
PAM
PLE-
MOU
SSES
RIV.
DU
REM
PART
FLAC
Q
GRAN
DPO
RT
SA-
VANN
E
PLAI
NES
WIL
HEM
S
MOK
A
BLAC
KRI
VER
TOTA
L
IMMUNIZATIONS
PERFORMED CHILDREN:
B.C.G.
1,383 1,315 1,187 1,484 1,090 706 2,869 833 978 11,845
M.M.R.
1,266 1,273 1,246 1,610 1,193 724 2,965 839 893 12,009
D.P.T & H.I.B, HEP. B & O.P.V:
1st dose 1,323 1,305 1,167 1,508 1,078 699 2,869 867 991 11,807 2nd dose
1,304 1,331 1,246 1,511 1,079 691 2,921 874 939 11,896
3rd dose 1,332 1,304 1,243 1,485 1,068 731 2,810 892 889 11,754 Booster dose#
1,003 1,130 1,172 1,543 1,090 662 2,576 745 731 10,652
D.T , O.P.V & HEP.B:
1st dose 12 - 3 4 5 7 20 3 33 87 2nd dose
15
5 2 2 3 10 34 8 42 121
3rd dose 17
7 4 1 6 8 53 10 44 150
Booster dose#
133 59 63 89 71 44 402 73 127 1,061
TOTAL ATTENDANCES FOR IMMUNIZATION OF CHILDREN
7,788 7,729 7,333 9,237
6,683
4,282 17,519
5,144
5,667
71,382
PREGNANT WOMEN *: TETANUS TOXOID: 1st dose 962 1,046 832 1,159 880 599 1,978 603 696 8,755 2nd dose 830 919 735 1,105 762 548 1,706 584 570 7,759 Booster dose
(1 year after 2nd dose)
202 257 293 279 107 62 433 196 99 1,928

TOTAL ATTENDANCES FOR IMMUNIZATIONS OF PREGNANT WOMEN
1,994 2,222 1,860 2,543
1,749
1,209 4,117 1,383
1,365
18,442
# Excluding Hepatitis * including immunizations carried out at Regional Hospitals

45ISLAND OF MAURITIUS
INDICATORS RELATED TO ANTENATAL CARE IN GOVERNMENT SERVICE
Gestational age at first attendance for antenatal care
YEAR % Of First Attendances by gestational age3 Months or less Between 3 and 6
Months6 Months or over
2003 26.6 62.7 10.7
2004 24.5 65.2 10.3
2005 23.0 65.9 11.1
2006 23.8 64.2 12.0
2007 23.9 63.6 12.5
2008 25.1 62.7 12.2
2009 25.7 61.1 13.2
2010 26.1 61.1 12.9
2011 25.4 62.6 12.0
2012 30.0 59.0 11.0
Haemoglobin level (mg/dl) at first determination of antenatal cases
YEAR % Antenatal Cases by Haemoglobin Level
Below 10.0 (Moderate or severe anaemia)
10.0 to 10.9 (Mild anaemia)
11.0 or above (Normal)
2003 14.0 24.6 61.4
2004 15.2 26.2 58.6
2005 13.5 24.9 61.6
2006 11.8 24.2 64.0
2007 13.1 25.5 61.4
2008 12.0 22.4 65.6
2009 13.4 21.9 64.7
2010 13.1 25.0 61.9
2011 14.2 24.0 61.8
2012 13.0 25.1 61.9

46 ISLAND OF MAURITIUS
IMMUNISATIONS REPORTED BY GOVT SERVICES AND PRIVATE INTERNATIONAL VACCINATION CENTRES2008 - 2012
YEAR DISEASE 2008 2009 2010 2011 2012 IMMUNIZED AGAINST TUBERCULOSIS (B.C.G.) 13,665 12,821 12,484 12,172 11,845
DIPHTHERIA, PERTUSSIS, TETANUS, POLIOMYELITIS & HEPATITIS B (D.P.T, H.I.B, HEP.B & O.P.V )
1st dose 14,599 12,642 12,277 12,098 11,807
2nd dose 14,669 13,088 12,487 12,087 11,896
3rd dose 14,635 13,376 12,487 11,896 11,754Booster Dose# (excluding HEP. B)
14,200 12,201 11,528 10,931 10,652
(DIPHTHERIA 1st dose 40 50 73 47 87
TETANUS, 2nd dose 37 65 58 80 121
POLIOMYELITIS & 3rd dose 28 106 100 101 150
HEP B ) Booster dose 19,187 16,344 16,395 15,288 14,364
( exclude HEP. B)
YELLOW FEVER 1,703 1,368 1,673 1,907 1,996
INFLUENZA@ 45,015 43,653 211,536 103,760 99,209
TETANUS $ 199,604 196,230
206,500 204,700 209,809
TYPHOID FEVER 1,275 1,072 2,051 788 724
INFECTIOUS HEPATITIS "A" 8,989 8,738 10,482 8,730 9,748
INFECTIOUS HEPATITIS "B"
661 1,159 481 436 817
518 1,057 371 559 844
409 758 483 328 446
543 1,224 370 445 421
91 136 96 78 86
117 175 184 184 133
MENINGITIS 2,525 1,849 2,948 3,340 3,296
MEASLES/ MUMPS/ RUBELLA (MMR) 30,093 28,147 27,515 26,432 25,587
@ include vaccination done by Ministry of Social Security for old age persons (see pg 49)$ Injured persons, primary school leavers and pregnant women (figures for 2010 and 2011 adjusted)
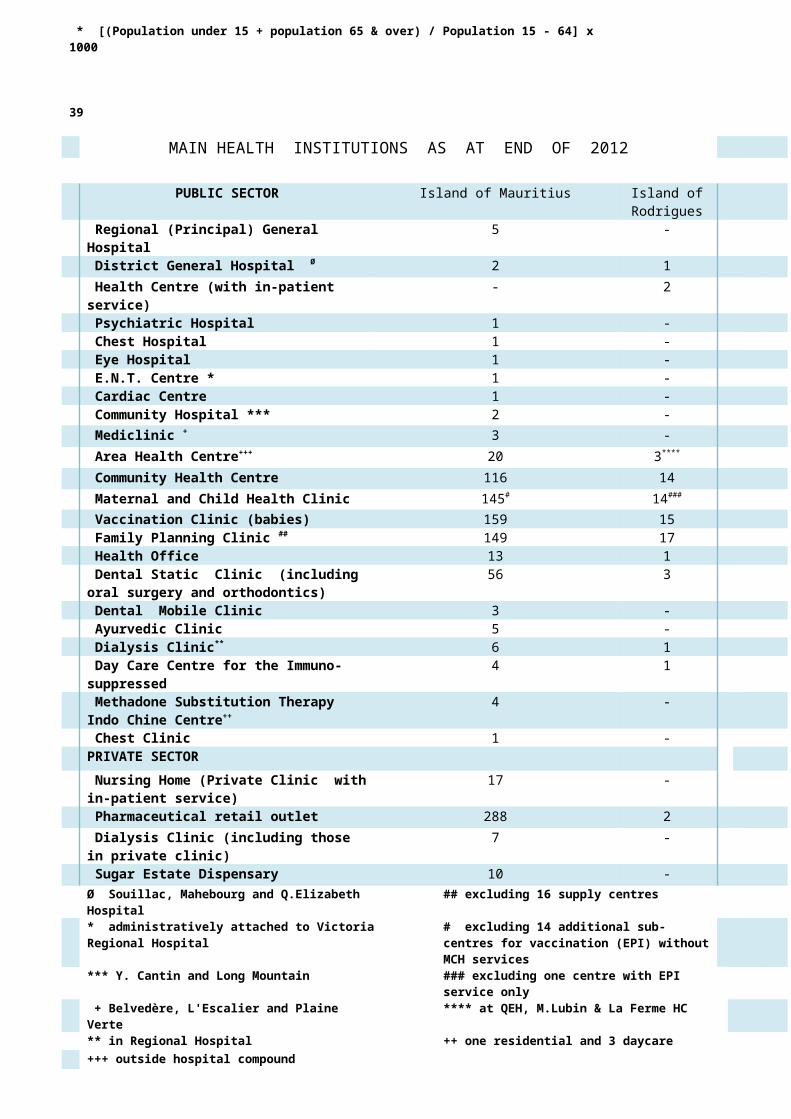
REPUBLIC OF MAURITIUS
EXPANDED PROGRAMME ON IMMUNISATION AT GOVERNMENT CLINICS
IMMUNISATION COVERAGE RATES AND PERFORMANCE INDICATORS - 2012
DISTRICTSurviving Infants#
BABIES PREGNANT WOMENBCG MMR DPT/HEPATITIS B/HIB/POLIO$ TETANUS TOXOID
Number
Coverage @
Number
Coverage @ Number Coverage @ Number Coverage &
Rate Rate (3rd dose) Rate (2nd & higher dose)
Rate
PORT LOUIS 1,454 1,383 95.1 1,266 87.1 1,332 91.6 1,032 70.3PAMPLEMOUSSES 1,571 1,315 83.7 1,273 81.0 1,304 83.0 1,176 74.2RIVIERE DU REMPART 1,407 1,187 84.4 1,246 88.6 1,243 88.3 1,028 72.3FLACQ 1,723 1,484 86.1 1,610 93.4 1,485 86.2 1,384 79.7GRAND PORT 1,290 1,090 84.5 1,193 92.5 1,068 82.8 869 66.6SAVANNE 832 706 84.9 724 87.0 731 87.9 610 72.1PLAINES WILHEMS 3,365 2,869 85.3 2,965 88.1 2,810 83.5 2,139 63.3MOKA 926 833 90.0 839 90.6 892 96.3 780 83.0BLACK RIVER 1,008 978 97.0 893 88.6 889 88.2 669 65.5ISLAND OF MAURITIUS 13,576 11,845 87.2 12,009 88.5 11,754 86.6 9,687 70.7RODRIGUES @ 711 714 100.0 665 93.5 715 100.0 490 70.0REPUBLIC OF MAURITIUS 14,287 12,559 87.9 12,674 88.7 12,469 87.3 10,177 70.7$: Excluding 150 doses of DT - POLIO ( 3rd dose )
@ based on surviving infants
# : live births less infant deaths registered in 2012
& based on estimated pregnant women
NB:The relatively high percentages observed in Rodrigues are most probably due to return to Rodrigues of babies born in the Island of Mauritius
DISTRICT PERFORMANCE - 2012 GOVERNMENT CLINICS
Coverage Rate for DPT 3rd dose
Less than 80% 80% to 89% 90% and above
Number of districts - 7 3
47

REPUBLIC OF MAURITIUS48
EXPANDED PROGRAMME ON IMMUNIZATION AT GOVERNMENT CLINICS
IMMUNISATION** COVERAGE RATES
1994 - 2012
VACCINE
BABIES ( 0-1 year ) PREGNANT WOMENBCG DPT, HEPATITIS B & HIB#
(3rd dose)POLIO (3rd dose) MMR* TETANUS TOXOID
(2nd & higher dose)
YEAR Mauritius
Rodrigues
Republic of
Mauritius
Mauritius
Rodrigues
Republic of
Mauritius
Mauritius
Rodrigues
Republic of
Mauritius
Mauritius
Rodrigues
Republic of
Mauritius
Mauritius
Rodrigues
Republic of
Mauritius
1994 86.5 81.2 86.3 88.7 92.1 88.9 89.1 93.4 89.3 85.4 86.8 85.4 78.4 80.5 78.41995 86.0 100.0 86.3 92.5 96.4 92.7 93.0 98.6 93.3 89.1 88.7 89.4 81.5 77.7 81.41996 86.3 94.3 86.5 89.5 99.2 89.8 89.7 100.0 90.1 61.0 67.2 61.2 77.9 75.2 77.81997 86.7 100.0 87.0 90.0 97.2 90.2 90.2 97.8 90.5 87.1 88.4 87.1 70.5 77.1 71.01998 86.6 98.1 86.9 89.2 96.8 89.5 89.6 97.4 89.9 84.6 92.9 84.9 76.9 78.3 77.01999 86.1 98.2 86.4 85.0 89.8 85.1 85.4 90.2 85.6 79.7 82.7 79.8 74.9 71.1 74.82000 87.2 96.7 87.5 87.3 93.9 87.7 87.4 94.4 88.0 84.3 76.7 84.0 75.3 79.9 75.52001 88.0 100.0 88.3 92.0 99.9 92.7 92.2 99.9 92.6 89.2 100.0 89.9 73.8 81.0 74.22002 86.9 93.0 87.1 88.1 93.0 88.3 88.5 93.0 88.6 84.5 99.0 85.1 71.5 76.2 71.72003 91.9 97.3 92.1 92.0 100.0 92.3 92.2 100.0 92.6 93.5 93.5 93.5 73.2 75.3 73.32004 89.8 95.8 90.1 88.4 93.0 88.6 88.8 94.7 89.2 88.5 91.0 88.6 75.4 74.1 75.02005 90.1 99.6 90.5 87.4 98.2 87.9 87.9 82.9 87.6 87.9 100.0 88.6 80.2 72.8 79.82006 89.3 100.0 89.8 88.2 94.3 88.5 89.8 95.3 90.0 92.2 97.8 92.4 81.9 78.2 81.82007 90.6 96.3 90.9 88.7 98.1 89.2 88.7 98.1 89.2 91.4 91.1 91.4 83.4 79.1 83.22008 90.6 100.0 91.4 97.0 100.0 97.8 97.2 100.0 97.8 90.0 100.0 90.9 86.3 82.2 86.12009 88.9 100.0 89.4 92.7 100.0 93.4 93.4 100.0 93.4 92.3 100.0 93.0 82.2 89.0 82.52010 88.4 100.0 89.0 88.4 100.0 89.1 89.1 100.0 89.8 88.5 92.7 88.7 79.5 81.9 79.62011 88 100.0 88.4 86.1 100.0 86.3 86.8 100.0 87 88.9 93.0 89.0 75.5 74.6 75.42012 87.2 100.0 87.9 86.6 100.0 87.3 87.7 100.0 88.3 88.5 93.5 88.7 70.7 70.0 70.7
** See Glossary for full name of vaccines # With Hepatitis B as from 1996 & HIB from 2006 * In 1996, Measles was gradually replaced by MMR

49
ISLAND OF MAURITIUSDISTRIBUTION OF IMMUNIZATIONS REPORTED IN 2012
BY SECTION OF POPULATION COVERED DISEASE
IMMUNIZED AGAINST
POPULATION COVERED NUMBER OF IMMUNIZATIONS
Govt Service
s
Private International Vaccination
Centres#
TOTAL
TUBERCULOSIS (B.C.G) Babies attending M.C.H. Clinics 11,845 - 11,845 DIPHTHERIA, PERTUSSIS,
TETANUS,HIB POLIOMYELITIS & HEPATITIS B ( D.P.T, H.I.B, HEP. B
& O.P.V)
Babies 1st dose 11,807 - 11,807 attending 2nd dose 11,896 - 11,896
M.C.H. Clinics 3rd dose 11,754 - 11,754 Booster dose
(Excluding HEP.B)
10,652 - 10,652
Babies 1st dose 87 - 87 DIPHTHERIA attending 2nd dose 121 - 121 TETANUS, M.C.H. Clinics 3rd dose 150 - 150
POLIOMYELITIS Babies attending M.C.H. Clinics
Booster dose (exclude Hep. B)
1,061 - 1,061
& HEPATITIS B Primary Schools New Entrants
13,294 - 13,294
(D.T, O.P.V & HEP B) Persons travelling abroad - 9 9 YELLOW FEVER Persons travelling abroad 1,731 265 1,996
INFLUENZA Old persons* 80,000 - 80,000
(Trivalent inc AH1N1) Pregnant women, children between 6 months to 2 years, health personnel, patients with
chronic condition@, etc
19,155 - 19,155
Persons travelling abroad - 54 54 TETANUS Pregnant women attending
Antenatal Clinics 1st dose 8,755 - 8,755
2nd dose 7,759 - 7,759 Booster dose 1,928 - 1,928
Primary School Leavers 15,297 - 15,297 Injured persons attending
Health Institutions176,07
0 - 176,07
0
TYPHOID FEVER Persons travelling abroad 525 199 724 INFECTIOUS HEPATITIS "A" Persons travelling abroad 9,514 234 9,748
INFECTIOUS HEPATITIS "B" Mainly Dialysis Patients, Medical and Para-medical
Staff, Policemen and Firemen
1st dose 817 - 817 2nd dose 841 - 841
3rd dose 446 - 446
4th & higher dose
421 - 421
Booster dose 86 - 86 Persons travelling abroad Unspecified
dose- 133 133
MENINGITIS Persons travelling abroad 3,124 172 3,296
MEASLES/MUMPS/RUBELLA (MMR) Children attending M.C.H. Clinics 12,009 - 12,009
Primary Schools New Entrants 13,559 - 13,559
Persons travelling abroad - 19 19
* aged 60 years & over ( by Ministry of Social Security) include AH1N1 vaccine@ persons aged less than 60 years ( by Ministry of Health)# City Clinic and Fortis Darne Clinic

ISLAND OF MAURITIUSSUMMARY OF WORK PERFORMED IN HOSPITALS - 2012
HOSPITAL
NUM
BER
OF
ADM
ISSI
ONS
Aver
age
leng
thof
stay
(day
)
Num
ber
ofDe
aths
Daily
ava
ilabl
e be
ds
PERC
ENTA
GE O
OOCC
UPAN
CY
NUMBER OF OPERATIONS$ PERFORMED
CASES SEEN BY DOCTOR
Accid
ent &
Emer
genc
yDe
partm
ent
Sorte
d OP
D
Unso
rted
OPD
TOTA
L
IN-P
ATIE
NTS
OUT-
PATI
ENTT
S
DR. A.G. JEETOO (P.Louis) 36,277 3.0 920 501 76.6 5,696 - 243,954 141,910 142,264 528,128
S.S.R.N. (Pamplemousses) 29,774 3.1 832 473 64.1 6,143 - 157,981 170,258 147,795 476,034
FLACQ (Central Flacq) 26,721 3.0 488 330 75.9 5,056 - 116,312 112,887 149,119 378,318
J. NEHRU (Rose Belle) 32,013 3.2 690 457 66.0 4,735 - 145,046 122,144 54,662 321,852
VICTORIA & P.M.O.C.(Quatre Bornes)
48,032 3.7 1,482 699 88.7 10,048 - 325,693 241,283 95,358 662,334
MAHEBOURG 5,298 1.5 1 60 36.4 - - 98,539 15,226 - 113,765
SOUILLAC 5,711 1.0 9 48 34.2 - - 83,898 18,904 - 102,802
SUB-TOTAL (GENERAL)
183,826 3.1 4,422 2,568 73.6 31,678 - 1,171,423 822,612 589,198 2,583,233
BROWN SEQUARD (PSYCHIATRY) (Beau Bassin)
Lo Long stay patpatients
38 219.3 8 453 93.2 - - 24,872 30,667 - 55,539
Others 4,453 12.2 9 241 69.0
POUDRE D'OR (CHEST) 857 17.1 48 61 73.4 - - - - - - S. BHARATI (EYE) (Moka) 7,126 1.7 1 59 57.5 5,665 1,249 145,148 67,458 - 212,606 E.N.T. CENTRE (Vacoas) 5,350 2.0 2 63 51.6 1,767 3,590 147,892 10,686 - 158,578 CARDIAC CENTRE (Pamplemousses) 3,086 3.1 79 67 67.6 1,341 - - 21,813 - 21,813 TOTAL (GENERAL + SPSPECIALISED)
204,736 3.3 4,569 3,512 75.0 40,451 4,839 1,489,335 953,236 589,198 3,031,769
50
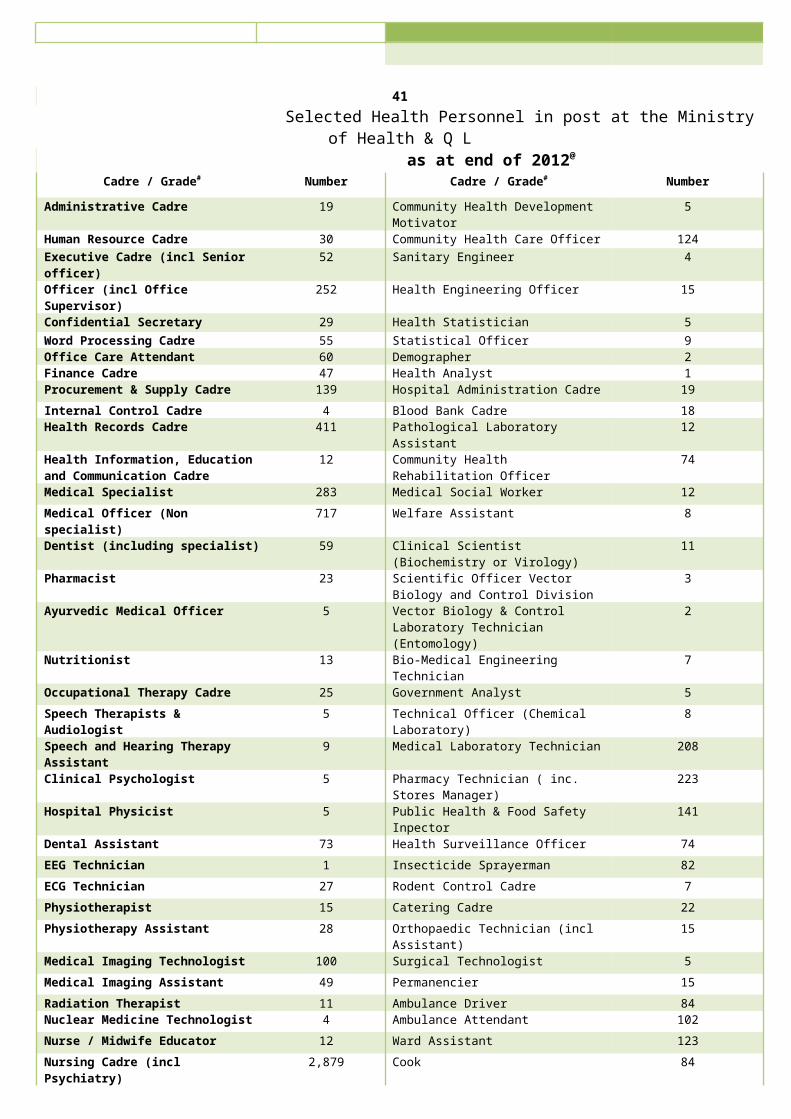
51
ISLAND OF MAURITIUSHAEMODIALYSIS, CT-SCAN AND MRI PERFORMED ON GOVERNMENT HOSPITAL
PATIENTS - 2012
HOSPITAL/CENTRE
NUMBER OF HAEMODIALYSIS
PERFORMED*
NUMBER OF EXAMINATIONS
CT - SCAN MRI
Dr. A.G. JEETOO 16,641 - 457
SSSRN 22,694 938@ 833
FLACQ 22,112 - -
J. NEHRU 16,958 3,141 -
VICTORIA 25,768 6,313 1,674
SOUILLAC# 3,712
SUB TOTAL 107,885 10,392 2,964
PRIVATE 30,779 2,012 123
TOTAL 138,664 12,404 3,087
* At the end of the year, there were 758 patients on dialysis in the 5 regional hospitals and Souillac Hospital; another 212 government hospital patients were on dialysis in private centres.
# Operational as from April 2012
@ Apparatus out-of-order from February to September 2012
Non-traumatic amputations performed in government hospitals
CATEGORY
2008 2009 2010 2011 2012
Mal
e
Fem
ale
Both
Se
xes
Mal
e
Fem
ale
Both
Se
xes
Mal
e
Fem
ale
Both
Se
xes
Mal
e
Fem
ale
Both
Se
xes
Mal
e
Fem
ale
Both
Se
xes
New amputees … … 25
3 … … 281 … … 292 … … 284 … … 332
Re-amputation … … 11
3 … … 127 … … 118 … … 150 … … 167
TOTAL (Amputations)
260 106 36
6265 143 408 30
2108 410 320 114 434 35
7 142 499
of which diabetic
219 100 31
9231 129 360 27
5105 380 281 108 389 31
9 135 454
% Diabetic 84.2 94.3 87.
287.2 90.2 88.2 91.
197.2 92.7 87.8 94.7 89.6 89.
4 95.1 91.0

52 ISLAND OF MAURITIUS
WORK PERFORMED IN MATERNITY SECTIONS OF GOVERNMENT GENERAL HOSPITALS 2000- 2012
DELIVERY BIRTH
NORMAL#
INSTRU- MENTAL CAESARIAN
SECTIONTotal
LIVE BIRTHSTILL- BIRTH TOTAL
No.
of which Low Birthweight *
No.
Ratex
No.
% ofTotalbirths
@
in WholeIsland
No No. No.%
Total +
No. %
2000
11,944 382 4,508 26.8
16,834 16,747 2,400 14.3 215
12.7 16,962
86.1

2001
11,194 430 4,510 28.0
16,134 16,012 2,283 14.3 210
12.9 16,222
85.7
2002
11,305 374 4,714 28.8
16,393 16,331 2,335 14.3 177
10.7 16,508
86.1
2003
10,429 322 4,960 31.6
15,711 15,701 2,358 15.0 175
11.0 15,876
85.5
2004
10,157 231 5,117 33.0
15,505 15,499 2,415 15.6 150
9.6 15,649
85.5
2005
9,831 205 4,851 32.6
14,887 14,854 2,551 17.2 164
10.9 15,018
84.0
2006
8,621 140 4,953 36.1
13,714 13,723 2,152 15.7 122
8.8 13,845
82.1
2007
8,129 155 5,071 38.0
13,355 13,328 2,304 17.3 152
11.3 13,480
82.5
2008
7,386 127 4,984 39.9
12,497 12,467 2,086 16.7 156
12.4 12,623
80.1
2009
6,548 140 4,919 42.4
11,607 11,597 2,188 18.9 115
9.8 11,712
79.4
2010
6,383 145 4,633 41.5
11,161 11,168 2,145 19.2 90 8.0 11,258
78.3
2011
6,338 145 4,399 40.4
10,882 10,870 2,084 19.2 110
10.0 10,980
77.7
2012
6,095 177 4,367 41.0
10,639 10,645 2,039 19.2 119
10.2 10,764
77.5
* birthweight of less than 2,500 grammes @ live births + stillbirths x per 1,000 total live births and stillbirths + CS Rate
(%)
# mostly by midwife
NB: in 2012, (a) there were 222 twin and 21 triplet babies (b) 571 births were reported as "premature" (5.3%)
Livebirths registered among teenagers*
2008 2009 2010 2011 2012
Live births among mothers aged <20 years
1,667 1,640 1,519 1,469 1,402
% of all live births registered 10.7 11.2 10.6 10.5 10.2
* Source: Statistics Mauritius
53
ISLAND OF MAURITIUS
ACTIVITY OF THE X-RAY DEPARTMENT*-2012
Examination Number Examination Number

Extremities 221,039 Scintigraphy (Nuclear medicine)
1,138
Chest 149,550 Angioplasty 945Skull 71,285 Mammography 634Spine 68,701 Barium Meal 568Abdomen 41,869 Pyelogram (intravenous) 545Echography 22,987 Barium Enema 482Angiogram 3,214 Barium Swallow 235C-Arm 1,781 Hystero-salpingo-gram 97NB: a total of 598,525 (601,272 in 2011) examinations were performed by the X-Ray Department including MRI and CT-Scan* See page 51 for figures pertaining to MRI and CT-Scan NB: Cystogram (23), Urethrogram (43), and a few other examinations with lesser frequency were also carried out in 2012.
OUT-PATIENT ATTENDANCES# AT SPECIALISED CLINICS -2012
Specialty Number Specialty NumberOrthopaedics 135,842 Oncology 33,128General Medicine 121,313 Chest Disease 30,604Cardiology 104,578 ENT 23,807Psychiatry 91,154 Physical Medicine 22,268General Surgery 90,205 Neurosurgery/Neurology 7,742Ophthalmology@ 74,304 Cardiac Surgery 6,268Gynaecology 70,796 Plastic Surgery 4,262Obstetrics 48,862 Endocrinology 3,953Dermatology 46,787 Nephrology/Renal
Transplant3,708
Paediatrics 40,899 Geriatrics 1,291 # Total attendances= 992,205 (1,004,110 in 2011) of which 19,549 cases of NCD seen at District and Community Hospitals (in 2012)@ excluding 10,885 refractions only
OUT-PATIENT ATTENDANCES AT CERTAIN ANCILLIARY SERVICES
Service Number2010 2011 2012
Physiotherapy 89,951 91,794 95,749Occupational Therapy 44,647 44,692 39,911Speech Therapy 15,142 13,544 11,403Audiology 10,595 12,793 11,581Podiatry 2,086 2,659 2,531Retinal screening@ 6,972 13,705 21,722@ increases due to extension of services
54

ATTENDANCES* FOR THE TREATMENT OF COMMON DISEASES AND INJURIESAT THE COMMUNITY HOSPITALS, MEDICLINICS, AREA HEALTH CENTRES AND COMMUNITY HEALTH
CENTRES - 2012Re
gio
n.
CENTRE AND DISTRICT TOTAL
TOTAL ATTEN-DANCES
Regi
on.
CENTRE AND DISTRICT TOTAL
TOTAL ATTEN-DANCES
Regi
on.
CENTRE AND DISTRICT TOTAL
TOTAL ATTEN-DANCES
FLACQ PLAINES WILHEMS PAMPLEMOUSSES3 LADY RAMGOOLAM
MEDICLINIC100,504 1 B.BASSIN (L.Twining St) AHC 75,381 2 L.MOUNTAIN COMM HOSPITAL 113,095
3 FLACQ AHC 39,250 5 CASTEL AHC 64,067 2 TRIOLET AHC 123,4303 BEL AIR AHC 76,816 5 CUREPIPE ROAD AHC 50,191 2 Arsenal CHC 12,8893 BRAMSTHAN AHC 52,520 5 QUATRE BORNES AHC 55,962 1 Baie Du Tombeau CHC 44,2723 Belle Mare CHC 15,255 5 ROSE HILL AHC 46,784 2 Bon Air CHC 18,1033 Bon Accueil CHC 26,355 5 VACOAS (La Caverne) AHC 44,118 2 Calebasses (Human S.Trust) CHC 18,0753 Camp De Masque Pavé CHC 22,478 5 Bassin CHC 26,692 2 Congomah CHC 7,5203 Camp Ithier CHC 14,744 1 Beau Bassin (Odette Leal) CHC 35,530 2 Crève Coeur CHC 9,9783 Caroline CHC 13,679 1 Coromandel CHC 11,603 2 D'Epinay CHC 11,3283 Clemencia CHC 11,223 5 Floreal CHC 17,784 2 Fond Du Sac CHC 24,5463 Dr Saxena (Pellegrin) CHC 15,512 5 Forest Side CHC 38,074 1 Le Hochet (S.K.Patel) CHC 25,1423 Ecroignard CHC 9,905 5 Glen Park CHC 40,885 2 Pamplemousses CHC 22,8193 G.R.S.E CHC 12,884 5 Highlands CHC 17,664 2 Petite Julie CHC& 1,6033 Lalmatie CHC 38,146 5 Midlands CHC 27,094 2 Plaine Des Papayes CHC 19,7823 La Lucie Roy CHC 16,192 5 Pandit Sahadeo (Vacoas) CHC 37,009 2 Pointe Aux Piments CHC 15,7063 Laventure CHC 17,018 5 Phoenix CHC 22,844 2 Terre Rouge CHC 24,8633 Mare La Chaux CHC 15,618 5 SSR (Ollier) CHC 21,849 2 Trou aux Biches 5,6483 Medine Camp De Masque CHC 19,389 5 Stanley CHC 74,564 2 Villebague CHC 13,8113 Olivia CHC 15,513 5 Trefles (Jacques Rougeot)CHC$ 2,603 TOTAL 512,6103 Pellegrin (R.F.Palmer) CHC 10,036 5 Swami Krishnanand (H/Rood)
CHC21,922
3 Poste De Flacq CHC 27,329 5 Vacoas (Club Road) CHC 15,900 BLACK RIVER 3 Quatre Cocos CHC 18,046 5 Wooton CHC 20,244 5 DR CANTIN Comm. HOSPITAL 66,0563 Quatre Soeurs CHC 16,645 TOTAL 768,764 1 BAMBOUS AHC 66,0491 St Julien D'Hotman CHC 16,825 1 Albion CHC 14,8903 St Julien Village CHC 11,167 MOKA 5 Beaux Songes CHC 21,2693 Sebastopol (Lesur) CHC 15,234 3 DR MAHLER(Mt.
Blanche)AHC93,775 5 Case Noyale CHC 17,387
3 Trou D'Eau Douce CHC 19,440 1 QUARTIER MILITAIRE AHC
35,075 5 Chamarel CHC 8,641
1 DR QUENUM (St Pierre) AHC
47,750 5 Flic En Flac CHC 13,236
TOTAL 667,723 1 Camp Thorel CHC 24,119 5 Shri R Jugnauth (Palma) CHC 19,5341 Dagotiere CHC 32,697 5 La Gaulette CHC 18,431
SAVANNE 5 Dubreuil CHC 14,270 1 M. Leal (La Tour Koenig) CHC 26,1874 CHEMIN GRENIER AHC 66,594 1 L'Avenir CHC 17,198 1 Petite Riviere CHC 56,6594 TYACK AHC 59,593 1 La Laura CHC 7,487 5 Pointe Aux Sables CHC 18,7394 Baie Du Cap CHC 16,895 1 M.de Speville (Esp/Q.M.)
CHC10,123 5 Tamarin CHC 10,601
4 Camp Diable CHC 17,911 3 Melrose CHC 8,441 4 Chamouny (Prof.Cerene) CHC 17,043 1 Moka CHC 25,901 TOTAL 357,6794 Grand Bois CHC 30,749 1 Pailles CHC 39,773
1 Pailles West CHC$ 400 PORT LOUIS
TOTAL 208,785 1 Providence CHC 16,700 1 DR Hyderkhan(P/Verte) Mediclinic
97,870
1 Ripailles CHC 10,816 1 DR BOULOUX (Cassis) AHC 82,200RIVIERE DU REMPART TOTAL 384,525 1 Cité La Cure (Dr Mahler) CHC 31,9642 GOODLANDS AHC 115,446 1 Eastern CHC 15,7452 RIVIERE DU REMPART AHC 99,157 GRAND PORT 1 Roche Bois CHC 27,7952 Amaury CHC 18,330 1 Sainte Croix CHC 75,3902 Barlow CHC 9,904 4 L'ESCALIER MEDICLINIC 49,551 1 Tranquebar CHC 30,1352 Belle Vue Maurel CHC 16,949 4 ROSE BELLE AHC 35,545 1 Vallee Des Pretres CHC 23,6912 Cap Malheureux CHC 21,985 4 Bambous Virieux CHC 15,435 1 Vallee Pitot CHC 27,3102 Cottage CHC 29,490 4 Cluny CHC 12,404 2 Esp.Trébuchet (K.Ramdanee)
CHC21,566 4 Grand Sable CHC 29,812
2 Grand Bay CHC 26,945 4 Mare D`Albert CHC 24,144 TOTAL 412,1002 Grand Gaube CHC 26,736 4 Mare Tabac CHC 12,6102 Petit Raffray CHC 33,352 4 New Grove CHC 26,367 2 Piton CHC 41,643 4 Nouvelle France CHC 18,208 ISLAND TOTAL ** 4,201,676 2 Plaines Des Roches CHC 19,040 4 Old Grand Port CHC 22,786 of which in Health
Regions $$
2 Poudre D'Or CHC 15,345 4 Plaine Magnien CHC 37,720 Region 1 (Dr Jeetoo Hospital)
1,052,684
2 Roches Noires CHC 30,885 4 Riviere Des Creoles CHC 18,454 Region 2 (SSRN Hospital) 985,338 2 Vale CHC 15,369 4 Riviere Du Poste CHC 11,952 Region 3 (Flacq Hospital) 753,123 4 Saint Hubert CHC 16,149 Region 4 ( J.Nehru
Hospital)556,133
4 Trois Boutiques CHC 16,211 Region 5 (Victoria Hospital)
854,398
TOTAL 542,142 TOTAL 347,348 $$ excluding Out-patient
at hospitals
* based on monthly returns received and adjusted for under/over reporting and yearly trends.$ opened in Nov 2012 & opened in Aug 2012 # opened in March 2012.** at Community Hospitals (179,151), Mediclinics ( 247,925), Area Health Centre (1,329,703 ) and Community Health Centre ( 2,439,249).** excluding MCH (304,192), Vaccination (94,985), Family Planning ( 84,101) and Dental (225,949)** of which (2,087,144) seen by doctor, that is, 40.6% of all cases seen by doctor in government outpatient services (5,136,357)

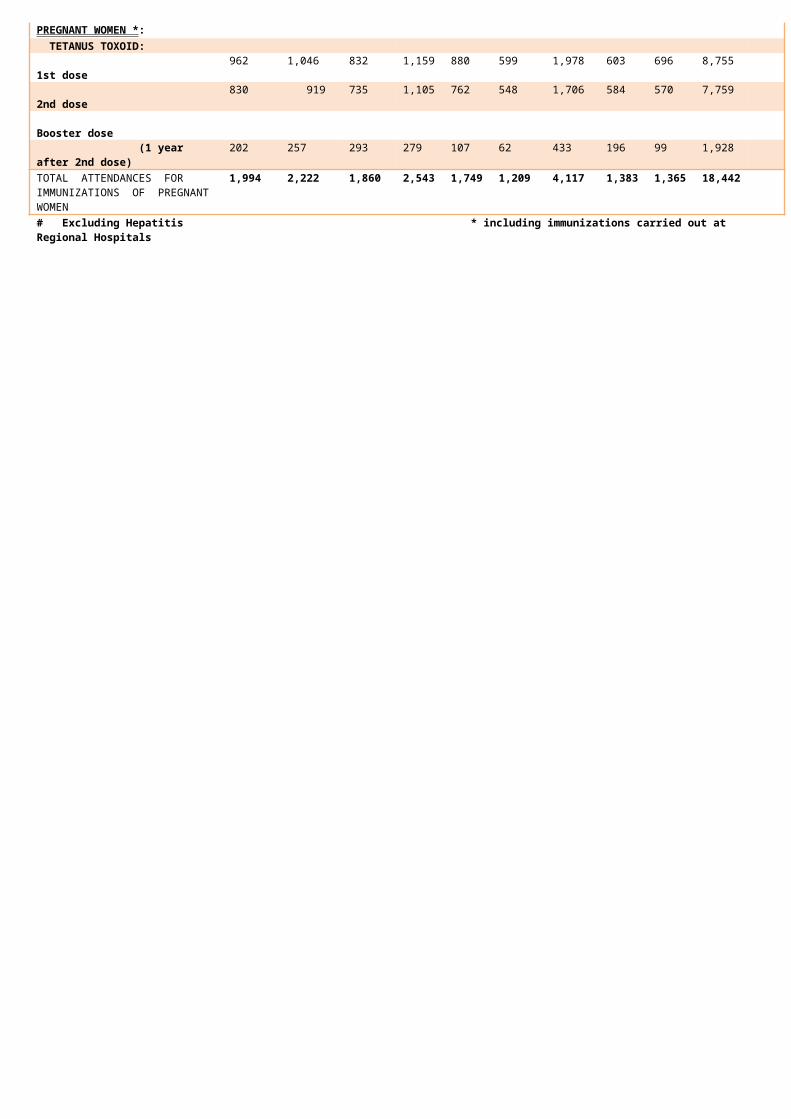
55
SUMMARY ON PRE-PRIMARY SCHOOL HEALTH PROGRAMME - 2012
DISTRICT ACTIVITY AND RESULT
PORT
L
OUIS
PAM
PLE-
MOU
SSES
RIV.
DU
REM
PART
FLAC
Q
GRAN
D P
ORT
SAVA
NNE
PLAI
NES
WIL
HEM
S
MOK
A
BLAC
K RI
VER
ISLA
ND
OF
MAU
RITI
US
ROD
RIG
UES
REPU
BLIC
OF
MAU
RITI
US
SCREENING BY NURSING STAFF
No. of schools visited 43 67 78 67 42 33 209 39 37 615 13 628 No. of children on roll 1,69
8 2,071 2,576 2,39
3 1,35
6 1,34
9 7,32
8 1,34
5 1,564 21,68
0 753 22,43
3 No. of children screened 1,45
1 1,783 2,356 2,17
1 1,21
6 1,18
0 6,41
6 1,16
3 1,357 19,09
3 580 19,67
3 Scabies 4 5 3 2 6 8 21 1 8 58 7 65
Nits and lice 58 76 85 125 54 41 345 88 84 956 -
956
Dental carries 234 433 419 489 231 172 780 227 217 3,202 143 3,345 No. of children referred to
dentist1 433 358 240 236 164 617 177 164 2,390 135 2,525
No. of children referred to M.C.H. clinics for immunization
87 41 41 2 5 7 276 26 60 545 -
545
SUMMARY ON PRIMARY SCHOOL HEALTH PROGRAMME - 2012SUMMARY ON PRIMARY SCHOOL HEALTH PROGRAMME 2012
Normal Schools
Spec
ialis
ed
Scho
ols#
ISLA
ND
OF
MAU
RITI
US
ROD
RIG
UES
REPU
BLIC
OF
REPU
BLIC
M
AURI
TIU
S
PO
RT L
OUIS
PAM
PLEM
OUSS
ES
RIV.
DU
REM
PART
FLA
CQ
G
RAND
PO
RT
S
AVAN
NE
PL
AINE
S W
ILHE
MS
MOK
A
BL
ACK
RIVE
R
SCREENING BY NURSING STAFF
No. of schools visited# 34 32 25 36 30 18 65 25 18 23 283 15 298 No. of children on roll 13,99
69,592
8,826
8,088 9,313 6,073
27,082 5,785
5,303
629 94,687
4,913
99,600
No. of children screened 7,148 8,620
8,290
7,046 5,494 3,708
11,817 3,636
3,411
377 59,547
4,325
63,872
Scabies 6 16 14 12 36 32 29 7 27 2 181 74 255 Nits and lice 198 689 772 603 431 370 942 243 364 28 4,640 22 4,662
Dental problems 1,106 1,930
2,175
2,268 1,075 435 1,817 745 754 69 12,374
942 13,316
No. of children referred to dentist
28 1,878
2,117
2,197 1,065 432 1,162 494 625 53 10,051
653 10,704
VISION SURVEY (Std III,V& VI)
No. of children screened 3,247 2,738
2,790
3,959 2,806 1,832
8,297 2,113
1,677
12 29,471
1,933
31,404
No. with defective vision 99 67 174 181 146 74 358 92 28 1 1,220 33 1,253 No. referred to specialists 21 66 63 169 146 74 328 45 26 1 939 43 982 IMMUNIZATIONS PERFORMED
D.T - POLIO (New entrants)
1,785 1,513
1,154
1,698 1,208 727 3,798 742 601 68 13,294
689 13,983
MMR (New entrants) 1,861 1,505
1,181
1,708 1,246 732 3,900 764 614 48 13,559
697 14,256
Tetanus Toxoid (School leavers)
1,945 1,592
1,432
1,996 1,430 878 4,406 896 652 70 15,297
667 15,964
# mostly in Plaines Wilhems (11), Port Louis(4), Riviere du Rempart(3), Pamplemousses & Savanne (2) and Black River (1)
DISTRICT
ACTIVITY AND RESULLT

56Primary School Health Statistics - 2012
ISLAND OF MAURITIUSSCREENING BY NURSING STAFF IN : NORMAL SCHOOLS Total
STANDARD: I II III IV V VI SS#
Number of children on roll 15,299 13,063
16,166
13,629 16,872 19,029 629 94,687
Number of children screened 13,916 2,838 12,337
3,271 15,606 11,202 377 59,547
Number of children having the following : Scabies 63 19 41 8 38 10 2 181
Nits and/or lice 774 279 1,009 287 1,599 664 28 4,640
Dental caries 3,118 670 2,895 724 3,722 1,176 69 12,374
of whom referred to dentist 2,349 642 2,349 717 2,849 1,092 53 10,051
VISION SURVEY ON CHILDREN IN:
III V VI SS Total
STANDARD:Number of children surveyed 14,262 15,160 49 12 29,47
1Number of children with visual problem
469 750 0 1 1,220
of whom referred to eye specialist
395 543 0 1 939
IMMUNIZATION PERFORMED Normal
SchoolsSS# TOTAL
MMR (Standard I) 13,226 68 13,294D.T - Polio (Standard I)
13,511 48 13,559
Tetanus (Standard VI) 15,227 70 15,297
# Specialised SchoolsISLAND OF RODRIGUES
SCREENING BY NURSING STAFF IN :
Total
STANDARD: I II III IV V VINumber of children on roll 787 805 867 775 784 895 4,913Number of children screened 768 686 740 663 682 786 4,325Number of children having the following :
8 18 14 19 8 7 74
Scabies Nits and/or lice 0 6 6 5 2 3 22 Dental caries 142 165 173 166 165 131 942 of whom referred to dentist 92 122 128 125 100 86 653
VISION SURVEY ON CHILDREN IN:
III V VI Total
STANDARD:Number of children surveyed 835 764 334 1,933Number of children with visual problem
15 18 0 33
of whom referred to eye specialist
23 19 1 43
IMMUNIZATION PERFORMED
MMR (Standard I) 697

D.T - Polio (Standard I) 689Tetanus (Standard VI) 667
57
ISLAND OF MAURITIUS
STATISTICS ON NCD MOBILE SERVICE
Population Reached: 2009 2010 2011 2012
Number of adults screened and /or sensitised at worksites and localities
77,832 127,437 87,340 95,106
Number of students of secondary/tertiary/vocational institutions screened and sensitised
24,008 25,807 26,414 26,074
Republic of MauritiusCash Gift Coupons* distributed at government MCH Clinics
Year Mauritius RodriguesNo of Cash Coupons No of Cash Coupons
First Second Third Fourth First Second Third Fourth
2006 10,466 12,888 11,947 9,326 399 653 599 4492007 9,108 11,367 10,916 8,718 403 723 691 6082008 7,909 10,981 10,276 8,233 416 749 687 5662009 7,730 10,023 9,412 7,177 424 683 608 4802010 7,519 9,493 8,623 7,010 469 629 561 5102011 7,306 9,057 7,965 6,147 618 622 531 4402012 6,888 8,977 7,608 5,805 547 586 502 375* started in 1999
ISLAND OF MAURITIUS
Summary Statistics on Noise Monitoring
Year Number of Complaints Received & Attended
Number of Complaints where
noise nuisance were detected
Noise Monitoring Visits during
Weekends and after Office Hours
Number of Notices Served
2005 250 239 - -2006 203 199 - -2007 313 234 - 132008 558 149 - 102009 526 194 605 342010 620 203 1553 252011 562 203 1751 142012 626 229 1753 8
# Source: Environmental Health Engineering Unit* by Noise Monitoring Squad ( as from July 2009)
#
*

58
ISLAND OF MAURITIUSSCREENING* OF PRIMARY & PRE-PRIMARY SCHOOL CHILDREN# - 2012
Children reported with: Pre-primary Primary Abdominal pain 5 20Pallor 16 48Pityriasis versicolor 57 156Skin diseases 200 734Eye defects 29 277Hearing impairment and other ear disorders 1 35Speech disorders 59 88Asthma (known) 55 119Enlarged tonsils/tonsillitis 10 32Upper respiratory tract infections 12 23Congenital anomalies: Cleft palate/lip - 5 Congenital heart disease 50 64 Undescended testis 33 67Dyslexia 1 5Mental & behavioural disorders 15 81Underweight 217 200Overweight 327 1,338Other conditions 399 292No. of children referred to specialists 321 972* for specific diseases by doctor or nursing staff# all children not covered
ACTIVITIES OF THE DENTAL HEALTH SERVICE 2009-2012 PREVENTIVE SERVICE*
ACTIVITY PLACE POPULATION COVERED 2009 2010 2011 2012
FLUO
RIDE
DIS
TRIB
UTIO
N TO
CHI
LDRE
N
Well Baby Clinics in Area & Community Health Centres
No. of children 6-9 months 237 - - - No. of children 10-23 months 1,016 - - - No. of children 24-35 months 395 - - -
Pre-Primary schools
No. of schools visited 94 549 - - No. of pupils (3-5 years) 3,716 19,97
2 - -
-
TOTAL 5,364 19,972
- -
ORAL
HEA
LTH
PROM
OTIO
N
Pre-Primary, Primary, & Secondary
Schools
No. of pre-primary schools visited
62 382 286 73
No. of pre-primary school children reached
2,026 13,721
10,726 2,570
No. of primary schools visited 111 99 188 111 No. of primary school
children reached14,22
2 13,74
3 18,010 34,827
No. of secondary schools visited
2 15 28 5
No. of secondary school children reached
528 1,640 3,332 218
Other places (community)
No. of nursing mothers reached in well-baby clinics
1,648 - - -
No. of persons reached in SWC/COM/other centres
21,179
5,007 1,571 470
No of persons screened in mobile dental clinics
2,738 2,044 3,701 3,610
TOTAL 42,341
36,155
37,340 41,695
@ @

Source: Dental Health Services* drastic changes due to administrative reasons@ no fluoride distribution to children

59 ISLAND OF MAURITIUS
DENTAL CURATIVE SERVICES
TABLE A: ATTENDANCES AT DENTAL CLINICS 2008-2012
ATTENDANCES Number2008 2009 2010 2011 2012
Cases seen by dentists: Children < 5 years 8,645 8,192 7,436 7,775 6,928
Children aged 5-11 years 63,533 64,123 65,547 65,715 65,091Persons aged 12 years & above 231,53
2 230,086 225,925 245,369 238,302SUBTOTAL 303,71
0 302,401 298,908 318,859 310,321Cases seen by specialist:
oral surgeons 9,569 10,705 11,242 10,452 11,230
orthodontists 8,315 8,132 7,062 7,215 7,339
endodontists 694 2,531 4,364 4,227 4,053
TOTAL ATTENDANCES322,288
323,769 321,576 340,753 332,943
# of which 225,949(67.9%) seen at AHC's and CHC'sTABLE B: DISTRIBUTION OF CASES SEEN BY TYPE OF DENTAL CARE
Dental care Number2008 2009 2010 2011 2012
EXTRACTION AND TOOTH RESTORATION Deciduous teeth extracted 32,359 31,295 30,617 29,195 28,486 School children Temporary fillings inserted in : deciduous teeth
6,968 7,158 8,234 8,769 8,760
permanent teeth
5,070 4,838 4,995 4,324 4,082
Permanent fillings inserted : amalgam 9,702 8,562 12,912 7,455 7,872 composite 743 732 928 1,009 805 Permanent teeth extracted 1,911 1,964 1,660 1,460 1,248 Adults Temporary fillings inserted 53,511 53,943 58,967 59,966 62,764 Permanent fillings inserted : amalgam 28,839 28,681 31,349 36,069 36,856 composite 6,122 6,888 10,107 12,007 13,225 Teeth extracted 66,901 64,020 65,190 64,473 61,154 OTHER DENTAL CARE Treatment of paradontal disease 28,579 31,305 32,189 37,030 34,573 Surgical operations on jaws, etc. 2,632 3,195 6,312 7,560 7,817 Treatment of fracture of jaws 389 344 382 376 279 Endodontic treatment 1,387 1,694 4,156 4,061 4,134 Treatment of dental cysts 71 250 396 377 323 Treatment of temporo-mandibular joint 350 648 643 557 610 Application of pit and fissure sealants 2,702 5,942 6,373 8,900 9,939 Cases treated under general anaesthesia 209 119 99 125 99
TABLE C: ORTHODONTIC ACTIVITY
Activity Number2008 2009 2010 2011 2012
No. of impressions taken 1,103 1,010 999 831 885 No. of appliances delivered 1,077 959 861 719 940 No. of patients with cleft palate 17 26 41 35 34 No. of appliances activated 4,344 4,223 3,560 3,857 3,785 No. of appliances repaired 83 70 70 56 85
#


REPUBLIC OF MAURITIUS
DETAILS OF PATHOLOGICAL TESTS CARRIED OUT IN PUBLIC LABORATORIES - 2012
60
NUMBER OF SPECIMENS/TESTS
LABORATORY
BIO-CHEMISTRY
HAEMATOLOGY
HISTOLOGY
CYTOLOGY
BACTERIOLOGY
PARASITOLOGY VIROLOGY
BLOOD TRANSFUSION SERVICE
TOTAL
CENTRAL (CANDOS) SPECIMENS
1,141,337 154,313 9,596 8,804 75,714 75,829 320,717 210,806 1,997,116
TESTS 1,703,233 400,974 72,314 12,112 319,599
144,549
395,794 288,312 3,336,887
DR JEETOO HOSPITAL SPECIMENS
387,279 99,553 12,455 125,837 625,124
TESTS 534,991 271,696 16,452 220,369 1,043,508
SSRN HOSPITAL SPECIMENS
819,780 142,239 14,907 159,485 1,136,411
TESTS 1,124,383 384,269 17,869 172,277 1,698,798
J. NEHRU HOSPITAL SPECIMENS
398,789 129,886 14,184 116,199 659,058
TESTS 636,958 388,535 15,751 212,230 1,253,474
FLACQ HOSPITAL SPECIMENS
354,883 91,327 14,702 93,072 553,984
TESTS 582,597 245,277 17,642 149,294 994,810MAHEBOURG HOSPITAL SPECIMEN
S9,841 1,629 1,166 12,636
TESTS 11,718 2,522 1,254 15,494SOUILLAC HOSPITAL SPECIMEN
S56,731 5,789 387 62,907
TESTS 61,649 6,195 673 68,517ENT HOSPITAL SPECIMEN
S 6,299 6,299
TESTS 7,540 7,540CHEST CLINIC SPECIMEN
S 7,540 7,540
TESTS 31,225 31,225YVES CANTIN COM. HOSPITAL SPECIMEN
S6,641 7,108 6,651 20,400
TESTS 8,276 11,933 7,731 27,940P.VERTE MEDICLINIC SPECIMEN
S2,296 242 2,538
TESTS 4,534 322 4,856
TOTAL ISLAND OF MAURITIUS SPECIMENS
3,177,577 632,086 9,596 8,804 89,553 140,281 320,717 705,399 5,084,013
TESTS 4,668,339 1,711,723 72,314 12,112 358,364 221,921 395,794 1,042,482 8,483,049
*
CATEGORY


61REPUBLIC OF MAURITIUS
POSITIVITY RATES OF PATHOLOGICAL TESTS CARRIED OUT IN PUBLIC LABORATORIES ON CERTAIN SELECTED PATHOGENIC CONDITIONS -2010-2012
2010 2011 2012PATHOGENIC CONDITION
SPECIMENS TESTED
POSITIVE CASES
SPECIMENS
TESTED
POSITIVE CASES SPECIMENS
TESTED
POSITIVE CASES
No. RATE (%)
No. RATE (%)
No. RATE (%)
4,471 178 4.0 4,373
162 3.7 5,069 96 1.9
Parasites identified :
Entamoeba histolytica
31 0.7 25 0.6 20 0.4
Precystic amoebae
20 0.4 14 0.3 11 0.2
Trichuris ova 25 0.6 25 0.6 16 0.3Ascaris ova 27 0.6 30 0.7 19 0.4
Endolimax nana 5 0.1 6 0.1 3 0.1Giardia lamblia 3 0.1 8 0.2 4 0.1Hookworm ova 3 0.1 3 0.1 2 0.0
Other 64 1.4 51 1.2 21 0.41. Stools ( selected pathogens)
3139 3068 2582
Non-typhoidal salmonella
251 8.0 254 8.3 124 4.8
Campylobacter 82 2.6 66 2.2 65 2.5Shigella species 2 0.1 8 0.3 4 0.2
Salmonella typhi - - - - 1 0.02. Throat Swabs 3594 2971 2556
Streptococcus group A
250 7.0 232 7.8 86 3.4
3. Cerebrospinal Fluid ( selected pathogens)
510 442 489
Haemophilus influenza type B
2
0.4 -
-
-
-
Streptoccus pneumoniae
4 0.8 5 1.1 3 0.6
Streptococcus group B
2 0.4 3 0.7 4 0.8
Cryptoccus neoformans
2 0.4 - - 1 0.2
Neisseria meningitidis
1 0.2 1 0.2 2 0.4Gonorrhoea … 5 … 2,57
612 0.5 2,883 23 0.8
Syphilis (VDRL) 76,529 132 0.2 66,748 425 0.6 67,772 457 0.7
Malaria 57,511 52 0.1 56,684 54 0.1 54,938 33 0.1
Human immuno-deficiency virus (HIV)
82,648 580 0.7 85,197 417 0.5 83,823 327 0.4
On histological examinations (tissue)
8,696 1,295
14.9 9,595
1,325 13.8 9,596 1,547 16.1
On cytological examinations (smears)
12,321 606 4.9 12,027 698 5.8 8,834 407 4.6
On haematological examinations (Bone marrow)
137 41 29.9 134 32 23.9 267 45 16.9
Toxoplasma antibodies
1,564 349 22.3 1,656
101 6.1 2,028 144 7.1
Hepatitis A 1,523 57 3.7 855 44 5.1 715 3 0.4Hepatitis B (HBs Ag)
55,172 332 0.6 55,665 371 0.7 57,809 272 0.5
Hepatitis C 54,950 1,637
3.0 55,158 1,502 2.7 57,586 1,598 2.8
Cytomegalovirus 1,361 61 4.5 1,463
43 2.9 1,855 53 2.9
Leptospirosis 613 64 10.4 604 37 6.1 639 33 5.2Chikungunya 563 5 0.9 1,40
93 0.2 1,374 1 0.1
* IGM antibodies only
**

62 ISLAND OF MAURITIUS
STATISTICS RELATING TO THE FIELDS OF BASIC SANITATION AND FOOD HYGIENE ( 2008 - 2012)
ACTIVITIES 2008 2009 2010 2011 2012 BASIC SANITATION No. of premises and other sites inspected 93,173 85,797 82,218 91,766 96,20
8 No. of notices issued 5,375 6,050 6,539 6,999 6,185 No. of sanitary contraventions 215 38 109 88 109 No. of cases sentenced 111 58 63 65 111FOOD HYGIENE No. of inspections carried out 25,299 32,817 23,850 33,436 34,47
1 Foodstuffs unfit for consumption seized and
destroyed (kg)2,017,910 424,814 467,452 259,715 381,8
07 No. of contraventions 531 514 571 1,076 973 No. of cases sentenced 165 611 507 839 814 No of imported food containers examined 11,943 12,879 13,507 12,688 14,02
6INSPECTION OF PUBLIC PLACES Cinema halls & other entertainment places 2,585 2,810 1,002 926 1,202 Dormitories ( including Boarding Houses) 1,586 1,224 1,321 1,803 2,578 Industrial establishments 550 715 645 589 855 Schools 1,304 2,044 3,575 3,899 6,067AIRPORT No. of planes disinsectised on arrival 60 78 84 90 47 No. of planes disinsectised before departure 818 787 871 961 1,028 No. of passengers put under malaria
surveillance189,919 145,167 146,066 260,522 289,5
99 No. of passengers put under chikungunya
surveillance221,486 252,020 339,287 443,061 429,8
66 No. of passengers put under surveillance for
AH1N1- 678,002 165,550 - -
No. of passengers put under surveillance for other infectious diseases*
21,913 27,207 32,116 56,828 147,262
No. of inspections of airport area 14 11 - - - - No. of nuisances detected 2 - - - - - No. of nuisances abated 2 - - - -SEAPORT No. of ships given pratique 2,195 2,410 2,536 2,759 2,969 No. of ships visited for malaria surveillance 230 449 775 599 455 No. of ships inspected for issue of deratting exemption certificate 159 297 266 277 257 No. of deratting of ships performed 74 89 111 118 124NB: Drastic changes due to administrative reason and/or unforseen circumstances * including SARS and Avian Flu
Republic of MauritiusNumber of imported cigarette sticks
Product 2009 2010 2011 2012
Cigarettes (No of sticks) 1,306,406,000
1,052,497,000
1,072,869,000 1,000,560,000
Number of litres of imported or produced alcoholic productsProduct 2009 2010 2011 2012Beer 36,098,478 37,204,361 37,753,912 36,395,78
2Fruit Wine 5,283,713 4,892,802 5,184,531 4,356,091
Spirits (including imported Rum, Whiskey Liquor and Compounded Spirits)
13,408,464 13,695,466 13,097,458 12,597,301
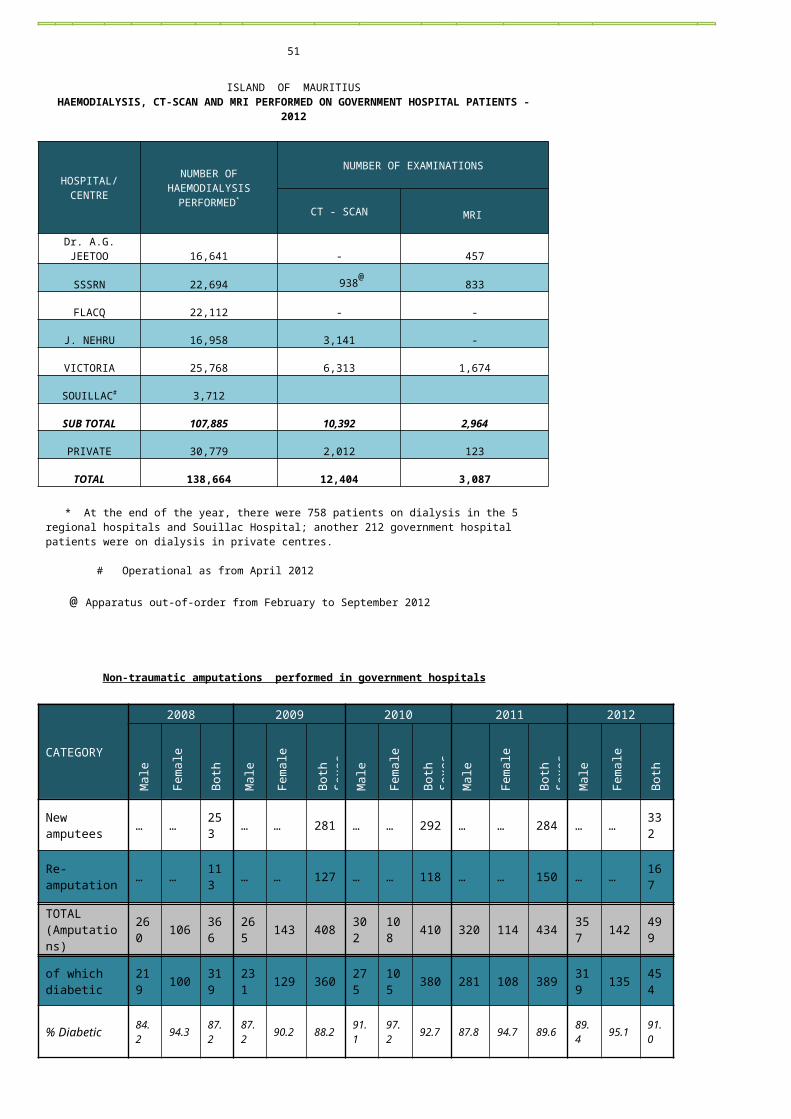
Total alcoholic products (litre) 54,790,655 55,792,629 56,035,901 53,349,174
63ISLAND OF MAURITIUS
ACTIVITIES OF THE COMMUNITY BASED REHABILITATION@
PROGRAMME 2008- 2012 ACTIVITY YEAR 2008 2009 2010 2011 2012
SUMMARY FIGURES Cumulative total of disabled as at end-of-year
11,067 11,179 10,809 10,884 10,968 New cases of disabled registered during year
986 993 1,184 880 1,030 Number of visits to disabled 38,507 38,346 41,006 46,857 47,516 Number of referrals of disabled
6,764 6,817 7,283 7,722 7,280 Number of appliances delivered to disabled
1,549 1,745 1,817 1,878 1,575 Number of visits to institutions by staff
2,073 2,142 2,166 2,424 2,100
DETAILS OF REFERRALS OF DISABLED
To social security offices 1,441 1,465 1,689 1,690 1,557 To hospitals 1,560 1,459 1,531 1,765 1,744 To health centres 2,210 2,157 2,306 2,435 2,371 To National Council for the
Rehabilitation of the Disabled Persons (NCRD)
49 56 58 79 51
To orthopaedic workshop 870 839 913 885 697 To day care centres 213 225 289 338 316 To specialised schools 182 157 179 190 206 To Pre-Primary Schools 40 63 92 67 38 To Primary Schools 10 12 27 35 21 To other institutions 189 384 199 238 279
DETAILS OF APPLIANCES DELIVERED TO DISABLED
Walking aids 609 627 762 700 598
Wheelchairs 402 435 466 488 448 Adapted appliances 209 259 266 247 213 Splints/calipers 162 167 159 197 134 Hearing aids 29 49 35 25 29 Artificial limbs 51 51 53 82 33 Other appliances* 87 157 76 139 120
DETAILS OF VISITS TO INSTITUTIONS
BY STAFF
Day care centres 365 346 417 492 413 Pre-primary schools 335 341 331 309 274 Specialised institutions 274 255 286 331 273 Primary schools 116 103 112 141 110 Social security offices 707 742 734 830 758 Other institutions 276 355 286 321 272@ see page 53 for attendances at rehabilitation service departments* including walking sticks

REPUBLIC OF MAURITIUSNEW CASES OF CERTAIN NOTIFIABLE DISEASES## REPORTED TO SANITARY AUTHORITIES 1993 - 2012
DISEAS
E HIV / AIDS@
AMOE
-BIA
SIS
CHIC
KUNG
UNYA
DENG
UE
FOOD
POI
SONI
NG
INFE
C-TI
VE H
EPAT
ITIS
LEPR
OSY
LEPT
SPIR
OSIS
MALARIA
MEA
SLES
$
MEN
INGI
TIS#
$
SCHI
STOS
O-M
IASI
S
TETANUS TUBERCULOSIS**
TYPH
OID
WHO
OPIN
G CO
UGH
(PER
TUSS
IS)$
MAU
RITI
AN
NON-
MAU
RITI
AN
INDI
GENO
US
IMPO
RTED
INTR
ODUC
ED
NEO-
NATO
RUM
NON
-NE
ONAT
AL
PULMONARY
OTHE
R
YEAR
MAU
RITI
AN NO
N-M
AURI
TIA
1993 10 4 105 - - 57 1,800 4 4 - 49 5 88 - 5 - 1 159 … 5 8 -1994 15 8 58 - - 39 453 - 6 - 59 7 10 - 15 - - 147 … 2 4 11995 20 7 2 - - 57 38 - 4 - 46 - 9 - - - 1 138 … 4 2 -1996 16 7 5 - - 13 24 5 9 17 63 2 - - 5 - - 112 … - 5 -1997 24 4 - - - 35 10 - 4 1 64 - - - 2 - - 126 … - 1 -1998 23 6 - - - 28 16 1 7 - 53 4 1 - - - 1 121 … 2 6 -1999 28 5 1 - - 73 24 1 1 - 73 - - - - - - 147 … 3 2 12000 50 7 1 - - 62 12 - 3 - 62 - 4 18 - - 1 131 8 2 10 -2001 55 14 8 - - 23 41 - 3 - 63 3 1 14 - - 1 112 - 1 1 -2002 98 4 - - - 33 11 - 1 - 38 1 8 11 - - - 106 21 10 1 -2003 225 15 - - - 60 20 - 3 - 40 - 679 10 - - - 107 14 3 2 -2004 525 10 - - - 160 19 - 3 - 45 3 110 10 - - 1 118 11 1 1 -2005 921 7 - 1381&& - 29 12 1 6 - 35 1 11 14 - - - 117 6 4 5 -2006 542 13 1 11,165 - 78 5 - 6 - 38 - 3 4 - - - 104 7 4 4 -2007 546 22 - 1& - 766 5 1 9 - 42 - 13 18 - - 1 97 11 - 15 12008 538 19 - - 1& 129 4 - 3 - 27 - 12 12 - - - 102 4 2 6 -2009 548 7 - - 25
2&&718 23 1 7 - 23 - 15 7 - - 1 109 4 4 5 1
2010 568 12 - 5& 11& 156 28 2 28 - 52 - - 5 - - - 106 11 6 3 -2011 401 16 - 1& 8& 445 35 2 17 - 54 - - 7 - - 1 111 2 - 5 -2012 320 7 - 1& 13& 26
42 - 16 - 30 3 - 3 - - - 122 6 2 4 -
## No cases of Diphteria have been reported in 2010-2012 ; no such case was reported since 1986 except in 2009 when 5 cases were reported $ As from 2000, sources include hospitals and laboratories# Cerebrospinal ( Hib, Streptoccus pneumonia and neisseria) ** Forms of tuberculosis notifiable in Mauritius are : respiratory, skeletal, of meninges and central nervous system @ Human Immuno-Deficiency Virus / Acquired immuno-deficiency syndrome (See page 69 for additional data). & imported/secondary to imported cases only && outbreak localised mostly in Port Louis
NB: See page 89 for data on Sexually Transmitted Diseases
64

REPUBLIC OF MAURITIUSDISTRIBUTION OF NOTIFIABLE DISEASES REPORTED TO SANITARY AUTHORITIES BY MONTH - 2012
DISEASE
HIV / AIDS@
FOOD POISONING
GONOR-RHOEA
INFEC-TIVE
HEPATITIS
LEPROS
Y
MALARIA SYPHILI
S
TETANUS
TUBERCULOSIS *
TYPHOI
D FEVER
LEPTOS
-PIROSI
S
MAU
RITI
AN
NON-
M
AURI
TIAN
INDI- GENOU
S
IM- PORTE
D
INTRO- DUCED
NEON
ATOR
UM
NON-
NE
ONAT
ALPU
LMON
ARY
OTHE
R MONTH
JANUARY 38 - 29 8 - - 1 - 3 - 1 - - 8 - -
FEBRUARY 30 1 14 16 - - - - 3 1 - - - 13 - -
MARCH 26 1 49 10 - - 2 - - - 2 - - 8 - 2
APRIL 14 - 13 16 1 - - - - - 4 - - 12 - 1
MAY 27 - 5 19 - - 4 - 3 2 2 - - 9 - - 65
JUNE 34 2 11 13 - - 2 - 2 - 1 - - 7 - -
JULY 28 1 - 10 1 - 4 - 2 - - - - 11 - -
AUGUST 20 1 15 10 - - - - 5 - 1 - - 9 - -
SEPTEMBER 28 - 2 9 - - 1 - 2 - 1 - - 7 - 1
OCTOBER 37 1 6 8 - - 1 - 4 - 3 - - 12 - -
NOVEMBER 10 - 10 10 - - 1 - 2 - 1 - - 22 - -
DECEMBER 28 - 110 10 - - - - 4 - - - - 10 2 -
320 7 264 139 2 - 16 - 30 3 16 - - 128 2 4
@ Human Immuno-Deficiency Virus / Acquired immuno-deficiency syndrome * Forms of tuberculosis notifiable in Mauritius are : respiratory, skeletal, of meninges and central nervous system See page 89 for additional statistics on Sexually Transmitted Infections


DISTRIBUTION OF NOTIFIABLE DISEASES REPORTED TO SANITARY AUTHORITIES BY DISTRICT - 2012
DISEASEHIV / AIDS@
FOODPOISONIN
GGONOR-RHOEA
INFEC-
TIVEHEPA-TITIS
LEP-ROS
Y
LEPTOS-
PIROSIS
MALARIA
SYPHILIS
TETANUSTUBERCULOSI
S*
TYPHOID
FEVERM
AURI
TIAN
NON-
MAU
RITI
AN
INDI- GENOU
SIM-
PORTEDINTRO- DUCED
NEON
ATOR
UM
NON-
NEO
NATA
L
PULM
ONAR
Y
OTHE
R
DISTRICT
PORT LOUIS 116
7 40 - - 1 - 10 - - - - 28 - 2
PAMPLEMOUSSES 45
6 22 - - 2 - 1 1 - - - 15 2 -
RIVIERE DU REMPART 13
11 8 - - 1 - - - 2 - - 8 - 1
FLACQ 16
81 3 - - 4 - - - 2 - - 6 - - 66
GRAND PORT 13
62 1 - - 1 - 2 - 1 - - 8 - 1
SAVANNE 7
13 5 - - - - - - - - - 3 - -
PLAINES WILHEMS 78
70 31 2 - 5 - 13 2 10 - - 37 - -
MOKA 5
4 4 - - 1 - 1 - - - - 5 - -
BLACK RIVER 22
3 25 - - 1 - 3 - 1 - - 17 - -
RODRIGUES 5
7 - - - - - - - - - - 1 - -
TOTAL 320
7 264 139 2 - 16 - 30 3 16 - - 128 2 4
@ Human Immuno-Deficiency Virus / Acquired immuno-deficiency syndrome # - includes 3 cases of unknown address
* Forms of tuberculosis notifiable in Mauritius are : respiratory, skeletal, of meninges and central nervous system
#

REPUBLIC OF MAURITIUSDISTRIBUTION OF CERTAIN NOTIFIABLE DISEASES REPORTED TO SANITARY AUTHORITIES
67
BY AGE-GROUP AND SEX - 2012
DISEASE FOOD POISONING
GONORRHOEA
MALARIA (IMPORTED)
SYPHILIS
TUBERCULOSISHIV / AIDS@
& MAURITIAN
(PULMONARY)SEX
AGE-GROUP (YEARS) MALE FEMALE MALE FEMALE MALE FEMALE MALE FEMALE MALE FEMALE MALE FEMALE
Less than 1 0 1 - 9 12 1 - - - - -
10 - 19 6 9 19 56 20 - 4 1 1
1 5 5
20 - 29 56 41 42 9 70 - 11 1 - 6
16 8
30 - 39 82 33 50 17 35 1 7 1 3
- 18 6
40 - 49 37 15 23 7 7 - 3 - 2
1
19 9
50 - 59 28 5 6 6 3 - 2 1 1
- 14 4
60 & over 5 2 3 5 2 - 2 - 1 - 14 10
TOTAL 215 105 152 112 138 1 29 4 8 8 86 42
@ Human Immuno-Deficiency Virus / Acquired immuno-deficiency syndrome See page 89 for additional statistics on Sexually Transmitted Infections

68ISLAND OF MAURITIUS
SELECTED LABORATORY* CONFIRMED CASES OF COMMUNICABLE DISEASES 2003 - 20122003 2004 2005 2006 2007 2008 2009 2010 2011 2012
Gonorrhoea 71 34 37 16 10 5 3 5 12 23Haemophilus influenza Type B
6 5 7 3 9 4 1 2 -
-
Hepatitis A 1 1 3 9 7 10 39 57 44 3Hepatitis B 517 673 420 422 379 346 331 332 371 272Hepatitis C 2,03
32,713 1,952 2,026 1,839 1,66
01,73
51,637 1,50
21,59
8Leptospirosis 20 42 23 16 18 20 45 64 37 33Meningitis Meningococcal
1 - 2 - 2 3 2 1 1 2
Syphilis 160 646 557 432 462 317 327 132 425 457Typhoid Fever - 2 - 1 4 - - 3 2 1* Government services
ACUTE FLACCID PARALYSIS (AFP) SURVEILLANCE* 2005-2012
YEAR 2005
2006 2007 2008 2009
2010
2011 2012
Number of AFP reported cases 6 8 8 5 1 5 2 6
Rate per 100,000 population <15 years
2.0 2.6 2.7 1.7 0.35 1.7 0.7 2.3
* Republic of MauritiusDISEASE SURVEILLANCE AT HOSPITAL LEVEL# - 2012
DISEASEGastro-enteritis Upper respiratory tract
infection1Conjunctivitis2 Severe Pneumonia3
amongchildren < 5 years
MONTH January 5,629 16,826 2,240 3 February 3,567 13,222 2,005 8 March 2,890 17,554 2,058 12 April 2,191 19,207 2,049 8 May 2,709 23,537 1,958 7 June 3,075 27,947 1,741 7 July 3,117 35,759 1,844 10 August 2,593 24,737 1,968 9 September 2,735 26,387 1,974 4
October 2,524 22,006 2,363 3 November 2,515 15,100 2,035 3
December 2,553 10,513 1,747 2 Year 36,098 252,795 23,982 76
# General Hospitals (including Long Mountain) 1. including ENT Hospital 2. including Moka (Eye) Hospital 3. Regional Hospitals
NEW CASES ATTENDING AREA AND COMMUNITY HEALTH CENTRES - 2012
DISEASE Gastro-enteritis
Upper respiratory tract infection Conjunctivitis ScabiesMONTHJanuary 7,344 26,457 2,806 790 February 5,978 21943 2,508 751 March 5,246 28992 2,857 858 April 4,837 32816 2,740 816
YearDISEASE

May 4,713 40608 2,829 758 June 5,099 47818 2,683 613 July 4,862 54720 2,796 636 August 4,290 37856 2,815 705 September 4,534 41504 3,066 623 October 4,364 30147 3,151 652 November 4,543 22908 2,846 690 December 4,438 16656 2,191 630 Year 60,248 402,425 33,288 8,522

69REPUBLIC OF MAURITIUS
STATISTICS RELATING TO NOTIFICATION OF HIV / AIDS CASES AND DEATHS 1987 - 2012
PERIOD NEW CASES OF HIV / AIDS NOTIFIED @ DEATHS REGISTERED AMONG HIV / AIDS
CASES ( MAURITIAN)##
of which HIV as under-lying cause
of death
MAURITIAN NON-MAURITIAN TOTALM
ALE
FEM
ALE
BOTH
SE
XES
MAL
E
FEM
ALE
BOTH
SE
XES
MAL
E
FEM
ALE
BOTH
SE
XES
MAL
E
FEM
ALE
BOTH
SE
XES
1987-1999 113 58 171 49 10 59 162 68 230 38 13 51 …2000 32 18 50 3 4 7 35 22 57 10 3 13 …2001 34 21 55 12 2 14 46 23 69 5 3 8 …2002 59 39 98 3 1 4 62 40 102 9 4 13 …2003 167 58 225 12 3 15 179 61 240 11 8 19 …2004 464 61 525 8 2 10 472 63 535 16 6 22 …2005 815 106 921 5 2 7 820 108 928 38 6 44 19 2006 455 87 542 9 4 13 464 91 555 35 9 44 31 2007 452 94 546 16 6 22 468 100 568 56 13 69 60 2008 402 136 538 12 7 19 414 143 557 55 7 62 50 2009 436 112 548 6 1 7 442 113 555 35 4 39 33 2010 433 135 568 8 4 12 441 139 580 78 15 93 70 2011 298 103 401 10 6 16 308 109 417 79 13 92 58 2012 215 105 320 6 1 7 221 106 327 97 8 105 76
TOTAL 4375 1133 5508 159 53 212 4534 1186
5720 562 112 674
## Since 2005 information obtained from the Civil Status Office are used to adjust figures related to death
STATISTICS RELATING TO HIV TESTS CARRIED OUT 2010 - 2012@
CATEGORY 2010 2011 2012
Num
ber o
f te
sts
Positive cases
Num
ber o
f te
sts
Positive cases
Num
ber o
f te
sts
Positive cases
num
ber
Rate
per
10
0 te
sts
num
ber
Rate
per
10
0 te
sts
num
ber
Rate
per
10
0 te
sts
Blood donors - Island of Mauritius 43,471 15 0.03 44,28
6 12 0.03 46,250 9 0.02Blood donors - Island of Rodrigues 829 - - 838 - - 943 - -
Persons of high risk groups* 8,929 318 3.56 8,735 259 2.97 8,107 194 2.39Migrant workers (incoming foreigners) 7,318 12 0.16 8,467 16 0.19 7,837 8 0.10Request for visa purposes (outgoing
Mauritians) 225 - - 33 - - 23 - -Cardiac and renal patients (including
dialysis) undergoing surgery and their blood donors
3,391 - - 3,300 - - 3,314 - -
Screening on target groups ( prison inmates, sailors & TB patients) 4,733 195 4.12 5,238 100 1.91 4,778 75 1.57
Voluntary testing 656 2 0.30 900 - - 638 2 0.31Antenatal cases screened $ - Island of
Mauritius13,51
2 37 0.27 12,763 30 0.24 12,333 38 0.31
Antenatal cases screened $ - Island of Rodrigues 836 1 0.12 729 - - 557 - -Others# 532 - - 569 - - 1,248 1 0.08
TOTAL TESTS£ 84,432 580 0.69 85,85
8 417 0.49 86,028 327 0.38* Commercial Sex workers, Injecting drug users, Homo/bisexual, patients/contact tracing, S.H.C. and Syphilis positive patients including at NDCCI# Other outreach activities/Drug addicts Rehabilitation Centres/Post Mortems/insurance/survey@ refers to Republic of Mauritius$ excluding known HIV/AIDS cases ( 31 in 2010 and 28 in 2011 and 45 in 2012)£ excl BB/Apheresis and repeats
IN NON-RESIDENT POPULATIONIN RESIDENT POPULATION

70
ISLAND OF MAURITIUSSELECTED STATISTICS ON PRIVATE HEALTH INSTITUTIONS * 2000 - 2012
YEAR
NUMBER OF NURSING HOMES
NO. OF BEDS AS AT 31ST
DEC.
Live births
Numberof
Still-births
Births
No.
% LowBirth
Weight
%
%
TotalCaesarianon Total
Births @
in whole Island
2000 14 572 2,680 4.7 11 2,691 35.3 13.72001 12 588 2,680 5.7 14 2,694 40.6 14.12002 12 585 2,620 6.9 11 2,631 40.6 13.62003 12 539 2,533 6.8 15 2,548 42.1 13.62004 12 543 2,638 8.6 5 2,643 46.3 14.32005 12 517 2,837 7.4 10 2,847 48.4 15.72006 13 562 2,784 7.3 16 2,800 45.8 16.62007 13 550 2,758 9.2 8 2,766 50.0 16.92008 17 582 3,033 7.9 15 3,048 50.1 19.42009 19 807 2,950 8.4 18 2,968 52.3 20.12010 17 759 3,064 10.7 6 3,070 53.3 21.32011 17 706 3,080 9.7 20 3,100 56.3 21.92012 17 705 3,051 10.5 13 3,064 53.3 22.0
@ live births and stillbirthsADMISSIONS AND OTHER ATTENDANCES AT PRIVATE HEALTH INSTITUTIONS * - 2012
Period First Second Third Fourth Whole
Quarter Quarter Quarter Quarter Year
Number 46,092 49,267 46,218 45,575 187,152
TOTAL BIRTHS BY TYPE OF DELIVERY$ IN PRIVATE HEALTH INSTITUTIONS *- 2012
First Second Third Fourth WholeTYPE OF DELIVERY Quarter Quarter Quarter Quarter Year
Normal 244 249 250 220 963 Caesarian 363 425 415 430 1,633
Instrumental 101 123 113 131 468 Total 708 797 778 781 3,064
*with medical treatment services $ based on data received from 17 private health institutions and adjusted for under reporting
71

ISLAND OF MAURITIUSDISTRIBUTION OF CASES TREATED AT PRIVATE HEALTH INSTITUTIONS * BY CAUSE AND SEX - YEAR 2012
CAUSE OF ATTENDANCE (including admissions)(W.H.O. International Classification of
Diseases 10th Revision) Number# I.C.D.
CHAPTER MALE FEMAL
ETOTA
L I Infectious colitis,enteritis,gastroenteritis and diarrhoea 1,869 1,771 3,640
Septicaemia and other infectious and parasitic diseases 235 180 415 II Malignant Neoplasms (Cancer, Hodgkin's, lymphoma, leukemia etc.) 367 461 828
Benign and other Neoplasms (Fibroid of uterus, carcinoma in situ, brain tumor etc.) 214 401 615 III Anemias 247 448 695
Coagulation defects and other diseases of the blood and blood-forming organs and certain disorders involving the immune mechanism
49 38 87
IV Diabetes Mellitus and related complications (coma, cataract,gangrene, renal, etc.) 1,017 928 1,945
Disorders of thyroid & other endocrine, nutritional and metabolic diseases 94 134 228 V Alcoholism 135 63 198
Depression and other mental and behavioural disorders 119 253 372 VI Epilepsy and other diseases of the nervous system 198 171 369 VII Diseases of the eye & adnexa 4766 4130 8,896 VIII Diseases of the ear & mastoid process 438 464 902 IX Hypertension and related complications (renal , heart etc.) 904 753 1,657
Myocardial, Ischaemic and other heart disease 1,274 682 1,956 Stroke and other cerebrovascular diseases 316 220 536 Varicose veins and haemorrhoids 341 344 685 Hypotension and other diseases of the circulatory system 223 197 420
X Influenza and pneumonia 689 707 1,396 Bronchitis & bronchiolitis 835 880 1,715 Sinusitis & rhinitis 533 569 1,102 Asthma 279 298 577 Emphysema and other diseases of the respiratory system 691 562 1,253
XI Gastric & duodenal ulcer 412 405 817 Appendicitis and hernia 424 297 721 Pancreas and liver diseases 196 82 278 Calculus (stone) of gallbladder and bile duct 215 262 477 Gastritis and other diseases of the digestive system 1,634 1,663 3,297
XII Lupus erythematosus and other diseases of the skin and subcutaneous tissue 393 371 764 XIII Rheumatism and other diseases of the musculoskeletal system and connective tissue 1,093 930 2,023 XIV Diseases of the genital organs, including breast and menstrual disorders 477 1,764 2,241
Renal failure 242 131 373 Cystitis and other diseases of the genitourinary system 862 674 1,536
XV Complications following spontaneous and other abortions -
542 542
Deliveries and other conditions associated with pregnancy, childbirth and the puerperium
-
1,696 1,696
XVI Certain conditions originating in the perinatal period (newborns) 280 341 621 XVII Congenital malformations, deformations and chromosomal abnormalities 45 29 74 XVIII Fever , headache, pain all over, malaise and fatigue, senility, syncope and collapse 2,241 2,389 4,630
All other symptoms, signs and ill-defined conditions 729 818 1,547 XIX &XX Fractures and other injuries 1,188 867 2,055
Adverse effects & other poisonings 278 441 719 XXI Attendances/admissions for observations, examinations or investigations only 29,516 29,230 58,746
TOTAL** 56,058 57,586 113,644
* Clinic/hospital with medical treatment services# based on data with details on diseases received from 17 institutions** excluding cases seen at the out-patient department not classified by diseases

72
ISLAND OF MAURITIUS
SURGICAL OPERATIONS AND PROCEDURES
PERFORMED AT PRIVATE HEALTH INSTITUTIONS* - 2012
Body Site/Type of interventionMALE FEMAL
E
BOTH SEXES
NUMBER %
1. Brain, spinal and other nervous system 24 17 41 0.2 2. Thyroid, adrenal and other endocrine system 14 40 54 0.3 3. Eye and adnexa 2,02
0 1,842 3,862 22.0
4. Ear and mastoid process 61 57 118 0.7 5. Nose, mouth and pharynx 413 395 808 4.6 6. Lung, diaphragm and other respiratory system 74 104 178 1.0 7 Heart, arteries, veins and other cardiovascular system 166 145 311 1.8 8. Bone marrow,lymph nodes, spleen and other blood and
blood forming organs3 16 19 0.1
9. Stomach, duodenal, appendix, gallbladder and other digestive system (incl. proctological)
1,327
1,173 2,500 14.2
10.
Kidney, ureter,bladder and other urinary system 484 191 675 3.8
11.
Prostate,testis, penis and other male genital organs 568 - 568 3.2
12.
Ovary, uterus, vagina and other gynaecological procedures - 2,271 2,271 12.9
13.
Antepartum, labour, delivery and postpartum procedures - 698 698 4.0
14.
Neck, spine, pelvis,limbs and other musculoskeletal system 788 552 1,340 7.6
15.
Dermatological and plastic procedures(skin, soft tissue) 748 832 1,580 9.0
16.
Breast (Male and Female) 36 404 440 2.5
17.
Diagnostic,therapeutic, client support and other non-invasive and cognitive interventions
984 1,122 2,106 12.0
TOTAL (classified interventions) 7,710
9,859 17,569 100.0
18 Interventions not classified by body site/type 2,272
2,028 4,300
TOTAL (interventions) 9,982
11,887
21,869
* with medical treatment services
73 ISLAND OF MAURITIUS

CERTAIN PRINCIPAL CAUSES OF GENERAL HOSPITALS DISCHARGES (INCLUDING DEATHS)
BY SEX - 2012CAUSE
(I.C.D - 10)
MALE
FEMALE
TOTAL
No. % No. % No. %
1. Deliveries (including by caesarian etc) 0.0 10,456 11.2 10,456 6.2 2. Diabetes mellitus 3,533 4.7 3,642 3.9 7,175 4.2 3. Acute Upper Respiratory infections 3,624 4.8 3,479 3.7 7,103 4.2 4. Diarrhoea and gastroenteritis of presumed infectious origin 2,416 3.2 3,245 3.5 5,661 3.3 5. Gastritis and duodenitis 2,462 3.3 2,336 2.5 4,798 2.8 6. Hypertensive disease 1,742 2.3 2,724 2.9 4,466 2.6 7. Acute myocardial infarction and other ischaemic heart
diseases 2,699 3.6 1,729 1.8 4,428 2.6
8. Abdominal and pelvic pain 1,589 2.1 2,110 2.3 3,699 2.2 9. Fractures 2,476 3.3 1,199 1.3 3,675 2.210. Infections of the skin and subcutaneous tissue 1,856 2.5 1,093 1.2 2,949 1.711. Dorsopathies 1,670 2.2 1,261 1.3 2,931 1.712. Mental and behavioural disorders due to use of alcohol 2,495 3.3 215 0.2 2,710 1.613. Anaemias 756 1.0 1,843 2.0 2,599 1.514. Asthma 1,098 1.5 1,403 1.5 2,501 1.515. Poisonings and toxic effects of drugs and other substances 1,203 1.6 1,171 1.2 2,374 1.416. Non-inflammatory disorders of female genital tract 0.0 2,302 2.5 2,302 1.417. Cerebrovascular disease 1,211 1.6 979 1.0 2,190 1.318. Malaise and fatigue 660 0.9 1,103 1.2 1,763 1.019. Bronchitis, emphysema and other chronic obstructive
pulmonary diseases 914 1.2 816 0.9 1,730 1.0
20. Epilepsy 845 1.1 644 0.7 1,489 0.921. Convulsions, elsewhere classified (excluding newborns) 878 1.2 589 0.6 1,467 0.922. Nausea and vomiting 584 0.8 766 0.8 1,350 0.823. Pain in throat and chest 826 1.1 482 0.5 1,308 0.824. Diseases of male genital organs 1,296 1.7 0.0 1,296 0.825 Complications following spontaneous and other abortions 0.0 1,293 1.4 1,293 0.826. Dyspnoea and other abnormalities of breathing 562 0.7 633 0.7 1,195 0.727. Fever of unknown origin 585 0.8 571 0.6 1,156 0.728. Calculus of kidney and ureter 806 1.1 312 0.3 1,118 0.729. Disorders of breast 21 0.0 1,000 1.1 1,021 0.630. Disorders of menstruation 0 0.0 1,018 1.1 1,018 0.631. Gastrointestinal haemorrhage, unspecified 685 0.9 312 0.3 997 0.632. Benign neoplasm of uterus 0.0 971 1.0 971 0.633. Heart Failures 414 0.5 543 0.6 957 0.635. Oedema, proteinuria and hypertensive disorders in
pregnancy, childbirth and the puerperium 0.0 856 0.9 856 0.5
36. Varicose veins of lower extremities 313 0.4 529 0.6 842 0.537. Pneumonia 280 0.4 276 0.3 556 0.3
All other causes 34,952 46.3 39,821 42.5 74,773 44.2TOTAL
75,451 100.0 93,722 100.0 169,173 100.0
Note: The above table is based on data received on in-patients from the regional and district hospitals.
The table on page 50 contains the total number of cases treated at regional, district and specialised hospitals.

74
ISLAND OF MAURITIUS
GENERAL HOSPITALS DISCHARGES (INCLUDING DEATHS) BY I.C.D - 10 CHAPTER AND SEX - 2012
CAUSE ( ICD - 10 ) DISCHARGES *
MALE FEMALE TOTAL
No. % No. % No. %
1. Certain infectious & parasitic diseases 2,924 3.9 3,670 3.9 6,594 3.9
2. Neoplasms 2,270 3.0 4,094 4.4 6,364 3.8
3. Diseases of the blood & blood-forming organs and certain disorders involving the immune mechanism
1,166 1.5 1,943 2.1 3,109 1.8
4. Endocrine, nutritional & metabolic diseases
4,747 6.3 5,169 5.5 9,916 5.9
5. Mental & behavioural disorders 3,069 4.1 1,349 1.4 4,418 2.6
6. Diseases of the nervous system 1,814 2.4 1,664 1.8 3,478 2.1
7. Diseases of the eye & adnexa 66 0.1 55 0.1 121 0.1
8. Diseases of the ear & mastoid process 82 0.1 105 0.1 187 0.1
9. Diseases of the circulatory system 7,942 10.5 8,049 8.6 15,991 9.5
10. Diseases of the respiratory system 8,564 11.4 8,549 9.1 17,113 10.1
11. Diseases of the digestive system 7,046 9.3 5,138 5.5 12,184 7.2
12. Diseases of the skin & subcutaneous tissue
2,835 3.8 2,036 2.2 4,871 2.9
13. Diseases of the musculoskeletal system & connective tissue
3,221 4.3 3,032 3.2 6,253 3.7
14. Diseases of the genitourinary system 4,210 5.6 6,853 7.3 11,063 6.5
15. Pregnancy, childbirth & the puerperium - 0.0 21,205 22.6 21,205 12.5
16. Certain conditions originating in the perinatal period
1,454 1.9 1,447 1.5 2,901 1.7
17 Congenital malformations, deformations & chromosomal abnormalities
311 0.4 166 0.2 477 0.3
18 Symptoms, signs & abnormal clinical & laboratory findings, not elsewhere classified
9,347 12.4 9,956 10.6 19,303 11.4
19 & 20
Injury, poisoning & certain other consequences of external causes
11,594 15.4 6,850 7.3 18,444 10.9
21 Factors influencing health status & contact with health services
2,789 3.7 2,392 2.6 5,181 3.1
T O T A L 75,451
100.0
93,722
100.0
169,173
100.0
* based on data receivedNB: For total number of admissions, see Page 50
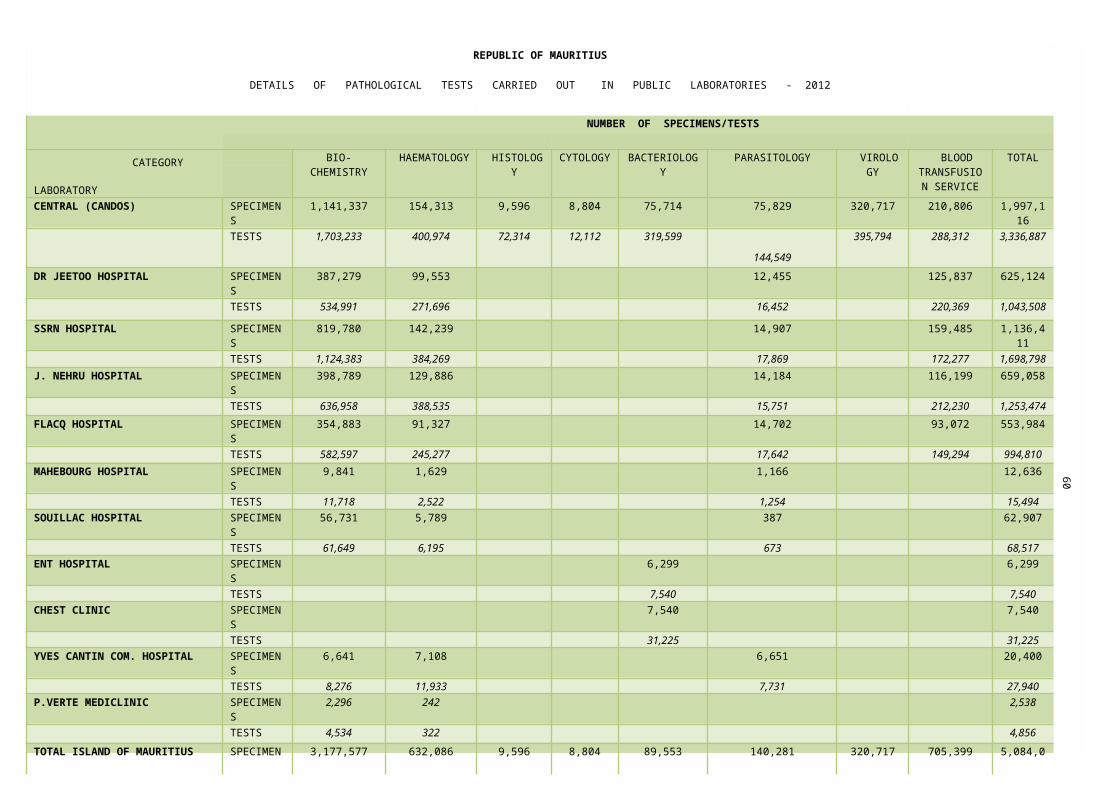
ISLAND OF MAURITIUS
GENERAL HOSPITAL DISCHARGES (INCLUDING DEATHS) BY ICD-10 CHAPTER, AGE-GROUP AND SEX - 2012
75
M A L E S F E M A L E SCAUSES Unde
r1 - 4 5 -
1213- 19
20- 39
40- 59
60 years
Under
1 - 4 5 - 12 13- 19
20- 39
40- 59 60 years
(I.C.D. 10th REVISION) 1 year
years
years years years years & over 1 year
years
years years years years & over
1. Certain infectious & parasitic diseases 227 441 386 214 563 613 480 222 445 402 300 512 706 1,083 2. Neoplasms 4 114 195 128 238 730 861 15 81 165 50 508 2,087 1,188 3. Diseases of the blood & blood-
forming organs and certain disorders involving the immune mechanism
17 133 322 92 151 175 276 22 89 166 196 393 564 513
4. Endocrine, nutritional & metabolic diseases
17 45 15 24 364 2,079 2,203 6 2 20 66 305 1,689 3,081
5. Mental & behavioural disorders 2 1 13 102 896 1,659 396 1 1 12 118 444 461 312 6. Diseases of the nervous system 12 35 96 129 489 626 427 7 36 96 161 370 501 493 7. Diseases of the eye & adnexa 4 3 3 4 9 26 17 3 3 2 6 7 16 18 8. Diseases of the ear & mastoid process 17 27 5 5 6 14 8 19 11 3 2 13 27 30 9. Diseases of the circulatory system 7 11 15 43 686 3,435 3,745 13 1 28 55 534 2,552 4,866 10. Diseases of the respiratory system 848 1,521 1,128 440 1,145 1,400 2,082 616 1,255 870 442 893 1,569 2,904 11 Diseases of the digestive system 53 108 223 251 1,865 2,766 1,780 34 74 209 374 1,014 1,514 1,919 12. Diseases of the skin & subcutaneous
tissue38 77 132 193 724 1,081 590 48 50 96 180 464 667 531
13. Diseases of the musculoskeletal system & connective tissue
6 21 84 100 917 1,521 572 7 21 52 146 608 1,387 811
14 Diseases of the genitourinary system 18 100 203 161 911 1,683 1,134 14 35 97 530 2,273 2,816 1,088 15 Pregnancy, childbirth & the
puerperium - - - - - - - - -
32,989 17,665
548
-
16 Certain conditions originating in the perinatal period
1,454 - - - - - - 1,447 - - - - - -
17. Congenital malformations, deformations & chromosomal abnormalities
118 83 70 20 18 2 - 64 36 30 12 20 3 1
18 Symptoms, signs & abnormal clinical & laboratory findings, not elsewhere classified
359 596 852 536 1,685 2,706 2,613 261 527 763 887 1,981 2,346 3,191
19.& 20
Injury, poisoning & certain other consequences of external causes
99 465 883 1,076 3,928 3,579 1,564 100 386 400 724 1,702 1,529 2,009
21. Factors influencing health status & contact with health services
224 70 170 147 522 921 735 216 29 68 129 801 696 453
T o t a l 3,524
3,851
4,795 3,665 15,117
25,016
19,483 3,115
3,082
3,482 7,367 30,507
21,678 24,491
# *

# 12 years old * 40-45 years
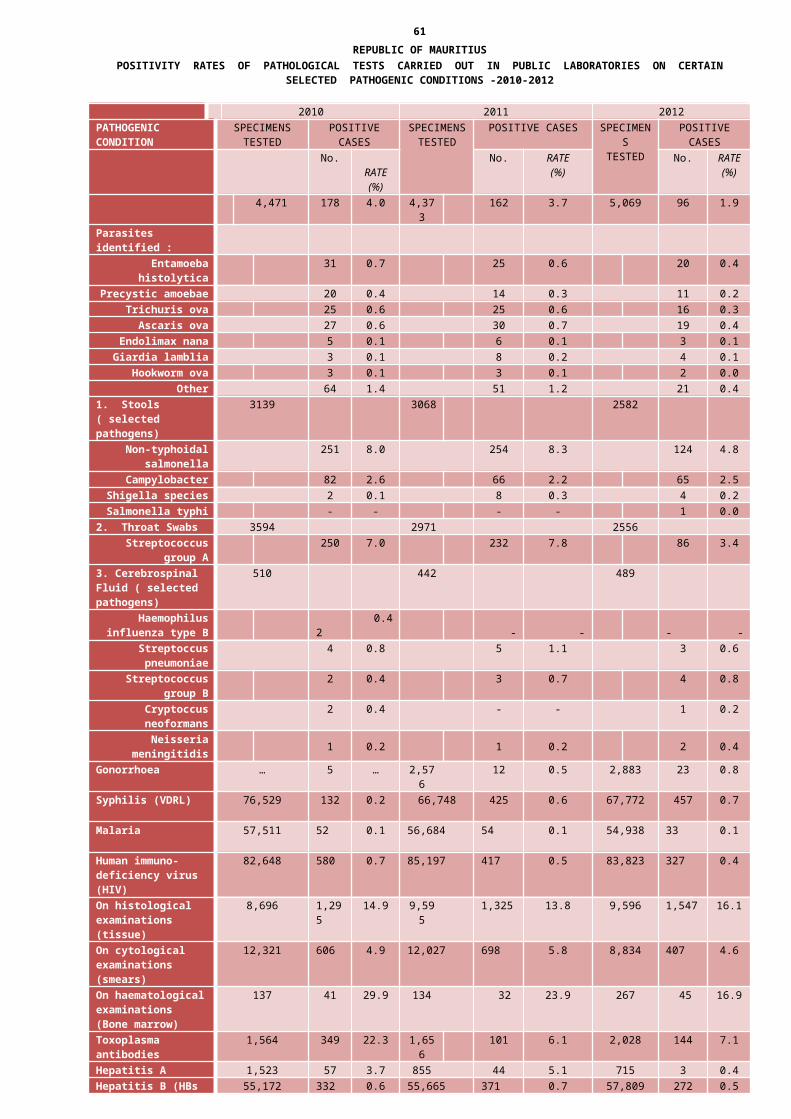
76 ISLAND OF MAURITIUS
CHILDREN UNDER ONE YEAR*
CERTAIN PRINCIPAL CAUSES OF GENERAL HOSPITALS DISCHARGES (INCLUDING DEATHS) - 2012
CAUSE ( I.C.D - 10 ) NUMBER OF DISCHARGES
MALE FEMALE TOTALNo. %
1. Acute Upper Respiratory infections 525 408 933 14.1 2. Slow fetal growth, fetal malnutrition and disorders related to
short gestation and low birthweight393 409 802 12.1
3. Acute bronchitis and bronchiolitis 322 233 555 8.4 4. Diarrhoea and gastro-enteritis of presumed infectious origin 207 199 406 6.1 5. Newborn affected by maternal factors and by complications of
pregnancy, labour and delivery153 184 337 5.1
6. Septicaemia and infections specific to the perinatal period 126 122 248 3.7 7. Nausea and vomiting , including newborns 125 118 243 3.7 8. Fever of unknown origin 103 67 170 2.6 9. Diseases of the Digestive System 53 34 87 1.3 10.
Convulsions, including newborns 35 33 68 1.0
11.
Abdominal and pelvic pain 33 32 65 1.0
12.
Intrauterine hypoxia and birth asphysia 35 26 61 0.9
13.
Cough 39 15 54 0.8
14.
Infections of the skin and subcutaneous tissue 26 28 54 0.8
15.
Pneumonia, including newborns 26 25 51 0.8
16.
Anaemias, including newborns 18 19 37 0.6
17.
Diseases of the Genito-urinary System 18 14 32 0.5
18.
Respiratory distress of newborn 14 17 31 0.5
19.
Dyspnoea and other abnormalities of breathing 16 12 28 0.4
20.
Neonatal aspiration syndromes 19 7 26 0.4
21.
Congenital deformities of feet 14 9 23 0.3
22.
Fractures 14 9 23 0.3
23.
Diseases of the Nervous System 12 7 19 0.3
24.
Diseases of the musculoskeletal system and connective tissue 6 7 13 0.2
25.
Cleft lip and cleft palate 5 7 12 0.2
26.
Asthma 4 - 4 0.1
All other causes 1,183
1,074 2,257
34.0
TOTAL 3,524
3,115 6,639
100.0
Note: Healthy babies born in hospitals and not requiring special care are excluded from the above figures.* includes babies admitted in the Neonatal Intensive Care Units ( see page 93 )

77 ISLAND OF MAURITIUS
NEOPLASMSGENERAL HOSPITALS DISCHARGES (INCLUDING DEATHS) BY TYPE AND SEX - 2012
TYPE OF NEOPLASM MALE FEMALE
TOTAL(I.C.D - 10)
Malignant neoplasm of lip, oral cavity and pharynx 152 35 187Malignant neoplasm of oesophagus 42 25 67Malignant neoplasm of stomach 123 75 198Malignant neoplasm of colon 91 138 229Malignant neoplasm of rectosigmoid junction, rectum, anus and anal canal 106 79 185Malignant neoplasm of liver and intrahepatic bile ducts 21 16 37Malignant neoplasm of pancreas 37 21 58Other malignant neoplasm of digestive organs 20 27 47Malignant neoplasm of larynx 45 4 49Malignant neoplasm of trachea,bronchus and lung 168 117 285Other malignant neoplasm of respiratory and intrathoracic organs 16 22 38Malignant neoplasm of bone and articular cartilage 19 14 33Malignant neoplasm of skin, including melanoma 8 15 23Malignant neoplasm of mesothelial and soft tissue 45 93 138Malignant neoplasm of breast 6 857 863Malignant neoplasm of cervix uteri 201 201Malignant neoplasm of other and unspecified parts of the uterus 101 101Other Malignant neoplasms of female genital organs 282 282Malignant neoplasm of prostrate 117 117Other malignant neoplasm of male genital organs 57 57Malignant neoplasm of bladder 88 49 137Other malignant neoplasm of urinary tract 33 38 71Malignant neoplasm of eye and adnexa 1 - 1Malignant neoplasm of central nervous system, including brain 32 28 60Malignant neoplasm of other , ill-defined, secondary, unspecified and multiple sites 89 219 308Hodgkin's disease 54 26 80Non-Hodgkin's lymphoma 49 44 93Leukaemia 365 80 445Other malignant neoplasms of lymphoid, haematopoietic and related tissue 27 66 93Carcinoma in situ of cervix uteri 13 13Benign neoplasm of skin 15 28 43Benign neoplasm of breast - 18 18Leiomyoma of uterus 964 964Benign neoplasm of ovary - -Benign neoplasm of urinary organs 1 - 1Benign neoplasm of brain and other parts of central nervous system 20 21 41Other in situ and benign neoplasms and neoplasms of uncertain and unknown behaviour 423 378 801
TOTAL 2,270 4,094 6,364
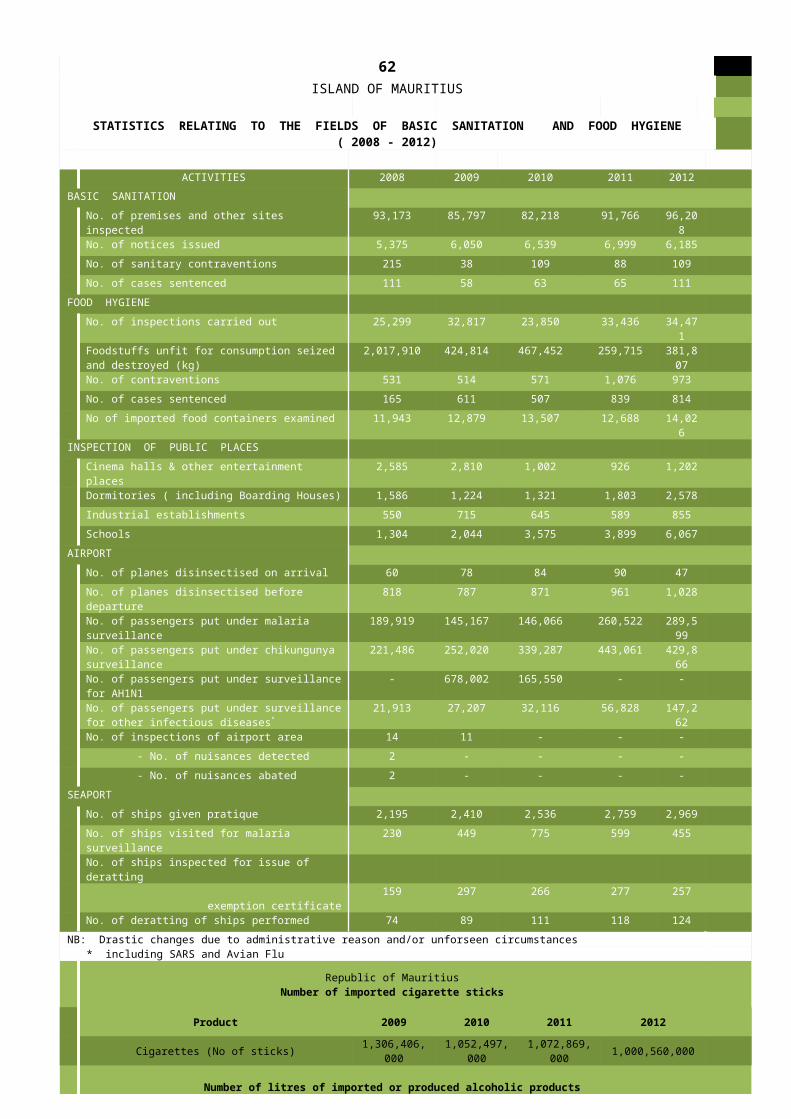
`
78
GENERAL HOSPITALS DISCHARGES (INCLUDING DEATHS) DUE TO DISEASES OF THE CIRCULATORY SYSTEM
BY AGE-GROUP AND SEX - 2012
MALES FEMALES TOTAL
CAUSES Under 30-44
45-59
60-74
75+ Under 30-44
45-59
60-74
75+ Under 30-44
45-59
60-74
75+ ALL AGES
(I.C.D. 10) 30 years
years
years
years
years
30 years
years
years
years
years
30 years
years
years
years
years
Acute rheumatic fever - 1 - - - - - 1 - - - 1 1 - - 2
Chronic rheumatic heart disease 1 2 2 1 - 2 1 3 4 1 3 3 5 5 1 17
Hypertensive diseases 56 254 662 520 250 38 253 826 982 625 94 507 1,488
1,502
875 4,466
Acute Myocardial Infarction 4 100 375 237 75 1 15 104 125 95 5 115 479 362 170 1,131
Other Ischaemic Heart diseases 17 197 853 627 214 3 73 385 618 310 20 270 1,238
1,245
524 3,297
Pulmonary embolism 1 1 5 3 3 - 3 5 5 3 1 4 10 8 6 29
Conduction disorders and cardiac arrhythmias
28 58 178 323 145 20 59 187 262 293 48 117 365 585 438 1,553
Heart failure 7 13 96 185 113 1 16 71 222 233 8 29 167 407 346 957
Other heart diseases 21 54 77 57 45 20 14 29 72 51 41 68 106 129 96 440
Cerebrovascular diseases (strokes) 12 105 401 481 212 14 63 221 354 327 26 168 622 835 539 2,190
Diseases of arteries,arterioles and capillaries
6 8 26 24 14 4 6 8 9 12 10 14 34 33 26 117
Phlebitis, thrombophlebitis,venous embolism and thrombosis
10 27 55 25 11 14 30 30 19 7 24 57 85 44 18 228
Varicose veins of lower extremities 19 76 128 72 18 14 131 242 123 19 33 207 370 195 37 842
Haemorrhiods 30 65 53 27 5 47 56 36 21 5 77 121 89 48 10 345
Other Diseases of circulatory system
36 37 40 35 23 65 31 41 42 27 101 68 81 77 50 377
T O T A L (Circulatory system) 248 998 2,951
2,617
1,128
243 751 2,189
2,858
2,008
491 1,749
5,140
5,475
3,136
15,991
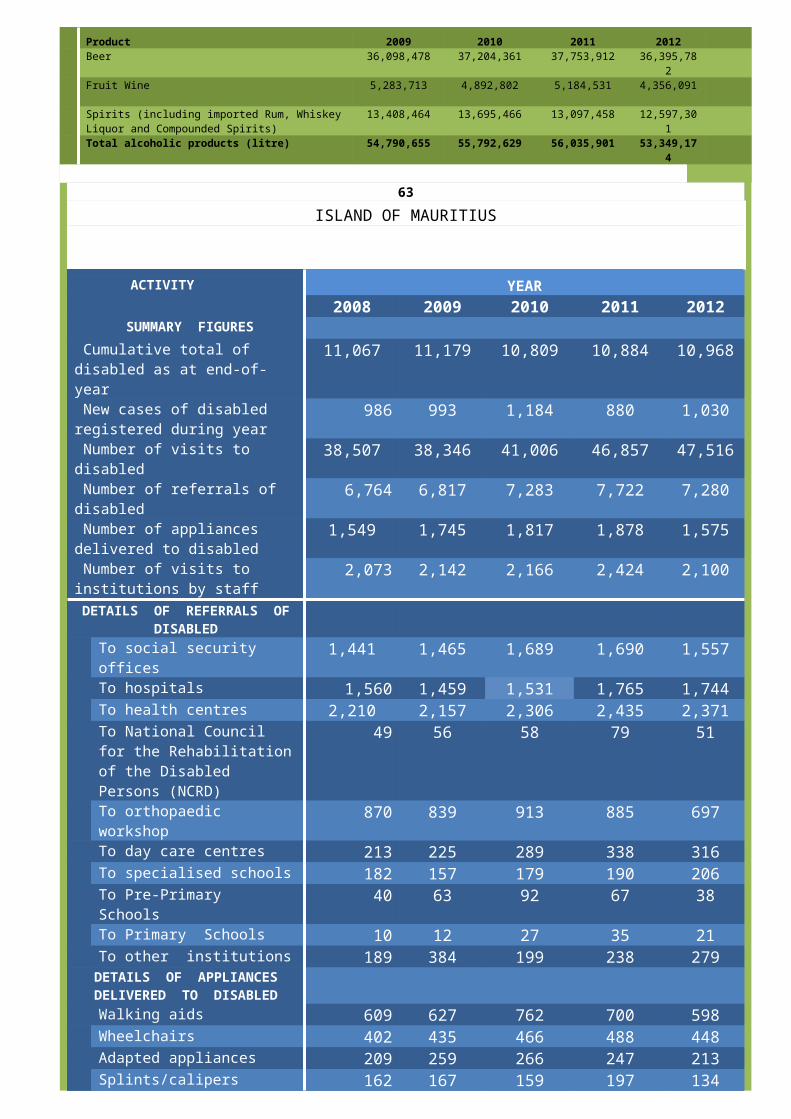
79
ISLAND OF MAURITIUSINJURY AND POISONING
DISCHARGES FROM GENERAL HOSPITAL (including deaths)
BY EXTERNAL CAUSE AND SEX - 2012
CAUSE (I.C.D.- 10 ) DISCHARGES
MALE FEMALE TOTALNo.
Transport Accidents 1,626
390
2,016
Falls 4,377
2,931
7,308
Contact with sharp glass, knife and non-powered hand tool
145
50
195
Foreign body entering into or through eye or natural orifice
76
49
125
Exposure to other Inanimate Mechanical Forces
261
65
326
Exposure to Animate Mechanical Forces 88
44
132
Accidental Drowning and Submersion 13
10
23
Exposure to Electric Current 30
15
45
Exposure to Smoke, Fire and Flames 69
40
109
Contact With Heat and Hot Substances 86
85
171
Contact With Venomous Animals and Plants 138
44
182
Accidental Poisoning by & Exposure to Noxious Substances
701
802
1,503
Other & Unspecified accidents 1,468
560
2,028
Intentional Self-Poisoning by drugs 243
369
612
Intentional Self-Poisoning by Pesticides 45
24
69
Other Intentional Self-Harm 175
167
342

80 ISLAND OF MAURITIUS
CERTAIN PRINCIPAL CAUSES OF FIRST ATTENDANCES FOR THE TREATMENT OF COMMON DISEASES AND INJURIES AT THE COMMUNITY HOSPITALS, MEDICLINICS, AREA HEALTH CENTRES & COMMUNITY
HEALTH CENTRES - 2012 (See also distribution of first attendances by I.C.D. Chapter on page 81)
CAUSE (I.C.D. 10)
FIRST ATTENDANCES *
MALE FEMALE TOTAL
No. %1 Tonsilitis, laryngitis, nasopharyngitis, sore throat and Upper
Respiratory Tract Infection (URTI) 152,291 163,905 316,196 17.8
2 Superficial injury, open wound, sprain/strain, fractures, burns and other injuries
76,521 60,121 136,642 7.7
3 Cough, pain in throat, chest pain, wheezing, hiccough, sneezing
61,923 65,450 127,373 7.2
4 Fever / pain all over 57,556 63,072 120,628 6.8
5 Influenza 37,893 41,730 79,623 4.5
6 Spondylosis, neck pain, low back pain, backache 37,310 39,009 76,319 4.3
7 Abdominal and epigastric pain 33,174 37,726 70,900 4.0
8 Dermatitis, eczema , itching, ingrowing nail, acne, vitiligo and other diseases of the skin and subcutaneous tissue
32,099 35,566 67,665 3.8
9 Headache, dizziness, giddiness 28,488 34,784 63,272 3.6
10 Gastritis and duodenitis 30,354 32,812 63,166 3.6
11 Rheumatism, muscular pain, myalgia, pain in limb 27,735 32,727 60,462 3.4
12 Gastroenteritis and diarrhoea of presumed infectious origin 29,901 30,347 60,248 3.4
13 Sinusitis, rhinitis, nasal polyp, blocked nose 26,013 29,073 55,086 3.1
14 Nausea and vomiting 19,289 24,792 44,081 2.5
15 Malaise, fatigue , weakness, blackout, fainting and other symptoms and signs
17,751 22,374 40,125 2.3
16 Gout , arthritis, pain in joint 18,685 18,610 37,295 2.1
17 Conjunctivitis 16,222 17,066 33,288 1.9
18 Bronchitis, emphysema, asthma 15,226 15,547 30,773 1.7
19 Indigestion, constipation, irritable bowel syndrome, anal / rectal abscess
14,754 15,051 29,805 1.7
20 Otitis, wax in ear, earache and other diseases of the ear and mastoid process
13,890 14,741 28,631 1.6
21 Skin abscess , boil, cellulitis, cyst, septic leg (non-diabetic) 12,590 11,848 24,438 1.4
22 Hypertension 9,736 10,780 20,516 1.2
23 Localised swelling, mass, lump of skin, rash 9,068 10,721 19,789 1.1
24 Diabetes Mellitus 8,104 9,053 17,157 1.0
25 Swelling gum, gingivitis, dental caries, stomatitis, disease of lip
8,321 8,268 16,589 0.9
26 Helminthiasis (worms) 7,969 8,426 16,395 0.9
27 Diseases of the eye and adnexa (excluding conjunctivitis) 7,294 8,025 15,319 0.9
28 Cystitis, urinary tract infection 5,051 9,790 14,841 0.8
29 Migraine and other diseases of the nervous system 5,564 7,065 12,629 0.7
30 Vaginitis, bleeding PV, leukorrhoea, menstrual disorders 11,924 11,924 0.7
31 Varicose veins of lower extremities, haemorrhoids,oesophageal varices
4,123 4,857 8,980 0.5
32 Haematuria, painful micturation, retension of urine 4,092 4,526 8,618 0.5
33 Scabies 4,144 4,378 8,522 0.5
34 Hypotention and other diseases of the circulatory diseases 2,649 3,593 6,242 0.4
35 Alcoholism 4,539 1,678 6,217 0.4
All other causes 9,165 12,810 21,975 1.2
TOTAL
849,484 922,245 1,771,729 100.0
Refer to page 54 for statistics on attendances by health centre * based on the Monthly Returns of Sick Treated received

81
ISLAND OF MAURITIUSFIRST ATTENDANCES FOR THE TREATMENT OF COMMON DISEASES AND INJURIES
AT THE COMMUNITY HOSPITALS, MEDICLINICS, AREA HEALTH CENTRES AND COMMUNITY HEALTH CENTRES BY I.C.D. CHAPTER - 2012
CHAPTER (I.C.D. 10)
FIRST ATTENDANCES *
MALE FEMALE
TOTAL
No. %
1. Certain infectious & parasitic diseases 42,456 43,725 86,181 4.9
2. Neoplasms 46 109 155 0.0
3. Diseases of the blood & blood-forming organs and certain disorders involving the immune mechanism
1,595 4,045 5,640 0.3
4. Endocrine, nutritional & metabolic diseases 9,262 10,518 19,780 1.1
5. Mental & behavioural disorders 5,319 2,471 7,790 0.4
6. Diseases of the nervous system 5,159 6,680 11,839 0.7
7. Diseases of the eye & adnexa 23,516 25,091 48,607 2.7
8. Diseases of the ear & mastoid process 13,890 14,741 28,631 1.6
9. Diseases of the circulatory system 16,508 19,230 35,738 2.0
10. Diseases of the respiratory system 232,986 251,708 484,694 27.4
11. Diseases of the digestive system 53,975 56,657 110,632 6.2
12. Diseases of the skin & subcutaneous tissue 44,689 47,414 92,103 5.2
13. Diseases of the musculoskeletal system & connective tissue
85,253 92,062 177,315 10.0
14. Diseases of the genitourinary system 5,386 22,191 27,577 1.6
15. Pregnancy, childbirth & the puerperium 0 446 446 0.0
16. Certain conditions originating in the perinatal period
244 188 432 0.0
17 Congenital malformations, deformations & chromosomal abnormalities
638 562 1,200 0.1
18 Symptoms, signs & abnormal clinical & laboratory findings, not elsewhere classified
231,341 263,445 494,786 27.9
19 Injury, poisoning & certain other consequences of external causes
77,221 60,962 138,183 7.8
T O T A L 849,484 922,245 1,771,729 100.0
* based on the Monthly Return of Sick Treated received
Refer to page 54 for statistics on attendances by health centre

82
CASES # TREATED AS IN-PATIENTS AT S. BHARATI (EYE) HOSPITAL - 2012
CAUSE (ICD.10) NUMBER OF CASES * NUMBER OPERATED UPON
MALE FEMALE TOTAL MALE FEMALE
TOTAL
No %1 Chalazion 5 11 16 0.2 5 9 14
2 Other disorders of eyelid 36 44 80 1.2 28 35 63
3 Disorders of lacrimal system 9 24 33 0.5 8 17 25
4 Disorders of orbit 5 3 8 0.1 3
-
3
5 Disorders of conjunctiva 14 13 27 0.4 7 4 11
6 Keratitis 19 20 39 0.6 3
1 4
7 Other disorders of sclera and cornea 63 40 103 1.5 40 26 66
8 Iridocyclitis 8 5 13 0.2 1
2
3
9 Other disorders of iris and ciliary body 19 8 27 0.4 11 3 14
10 Cataract 2,026 2,444 4,470 65.6 1,979 2,393 4,372 11 Other disorders of lens 35 23 58 0.9 31 22 53
12 Disorders of choroid 1 4 5 0.1 -
1
1
13 Disorders of retina 151 93 244 3.6 121 71 192
14 Glaucoma 48 41 89 1.3 23 13 36 15 Disorders of vitreous body and globe 155 113 268 3.9 131 93 224
16 Disorders of optic nerve and visual pathways
11 8 19 0.3 1 2
3
17 Disorders of ocular muscles, binocular movement, accomodation and refraction
38 30 68 1.0 28 25 53
18 Visual disturbances and blindness 121 56 177 2.6 27 11 38
19 Ocular pain 295 232 527 7.7 46 21 67
20 Other diseases of eye and adnexa 4 1 5 0.1 3 1 4
21 Cancer and other neoplasms 12 11 23 0.3 9 10 19
22 Congenital diseases of eye - - - 0.0 - - -
26 Other diseases 4 2
6 0.1 3
2 5
23 Burn and corrosion - - -
0.0 -
-
-
24 Injuries and other consequences of external causes
333 146 479 7.0 108 27 135
25 Surgical follow up care, examination and other non-morbid factors
24 8 32 0.5 20 7 27
TOTAL 3,436 3,380 6,816 100.0 2,636 2,796 5,432
* including number operated upon # based on data received (see page 50 for total admissions and operations)

83
CASES TREATED AS IN-PATIENTS AT POUDRE D'OR (CHEST) HOSPITAL - 2012
DISEASEDEATHS DISCHARGES (INC.
DEATHS)(I.C.D. 10) MALE FEMALE TOTAL MAL
EFEMALE TOTAL
No. % Pulmonary tuberculosis 9 1 10 135 80 215 23.9 Pulmonary fibrosis 4 1 5 23 11 34 3.8 Other Respiratory tuberculosis - - - - - - 0.0 Tuberculosis of Bones and Joints - - - - - - 0.0 Other tuberculosis - - - - 2 2 0.2 Miliary tuberculosis - - - - 1 1 0.1 Cancer of bronchus & lung 7 1 8 37 19 56 6.2 Cancer of other respiratory and Intrathoracic organs - - - 6 4 10 1.1 Pneumonia - 1 1 22 12 34 3.8 Acute bronchitis - - - 2 - 2 0.2 Chronic Bronchitis - - - 5 - 5 0.6 Bronchitis not elsewhere specified - - - 4 - 4 0.4 Emphysema - - - - - - 0.0 Asthma 8 2 10 124 90 214 23.8 Bronchiectasis - - - 10 3 13 1.4 Alveolitis - - - 2 - 2 0.2 Abscess of lung and mediastinum - 1 1 18 15 33 3.7 Emphyema 1 - 1 7 2 9 1.0 Pleurisy without mention of tuberculosis 2 - 2 54 18 72 8.0 HIV with pulmonary tuberculosis 1 - 1 11 3 14 1.6 HIV with pneumonia 2 - 2 6 2 8 0.9 HIV with other respiratory infections 4 - 4 20 7 27 3.0 HIV with other infections or diseases - - - - - - 0.0 Other diseases of the respiratory system 1 2 3 86 39 125 13.9 Other diseases - - - 6 13 19 2.1
TOTAL 39 9 48 578 321 899 100.0
CASES SEEN AT OUT-PATIENT SPECIALIST CLINICS IN CHEST DISEASES - 2012
DISEASE MALE FEMALE TOTAL No. % Pulmonary tuberculosis 53 26 79 8.1 Pulmonary fibrosis 9 8 17 1.7 Other respiratory tuberculosis 1 - 1 0.1 Tuberculosis of bones and joints 1 1 2 0.2 Other tuberculosis 1 - 1 0.1 Miliary tuberculosis - - - 0.0 Cancer of lung & bronchus 11 1 12 1.2 Cancer of other respiratory and intrathoracic organs - - 0 0.0 Pneumonias 6 3 9 0.9 Acute bronchitis 2 4 6 0.6 Chronic bronchitis 7 7 14 1.4 Bronchitis not otherwise specified 8 2 10 1.0 Emphysema 18 28 46 4.7 Asthma 197 213 410 41.8 Bronchiectasis 2 - 2 0.2 Abscess of lung and mediastinum 8 8 16 1.6 Emphyema - - - 0.0 Pleurisy, without mention of tuberculosis 18 3 21 2.1 HIV with pulmonary tuberculosis 5 - 5 0.5 HIV with pneumonia 1 1 2 0.2 HIV with other respiratory infections 9 2 11 1.1 Other diseases of the respiratory system 150 152 302 30.8 Other diseases 9 6 15 1.5 Total cases diagnosed (First attendances) 516 465 981 100.
0 SUBSEQUENT ATTENDANCES 8,599 8,402 17,001 TOTAL 9,115 8,867 17,982
Note: Cases whose condition necessitated immediate admission have been excluded from the above figures

84
CASES TREATED AS IN-PATIENTS AT BROWN SEQUARD PSYCHIATRIC HOSPITAL - 2012
CAUSE (I.C.D. 10)
MALE FEMALE TOTAL
No. % No. % No. %
Dementia 10 0.3 20 1.4 30 0.7 Epileptic Psychosis NOS 43 1.5 32 2.3 75 1.7
Unspecified mental disorders due to brain damage and dysfunction and to physical disease
5 0.2 1 0.1 6 0.1
Mental and behavioural disorders due to use of alcohol
1,624 55.0 224 16.1 1,848
42.5
Mental and behavioural disorders due to use of opioids/cannabinoids
2 0.1 - 0.0 2 0.0
Mental and behavioural disorders due to multiple drug use and use of other psychoactive substances
54 1.8 7 0.5 61 1.4
Schizophrenia 719 24.3 627 45.1 1,346
31.0
Delusional disorder 4 0.1 5 0.4 9 0.2 Acute psychotic episode 98 3.3 86 6.2 184 4.2 Schizoaffective psychosis NOS - 0.0 2 0.1 2 0.0 Psychosis unspecified 41 1.4 31 2.2 72 1.7 Hypomania 23 0.8 22 1.6 45 1.0 Bipolar affective disorder 33 1.1 41 2.9 74 1.7 Depressive episode 112 3.8 162 11.7 274 6.3 Persistent mood disorders - 0.0 2 0.1 2 0.0 Anxiety disorders 4 0.1 3 0.2 7 0.2 Obsessive compulsive disorder 3 0.1 2 0.1 5 0.1 Dissociative (conversion) disorders 2 0.1 2 0.1 4 0.1 Puerperal psychosis NOS - 0.0 4 0.3 4 0.1 Mental retardation 52 1.8 36 2.6 88 2.0 Conduct disorders 66 2.2 31 2.2 97 2.2 Parkinsonism 2 0.1 - 0.0 2 0.0 Alzheimer 2 0.1 2 0.1 4 0.1 Degenerative disease of nervous system, unspecified
1 0.0 - 0.0 1 0.0
Grand mal seizures, unspecified (with or without petit mal)
6 0.2 7 0.5 13 0.3
Epilepsy, unspecified 13 0.4 8 0.6 21 0.5 Sleep disorders 1 0.0 2 0.1 3 0.1 Other mental & behavioural causes 6 0.2 11 0.8 17 0.4 Other causes 28 0.9 20 1.4 48 1.1 T O T A L 2,954 100.
01,390 100.
04,34
4 100.
0

85
ISLAND OF MAURITIUSQUARTERLY DISTRIBUTION OF NEW CASES DIAGNOSED AT OUT-PATIENT
SPECIALIST CLINICS IN DERMATOLOGY - 2012
NO
DISEASE FIRST QUARTE
R
SECOND QUARTE
R
THIRD QUARTE
R
FOURTH QUARTE
R
T O T A L NUMBER
%
1 ACNE 247 386 249 183 1065 7.7 2 Pemphigus 6 4 - 4 14 0.1 3 BULLOUS
DERMATOSIS Pemphigoid 1 5 3
- 9 0.1
4 D. Herpetiformis - -
- -
-
0.0
5 CONGENITAL ANOMALIES OF THE TEGUMENT
18 30 25 9 82 0.6
6 CORNS AND CALLOSITIES 83 116 92 109 400 2.9 7 DISEASES OF
CONNECTIVE TISSUE
Lupus Erythematosus
9 8 - 8 24 0.2
8 Scleroderma 0 4 - 3 6 0.0 9 Rheumatoid
arthritis 0 15 6
- 21 0.2
10 DISEASES OF NAIL AND HAIR 188 202 209 145 745 5.4 11 DISORDERS OF
PIGMENTATION Vitiligo 45 67 39 43 194 1.4
12 Melanosis of face 24 59 33 14 130 0.9 13 Other 9 24 6 16 56 0.4 14 DRUG INDUCED DERMATOSIS 15 48 25 18 106 0.8 15 ECZEMA Atopic dermatitis 193 261 290 223 968 7.0
Contact dermatitis: 16 industrial
origin71 114 42 66 292 2.1
17 other origin 233 156 259 124 773 5.6 18 Stasis eczema 101 140 101 101 443 3.2 19 LICHEN PLANUS 40 48 39 21 149 1.1 20 NEOPLASM OF SKIN Malignant 6 13 1 1 21 0.2 21 Benign 43 34 23 21 121 0.9 22 PHOTODERMATITIS 112 95 30 76 313 2.3 23 PSORIASIS AND SIMILAR DISORDERS 284 298 304 236 1122 8.1 24 ROSACEA 26 32 28 24 110 0.8 25 SEBORRHEIC DERMATITIS 62 126 126 57 371 2.7 26 SKIN
INFECTIONS Fungal 502 464 399 356 1722 12.4
27 Parasitic 203 232 305 209 951 6.8 28 Pyococcal 117 162 208 114 601 4.3 29 Viral 288 223 237 175 924 6.6 30 ULCER OF LOWER LIMBS 15 61 25 13 114 0.8 31 URTICARIA 106 168 114 76 463 3.3 32 ALL OTHER DISEASES 397 540 410 252 1601 11.5 TOTAL 3,447 4,134 3,629 2,695 13911 100.0

86 NEW CASES# DIAGNOSED AT OUT-PATIENT CLINICS SPECIALISED IN ENT IN 2012
DISEASE( I.C.D 1975 Revision ) FIRST QUARTER
SECOND QUARTER
THIRD QUARTE
R
FOURTH QUARTER
T O T A LNUMBER %
EAR Acute non-suppurative otitis media
34 47 32 36 149 2.0
Acute suppurative otitis media
36 18 38 16 108 1.5
Chronic tubotympanic suppurative otitis media
95 63 66 95 319 4.3
Chronic atticoantral suppurative otitis media
34 56 43 56 190 2.5
Unspecified chronic suppurative otitis media
5 23 11 9 47 0.6
Otitis externa 75 97 79 106 357 4.8 Impacted cerumen 32 36 34 29 131 1.8
Tinnitus 104 108 133 129 475 6.4 Conductive deafness 27 36 54 45 163 2.2
Sensorineural deafness 122 156 194 167 640 8.6 Eustachian tube disorders 23 36 43 27 129 1.7
Foreign body in ear 14 25 14 11 63 0.8 Ear injury 9 45 27 14 95 1.3
All other diseases and conditions of ear
9 16 41 16 81 1.1
NOSE
Acute nasopharyngitis 20 20 23 14 77 1.0 Sinusitis (acute) (chronic) 70 122 138 111 441 5.9 Allergic rhinitis 219 253 228 233 933 12.5 Epistaxis 59 59 75 81 273 3.7 Nasal polyps 54 52 41 45 192 2.6 Deflected nasal septum 34 25 29 45 133 1.8 Foreign body in nose 16 2 18 32 68 0.9 Fracture of nasal bone 61 61 47 59 228 3.1
All other diseases and conditions of nose
9 11 14 20 54 0.7
THROAT
Acute tonsillitis 86 70 63 38 258 3.4 Chronic tonsillitis 192 244 190 190 816 10.9
Hypertrophy of tonsils and adenoids
32 68 68 47 215 2.9
Pharyngitis (acute) (chronic) (granular)
70 84 72 54 280 3.7
Laryngitis (acute) (chronic) 34 68 52 66 219 2.9 Tongue tie 5 18 2 7 32 0.4
Foreign body in throat 43 47 25 34 149 2.0 All other diseases and
conditions of throat16 23 29 20 88 1.2
Other diseases and conditions (including neoplasm)
27 25 11 7 70 0.9
TOTAL 1,662 2,016 1,934 1,860 7,473 100.0 # based on monthly returns received from E.N.T centre and other hospitals

87CASES TREATED AS IN-PATIENTS AT E.N.T HOSPITAL# - 2012
Causes (ICD-10) Male Female
TotalNo. %
Cancer and other neoplasm 30 9 39 0.7Otitis externa and other disorders of external ears 25 28 53 0.9Suppurative and unspecified otitis media 17 20 37 0.6Hearing loss 58 37 95 1.6Otalgia and effusion of ear 247 211 458 7.9Other diseases of the ear and mastoid 12 19 31 0.5Acute pharyngitis 541 690 1,231 21.2Acute tonsilitis 487 627 1114 19.2Sinusitis 57 44 101 1.7Nasal polyp and other disorders of nose and nasal sinuses
136 87 223 3.8
Peritonsilar abscess 37 18 55 0.9Other diseases of the respiratory system 62 63 125 2.1Epistaxis (Haemorrhage from nose) 87 82 169 2.9Dysphagia (Difficulty from swallowing) 76 44 120 2.1Localised swelling mass and lump of skin and subcutaneous tissue mainly of head and neck
184 138 322 5.5
Diseases of oral cavity, salivary glands & jaws 101 91 192 3.3Delayed Speech 33 14 47 0.8Voices disturbances 41 27 68 1.2Headache including facial pains 70 73 143 2.5Foreign body in ear 24 19 43 0.7Foreign body in nostril, pharynx and other respiratory tract
126 163 289 5.0
Foreign body in alimentary tract 5 5 10 0.2Fracture of skull and facial bones 78 21 99 1.7Injury and other consequences of external causes 121 59 180 3.1Other causes* 230 342 572 9.8
TOTAL 2,885 2,931 5,816 100.0* including pain throat (49) and fever (26)
OPERATIONS PERFORMED ON IN-PATIENTS AT E.N.T. HOSPITAL# - 2012Operations / Procedures Male Female Total
No. %Application, insertion or removal procedures on external ear
24 16 40 2.5
Other procedures on ear and mastoid processes 102 101 203 12.7Examination and other procedures on nose 105 45 150 9.4Application, insertion or removal procedures on nasal sinuses
19 23 42 2.6
Other procedures on nasal sinuses 27 25 52 3.3Oral surgery 20 24 44 2.8Excision and other procedures on mouth 9 5 14 0.9Excision on tonsils and adenoids 232 315 547 34.2Procedures on pharynx 20 22 42 2.6Procedures on larynx 35 17 52 3.3Procedures on other respiratory system 22 6 28 1.8Examination and other procedures on oesophagus
63 84 147 9.2
Reduction of fracture of facial bone 41 9 50 3.1Dermatological and plastic procedures 37 24 61 3.8Diagnostic and therapeutic intervention 39 20 59 3.7Other procedures 31 38 69 4.3
TOTAL 826 774 1,600 100.0# figures (include patients referred from Victoria Hospital are based on database of discharged patients (See page 50 for total admissions and operations)

CASES TREATED AS IN-PATIENTS AT THE CARDIAC CENTRE# - 2012
88Causes (ICD -10) Cases treated
Male Female Total %
Rheumatic fever with heart involvement 3 1 4 0.1
Mitral stenosis 1 9 10 0.3
Other rheumatic mitral valve diseases 27 49 76 2.5 Other chronic rheumatic heart diseases 7 16 23 0.7 Angina pectoris 1,047 623 1,670 53.9
Acute Myocardial infarction 82 20 102 3.3
Chronic ischaemic heart diseases 533 173 706 22.8
Nonrheumatic mitral valve disorders 5 3 8 0.3
Nonrheumatic aortic valve disorders 42 21 63 2.0
Pulmonary valve disorders 37 15 52 1.7
Left ventricular and other heart failure 4 2 6 0.2
Cardiac septal defect 5 16 21 0.7
Other heart diseases 13 13 26 0.8
Cerebrovascular diseases 2 - 2 0.1
Peripheral vascular disease 145 43 188 6.1
Artetiovenous fistula acquired 34 21 55 1.8
Other diseases of the circulatory system 7 2 9 0.3
Congenital malformations of the heart and other circulatory system 25 22 47 1.5
Other causes 20 13 33 1.1
Total 2,039 1,062 3,101 100.0 NB:total operations performed =1,326 of which Thoracic Surgery (2), Vascular Surgery (107), Neuro Surgery (169), Cardiac Surgery (646) and general surgery (402).
# based on data received (see page 50 for total admissions and operations)

REPORTED CASES OF CERTAIN SEXUALLY TRANSMITTED INFECTION DIAGNOSED AT SKIN DISEASE CLINIC OF GOVERNMENT HOSPITAL- 2012
CAUSE Under 20 years
20 -29 years 30 - 39 years 40 - 49 years 50 years & over ALL AGES
Male Female
Male Female
Male Female Male Female Male Female Male Female Total
Gonococcal infections
21 - 70 - 35 1 7 - 5 - 138 1 139 Venereal
warts2 7 15 11 4 7 6 3 2 3 29 31 60
Syphilis 1 1 - 6 3 - 2 1 2 - 8 8 16 Herpes
simplex- - 3 1 4 - 2 - 2 - 11 1 12
Chancroid - - 1 - - - 1 - - - 2 - 2 TOTAL 24 8 89 18 46 8 18 4 11 3 188 41 229
ATTENDANCE AT THE NATIONAL DAY CARE CENTRES* FOR THE IMMUNO-SUPPRESSED - 2012
New HIV/AIDS cases seen for treatment MALE FEMALE TOTAL
Under 10 years - 2 2
10-19 years 5 9 14 20-29 years 48 47 95 30-39 years 116 32 148 40-49 years 72 12 84 50-59 years 37 7 44 60 years & over 13 5 18 A. Total New Cases (all ages) 291 114 405 B. Subsequent attendances of HIV/AIDS cases for treatment/follow-up
6,669 3,186 9,855
Total seen for treatment (A+B) 6,960 3,300 10,260
- of whom on ARV 3,746 1,361 5,107 C. PMTCT - 99 99D. Post -HIV Exposure Prophylaxis 215 125 340
E. Voluntary counselling 899 526 1,425F. Police Case 58 55 113 G. Visa purpose 22 22 44 H. Screening (expatriates) 4,709 3,152 7,861I. Other (premarital, medical purpose@, etc) 104 63 167
Total attendances 12,967 7,342 20,309* at Volcy Pougnet Centre, Victoria, SSRN and JNH Hospitals @ mostly cases referred by private
doctors
89

90Island of Mauritius
Cases of occupational and work related diseases diagnosed during screening sessions at Occupational Health Clinics 2012
Condition Male Female Total
Diseases caused by chemical agents 8 - 8
Diseases caused by physical agents 5 - 5
Biological agents - 1 1
Occupational respiratory diseases 3 4 7
Occupational skin diseases 13 5 18Occupational musculo-skeletal disorders 83 20 103
Occupational cancer - - - Others - - - Total (cases diagnosed) 112 30 142
Attendances at screening sessions:
First attendances 1,128 506 1,634Subsequent attendances 5,259 1,020 6,279TOTAL ATTENDANCES 6,387 1,526 7,913
Pre employment medical fitness examinations
Number of persons examined 2,260 1,271 3,531
Statistics on Home Nursing Care Services
Number of visits
2009 2010 2011 2012
1 Port Louis 6,802 6,701 7,386 4,4042 Pamplemousses / Riviere du
Rempart6,595 5,632 6,219 11,979
3 Flacq 7,692 7,311 7,575 7,4954 Grand Port / Savanne 6,881 6,264 6,402 6,1885 Plaine Wilhems 8,068 8,370 8,328 6,299
TOTAL 36,038 34,278 35,910 36,365
YearHealth Region

91CAUSES @ OF ATTENDANCES* AT GOVERNMENT AYURVEDIC (OUT-PATIENT) CLINICS - 2012
CAUSES
TOTAL %TYPE OF DISEASE AYURVEDIC TERMS
1 Diseases of skeletal/osseous system
Asthi Vaha Srotas 12,805 20.82 Diseases related to blood and
plasmaRasa Vaha Srotas 8,362 13.6
3 Symptoms involving head and neck
Urdhwa Jatrugataroga 7,171 11.74 Gastritis and other diseases of
digestive systemAnnavaha Srotas 4,358 7.1
5 Diabetes mellitus Madhumeha rogas 3,777 6.16 Diseases of adipose system Medho Vaha Srotas 3,496 5.77 Diseases of haemopoitic system Rakta Vaha Srotas 3,031 4.98 Diseases of lower intestinal
systemPurisha Vaha Srotas 2,869 4.7
9 Diseases of respiratory system Pranavaha Srotas 2,807 4.610
Mental disorder Mano Vaha Srotas 2,770 4.511
Diseases of muscular System Mamsagata Vaha Srotas 2,243 3.712
Hypertensive diseases Uccha Raktachapa Dab 1,928 3.113
Paralysis tremors, neuritis and other diseases of the nervous system
Vata Vikara1,582 2.6
14
Urinary Disorder Mutra vaha Srotas 1,354 2.215
Common gynaecological disorders Artava Srotas 821 1.316
Diseases of reproductive system Sukra Vaha Srotas 819 1.317
Common pediatric diseases Balaroga 788 1.318
Diseases of body fluids system Udhakavahas Srotas 450 0.7 TOTAL 61,431 100.0
@ A patient with 2 distinct diseases are counted twice etc.
* New and follow-up casesNUMBER OF ATTENDANCES
MALE FEMALE TOTAL
BELVEDERE MEDI CLINIC 2,931 4,975 7,906
L'ESCALIER MEDI CLINIC 3,142 6,186 9,328
SSRN HOSPITAL 5,092 8,069 13,161 VICTORIA HOSPITAL 4,315 8,352 12,667
LA SOURCE FLACQ 2,532 6,092 8,624 TOTAL 18,012 33,674 51,686

92REPUBLIC OF MAURITIUS
New cases of Cancer registered *
COMMON CANCERS AMONG MEN
Sn
Site
2001 - 2004 (4 years)
2005 - 2008 (4 years)
2009 - 2011 (3 years)
Number % Total Number % Total Number % Total
1 Colon/Rectum 268 11.8 320 14.0 271 13.5
2 Prostate 230 10.2 241 10.5 236 11.7
3 Trachea/Bronchus/Lung 206 9.1 220 9.6 164 8.1
4 Skin 108 4.8 132 5.8 163 8.1
5 Lip/Oral Cavity/Pharynx 205 9.1 177 7.7 162 8.0
6 Stomach 151 6.7 182 8.0 125 6.2
7 Bladder 131 5.8 112 4.9 93 4.6
8 Lymphoma 105 4.6 92 4.0 89 4.4
9 Leukaemias 83 3.7 100 4.4 68 3.4
10 Other 778 34.3 710 31.1 642 31.9
TOTAL 2,265 100 2,286 100 2,013 100
COMMON CANCERS AMONG WOMEN
Sn
Site
2001 - 2004 (4 years)
2005 - 2008 (4 years)
2009 - 2011 (3 years)
Number % Total Number % Total Number % Total
1 Breast 1,066 34.3 1,239 37.8 1,154 38.6
2 Cervix Uteri 382 12.3 334 10.2 262 8.8
3 Colon/Rectum 226 7.3 250 7.6 257 8.6
4 Corpus Uteri 124 4.0 149 4.5 164 5.5
5 Ovary 139 4.5 183 5.6 135 4.5
6 Skin 92 3.0 102 3.1 119 4.0
7 Stomach 87 2.8 83 2.5 78 2.6
8 Leukaemias 81 2.6 73 2.2 65 2.2
9 Trachea/Bronchus/Lung 79 2.5 78 2.4 60 2.0
10 Other 830 26.7 789 24.1 699 23.4
TOTAL 3,106 100 3,280 100 2,993 100
* Source: National Cancer Register
Period
Period

93 ISLAND OF MAURITIUS
CASES# TREATED AS IN-PATIENTS AT THE NEONATAL INTENSIVE CARE UNITS * - 2012 (The figures given below are included in all tables pertaining to discharges from government
general hospitals )
CAUSE (ICD-10 Classifications) NUMBER OF CASES @ OF WHOM PASSED AWAY @
MALE FEMALE
TOTAL MALE FEMALE
TOTAL
Disorders related to length of gestation and fetal growth.
115 82 197 32 22 54
Respiratory and cardiovascular disorders specific to the perinatal period.
27 23 50 10 5 15
Infections specific to the perinatal period.
31 15 46 6 3 9
Birth trauma 1 1 2 1 - 1 Digestive system disorders of fetus
and newborn- - - - - -
Fetus and newborn affected by maternal factors and by complications of pregnancy, labour and delivery.
- - - - - -
Haemorrhagic and haematological disorders of fetus and newborn.
3 1 4 1 - 1
Transitory endocrine and metabolic disorders specific to fetus and newborn
3 - 3 - - -
Conditions involving the integument and temperature regulation of foetus and newborn
1 - 1 - - -
Other disorders originating in the perinatal period.
6 5 11 - 1 1
Congenital malformation of the nervous system
- 1 1 - - -
Congenital malformations of the circulatory system.
3 1 4 3 - 3
Congenital malformations of the respiratory system.
- - - - - -
Congenital malformations of digestive system.
3 2 5 1 - 1
Congenital malformation and deformities of the musculoskeletal system
2 2 4 1 - 1
Other congenital malformations 6 3 9 2 3 5
Diseases of respiratory system. 1 3 4 - 1 1
Other diseases 4 1 5 1 - 1
TOTAL 206 140 346 58 35 93 * Victoria and SSRN Hospitals @ based on data obtained from the Health Records Division # 0-3 months

94ISLAND OF MAURITIUS
INFANT DEATHS BY SEX AND DETAILED AGE - 2012
MALE FEMALE TOTAL
AGE AT DEATH No. % No. % No. %
Under 1 day 19 17.4 16 21.3 35 19.0
1 day 13 11.9 6 8.0 19 10.3
2 days 5 4.6 7 9.3 12 6.5
3 days 8 7.3 1 1.3 9 4.9
4 days 2 1.8 2 2.7 4 2.2
5 days 3 2.8 8 10.7 11 6.0
6 days 2 1.8 1 1.3 3 1.6
Sub-total 0 - 6 days 52 47.7 41 54.7 93 50.5 7 - 13 days 15 13.8 7 9.3 22 12.0
14 - 20 days 8 7.3 6 8.0 14 7.6
21 - 27 days 3 2.8 2 2.7 5 2.7
Sub-total 0 - 27 days 78 71.6 56 74.7 134 72.8
28 - 59 days 13 11.9 10 13.3 23 12.5
2 months 5 4.6 1 1.3 6 3.3
3 months 2 1.8 2 2.7 4 2.2
4 months 4 3.7 2 2.7 6 3.3
5 months 2 1.8 1 1.3 3 1.6
Sub-total under 6 months 104 95.4 72 96.0 176 95.7
6 months 2 1.8 1 1.3 3 1.6
7 months 1 0.9 - 0.0 1 0.5
8 months - 0.0 - 0.0 - 0.0
9 months - 0.0 - 0.0 - 0.0
10 months 1 0.9 2 2.7 3 1.6
11 months 1 0.9 - 0.0 1 0.5
TOTAL UNDER ONE YEAR 109 100.
0 75 100.0 184 100.0

ISLAND OF MAURITIUS
BREAKDOWN OF INFANT DEATHS BY CAUSES AND SEX - 2012
CAUSE (I.C.D. 10 ) Early Neo-Natal Deaths Late Neo-Natal Deaths Neo-Natal Deaths Post Neonatal Deaths
MALE FEMALE
TOTAL MAL
E FEMALETOTAL
MALE FEMALE
TOTAL MALE FEMALE
TOTAL
No. % No. % No. % No. %
Diarrhoea and gastroenteritis of presumed infectious origin
- - - 0.0 - - - 0.0 - - - 0.0 - - - 0.0
Meningitis - - - 0.0 - - - 0.0 - - - 0.0 - - - 0.0
Acute Bronchitis and Acute Bronchiolitis
- 1 1 1.1 - 1 1 2.4 - 2 2 1.5 2 2 4 8.0
Asthma - - - 0.0 - - - 0.0 - - - 0.0 - - - 0.0
Pneumonia - 2 2 2.2 1 - 1 2.4 1 2 3 2.2 2 1 3 6.0
Congenital anomalies 14 10 24 25.8 4 5 9 22.0 18 15 33 24.6 4 4 8 16.0
Slow foetal growth, foetal malnutrition and disorders related to short gestation and low birth weight
3 3 6 6.5 - - - 0.0 3 3 6 4.5 - - - 0.0
Intrauterine Hypoxia and birth asphyxia
1 3 4 4.3 - 2 2 4.9 1 5 6 4.5 - - - 0.0
Septicaemia and infections specific to the perinatal period
5 1 6 6.5 5 2 7 17.1 10 3 13 9.7 - 4 4 8.0
Neonatal haemorrhage 1 1 2 2.2 1 - 1 2.4 2 1 3 2.2 - - - 0.0
Birth Trauma - - - 0.0 1 - 1 2.4 1 - 1 0.7 - - - 0.0
Disseminated intravascular coagulation in newborn
2 1 3 3.2 3 1 4 9.8 5 2 7 5.2 - - - 0.0
Sudden Infant Death Syndrome
1 - 1 1.1 - - - 0.0 1 - 1 0.7 5 1 6 12.0
Ingestion of food causing suffocation
- - - 0.0 - - - 0.0 - - - 0.0 2 - 2 4.0
All other causes 25 19 44 47.3 11 4 15 36.6 36 23 59 44.0 16 7 23 46.0
TOTAL 52 41 93 100.0
26 15 41 100.0
78 56 134 100.0 31 19 50 100.0
95

96
ISLAND OF MAURITIUSSELECTED CAUSES OF INFANT DEATHS - 2012
CAUSE (I.C.D. 10 )
NUMBER OF DEATHS
MALE FEMALETOTAL
No. %Diarrhoea and gastroenteritis of presumed infectious origin
- - -
0.0
Meningitis - - -
0.0
Acute Bronchitis and Acute Bronchiolitis 2
4
6
3.3
Asthma - -
-
0.0
Pneumonia 3
3
6
3.3
Congenital anomalies 22
19
41
22.3
Slow foetal growth, foetal malnutrition and disorders related to short gestation and low birth weight
3
3
6
3.3
Intrauterine Hypoxia and birth asphyxia 1
5
6
3.3
Septicaemia and infections specific to the perinatal period
10
7
17
9.2
Neonatal haemorrhage 2
1
3
1.6
Birth Trauma 1
- 1
0.5
Disseminated intravascular coagulation in newborn 5
2
7
3.8
Sudden Infant Death Syndrome 6
1
7
3.8
Ingestion of food causing suffocation 2
- 2
1.1
All other causes* 52
30
82
44.6
TOTAL 109
75
184
100.0
SELECTED CAUSES OF DEATHS AMONG CHILDREN AGED 0-4 YEARS - 2012
CAUSE (I.C.D. 10 )
NUMBER OF DEATHS
MALE FEMALETOTAL
No. %Diarrhoea and gastroenteritis of presumed infectious origin
- - -
0.0
Meningitis - - -
0.0
Acute Bronchitis and Acute Bronchiolitis 3
5
8
3.8
Asthma - -
-
0.0
Pneumonia 4
3
7
3.3
Congenital anomalies 26
21
47
22.3
Slow foetal growth, foetal malnutrition and disorders related to short gestation and low birth weight
3
3
6
2.8
Intrauterine Hypoxia and birth asphyxia 1
5
6
2.8

Septicaemia and infections specific to the perinatal period
11
8
19
9.0
Neonatal haemorrhage 2
1
3
1.4
Birth Trauma 1
- 1
0.5
Disseminated intravascular coagulation in newborn 5
2
7
3.3
Sudden Infant Death Syndrome 6
1
7
3.3
Ingestion of food causing suffocation 2
- 2
0.9
Accidents 2
2
4
1.9
Assaults - 1
1
0.5
All other causes* 57
36
93
44.1
TOTAL 123
88
211
100.0
* including pulmonary haemorrhage (17 deaths) and respiratory distress (28 deaths)

97 ISLAND OF MAURITIUS
DEATHS (ALL AGES) BY CHAPTER OF THE INTERNATIONAL CLASSIFICATION OF DISEASES AND SEX - 2012
CAUSE ( ICD - 10 ) DEATHSMALE FEMALE TOTAL
No. % No. % No. %
1. Certain infectious & parasitic diseases
189 3.8 102 2.5 291 3.2
2. Neoplasms 569 11.4 549 13.4 1,118 12.3 3. Diseases of the blood & blood-
forming organs and certain disorders involving the immune mechanism
28 0.6 30 0.7 58 0.6
4. Endocrine, nutritional & metabolic diseases
1,237 24.8 1,234 30.0 2,471 27.1
5. Mental & behavioural disorders 39 0.8 5 0.1 44 0.5
6. Diseases of the nervous system 75 1.5 48 1.2 123 1.4 7. Diseases of the eye & adnexa
- 0.0
- 0.0
- 0.0
8. Diseases of the ear & mastoid process
-
0.0 -
0.0 -
0.0
9. Diseases of the circulatory system
1,518 30.4 1,336 32.5 2,854 31.4
10 Diseases of the respiratory system
420 8.4 330 8.0 750 8.2
11 Diseases of the digestive system 260 5.2 81 2.0 341 3.7
12 Diseases of the skin & subcutaneous tissue
16 0.3 20 0.5 36 0.4
13 Diseases of the musculoskeletal system & connective tissue
3 0.1 23 0.6 26 0.3
14 Diseases of the genitourinary system
85 1.7 64 1.6 149 1.6
15 Pregnancy, childbirth & the puerperium
-
0.0 9 0.2 9 0.1
16 Certain conditions originating in the perinatal period
61 1.2 39 0.9 100 1.1
17 Congenital malformations, deformations & chromosomal abnormalities
28 0.6 23 0.6 51 0.6
18 Symptoms, signs & abnormal clinical & laboratory findings, not elsewhere classified
84 1.7 107 2.6 191 2.1
19 & 20
Injury, poisoning & certain other consequences of external causes
383 7.7 108 2.6 491 5.4
T O T A L 4,995 100.0 4,108 100.0
9,103 100.0

ISLAND OF MAURITIUS
DEATHS BY CHAPTER OF THE INTERNATIONAL CLASSIFICATION AND BY AGE-GROUP - 2012 M A L E S F E M A L E S B O T H S E X E S
98
CHAPTER Under 1 year
1 - 4 years
5 - 12 years
13- 19
years
20- 39
years
40- 59 years
60 years
Under 1 year
1 - 4 years
5 - 12 years
13- 19 years
20- 39 years
40- 59
years
60 years
Under 1 year
1 - 4 years
5 - 12
years
13- 19 years
20- 39
years
40- 59 years
60 years
TOTAL
(I.C.D.10)
1. Certain infectious & parasitic diseases
3
2
2
1
49
82
50
2
1
1
-
13
21
64
5
3
3
1
62
103
114
291
2. Neoplasms - 1
5
5
21
169
368
1
2
3
2
28
191
322
1
3
8
7
49
360
690
1,118
3. Diseases of the blood & blood-forming organs and certain disorders involving the immune mechanism
- - -
2
4 3 19 -
-
-
1
3 7 19 -
-
-
3
7
10
38
58
4. Endocrine, nutritional & metabolic diseases
1
- -
-
22
356
858
-
-
-
-
14
227
993
1
-
-
-
36
583
1,851
2,471
5. Mental & behavioural disorders -
-
-
-
8
22
9
-
-
-
-
1
2
2
-
-
-
-
9
24
11
44
6. Diseases of the nervous system 1
2
2
5
22
17
26
-
2
1
2
7
9
27
1
4
3
7
29
26
53
123
7. Diseases of the eye & adnexa -
-
-
-
-
-
-
-
-
-
-
-
-
-
-
-
-
-
-
-
-
-
8. Diseases of the ear & mastoid process
-
-
-
-
-
-
-
-
-
-
-
-
-
-
-
-
-
-
-
-
-
-
9. Diseases of the circulatory system -
1
1
2
62
413
1,039
2
-
-
2
26
156
1,150
2
1
1
4
88
569
2,189
2,854
10. Diseases of the respiratory system 10
2
-
-
29
68
311
9
2
1
1
8
44
265
19
4
1
1
37
112
576
750
11. Diseases of the digestive system 2
-
-
2
29 130 97 1
-
-
1
3 22 54 3
-
-
3
32 152 151 341
12. Diseases of the skin & subcutaneous tissue
-
-
1
- - 2
13
-
-
-
-
-
2
18
-
-
1
-
-
4
31
36
13. Diseases of the musculoskeletal system & connective tissue
-
-
-
-
1
1 1 -
-
1
3
6 3 10 -
-
1
3
7
4
11
26
14. Diseases of the genitourinary system
- -
-
1
3
18
63
-
-
- -
1
20
43
-
-
-
1
4
38
106
149
15. Pregnancy, childbirth & the puerperium
-
-
-
-
1
7
1
-
-
-
-
1
7 1
-
9
16. Certain conditions originating in the perinatal period
61
-
-
-
-
-
-
39
-
-
-
- -
-
100
-
-
-
-
-
-
100
17. Congenital malformations, deformations & chromosomal abnormalities
22
4
1
-
1
-
-
19
2
-
1
1
-
-
41
6
1
1
2
-
-
51
18. Symptoms, signs & abnormal clinical & laboratory findings, not elsewhere classified
6
-
1
-
5
11
61
1
1
- -
2
2
101
7
1
1
-
7
13
162
191
19. Injury, poisoning & certain other consequences of external causes
3 2 2 24 144 133 75 1 3 - 8 29 29 38 4 5 2 32 173 162 113 491
T O T A L
109 14 15 42 400 1425 2990 75 13 7 22 149 736 3106 184 27 22 64 549 2161 6096 9103

99
ISLAND OF MAURITIUSSELECTED PRINCIPAL CAUSES OF DEATH (ALL AGES) - 2012
(See page 81 for deaths by ICD-10 chapters)
CAUSE MALE FEMALE TOTAL
(I.C.D - 10) No. % No. % No. %
Acute myocardial infarction and other ischaemic heart diseases
605 12.1 441 10.7 1,046 11.5
Heart Failures 174 3.5 163 4.0 337 3.7 Cardiac Arrest 63 1.3 53 1.3 116 1.3 Pulmonary heart diseases 23 0.5 13 0.3 36 0.4 Other heart diseases 64 1.3 42 1.0 106 1.2 Cerebrovascular disease 347 6.9 340 8.3 687 7.5 Hypertensive disease 225 4.5 272 6.6 497 5.5 Diabetes mellitus 1,20
9 24.2 1,207 29.4 2,416 26.5
Malignant neoplasm of trachea, bronchus and lung
99 2.0 41 1.0 140 1.5
Malignant neoplasm of breast - 0.0 139 3.4 139 1.5 Malignant neoplasm of stomach 59 1.2 28 0.7 87 1.0 Malignant neoplasm of uterus (inc. cervix uteri)
- 0.0 64 1.6 64 0.7
Malignant neoplasm of liver and intrahepatic bile duct
24 0.5 17 0.4 41 0.5
Malignant neoplasm of lip, oral cavity and pharynx
43 0.9 14 0.3 57 0.6
Malignant neoplasm of pancreas 27 0.5 21 0.5 48 0.5 Malignant neoplam of prostate 55 1.1
- 0.0 55 0.6
Pneumonia 104 2.1 105 2.6 209 2.3 Asthma 53 1.1 61 1.5 114 1.3 Pulmonary oedema 33 0.7 23 0.6 56 0.6 Bronchitis, emphysema and other chronic obstructive pulmonary diseases
63 1.3 20
0.5 83 0.9
Land Transport Accidents 145 2.9 23 0.6 168 1.8 Suicide 89 1.8 26 0.6 115 1.3 Homicides 18 0.4 13 0.3 31 0.3
Accidental drowning and submersion 37 0.7 3 0.1 40 0.4 Accidents caused by fire and flames 10 0.2 6 0.1 16 0.2 Diseases of liver (inc. alcoholic cirrhosis)
159 3.2 20 0.5 179 2.0
Renal failures 71 1.4 52 1.3 123 1.4
Senility 41 0.8 82 2.0 123 1.4
Septicaemia unspecified 51 1.0 56 1.4 107 1.2
Gastrointestinal haemorrhage unspecified
41 0.8 21 0.5 62 0.7
All other causes 1,063
21.3 742 18.1 1,805 19.8
T O T A L 4,995
100.0 4,108 100.0 9,103 100.0

ISLAND OF MAURITIUSSELECTED PRINCIPAL CAUSES OF DEATHS BY AGE-GROUP AND SEX - 2012
CAUSES (ICD.10) M A L E S F E M A L E S B O T H S E X E S Under
15 years
15-29
years
30-44
years
45-59 years
60-74 years
75+ years
Under 15 year
s
15-29
years
30-44
years
45-59
years
60-74 years
75+ years
Under 15
years
15-29
years
30-44
years
45-59 years
60-74 years
75+ years
TOTAL
Acute myocardial infarction and other ischaemic heart diseases
- 3 25 155 209 213 - 1 3 48 119 270 - 4 28 203 328 483 1,046
Heart Failures - 5 22 53 43 51 1 3 9 25 25 100 1 8 31 78 68 151 337Cardiac Arrest - 1 1 10 11 40 - - - 2 6 45 - 1 1 12 17 85 116Pulmonary heart diseases
1 - 2 2 7 11 - 1 2 2 5 3 1 1 4 4 12 14 36
Other heart diseases - 3 8 24 11 18 1 - - 4 5 32 1 3 8 28 16 50 106Cerebrovascular disease 1 2 22 69 114 139 - 3 13 26 74 224 1 5 35 95 188 363 687Hypertensive disease - 2 10 48 69 96 - 1 7 32 67 165 - 3 17 80 136 261 497Diabetes mellitus - 5 37 327 523 317 - 2 27 208 493 477 - 7 64 535 1,016 794 2,416Malignant neoplasm of trachea, bronchus and lung
- 1 2 22 39 35 - - 1 12 14 14 - 1 3 34 53 49 140
Malignant neoplasm of breast
- - - - - - - 1 17 55 47 19 - 1 17 55 47 19 139
Malignant neoplasm of stomach
- 1 4 22 20 12 - - 2 9 10 7 - 1 6 31 30 19 87
Malignant neoplasm of uterus (inc. cervix uteri)
- - - - - - - 1 3 19 24 17 - 1 3 19 24 17 64
Malignant neoplasm of liver and intrahepatic bile duct
- - 1 5 9 9 - - 1 2 11 3 - - 2 7 20 12 41
Malignant neoplasm of lip, oral cavity and pharynx
- - 3 18 18 4 - - 1 4 4 5 - - 4 22 22 9 57
Malignant neoplasm of pancreas
- - 1 12 10 4 - - - 4 10 7 - - 1 16 20 11 48
Malignant neoplasm of prostate
- - - 7 21 27 - - - - - - - - - 7 21 27 55
Pneumonia 3 2 4 15 24 56 2 - 2 13 15 73 5 2 6 28 39 129 209Asthma - 1 3 7 13 29 - - 7 5 12 37 - 1 10 12 25 66 114Pulmonary oedema 2 5 11 8 4 3 1 - 2 5 5 10 3 5 13 13 9 13 56Bronchitis, emphysema and other chronic obstructive pulmonary diseases
- - 2 4 21 36 - - - - 3 17 - - 2 4 24 53 83
Land Transport Accidents
1 47 35 36 22 4 - 5 - 8 6 4 1 52 35 44 28 8 168
Suicide 1 19 39 19 9 2 2 14 5 3 1 1 3 33 44 22 10 3 115Homicides - 5 6 4 2 1 1 2 5 3 - 2 1 7 11 7 2 3 31Accidental drowning and submersion
1 9 12 9 6 - - - 1 1 1 - 1 9 13 10 7 - 40
All other causes 131 53 203 371 352 326 90 36 72 164 199 418 221 89 275 535 551 744 2,415
100

T O T A L 141 164 453 1247 1557 1433 98 70 180 654 1156 1950 239 234 633 1901 2713 3383 9103

101 CHAPTER-SPECIFIC DEATH RATES
PER 10,000 MID-YEAR RESIDENT POPULATION - 2012CHAPTER (ICD-10) MAURITIUS RODRIGUES REPUBLIC
No. of Deaths
Death Rate
No. of Deaths
Death Rate
No. of Deaths
Death
Rate 1. Certain infectious & parasitic
diseases291 2.3 2 0.5 293 2.3
2. Neoplasms 1,118 8.9 41 10.7 1,159 9.0
3. Diseases of the blood & blood-forming organs and certain disorders involving the immune mechanism
58 0.5 5 1.3 63 0.5
4. Endocrine, nutritional & metabolic diseases
2,471 19.7 45 11.8 2,516 19.5
5. Mental & behavioural disorders 44 0.4 2 0.5 46 0.4
6. Diseases of the nervous system 123 1.0 3 0.8 126 1.0
7. Diseases of the eye & adnexa - 0.0 - 0.0 - 0.0
8. Diseases of the ear & mastoid process
- 0.0 - 0.0 - 0.0
9. Diseases of the circulatory system
2,854 22.8 79 20.7 2,933 22.7
10. Diseases of the respiratory system
750 6.0 18 4.7 768 5.9
11. Diseases of the digestive system 341 2.7 5 1.3 346 2.7
12. Diseases of the skin & subcutaneous tissue
36 0.3 1
0.3 37 0.3
13. Diseases of the musculoskeletal system & connective tissue
26 0.2 1
0.3 27 0.2
14. Diseases of the genitourinary system
149 1.2 4
1.0 153 1.2
15. Pregnancy, childbirth & the puerperium
9 0.1 -
0.0 9 0.1
16. Certain conditions originating in the perinatal period
100 0.8 6 1.6 106 0.8
17. Congenital malformations, deformations & chromosomal abnormalities
51 0.4 5 1.3 56 0.4
18. Symptoms, signs & abnormal clinical & laboratory findings, not elsewhere classified
191 1.5 7 1.8 198 1.5
19. Injury, poisoning & certain other consequences of external causes
491 3.9 16 4.2 507 3.9
TOTAL 9,103 72.6 240 62.9 9,343 72.4
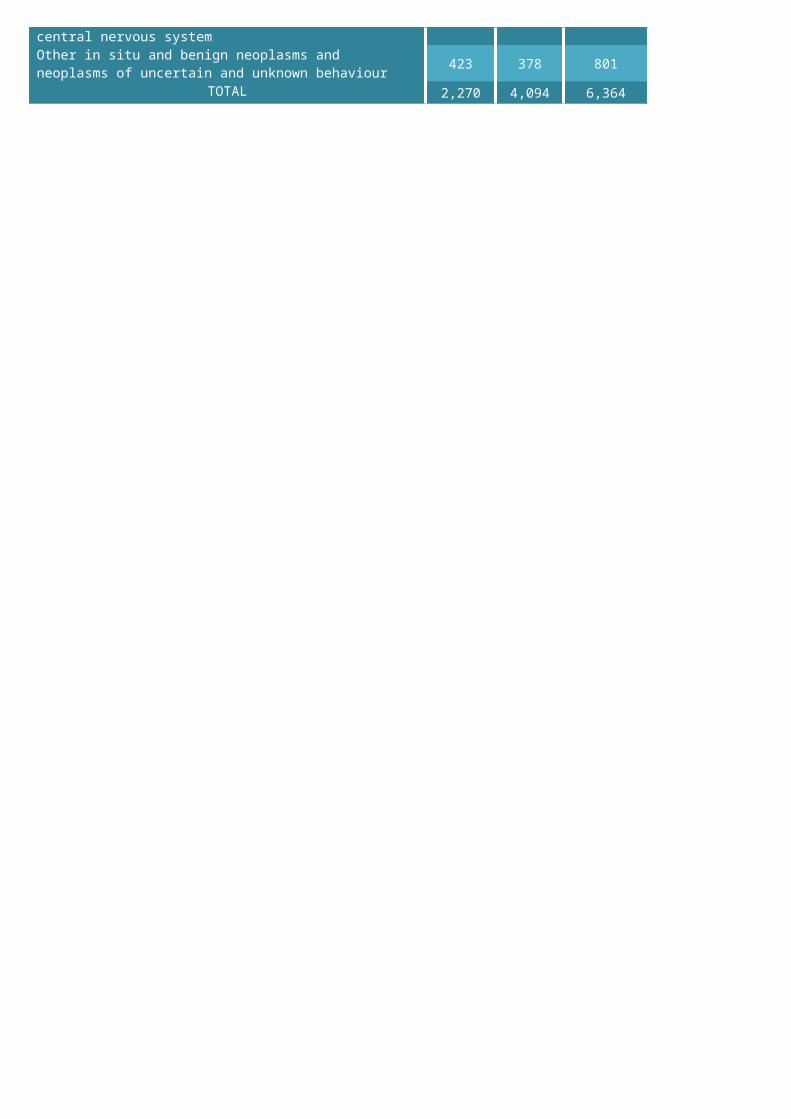

102 ISLAND OF MAURITIUS
DISTRIBUTION OF DEATHS BY AGE-GROUP AND SEX, AND AGE-SPECIFIC DEATH RATESPER 1,000 MID-YEAR RESIDENT POPULATION - 2012
DEATHS DEATH RATES AGE-GROUP MALE FEMALE BOTH SEXES MALE FEMALE BOTH
SEXES (years) Number Number Number Percentage Cumulative
percentage Under 1 109 75 184 2.0 2.0 15.6 11.0 13.4
1 - 4 14 13 27 0.3 2.3 0.5 0.4 0.5
5 - 9 6 5 11 0.1 2.4 0.1 0.1 0.1
10 - 14 12 5 17 0.2 2.6 0.3 0.1 0.2
15 - 19 39 19 58 0.6 3.3 0.8 0.4 0.6
20 - 24 54 21 75 0.8 4.1 1.1 0.4 0.7
25 - 29 71 30 101 1.1 5.2 1.6 0.7 1.1
30 - 34 121 40 161 1.8 7.0 2.2 0.7 1.5
35 - 39 154 58 212 2.3 9.3 3.3 1.2 2.2
40 - 44 178 82 260 2.9 12.1 4.0 1.8 2.9
45 - 49 319 161 480 5.3 17.4 6.5 3.3 4.9
50 - 54 418 212 630 6.9 24.3 9.8 4.8 7.3
55 - 59 510 281 791 8.7 33.0 14.1 7.4 10.7
60 - 64 566 347 913 10.0 43.1 20.5 11.3 15.6
65 - 69 505 376 881 9.7 52.7 31.5 18.9 24.6
70 - 74 486 434 920 10.1 62.8 47.6 31.4 38.3
75 - 79 520 482 1,002 11.0 73.9 72.1 44.3 55.4
80 - 84 426 526 952 10.5 84.3 117.5 80.7 93.8
85 & over 487 941 1,428 15.7 100.0 205.2 174.4 183.8
ALL AGES 4,995 4,108 9,103 100.0 - 8.1 6.5 7.3

ISLAND OF MAURITIUS
103
DEATHS DUE TO DISEASES OF THE CIRCULATORY SYSTEM
BY AGE-GROUP AND SEX - 2012
CAUSES (ICD-10)
M A L E S F E M A L E S B O T H S E X E SUnder 15
years
15-29
years
30-44
years
45-59
years
60-74
years
75+ years
Under 15
years
15-29
years
30-44
years
45-59
years
60-74
years
75+ years
Under 15
years
15-29 years
30-44
years
45-59
years
60-74
years
75+ years
TOTAL
Acute Myocardial Infarction
- 3 21 125 141 122 - 1 2 36 82 160 - 4 23 161 223 282 693
Other Ischaemic Heart diseases
- - 4 30 68 91 - - 1 12 37 110 - - 5 42 105 201 353
Total (Ischaemic Heart diseases)
- 3 25 155 209 213 - 1 3 48 119 270 - 4 28 203 328 483 1,046
Cardiac Arrest - 1 1 10 11 40 - - - 2 6 45 - 1 1 12 17 85 116
Heart Failure - 5 22 53 43 51 1 3 9 25 25 100 1 8 31 78 68 151 337
Other heart diseases
1 3 10 24 16 26 1 1 2 6 8 29 2 4 12 30 24 55 127
Total (Heart diseases)*
1 12 58 242 279 330 2 5 14 81 158 444 3 17 72 323 437 774 1,626
Hypertensive diseases
- 2 10 48 69 96 - 1 7 32 67 165 - 3 17 80 136 261 497
Intracranial haemorrhage and cerebral infarction
1 2 15 27 21 18 - 1 10 13 19 19 1 3 25 40 40 37 146
Stroke, not specified as haemorrhage or infarction
- - 7 41 88 115 - 2 3 13 54 192 - 2 10 54 142 307 515
Other cerebrovascular diseases
- - - 1 5 6 - - - - 1 13 - - - 1 6 19 26
Total (cerebrovascular diseases)
1 2 22 69 114 139 - 3 13 26 74 224 1 5 35 95 188 363 687
Other diseases of the circulatory system
- - 4 8 6 6 - - 1 1 9 9 - - 5 9 15 15 44
T O T A L (Circulatory
system)
2 16 94 367 468 571 2 9 35 140 308 842 4 25 129 507 776 1,413
2,854

104 ISLAND OF MAURITIUS
DEATHS DUE TO NEOPLASMS BY TYPE AND SEX 2012
TYPE OF NEOPLASM (ICD-10) MALE FEMALE TOTAL
Malignant neoplasm of lip, oral cavity and pharynx 43 14 57Malignant neoplasm of oesophagus 16 8 24
Malignant neoplasm of stomach 59 28 87Malignant neoplasm of colon 44 30 74
Malignant neoplasm of rectosigmoid junction, rectum, anus and anal canal 14 16 30
Malignant neoplasm of liver and intrahepatic bile ducts 24 17 41Malignant neoplasm of pancreas 27 21 48
Other malignant neoplasm of digestive organs 16 17 33Malignant neoplasm of larynx 21 2 23
Malignant neoplasm of trachea, bronchus and lung 99 41 140Other malignant neoplasm of respiratory and intrathoracic
organs 2 2 4Malignant neoplasm of bone and articular cartilage 8 2 10Malignant neoplasm of skin, including melanoma 2 - 2
Malignant neoplasm of mesothelial and soft tissue 4 1 5Malignant neoplasm of breast - 139 139
Malignant neoplasm of cervix uteri 25 25Malignant neoplasm of other and unspecified parts of the
uterus 39 39Other Malignant neoplasms of female genital organs 42 42
Malignant neoplasm of prostrate 55 55Other malignant neoplasm of male genital organs 5 5
Malignant neoplasm of bladder 11 9 20Other malignant neoplasm of urinary tract 17 3 20
Malignant neoplasm of eye and adnexa - 1 1Malignant neoplasm of central nervous system, including
brain 4 6 10Malignant neoplasm of other , ill-defined, secondary,
unspecified and multiple sites 31 27 58

Hodgkin's disease 2 3 5Non-Hodgkin's lymphoma 10 5 15
Leukaemia 23 18 41Other malignant neoplasms of lymphoid, haematopoietic and
related tissue 6 4 10Benign neoplasm of breast - 1 1
Benign neoplasm of ovary organs - 1 1Benign neoplasm of urinary organs - 1 1
Benign neoplasm of brain and other parts of central nervous system 12 22 34
Other in situ and benign neoplasms and neoplasms of uncertain and unknown behaviour 14 4 18
TOTAL 569 549 1,118
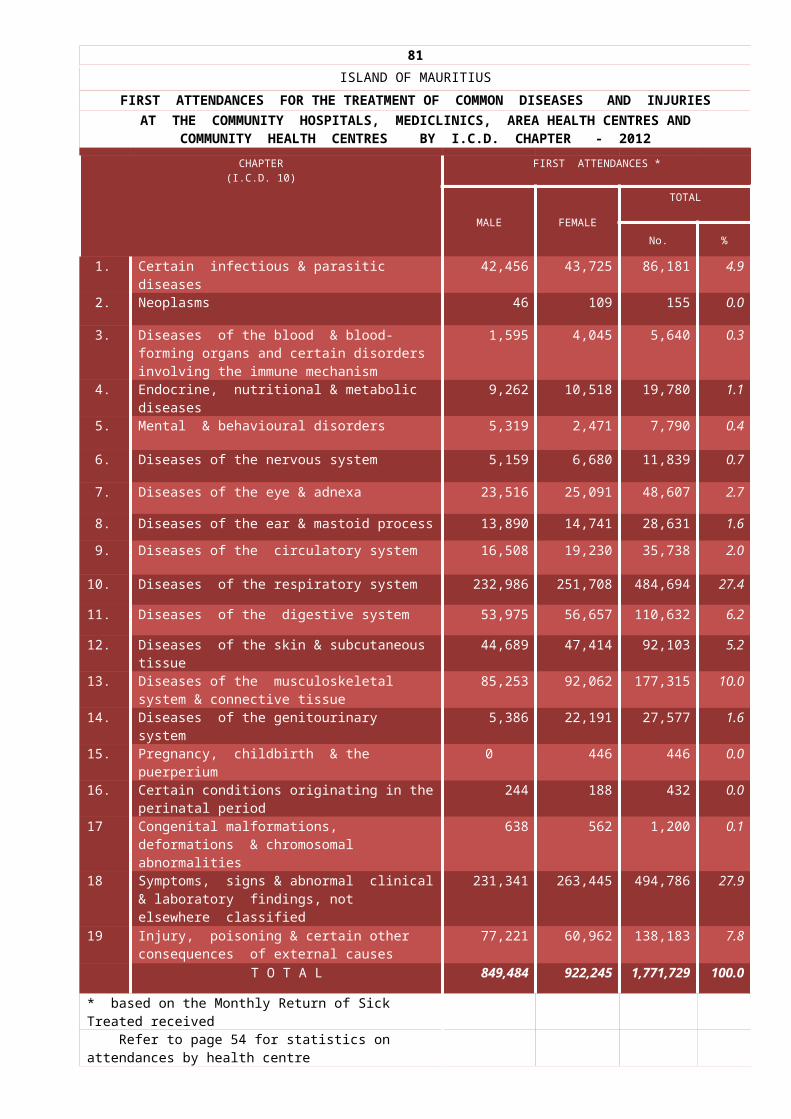
ISLAND OF MAURITIUS
105
Deaths due to External Causes , by Age-group and Sex - 2012
CAUSES (ICD - 10)
MALE FEMALE B O T H S E X E SUnder 5 years
5 - 12 years
13- 19 years
20- 39 years
40- 59 years
60 years & over
Under 5 years
5 - 12 years
13- 19 years
20- 39 years
40- 59 years
60 years & over
Under 5 years
5 - 12 years
13- 19 years
20- 39 years
40- 59 years
60 years & over
TOTAL
Transport Accidents - 1 12 59 47 26 - - - 5 8 10 - 1 12 64 55 36 168
Falls 1 - 1 3 8 6 1 - - - 1 3 2 - 1 3 9 9 24Accidental Drowning and Submersion
- - 4 14 13 6 - - - 1 1 1 - - 4 15 14 7 40
Ingestion of food causing obstruction of respiratory tract
2 - - 1 1 - - - - - 2 - 2 - - 1 3 - 6
Exposure to Electric Current
- - - 3 - - - - - - - - - - - 3 - - 3
Exposure to Smoke, Fire and Flames
1 - 1 4 2 2 - - 1 2 2 1 1 - 2 6 4 3 16
Other and unspecified accidents
- - - 5 11 11 2 - - - 1 14 2 - - 5 12 25 44
Suicide by chemicals and noxious substances
- - - 11 11 4 - - 1 2 1 - - - 1 13 12 4 30
Suicide by hanging - 1 5 32 16 4 - - 3 10 1 1 - 1 8 42 17 5 73Suicide by fire - - - - - 1 - - 1 3 1 1 - - 1 3 1 2 7Suicide by other and unspecified means
- - - 1 1 2 - - 1 - - - - - 1 1 1 2 5
Assault - - 1 7 7 3 1 - 1 5 4 2 1 - 2 12 11 5 31Accidental poisoning by exposure to noxious substances and/or of undetermined intent
1 - - 1 4 - - - - - - - 1 - - 1 4 - 6
Complications of medical and surgical care
- - - 2 8 10 - - - 1 6 5 - - - 3 14 15 32
Other and unspecified External causes
- - - 1 4 - - - - - 1 - - - - 1 5 - 6
T O T A L 5 2 24 144 133 75 4 - 8 29 29 38 9 2 32 173 162 113 491

106

107
SELECTED HEALTH VARIABLES AND INDICATORS
ISLAND OF RODRIGUES-2012
Variable/Indicator Number/Value
Denominator
POPULATION AND VITAL STATISTICS Estimated mid-year resident population 38,16
7
Population density 367 per square kilometreEstimated mid-year resident population by sex: male
18,864
female 19,303
sex ratio 977 males per 1000 femalesEstimated end-of-year resident population
38,242
Population density 368 per square kilometreEstimated female mid-year resident population 15-49 years
9,654
Percentage of total female population 50.0 Percentage of total population (both sexes) 25.3 Estimated mid-year population 60 years and over 4,078 Percentage of total population 10.7 Estimated mid-year population 65years and over 2,905 Percentage of total population 7.6 Live births 728 Crude birth rate 19.1 per 1000 mid-year
populationDeaths (all ages) 240 Crude death rate 6.3 per 1000 mid-year
populationStillbirths 8 Stillbirth rate 10.9 per 1000 total birthsPerinatal deaths 13 Perinatal mortality rate 17.7 per 1000 total birthsInfant deaths 15 Infant mortality rate 20.6 per 1000 live birthsDeaths under five years 17 Under-five mortality rate 23.4 per 1000 live birthsMaternal deaths - Maternal mortality ratio - per 1000 live birthsLife expectancy at birth (years) - male 71.5 Life expectancy at birth (years) - female
76.6
Life expectancy at birth (years) - Both Sexes 74.0 INFRASTRUCTURE AND PERSONNEL Beds 189 Population : bed ratio 202 inhabitants per bedDoctors 20 Population : doctor ratio 1,912 inhabitants per doctorDentists 2 Population : dentist ratio 19,12
1 inhabitants per dentist
Nurses (including midwives) 159 Population : nurse ratio 241 inhabitants per nurse

108
SELECTED HEALTH VARIABLES AND INDICATORSISLAND OF RODRIGUES-2012
Variable/Indicator Number/Value
Denominator
MATERNAL AND CHILD HEALTH Births attended by qualified personnel 70
8
Percentage of all births (occurred = 712)
99.4
Children with a birthweight of less than 2.5 kg 81 Percentage of live births (hospital & health centres=704)
11.5
Total Fertility Rate 2.4 Net Reproduction Rate 1.1 IMMUNIZATION Children immunized against tuberculosis 71
4
Immunization coverage
100.0
per 100 surviving infants
Children immunized against diphtheria, whooping cough, tetanus, hepatitis B, Hib and poliomyelitis (3rd dose) 71
5
Immunization coverage 100.0
per 100 surviving infants
Children immunized against measles/mumps/rubella (MMR)
665
Immunization coverage
93.5 per 100 surviving infants
Pregnant women immunized against tetanus (2nd or higher dose) 49
0
Immunization coverage 70.0 per 100 surviving infants NOTIFIABLE DISEASES Cases of malaria reported - Incidence rate - per 10,000 mid-year populationCases of tuberculosis reported 1 Incidence rate 0.3 per 10,000 mid-year populationCases of HIV / AIDS reported 5 Incidence rate 1.3 per 10,000 mid-year population CAUSE OF DEATH Deaths due to diseases of the circulatory system 79 Percentage of total deaths 32.9 Disease-specific death rate
20.7 per 10,000 mid-year population
Deaths due to endocrine, nutritional and metabolic diseases
45
Percentage of total deaths 18.8 Disease-specific death rate 11.8 per 10,000 mid-year populationDeaths due to neoplasms 41 Percentage of total deaths 17.1 Disease-specific death rate
10.7 per 10,000 mid-year population
Deaths due to diseases of the respiratory system 18 Percentage of total deaths 7.5 Disease-specific death rate 4.7 per 10,000 mid-year populationDeaths due to injury and poisoning 16

Percentage of total deaths 6.7 Disease-specific death rate 4.2 per 10,000 mid-year population

109ISLAND OF RODRIGUES
An Analysis of the Health Situation
Rodrigues Island, administratively autonomous, is of volcanic origin, with an area of 104.0 km2, and is located 560 km north-east of Mauritius. In general, the population is scattered over the island, with no dominant towns, except the administrative centre, Port Mathurin.
POPULATION AND VITAL STATISTICS
The estimated mid-year resident population of the Island of Rodrigues was 38,167 in 2012 as compared to 36,175 in 2002. The population density, at the end of 2012 was 368 inhabitants per square kilometer. During the 10-year period (2002-2012) the average annual growth rate was 0.5%. During these years, there has been a notable positive net increase in the migration of Rodriguans to the main Island of Mauritius, mostly for economic reasons.
The proportion of population aged under 15 years slightly decreased from 31.0 % in 2002 to 30.6 % in 2012, while the proportion of elderly population (aged 65 years and above) increased from 5.6 % to 7.6 %. During that period, the total dependency ratio has increased from 578.4 per 1,000 mid year population aged 15-64 years to 617.1. The young age dependency ratio increased from 489.6 to 494.0 while the old age dependency ratio increased from 88.8 to 123.1.
Life expectancy at birth, 70.2
years for males and 76.1 for females in 2002, was 71.5 years and 76.6 respectively in 2012.
The number of live births registered in 2002 and 2012 was 814 and 728 respectively, corresponding to a decrease in the crude birth rate from 22.5 per 1,000 mid-year population to 19.1. The number of deaths registered in 2002 was 229 while in 2012 it was 240. The crude death was 6.3 in 2002 as well as in 2012.
The number of infant deaths, that is deaths among children aged under one year, registered in 2002 and 2012 was 19 and 15 respectively, corresponding to a decrease in the infant mortality rate (IMR) from 23.3 per 1,000 live births to 20.6. The lowest IMR, that is 12.3, was recorded in 2005 with only 11 infant deaths. However, as shown in the chart that follows, it drastically rose to 27.2 in 2006 then declined to 15.4 in 2007. Since then, an increasing trend has been observed.
The number of still-births registered in 2012 was 8 corresponding to a still-birth rate of 10.9 per 1,000 total births. In 2004, the still-birth rate was 24.8 with 24 still-births. After this peak, a decreasing trend has been observed till 2011 when the rate reached 4.3 with only 3 registered still births.
110
ISLAND OF RODRIGUES
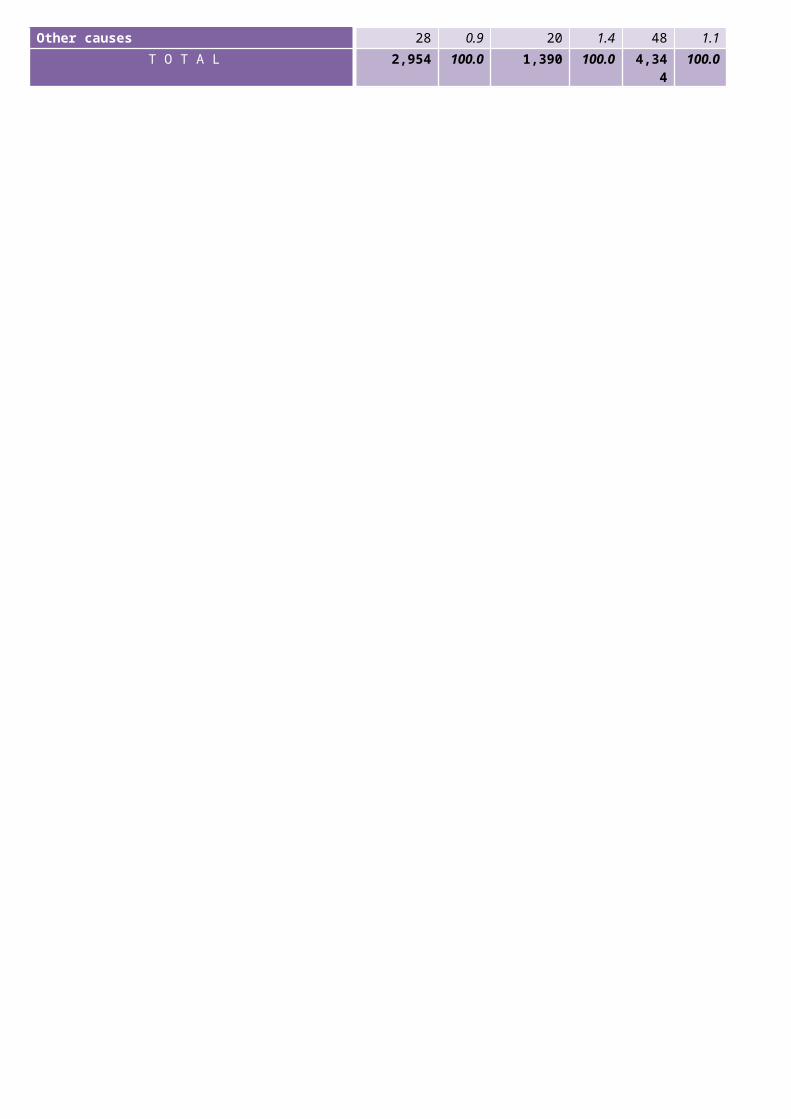
HEALTH DELIVERY SYSTEM
In the Island of Rodrigues, at the end of 2012, there were one hospital with 135 beds and two health centres with in-patient facilities equipped with 54 beds. This brought the total number of beds in government institutions providing in-patient facilities to 189 as compared to 183 in 2002. Patients in need of tertiary health care are usually referred to Mauritius.
At the end of 2012, there were 14 Community Health Centres, providing basic services including treatment of common diseases and injuries, maternal and child health care and family planning. There were three dental clinics, namely at Queen Elizabeth Hospital, Mont Lubin Health Centre, and La Ferme Health Centre. There was also a Health Office at Port Mathurin.
HEALTH PERSONNEL
At the end of 2012, there were 20 doctors in the Island of Rodrigues including (one in the private sector) that is one doctor for 1,912 inhabitants compared to 2,269 inhabitants in 2002. There were 2 dentists that is one for 19,120 inhabitants at the end of 2012 while in 2002 it was one for 18,152 inhabitants. Almost all of these health professionals are employees
of the Ministry of Health & Quality of Life posted to the island on tour service basis.
The number of qualified nurses and midwives was 159 at the end of 2012, that is one nurse/midwife for 241 inhabitants compared to one for 286 inhabitants in 2002.
111
ISLAND OF RODRIGUES
2000 2001 2002 2003 2004 2005 2006 2007 2008 2009 2010 2011 20120
5
10
15
20
25
30
19.8
23.4
23.3
24.2
22.2
12.3
27.2
15.416.6 13.9
1417.2
20.6
3.7
12.2
7.3
17.9
24.8
13.213.4
17.5
7.6
6.9
11.1
4.3
10.9
INFANT MORTALITY RATESTILLBIRTH RATE
RA
TE p
er 1
,000
LIV
E B
IRTH
S

IN-PATIENT SERVICE
The number of admissions at Queen Elizabeth Hospital and the two Health Centres (Mont Lubin and La Ferme) was 12,236 in 2012, while in 2011 it was 9,779. The percentage increase in admissions during the one-year period was 25 %. The highest number of admissions ever recorded was in 2006 with 13,695, probably due to the outbreak of chikungunya.
OUT-PATIENT SERVICE
The total number of attendances at the out-patient departments, that is the Accident & Emergency and the Sorted/Unsorted Unit at Queen Elizabeth Hospital, Mont Lubin and La Ferme Health Centres was 187,054 in 2012, while in 2002 it was 136,401, representing an average annual increase of about 3.7%.
In 2012, the number of attendances for the treatment of common diseases and injuries at Community Health Centres was 49,074 as compared to 55,056 in 2011, that is, a 11% decrease.
MATERNAL AND CHILD HEALTH
In 2012, a total of 712 births (including 8 stillbirths) occurred at Queen Elizabeth Hospital, Mont Lubin HC and La Ferme HC. Out of the 704 live births attended by trained personnel, 81 were with a low birth weight (less than 2500 grammes) representing 11.5 % as compared to 15.5 % in 2011. An increasing trend has been observed since 2002 when the percentage of low birth weight was 7.7%.
A total of 708 live births were reported by the MCH services in 2012.
The number of babies immunized against Tuberculosis (BCG) by MCH staff was 714. 715 babies were immunized against Diphtheria, Haemophilus influenza type B, hepatitis B and oral Polio Vaccine (3rd dose) and 665 against Measles/mumps/rubella (MMR).
DENTAL HEALTH
The total number of attendances at the three dental clinics in 2012 was 15,047 while in 2002 it was 12,420. This represented an increase of 21.2 % during the 10-year period.

112
ISLAND OF RODRIGUES
MORBIDITY
The number of discharged patients in 2012 was 11,987 of whom 680 (5.7 %) were treated for Complications of pregnancy, childbirth and the puerperium (excluding Normal deliveries and Complications following abortions), 637 (5.3 %) for Delivery without mention of complications and 720 (6.0%) for Injuries (crushing & superficial injuries, fractures, open wounds, dislocation, sprain and strains).
In 2012, the diseases responsible for the highest number of first attendances at the 14 Community Health Centres were tonsilitis, laryngitis, nasopharyngitis (common cold), sore throat and URTI with 2,643 attendances (16. 9%) followed by cough, pain in throat, chest pain, wheezing, hiccough and sneezing with 2,085 attendances (13.4%). Fever/pain
all over with 1,051 attendances (6.7%) stood in the third position.
Diseases grouped by ICD chapters indicate that Diseases of respiratory system which was 23.4 % of total first attendances in 2002 compared to 23.2 % in 2012. During the same period, Infectious and parasitic diseases increased from 9.1 % to 11.1 %. Diseases of the musculoskeletal and connective tissue were 9.3 % of first attendances in 2002 compared to 9.6% in 2012; in 2006, they represented 14.7% probably due to the outbreak of chikungunya.
In 2012, the number of cases treated for scabies in primary health care centres in Rodrigues was 641 compared to 693 in 2011. This decrease, though slight, is mainly explained by the setting up of an enhanced surveillance system in Rodrigues in 2012 following the increasing trend observed between 2009 and 2011. (See chart below)

2005 2006 2007 2008 2009 2010 2011 20120
100
200
300
400
500
600
700
800
319 335
474
298 315
462
693641
Attendances at Primary Health Care Centres due to Scabies
YEAR
YEAR
LY A
TTEN
DAN
CES
113
ISLAND OF RODRIGUES
CAUSE OF DEATH
In 2012, 240 deaths were registered in Rodrigues. The distribution of deaths by the chapters of the International Classification of Diseases (ICD-10), as shown in the pie–chart below, indicates that Heart and other diseases of the circulatory system were responsible for 32.9 % of all deaths. Diabetes and other
endocrine, nutritional & metabolic disorders with 18.8% were in the second position followed by Cancer and other Neoplasms with 17.1 %, Diseases of the respiratory system (7.5 %) and Accidents and other consequences of external causes (6.7%)
Other causes; 17.0%
Cancer and other neoplasms; 17.1%
Diabetes and other en-docrine, nutritional and
metabolic disorders; 18.8%
Heart and other diseases of the circulatory system;
32.9%
Diseases of the respiratory system; 7.5%
Accidents and other consequences of external causes; 6.7%
Underlying causes of deaths by ICD-10 Chapter - 2012
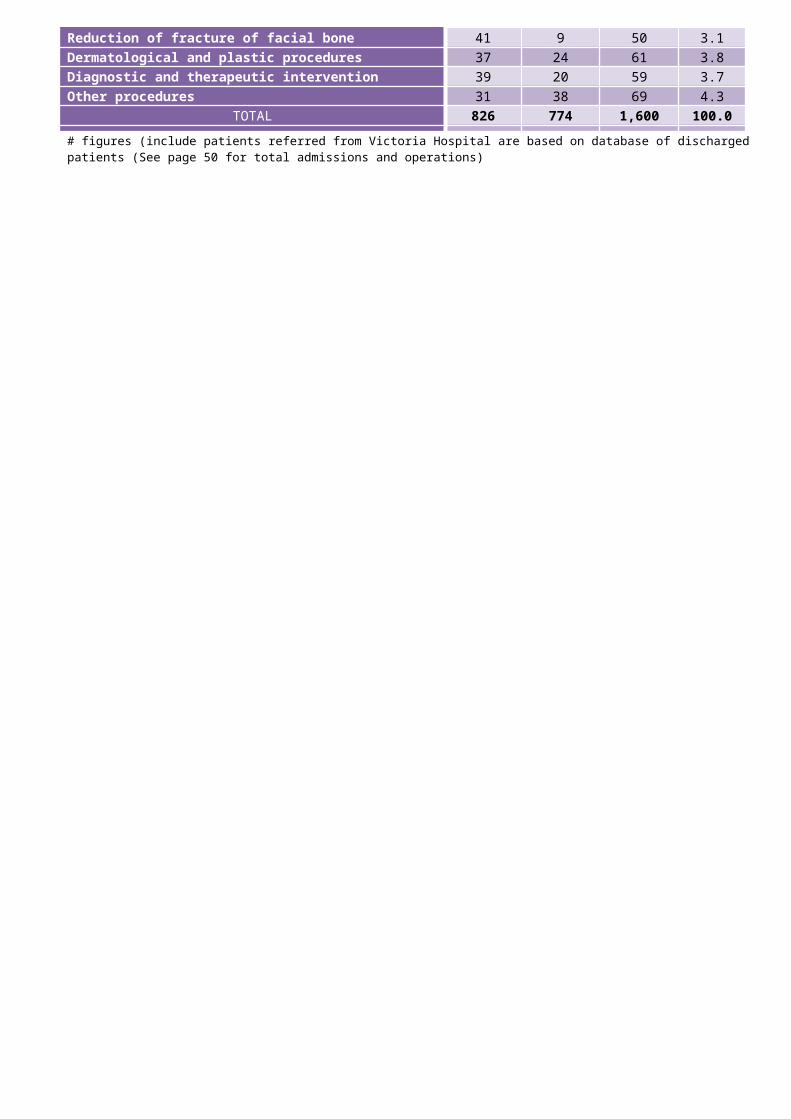
ISLAND OF RODRIGUES114
POPULATION AND VITAL STATISTICS (NUMBERS) 1990 - 2012
YEAR Estimated Mid-Year
population
Civil marriages
Live Births
Deaths
Natural Increase
Maternal Deaths
Still-Births
Infant Deaths z
Child Deaths x
Under-5 Deaths #
Estimated End-of-Year Population
1990 *
34,204 173 803 177 626 - 17 28 5 33 34,292
1991 34,330 149 761 212 549 2 14 25 2 27 34,3861992 34,453 162 732 157 575 1 5 18 4 22 34,5091993 34,519 193 662 158 504 - 4 14 2 16 34,5551994 34,698 202 745 168 577 - 3 15 1 16 34,7071995 34,821 194 725 167 558 - 2 16 2 18 34,8681996 34,939 198 714 162 552 - 2 14 2 16 35,0721997 35,140 233 681 188 493 - 4 13 - 13 35,2601998 35,303 248 690 188 502 - 6 12 4 16 35,4111999 35,549 223 768 153 615 - 7 21 2 23 35,640 2000
*35,779 243 807 176 631 1 3 16 4 20 35,885
2001 36,006 221 812 222 590 1 10 19 1 20 36,0852002 36,175 231 814 229 585 2 6 19 6 25 36,3032003 36,448 256 825 210 615 - 15 20 4 24 36,5032004 36,690 247 945 216 729 - 24 21 2 23 36,7722005 36,907 218 896 224 672 - 12 11 2 13 36,9942006 37,079 209 881 245 636 - 12 24 4 28 37,2302007 37,314 186 844 175 669 - 15 13 - 13 37,4992008 37,570 185 782 206 576 - 6 13 2 15 37,7002009 37,749 173 721 237 484 - 5 10 - 10 37,7742010 37,840 185 714 240 474 1 8 10 2 12 37,8382011 37,925 165 699 219 480 - 3 12 3 15 38,0462012 38,167 185 728 240 488 - 8 15 2 17 38,242
Note: Population figures for 1984 and later years refer to the "resident" population.
z Infant : Less than one year old
* based on census data x Child : Aged one to under 5 years # Under-5 Deaths: Infant deaths + Child Deaths

ISLAND OF RODRIGUES
POPULATION AND VITAL STATISTICS (RATES) 1990 - 2012
Y E A R Mid-Year
Population
Density Per
Square Kilometr
e $
Rates per 1000 of the Mid-YearMaternal Mortality Ratio z
Stillbirth Rate @
Infant mortality
Rate zUnder-5
Mortality Rate z
End-of-Year Population Density
Per square Kilometre $Marriag
e RateCrude Birth Rate
Crude Death Rate
Rate of Natural Increas
e
1990 * 329 10.1 23.5 5.2 18.3 - 20.7 34.9 41.1 3301991 330 8.7 22.2 6.2 16.0 2.6 18.1 32.9 35.5 3311992 331 9.4 21.2 4.6 16.7 1.4 6.8 24.6 30.1 3321993 332 11.2 19.2 4.6 14.6 - 6.0 21.1 24.2 3321994 334 11.6 21.5 4.8 16.6 - 4.0 20.1 21.5 3331995 334 11.2 20.8 4.8 16.1 - 2.8 22.1 24.8 3351996 336 11.4 20.5 4.6 15.8 - 2.8 19.6 22.4 3371997 338 13.3 19.4 5.4 14.0 - 5.8 19.1 19.1 3381998 339 14.1 19.6 5.3 14.2 - 8.6 17.4 23.2 3401999 342 12.6 21.7 4.3 17.3 - 9.0 27.3 29.9 342
2000 *
344 13.6 22.6 4.9 17.6 1.2 3.7 19.8 24.8 344
2001 346 12.3 22.6 6.2 16.4 1.2 12.2 23.4 24.6 3472002 348 12.8 22.5 6.3 16.2 2.5 7.3 23.3 30.7 3492003 350 14.0 22.6 5.8 16.9 - 17.9 24.2 29.1 3512004 353 13.5 25.8 5.9 19.9 - 24.8 22.2 24.3 3542005 355 11.8 24.3 6.1 18.2 - 13.2 12.3 14.5 3562006 357 11.3 23.8 6.6 17.2 - 13.4 27.2 31.8 3582007 359 10.0 22.6 4.7 17.9 - 17.5 15.4 15.4 3612008 361 9.8 20.8 5.5 15.3 - 7.6 16.6 19.2 3632009 363 9.2 19.1 6.3 12.8 - 6.9 13.9 13.9 3632010 364 9.8 18.9 6.3 12.5 1.4 11.1 14.0 16.8 3642011 365 8.7 18.4 5.8 12.7 - 4.3 17.2 21.5 3662012 367 9.7 19.1 6.3 12.8 - 10.9 20.6 23.4 368
Note: Population densities and rates for 1984 and later years are based on the"resident" population rate per 1000 live births
115

* based on census data @ rate per 1000 total births (live births and stillbirths) $ based on an area of 104.0 square kilometres

ISLAND OF RODRIGUESSTILLBIRTHS, PERINATAL, NEONATAL AND INFANT DEATHS 1990 - 2012
116
YEAR STILLBIRTHS EARLY NEONATAL
DEATHSPERINATAL DEATHS LATE NEONATAL
DEATHSNEONATAL DEATHS POST-NEONATAL
DEATHSINFANT DEATHS
NUMBER RATE @ NUMBER RATE z NUMBER RATE @ NUMBER RATE z NUMBER RATE z NUMBER RATE z NUMBER RATE z
1990
17 20.7 8 10.0 25 30.5 3 3.7 11 13.7 17 21.2 28 34.9
1991
14 18.1 10 13.1 24 31.0 2 2.6 12 15.8 13 17.1 25 32.9
1992
5 6.8 6 8.2 11 14.9 3 4.1 9 12.3 9 12.3 18 24.6
1993
4 6.0 5 7.6 9 13.5 - - 5 7.6 9 13.6 14 21.1
1994
3 4.0 12 16.1 15 20.1 2 2.7 14 18.8 1 1.3 15 20.1
1995
2 2.8 11 15.2 13 17.9 - - 11 15.2 5 6.9 16 22.1
1996
2 2.8 8 11.2 10 14.0 - - 8 11.2 6 8.4 14 19.6
1997
4 5.8 4 5.9 8 11.7 2 2.9 6 8.8 7 10.3 13 19.1
1998
6 8.6 8 11.6 14 20.1 3 4.3 11 15.9 1 1.4 12 17.4
1999
7 9.0 15 19.5 22 28.4 1 1.3 16 20.8 5 6.5 21 27.3
2000
3 3.7 11 13.6 14 17.3 3 3.7 14 17.3 2 2.5 16 19.8
2001
10 12.2 13 16.0 23 28.0 2 2.5 15 18.5 4 4.9 19 23.4
2002
6 7.3 12 14.7 18 22.0 2 2.5 14 17.2 5 6.1 19 23.3
2003
15 17.9 9 10.9 24 28.6 1 1.2 10 12.1 10 12.1 20 24.2
2004
24 24.8 15 15.8 39 40.2 3 3.2 18 19.0 3 3.2 21 22.2
2005
12 13.2 4 4.5 16 17.6 1 1.1 5 5.6 6 6.7 11 12.3
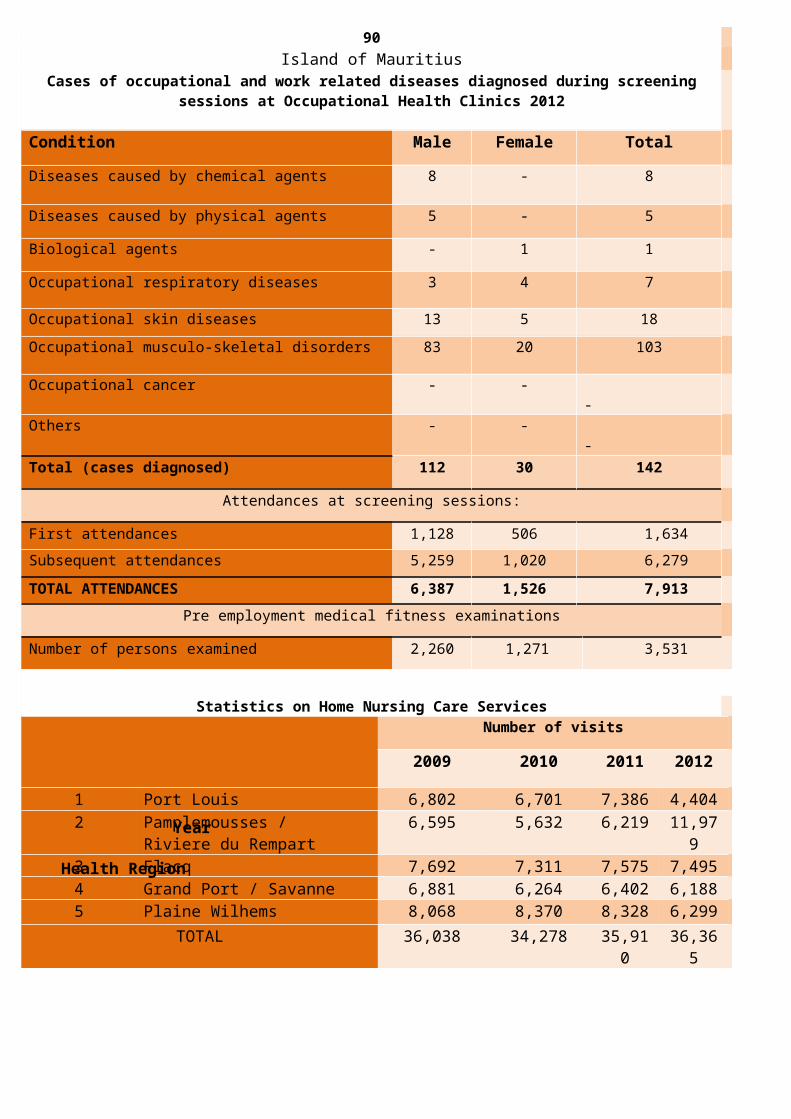
2006
12 13.4 13 14.8 25 28.0 5 5.7 18 20.4 6 6.8 24 27.2
2007
15 17.5 8 9.5 23 26.8 3 3.6 11 13.0 2 2.4 13 15.4
2008
6 7.6 6 7.7 12 15.2 3 3.8 9 11.5 4 5.1 13 16.6
2009
5 6.9 6 8.3 11 15.2 - - 6 8.3 4 5.5 10 13.9
2010
8 11.1 9 12.6 17 23.5 - - 9 12.6 1 1.4 10 14.0
2011
3 4.3 10 14.3 13 18.5 1 1.4 11 15.7 1 1.4 12 17.2
2012 8 10.9 5 6.9 13 17.7 3 4.1 8 11.0 7 9.6 15 20.6
@ Per 1,000 total births ( live births and stillbirths) z Per 1,000 live births DEFINITIONS: 1. STILLBIRTH: A child born dead after the 28th week of pregnancy 5. NEONATAL DEATHS: Deaths under 4 weeks 2. EARLY NEONATAL DEATHS: Deaths occurring in the 1st week of life 6. POST-NEONATAL DEATHS: Deaths between 4 weeks and 1 year 3. PERINATAL DEATHS: Stillbirths plus early neonatal deaths 7. INFANT DEATHS: Deaths under 1 year 4. LATE NEONATAL DEATHS: Deaths between 1 week and 4 weeks

117
ISLAND OF RODRIGUES
FERTILITY RATES 2003- 2012
RATE 2003 2004
2005 2006
2007
2008
2009
2010
2011
2012
Crude birth rate
23.6 24.2
24.6 24.2 22.4
20.8
19.1
18.9
18.4
19.1
General fertility rate
88.1 89.2
91.0 87.5 84.5
78.8
72.3
72.6
73.7
74.3
Total fertility rate
2.81 2.86
2.91 2.85 2.72
2.51
2.36
2.32
2.39
2.38
Gross reproduction rate
1.36 1.40
1.43 1.42 1.35
1.23
1.04
1.15
1.19
1.16
Net reproduction rate
1.31 1.35
1.38 1.37 1.31
1.19
1.00
1.11
1.15
1.12
Age-specific fertility rates: Age of women (Years)
15 - 1969.3 74.0 78.3 71.2 68.3 62.1 66.0 65.1 55.6 63.
0
20 - 24125.1 117.
6117.
5106.
799.7 93.6 81.5 98.6 83.6 96.
8
25 - 29138.9 144.
8150.
4144.
4139.
3129.
795.8 92.0 110.
796.
4
30 - 34119.9 124.
5127.
4135.
8124.
3117.
3115.
3107.
6104.
597.
0
35 - 3982.2 83.0 82.8 83.2 83.2 72.5 76.2 76.7 77.0 88.
6
40 - 4423.4 24.2 22.8 25.7 26.9 26.1 34.6 23.6 41.6 31.
1
45 - 493.0 3.0 2.6 2.6 1.5 1.7 2.0 0.0 4.1 2.1
Note : For definitions, see glossary
LIFE EXPECTANCY AT BIRTH (YEARS) *
2003 2004 2005 2006 2007
MALE 70.9 70.2 69.6 69.4 70.3
FEMALE 76.1 74.8 74.9 74.8 76.2
2008 2009 2010 2011 2012
MALE 70.7 70.7 70.9 71.6 71.5
FEMALE 76.4 77.0 76.8 77.2 76.6
* Calculation based on a five-year period118

ISLAND OF RODRIGUESESTIMATED MID-YEAR RESIDENT POPULATION BY AGE AND SEX - 2012
AGE-GROUP
(years)MALE FEMALE BOTH SEXES
Number % Number % Number % UNDER 1 366 1.9 372 1.9 738 1.9 1 - 4 1,514 8.0 1,406 7.3 2,920 7.7 5 - 9 2,164 11.5 2,102 10.9 4,266 11.2 10 - 14 1,924 10.2 1,812 9.4 3,736 9.8 15 - 19 1,727 9.2 1,793 9.3 3,520 9.2 20 - 24 1,824 9.7 1,797 9.3 3,621 9.5 25 - 29 1,677 8.9 1,702 8.8 3,379 8.9 30 - 34 1,420 7.5 1,536 8.0 2,956 7.7 35 - 39 836 4.4 993 5.1 1,829 4.8 40 - 44 792 4.2 868 4.5 1,660 4.3 45 - 49 935 5.0 965 5.0 1,900 5.0 50 - 54 978 5.2 967 5.0 1,945 5.1 55 - 59 861 4.6 758 3.9 1,619 4.2 60 - 64 566 3.0 607 3.1 1,173 3.1 65 - 69 477 2.5 537 2.8 1,014 2.7 70 - 74 391 2.1 479 2.5 870 2.3 75 - 79 243 1.3 302 1.6 545 1.4 80 - 84 124 0.7 167 0.9 291 0.8 85 & OVER 45 0.2 140 0.7 185 0.5 ALL AGES 18,864 100.0 19,303 100.0 38,167 100.0 UNDER 5 1,880 10.0 1,778 9.2 3658 9.6 5 - 11 2,998 15.9 2,839 14.7 5837 15.3 12 - 19 2,817 14.9 2,868 14.9 5685 14.9 16 - 18 1,060 5.6 1,092 5.7 2152 5.6 UNDER 15 5,968 31.6 5,692 29.5 11660 30.5 UNDER 18 6,998 37.1 6,771 35.1 13769 36.1 UNDER 21 8,034 42.6 7,853 40.7 15887 41.6 15 - 49 9,211 48.8 9,654 50.0 18865 49.4 15 - 59 11,050 58.6 11,379 58.9 22429 58.8 15 - 64 11,616 61.6 11,986 62.1 23602 61.8 15 & OVER 12,896 68.4 13,611 70.5 26507 69.5 18 & OVER 11,866 62.9 12,532 64.9 24398 63.9 21 & OVER 10,830 57.4 11,450 59.3 22280 58.4 60 & OVER 1,846 9.8 2,232 11.6 4078 10.7 65 & OVER 1,280 6.8 1,625 8.4 2905 7.6 MEAN AGE 29.0 30.3 29.7 MEDIAN AGE 24.8 26.1 25.4DEPENDENCY RATIO*
624.0 610.5 617.1
* [(Population under 15 + population 65 & over) / Population 15 - 64] x 1000
Note: Population figures by age and sex for the Island of Rodrigues have been obtained as a difference between thefigures for the Republic of Mauritius (excluding Agalega & Saint Brandon) and those for the Island of Mauritius.
119ISLAND OF RODRIGUES

SELECTED HEALTH PERSONNEL AS AT END-OF-YEAR IN THE PUBLIC SECTOR as at 31. 12. 2010 as at 31. 12. 2011 as at 31. 12. 2012 MALE FEMAL
ETOTA MAL FEMAL
ETOTAL MALE FEMALE TOTAL
Medical Officer (all grades) 13 6 19 11 5 16 14 5 19Dental Surgeon 1 1 2 2 - 2 1 1 2Senior Dental Assistant - 1 1 - 1 1 - 1 1Dental Assistant - 3 3 - 3 3 - 3 3Nursing Administrator * 1 - 1 1 - 1 1 - 1Nursing Supervisor * 3 3 6 3 3 6 3 3 6Charge Nurse * 19 15 34 19 15 34 20 19 39Nursing Officer 52 38 90 48 40 88 49 33 82Nursing Officer with
Midwifery- 7 7 - 3 3 - 3 3
Community Midwife/Senior C.M.
- 5 5 - - - - - -
Principal/Senior midwife - - - - 4 4 - 4 4Midwife - 24 24 - 22 22 - 22 22Community Health Nursing
Officer2 1 3 2 1 3 2 1 3
Principal Health Inspector 1 - 1 1 - 1 1 - 1Senior Health Inspector 1 - 1 1 - 1 1 - 1Health Inspector 1 - 1 2 - 2 2 - 2Principal Medical
Laboratory Technician
1 - 1 - 1 1 - 1 1
Senior Medical Laboratory Technician
1 - 1 1 - 1 1 - 1
Medical Laboratory Technician
2 1 3 1 2 3 1 2 3
Senior Medical Imaging Technologist
1 - 1 1 - 1 1 - 1
Medical Imaging Technologist
1 - 1 2 - 2 2 - 2
Radiographic Assistant/Senior R. A.
- 3 3 - 3 3 - 3 3
Principal Dispenser 1 - 1 1 - 1 1 - 1Senior Dispenser 2 - 2 2 - 2 2 - 2Dispenser 6 2 8 5 2 7 5 2 7Physiotherapy Assistant - 2 2 - 2 2 - 2 2Senior Health Records
Officer1 - 1 1 - 1 1 - 1
Senior Health Records Clerk - 1 1 - 1 1 - 1 1Higher Health Records
Clerk- 3 3 - 3 3 - 3 3
Health Records Clerk 2 8 10 2 8 10 2 8 10Statistical Assistant - 1 1 - 1 1 - 1 1Supervisor/Senior Sup.
(Family Planning)- 2 2 - 2 2 - 2 2
Motivator (Family Planning) - 1 1 - 1 1 - 1 1Community Health Care
Officer3 4 7 2 4 6 2 4 6
Health Care Assistant - 4 4 - 5 5 - 4 4E.C.G. Technician - 1 1 - 1 1 - 1 1* including officers appointed in an acting capacity
SELECTED HEALTH MANPOWER STATISTICS AS AT END-OF-YEAR as at 31. 12. 2010 as at 31. 12. 2011 as at 31. 12. 2012 NUMBE
RPOPULATION PER
GRADENUMBER POPULATION PER
GRADENUMBER POPULATIO PER
GRADEDoctor 19 1,991 16 2,378 20# 1,912Dentist 2 18,919 2 19,023 2 19,120Pharmacists* 1 37,838 2 19,023 2 19,120Nurse and
Midwife170 223 161 236 159 241
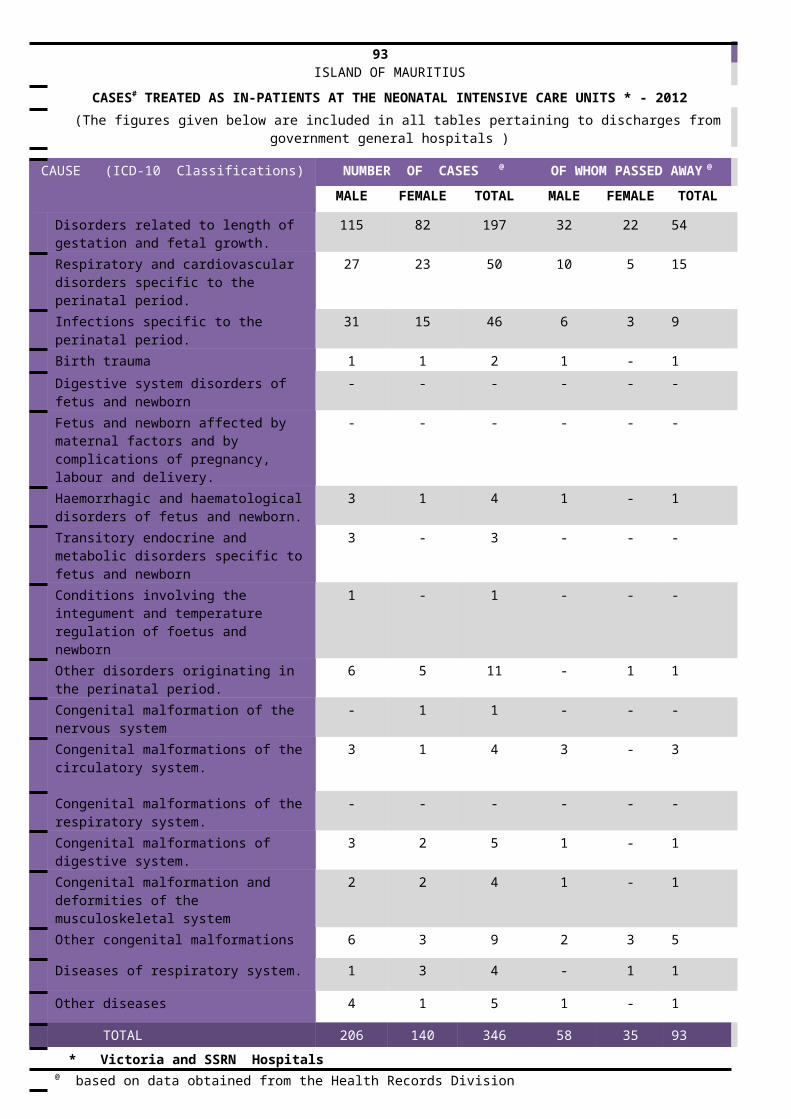
Health Inspector 3 12,613 4 9,510 4 9,560Laboratory
Technician5 7,568 5 7,608 5 7,648
Medical ImagingTechnologist
2 18,919 3 12,680 3 12,747
Dispenser 11 3,440 10 3,804 10 3,824Health Records
Staff15 2,523 15 2,536 15 2,549
* in the private sector
# including one doctor in the private sector

120
ISLAND OF RODRIGUES
SUMMARY OF WORK PERFORMED IN HOSPITAL/HEALTH CENTRES* - 2012
Institution Number of
beds
No. of admissions Percentage Bed Occupancy Number of
Deaths
Number of Operations performed
Male Female
Both Sexes
Quarter Year Minor
Major
Total
1st 2nd 3rd 4thQ. Elizabeth
135 4,146
5,296 9,442 60.3 62.0
60.6
50.2 58.2 106 770 1,074
1,844
Hospital Mont Lubin H.C.
28 476 1,068 1,544 34.3 35.7
31.0
26.5 31.9 - . . . . . .
La Ferme H.C.
26 388 862 1,250 16.2 22.9
26.4
21.5 21.7 - . . . . . .
T o t a l 189 5,01
07,226 12,23
650.6 52.
951.7
48.9 49.5 106 770 1074 1,844
* with in-patient services
. . not applicable (no operations are performed at Mont Lubin H.C. and La Ferme H.C.)
WORK PERFORMED IN MATERNITY SECTIONS - 2012
Institution
Deliveries Outcome of Deliveries Low Birthweight#
Stillbirth Rate *
% Caesarian Section
Normal
Caesarian
Other @
Total
Stillbirths
Live birth
s
Total birth
s
Number
% Live births
Q. Elizabeth Hospital
413 270 4 687 8 689 697 79 11.5 11.5 39.3
Mont Lubin H.C.
8 - - 8 - 8 8 1 12.5 - -
La Ferme H.C.
7 - - 7 - 7 7 1 14.3 - -
T o t a l 428 270 4 702 8 704 712 81 11.5 11.2 38.5
@ forceps delivery,breech delivery etc.
# birthweight of less than 2,500 grammes
* per 1,000 total births
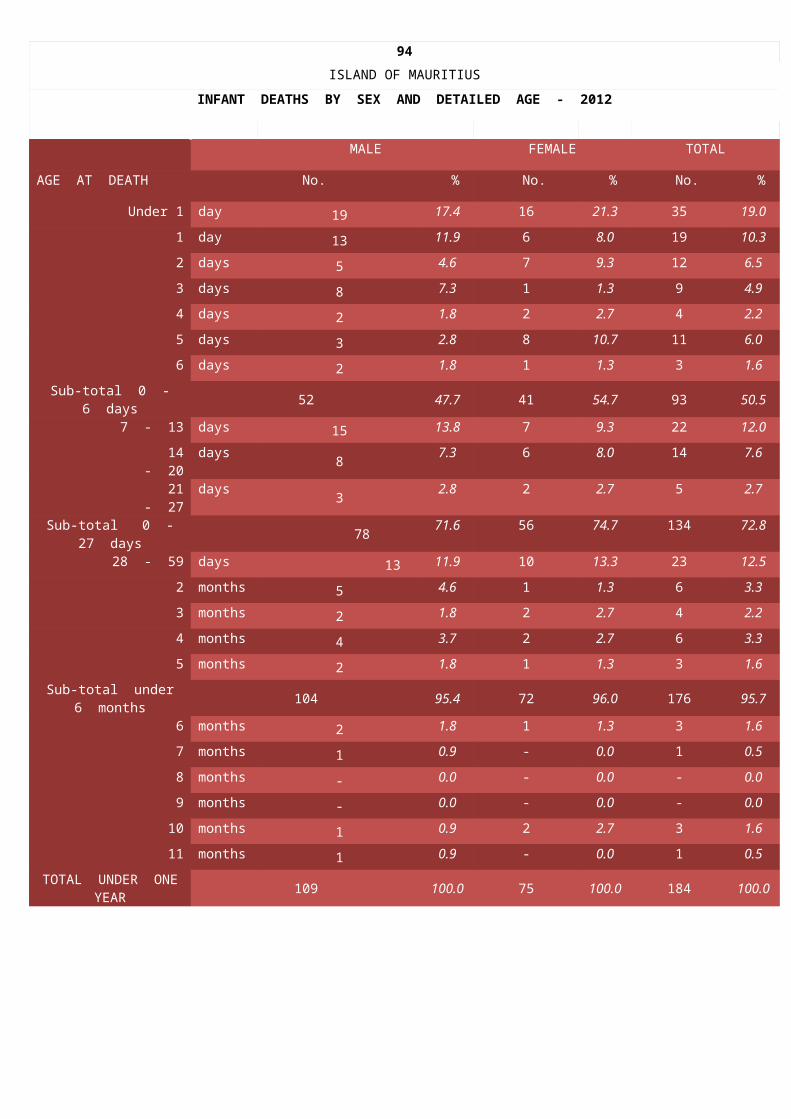
121ISLAND OF RODRIGUES
OUT-PATIENT ATTENDANCES - 2012INSTITUTION Number of out-patient attendances
Accident & Emergency/uns
orted OPD#
Sorted OPD# Other * TOTAL
HOSPITAL QUEEN ELIZABETH II 36,871 19,887 14,403 71,161
HEALTH CENTRES MONT LUBIN 34,995 10,672 13,384 59,051 LA FERME 29,526 6,674 20,642 56,842
T o t a l 101,392 37,233 48,429 187,054
* Follow up for injections , dressings etc. # seen by doctor
ATTENDANCES FOR TREATMENT OF COMMON DISEASES AND INJURIES AT COMMUNITY HEALTH CENTRES - 2012
C E N T R E 1st Quarte
r
2nd Quarter
3rd Quarter
4th Quarter
Total
ALLEE TAMARIN 42 49 86 63 240
BAIE AUX HUITRES 1,457 1,649 1,787 1,580 6,473
BAIE TOPAZE 316 342 410 335 1,403
CASCADE JEAN-LOUIS 233 300 323 174 1,030
GRAND BAIE 342 276 320 318 1,256
MALARTIC 151 162 280 218 811
MANGUES 1,065 1,245 871 997 4,178
PETIT GABRIEL 1,942 1,963 1,923 1,720 7,548
PORT SUD EST 1,606 1,531 1,833 1,821 6,791
RIVIERE COCOS 973 997 1,025 928 3,923
ROCHE BON DIEU 1,497 1,566 1,654 1,547 6,264
SOUPIRS 1,150 1,203 1,270 1,188 4,811
BATATRAND 521 557 606 654 2,338
MONTAGNE GOYAVE 438 424 561 585 2,008
T O T A L 11,733 12,264 12,949 12,128 49,074

122ISLAND OF RODRIGUES
ACTIVITIES CARRIED OUT AT QUEEN ELIZABETH HOSPITAL-2012
A. PHYSIOTHERAPY DEPARTMENTCASES SEEN NUMBER
Male Female TotalIN-PATIENT# New cases 78 90 168
Follow-up 126 274 400
Total cases 204 364 568
OUT-PATIENT First Attendances 148 214 362
Subsequent Attendances 438 639 1,077
Total Attendances 586 853 1,439
# in wards or at the physiotherapy unit
B. RADIOLOGICAL DEPARTMENT
EXAMINATIONS NUMBER
GENERAL PROCEDURES Extremities 5,278
Chest 3,188
Spine 1,061
Abdomen 1,501
Skull 2,063
PROCEDURES WITH BARIUM
Meal 14
Swallow 8
Enema 26
SPECIAL PROCEDURES (including intravenous pyelography, urethrography, hysterosalpingography and cholecystography)
34
TOTAL* 13,173
* The 13,173 examinations were carried out on 9,888 patients.
C. HAEMODIALYSIS UNIT
DETAIL NUMBER
Dialysis done on patients@ 3,084
Patients as at end of year 24
@ during 939 sessions

123
ISLAND OF RODRIGUESSTATISTICS RELATING TO MATERNAL AND CHILD HEALTH ACTIVITIES - 2012
REGISTRATION OF GESTATIONAL AGE AT FIRST Number %
ATTENDANCE FOR ANTENATAL TREATMENT 3 months or less 268 38.6
Between 3 and 6 months 310 44.7
6 months and over 116 16.7
TOTAL FIRST ATTENDANCES 694 100.0
FIRST DETERMINATION OF HAEMOGLOBIN LEVEL %
OF ANTENATAL CASES
below 9.0 25 3.6
9.0 to 9.9 40 5.8
10.0 to 10.9 157 22.8
11.0 to 11.9 258 37.4
12.0 or above 210 30.4
TOTAL 690 100.0
EXAMINATIONS CARRIED OUT AT CLINIC
ANTENATAL EXAMINATIONS BY MIDWIFE/NURSE First attendances 694 Subsequent attendances 4,920 ANTENATAL EXAMINATIONS BY DOCTOR* First attendances 694 Subsequent attendances 4,924 POSTNATAL EXAMINATIONS BY DOCTOR First attendances 581 Subsequent attendances 620 CHILDREN SEEN FOR GROWTH MONITORING Number of attendances 7,146 of whom reported underweight 1
of whom reported overweight Nil
EXAM. OF CHILDREN UNDER 5 YEARS BY DOCTOR# First attendances 547 Subsequent attendances 1,466 TOTAL ATTENDANCES 21,592
* of which 608 were referred to hospital# figures are estimates based on attendances for cash gifts

124ISLAND OF RODRIGUES
STATISTICS RELATING TO EXPANDED PROGRAMME ON IMMUNIZATION - 2012
EXPANDED PROGRAMME ON IMMUNIZATION
BABIES B.C.G. 714
M.M.R. 665 D.P.T. & H.I.B, HEP. B & O.P.V: 1st dose 720
2nd dose 715 3rd dose 715
Booster dose (excl.Hep B) 580 D.T, O.P.V & HEP.B: 1st dose 1 2nd dose - 3rd dose -
Booster dose (excl. Hep B)
-
TOTAL ATTENDANCES 4,110
PREGNANT WOMEN TETANUS TOXOID: 1st dose 561
2nd dose 459 Booster dose (1 year after
2nd dose)31
TOTAL ATTENDANCES 1,051
ACTIVITIES RELATING TO BASIC SANITATION AND FOOD HYGIENE -2012
ACTIVITIES
NUMBER
BASIC SANITATION
No. of premises and other sites inspected 1,820No. of notices issued 291No. of sanitary contraventions -No. of cases sentenced -FOOD HYGIENENo. of inspections carried out 4,838Foodstuffs units for consumption seized and destroyed (kg)
9,825
No. of contraventions -No. of cases sentenced -INSPECTION OF PUBLIC PLACESCinema halls & other entertainment places 194Dormitories ( including Boarding Houses) 408Industrial establishments 121Schools 596@
OTHERNo. of passengers put under surveillance for: malaria 832No. of times given pratique to ships/aircrafts 174@ include hospitals and health centres

125 ISLAND OF RODRIGUES
TABLE A: ATTENDANCES AT DENTAL CLINICS 2008 - 2012
Attendances Number2008 2009 2010 2011 2012
Cases seen by dentists: Children < 5 years 567 633 610 488 583
Children aged 5-11 years 2,424 2,685 3,056 3,302 3,107Persons aged 12 years & above 11,683 11,688 12,015 11,685 11,003
SUBTOTAL
14,674
15,006 15,681 15,475 14,693
Cases seen by specialists:
Orthodontists 254 178 189 174 245 Oral Surgeons 92 139 64 131 109
TOTAL ATTENDANCES
15,020 15,323 15,934 15,780 15,047
TABLE B: DISTRIBUTION OF CASES SEEN BY TYPE OF DENTAL CARE
Dental care Number2008 2009 2010 2011 2012
EXTRACTION AND TOOTH RESTORATION Deciduous teeth extracted 2,150 2,186 2,432 2,419 3,115 Schoolchildren Temporary fillings inserted in : deciduous
teeth 196 232 160 143 22
permanent teeth 76 157 105 129 162 Permanent fillings inserted : Amalgam 71 230 507 482 402 Composite 19 24 56 25 23 Permanent teeth extracted 71 60 107 108 154 Adults Temporary fillings inserted 2,787 3,028 1,966 2,552 1,188 Permanent fillings inserted : Amalgam 1,077 1,407 1,867 1,554 1,989 Composite 549 415 707 723 647 Teeth extracted 3,114 3,362 3,782 3,374 4,432 OTHER DENTAL CARE
Treatment of paradontal disease (scaling) 350 343 365 371 451 Treatment of dental abscess 1,042 1,155 957 925 680 Surgical operations on jaws and surgical extractions 494 507 381 553 514 Application of pit and fissure sealants 2 5 3 344* 543* Endodontic treatment 72 96 108 141 143 * preventive programme of pit and fissure sealants reviewed
TABLE C: ORTHODONTIC ACTIVITY ACTIVITY Number
2008 2009 2010 2011 2012 No of impressions taken 37 26 31 26 42 No of appliances delivered 29 24 27 25 40 No of appliances activated 7 - - - - No of appliances repaired - - 16 1 2

ISLAND OF RODRIGUESDISTRIBUTION OF CERTAIN NOTIFIABLE DISEASES REPORTED TO SANITARY AUTHORITIES 1992 - 2012
DISEASEHIV/AIDS@ AMOEBIASIS
FOOD POISONI
-NGGONORRHOE
AINFECTIVE HEPATITIS
INFLU-ENZA LIKE
DISEASES
LEPROSY
MALARIA (IMPORTED
)MEASLE
S SYPHILIS
TUBERCULOSIS*
TYPHO-ID FEVE
R
WHOO-PING
COUGH (PERTU-SIS)
126
YEAR
PULMONARY
OTHER
1992 - - 1 2 2 - 1 - - - 1 - - -1993 - - - - 173 - 1 - - - 5 - - -1994 - - - - 6 - - - - - 4 - - -1995 - - - - - - - - - - - - - -1996 - - 21 - 2 - - - - - 1 - - -1997 - - 1 - - - 1 1 - - - - - -1998 1 - 16 - 1 - - 1 - - 3 - - -1999 - - - 3 - - - - - - 1 - - -2000 - - - - - - - - - - 1 - - -2001 - - 15 - - - - 1 - - - - - -2002 - - 4 - - - - - - - 1 - - -2003 2 - - - - - - - 27 - - - - -2004 1 1 3 - - - - - 6 - 2 - - -2005 3 5 - - - - - - 6 - 1 - - -2006 5 - - - - - - - - - - - - -2007 9 - - - 1 - - - - - 1 - - -2008 8 - 2 - - - - 1 - - - - - -2009 4 - 13 - - 1 - - - - 3 - - -2010 8 - 9 - - - - - - - - - - -2011 9 - 26 - 3 - - 1 - 1 - - - -2012 5 - 7 - - - - - - - 1 - - -
* The following forms of tuberculosis are notifiable: respiratory, skeletal, of meninges and central nervous system @ Human Immuno-Deficiency Virus/Acquired immuno-deficiency syndromeN.B. 553 cases of chikungunya have been reported in 2006 mostly in April

127 ISLAND OF RODRIGUES
CERTAIN PRINCIPAL CAUSES OF DISCHARGES FROM HOSPITAL AND HEALTH CENTRES - 2012(The distribution of discharges by I.C.D. Chapter is on page 128)
C A U S E (ICD-10)
DISCHARGESMALE FEMAL
ETOTAL
No. %1 Injuries (Crushing & superficial injuries, fractures,
open wounds , dislocations, sprains & strains)498 222 720 6.0
2 Complications of pregnancy, childbirth and the puerperium
- 680 680 5.7
3 Delivery without mention of complications - 637 637 5.34 Diabetes mellitus 219 337 556 4.65 Bronchitis (chronic and unspecified, emphysema,
and asthma)261 270 531 4.4
6 Abdominal pain 158 262 420 3.57 Acute upper respiratory infections 198 202 400 3.38 Hypertensive disease 131 234 365 3.09 Heart diseases # 150 166 316 2.610 Gastritis and duodenitis 133 169 302 2.511 Ill-defined intestinal infections (colitis, enteritis,
gastro-enteritis, diarrhoea) 140 148 288 2.4
12 Cellulitis and abscess 162 98 260 2.213 Epilepsy 162 92 254 2.114 Nausea and vomiting 103 130 233 1.915 Dorsopathies including spondylopathies 107 109 216 1.816 Poisonings and toxic effects 129 81 210 1.817 Fever (Pyrexia) of unknown origin 93 109 202 1.718 Anaemias 74 98 172 1.419 Malaise and fatigue 49 110 159 1.320 Complications following spontaneous and other
abortions- 124 124 1.0
21 Diseases of eye and adnexa 59 43 102 0.922 Non-inflammatory disorders of vagina - 102 102 0.923 Cerebrovascular disease 58 44 102 0.924 Convulsions 58 37 95 0.825 Alcoholic psychoses 83 7 90 0.826 Symptoms involving heart beat & cardiac
murmurs37 45 82 0.7
27 Headache 35 44 79 0.728 Rheumatism, unspecified 32 37 69 0.629 Dyspnoea and other abnormalities of breathing 33 33 66 0.630 Symptoms involving urinary system 38 10 48 0.431 Appendicitis 19 26 45 0.432 Non-dependent abuse of alcohol 32 7 39 0.333 Alcohol dependence syndrome 36 2 38 0.334 Gout 22 7 29 0.235 Chest pain 13 12 25 0.2 All other causes 1,779 2,152 3,931 32.8
T O T A L 5,101 6,886 11,987
100.0
# excluding "Acute rheumatic fever", "Hypertensive disease" and "Diseases of pulmonary circulation"

128 ISLAND OF RODRIGUES
DISCHARGES FROM HOSPITAL AND HEALTH CENTRES BY I.C.D. (10th REVISION ) CHAPTER AND SEX - 2012
CHAPTER (I.C.D. 10th Revision )
DISCHARGES MALE FEMAL
ETOTAL
No. % 1. Certain infectious & parasitic diseases 183 190 373 3.1
2. Neoplasms 92 131 223 1.9 3. Diseases of the blood & blood-forming
organs and certain disorders involving the immune mechanism
88 110 198 1.7
4. Endocrine, nutritional & metabolic diseases 240 383 623 5.2
5. Mental & behavioural disorders 211 133 344 2.9
6. Diseases of the nervous system 182 141 323 2.7
7. Diseases of the eye & adnexa 59 43 102 0.9
8. Diseases of the ear & mastoid process 29 21 50 0.4
9. Diseases of the circulatory system 371 507 878 7.3
10.
Diseases of the respiratory system 712 693 1,405 11.7
11.
Diseases of the digestive system 401 383 784 6.5
12.
Diseases of the skin & subcutaneous tissue 232 166 398 3.3
13.
Diseases of the musculoskeletal system & connective tissue
230 228 458 3.8
14.
Diseases of the genitourinary system 199 527 726 6.1
15.
Pregnancy, childbirth & the puerperium - 1,441 1,441 12.0
16.
Certain conditions originating in the perinatal period
174 169 343* 2.9
17 Congenital malformations, deformations & chromosomal abnormalities
37 18 55 0.5
18 Symptoms, signs & abnormal clinical & laboratory findings, not elsewhere classified
799 1,042 1,841 15.4
19 & 20
Injury, poisoning & certain other consequences of external causes
738 417 1,155 9.6
21 Factors influencing health status & contact with health services
124 143 267 2.2
T O T A L 5,101 6,886 11,987
100.0
Note: The above table is based on data received on discharged patients from Hospital/ Health Centres. The table on page 120 contains the total number of admissions at Hospital/Health Centres.
* including 161 cases with diagnosis "under observation"129
ISLAND OF RODRIGUES
*

CERTAIN PRINCIPAL CAUSES OF FIRST ATTENDANCES AT COMMUNITY HEALTH CENTRESFOR THE TREATMENT OF COMMON DISEASES AND INJURIES - 2012
CAUSE (I.C.D. 10TH REVISION) MALE FEMALE T O T A LNo. %
1 Tonsilitis, laryngitis, nasopharyngitis (common cold), sore throat, URTI
1,105 1,538 2,643 16.9
2 Cough, pain in throat, chest pain, wheezing, hiccough, sneezing
887 1,198 2,085 13.4
3 Fever / pain all over 439 612 1,051 6.74 Abdominal and epigastric pain 298 489 787 5.05 Dermatitis, eczema , itching, ingrowing nail, acne, vitiligo
and other diseases of the skin and subcutaneous tissue285 467 752 4.8
6 Spondylosis, neck pain, low back pain, backache 276 413 689 4.47 Scabies. 308 333 641 4.18 Helminthiasis (worms). 304 314 618 4.09 Sinusitis, rhinitis, nasal polyp, blocked nose 253 354 607 3.9
10 Headache, dizziness, giddiness 195 390 585 3.811 Gastritis and duodenitis 201 273 474 3.012 Gastroenteritis and diarrhoea of presumed infectious
origin200 257 457 2.9
13 Gout , arthritis, pain in joint 178 265 443 2.814 Malaise, fatigue , weakness, blackout, fainting and other
symptoms and signs99 265 364 2.3
15 Nausea and vomiting 138 190 328 2.116 Rheumatism, muscular pain, myalgia, pain in limb 103 217 320 2.117 Vaginitis, bleeding PV, leukorrhoea, menstrual disorders
- 307 307 2.0
18 Conjunctivitis 110 160 270 1.719 Otitis, wax in ear, earache and other diseases of the ear
and mastoid process93 151 244 1.6
20 Influenza 96 122 218 1.421 Superficial injury, open wound, spain/strain, fractures,
burns and other injuries101 87 188 1.2
22 Indigestion, constipation, irritable bowel syndrome, anal / rectal abscess
73 111 184 1.2
23 Cystitis, urinary tract infection 73 104 177 1.124 Skin abscess , boil, cellulitis, cyst, septic leg (non-
diabetic)78 78 156 1.0
25 Localised swelling, mass, lump of skin, rash 34 106 140 0.926 Bronchitis, emphysema, asthma 62 67 129 0.827 Swelling gum, gingivitis, dental caries, stomatitis, disease
of lip53 50 103 0.7
28 Hypertension 36 62 98 0.629 Anemias 9 33 42 0.330 Malnutrition and other nutritional deficiencies 12 18 30 0.2 All other causes 184 285 469 3.0 T O T A L 6,283 9,316 15,59
9100.
0

130
ISLAND OF RODRIGUES
FIRST ATTENDANCES AT COMMUNITY HEALTH CENTRES FOR THE TREATMENT
OF COMMON DISEASES AND INJURIES
BY I.C.D. CHAPTER AND SEX - 2012
CHAPTER (I.C.D. 10th REVISION) FIRST ATTENDANCES
MALE FEMALE TOTALNo. %
1 Certain infectious & parasitic diseases 813 911 1,724 11.1
2 Neoplasms - - - 0.0
3. Diseases of the blood & blood-forming organs and certain disorders involving the immune mechanism
9 33 42 0.3
4. Endocrine, nutritional & metabolic diseases
20 29 49 0.3
5. Mental & behavioural disorders 1 1 2 0.0
6. Diseases of the nervous system 13 43 56 0.4
7. Diseases of the eye & adnexa 173 233 406 2.6
8. Diseases of the ear & mastoid process 93 151 244 1.6
9. Diseases of the circulatory system 56 119 175 1.1
10.
Diseases of the respiratory system 1,522 2,098 3,620 23.2
11.
Diseases of the digestive system 331 443 774 5.0
12.
Diseases of the skin & subcutaneous tissue
363 545 908 5.8
13.
Diseases of the musculoskeletal system & connective tissue
576 917 1,493 9.6
14.
Diseases of the genitourinary system 76 420 496 3.2
15 Pregnancy, childbirth & the puerperium
- 1 1 0.0
16 Certain conditions originating in the perinatal period
- - - 0.0
17 Congenital malformations, deformations & chromosomal abnormalities
5 8 13 0.1
18 Symptoms, signs & abnormal clinical & laboratory findings, not elsewhere classified
2,129 3,274 5,403 34.6
19 & 20
Injury, poisoning & certain other consequences of external causes
103 90 193 1.2
T O T A L 6,283 9,316 15,599 100.0

131 ISLAND OF RODRIGUES
EARLY NEONATAL DEATHS - 2012( Deaths under one week [ age group 0 - 6 days ] )
CAUSE ( I.C.D. 10 ) NUMBER OF DEATHSMALE FEMAL
ETOTAL
No. %Congenital anomalies 2 - 2 40.0 Respiratory Distress Syndrome 2 - 2 40.0 Septicaemia
1 - 1 20.0
TOTAL EARLY NEONATAL DEATHS
5 - 5 100.0
LATE NEONATAL DEATHS - 2012( Deaths between one and four weeks [ age group 7 - 27 days ] )
CAUSE (ICD-10) NUMBER OF DEATHS
MALE FEMALE TOTAL
Severe prematurity 1 - 1Congenital pneumonia 1 - 1Jaundice 1 - 1
Total Late Neonatal Deaths 3 - 3POST-NEONATAL DEATHS - 2012
( Deaths between four weeks and one year [ age group 28 - 364 days ] )
CAUSE ( I.C.D. 10) NUMBER OF DEATHS
MALE FEMALE TOTAL
Congenital anomalies 1 2 3Aspiration pneumonia - 1 1Acute bronchiolitis - 1 1Pneumonia - 1 1Malnutrition - 1 1Total Post Neonatal Deaths
1 6 7
INFANT DEATHS - 2012( Deaths under one year [ age group 0 - 364 days ] )
CAUSE ( I.C.D. 10 ) NUMBER OF DEATHSMALE FEMALE TOTAL
No. %Congenital anomalies 3 2 5 33.3Septicaemia specific to the perinatal period
1 - 1 6.7
Respiratory Distress Syndrome
2 - 2 13.3
Congenital Pneumonia 1 - 1 6.7Prematurity 1 - 1 6.7Jaundice 1 - 1 6.7Aspiration pneumonia - 1 1 6.7Acute bronchiolitis - 1 1 6.7Pneumonia - 1 1 6.7Malnutrition - 1 1 6.7
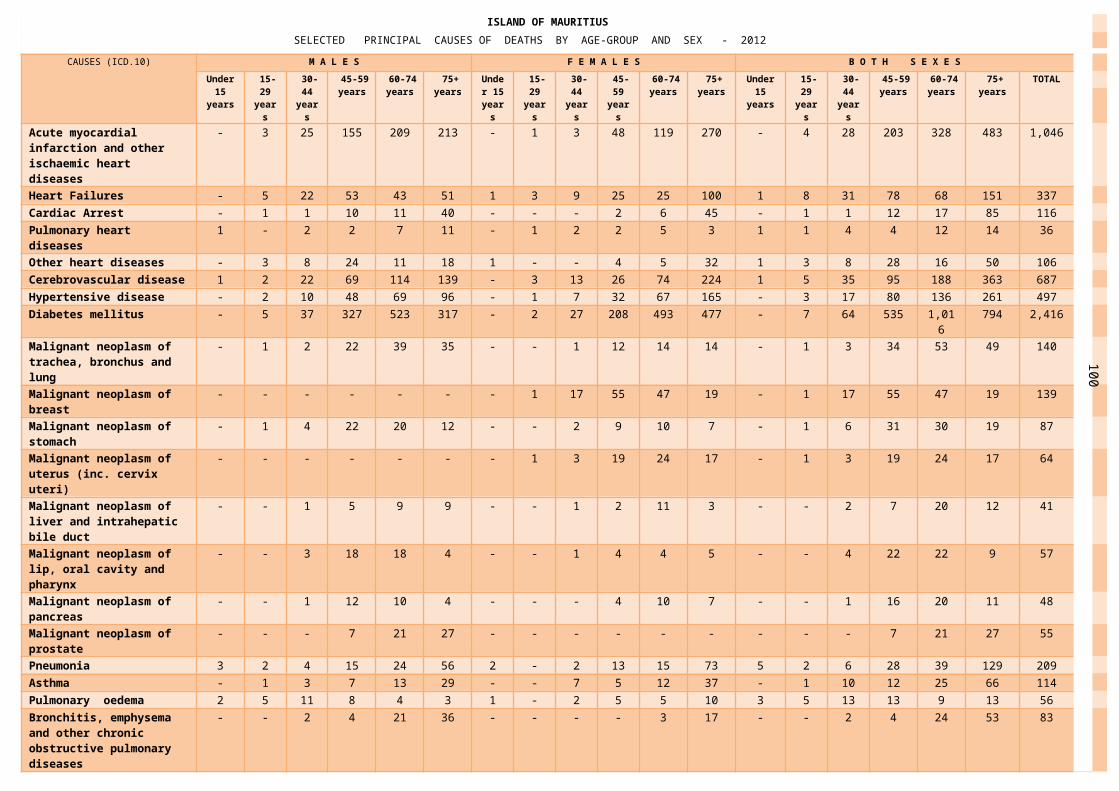
TOTAL INFANT DEATHS 9 6 15 100.0
132 ISLAND OF RODRIGUES
CHILD@ DEATHS - 2012CAUSE (I.C.D 10) NUMBER OF DEATHS
Male Female TotalCongenital anomalies - 2 2 @ aged 1-4 years
INFANT ( UNDER ONE YEAR) DEATHS BY SEX AND DETAILED AGE - 2012
AGE AT DEATH MALE FEMALE TOTAL
No. % No. % No. %
Under 1 day
- - - - - -
1 day 2 22.2 - - 2 13.3
2 days 2 22.2 - - 2 13.3
3 days - - - - - -
4 days 1 11.1 - - 1 6.7
5 days - - - - - -
6 days - - - - - -
Sub-total 0 - 6 days 5 55.6 - - 5 33.3
7 - 13 days
2 22.2 - - 2 13.3
14 - 20 days
- - - - - -
21 - 27 days
1 11.1 - - 1 6.7
Sub-total 0 - 27 days
8 88.9 - - 8 53.3
28 - 59 days
- - 2 33.3 2 13.3
2 months
- - - - - -
3 months
- - 1 16.7 1 6.7
4 months
- - - - - -
5 months
- - 1 16.7 1 6.7
Sub-total under 6 months 8 88.9 4 66.7 12 80.0
6 months
- - - - - -
7 months
1 11.1 2 33.3 3 20.0
8 months
- - - - - -
9 months
- - - - - -
10 months
- - - - - -
11 months
- - - - - -

TOTAL UNDER ONE YEAR 9 100.0
6 100.0 15 100.0
133 ISLAND OF RODRIGUES
SELECTED CAUSES OF DEATH (ALL AGES) - 2012
MALE FEMALE TOTAL
No. % No. % No. %Acute myocardial infarction and other ischaemic heart diseases
13 10.2 16 14.3 29 12.1
Heart Failures - - - - - -
Cardiac Arrest 2 1.6 3 2.7 5 2.1
Pulmonary heart disease - - - - - -
Other heart diseases 2 1.6 - - 2 0.8
Cerebrovascular disease 8 6.3 8 7.1 16 6.7
Hypertensive disease 12 9.4 15 13.4 27 11.3
Diabetes mellitus 17 13.3 25 22.3 42 17.5
Malignant neoplasm of trachea, bronchus and lung
4 3.1 2 1.8 6 2.5
Malignant neoplasm of breast
- - 5 4.5 5 2.1
Malignant neoplasm of stomach
- - - - - -
Malignant neoplasm of uterus (inc. cervix uteri)
- - 4 3.6 4 1.7
Malignant neoplasm of hepatocellular
- - 1 0.9 1 0.4
Malignant neoplasm of lip, oral cavity and pharynx
2 1.6 - - 2 0.8
Malignant neoplasm of pancreas
2 1.6 - - 2 0.8
Malignant neoplasm of prostate
5 3.9 - - 5 2.1
Pneumonia 1 0.8 3 2.7 4 1.7Asthma 1 0.8 - - 1 0.4
Pulmonary oedema - - - - - -
Chronic obstructive airway disease
6 4.7 1 0.9 7 2.9
Land Transport Accidents 2 1.6 1 0.9 3 1.3
Suicide - - 1 0.9 1 0.4
Homicide 3 2.3 - - 3 1.3
Accidental drowning and submersion
2 1.6 - - 2 0.8
Diseases of liver (inc. alcoholic cirrhosis)
3 2.3 - - 3 1.3
Renal failures 2 1.6 2 1.8 4 1.7
Senility 1 0.8 1 0.9 2 0.8Septicaemia unspecified - - 1 0.9 1 0.4
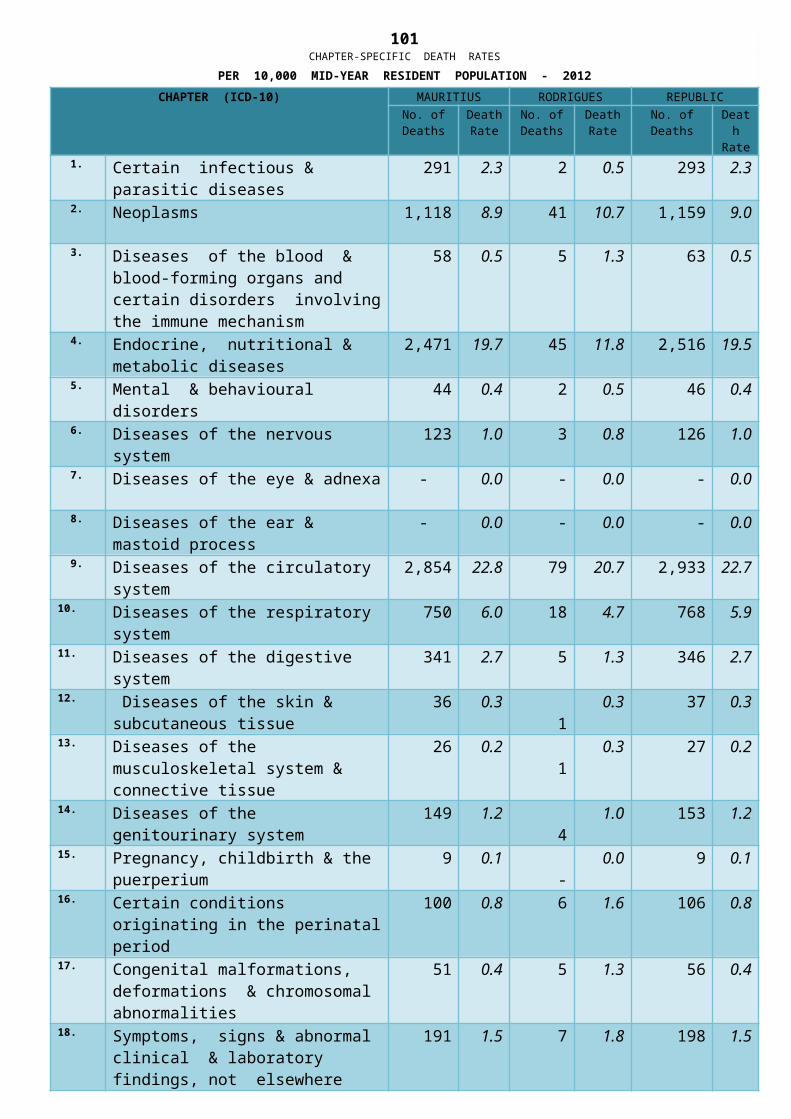
Gastrointestinal haemorrhage unspecified
2 1.6 - - 2 0.8
All other causes 38 29.7 23 20.5 61 25.4
T O T A L 128 100.0 112 100.0 240 100.0
134
ISLAND OF RODRIGUESDEATHS (ALL AGES) BY I.C.D. CHAPTER AND SEX - 2012
CAUSE ( ICD - 10 ) DEATHS
MALE FEMALE TOTAL
No. % No. % No. %1 Certain infectious & parasitic
diseases1 0.8 1 0.9 2 0.8
2 Neoplasms 21 16.4 20 17.9 41 17.1
3 Diseases of the blood & blood-forming organs and certain disorders involving the immune mechanism
1 0.8 4 3.6 5 2.1
4 Endocrine, nutritional & metabolic diseases
19 14.8 26 23.2 45 18.8
5 Mental & behavioural disorders 1 0.8 1 0.9 2 0.8
6 Diseases of the nervous system 2 1.6 1 0.9 3 1.3
7 Diseases of the eye & adnexa - 0.0 - 0.0 - 0.0
8 Diseases of the ear & mastoid process - 0.0 - 0.0 - 0.0
9 Diseases of the circulatory system 37 28.9 42 37.5 79 32.9
10
Diseases of the respiratory system 9 7.0 9 8.0 18 7.5
11
Diseases of the digestive system 5 3.9 - 0.0 5 2.1
12
Diseases of the skin & subcutaneous tissue
1 0.8 - 0.0 1 0.4
13
Diseases of the musculoskeletal system & connective tissue
1 0.8 - 0.0 1 0.4
14
Diseases of the genitourinary system
2 1.6 2 1.8 4 1.7
15
Pregnancy, childbirth & the puerperium
- 0.0 - 0.0 - 0.0
16
Certain conditions originating in the perinatal period
6 4.7 - 0.0 6 2.5
17
Congenital malformations, deformations & chromosomal abnormalities
3 2.3 2 1.8 5 2.1
18
Symptoms, signs & abnormal clinical & laboratory findings, not elsewhere classified
5 3.9 2 1.8 7 2.9

19
Injury, poisoning & certain other consequences of external causes
14 10.9 2 1.8 16 6.7
T O T A L 128 100.0 112 100.0 240 100.0
135 ISLAND OF RODRIGUES
DISTRIBUTION OF DEATHS BY AGE-GROUP AND SEX, AND AGE-SPECIFIC DEATH RATES
PER 1,000 MID-YEAR RESIDENT POPULATION - 2012
DEATHS DEATH RATES
AGE-
GROUPMALE FEMAL
EBOTH SEXES
BOTH
(years) Cumulative
MALE
FEMALE
SEXES
Number
Number
Number
Percentage
Percentage
Under 1 9 6 15 6.3 6.3 24.6 16.1 20.3
1 - 4 - 2 2 0.8 7.1 0.0 1.4 0.7
5 - 9 - - - 0.0 7.1 0.0 0.0 0.0
10 - 14 2 1 3 1.3 8.3 1.0 0.6 0.8
15 - 19 - - - 0.0 8.3 0.0 0.0 0.0
20 - 24 3 - 3 1.3 9.6 1.6 0.0 0.8
25 - 29 - 1 1 0.4 10.0 0.0 0.6 0.3
30 - 34 - 3 3 1.3 11.3 0.0 2.0 1.0
35 - 39 3 1 4 1.7 12.9 3.6 1.0 2.2
40 - 44 1 2 3 1.3 14.2 1.3 2.3 1.8
45 - 49 5 2 7 2.9 17.1 5.3 2.1 3.7
50 - 54 10 1 11 4.6 21.7 10.2 1.0 5.7
55 - 59 12 6 18 7.5 29.2 13.9 7.9 11.1
60 - 64 12 9 21 8.8 37.9 21.2 14.8 17.9
65 - 69 12 12 24 10.0 47.9 25.2 22.3 23.7
70 - 74 16 10 26 10.8 58.8 40.9 20.9 29.9
75 - 79 20 15 35 14.6 73.3 82.3 49.7 64.2
80 - 84 10 12 22 9.2 82.5 80.6 71.9 75.6
85 & over 13 29 42 17.5 100.0 288. 207.1 227.

9 0 ALL AGES 128 112 240 100.0 6.8 5.8 6.3

AGE-GROUP
136
GLOSSARY
A period covering several years relating to the age of members of a population. Usually expressed in a range of age last birthday, for example 15-19 years. This age-group concerns all persons who have reached 15 years of age, but who have not reached twenty years. A person aged 19 years, 11 months and 29 days would be included in that age-group.
ANTENATAL EXAMINATIONS
Care and examination of expecting mothers during pregnancy
BIRTHWEIGHT The first weight of the foetus or newborn obtained after birth. This weight should be measured preferably within the first hour of life before significant postnatal weight loss has occurred.
BIRTHWEIGHT (LOW) A birthweight of less than 2,500 grammes (up to, and including 2,499 grammes).
CAUSES OF DEATH All diseases, morbid conditions or injuries which either resulted in or contributed to death and the circumstances of the accident or violence which produced any such injuries.
CHILDBEARING YEARS The period of her life during which a woman can reproduce. For the purpose of international comparisons, this is arbitrarily assumed to be in the age-group 15-49 years.
DEATH The irreversible cessation of all the following (i) total cerebral function (ii) spontaneous function of the respiratory system and spontaneous function of the circulatory system.
DEATH CERTIFICATE A legal document signed by a medical practitioner indicating the morbid conditions which lead directly to death and to state any antecedent conditions giving rise to this cause.
EPIDEMIC Infections diseases occurring suddenly in numbers clearly in excess of normal expectancy.
FECUNDITY The physiological capacity to reproduce.
FERTILITY The actual reproductive performance.
FOETAL DEATH Foetal death is death prior to the complete expulsion or extraction from its mother of a product of conception, irrespective of the duration of the pregnancy; the death is indicated by the fact that after such separation the foetus does not breathe or show any other evidence of life, such as beating of the heart, pulsation of the umbilical cord, or definite movement of voluntary muscles. (W.H.O. definition). A distinction is made between early foetal death (abortion) and late foetal death (stillbirth), the dividing line being the 28th week of gestation.

137
GLOSSARY
GESTATIONAL AGEThe duration of gestation is measured from the first day of the last menstrual period, and is usually expressed in completed weeks. (W.H.O. definition).
LIFE EXPECTANCY The average number of years left to a person to live, if current mortality trends were to continue. Life expectancy at birth is a much used health indicator. In most societies the expectancy for females is a few years longer than for males.
LIFE TABLES Any of various tables describing mortality and survival data for groups of individuals at specific times or over defined intervals
LIVE BIRTH Live birth is the complete expulsion or extraction from its mother of a product of conception, irrespective of the duration of the pregnancy, which, after such separation, breathes or shows any other evidence of life, such as beating of the heart, pulsation of the umbilical cord, or definite movement of voluntary muscles, whether or not the umbilical cord has been cut or the placenta is attached; each product of such a birth is considered live born. (W.H.O. definition).
MORBIDITY The measurement of illness in a population.
MORTALITY The frequency and characteristics of deaths in a population.
NATALITY The frequency and characteristics of births in a population.
NATURAL INCREASE The excess of live births over deaths in a population during a given time period, usually a calendar year. In a few societies the excess is negative, that is there is a "natural decrease".
NEONATAL INTENSIVE CARE
Provision of treatment to newborns who are in critical conditions (normally after birth) necessitating life saving care.
NUPTIALITY The frequency and characteristics of marriages in a population.
PANDEMIC A widespread epidemic of a disease distributed or occurring widely throughout a region/country/continent or globally
PARADONTAL DISEASES Disease of the soft tissue surrounding the tooth
POSTNATAL EXAMINATIONS
Examination and care of mother after delivery
VITAL STATISTICS Demographic data on live births, stillbirths, deaths and marriages.
FERTILITY RATES
AGE-SPECIFIC FERTILITY RATE
The number of live births to women in each of the five-year age-groups, 15-19, 20-24, ...,45-49, registered during a calendar year, divided by the estimated mid-year female population in the respective age-group, and multiplied by 1,000; expressed per 1,000 women in the relevant age-group.
CRUDE BIRTH RATE The number of live births registered during a calendar year, divided by the estimated mid-year population, and multiplied by 1,000; expressed per 1,000 mid-year population.
138
GLOSSARY
GENERAL FERTILITY RATE
The number of live births registered during a calendar year, divided by the estimated mid-year female population aged 15-49 years, and multiplied by 1,000; expressed per 1,000 women aged 15-49 years.
GROSS REPRODUCTION RATE
The definition and modes of computation and expression of this rate are similar to those of the Total Fertility Rate, except that only children of the female sex are taken into consideration. As more often than not, in any given year, more boys than girls are born, the Gross Reproduction Rate is usually slightly less than half the Total Fertility Rate.
NET REPRODUCTION RATE
This rate is an improvement of the Gross Reproduction Rate, in that it takes into consideration the fact that some women die before reaching the end of their childbearing years, and therefore their contribution to reproduction would be less than that assumed in the computation of the Gross Reproduction Rate. The Net Reproduction Rate is therefore always less than the Gross Reproduction Rate. A Net Reproduction Rate of 1.00 denotes replacement level fertility, that is the women are having just enough daughters to "replace" them in the population.
TOTAL FERTILITY RATE The average number of children that would be born alive to an average woman during her life-time if she were to be subjected during her childbearing years (15-49) to the age-specific fertility rates observed in a given calendar year. Usually computed by adding the age-specific fertility rates (in five-year age-groups, 15-19, 20-24, ..., 45-49), multiplying by five, and dividing by 1,000; expressed as a number, usually given correct to two places of decimal.
MORTALITY RATES
AGE SPECIFIC DEATH RATE
The number of deaths for a specific age/age group divided by mid year population for this age/age group and multiplied by 10,000.
CAUSE SPECIFIC DEATH RATE
Number of deaths due to a specific disease/s divided by mid year population multiplied by 10,000
CRUDE DEATH RATE The number of deaths registered during a calendar year, divided by the estimated mid-year population, and multiplied by 1,000; expressed per 1,000 mid-year population.
INFANT MORTALITY RATE
The number of deaths of children under the age of one year (0-364 days) registered during a calendar year, divided by the number of live births registered during the same year, and multiplied by 1,000; expressed per 1,000 live births.
NEONATAL MORTALITY RATE
The number of deaths of children under the age of four weeks (0-27 days) registered during a calendar year, divided by the number of live births registered during the same year, and multiplied by 1,000; expressed per 1,000 live births.

139
GLOSSARY
EARLY NEONATAL MORTALITY RATE
The number of deaths of children under the age of one week, (0-6 days) registered during a calendar year, divided by the number of live births registered during the same year, and multiplied by 1,000; expressed per 1,000 live births.
LATE NEONATAL MORTALITY RATE
The number of deaths of children aged between one week and four weeks (7-27 days) registered during a calendar year, divided by the number of live births registered during the same year , and multiplied by 1,000; expressed per 1,000 live births.
POST-NEONATAL MORTALITY RATE
The number of deaths of children aged between four weeks and one year (28-364 days) registered during a calendar year, divided by the number of live births registered during the same year, and multiplied by 1,000; expressed per 1,000 live births.
PERINATAL MORTALITY RATE
The sum of the number of stillbirths and the number of deaths of children under the age of one week (0-6 days) registered during a calendar year, divided by the sum of the number of live births and the number of stillbirths registered during the same year, and multiplied by 1,000; expressed per 1,000 total live births and stillbirths. Sometimes the Perinatal Mortality Rate is expressed per 1,000 live births, in which case the divisor in the computation is the number of live births only.
CHILD (OR EARLY CHILDHOOD) MORTALITY RATE
The number of deaths of children aged between one year and five years (1-4 years) registered during a calendar year, divided by the estimated mid-year population aged between one year and five years (1-4 years), and multiplied by 1,000; expressed per thousand mid-year population aged between one year and five years (1-4 years).
UNDER FIVE MORTALITY RATE
The number of deaths of children aged under five years (0-4 years) registered during a calendar year, divided by the number of live births registered during the same year, and multiplied by 1,000; expressed per 1,000 live births.
MATERNAL MORTALITY RATIO
The number of (female) deaths ascribed to complications of pregnancy, childbirth and the puerperium registered during a calendar year, divided by the number of live births registered during the same year, and multiplied by 1,000; expressed per 1,000 live births.
MORBIDITY RATES
INCIDENCE RATE
The number of new cases of a disease registered (or notified) during a given year, divided by the estimated mid-year population, and multiplied by 10 raised to the power of a convenient digit, which depends upon the frequency of the particular disease. For example, in the Island of Mauritius, in 2002, the incidence rate of pulmonary tuberculosis was 8.9 new cases per 100,000 mid-year population.

PREVALENCE RATE
140
GLOSSARY
The number of persons suffering from a particular disease at a given point in time, usually 30th June or 31st December of a given year, divided by the estimated population at the same point in time, and multiplied by 10 raised to the power of a convenient digit, which depends upon the frequency of the particular disease. Difficult to compute on a regular basis through lack of disease registers. The prevalence rates of specific diseases are occasionally estimated by means of population based surveys.
OTHER RATES
BED OCCUPANCY RATE The percentage of the sum of all occupied beds days divided by the sum of all available bed days.
CRUDE MARRIAGE RATE The number of persons civilly married during a calendar year, divided by the estimated mid-year population, and multiplied by 1,000; expressed per 1,000 mid-year population.
STILLBIRTH (OR LATE FOETAL MORTALITY) RATE
The number of stillbirths registered during a calendar year, divided by the sum of the number of live births and the number of stillbirths registered during the same year, and multiplied by 1,000; expressed per 1,000 total live births and stillbirths.
ABBREVIATIONS PERTAINING TO VACCINES
B.C.G Bacille Calmette-Guerin (tuberculosis)
D.P.T Diphtheria, Pertussis (whooping cough) and Tetanus
H.I.B Haemophilus Influenzae Type B
O.P.V Oral Polio Vaccine
HEP.B Hepatitis B
M.M.R Measles, Mumps and Rubella
D.T Diphtheria and Tetanus
T.T Tetanus Toxoid