Embed Size (px)
Citation preview

Polyspectral Analysis of Musical Timbre
A thesis submitted in ful�llmentof the requirements for the degree of
Doctor of Philosophy
Shlomo Dubnov
Submitted to the Senate of the Hebrew University in the year ����

This work was carried out under the supervision of
Prof� Naftali Tishby and Prof� Dalia Cohen

Acknowledgments
Special thanks are due to�
� Prof� Naftali Tishby and Prof� Dalia Cohen for their help
and guidance in carrying out this study�
� Yona Golan for discussions of clustering and for providing
some of the routines�
� Itay Gat� Lidror Troyansky� Elad Schneidman and the rest
of the members of the lab� for their help and support for
the study�
� the late Michael Gerzon and Meir Shaashua for suggesting
the subject and providing with many of the original ideas�
� Steve McAdams and David Wessel� for their revision and
discussion of parts of this study�
� Eshkol Fellowship of the Ministry of Sceineces and Art for
partial support of this study�
� My family�
� My parents�

Contents
Abstract �
I Introduction �
� The Musical Problem of Timbre and Sound Texture ���� Timbre and Sound Texture � � � � � � � � � � � � � � � � � � � ���� Existing Works on Timbre � � � � � � � � � � � � � � � � � � � �
����� Historical Perspective � � � � � � � � � � � � � � � � � � � ������ State of the Art in Sound Representation � � � � � � � � ������ Modeling and Feature Extraction for the Description
of Timbre � � � � � � � � � � � � � � � � � � � � � � � � � ������ Previous Works on Apperiodicities in Periodic Sounds �
��� Overview of the study � � � � � � � � � � � � � � � � � � � � � � ������ Goals � � � � � � � � � � � � � � � � � � � � � � � � � � � � ������ Outline of the Work and Summary of Results � � � � � ������� Musical Contribution � � � � � � � � � � � � � � � � � � ��
� Higher Order Spectra for Acoustic Signal Processing ����� Multiple Correlations and Cumulants of Stochastic Signals � ��
����� Elements System Theory � � � � � � � � � � � � � � � � ����� Properties of Bispectrum of Musical Signals � � � � � � � � � ��
����� Harmonicity Sensitivity � � � � � � � � � � � � � � � � � ������� Phase Coherence � � � � � � � � � � � � � � � � � � � � ��
��� Signi�cance for Musical Raw�Material � � � � � � � � � � � � � ������� Timbre versus Interval � � � � � � � � � � � � � � � � � � ������� RelatedWorks on Bispectral Analysis of Musical Sounds
������� Tone Separation and Timbral Fusion Segregation � � ������ E�ects of Reverberation and Chorusing � � � � � � � � ������ Experimental Results � � � � � � � � � � � � � � � � � � ������� Example � synthetic all�pass �lter � � � � � � � � � � � ��
iv

II The Acoustic Model ��
� AR Modeling and Maximum Likelihood Analysis ����� Source and Filter Parameters Estimation � � � � � � � � � � � � ����� Relations to Other Spectral Estimation Methods � � � � � � � � �
����� Discussion � � � � � � � � � � � � � � � � � � � � � � � � ����� Simulation Results � � � � � � � � � � � � � � � � � � � � � � � � �
� Acoustic Distortion Measures ����� Statistical Distortion Measure � � � � � � � � � � � � � � � � � ����� Acoustic Clustering Using Bispectral Amplitude � � � � � � � ����� Maximum Entropy Polyspectral Distortion Measure � � � � � � ��
����� Discussion � � � � � � � � � � � � � � � � � � � � � � � � ������� Sensitivity to the Signal Amplitude � � � � � � � � � � � ��
��� The Clustering Method � � � � � � � � � � � � � � � � � � � � � � ���� Clustering Results � � � � � � � � � � � � � � � � � � � � � � � � ��
III Analysis of the Signal Residual ��
� Estimating the Excitation Signal ����� Examples of Real Sounds � � � � � � � � � � � � � � � � � � � � ����� Higher Order Moments of the Residual Signal � � � � � � � � ����� Tests for Gaussianity and Linearity � � � � � � � � � � � � � � ����� Results � � � � � � � � � � � � � � � � � � � � � � � � � � � � � � ����� Probabilistic Distortion Measure for HOS features � � � � � � ����� Discussion � � � � � � � � � � � � � � � � � � � � � � � � � � � � ��
����� Musical Signi�cance of the Classi�cation Results � � � � ������� Meaning of Gaussianity � � � � � � � � � � � � � � � � � ��
� �Jitter� Model for Resynthesis ����� Stochastic pulse�train model � � � � � � � � � � � � � � � � � � ����� In�uence of Frequency Modulating Jitter on Pulse Train Sig�
nal� � � � � � � � � � � � � � � � � � � � � � � � � � � � � � � � � ������� The E�ective Number of Harmonics � � � � � � � � � � ������ Simulation Results � � � � � � � � � � � � � � � � � � � ��
��� Summary � � � � � � � � � � � � � � � � � � � � � � � � � � � � � ������� The Findings of the Model � � � � � � � � � � � � � � � ������� Musical Signi�cance � � � � � � � � � � � � � � � � � � � ��
IV Extentions ��

Non Instrumental Sounds ���� Bispectral Analysis � � � � � � � � � � � � � � � � � � � � � � � � ����� �Granular� Signal Model � � � � � � � � � � � � � � � � � � � � � ��
Musical Examples of the Border�State between Texture andTimbre ��� General Characterization of Textural Phenomena � � � � � � � ��
���� Texture and its Relationship to Other Parameters� Dif�ference and Similarity and Borderline States � � � � � � ��
�� Further remarks � � � � � � � � � � � � � � � � � � � � � � � � � � ������ Analogy to Semantic Prosodic Layers in Speech � � � � ���� Symmetry � � � � � � � � � � � � � � � � � � � � � � � � � ���� Non�concurrence and Uncertainty � � � � � � � � � � � � �
�� Summary � � � � � � � � � � � � � � � � � � � � � � � � � � � � � �
Bibliography �

List of Figures
��� Top� Spectrogram of a signal with independent random jittersof the harmonics� Bottom� Spectrogram of a signal with thesame random jitters applied to modulate all three harmonics�One can see the similar instantaneous frequency deviations ofall harmonics� � � � � � � � � � � � � � � � � � � � � � � � � � � �
��� Random jitter applied to modulate the frequency of the har�monics� When each harmonic deviates independently� the bis�pectrum vanishes �left�� while coherent variation among allthree harmonic causes high bispectrum �right�� The bispec�tral analysis was done over a �� sec� segment of the signalwith �� msec� frames� The sampling rate was KHz� � � � � � ��
��� Bicoherence index amplitude of Solo Viola and Arco Violassignals� The x�y axes are normalized to the Nyquist frequency� KHz�� � � � � � � � � � � � � � � � � � � � � � � � � � � � � � ��
��� Bicoherence index amplitude of Solo Cello and Tutti Celli sig�nals� The indices were calculated with �� msec� frames� aver�aged over a � sec� segment� with order FFT transform� Inorder to reveal the high amplitude bispectral constituents bothindices were calculated with the spectra denominator thresh�olded at � db� � � � � � � � � � � � � � � � � � � � � � � � � � � ��
��� Bicoherence of duet soprano singers versus women choir cal�culated with �� msec� frames over a �� sec� segment� Theindices were thresholded to include approximately just the �rsttwo formants� � � � � � � � � � � � � � � � � � � � � � � � � � � ��
��� Bicoherence index amplitude of the output signal resultingfrom passing the �Solo Viola� signal through a Gaussian� ��sec� long �lter � � � � � � � � � � � � � � � � � � � � � � � � � � ��
��� Correlation �left� versus cumulant based �right� �lter esti�mates� � � � � � � � � � � � � � � � � � � � � � � � � � � � � � � � ��
��� Probability distribution function of the non�gaussian input�plotted against the original Gaussian estimate� � � � � � � � � ��
vii

��� Spectral clustering tree� The numbers on the nodes are thesplitting values of �� � � � � � � � � � � � � � � � � � � � � � � � ��
��� Bispectral clustering tree� � � � � � � � � � � � � � � � � � � � � ����� A combined spectral and bispectral clustering tree� � � � � � � ��
��� Signal Model � Stochastic pulse train passing through a �lter� ����� Estimation of the excitation signal �residual� by inverse �lter�
ing� � � � � � � � � � � � � � � � � � � � � � � � � � � � � � � � � ����� The original Cello signal and its spectrum �yop�� The residual
signal and its respective spectrum �bottom�� Notice that allharmonics are present and they have almost equal amplitudes�very much like the spectrum of an ideal pulse train� The timedomain signal of the residual does not resemble pulse train atall� � � � � � � � � � � � � � � � � � � � � � � � � � � � � � � � � � �
��� The bispectrum of a Cello residual signal �top� and the bis�pectrum of the original Cello sound �bottom�� See text formore details� � � � � � � � � � � � � � � � � � � � � � � � � � � � � ��
��� The bispectrum of a Clarinet residual signal �top� and thebispectrum of the original Clarinet sound �bottom�� See textfor more details� � � � � � � � � � � � � � � � � � � � � � � � � � � �
��� The bispectrum of a Trumpet residual signal �yop� and thebispectrum of the original Trumpet sound �bottom�� See textfor more details� � � � � � � � � � � � � � � � � � � � � � � � � � � ��
��� Location of sounds in the �rd and �th cumulants plane� Thevalue � is substructed from the kurtosis so that the originwould correspond to a perfect gaussian signal� Left� All �signals� Brass sounds are on the perimeter� Right� Zoomin towards the center containing strings and surrounded bywoodwinds� � � � � � � � � � � � � � � � � � � � � � � � � � � � � ��
�� Results of the Gaussianity and Linearity tests� PFA � ��means Gaussianity� R�estimated �� R�theory means non�Linearity� The deviations in the Y�axis of the right �gureshould not be considered since the Linearity test is unreliablefor signals with zero bispectrum �Gaussian�� � � � � � � � � � � ��
��� Harmonic signal �left� and its histogram �right�� � � � � � � � ���� Inharmonic signal �left� and its respective histogram �right�� � �

��� Bispectra of two synthetic pulse train signals with frequencymodulating jitter� Top� Qe� � �� Bottom� Qe� � ��� Noticethe resemblance of the two �gures to the bispectral plots of thecello and trumpet in �gure ���� The Qe� values were chosenespecially to �t these instruments according to the skewnessand kurtosis values for the instrument in �gure ���� � � � � � � ��
��� Bispectral amplitudes for people talking� car production fac�tory noise� buccaneer engine and m�� tank sounds �left toright�� � � � � � � � � � � � � � � � � � � � � � � � � � � � � � � � �
��� Location of sounds in the �rd and �th normalized momentsplane� The value � is subtracted from the kurtosis so that theorigin would correspond to a perfect Gaussian signal� Soundswith many random transitory elements are on the perimeter�Smooth sounds are in the center� � � � � � � � � � � � � � � � � ��
�� The grey area between interval�texture and texture�timbre andsome examples of timbres in the borderline between textureand timbre� � � � � � � � � � � � � � � � � � � � � � � � � � � � � ��
�� Comparison of the three parameters from various aspects� � � ��

Abstract
This study is interdisciplinary in its nature� combining problems in musical research withnew techniques of signal and information processing� In the narrow sense� the subject of theresearch is investigation of a phenomenon of aperiodicities in the waveform or �uctuations�jitter� in frequency that occur during the stable �sustained� portion of the sound� Thisphenomenon� which is not related to one of the common timbre characteristics such as thespectral envelope� time envelope and etc�� has scarcely been investigated in the acousticaldomain and its importance for the de�nition of timbre is now being recognized� The �uctu�ations in instrumental sounds occur for time scale shorter then ��� ms and are beyondthe control of the player� Perceptually they bring a sense of separability which� accordingto the de�nitions we give in the study� puts the problem in the border area between timbreand texture�
Additional important property is that the �uctuations are strongly related to non�linearitiesof the sound generating mechanism� Since most of the modeling� analysis and synthesis ofsounds is based on linear modeling� it basically uses spectral information or second orderstatistics �autocorrelation� of the signal� The linearity property obeys the superpositionprinciple � the signal equals to a sum of its components � which from statistical stand pointamounts to independence between the spectral components� The linear approach is thusinsu�cient for the description of the above acoustic phenomena� especially since one of themajor properties of the �uctuations that we are about to discuss is the statistical depen�dence independence among overtones� or in other words concurrence non�concurrence ofthe jitter�
By application of higher order statistical �polyspectral� methods� we analyze and modelthese phenomena so as to reveal the properties of the frequency modulating jitter and con�struct acoustical distance measures that allow for comparison between signals based on the�uctuation non�linearity properties of sounds� The main sound sources that were examinedin this study are timbres of traditional acoustic musical instruments� with some extensionsdone towards analysis and classi�cation of natural and man�made sounds� From a broaderperspective� the method of analysis and its results are signi�cant in many additional musicaldomains�
The main result of the work is in the correspondence between HOS features and soundtimbre properties� speci�cally the classi�cation into instrument families� that we present inthis study� This and other results prove the applicability of our method for the investigationof real acoustical problems and provides an analytical method for the investigation of theseacoustic phenomena� Another contribution is in the use of statistical distance measures forassessing the di�erence between sounds� which is new in musical applications� Combinedwithnew polyspectral source and �lter parameter estimation methods� a generalization to existingspectral distance measures is developed� An important correspondence between non�linearityand non�Gaussianity tests of time series analysis and polyspectral contents of a sound isshown� This result is signi�cant for understanding the relationship between models and their

acoustic features� Moreover� a simple synthesis method which reconstructs the bispectral andtrispectral properties of signals by controlling the concurrence non�concurrence among jittersof the harmonics is presented� Finally� extensions to more general revelations of timbre andtexture� with application to broader class of signals and higher level musical problems aresuggested� �
�Parts of this work were published with some changes in several papers� Please see the bibliography
�

Part I
Introduction
�

Chapter �
The Musical Problem of Timbre and
Sound Texture
��� Timbre and Sound Texture
Timbre is one of four basic psychoacoustical parameters� but in contrast to the other three �pitch� duration and intensity � which can be relatively simply de�ned� hierarchically organizedand notated� timbre has a very complex de�nition� it can not be put on a scale and itsde�nition in fact has never been completed� The de�nition is basically multidimensional�time envelope� spectral envelope� etc�� and here we would like to add another dimensionwhich could be regarded as a border area between timbre and texture�
In the most general sense� timbre can be de�ned negatively� it is the musical parameterwhich describes the properties of a sound which are not one of the following� pitch� intensityand duration� This de�nition� based on the negation of the common musical parameters�� has many realisations �it is mainly known as the perceptual property that distinguishesbetween the sounds of di�erent musical instruments� and it has been given various namessuch as �sound color�� �tone quality�� �tone colour� �Slawson ���� pp������������Erickson����� p���������
Untill the �th century� most of the musical theories related to music parameters otherthan timbre �except for practical orchestration treatises�� Since the ��th century the role ofthe parameter of timbre has gradually increased� reaching a climax in the works of ClaudeDebussy� who uses the chords more for their timbre than for their harmonic function� �
�These parameters are the basis for higher musical constructs and learned schemes on which the variousmusical styles are based in various cultures and di�erent periods� till the ���th century� Musically� the timbreand the interval are complementary parameters� as we shall see in section ������
�An extreme counter example of complete lack of reference to timbre is the Art of the fugue by J�S�Bach�The work is a perfect construct of learned schemes�intervals� with no indication about the type of instrumentsor instrumental writing�
�

In the �th century a great deal of the modern music is based on timbre� as well as ontexture and on various border areas between the two� �One can also speak about borderareas between texture and interval� A detailed discussion will be presented in chapter ��
Texture is a hyperparameter which relates to a statistical description of the organizationof other musical parameters� A more concise de�nition will be given later� In the meantimeit is su�cient to state that we de�ne musical texture as the principle of organization ofsound which is not derived from learned schemes� � and as such it requires a probabilisticapproach for its description� The most salient di�erence between texture and timbre is theperceptual non separability of timbre versus the separability of texture into several sourcesand segmentation in time�
In the border case� when we have di�culty identifying texture constituents or perform�ing segmentation in time�� or when we perceive some internal changes within timbre� anintermediate case between simple timbre and complex organized sound occurs�
Today� in electroacoustic� computer music and in audio applications in general� the basicsound phenomena� or the new �building blocks� for musical composition are de�ned in amuch broader sense than the timbre in the classical period� which related mainly to musicalinstruments� and it encompasses sound events such as complex musical� environmental orman�made sounds� These sounds are still largely regarded and described as phenomena oftimbre�
One could investigate timbre from many aspects� as a maker of musical instruments� asa researcher interested in psychoacoustical and cognitive activity� as a musician interestedin timbre oriented composition and many more� Today the focus on timbre is for one of thefollowing reasons�
�� Timbre occupies a central place in contemporary musical composition�
�� Appropriate tools exist for its research and generation�
�� The research on timbre is a part of our general desire to deepen the understanding ofmusic phenomena as a cognitive activity and investigate the role of each constituentin de�ning the various musical styles�
Due to the complexity of the musical parameter of timbre� the main problems� in our opinion�are the control of timbral properties both for analysis and as a means of its production� witha strong emphasis on the question of �similarity and di�erence�� which is essential for anyform of organization and stands at the basis of every cognitive activity �Tversky �����������
In this work we will extend the research on timbre by the use of a new analytical method� �Higher Order Statistics� �HOS� or �Polyspectra� � and by extending the �eld of timbre
�By learned schemes we mean musical knowledge expressed by the rules of music theory such as harmony�counterpoint and etc�� more readily described by rules of syntax and other Arti�cial Intelligence techniques�
�This situation exists due to psychoacoustic constrains�
�

phenomena to include border areas with timbre� Thus� we have chosen to address the issuemainly from the signal processing point of view� regarding the acoustic signal as a stochasticprocess and suggesting a new approach for its treatment� As we shall see� the method andthe results have interesting implications for musical research and understanding�
��� Existing Works on Timbre
����� Historical Perspective
The research on timbre is relatively young� but something about it� such as the existenceof the second harmonic� was known already in Ancient Greece� The existence of harmonicswas �rst reported clearly by the theoretician Mersenne ������ ���� He heard at least �vepartials after the fundamental frequency has decayed� but his explanation was obscure� Athorough explanation of the phenomenon was provided by the French researcher Sauveur����� �������Scherchen ���������� He was the �rst to understand properly the phenomenonof overtones and coined the terms �overtones� and �fundamental frequency�� The �rst bookon harmony by Rameau ���� was based on Sauveur�s theory� he attempted to explain therules of harmony based on natural phenomena� as they were understood at the time� Aswe�ve mentioned earlier� the research on timbre has advanced mostly in the �th century�We can not present a broad historical review� but we shall at least stress the importance ofresearch and theory on the shaping of musical practice and musical style�
Many modern studies focus on speci�c problems and parameters� with the purpose of�nding good mathematical models for describing timbre and de�ning its psychoacousticaldimensions� followed by attempts to �nd some organizational principles for timbre ���� andto devise methods of synthesis and transformation�
The speci�c method for analysis that we use in this work � higher order statistics�polyspectra� � has appeared in the statistical and signal processing literature� but it hashardly received any attention in the studies of acoustics and music� The basic issue here isthe focus on the steady state of the sound while extending the �eld to deal with border areasbetween timbre and texture� and adding a new dimension for the analysis of timbre�
����� State of the Art in Sound Representation
Our understanding of the world strongly depends on the representation of its objects� Theinability to �nd a satisfactory descriptive vocabulary for sounds or to relate verbal attributesto physical sound parameters had been a central di�culty in sound information handling�Finding high�level means for describing sound holds the promise for arranging on somescale� having means for organization� structuring and handling of sound and much more�The prospect of de�ning a �representation space� for sound is thus a fairly obvious and
�

attractive idea and indeed several studies have attempted to do so� Most of them have fo�cused on the representation of sounds of musical instruments� while almost no attention hasbeen paid to more complex natural or man made sounds� An important study of di�erencesbetween musical instruments� based onidenti�cation by human subjects� was done by J�Grey����������� who suggested a multidimensional representation based on spectral energy distri�bution� dynamic attributes in the onset portion of the tone and presence of high frequencynoise during the early part of the sound� It appears� though� that these dimensions are notenough to characterize all the perceivable di�erences in sound timbres�
In contrast to these studies of known timbres� other studies deal with describing soundsynthesis schemes� One of them� by Ashley ��������� uses a knowledge�based method formapping between verbal descriptions and FM synthesis parameters� A more recent workby Ethington ���������� uses a series of listening experiments to map verbal descriptionsto a synthesis technique� In fact� a strong background in synthesis theory has always beena prerequisite for e�ective work with synthesizers� where sounds are speci�ed by a largecollection of numerical parameters speci�c to a given synthesis technique�
����� Modeling and Feature Extraction for the Description ofTimbre
Three basic model types are in prevalent use today for musical sound generation� instrumentmodels� spectrum models� and abstract models� Instrument models attempt to parameterizea sound at its source� such as a violin� clarinet� or vocal tract� Spectral models attempt toparameterize a sound at the basilar membrane of the ear� discarding whatever informationthe ear seems to discard in the spectrum� Abstract models� such as FM� attempt to providemusically useful parameters in an abstract formula� We shall not deal with the last type ofmodels in this study�
Instrument models can be further classi�ed into two main classes of methods for soundanalysis�synthesis� The �rst one is known as a �Signal Model�� It tries to model the essentialproperties of some families of signals� It is essentially based on signal processing methods�Source��lter models� as applied �rst for speech synthesis� are good examples of a signalmodel�
The second class of models is known as a �Physical Model�� It tries to build a model ofa musical instrument by �nding and simulating the physical laws that governs its function�ing� For instance� models of the vocal tract have been developed for speech synthesis� andmany models of musical instruments are being studied� Both classes have advantages anddrawbacks� and e�orts are being made to build models with the bene�t of both�
Naturally� it is very important to discover the relationship between models and synthesistechniques and the psychoacoustical parameters� Concerning the basic paramters such aspitch� loudness� duration and the two main dimensions of timbre � spectral envelope and
�

temporal envelope � plenty of works have been published and we will not explain them here�We would like to mention here brie�y some terms that are especially relevant for describingtimbre �
� Brightness� Brightness is one of the main dimensions in the description of timbre �Grey����������and is important for judgments of similarity� It represents the centroid of thedistribution of spectral energy�
� Spectral Flux� This is another dimension in the description of timbre� but it is not wellde�ned� Spectral Flux stands for the synchrony of onset and �uctuations in time ofthe harmonics� There is� however� no commonly accepted method for calculating thisproperty�
� Harmonicity� This parameter distinguishes between �harmonic spectra� �e�g�� vowelsand most musical sounds�� inharmonic spectra �e�g�� metallic sounds�� and noise �spec�tra that vary randomly in frequency and time�� In other words� this feature representsthe degree of de�nability of pitch due to sound partials being integer multiples of thefundamental frequency� For various reasons� it has not been considered a dimension sofar�
� Attack quality and other features� Attack quality relates to the initial stage in sound�senvelope when the pitch is not well de�ned� and it represents the degree of noise presentat this stage� This and several other speci�c features that seem to distinguish particularinstruments from others� have been reported�
����� Previous Works on Apperiodicities in Periodic Sounds
Acoustical musical instruments� even chordophonic and aerophonic ones� which are consid�ered to produce a well de�ned pitch� even when they are unlimited in their duration� stillemit waveforms which are never precisely periodic� These aperiodicities supposedly originatein some fundamental mechanism of their sound production� This e�ect� which for time scalesshorter than � or � ms is beyond the control of the player�� is expected to be typical ofthe particular instrument or maybe of the instrument family�
Recently there has been growing interest in these phenomena due to recognition of theirimportance for the characterization of the timbre of sound� With the exception of somestudies on the periodic �uctuations of bowed string instruments� these aperiodicities have notbeen quantitatively characterized �McIntyre et al� �������� Signal models of sound usuallydescribe the behavior of slowly time varying partials or model the gross spectral envelopesof resonant chambers in musical instruments� thus neglecting the short time aperiodicities�From the psychoacoustic perspective� the in�uence of microscopic deviations in frequency and
�Vibrato and other expressive musical gestures have a longer time scale�

amplitude of the spectral components on the perception of sound has been investigated byseveral researchers �McAdams ��������Sandell ����������� It has been shown that randomfrequency deviations in�uence the perceived sound harmonicity and its coherence contributeto the sense of fusion segregation among partials� We discuss the psychoacoustic �ndingsfurther in section ������
There are two basic approaches to modeling microvariations� which are models of theaperiodicities� One is routed in chaos theory and attempts to model the microvariationsas fractal Brownian motion based on analysis of correlation or fractal dimension �Vettori������������ �Keefe ���������� We shall not discuss these models here but we would like tomention that fractal dimension is a non�linear statistic dependent on the source entropy� andas such it is expected to be sensitive to changes in the entropy of a signal caused by thepresence of polyspectral factors�
Another approach attempts to investigate the temporal changes in signal contents acrosssuccessive time frames� Two methods of analysis� one based on comparisons of cycle tocycle waveforms in the time domain� and another based on Fourier transforms of successivesonograms� were suggested by Schumacher ����������� The Fourier method results in a twodimensional plot� with one axis representing the short time spectral contents of the signaland the second axis revealing the low�frequency �subharmonic� �uctuations of the primarypower spectrum� It is interesting to note that this method is closely related to the cor�relogram representation of sound which was investigated in the context of pitch perceptionand auditory modeling �Slaney ����������� The correlogram represents sound as a threedimensional function of time� frequency and periodicity� The third dimension measures thecorrelations between spectral estimates in each time frame� with the time between successiveframes allowing for slow temporal changes in the signal� The two dimensional periodic�ity display �frequency vs� correlation� reveals short temporal events such as glottal pulsesand other short�term spectral periodicities� This method has not been applied directly tocharacterization of aperiodicities or other subtle properties of timbre�
We would like to point out that these methods look for sub�harmonic� structure in thesignal by considering �uctuations of the harmonics in the low frequency range� This signif�icantly di�ers from our polyspectral analysis method �and the frequency modulating jittermodel� presented later in the study�� since we emphasize the e�ect of �uctuations in thehigh harmonics� speci�cally dealing with statistical dependence independence between �uc�tuations� rather than sub�harmonic e�ects�
Other works which are concerned with the application of bispectral analysis to musicalsounds but have not been able to relate it to aperiodicities or microvariations in the soundcomponents will be presented in section ������
�This means frequencies that are usually lower than the fundamental frequency and are unrelated to themechanism of pitch production� These fall in the range from � Hz to approximately �� Hz�
�

��� Overview of the study
����� Goals
The most general goal of this work is the extension of research on timbre by introducing anew method �polyspectra or higher order statistics� and by extending the �eld of timbre phe�nomena to include border areas with texture� Moreover� the methods may have interestingimplications in a broader range of musical phenomena� too�
In more detail� the purpose of this work is to investigate acoustic phenomena that origi�nate in the micro�uctuations of the sound partials and contribute to the sense of perceivedtimbre of sound� Although the mechanism responsible for the micro�uctuations are physical�of course� we still lack an understanding which would allow us to use Physical Models for thedescription of this phenomenon� In the course of our presentation we shall use several signalmodels� such as the source��lter instrument model in chapter � and sinusoidal representa�tion of the source excitation� which is usually regarded as a spectral model� in section ����We shall extend these models to include acoustic properties that are not usually accountedfor in the traditional methods and provide a mathematical framework �by using higher or�der polyspectral signal processing methods� for their analysis� This point is important forunderstanding the contribution of the present study� and it will be explained in length inthe next section�
The issue of timbre analysis of musical signals is extremely complicated due to the mul�tiplicity of factors that compete in the perception of timbre� Various factors such as theformant structure� the waveform of the signal together with its spectral contents and manytemporal features� as mentioned in section ���� have been investigated in detail both in termsof the technical aspects and with respect to their perceptual �ISSM������� and musical im�portance �Slawson ���������� �Wessel �����������
Most of the modeling� analysis� parameter estimation and synthesis of sound is basedupon second order statistics or spectral information� This approach seems insu�cient forhandling the abovementioned types of acoustic phenomena� especially in the case of the veryhigh quality and subtlety required for music� As an example� residual signals from Autore�gressive estimation� or from Sinusoids and Noise models need better modeling techniques�These signals� which are closely related to the modeling of the excitation signal in instrumentmodels� and which contain much of the more subtle information about the structure of thesignal� are spectrally �uninteresting� �white�� The analysis of Higher Order Statistics �HOS�that we use� seems to be the natural next step for their description and it is certainly a �eldto be explored in priority�
�

����� Outline of the Work and Summary of Results
This work is divided into four main parts� The Introduction part contains a generalintroduction into The Musical Problem of Timbre and Sound Texture� followed bya more speci�c presentation of the applications of Higher Order Spectra for AcousticSignal Processing� After introducing the general musical framework of the timbre andtexture research� we provide a short overview of the mathematical preliminaries� with anemphasis on music and acoustic applications�
In section ��� we shall demonstrate the relevance of HOS analysis for acoustical purposes�We show that several acoustically meaningful bispectral measures could be devised� thatare sensitive to properties such as harmonicity and phase coherence among the harmonics�E�ects such as reverberation and chorusing are demonstrated to be detected clearly by theabove measures�
By using a source��lter model� with non�Gaussian modeling of the source� a maximumlikelihood parameter estimation scheme is developed in �� This scheme also allows us toconstruct an acoustic distortion function which is the generalization of the Itakuro�Saitodistance measure to include polyspectral information�
A better approximation of source excitation is achieved by sinusoidal modeling of thespectrally �at� pulse�train�like input signal� In section ��� we suggest a model with fre�quency modulating jitter �injected� into the frequencies of the harmonics� to simulate theirmicro�uctuations� In this part of the work we show that the presence of jitter is directlyrelated to the non�Gaussianity and non�linearity of the signal� Moreover� it is shown thathigher order statistics �HOS� are directly related to the number of coupled harmonics andthat this number could be analytically calculated by considering the average amount of har�monicity apparent among triplets and larger groups of partials in the signal� This e�ectivenumber of coupled harmonics serves us for the resynthesis of the �pulse train� signal� withthe desired polyspectral properties�
Finally� another important application of HOS is in the classi�cation of a broad range ofsounds� musical� natural and environmental �classi�ed by us as sound textures�� which areneeded by musicians and composers for applications in computer music� In chapter � weexamine the possibilities for application of our techniques to the classi�cation of man�madenoises and other complex sounds� We end this work by presenting an extension of the problemof texture and application of the main principles �such as concurrence non�concurrence� usedhere to describe micro phenomena to �macro� musical organization �chapter ��
To sum up the scienti�c contribution of the study� we might say that the main acheive�ments are in the following�
�� Addressing an important acoustical problem of microvariations within sound whosesigni�cance is only now being recognized�
�� Using a new mathematical analysis method which has not been applied yet to acoustical
��

processing and that puts the issue on analytical grounds�
�� Signi�cant results of the correspondance between HOS features and sound timbre prop�erties �such as classi�cation into instrument families� shows the applicability of themethod to real acoustical problems�
����� Musical Contribution
The implications of this work for other �elds of music research could be�
�� Probabilistic modeling of other musical parameters� In music many manifestationsof uncertainty appear with respect to various parameters on di�erent levels of themusical structure� so that the presence and quanti�cation of uncertainty may serve asan important parameter in the characterization of a musical style�
�� Extension of the term concurrence non�concurrence to deal with phenomena in thedomain of timbre� Concurrence non�concurrence is a very important variable thatcontributes to the characterization of the most basic variables for musical organization� similarity di�erence� salience non�salience� certainty uncertainty � and therefore tothe characterization of style�
�� Research of timbre�texture� texture�interval and texture�rhythm border areas� whichemphasize the momentary musical events and contribute to a static musical feeling�This border areas are of special importance in contemporary and non western mu�sic� Moreover� the relationship between static and dynamic in music is an importantcharacteristic of style�
�� Classi�cation of musical instruments and natural sounds�
�� Understanding of the musical signi�cance of the parameters of timbre� texture andborder areas�
The methods and tools developed here may allow for a better understanding and formaltreatment of the above musical problems�
��

Chapter �
Higher Order Spectra for Acoustic
Signal Processing
��� Multiple Correlations and Cumulants of Stochas�
tic Signals
How to extract information from a signal is a basic question in every branch of science�The lack of complete knowledge of the signal exists in many physical settings due to thenature of the observed signal or the type of measurement device� In information processingwe encounter the inverse problem � given the signal we want to extract information fromit in order to perform basic tasks such as detection and classi�cation� We presume thatany biological information processing system acts in a similar manner� For instance� ourears analyze the acoustic signal by extracting pitch and timbre information from it� Tounderstand our motivation to study higher order correlations it is worth recapitulating brie�ysome of the reasons for using the ordinary double correlation� A customary assumption isthat our ears perform spectral analysis of the incoming signal� Naturally� not all of thesignal information is retained in our ears� and the simplest assumption is that the phaseis neglected� It is well known that the amplitude of the Fourier spectrum is equivalent tothe Fourier transform of the signal�s autocorrelation� Double correlation in time domain isthe basic type of information extracted from the signal by our ears� This information hasthe meaning of the signal�s spectral envelope in the frequency domain� Now we intend towiden the scope of acoustical analysis by suggesting the use of triple� quadratic and highercorrelations� which are known also as polyspectra in the frequency domain� The kth�ordercorrelation� hk�i�� ��� ik��� of a signal fh�i�gNi�� is de�ned as
hk�i�� ��� ik��� �NXi��
h�i�h�i� i����h�i� ik��� �����
��

and in the frequency domain it corresponds to the kth�order spectrum
Hk���� ��� �k��� �NX
i�����ik����N
hk�i�� ��� ik��� � e�j��i�����j�k��ik��
� H���� � � �H��k��� �H���� � � � �� �k��� �����
Under some common assumptions� the time domain correlation converges to the kth�ordermoment of the process� The kth�order cumulant is derived from the kth and lower ordermoments� and contains the same information about the process� We prefer to use cumulantsin our de�nition of spectra since for Gaussian processes all higher then second cumulantsvanish� For zero mean sequences� the second and third order moments and cumulants coin�cide� Thus we arrive at an equivalent de�nition of the kth�order spectrum as the �k � ���DFourier transform of the respective kth�order cumulant of the process �
����� Elements System Theory
Let y�i� be the output of an FIR system h�i�� which is excited by an input x�i�� i�e�
y�i� �NXj��
h�j�x�i� j� �����
Using the de�nition ��� it is easy to show that
yk�i�� ��� ik��� �NX
j������jk����N
hk�j�� ���� jk��� � xk�i� � j�� ���� ik��� jk��� �����
where yk� hk� xk are de�ned as in ���� Further� employing ��� and ��� we arrive at thefrequency domain relations
Yk���� ��� �k��� � Hk���� ��� �k���Xk���� ��� �k��� �����
An important property of the polyspectra is that if we are given two signals f and g thatoriginate in stochastically independent processes and their sum signal z � f � g� then
Zk���� ��� �k��� � Fk���� ��� �k��� �Gk���� ��� �k��� �����
This property is important when considering the perception of simultaneously soundingindependent signals� as will be discussed later�
��

��� Properties of Bispectrum of Musical Signals
One of the main objectives of research on musical timbre is to identify physical factorsthat concern our perception of musical sounds� Several such factors have been alreadydiscovered by various researchers and some of them� such as spectral envelope� formants�time envelope� etc�� are generally accepted as the standard features for describing musicalsounds �Grey ���������� �McAdams � Bregman �������� �McAdams �������� �Sandell����������� �Kendall � Carterette ����������
Below we focus on two more subtle factors� namely harmonicity and the time coherenceamong the partials� which appear in the mathematical de�nitions of the bispectrum andits related bicoherence index� We believe that these properties are the ones that makebispectrum acoustically interesting and signi�cant� The manner in which they combine toin�uence higher acoustical musical phenomena will be the topic of the next section�
The harmonicity and time coherence factors are not independent factors� however� Psy�choacoustics research has pointed out several auditory cues central to the perception ofspectral blend� It has been shown that harmonicity of the frequency content and coherencebetween the spectral elements are the major factors in�uencing spectral blend �McAdams����� ����
����� Harmonicity Sensitivity
The �harmonicity measure� concerns the degree of existence of integral ratios among theharmonics of the tone �Sandell ����� ������ Various experiments conducted by psychoacous�ticians indicate that processing of harmonicity as a spectral pattern is a central auditoryprocess� Harmonic tones fuse more readily than inharmonic tones under similar conditionsand the degree to which inharmonic tones do fuse is partially dependent on their spectralcontent� Physical acoustics teaches us also that the presence of harmonicity makes possiblethe establishment of e�ective regimes of oscillation which are important for the productionof stable� centered tones �Dudley � Strong� ����� �Benade ��������� In general� musical in�struments do not have a single constant set of harmonics ratios throughout the duration of atone� Thus� the characterization of the degree of harmonicity concerns some overall averagebehavior of these ratios�
One possible characterization of the harmonicity measure is obtained by means of bispec�tral analysis of the sound� Presence of a strong bispectral ingredient indicates the existenceof a harmonically related triplet of frequencies in the signal spectrum H����� ��� �k��� �H���� � H���� � H���� � ���� as directly follows from the de�nitions� Integrating over thebispectral plane gives a single number that represents the harmonicity measure � In caseof a stationary signal� the excitation pattern in the bispectral plane remains constant� Inreality the signals are time evolving and the bispectral signature changes with time� so thatthe above measure gives the instantaneous harmonicity averaged over the time interval cho�
��

sen for the bispectral analyzer� Averaging again over the whole time span of the signal�sexistence would result in a single time independent number characteristic of the harmonicitymeasure of the musical tone�
Naturally� the signal must be normalized in time� frequency and amplitude prior to ap�plication of the bispectral analysis� The above procedure in additionally to its advantages insimplicity of application� puts the above question in a rigorous signal processing framework�
����� Phase Coherence
The coherence of the spectral contents of the signal has been studied with respect to thein�uence of frequency and amplitude modulation on tone perception� All natural� sustained�vibration sounds contain small�bandwidth random �uctuations in the frequencies of theircomponents� Several experimental results demonstrate the importance of frequency modu�lation coherence for perceptual fusion� McAdams ����� explained these results on the basisof an assumption about the existence of mechanisms in our ear system that respond to aregular and coordinated pattern of activity distributed over various cells in the system� Inour presentation we suggest yet another lower level mechanism that might be responsible forthis phenomenon�
The e�ect of frequency modulation coherence is best illustrated by an example adoptedfrom Nikias � Raghuveer ���������� Consider two processes
x�n� � cos���n� ��� � cos���n� ��� � cos���n � ��� �����
andy�n� � cos���n � ��� � cos���n� ��� � cos���n� ��� � ���� ����
where �� � �� � � �� � �� � ���� i�e� harmonically related triple� and ��� ��� �� areindependent random phases uniformly distributed between �� ���� It is apparent that in the�rst signal x�n�� the �� is an independent harmonic component because �� is an independentrandom�phase variable� On the other hand �� in y�n� is a result of phase coupling between�� and ��� One can verify that x�n� and y�n� have identical power spectra consisting ofimpulses at ��� �� and ��� However� the bispectrum of x�n� is zero whereas the bispectrumof y�n� shows an impulse at ��� � ��� �� � ���� One might notice that the case presentedabove corresponds to a phenomenon of the so�called quadratic phase coupling� which wouldbe due to quadratic non�linearities in the process� The resulting non�zero bispectrum doesnot depend on this particular mechanism� though� and it will hold for any case of statisticaldependence between the phases� An example of such an e�ect will be demonstrated insucceeding sections�
��

��� Signi�cance for Musical Raw�Material
����� Timbre versus Interval
In the most general manner we can contrast timbre to the parameter of the musical intervalwith all its derivatives� scales� rules of harmony �the chords include also a timbral qual�ity�� etc� In contrast to the interval� the de�nition of timbre is very complex� needs manydimensions for characterization� and is not suitable for a simple arrangement on a scale orother clear and complex hierarchical organization �Lerdahl ��������� Also� in contrast tothe interval which is a learned quality� timbre is loaded to a large extent with sensations fromthe extra�musical world� Furthermore� timbre takes longer time to be percieved� and onecannot precisely remember many rapid timbral changes� In contrast to the interval� whosemain meaning is derived from various contexts� timbre is perceived as a single event evenon the most immediate level� In its broad sense� timbre will encompass musical acousticalproperties of the register of pitch� intensity� aspects of articulation �various degrees of stac�cato and legato�� vibrato and other microtonal �uctuations� spatialization of sound sources�various kinds of texture� chorusing� etc� However� this extension is a priori limited so as toexclude tonal and rhythmic schemes� contrary to the liberal view of Cogan ����� ���� whoincluded them as aspects of timbre� too�
Artistically� the timbre might ful�ll several roles� such as incorporating extra�musical as�sociations� focusing attention on momentary occurrences� supporting or blurring the musicalstructure that is otherwise de�ned by the tonal and rhythmic systems by being in concur�rence or non�concurrence with the other musical parameters� and serving as the main subjectof the composition� Its role in the composition may be a crucial factor in characterizing thestyle and the stylistic ideal� Regarding musical timbre as one of the components of themusical raw material� we concentrate� as mentioned above� on a few speci�c aspects� In theprevious sections we discussed the �micro� level� i�e� the notion of bispectrum and someof the related acoustic features� Here we would like to present several higher�level� �musi�cally signi�cant� acoustic phenomena� We will try to show that these phenomena e�ectivelyin�uence the bispectral contents of the signal� and thus might be explained on this basis�
����� Related Works on Bispectral Analysis of Musical Sounds
The manifestation of the various timbres is most prominent in musical instruments �and inphonemes of speech with which we are not dealing here�� Musical instruments are involvedin shaping the musical style �Sachs ���������� �Geiringer �������� for three main reasons�
�� The system of pitches and intervals which may be produced by the instrument�
�� The timbre of a single note� The timbres of various instruments may support oremphasize the structure of the work� which is based in principle on pitch organization�
��

blur the structure� or serve as an essential parameter for the structure�
�� The possibility of changing the properties of single notes and combinations thereofduring performance�
In the west many e�orts were made to neutralize the �rst factor� Musical instruments inthe west re�ect an optimal selection of timbre types which can be categorized� Thus� inthe present study we have chosen to focus �rst on the contribution of the bispectrum tothe characterization of instrumental timbres� Analysis of instrumental timbres based on theknown aspects has received plenty of attention and we shall not mention these researcheshere�
With regards to the bispectrum� the �rst attempts to use bispectral considerations forsound quality characterization can be traced to Michael Gerzon ������������ to whom we arealso indebted for many of the following ideas� The power spectrum� which is generally usedfor sound characterization� being �phase�blind�� cannot reveal the relative phases betweenthe sound components� Although the human ear is almost deaf to the phase di�erences� theear can perceive time�varying phase di�erences� The bispectral analyzer is the generalizationof the power spectrum to the third order statistics of the signal� The bispectrum reveals boththe mutual amplitude and phase relation between the frequency components ��� ��� If soundsources are stochastically independent� their bispectra will be the sum of their individual bis�pectra� In order for a bispectral analyzer to be able to recognize the characteristic signatureof the sound in the bispectral plane� the excitation of a given ��� �� should be distinguishablefrom the background noise� Thus� a �good� instrument is supposed to produce the maxi�mum bispectral excitation possible for a given signal energy� Stating the problem as �can wepredict the properties of a Stradivarius�� Gerzon claimed that the design requirement fora musical instrument is that �they should have a third formant frequency region containingthe sum of the �rst two formant frequencies�� Surprisingly enough� this theoretical criterionseems to be satis�ed by many orchestral instruments� For example� speci�c cases of theStradivarius violin ���� Hz� ��� Hz� �� Hz�� Contrabassoon ���� Hz� ��� Hz� �� Hz� andCor Anglais ��� Hz� ��� Hz� �� Hz�� In a later work� Lohman and Wirnitzer ���������analyzed two �utes by calculating their bispectra� Their results demonstrate that a higherintensity of the phase of the complex bispectra is achieved for a good�quality �ute� This alsosuggests that the intelligibility of speech could be determined by looking at the bispectralsignature and might be even enhanced by adding an arti�cial third formant to the sum ofthe momentary two lowest formant frequencies� Such a device can easily be constructed bymeans of a quadratic �lter or other non�linear speech clipping system� One must note thatsuch a simple device will modify the spectrum� too� which might be undesirable�
����� Tone Separation and Timbral Fusion�Segregation
Among the various questions dealing with the timbral characteristics of sounds� the problemof simultaneous timbres �McAdams � Bregman �������� �McAdams ������� is basic to
�

musical practice itself� manifestating itself in daily orchestration practice� choice of instru�ments and the ability to perceive and discriminate individual instruments in a full orchestralsound� Originally treated semi�empirically by the orchestration manuals� vague criteria forevaluating orchestral choices were presented� In recent times more quantitative acousticalstudies point out several features in the temporal and spectral behavior of the sounds whichare pertinent for instrument recognition and modeling spectral blend �Sandell �����������We suggest realizing the power of polyspectral techniques for the analysis of spectral blend�
McAdams ����� reported about several experimental results that support the notion thatfrequency modulation coherence contributes to perceptual fusion� He explained his results onthe basis of an assumption about the existence of mechanisms in our ear system that respondto a regular and coordinated pattern of activity distributed over various frequency sensitivecells� Several recent works have suggested analyzing sounds of polyphonic music by tracking�uctuations in pitch and amplitude in order to separate the spectrum of a multivoice signalinto classes of partials united by a common law of motion �Tanguiane ����������� Now thatwe have at our disposal such a powerful tool for detecting coherence between the spectralcomponents of a signal� we claim that the ear performs grouping of the various spectralcomponents present in the sound by relating strong bispectral peaks to a single source�In the following example we demonstrate the above phenomena on a very simple signalconstructed of three harmonics at �� � and � Hz� In both signals there are randomchanges in the frequency of the harmonics� but whereas in the �rst signal these changes areindependent� in the second signal there is concurrence among the various harmonics withrespect to their instantaneous direction of change� Technically� these signals are similar tothe ones described in equations ����� and ���� in section ������ Each of the three harmonicsin both signals was frequency modulated with a random jitter� The spectrum of the jitterwas such that most of its energy was centered around � Hz� In the �rst signal independentjitters were applied to each harmonic �Fig� ����top�� while the second one used the samejitter function� In the second signal the frequency modulation� too� was such that the amountof deviation was proportional to the frequency of the harmonic �Fig� ����bottom��
Thus what we have here is almost identical spectral content with a slight random temporalvariation between the signal whose sole characteristic is statistical dependence independenceamong the frequency deviations� Audition to the two signals reveals two components inthe all random signal� while the coherent phases signal sounds like a single source� Thisclearly non linear e�ect is easily detected in the bispectral plane� Fig� ��� demonstrates therespective bispectra of the two signals� The bispectral peaks are at �����Hz �the half peakon the diagonal� and at �����Hz as expected� � It is possible thus that a spectral blendis actually a blend of bispectral patterns where harmonics with strong bispectral componentsfuse together to form a single sound� To conclude this discussion we should mention thatthis bispectral mechanism is one of many that in�uence tone color separation blending�
�Due to symmetries of the bispectrum it su�ces to display only one of the eight symmetry regions thatexist in the bispectral plane�
��

Figure ���� Top� Spectrogram of a signal with independent random jitters of the harmonics�Bottom� Spectrogram of a signal with the same random jitters applied to modulate all threeharmonics� One can see the similar instantaneous frequency deviations of all harmonics�
����� E�ects of Reverberation and Chorusing
Other� more subtle problems of intelligibility can be considered by looking at the e�ects ofreverberation and chorusing� As it is an important musical issue� we note� quoting Erickson����� that �there is nothing new about multiplicity and the choric e�ect� What is newis the radical extension of the massing idea in contemporary music� and the range of itsmusical applications� but a great deal more needs to be known before the choric e�ectis fully understood or adequately synthesized�� As mentioned previously� if the soundsare stochastically independent� then their bispectra will simply be the sum of the separatebispectra� Assume a sound source with energies S�� S�� S� at frequencies ��� ��� �� � �����
and bispectrum levelB at ���� ��� subject to reverberation e�ect� Now let us assume that thise�ect can be modeled as a linear �lter acting as a reverberator added to the direct sound�Suppose that the e�ect of the reverberation is only to produce a proportionate spectrumenergy kS�� kS�� kS� at ��� ��� ��� A plausible model for the linear �lter describing thereverberator part alone could be an approximation of its impulse response by a long sampleof a random Gaussian process� According to Eq� ���� the bispectral response of such a �lteris zero� which results in a zero bispectrum of the output signal� The total resultant signalcontains a �stochastically independent� mixture of the direct and the reverberant sound� Thespectral energy of the combined sound at ��� ��� �� will be �� � k�S�� �� � k�S�� �� � k�S�
at ��� ��� �� and bispectrum level B at ��� ��� Naturally� the proportion of the bispectralenergy to the spectral energy of the signal deteriorated� For a signal with complex spectrumH���� the power spectrum equals S��� �j H��� j� and the bispectrum is B���� ��� �
�

500 1000 15002000 2500 3000 3500
500
1000
1500
050000
100000150000200000250000300000350000400000
500 1000 15002000 2500 3000 3500
500
1000
1500
050000
100000150000200000250000300000350000400000
Figure ���� Random jitter applied to modulate the frequency of the harmonics� When eachharmonic deviates independently� the bispectrum vanishes �left�� while coherent variationamong all three harmonic causes high bispectrum �right�� The bispectral analysis was doneover a �� sec� segment of the signal with �� msec� frames� The sampling rate was KHz�
H����H����H���� � ���� Taking a bicoherence index
b���� ��� �B���� ���
�S����S����S���� � ������������
we arrive at a dimensionless measure of the proportionate energy between the spectrumand the bispectrum of a signal� If b � bin for the original signal� then after reverberationbout � ���k�����bin� Thus for a reverberation energy gain k� the relative bispectral level hasbeen reduced by a factor of �� � k����� �Gerzon ������ Now consider a very similar e�ectof chorusing� For N identical but stochastically independent sound sources the resultantspectral energies at ���� ��� �� � �� � ��� are �NS�� NS�� NS�� and the resulting bispectraare NB at ���� ���� Comparing again the bicoherence indexes we arrive at bout � N����bingiving a relative attenuation of N���� due to this chorus e�ect� It is worth mentioning onceagain the importance of stochastic independence� The chorusing as described above might beconfused with a simple multiplication of the original signal energy by a gain factor N� Such again is not stochastically independent and the resulting bispectrum would be augmented byN��� instead of N � Only a true lack of coherence between the replicated signals will causethe resulting bispectra to be actually NB�
����� Experimental Results
In order to demonstrate the above e�ects� we have performed an analysis of various soundexamples� The �rst example is a pair of sampled signals of solo instrument �Solo Viola� and ofan orchestral section of the same instruments �Arco Violas�� �The signals were recorded froma sample�player synthesizer and are believed to be true recordings of the above instruments��
��

The signals have very similar spectral characteristics and the �chorusing� feature� dominantlypresent in the �Arco Violas� signal� cannot be extracted from the spectral information alone�Nevertheless� it has its manifestation in the signal�s bispectral contents� We plotted theamplitude in the bicoherence index for each of the two signals� As we can clearly see fromFig� ���� there is a signi�cant reduction of the bispectral amplitude for the �ArcoViolas�signal� Note also that the bispectral excitation pattern is di�erent for the two signals� withthe �SoloViola� signal having few clear peaks while the �ArcoViolas� has a much morespread�out and noisy pattern�
50100 0
1020
3040
5060
00.050.1
0.150.2
0.25
50100 0
1020
3040
5060
00.050.1
0.150.2
0.25
Figure ���� Bicoherence index amplitude of Solo Viola and Arco Violas signals� The x�y axesare normalized to the Nyquist frequency � KHz��
The second pair of examples was taken from a CD recording of two performances of theopera �Don Carlos� by Verdi� In one performance a cello passage was played by a singleinstrument �Solo�� while in the other it was performed by a section of celli �Tutti��
50100 0
1020
3040
5060
00.010.020.030.040.05
50100 0
1020
3040
5060
00.010.020.030.040.05
Figure ���� Bicoherence index amplitude of Solo Cello and Tutti Celli signals� The indiceswere calculated with �� msec� frames� averaged over a � sec� segment� with order FFTtransform� In order to reveal the high amplitude bispectral constituents both indices werecalculated with the spectra denominator thresholded at � db�
The last example is taken from a soprano duet versus a women�s choir�
��

50100 0
1020
3040
5060
0
0.05
0.1
0.15
50100 0
1020
3040
5060
0
0.05
0.1
0.15
Figure ���� Bicoherence of duet soprano singers versus women choir calculated with �� msec�frames over a �� sec� segment� The indices were thresholded to include approximately justthe �rst two formants�
Before concluding this section� we must remark on an important di�erence between thevoice and string signals above� According to our physical motivation� the resonator��lterremains constant over the duration of the signal� On the other hand� auditory experiencetells us that e�ects such as chorusing are better perceived at the changing portion of sounds�such as short note passages and attacks� Although this might seem surprising� there is nocontradiction between the two� since in our formalism we do not actually require signalstationarity� but only �lter constancy� Such an assumption is acceptable for all soundsproduced by a string instrument� but is only locally applicable to the human voice� Thus�the cello results above were obtained by averaging over �the same� musical passages� whilethe human voice examples were sampled from short� constant� vowel singing portions�
����� Example synthetic allpass �lter
As seen from Eq� ����� in section ���� the bispectra of the output signal y�i� resulting frompassing a signal x�i� through a linear �lter h�i� equal the product of their respective bispec�tra� An equivalent relationship holds for the linear random process� i�e� when the outputsignal results from passing a stationary random signal through a deterministic linear �lter�Consider now a device whose impulse response resembles a long segment of a Gaussian pro�cess� Although the �lter might be deterministic overall� it could be considered a randomsignal for all practical purposes� Applying� for instance� a bispectral analyzer of �nal tempo�ral aperture to such an impulse response� would average its bispectral contents to zero� givingus a �lter with zero bispectral characteristics� Naturally� the output signal resulting frompassing a deterministic signal through such a �lter will have a zero bispectrum� Since theimpulse response resembles a white noise signal� its spectral characteristics are �at� givingus an all�pass �lter� Also� by properly scaling the impulse response we can assure that the�lter gain equals ��The following �gure describes the result of passing the original �Solo Viola� signal througha linear �lter whose impulse response was created by taking a �� sec� sample of a Gaussianprocess� The bispectral analysis of the signal was performed by averaging over �� framesof �� msec� each� The subjective auditory result seems to resemble a reverberation device�
��

Fig� ��� shows the bicoherence index of the signal after �ltering�
50100 0
1020
3040
5060
00.050.1
0.150.2
0.25
Figure ���� Bicoherence index amplitude of the output signal resulting from passing the�Solo Viola� signal through a Gaussian� �� sec� long �lter
��

Part II
The Acoustic Model
��

Chapter �
AR Modeling and Maximum
Likelihood Analysis
Assuming a linear �lter model driven by zero mean WNG noise� we represent the signal asa real pth order process y�n� described by
w�n� � y�n��pX
i��
hiy�n� i� �����
where w�n� are i�i�d� The innovation �excitation� signals w have an unknown probabilitydistribution function �pdf�� with non�zero higher order cumulants� We shall assume a pdf ofan exponential type
P �w� � exp���Xi��
�iwi� � exp���� �
�Xi��
�iwi� �����
where the parameters �i� i � ������� are the parameters of the distribution and
exp���� � Z�������� �Z
exp���X
i��
�iwi�dw �����
is the normalization integral�
The particular choice of an exponential form pdf can be justi�ed in various ways� such asthe Maximum Entropy �ME� principle����� The unknown moments of the innovation canbe estimated from the higher order statistics of the signal y�n�� Under constrains of thesemoments� the exponential type pdf is obtained as the ME solution�
Given the measurements Y � fy�� ��� yNg� the probability of observing this set of samples�given the model �the noise pdf parameters and the AR coe�cientsH � f��� ��� ��� �� h�� ��� hpg�can be written� The average �over all samples� log�likelihood� restricted to the �rst three
��

terms� is then
� lnP �Y j H� �� �N lnZ���� �����
� N��
pXi��
pXj��
R��i� j�aiaj
� N��
pXk��
pXl��
pXm��
R��k � l� k �m�akalam
� �N lnZ �N��
Z �
��
d�
��Sy��� j A��� j
�
� N��
Z �
��
Z �
��
d��d��
�����By���� ��� �
�A����A����A���� � ��� �����
with a� � �� ai � �hi� i � ���p� and A�z� denoting the polynomial a� � a�z � ��� apzp� and
Rk�i� j� ��� l� the k�th order moments tensor of the measurements Y �with R� � �� Sy���and By���� ��� denote the power spectrum and bispectrum of the signal� respectively�
��� Source and Filter Parameters Estimation
If we are given only partial information concerning the source� the remaining parts of themodel must be estimated� If� for instance� we know the linear �lter coe�cients hi� but thenoise source statistics are unknown� the average log�likelihood becomes�
hlnP �Y j H�i � �N�lnZ � ��� � ���� �����
where we have assume that the actual noise moments areDwiE� i� hwi � � � �����
and use the fact that polyspectra of a linear system are provided by
Sy��� � � j H��� j�
By���� ��� � �H����H����H���� � ��� � �����
with H�z� � �A�z��
Estimation of the ��s is accomplished by maximizing the log�likelihood� namely
�
N
NXn��
�y�n��pX
j��
hjy�n� j��k � �� lnZ��k
�DwkE� ����
��

or in homogeneous form as
�� lnZ
���� � � �����
pXi��
pXj��
R��i� j�aiaj �Dw�E� �
pXi��
pXj��
pXk��
R��i� j� i� k�aiajak �Dw�E� �
and similar higher order terms if necessary� In this manner we can estimate the excitationmoments �s using the �lter parameters and the correlation functions of the signal y�n��These moments determine the probability density function of the noise through their uniquecorrespondence to the parameters �i�
Alternatively� we assume that the �lter parameters are unknown� The estimation of theseparameters is performed similarly by maximizing the log�likelihood expression with respectto the ai�s� yielding the p �i � ���p� equations
� �Pp
j�� ��R��i� j�aj
� � �Pp
j��
Ppk�� ��R��i� j� i� k�ajak � � �����
Notice that the above estimation procedure does not imply the stability of the estimated�lter� similar to other parametric methods of higher order spectral estimation��������� Thisissue can be addressed directly using alternative �lter representations which explicitly guar�antee the stability �e�g� lpc parameters�� but it is beyond our scope here�
��� Relations to Other Spectral Estimation Methods
Two important special cases can now be easily derived from our general estimation scheme�In the case of white Gaussian input� the log�likelihood expression reduces to the sum ofthe �rst two terms in equation ������ Adequately� only the �rst of the two equations in����� remains� and the �lter parameters estimation equation ����� becomes equivalent tothe standard minimumvariance spectral estimation equations� Writing the equations for theGaussian case explicitly gives
i � ���ppX
j��
R��i� j�aj � ������
pXi��
pXj��
R��i� j�aiaj �Dw�E� ������
the last giving the gain factor equation for spectral matching�
�

An interesting derivation of the bispectral method for �lter parameters estimation� whichwas suggested by Raghuver and Nikias ����� can be derived on a similar basis� Neglectingthe Gaussian part in this case� we rewrite equation ����� as
i � ���ppX
j��
pXk��
R��i� j� i� k�ajak � � ������
which can be rewritten also as
i � ���ppX
j��
�R���i��j� �pX
k��
R��i� j� i� k�ak�aj � � ������
The bracketed part can be written as
j � ��p� i � ���p R���i��j� �pX
k��
R��i� j� i� k�ak � � ������
If we include the bispectral equation in ����� we arrive at
pXk��
R��i� i�ai �Dw�E� ������
which is obtained by taking j � � k � in the original equation� Combining both equationsgives the original Raghuver and Nikias equations
j � ��p� i � ��p R���i��j� �pX
k��
R��i� j� i� k�ak �Dw�E��i� j� � ������
����� Discussion
The log�likelihood expression ����� contains both second and higher order information� com�bined in a uni�ed framework� It requires both an estimation of higher order correlations andthe solution of a complex non�linear system of equations� Several comments are in order�
�� Although the non�linear system of equations has no analytic solution� standard nu�merical techniques could be applied� The drawback of such an analysis is that thestability of the estimated linear �lter is not automatically guaranteed� This problemwas already present in the cumulant based spectral estimation method �����
�� In our approach we apply the maximum entropy formalism to infer the source distri�bution from its moments� For the existence of a maximum entropy solution to themoments problem� the magnitudes of the moments can not be arbitrary ���� Weassume that whenever a solution is obtained these constraints are satis�ed�
��

�� One could suggest estimating the parameters by iterative applications of equations������ ������ Such a method requires estimating the �s from the estimated ��s obtainedin each step� Equations ������ ����� were derived under the assumption of exponential�maximum entropy� pdf of the innovation w and are obeyed at the extrema of thelog�likelihood only� Care must be taken during the iteration process not to violate theabove moments conditions for the existence of the maximum entropy form� One waywhich seems to work is to estimate all the parameters simultaneously�
�� The correlation functions� Ri� i � ����� must be estimated from the samples of theprocess� It has been shown that the conventional estimates are asymptotically unbiasedand consistent� but are generally of high variance� Thus a large number of records isrequired to obtain smooth estimates� Poor estimates might con�ict with condition ���above as well�
In the derivation of the standard estimation methods above� we notice that the cumulantbased method provides a way to estimate ai�s� using third order statistical information only�similar to the way that the power spectral methods rely solely upon second order statistics�There is no principled criterion for the choice among the two methods� Comparative exper�iments with both methods for noisy speech recognition show that the bispectral estimationmethod gives better results in low signal to noise ratio� for Gaussian noise���� � We claimhere that equation ����� provides a statistically consistent approach to the various orderspectral estimation methods� The advantage in using the second order method� apart fromthe e�cient and stability of the solution� is the fact that we can easily estimate the innova�tion pdf parameters from the observed second moments� For Gaussian zero mean randomvariable x� the second moment �variance� is given by
� �Dx�E�
�
Z
Ze���x
�
dx �����
which gives the simple relationship between the only Lagrange multiplier and the moment�� � �
���� No such simple relationship holds for non�Gaussian pdf�s and in general all
moments depend on all Lagrange multipliers�
��� Simulation Results
In our simulations we applied standard conjugate�gradient optimization techniques in orderto obtain a solution to the likelihood equations� To assure the normalizability of the re�sulting innovation pdf we have extended the log�likelihood to include a fourth order termas well� We initialized the algorithm by �rst solving the second order �spectral� part� esti�mating the initial �lter coe�cients ai� and then optimizing over ��� yielding a starting pointf�� a�� ��� ap� ��� �� � � �� � g� The solution was obtained by simultaneously maximizingthe likelihood function with respect to all free parameters�
�

Here we demonstrate the results of maximizing the log�likelihood function for the signal ob�tained from a CD recording of an aria sang by a female soprano �Figure ����� The analyzedsignal has a �xed pitch single vowel singing segment�
-15
-10
-5
0
5
10
15
20
25
30
35
0 0.05 0.1 0.15 0.2 0.25 0.3 0.35 0.4 0.45 0.5-15
-10
-5
0
5
10
15
0 0.05 0.1 0.15 0.2 0.25 0.3 0.35 0.4 0.45 0.5
Figure ���� Correlation �left� versus cumulant based �right� �lter estimates�
The estimated ��s are � f�� � ������� �� � �������� �� � ������� �� � �����gThe estimated pdf can be seen in �gure ���� with the Gaussian distribution plotted forreference� and the correct �� � �������� derived by gain matching�
0
0.1
0.2
0.3
0.4
0.5
0.6
0.7
0.8
0.9
1
-2 -1.5 -1 -0.5 0 0.5 1 1.5 2
Figure ���� Probability distribution function of the non�gaussian input� plotted against theoriginal Gaussian estimate�
A note of caution� The maximum entropy method is known to be anomalous for thethree moment constraints� in the sense that almost any value for the third moment can beobtained by taking a normal distribution with a small �wiggle� at an arbitrary distant point���� Such a construction leaves the even moments almost unchanged with the largest a�ectbeing on the third moment� It might be observed during our process of optimization� thata gradual distortion of the original Gaussian suddenly switches to a solution of a mixtureof a Gaussian and a distant �wiggle� as �� grows� This phenomenon occurs for signals withlarge third order correlations and is controlled in our procedure by the inclusion of the fourthorder terms�
��

Chapter �
Acoustic Distortion Measures
��� Statistical Distortion Measure
The main motivation behind the ideas that we are about to present� from now until theend of the chapter� concerns the construction of functions for signal comparison� The so�called distortion measures give an assessment of the �similarity� between two signals� whichis a basic characteristic needed for signal separation and evaluation� Such a separationprocedure could be derived on various grounds� and here we chose to adopt tools frominformation theory which treat signals as stochastic models and give a probabilistic measureof separation between models� By constructing a statistical model we turn the problemof measuring distances between signals into a question of evaluating a statistical similaritybetween their model distributions� Before proceeding to talk about the construction ofdistortion function� some words about the models are in place�
As the �rst step we have chosen a very crude model that treats the power�spectral and thebispectral amplitude planes as one and two dimensional probability distribution functionsrespectively� The acoustic separation based on this model is the subject of this section� Inthe next section we shall construct a better acoustical model with a clear underlying physicalmotivation� This model will serve us for constructing an acoustic distortion measure whichcombines both the spectral and bispectral parts in a uni�ed� systematic manner�
As mentioned above� in the following analysis we treat the power�spectral and the bispec�tral amplitude planes as probability functions� We assume that the power�spectral amplitudeof each frequency in the spectrum can be viewed as an indication of how likely is it to iden�tify a spectral component at a particular frequency within the whole spectrum� Similarly�the bispectral amplitude distribution indicates the likelihood of having a pair of frequen�cies whose mutual occurrence probability is proportional to the bispectral amplitude of thesignal� In other words� the spectral model assumes that the signal is constructed by a collec�tion of independent oscillators� distributed in accordance with the spectrum� The bispectral
��

model assumes pairwise dependent oscillators� with their respective probabilities given bythe bispectral amplitude�
Let us turn now to the distortion measure itself� The idea of looking at signals asstochastic processes and replacing the signal by its stochastic model is a very powerful one�When we receive a new signal� the model enables us to judge how probable the observedsample is within the chosen model� Low probability would mean that the new sound is �far�from the model� Soundwise� distortion measure says how probable it would be for a Flutesound to have been created by a Clarinet source� It is important to note that this �is nota symmetric quantity� i�e� it is not the same as the probability of having a Clarinet soundplayed by a Flute�
Calculation of the distortion between signals is achieved by means of the Kullback�Liebler�KL� divergence �Kullback ���� ���� which measures the distortion between their associatedprobability distributions� Denoting by P �Y � and Q�Y � the probabilities of having the signalY � fy�� ��� yNg appear in models P and Q� respectively� the probability of a sample generatedby P to be considered as a sample from Q satis�es
Q�Y � � e�ND�P jjQ �����
where D�P jjQ� is the KL divergence between the two pdf�s and N is the sample size� Asexplained above� we construct a model for each of the signals that coincides with our �mea�surements� of the spectrum and the bispectrum of the signal� Statistically this means thatwe look at a probability distribution that has the same �rst� second and third order statis�tics as those of the signal under consideration� Calculation of the KL divergence betweenthe models is accomplished by calculating the average of the loglikelihood ratio of the twomodels with respect to the probability distribution of one of the signals chosen to be thereference signal�
D�P jjP �� �
�ln
P �Y �
P ��Y �
�P
�����
The distortion in �spectral sense� is achieved by calculating
DS �S�� S�� �Z �
��S���� ln
S����
S����d� �����
and in �bispectral sense� by
DB�B�� B�� �Z �
��
Z �
��B����� ��� ln
B����� ���
B����� ���d��d�� �����
with the spectra and bispectra normalized amplitudes so as to have a total energy equal toone�
��

��� Acoustic Clustering Using Bispectral Amplitude
The comparative distance analysis was performed on nine instruments obtained from asample�player synthesizer� The analysis took account only of the steady state portion ofthe sound� thus ignoring all information in the attack portion of the tone onset� All soundswere one pitch �middle C�� the same duration and approximately the same amplitude� Theseresults are summarized in the following tables� with the rows standing for the �rst� and thecolumns for the second argument of the distortion function�
Spectral distances matrix
Cello Vla Vln Trbn Trmp FH Cl Ob Fl
Cello �� ��� �� ��� �� ��� �� ���Vla � ��� ��� ��� ��� �� ��� ���Vln ��� ��� �� ��� ��� ��� ��� ���Trbn ��� ��� �� ��� ��� ��� �� ���Trmp ��� �� ��� ��� ��� ��� �� ����FH �� �� ��� �� ��� ��� �� ���Cl ��� ��� ��� �� �� �� ��� ���Ob ��� ��� ��� �� �� ��� �� ����Fl ��� ��� ��� ���� ���� ��� ��� ���
Bispectral distances matrix
Cello Vla Vln Trbn Trmp FH Cl Ob Fl
Cello ��� �� ��� ���� � ���� ��� ��Vla ��� �� ���� ���� �� ��� ��� ����Vln �� �� ��� ���� �� ��� ��� ����Trbn ���� ��� ��� ��� ���� ���� �� ���Trmp ���� ���� ��� ��� ��� ���� �� ����FH �� ��� ��� ��� ���� ���� ��� ���Cl ��� �� ���� ��� ��� ��� ���� ��Ob ���� ��� �� ���� ��� ��� ��� ����Fl ��� ��� ��� ��� ���� ��� ���� ���
In general� the categorization of musical instruments into similar�sounding groups is per�formed by both methods in a manner reminiscent of the common orchestration practice�A more detailed analysis shows a clear di�erentiation into several groups� fCello Viola
��

French Horng with a related� but a more distant Violin� a group of fTrombone Trum�pet Oboeg� with the Clarinet and especially the Flute remaining relatively detachedfrom all the rest� One could also separate the groups with respect to their distance from theFlute� which is larger for the second group and smaller for the �rst one�
It is important to note that we are looking at the bispectral amplitudes only� and thus weneglect the important phase relationships� The phase behavior is actually the major qualitythat distinguishes between the spectral and bispectral analyses and it will be explored indepth in the following chapters� Thus� the bispectral �amplitudes only� information givesunsurprisingly similar classi�cation to the spectral one� and it is insu�cient for providing atruly new and distinct classi�cation�
One should also note the already�mentioned phenomenon of asymmetry of the distanceexpression with respect to its two arguments� The bispectral distances augment the dif�ferences among the signals� especially increasing the asymmetry of the distortion betweenthe pairs� In case of the fClarinet Oboeg pair� the relative asymmetry magnitudes areconverse in the spectral and bispectral cases�
Concerning the asymmetry property� we might propose an intuitive explanation whichclaims that there exists a better chance to produce a �dull� sound from a �rich� instrumentthen vice versa� Within this line of thought� the opposite relative asymmetry magnitudesbetween Clarinet and Oboe are especially curious � bispectrally Oboe is richer then Clar�inet while spectrally the opposite is the case� It is interesting to note that despite the factthat we ignore the e�ects of the pitch register and amplitude� this preliminary classi�cationseems to be in agreement with the judgment of several professional musicians� Of course�a complete con�rmation of these result calls for extensive and systematic experimentation�yet to be performed�
��� Maximum Entropy Polyspectral Distortion Mea�
sure
Using the log�likelihood expression that was derived in chapter ��� for the AR acousticmodel� we arrive at the primary result of our work� which involves the generalization ofthe acoustic distortion measure to include higher than second order statistics� In general�acoustic distortion measures are widely accepted in speech processing and are closely relatedto the feature representation of the signal �Gray � Markel ����� ����� Over the years manyfeature representations were proposed� with the LPC�coe�cient�based representation beingone of the most widely used �Gray et al� ��� ����� One of the distortions� the so�calledItakura�Saito acoustical distortion �Gray et al� ��������� �Rabiner � Schafer ��������has also been shown to be a statistical� KL divergence between signals represented by theirLPC models� By considering the above�described extension of the traditional LPC model wearrive at a new� extended distortion measure� which is a generalization of the Itakura�Saito
��

acoustical distortion measure�
As explained in the previous section� calculation of the KL divergence is accomplishedby calculating the average of the loglikelihood ratio of the two models with respect to theprobability distribution of one of the signals chosen as the reference signal� Using the averagelog likelihood expression for our model we arrive at
D�P jjP �� �
�ln
P �Y �
P ��Y �
�P
�����
which can be shown to be
D�P jjP �� � �N�
��ln
��
���� � �
Z �
��
Sy���
Sy����� �����
for the spectral case� and
D�P jjP �� � �N ln�����
�N���� � �����
Z �
��
d�
��
Sy���
Sy�����
�N���� � �����
Z �
��
Z �
��
d��d��
�����By���� ���
By����� ���� �����
for the bispectral case� The i and �i�s are the i�th order moments of the two �non�Gaussian�
distributions� Note that there exists a convenient inverse relationship between the momentsand the pdf parameters in the Gaussian case� which causes a canceling between the secondorder moment �� and ��� This is no longer true for the bispectral case�
����� Discussion
The above KL divergence depends upon many parameters� such as the �s and ��s of theexcitation source and the spectral and bispectral patterns of the resulting signal� One mustnote� though� that the �s and ��s are time�independent parameters whereas all temporalaspects appear in the spectral and bispectral ratios� Although we do not know yet howto estimate these parameters for the bispectral case� several important conclusions can bederived�Let�s assume P to be the complete description of the reference source and let P � be anapproximate linear AR model that �ts precisely the signal�s spectrum�
S��� � S���� ��
j A��� j�����
The bispectra B���� ��� of the real reference signal will� in general� be di�erent from thebispectra of the AR model� with the linear model�s bispectrum given by
B ����� ��� ��
A����A����A���� � ��������
��

The resulting distortion between the reference signal and it�s AR model will contain nospectral component� The KL expression can now be rewritten as
D�P jjP �� � C � C �Z �
��
d��d��
�����b���� ��� �����
where we have replaced the last integrand with the bicoherence index
b���� ��� �B���� ���
�S����S����S���� � �������������
and denoted by C and C � the various constants that appear in the equation� Thus we obtainthe simple result that indicates that to the �rst approximation� the distortion between anAR model of a signal� which is spectrally equivalent to the original reference signal� and thereference signal itself� is proportional to the integral of the bicoherence index�
The bicoherence index
The bicoherence index in our model is the ratio of two di�erent entities� the bispectrum andthe power spectrum estimate derived from the parametric AR model� For high frequencies�the values of the bispectrum and the power spectrum are close to zero� and the quotientmight take arbitrary values� Although the AR spectrum is all pole and has no zeros� we stillneed to avoid in the evaluation of the bicoherence index the division by small values of theAR spectrum� This can be achieved by thresholding the AR power spectrum to a minimalvalue� i�e� raising the low values of the tail of the spectrum to the threshold level� Thethreshold value is determined to be above the level of the background noise
We shall speak more of the bicoherence index in the next chapter when considering acous�tic separation function� For now we shall merely mention that the bicoherence index wasalready used in chapter ����� when we demonstrated the e�ects of chorusing and reverbera�tion on the bispectral contents of an audio signal�
����� Sensitivity to the Signal Amplitude
Another interesting result is obtained by applying scaling considerations� Multiplying asignal by a gain factor � results in a new model whose parameters will be related to theoriginal model parameters in the following manner �
Y � � �Y � ������
��� � ��� � ln�
��i ��
�i��i for i � �� �� ���
��

�i � �i�i
and the spectra and bispectra will change to
S� � ��S� ������
B� � ��B�
The new divergence expressed in terms of the original spectra and bispectra is written nowas
D�P jjP ��� � C � ln��
�
�����
��
Z �
��
S���
S�����
�
��
Z �
��
Z �
�����
��
d��d��
�����B���� ���
B����� ���������
� C � ln���
���OriginalSpectalFactor��
�
���OriginalBispectralFactor�
with C containing the gain insensitive constants� The acoustical signi�cance of the aboveresult is rather curious� Basically it says that the �distance� between signals is gain sensitive�with the scaling proportions given by the above equation� At the high gain limit� both thespectral and bispectral factors vanish� leaving the �distance� to be dependent solely uponthe excitation source parameters and normalization factors� The �similarity� of any signalto another very loud signal is independent of the polyspectral properties of the signals� Inthe middle range� the behavior of the function is such that a higher weighting is given to thebispectral part at the lower gain values and vice versa the spectra are emphasized when thegain is incremented�
��� The Clustering Method
An interesting application of our new distortion measure is an acoustic taxonomy of variousmusical instrument sounds� Musical sounds are hard to cluster since it is di�cult to modelsounds as points in a low dimensional space� Though we limit ourselves to the stationaryportion of the signal� a grouping of musical instruments� by the above similarity measure�appears in a rather interesting manner� as shown below�
In our approach� acoustic signals are treated as samples drawn from a stochastic source�that is� musical signals are represented by their corresponding statistical models� Each modelis chosen to be the most likely in its parameter class to have produced the observed waveform�It is important to note that our relevant observables are the spectrum and the bispectrumof the signal� but in order to evaluate all the parameters of the distortion function� thefi� �ig�s must be estimated as well� Although this can be done in principle and an iterativesolution procedure for this was described in the previous chapter� here we prefer to avoidthe complete estimation of these parameters ����� by using the following arguments�
�

The distortion function is characterized by two integrals over ratios of the spectra andbispectra of the two signals involved� These are actually the only two quantities that aredirectly derived from the observed signal� We expect these two observables to contain allthe relevant acoustic information and thus we substitute the original distortion function� Eq������� by the pair �Sry�y� � Bry�y�� where Sry�y� �
R ���
d���
Sy��Sy� ��
and Bry�y� �R ���
d��d������
By������By�������
are the spectral and bispectral integral ratio expressions� respectively�
The idea is to represent a sound y by a collection of all pairs �Sry�y� � Bry�y��� calculatedwith respect to all signals y� in our data set� This �trace� vector provides a signature of theparticular signal y� characterizing it by the values of spectral and bispectral integral ratios�with respect to all the other signals� These signatures are expected to be similar for soundswith similar characteristics and serve as the basis for an acoustic classi�cation� which in turndetermines the underlying structure in the musical domain� By this transformation we haveturned our data into a collection of points in a high dimensional space� the dimensionalitybeing equal to the length of our signature vectors�� Using this vector�signature representationwe explore our signal collection by means of a deterministic annealing hierarchical clusteringapproach� ��� �Rose et al� ���� As in other fuzzy clustering methods� each point �a signaturevector in our case� is associated in probability with all the clusters� The �annealed� systemconsists of a set of probability distributions for associating points with clusters�
The associations probability is controlled by a inverse temperature�like parameter� �� As� gets larger� the temperature is lowered and the associations become less fuzzy� At thestarting point � � and each point is equally associated with all clusters� As � is raised�the cluster centroids bifurcate through a sequence of phase transitions and we obtain anultrametric structure of associations controlled by the temperature parameter�
��� Clustering Results
As described above� hierarchical clustering was performed iteratively by splitting the models�cluster centers� while raising �� This creates a sequence of partitions that give re�nedmodels at each stage� with clusters containing a smaller group of signature vectors� whichare representatives of the signals themselves�
In order to test in detail the spectral and bispectral components of our data� we performedthree separate clusterings� ��� a clustering with the spectral integral ratios vector only� ��� abispectral integral ratios vector only� and ��� a combined clustering with vectors consistingof the complete �Sry�y� � Bry�y�� set of pairs�
Our data set was taken from a collection of �� sampled instruments sounds� from the Pro�teus sample player module� The results of spectral� bispectral and combined clustering are
�The signature vector could be calculated with respect to a small representative subset of our signal set�We chose to evaluate the complete distances matrix� i�e� each signal is represented by the distances from allother signals� and the space dimension is thus equal to the size of the data set�
��

shown in �gures ���� ���� ��� respectively� Regarding the spectral and bispectral clusterings�we �rst note that many similar pairs of sounds� such as Flutes Clarinets and Trumpetsare grouped together in both clustering methods� It is interesting to notice also that theViolin and Viola are related �to di�erent extents� in both methods� while the Cello isdistant from both of them in the two clustering trees� Notice also that the Bassoon is closeto the Contra Bassoon in the spectral tree� while being very distant in the bispectral case�Similarly� but in the other direction� the Alto Oboe English Horn pair are close in thebispectral tree and distant in the spectral tree�
Qualitative analysis of these results suggests some possible interpretations of the behaviorof spectral and bispectral clusterings� A rather �trivial� observation is that the spectral tree�grows� in the direction of spectral richness � the Flutes are close to the root� while thedeeper branches belong to spectrally richer string and wind instruments� The bispectral treeexhibits clustering that puts at the deep nodes instruments which are normally identi�ed as�solo� instruments� while the sounds closer to the root belong to a lower�register instrumentsof a more �supportive� character� It may be said that the hierarchical clustering splittingcorresponds to some �penetrating� quality of the sounds� with Flutes and Violin at theextreme�
The combined spectral bispectral results are di�cult to interpret� although traces of thespectral and bispectral trees are apparent there� This �nding would also require thoroughstatistical testing with human subjects� both musicians and non musicians�
�

B.Cl
Cl(23.9)
VlaAlt.Ob(38.3)
Bar.Sax(23.9)
(10.8)
ReedQrt3Syn.Str2(38.3)
(23.9)
Vln
Qrt4(23.9)
(10.8)
(4.51)
Trmp.Hard
Trmp.Soft
(4.51)
(1.07)
Ten.Sax
Syn.Str1
(10.8)
Gamba
(2.54)
Harm.Mute
Qrt1
(4.51)
Alt.Sax
ReedBuzz
(4.51)
(2.54)
(1.07)
(0.71)
Syn.Fl
Soft.Fl
(1.07)
DarkTrmp
Cont.Bassoon
(4.51)
BassoonCelloQrt2(23.9)
(10.8)
DarkSaxOb.noVib(23.9)
Eng.Horn(10.8)
(4.51)
(2.54)
Moog
Ob.Vib
WoodWind
(4,51)
(2.54)
(1.07)
(0.71)
(0.48)
Figure ���� Spectral clustering tree� The numbers on the nodes are the splitting values of ��
��

Bassoon
Bar.Sax
(5.03 )
Ob.noVib
Gamba
(7.71)
DarkTrmp
Trmp.Soft
(7.71 )
(5.03)
(3.24)
Vla,Qrt3
Syn.Fl,Soft.FlQrt4Vln(48.8)
Syn.Str1(21.6)(12.4)
Qrt1(10.3)
ReedBuzzSyn.Str2(12.4)
Ob.Vib(10.3)
(7.71)
(5.03)
Trmp.Hard
DarkSax
Ten.Sax(10.3)
(7.71)
HarmMuteAlt.SaxCl, B.Cl(12.4)
(10.3)
Moog
Reed(10.3)
(7.71)
(5.03)
(3.24)
(1.93)
Eng.Horn, WoodWind
Alt.Ob
(3.24)
Qrt2
Cello
(5.03)
Cont.Bassoon
(3.24)
(1.93)
(0.20)
Figure ���� Bispectral clustering tree�
��

Qrt1 Syn.Fl,Soft.FlBassoon(15.7)VlnQrt4
(15.7)(12.8)(9.71)
Ob.Vib ReedyBuzzSyn.Str2(12.8)(9.71)
(7.41)
MoogAlt.Sax(12.8)Syn.Str1Cl,B.Cl
(12.8)(9.71)
HarmMute(7.41)
(4.69)
Vla, Qrt3
Trmp.Hard
Reed(7.41)
(4.69)
(3.25)
Bar.Sax
Ob.noVib
Gamba(7.41)
Trmp.Soft
DarkTrmp(7.41)
(4.69)
(3.25)
(1.93)
Cello,Qrt2
Alt.Ob
(3.25)
Ten.Sax
DarkSax
(4.69)
Cont.Bassoon
Eng.Horn,WoodWind
(4.69)
(3.25)
(1.93)
(0.20)
Figure ���� A combined spectral and bispectral clustering tree�
��

Part III
Analysis of the Signal Residual
��

Chapter �
Estimating the Excitation Signal
In our work so far we have considered a Signal Model that treated sound as an output signalof a source��lter model� with the source being a non�Gaussian white noise excitation� Themain fault of this approach� in our view� is the loose modeling of the sound source by theexponential probability distribution derived from maximum entropy principles�
In this part of the work we take a closer look at the HOS properties of the excitation signal�We consider a Spectral Model for the excitation signal and try to identify the structure ofthe excitation signals based on the information present in the higher order statistics �HOS�of the stationary portion of the sound�
Spectral matching of a signal a represents the sound as a white process passing through alinear �lter whose role is to introduce the second order correlation properties into the signaland thus shape its spectrum� Stable linear systems subject to a Gaussian input are thuscompletely characterized by the covariance function of their output and hence their powerspectrum� In case of a non�Gaussian input signal� higher order cumulants appear in theoutput� Moreover� if the relationship between the output and input signals is not linear� thestatistics of the output signal will not be Gaussian even if the input is normal�
Given a signal Xt� the bispectrum BX���� ��� gives a measure of the multiplicative non�linear interaction between frequency components in the signal
BX���� ��� ��X
m���
�Xn���
CX�m�n�e�i��m���n� �����
with CX�m�n� � E�X�t�X�t�m�X�t� n�� the third order cumulant of zero mean processX�t�� Assuming that our signal is generated by a nonlinear �ltering operation satisfying aVolterra �Priestley ���������Pitas � Venetsanopoulos �������� functional expansion� wewrite
Xt ��Xu��
h��u�U�t� u� ��Xu��
�Xv��
h��u� v�U�t� u�U�t� v� � ��� � �����
��

In the linear case� the model is completely characterized by the transfer function
H���� ��Xu��
h��u�e�i�u �����
while
H����� ��� ��Xu��
�Xv��
h��u� v�e�i��u���v� �����
represents the kernel that weights the contribution of the components at frequencies ��� ��
in the input signal Ut to the component at frequency ��� � ��� in the output Xt �and soforth for higher order kernels��
We say here that a signal Xt is linear if the system that created it has no kernels oforder higher than two� This notion of linearity implies that no multiplicative interactionsoccur between the frequency components in the stationary portion of the signal and theprinciple of superposition applies in the sense that the resultant signal is obtained as asum of frequencies with appropriate spectral amplitudes� Although the more common andobvious manifestations of non�linearity appear in the dynamic behavior of the sound �suchas the non�linear dependence of the signal properties upon its amplitude�� the bispectralproperties in the sustained portion can quantify nonlinearities as well� �
Schematically� our approach could be summarized by the following Figures ���� ���� Thesignal is regarded as some kind of stochastic pulse train Xt passing through a linear �lter�In the case of a pitched signal �i�e� a signal with a discrete spectrum�� Gaussianity of theinput signal is obtained either for inharmonic signals� or harmonic sounds with statisticallyindependent partials� The independence is obtained for instances such as presence of randomindependent modulations at each harmonic �����
H(z)x(n) y(n)
(Non) GaussianWhite Noise. (Non) Linear
Filter
(Poly)spectra
Figure ���� Signal Model � Stochastic pulse train passing through a �lter�
In the following analysis we shall address the questions of Gaussianity and linearity basedon the higher order statistics ofXt without attempting to estimate the kernels or other system
�Although it is not clear whether these are the same non�linearities or if the same non�linear mechanismsare active in the transitory and sustained portions of a signal�
�Spectrally� the signal is composed of an incommensurate set of sinusoids� i�e� no partial sum of frequenciesin the set corresponds to an already�existing frequency�
��

Filter−1
Figure ���� Estimation of the excitation signal �residual� by inverse �ltering�
parameters� Since we have no underlying parametric model for our sounds� this chapter ismore concerned with the analysis of the structure of musical signals� the musical signi�cancediscussed in section ������
��� Examples of Real Sounds
Given a signal� we suggest that the next step beyond analyzing the spectral amplitudedistribution characterized by the �lter� should be to look at the properties of the inversely�ltered result� or the so�called residual�
The e�ect of the spectral envelope� which contains the information about the amplitudesof harmonics is removed by inverse �ltering of the signal through a �lter derived from itsLPC model� This action statistically amounts to low order decorrelation of the signal andleaves all harmonics at equal amplitudes � a situation reminiscent of a pulse train excitationsignal��
Before going further into analyzing and modeling �in the next chapter� the excitationfunction� we would like to demonstrate the bispectral signatures of several musical signalsand of their respective residuals� In �gure �� we present the bispectra of residual signalsfor three musical instruments� Cello� Clarinet and Trumpet� Their original bispectra �i�e�before the inverse �ltering operation for spectrum normalization� are shown under each plot�The strong presence of the high harmonics in the residual signi�cantly a�ects the bispectralcontents� Notice that the Cello residual has only a few peaks near the origin�
How do we look at these signals� First� we must be aware of the symmetries pertinentin the de�nition of bispectrum� In the sixfold symmetry it is su�cient to consider a lowertriangular part at the �rst quadrant only� Similarly� in the trispectrum� we shall consideronly the lower tetrahedron in the positive octant of a three dimensional space�
�In the next chapter we will show how the HOS properties of the excitation �residual error� are relatedto frequency deviations caused by a frequency modulating jitter acting on the harmonics of a pulse trainlike signal� In this case we obtain a statistical interpretation of the moments as probabilities for maintainingharmonicity among groups of partials�
��

0 200 400 600−1500
−1000
−500
0
500
1000
1500
Time
Am
plitu
de
residual
0 0.5 110
1
102
103
104
105
106
Mag
nitu
de R
espo
nce
(dB
)
Frequency (Nyquist = 1)
residual
0 200 400 600−10000
−5000
0
5000
Time
Am
plitu
de
Cello
0 0.5 110
0
102
104
106
108
Mag
nitu
de R
espo
nce
(dB
)
Frequency (Nyquist = 1)
Cello
Figure ���� The original Cello signal and its spectrum �yop�� The residual signal and itsrespective spectrum �bottom�� Notice that all harmonics are present and they have almostequal amplitudes� very much like the spectrum of an ideal pulse train� The time domainsignal of the residual does not resemble pulse train at all�
Below we shall consider the bispectra �trispectra� of residual signals �although it will notbe possible to represent them graphically�� The residuals are not only properly normalizedversions of the bispectrum that compensate for the e�ect of resonance chamber spectralshape� but it also has the following important properties to be shown below�
� The area �volume� obtained by integrating over the bispectral �trispectral� plane hasa statistical interpretation as a count of harmonicity between triplets �quadruples� ofharmonics�
� The area �volume� equals the moments of the signal and thus it can be easily calculatedby taking time averages of the signal to the �rd and �th powers�
As could be seen from the plots of the residual bispectrum � the overall area under the threegraphs is signi�cantly di�erent� It is interesting to note that investigation of the momentsof decorrelated signals were used in the analysis of texture in images ����������
�

−0.5 −0.4 −0.3 −0.2 −0.1 0 0.1 0.2 0.3 0.4
−0.4
−0.2
0
0.2
0.4
Cello residual bispectrum
−0.5 −0.4 −0.3 −0.2 −0.1 0 0.1 0.2 0.3 0.4
−0.4
−0.2
0
0.2
0.4
Original Cello bispectrum
Figure ���� The bispectrum of a Cello residual signal �top� and the bispectrum of the originalCello sound �bottom�� See text for more details�
��� Higher Order Moments of the Residual Signal
Since the non�linear properties of musical signals are attributed mainly to the properties ofthe excitation signal� the investigation of the higher order statistical properties of the residualseems a natural next step beyond the spectral modeling of the linear resonator� In general�any process Xt could be represented as a sum of deterministic and stochastic componentsand the Wold decomposition teaches us that any signal can be optimally represented interms of a �lter �linear predictor� acting on a white input noise� with the optimality beingwith respect to the second order statistics of a signal�� Let us assume for the moment thatthe musical signal Xt could be described by a non�Gaussian� independent and identicallydistributed �i�i�d�� excitation signal Ut passing through a linear �lter h�n��
Xt ��Xu��
h�u�U�t� u� �����
In such a case� the spectra and bispectra of Xt are equal to
SX��� � �jH���j� �����
�Since in the gaussian case white implies independent� the Wold optimality is maintained only then�
��

−0.5 −0.4 −0.3 −0.2 −0.1 0 0.1 0.2 0.3 0.4
−0.4
−0.2
0
0.2
0.4
Clarinet residual bispectrum
−0.5 −0.4 −0.3 −0.2 −0.1 0 0.1 0.2 0.3 0.4
−0.4
−0.2
0
0.2
0.4
Original Clarinet bispectrum
Figure ���� The bispectrum of a Clarinet residual signal �top� and the bispectrum of theoriginal Clarinet sound �bottom�� See text for more details�
BX���� ��� � �H����H����H���� � ���
�with a similar equation for the trispectra�� with �� � �and �� being the second� third�and fourth� order cumulants of Ut� For convenience we shall assume � � �� Althoughexact solution of the �lter parameters in the non�linear case is problematic ����� we assumethat it could be e�ectively estimated based on spectral information only� Taking a spectrallymatching �lter H���
SX��� � j H���j� �����
the inverse �ltering of Xt with H����� gives a residual Vt� Since Vt is a result of passing anon Gaussian signal Xt through a �lter H������ its bispectrum is
BV ���� ��� �BX���� ���
H���� H���� H���� � ���� ����
Taking the absolute value of BV ���� ��� and using the spectral matching property of H � weobtain the equivalence of the right�hand equation to the de�nition of the bicoherence indexfor the original signal Xt�
�Such a solution must be optimal with respect to the spectral� bispectral and all higher order statisticalinformation and requires complete knowledge of the noise distribution parameters�
�

−0.5 −0.4 −0.3 −0.2 −0.1 0 0.1 0.2 0.3 0.4
−0.4
−0.2
0
0.2
0.4
Trumpet residual bispectrum
−0.5 −0.4 −0.3 −0.2 −0.1 0 0.1 0.2 0.3 0.4
−0.4
−0.2
0
0.2
0.4
Original Trumpet bispectrum
Figure ���� The bispectrum of a Trumpet residual signal �yop� and the bispectrum of theoriginal Trumpet sound �bottom�� See text for more details�
The residual signal would ideally be a decorrelated version of the original sound for thecase when the excitation is a white noise� i�e� a signal with a continuous �at spectrum� Insuch a case� Vt is an i�i�d� process � its cumulants are zero at all times other then zero� Inthe case of pitched excitation� the residual signal is not ideally decorrelated� and it containscorrelations at time lags that correspond to multiples of the pitch period and thus respectivelydemonstrates peaks in the polyspectra� Inverse Fourier of the bispectra at zero lag timesgives
C�V �� � �
�
�����
Z �
��
Z �
��BV ���� ��� �����
so that the cumulants at time zero are integrals over the bispectral plane�
We claim that for excitation signals of both the continuous �excitation noise� and thediscrete �pitched� spectra types� the cumulants at time zero are signi�cant features� Obvi�ously� for i�i�d� white noise excitation� the �rst order amplitude histogram of the decorrelatedsignal is a plausible estimate of the excitation distribution function� and as such it is com�pletely characterized by its moments� In the pitched case� zero time lag cumulants which
�The resonant chamber of the musical instrument should be modeled by a low order �lter� and its inverse�decorrelating� �lter is a high boost that �attens out the spectral envelope but retains the comb�likestructure of the signal�
��

are integrals over polyspectral planes of various orders �� and � in our study� appear tobe important quantities as well� although they can no longer characterize the excitationdistribution function which now contains pairwise and higher order dependencies�
Assuming ergodicity� the cumulants can be calculated more conveniently as time averages
C�V �� � � lim
T��
�
T
Z T
�V ��t�dt �����
C�V �� � � � lim
T��
�
T
Z T
�V ��t�dt� � � C�
V �� �
and these results could be used as estimates of the actual third and fourth order cumulants�� � of the input Ut at zero time lag�
Instead of working with the cumulants directly� we look at the skewness � � ��� of
the signal� which is the ratio of the third order moment � � E�x�Ex�� over the � � powerof the variance �� � �� and kurtosis � � ��
�� which is the variance normalized version ofthe fourth order moment � � E�x� Ex��� Since we are dealing with zero mean processes�the third order moment is equivalent to the third order cumulant� For the fourth order wesubtract � from the kurtosis to get the variance normalized cumulant �����
��� Tests for Gaussianity and Linearity
As noted above� if a process is Gaussian� all its polyspectra of orders higher than second arezero� Hence� a non�zero bispectrum could be due to either of the following factor�
�� The process conforms to a linear model but the input signal statistics are not Gaussian�
�� The process conform to a non�linear model� regardless of the input signal statistics�
Case ��� is examined by testing the null hypothesis that the bispectrum is zero over theentire bispectral plane�Case ��� is examined by using the expression for bispectra of a signal X�t� assuming it hasa linear representation
BX���� ��� � �H�����H�����H�� ��� � ���� ������
The spectral density function of the process is given by
S��� � �jH���j� ������
hence the bicoherence function
b���� ��� �jBX���� ���jq
S����S����S��� � ���� constant �all ��� ��� ������
��

The test for linearity is based on replacing the BX���� ��� and S��� with their sampleestimates and testing the constancy of the sample values of the bicoherence index over a gridof points�
��� Results
Returning to real musical signals� we evaluate these moments by empirically calculating theskewness and kurtosis of various musical instrument sounds� These moments were calculatedfor a group of � instruments and they show a clear distinction between string� woodwindand brass sounds� Representing the sounds as coordinates in �cumulants space� placesthe instrumental groups in �orbits� of various distances around the origin� This graphicalrepresentation also suggest a simple distance measure which could be used for classi�cationof these signals�
−2 −1.5 −1 −0.5 0 0.5 1 1.5 2−2
0
2
4
6
8
10
12
14
16
Skewness
Ku
rto
sis
− 3
A.Sax FrHor
Trbn1
Trbn2
Tpt.S
Tpt.H
−0.6 −0.4 −0.2 0 0.2 0.4 0.6−1
−0.5
0
0.5
1
1.5
2
2.5
3
Skewness
Ku
rto
sis
− 3
B.Sax
B.Cla
Fagot
Clari
C.Fag
Ob.Vi Ob.nV
Flute
Cello
Viola Violn
T.Sax
Zoom In
Figure ���� Location of sounds in the �rd and �th cumulants plane� The value � is substructedfrom the kurtosis so that the origin would correspond to a perfect gaussian signal� Left� All� signals� Brass sounds are on the perimeter� Right� Zoom in towards the center containingstrings and surrounded by woodwinds�
Testing for Gaussianity and Linearity �Hinich ��������� �Mendel et al� �������� givesqualitatively similar results� One must note that the cumulants space representation can notresolve the Gaussianity Linearity problem since the calculation of the cumulants involvesintegrating over the bicoherence plane and no information about the constancy of the bico�herence values is directly available� One �nds� however� an intuitive correlation between theGaussianity and non�linearity properties and the magnitudes of the cumulants�
In the Gaussianity test� the null hypothesis is that the data have zero bispectrum� Since
��

the estimators are asymptotically normal� our test statistic is approximately chi�square andthe computed probability of false alarm �PFA� value is the probability that a value of the chi�squared random variable will exceed the computed test statistic� The PFA value indicatesthe false alarm probability of accepting the alternative hypothesis� that the data have anon�zero bispectrum� Usually� the null hypothesis is accepted if PFA is greater than ���i�e� it is risky to accept the alternative hypothesis��
In the Linearity test� the range Rest of values of the estimated bicoherence is computedand compared to theoretical range Rtheory of a chi�squared r�v� with two degrees of freedomand non�centrality parameter �� The parameter �� which is proportional to the mean valueof the bicoherence� is also computed� The linearity hypothesis is rejected if the estimatedand theoretical ranges are very di�erent from one another�
Since the Linearity test assumes a non�zero bispectrum� it should be considered reliableonly if the signal passed the earlier Gaussianity test� In the following �gure we presentthe results of Gaussianity and Linearity tests plotted so that the X�axis represents theGaussianity PFA value and the Y�axis is the di�erence between the estimated and theoreticalranges�
0 0.1 0.2 0.3 0.4 0.5 0.6 0.7 0.8 0.9 1−5
0
5
10
15
20
25
30
35
40
Fagot C.Fag B.Cla A.Sax
T.Sax
B.Sax
FrHor
Trbn1
Trbn2
Tpt.S
Tpt.H
0.95 0.96 0.97 0.98 0.99 1−3
−2.5
−2
−1.5
−1
−0.5
0
Cello Viola
Violn
Flute
Ob.nV Clari
Zoom In
PFA for the Linearity Test
R−estimated − R−theory
Figure ��� Results of the Gaussianity and Linearity tests� PFA � �� means Gaussianity�R�estimated �� R�theory means non�Linearity� The deviations in the Y�axis of the right�gure should not be considered since the Linearity test is unreliable for signals with zerobispectrum �Gaussian��
��

��� Probabilistic Distortion Measure for HOS fea�
tures
In this study we have provided qualitative evidence that the cumulant description of the�rst�order amplitude histogram of the decorrelated acoustic signal is an important featureof musical instruments� Considering two classes P� and P�� the Bhattacharyya �B� distancebetween the probability densities of features of the two classes is
B�P�� P�� � �lnZ��p� gjP��p� gjP���
���dx ������
where g denotes the HOS feature vector with conditional probability p� gjPi� for class i� Itis known that asymptotically the distribution of the kth order statistic Ck
V �� � is normalaround its true value� For Gaussian densities� the B distance becomes
B�P�� P�� ��
�g� � g��
T �!� � !�
�����g� � g�� ������
��
�ln
��j!� � !�j
�j!�j j!�j�����
where gi and !i represent the feature mean vector and covariance matrix of the classes�
According to our cumulants space representation� the instrumental families are residenton orbits of similar distance from the origin� In such a case� the grouping of timbres intofamilies should be according to the relative B distances of the instruments from a normalgaussian signal N�� ��� Then� the B distances become
B�P�N� ��
gT!��g ������
where the covariance matrix must be evaluated for each instrumental class�
��� Discussion
Our main result is that the cumulant space representation suggests an ordering of the signalsaccording to common practice for instrumental families of string� woodwind and brass in�struments� The grouping is with respect to the distances of the signals from the origin whichcorresponds to an ideal Gaussian �and hence linear� signal� The string instruments� being theclosest to the origin� are the most Gaussian� and similarly� the Linearity test applies to them�The second orbit band is occupied by woodwind instruments which are classi�ed as Linearbut Non Gaussian in the Hinich tests� The perimeter orbits contain brass sounds� Thesesounds also satisfy the non�Linearity tests with increasing level of con�dence for signals withstronger moments�
��

Considering the technical application of these results� there are two approaches to thecreation of a musicallymeaningful signal with Gaussian or non�Gaussian properties� which weare currently investigating� In the �rst approach �Dubnov et al� ����� ��� we assume that wecan represent our input signal as a sum of sinusoidal components with constant amplitudes�Application of random jitter to these components e�ectively reduces the correlations betweenthe constituent frequencies� and the resultant signal approaches Gaussianity in the sense thatits higher order cumulants vanish� This� of course� does not imply that the signal becomesaudibly a noise� since second order correlations remain arbitrarily long and they determinethe spectrum and the perceived pitch� Another approach is passing a Gaussian noise througha comb �lter� which is a poor man�s approximation of a bowing of a Karups�Strong string�
Since Gaussian statistics are preserved under linear transformation� Gaussianity of theoutput signal indicates that the input signal is Gaussian� too� In the cases where the signalis linear but non�Gaussian� the non�Gaussianity originates in the higher order cumulants ofthe input signal� In the sum�of�sinusoids interpretation this might be understood as a sumof sinusoids with a constant level of correlation between all components� This e�ect could beachieved by passing a Gaussian signal through a memoryless non�linear function �Grigoriu����� ����� Strictly speaking� non�Gaussianity is a certain sort of non�linearity where thenon�linear properties are e�ective at a single time instance only while all memory is assignedto the linear component exclusively�
����� Musical Signi�cance of the Classi�cation Results
For conclusion� it is apt to discuss in brief the musical signi�cance of the orchestral familyclassi�cations� Beyond the traditional and instrument builders� reasons for this classi�ca�tion� the categorization into instrumental families has a strong evidence in orchestrationpractice� Scoring of chords and harmonic �homophonic� writing achieves a better �blend�for instruments of the same family� For a combination of timbres Adler �������� suggests��When considering doubling notes� try to �nd instruments that have an acoustic a�nity forone another�� This very idea of acoustic a�nity had been formulated in our work as aproblem of representation and statistical distance in HOS feature space� the idea of usingcumulants as acoustic features is novel in audio signal analysis�
To demonstrate the correspondence between our features and the orchestration practice�it is interesting to note� for instance� that the French Horn is located between woodwindsand brass timbres in the moment space representation� This is very much in accordancewith the orchestration handbooks� description of the instrument� To quote Piston ��������� �The horns form an important link between brass and woodwind� Indeed� they seem tobe as much a part of the woodwind section as of the brass� to which they belong in nature��
One must mention the work of Sandell ������������ who considered temporal and spec�tral factors that determine blend� Since our method considers the higher order statistical�spectral� properties of the decorrelated signal� it might be worthwhile to consider the rela�
��

tionship between our results and the harmonicity and pitch deviations properties that wereconsidered by Sandell� These factors de�nitely have an impact on the polyspectral contentsof the signal� as was discussed in earlier work �Dubnov et al� ����������
To conclude the discussion we would like to note that he above results were also testedon a larger �� �� suite of sounds with comparable results� We note also that since we aredealing only with stationary sounds� we neglect any non stationary or transitory phenomenathat do not fall in the domain or could not be considered microscopic stationary �uctuationsat the sustained portion of a sound� These �ndings indicate interesting principles for theclassi�cation of music instruments� but as we constantly remark� all of our results requirecomparative psychoacoustic experimentation�
����� Meaning of Gaussianity
In order to understand better the in�uence of jitter on a perfectly periodic sound� we wouldlike to consider brie�y the statistical properties of non�harmonic pitched signals and showthat their statistics approach Gaussianity for large number of partials�Given a signal x�t� �
PQj�� e
i�jt� the second order time averaged correlation is
� x�t� � x��t� � � ��� �PQ
j�� ei�jt��
PQk�� e
i�kt� � ������
� lim ����
PQj�k���
R � e
i�j��k�tdt�e�i�j
�PQ
j�� e�i�j
which equals Q for � � and is zero for harmonically related �i�s ��i � i ����� but generallyis non zero for an arbitrary set of �i�s� Thus� second order statistics are non zero for bothharmonic and non harmonic sounds� The third order correlations though are extremelysensitive to the existence of harmonic relations since
� x�t�x�t� ���x��t� ��� �� �����
lim ��
�
�"
QXj�k�l��
�Z
� ei�j��k��l�tdt�
� e�i�k�e�i�l�
and the bracketed integral expression vanishes for non�harmonic signals since �j � �k � �lnever occurs�
The vanishing of high order correlations means that the signal statistics are Gaussian�This is easily demonstrated for � � by looking at the histograms of harmonically andnon�harmonically related signals�
In the mixed harmonic non�harmonic set of frequencies �i� the third order moment equalsthe e�ective number of harmonic triplets found in the sounds� spectrum�
��

The sinusoids
The resulting summation signal
Q=1
Q=2
Q=3
Q=4
Q=5
Q=6
Q=7
Q=8
Figure ���� Harmonic signal �left� and its histogram �right��
The sinusoids
The resulting summation signal
Q=1
Q=2
Q=3
Q=4
Q=5
Q=6
Q=7
Q=8
Figure ���� Inharmonic signal �left� and its respective histogram �right��
�

Chapter �
�Jitter� Model for Resynthesis
��� Stochastic pulse�train model
In the ideal case� the residual is supposed to be a low amplitude Gaussian noise� withregularly spaced peaks due to the pitch of the source signal� and is totally characterized byits variance� We assume that instead of the ideal pulse train� we have a sinusoidal modelapproximation which consists of a sum of equal amplitude cosines� with a random jitterapplied to its harmonics�
x�t� �QXn��
cos���f�n � t� Jitter�t�� �����
with f� being the fundamental frequency and Q the number of harmonics�
The statistical properties of this model are analyzed by calculating the third� fourth andpossibly higher order moments of the signal� and speci�cally we will look at the skewness � � m��
� of the signal which is the ratio of the third order moment m� � E�x � Ex��
over the � � power of the variance �� � m� and kurtosis � � m��� which is the variance
normalized version of the fourth order moment m� � E�x�Ex�� �Grigoriu ����������
��� Inuence of FrequencyModulating Jitter on Pulse
Train Signal�
The in�uence of jitter upon higher order moments is considered by its e�ect on harmonicitybetween harmonic triplets �quadruples� of the signal partials� Basically� the application offrequency modulating jitter to harmonically related partials destroys the harmonicity whenthe jitters are non�concurrent �independent� at each partial� Harmonicity is preserved� in
��

contrast� when the same jitter �concurrent modulation� is applied to the partials� The van�ishing of signal moments indicate that the signal obeys Gaussian statistics� The relationshipbetween Gaussianity and harmonicity is discussed at length at the appendix�
Designating the deviation in frequencies by #n � ��nr�n where �n � Modn�t� is anuniformly distributed random variable between ���� ��� with r being the modulation depthand n the partial number� we rewrite our stochastic pulse train model
x�t� �QXn��
cos����n�#i�n� � t� �����
�
The extent to which the random jitter causes degradation in the harmonicity of thesignal is evaluated by counting the number of triplets �quadruples� of partials that retain aharmonic relationship after the application of jitter�
This count is accomplished by measuring the third �fourth� order moment of the signal
m� ��
T
Z T
�x��t�dt �����
��
�����
Z Q��
�Q
Z Q��
QXi���Xi��
��X�i �� � ���d�d��
�Z Z QX
n��
QXm��
��� � �n�� �#n�i�� �
���� � �m�� �#m�i�� �
���� � ���� ��n �m��� �#n�m��i��d�d��
This double integral amounts to the number of harmonic triplets� since a contribution oforder one is obtained for each harmonically related triplet� A similar evaluation is applicableto the fourth order moment and its respective trispectrum representation in the frequencydomain�
����� The E�ective Number of Harmonics
Let us assume that the �rst Qeff partials of the signal �n � Qeff � are subject to concur�rent modulation jitter� while the partials above the threshold �n � Qeff� are modulatedindependently� In such a case only partials below Qeff contribute to the HOS� �
The theoretical calculation of the skewness and kurtosis is based upon a counting argu�ment for the total number of peaks in the bispectral and trispectral planes that occur due
�This assumption is based on empirical observations of bispectrum plots of real musical signals �such asthose demonstrated in �gure ���� that demonstrate a stronger bispectrum at low bifrequencies and a decayin bispectral amplitude for higher partials�
�
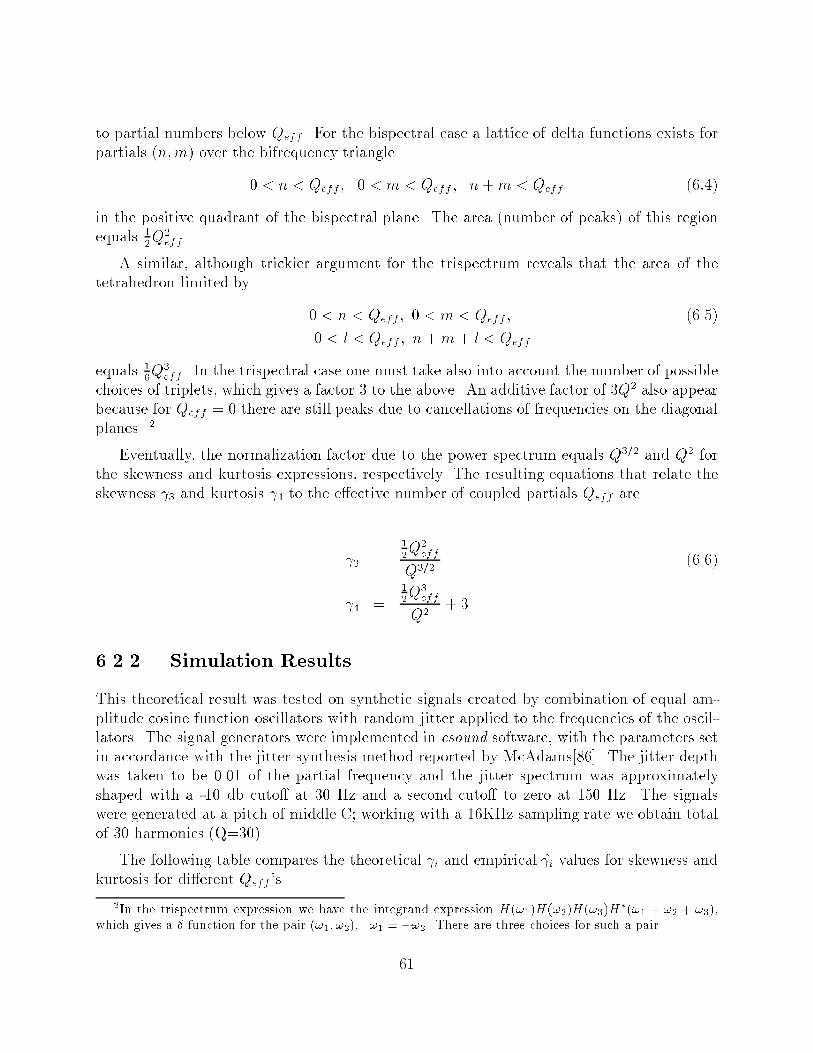
to partial numbers below Qeff � For the bispectral case a lattice of delta functions exists forpartials �n�m� over the bifrequency triangle
� n � Qeff � � m � Qeff � n�m � Qeff �����
in the positive quadrant of the bispectral plane� The area �number of peaks� of this regionequals �
�Q�eff �
A similar� although trickier argument for the trispectrum reveals that the area of thetetrahedron limited by
� n � Qeff � � m � Qeff � �����
� l � Qeff � n�m� l � Qeff
equals ��Q
�eff � In the trispectral case one must take also into account the number of possible
choices of triplets� which gives a factor � to the above� An additive factor of �Q� also appearbecause for Qeff � there are still peaks due to cancellations of frequencies on the diagonalplanes� �
Eventually� the normalization factor due to the power spectrum equals Q��� and Q� forthe skewness and kurtosis expressions� respectively� The resulting equations that relate theskewness � and kurtosis � to the e�ective number of coupled partials Qeff are
� ���Q�
eff
Q��������
� ���Q
�eff
Q�� �
����� Simulation Results
This theoretical result was tested on synthetic signals created by combination of equal am�plitude cosine function oscillators with random jitter applied to the frequencies of the oscil�lators� The signal generators were implemented in csound software� with the parameters setin accordance with the jitter synthesis method reported by McAdams���� The jitter depthwas taken to be �� of the partial frequency and the jitter spectrum was approximatelyshaped with a �� db cuto� at � Hz and a second cuto� to zero at �� Hz� The signalswere generated at a pitch of middle C� working with a ��KHz sampling rate we obtain totalof � harmonics �Q����
The following table compares the theoretical i and empirical i values for skewness andkurtosis for di�erent Qeff �s�
�In the trispectrum expression we have the integrand expression H����H����H����H���� � �� � ����
which gives a � function for the pair ���� ���� �� � ���� There are three choices for such a pair�
��

−0.5 −0.4 −0.3 −0.2 −0.1 0 0.1 0.2 0.3 0.4
−0.4
−0.2
0
0.2
0.4
Pulse Train with Frequency Jitter : Qeff = 25
−0.5 −0.4 −0.3 −0.2 −0.1 0 0.1 0.2 0.3 0.4
−0.4
−0.2
0
0.2
0.4
Pulse Train with Frequency Jitter : Qeff = 3
Figure ���� Bispectra of two synthetic pulse train signals with frequency modulating jitter�Top� Qe� � �� Bottom� Qe� � ��� Notice the resemblance of the two �gures to the bispectralplots of the cello and trumpet in �gure ���� The Qe� values were chosen especially to �tthese instruments according to the skewness and kurtosis values for the instrument in �gure����
Skewness and Kurtosis
Qeff � � � � � � � �� ��� ���� ��� ���� ��� ���� ��� ����� ���� ���� ��� ������ ���� ���� ��� ������ ���� ����� ����� ������� ����� ���� ���� ���� ���� ���� ���� ���
��

��� Summary
����� The Findings of the Model
In this chapter we presented an analysis�classi�cation�synthesis scheme for instrumental mu�sical sounds� Speci�cally we focused on the micro�uctuations that occur during a sustainedportion of single tones� and we showed that an important parameter in the characterizationof micro�uctuations is the �e�ective number� �Qeff � of coupled harmonics that exists in thesound� For modeling� simulation and resynthesis purposes the coupling was realized by ap�plication of concurrent frequency modulating jitter to �rst Qeff partials and non�concurrentjitter to the others� We present an analytic formula that relates the higher order moments�actually the skewness and kurtosis� of the sound to the number of coupled harmonics� Theclassi�cation results locate the sounds in instrumental families of string� woodwind and brasssounds� This is seen graphically using a cumulant space representation where the groupsappear in di�erent �orbits�� The closer the �orbit� is to the center� the more Gaussian isthe signal� and the greater is the number of non�concurrently modulated harmonics that donot contribute to the moments and draw such a signal towards Gaussianity�
Although we have used a stochastic version of pulse train� the above considerations arenot limited to symmetrical� pulse�train�like signals� Actually� any combinations of sine andcosine functions with equal amplitudes are appropriate for this kind of analysis� The reasonwe were looking at kurtosis was that for symmetrical signals� the third moment vanishes�and in real condition the harmonicity counts are better accomplished by looking at groups offour partials� or equivalently� at the fourth order moment� We also note that we are dealingwith stationary sounds only and neglect any non�stationary or transitory phenomena thatcould not be considered microscopic stationary �uctuations at the sustained portion of asound�
����� Musical Signi�cance
This study� as we have seen� focused on a speci�c phenomenon that contributes to timbre�The timbre� although extremely complex from the acoustic viewpoint� is perceived by thelistener as an inseparable event� Nevertheless� one can detect some microscopic occurenceseven within the timbre� and their ampli�cation will produce a border area between timbre�with a de�ned pitch� and noise and a border between timbre and texture� General verbalcharacterizations of sounds such as �focused�� �synthetic� versus �di�used�� �chorused��etc� are caused by the very same random �uctuations at the microscopic level� A moreprecise formulation of the phenomenon places it on the axis between concurrence and non�concurrence with respect to the random deviations in the frequencies of the harmonics�The principles behind this phenomenon � border areas� concurrence and non�concurrence�fusion segregation� determinism and uncertainty � are at the basis of musical activity on all
��

of its stages and in all levels of the musical material� even in the characteristics of musicalstyle� This research thus shows that the same principles we utilize for musical analysis in the�macro� level can be found in the �micro�� Putting this into a broad perspective one couldstate that the goals of this work are reciprocal� the abovementioned basic principles helpus understand the hidden microscopic phenomena� and on the other hand� the research intothese phenomena sheds a new light on the principles� Moreover� this reciprocal relationshipis important for musical creation todays� when we have placed emphasis on the momentaryevents related to timbre and texture instead of the interval parameter and its derived schemesthat ruled musical organization in tonal music�
Concurrence �Non�Concurrence
This term refers to the relationship among units and parameters� For instance� perfectconcurrence between parameters of pitch and intensity occurs when both change at the sametime and with similar trends �such as ascent in pitch concurrent with increase in loudness��Non�concurrence has numerous revelations � it increases the complexity and the uncertaintyand even creates tension� as such it becomes an essential parameter in the rules of musicalorganization and characterization of style� �Some of the rules of Palestrina counterpoint referto the prevention �Cohen ��������� of non�concurrence and this accords with the stylisticideal of the era� On the other hand� in Bach�s music we �nd revelation of non�concurrencesof many types��
Here we have addressed concurrence and non�concurrence among partials with respectto their de�ections in frequency�
The Border between Intervals Texture and Timbre�
In contrast to timbre� and especially in contrast to the interval� the research on texture isscarce� although many contemporary composers refer to it �Cohen � Dubnov ���������� Intonal music texture appears mainly as an aid that may support or contradict the intervalorganization� while today it has an existence of its own� Actually� most notation systemsthese days refer to textural phenomena� Without going into the details of texture classi��cation we shell note that the main di�erence between texture and timbre is that texture isseparable and usually relates to time scales that are larger than those of timbre� Timbrecan be identi�ed for durations of less than � msec�� during which it remains inseparable tothe listener� In comparison� texture must contain some sort of separability in the variousdimensions � time� frequency or intensity� In extreme cases in which we can no longer sepa�rate the simultaneous occurrences into its components� the texture becomes timbre� In theopposite case� too� when we sense the changes that occur in timbre� timbre becomes closer totexture� There exists then a grey area in the border between texture and timbre� and thereis a similar border area between pitch �interval� and texture� This applies to wide rangeof other musical phenomena such as nuances of intonation �Cohen ���������� �articulatory
��

ornamentations� in non�western music and random modulations in electronic music �Tenneyand Polansky ���������
��
Part IV
Extentions
��

Chapter �
Non Instrumental Sounds
The method of decorrelation and the higher order cumulants of the residual signal seemto be applicable for representing sounds other than musical instruments� In the case of�stationary� complex sounds� such as many natural and industrial sounds� the perceivedsound quality could be described verbally as texture � an acoustic phenomenon that holds acertain characteristic variability to its contents� Naturally� sound features such as spectralenvelope must play an important role in the description of these sounds as well� Nevertheless�these spectral features are insu�cient since they do not account for much of the intrinsicvariability present in the sound�
In this part of the study we shall address this problem of sound texture representation andanalysis� by adapting the HOS feature extraction and analytical methods for this purpose�Remaining loyal to the source��lter model� we model the spectral envelope by a linear �lter�The description of the decorrelated or pre�whitened sound �i�e� the sound source�� is possible�from the statistical standpoint� only through better modeling of the white excitation signal�which shall be done again by means of higher order statistics�
Before proceeding with the mathematical investigation� we should note that the basicquestion of the existence of texture in sound remains open� from the psychoacoustical stand�point� to a great extent� Whether or not there exists a �preattentive auditory system�that� although lacking the ability to process complex sounds on the cognitive level� stillhas the power to detect di�erences in �textural� features� remains to be examined by otherresearchers�
�� Bispectral Analysis
For the sound�texture signals� we investigated �� recordings of sounds such as people talkingin a room� engine noises of various kinds� recordings of factory sounds� etc� The sounds wereobtained from a Signal Processing Information Base �SPIB� at http� spib�rice�edu �
��

Below we show the bispectral amplitudes of several types of signals� These �gures visuallydemonstrate the bispectral signatures for the following sounds� recordings of a people talking�babble�� �crashing� factory noise �fac�� and a rather �smooth� buccaneer engine noise�buc���
−0.5 −0.4 −0.3 −0.2 −0.1 0 0.1 0.2 0.3 0.4−0.5
−0.4
−0.3
−0.2
−0.1
0
0.1
0.2
0.3
0.4
"Babble" (people talking) residual bispectrum
f1
f2
−0.5 −0.4 −0.3 −0.2 −0.1 0 0.1 0.2 0.3 0.4−0.5
−0.4
−0.3
−0.2
−0.1
0
0.1
0.2
0.3
0.4
Factory noise (fac2) residual bispectrum
f1
f2
−0.5 −0.4 −0.3 −0.2 −0.1 0 0.1 0.2 0.3 0.4−0.5
−0.4
−0.3
−0.2
−0.1
0
0.1
0.2
0.3
0.4
Buccaneer jet (buc1) residual bispectrum
f1
f2
−0.5 −0.4 −0.3 −0.2 −0.1 0 0.1 0.2 0.3 0.4−0.5
−0.4
−0.3
−0.2
−0.1
0
0.1
0.2
0.3
0.4
Tank engine (m109) residual bispectrum
f1
f2
Figure ���� Bispectral amplitudes for people talking� car production factory noise� buccaneerengine and m�� tank sounds �left to right��
One can see that the bispectral amplitudes of the signals vary signi�cantly� The cumulantspace representation places pulse�like� �gagged� or �rough� sounds� such as talking voices�babble�� machinery crashes �fac�� fac� � factory noises� and noisy engines �m��� dops �destroyer operations room recording� higher in the moments space �i�e� they have highermoments�� while the �smoothly� running engines are near the origin� and thus closer to aGaussian model�
As can be seen from �gure ���� the bispectral signatures vary signi�cantly for the di�erentsounds� The feature of the volume under the bispectral graph� which equals the skewness ofthe residual signal in the time domain� is still signi�cant� as can be seen from �gure ���� but
�

−1 −0.8 −0.6 −0.4 −0.2 0 0.2 0.4 0.6 0.8 1−1
0
1
2
3
4
5
6
babb
dops
fac1
fac2
m109
Skewness
Ku
rto
sis
−3
−0.1 −0.08−0.06−0.04−0.02 0 0.02 0.04 0.06 0.08 0.1
−0.25
−0.2
−0.15
−0.1
−0.05
0
0.05
0.1
0.15
0.2
0.25
buc1
buc2
deng f_16 hfch
leop
Skewness
Ku
rto
sis−
3Zoom In
Figure ���� Location of sounds in the �rd and �th normalized moments plane� The value �is subtracted from the kurtosis so that the origin would correspond to a perfect Gaussiansignal� Sounds with many random transitory elements are on the perimeter� Smooth soundsare in the center�
it is hardly su�cient for a detailed description of these sounds� By looking at the bispectralsignatures it is clear that much structure exists in the decorrelated �residual� signals� Sincethe bispectrum is not constant� it is clear that these signals are non�linear�� and thus theycannot be modeled by a non�Gaussian noise passing through a linear �lter� Below we shalltry to present a simple model with some non�linear control of the signal properties� whichmay account for the appearance of bispectral structure�
�� �Granular� Signal Model
In order to account for the HOS properties of the decorrelated texture signals and gain someintuition into the sound�generating mechanism� a model for an excitation signal is needed�Although we cannot provide a complete model here� we discuss some possible mechanismsfor production of random sound textures and interpret the results based on this model�
One of the most appealing models for random sound texture synthesis is the granularsynthesis method� A grain of sound is a brief acoustical event of time order of severalmilliseconds� which is near the threshold of human auditory perception� To create a complexsound� thousand of grains are combined� We should note that this method is closely linkedto time�frequency sound representation schemes such as the wavelet or short time Fouriertransform� which provide a local representation by means of waveforms or grains multipliedby coe�cients that are independent of one another� Actually� such a broad de�nition ofgranular synthesis covers a very signi�cant class of musical and speech sounds� such as thesource��lter model� The Formant Synthesis method� which uses a quasi�periodic signal as the
�See section ��� for a discussion of tests of non�linearity and their relationship to the bispectra of theresidual�
��

excitation of a time�varying linear �lter that shapes the spectral envelope of sound� can beseen at times as a variant of granular synthesis and it is often regarded as Pitch synchronousgranular synthesis �De Polli � Piccialli� ����� �Bennett � Rodet� ���� When the appearanceof the grains is asynchronous� i�e� the various grains appear randomly in time� many auditoryattributes such as pitch or a precept of a well de�ned timbre are lost� and we basically get asound cloud made up of thousands of elementary grains scattered about the frequency�timespace� Although asynchronous granular synthesis has received much attention in computermusic synthesis applications� little analytic work has been done so far �Roads ��� �����
Below we apply a simple asynchronous model for the description of sound textures� Thesound signal is modeled by a sum of time functions �granules� hk�t�
x�t� �Xk
Xi
hk�t� tk�i� �����
with �� �� �� tk���� tk��� tk��� tk��� �� �� �� being poisson distributed times of appearances of the k�thgranule� This process canalso be viewed as a sum of outputs of a �lter bank triggered byseveral poisson processes xk�t� �
Pi hk�t � tk�i�� Without loss of generality let us assume
that all poisson processes have the same average lag time E�ti�� � ti� � �
For each �lter �granule�� the power spectrum and bispectrum are given by �Nikias �Raghuveer ��������
Sk��� ��
jHk���j
� �����
Bk���� ��� ��
Hk����Hk����H
�k ��� � ���
If the granules have a band limited frequency response� one might end up with a situationwhere Hk����Hk����H�
k ��� � ��� is practically zero for all ���� ���� This occurs when theHk��� has a �nite support �$��$�� of less then an octave� since if
Hk��� � for � � $� and � � $� �����
then�� � �� � $� and �� � �� � $� iff $� � �$� �����
We call such granules �bispectrally null�� Assuming that our granules are indeed bispec�trally null� and that the excitation processes ftkg are statistically independent� the resultingspectrum of the process x�t� is the sum of the spectra Sk��� with zero bispectrum�
Now let us consider a slightly di�erent situation where the same process excites several�lters hk� hl� hm� which in other words amounts to synchronous appearance in time of theirrespective granules� When the granules are �harmonically related�� i�e� their frequencysupports approximately obey the relationship $k�� � $l�� � $m�� and $k�� � $l�� � $m��� we
�

have
g�t� �Xi
hk�t� ti�hl�t� ti�hm�t� ti� �����
G��� � Hk��� �Hl��� �Hm��
Sg��� ��
jG���j� � Sk��� � Sl��� � Sm���
Bg ��
G����G����G
���� � ��� ��
Hk����Hl����H
�m��� � ���
We would like to note that the requirement for suboctave �lters is interesting becausethis condition is widely obeyed in auditory modeling� Thus we may conclude that in soundswhich can be e�ectively created represented by combinations of suboctave granules� theexistence of synchronous groups of harmonically related granules causes bispectral peaks toappear� The amplitude of these peaks depends on the amplitudes of the particular granules�In order to give the bispectral plane a meaning of synchronicity detector� proper powerspectrum normalization is required� Such normalization would allow interpretation of thepeaks as probabilities for synchronous appearances among granules� Decorrelating the signalby our AR spectral matching method only approximately accomplishes this need� and bettermethods �such as wavelet transform� are required�
��

Chapter
Musical Examples of the
BorderState between Texture and
Timbre
In this chapter we attempt to understand the manifestations and signi�cance of texture incontrast to other parameters� bearing in mind gestalt principles and the stylistic ideal � thatvaries from culture to culture and from era to era� This statement raises numerous questions�especially because of the tremendous variety of forms texture can take� Texture was generallyattributed to pitch�related factors within the tonal system� and its classi�cation was based onthe number of parts or strata and the interactions between them� monophonic� homophonic�polyphonic� or heterophonic texture� These terms have been expanded to apply to pitchphenomena in atonal and serial music �Boulez ������ and even to encompass treatment ofother parameters in addition to intervals ��sound texture� as opposed to �harmonic texture�based on the interval system �Goldstein ��������� �Lansky ��������� Most research ontexture as we understand it has focused on twentieth�century music� in which it plays animportant role in the organization of the piece� Very little direct attention has been paidto texture in tonal music �Lorince ����� Ranter ��� Levy ����� Indirectly� however�the two �in our opinion� properties of texture � �register� and �contour�� sometimes called�design� �Rothgeb ���������� � have received more attention even in tonal music� Fewethnomusicological studies have been done on how texture characterizes a musical culture�Finally� there are studies dealing with the formulation of textural phenomena on the acousticlevel in electronic and computer music �Smalley �������� �Czink ��������� Nevertheless�no framework has been laid out for understanding texture from all these standpoints� Thuscertain questions arise�
�Stylistic ideal is characterized� in our opinion� mainly by four variables� � � connection�lack of connectionwith the outside world� ��� expression of calmness vs� excitement� ��� focusing on the moment vs� the overallstructure� ��� clear or blurred units and directionality
��

� Is it at all possible to come up with a suitable de�nition of texture that would encom�pass all the manifestations alluded to here�
� Can one speak of gestalt phenomena� that is� the existence of units� in texture��
� What is the role of texture in relation to the other parameters in various styles�
� Is texture of signi�cance for the stylistic ideal� including in music that focuses on themoment�
� What tools are needed to analyze textural phenomena�
Here we shall attempt to give general answers to the �rst four questions� which have todo with the characterization and signi�cance of texture� We will set up a general frameworkfor discussing texture and its signi�cance�
�� General Characterization of Textural Phenomena
����� Texture and its Relationship to Other Parameters Di�erence and Similarity and Borderline States
Just as the most general de�nition of timbre is based on negation of the other parameters�here� too� we shall de�ne texture as a principle of organization that is not derived fromlearned schemes� In the most general sense we can de�ne texture as a way of distributingthe frequencies that represent speci�c or unde�ned pitches in the space of frequency� duration�and intensity� This de�nition also holds true for timbre� but texture is divisible and refers tolonger durations than does timbre�� A simultaneously played chord possesses both timbreproperties �such as major minor� and texture properties� and we can �nd border areasbetween the two� These result in special cases when we sense the changes that occur inthe timbre or� due to psychoacoustical constraints� we do not separate the texture� Thustexture can be regarded as an expansion of timbre� and� vice versa� timbre can be viewed asa borderline case of texture� with a grey area between them�
Formally� one could de�ne texture as the distribution P ���� � � $� where $ is an eventspace� The events are various musical parameters �pitch� duration� intensity� and etc�� onthe lowest level� or operations acting on the parameters on a higher level� In the second case
�The existence of units is� of course� a necessary condition for musical organization� In this context weshould mention the opinion that texture cannot exist independently �Levy ���� p� ��������
�Timbre is de�ned for a duration of approximately �� milliseconds and is indivisible when we hear it�despite its extreme complexity� Texture� on the other hand� requires some separability along the frequencyor time axis� a single�note event has no texture�
��

texture is the principle of selection among operations or �grammatical� rules that belong toschemes�
Texture� as we de�ne it� can be viewed as a superparameter that is related to variouscombinations of other parameters� In the most general sense� textural phenomena are famil�iar to us from nature as psychoacoustic factors that evoke various emotional associations�Another property of texture is that it is not well de�ned quantitatively� In most styles priorto the twentieth century� the parameters �intervals� rhythms� and meters� are not only de��ned quantitatively but are also subject to systems of learned schemes that serve as buildingblocks for the musical organization of the particular style�
Di�erence in learned schemes refers to quantitative di�erence �for example� the majorscale di�ers from the minor scale in the sizes of three intervals�� whereas in texture theimportant factor is qualitative relationship rather than the quantitative ones� for instancethe direction of change and not the exact magnitude of the change� We have termed such arelationship a type�� We can measure the di�erence similarity by using probability separa�bility measures D�P�� P��� which measure the �distance� between distribution functions P�
and P�� Such measures are widely used in the pattern recognition literature and we will notdiscuss them here�
Thus� in �stylistic music� there are two kinds of information� one having to do withlearned schemes and the other with textural information� Their relationship is one of thecharacteristics of the style� As in the relationship between timbre and texture� there are alsoborderline states between texture and intervals and between texture and rhythm� These arethe situations in which minor or rapid changes occur in pitch or duration and psychoacousticconstraints prevent clear identi�cation of the pitches� the intervals� or the rhythm� Situationsin which intervals turn into texture are intentional in many non�western musical cultures� aswell as in contemporary music �Figure ����
The types of events� whose distribution creates texture� may be classi�ed according toseparability and de�nabilty of pitch� Interestingly� one can characterize these types accordingto computer sound synthesis and algorithmic composition methods �
� White noise� This is a perceptually inseparable sound unde�ned with respect to allaspects� The methods for its production are by various random number generators�
� Continuous sounds composed of segments that have continuous spectra with a sensationof pitch that is not well de�ned� such as �fricatives� in speech� These are still on thetimbre side of the border� With the computer they are produced by �ltering the whiteinput noise�
� Sounds that are composed of discrete set of frequencies such as idiophonic instruments
�Type relations can appear in many forms� For example a metric type is poetic meter� which� unlikemusical meter� is not well de�ned quantitatively� Type of intonation exists in the scale skeleton of theArab singing practice�
��

with continuous sound whose timbre gradually changes�� These �complex� sounds arean example of the borderline case with timbre� Such sounds� characterized by inhar�monic spectrum� are easily simulated by an FM synthesis method� The separability issensed due to the lack of a harmonic relationship between the partials�
� Timbres with well de�ned pitch� When parts of the sound envelope are relativelylong �especially during the attack phase�� as in the case of art singing� the ear sensesthe changes and we approach the border between timbre and texture� Interestingly�even in this inseparable timbre we can still classify according to the �concurrence non�concurrence� of its overtones� The non�concurrent case is the texture within timbre�There are various methods for syntheszing pitched sounds� and the sense of texture isachieved by applying a random �uctuation to the harmonics��
� In the case of very complex interval constructions� as we �nd� for example� in the musicof Ligeti� we arrive at a borderline between the interval and texture �typical of muchof modern music��� In computer music� many of the algorithmic composition methodsare actually concerned with production of textures� A list of parameters organized ina series� as a set or a pitch class� often serves as the only predetermined scheme� whilethe methods of selection from this list determine the texture�
Legend: − bell sound − sung note − piano note − grey area
��
��
Divisibility Non Divisibility
IntervalRythm
Texture
Timbre
������������������������������
������
Figure ��� The grey area between interval�texture and texture�timbre and some examplesof timbres in the borderline between texture and timbre�
�Note that in ancient China when one spoke of the meaning of a single note� one was referring to thecontinuous idiophonic sound�
�Applying a random modulation to the frequencies of the sinusoidal components in an additive synthesismethod� or randomizing the input pulses in granular synthesis� creates smooth transitions between pitch� texture � noise with increasing the amount of randomness�
�These textures can turn into noise in some limiting cases or transform into a well de�ned pitch in others�
��

The contribution of texture to the static and dynamic poles
One of the characteristics of a piece of music is its attitude to the time axis� which extendsbetween two poles� one representing the sense of ��ow� and directionality that accompaniesa series of musical events� the other representing the sense of focus on the present mo�ment� Various musical aspects related to these poles have been given various names� verti�cal horizontal �Grove ������� inside time outside of time and space time �Czink ���������material structure �Cage ���������� local global� momentariness overall directionality andcomplexity �Cohen ��������� Here we shall call this pair �static dynamic�� In the real world�of course� one cannot appear without the other� but the relations between them vary enor�mously� re�ecting one of the important characteristics of the stylistic ideal�� With regardto the di�erent possibilities for simple or complex organization� in the short or long term�the most prominent representative of the static pole is timbre� whereas the most prominentrepresentative of the dynamic pole is the interval �under certain conditions�� Particularlynoteworthy is the contribution of the borderline states between texture and the other pa�rameters to the static pole� Texture can be placed between timbre and intervals in terms ofthe static dynamic and other aspects� as we shall see below�
Interval’s Organization
Timbre Texture
��������������
Static Dynamic
QuantitativePrecision
Timbre Interval
Texture
Separability
Complexity
Simplicity
Organization of:isolated multipleevent combinations
Interval
Timbre
Figure ��� Comparison of the three parameters from various aspects�
Classi�cation of textures and textural units
Three main factors may produce units� ��� a scheme or gestalt principle that fuses a collectionof events into a unit� ��� a repetition of the collection A� A� A� ��� a substantial change fromthe surroundings� The learned schemes serve as a unit�forming factor on the various levels�With respect to the texture� too� as we shall see� there are some �natural� schemes thatcombine to form a single unit �factor ��� but here the important distinctions between unitsare achieved by di�erent kinds of texture �factor ��� Here we shall try to classify texture
�This importance has even been stated explicitly both in non�western cultures �e�g�� Chou ����� �� andby twentieth�century composers� We should also note that many twentieth�century compositions are based�consciously or otherwise� on the compositional principles of non�western music �Chou ����� ���
��

according to four overall frameworks� The �rst is derived from the fact that the texture mayappear with or without the constraints of learned schemes �especially interval�based tonalschemes�� The second is the appearance of texture in �pure� states or in various borderlinestates� The third is based on segregation� primarily into horizontal layers along the pitchaxis� and the fourth is segregation into units along the time axis� Thus� texture may appearin a single layer or in many� without change along the time axis or with a great deal ofchange producing numerous units of varying degrees of de�nability� Below we describe thefour frameworks for classifying texture�
Connection�lack of connection to a learned scheme with concurrence or non�concurrence
Texture can refer to the distribution of discrete� well di�erentiated elements �pitches� in�tervals� timbres� or intensities� or to continua of these elements with distinct directions ofvariation� In the �rst case� in addition to textural information� information is obtained fromthe distinct elements �intervals� chords� rhythms� and so on�� in extreme cases of learnedschemes� this information is extremely well de�ned� In this case� every learned scheme maybe realized in a variety of textures� and the texture may be concurrent or non�concurrentwith the learned schemes� In a situation of concurrence� textural changes follow changes inthe learned schemes� thereby highlighting the structure based on the schemes� In a situationof non�concurrence the texture may blur the structure� In the other extreme case �very com�mon in the twentieth century�� the texture is not only unconnected to learned schemes butmay be realized in a variety of intervals or durations while retaining the type as expressedin its speci�c notation� The relationship between texture and learned schemes with respectto their role and importance di�ers from style to style� as we shall see below�
Borderline states
As mentioned above� for each of the two cases described above �connection and lack ofconnection to learned schemes� there are borderline states due to psychoacoustic constraints�which set thresholds for our ability to make distinctions�� In the �rst case� where texturerefers to discrete elements� there are many degrees of borderline situations� In the secondcase the borderline situation is when one cannot detect the magnitude and direction ofchange and can only discern the existence of randomness and distinctions between di�erentkinds of randomness� In the most general terms we will distinguish between relatively stablesituations and the various borderline situations�
Ranges of occurrence
These may be related to various parameters that can be arranged on a scale� tempo� pitch�and intensity� The classi�cation is done in accordance with the absolute range and the degree
��

of scatter� described in terms of the three main sizes� low� medium� and high� In some casesthe medium size is a normative optimum� Such a classi�cation system is commonly used invarious cultures for tempo� tessitura� degree of melismatism� and so on� For example� thechants of Tibetan monks have a one�part layer �monophony� with extremely low scatter inthe low range� In Palestrina�s polyphonic music� all the indices � the scatter and absoluterange of each part and between the parts � are �medium�� A focus on the optimum asopposed to the extremes re�ects the stylistic ideal�
Curves of change along the time axis
So far we have de�ned stable texture primitives and used probability functions to describethem� Gradual changes in texture could be described as slow �modulation� acting on theparameters of the probability function� In general there are six types of curves in the variousparameters� level� zigzag� ascending� descending� convex� and concave� with concurrence ornon�concurrence between parameters� As we shall see� these types of curves are signi�cantin an interesting way�
�� The �at curve �successive repetitions�This includes various numbers of repetitions� with various degrees of precision� of unitsof various sizes� It may serve as a background for emphasizing events at another level�to create tension due to uncertainty of continuation� or to increase the clear direc�tionality by a single repetition �two appearances�� Hence it is not therefore surprisingthat the rules of Palestrina counterpoint prohibit various kinds of repetitions� whereasmultiple repetitions of small units are extremely common in Baroque music� and thesymmetrical periodic phrases �one repetition�� are so typical of the Classical period�The �n schemeThis scheme is an expansion of the simple symmetry obtained by a single repetition�two occurrences�� In the Classical period� symmetry� which is considered to expressmaximum clarity� generally includes a series of repetitions� with each one containingits predecessor within it� such that a �n series is obtained�
� � � � � � � � � �� ����
This series can also be obtained from an ongoing division of the whole into two parts�The �n scheme was common already in Far Eastern �especially ancient Chinese� music�and currently appears mainly in gamelan ��orchestral�� music in Indonesia� in which�n can reach ��� beats� however it is rare in many monophonic musics� Note that therepetitions are not exact� they may include various transformations�TransformationAnother expansion of the single repetition is obtained from the phenomenon of trans�formation� which is a repetition with the performance of an operation� Interestingly�the operations can be grouped into �ve categories whose principles govern general cog�
�

nitive operations �we shall note only a few operations� contrast� which has a widevariety of manifestations �Cohen ��������� expansion and contraction with regards tovarious parameters� and shifts in cyclical systems along the time or pitch axis�� Wecan thus see transformations as principles of textural organization that link units�Because of space limits� we will not elaborate about the rest of curves of change� exceptfor one extremely important curve � the convex curve�
�� The convex curveIn the extreme case� this refers to a gradual rise to a single peak� followed by a gradualdecline� It allows for maximum predictability about the next step in the process� andit helps consolidate the units� This curve is prevalent in folk tunes all over the world�except for melodies meant to awaken speci�c emotions �such as dirges� �Nettle ������In art music� it is prominent in the vocal works of Palestrina� whose ideal� as statedabove� was tranquility� Here the convexity is expressed on various levels� At the levelof the phrase� it appears in the parameters of pitch and duration �see Figure ���� Theconvex curve makes a covert appearance in the soprano line in most works of westerntonal music �according to Schenkerian analysis��The convex curve and the �n scheme are both common schemes that represent types ofgestalt rules that contribute to the formation of a single directional unit� A comparisonof the two is quite interesting� Both are e�cient� extreme methods of achieving pre�dictability� but one �convexity� represents a minimumof divisibility and levels� whereasthe other permits a maximum of divisibility and formation of levels in musical orga�nization� Unlike the convex curve� the concave curve does not allow prediction of thedirection of the process� because the curve has no upper limit� Concave curves appearin styles that seek to arouse emotions� for example� at the immediate level of perfor�mance of Rig Veda chants� which are full of an explicit tension� and at various levelsin Romantic music� On the other hand� the rules of Palestrina counterpoint forbid it�Without getting into details� one can see that the convex �n curves correspond tostable self similar �modulation� functions� Of course all six curves may appear withconcurrence or non�concurrence between them� in one stratum or in several strata� ina large or small range of variation within each stratum and between the strata� and indi�erent locations within the absolute ranges of the various parameters�
�� Further remarks
In light of the above discussion� we would like to add three summarizing remarks concerningthe contribution of texture to three topics that have come up repeatedly in various contextsthroughout the paper� a comparison of music and speech� symmetry� non�concurrence anduncertainty in music�
��

����� Analogy to Semantic�Prosodic Layers in Speech
Comparisons and analogies between music and speech have been o�ered from various per�spectives� Here we wish to propose an additional analogy� between two complementary pairs�learned schemes texture in music and the lexical stratum prosody in speech� The stratumof prosody� or �the musical factors in speech� �called �intonation� in linguistics �Bolinger�������� has two functions� ��� to represent the laws of syntax� ��� to convey the speaker�sattitude to the listener and to what he or she is saying that is� to convey the emotions�Texture in music has the same two functions� ��� �syntactic� � to clarify or blur the musicalstructure based on learned schemes� ��� to convey emotions� that is� to characterize themusical expression in terms of extra�musical factors� In terms of the acoustical appearance�the �musical factors in speech� are represented by the texture� that is� the distribution ofloudness� duration� and pitch �without reference to precise quantitative magnitudes�� Ex�citement and calm are� of course� expressed by the same means as texture� Like the texturein music that may be in concurrence or non�concurrence with the learned schemes� the mu�sical factors in speech may be correlated or non�correlated with the message contained inthe lexical stratum �try saying �I�d like to see you� twice � the �rst time emphasizing thesemantic content� the second time emphasizing the opposite meaning� in other words� �goto hell���� They can also appear as an independent message� as in various exclamations� �Instudies on bird calls in various situations� we have compared their calls to musical factors inspeech� although they have no lexical stratum� Interestingly enough� the universal principlesof tension and relaxation that determine the laws of Palestrina counterpoint �and not onlythem� of course� also apply to bird calls �Cohen ����������
����� Symmetry
One frequently hears today of principles of symmetry that are common to inanimate objectsin nature� living organisms� and even works of art �note the existence of an internationalassociation for symmetry in nature and in man�made products�� Without going into detail�we shall merely state that in music symmetry is expressed both in schemes and in opera�tions �Cohen ��������� In the present paper we have stressed the two symmetrical texturalschemes� the convex curve and �n which represent gestalt principles that fuse a collection ofevents into a unit� Similarly� we mentioned �natural� operations that� by their very nature�represent symmetrical organization in the texture� Finally� there is the common symmetricalorganization expressed as ABA� Grouping together all the di�erent phenomena mentionedhere� some of them extremely hidden� within the category of �symmetry� is a relatively newidea that reinforces the signi�cance of forms of textural organization in music from anotherdirection�

����� Nonconcurrence and Uncertainty
We have seen that texture� by its very nature� entails some freedom and uncertainty regardingthe quantitative expression of the range of its appearance and of its curves of change� Theuncertainty is increased by non�concurrence between the curves of change of the variouslayers and even of the di�erent parameters �for example� an ascent in pitch as intensitydecreases�� Non�concurrence can occur in an enormous variety of ways� and even within thetimbre of a single note �concurrence or non�concurrence between the phases of the overtones��and it contributes to complexity and to various kinds of uncertainty that come up in mostmusical analyses�
�� Summary
To sum up� we have attempted to clarify textural phenomena� taking into account gestaltprinciples and the stylistic ideal� Below is a brief summary of our answers to the questionsraised�
�� In the broadest sense� the de�nition of texture is suitable for describing the manymusical phenomena that we presented in the paper� In special cases� such as in borderareas and due to psychoacoustic constraints� some of the de�nitions are irrelevant�
�� There are indeed texture�based gestalt phenomena� First of all� we should note thatthe gestalt phenomena that have known formulations �Lerdahl and Jackendo� ����and have been corroborated empirically �Deutsch ��� are textural ones �according toour de�nition here�� Furthermore� one should bear in mind the symmetrical schemes�including the convex curve and �n�
�� Texture is a �superparameter� that has three types of relationships with the parametersand their learned schemes� it can support the scheme�based organization� it can blurit� and it has border areas� Moreover� it can serve as a major factor in organizationand can be realized in various manners�
�� Texture� by de�nition� unlike learned schemes� has inherent extra�musical meaningsand cannot create complex long�term organization on its own� Texture �as opposed tothe learned schemes� contributes directly to states of calm excitement� certainty uncertainty�and types of momentary overall and clear suspensive directionality� All of these arecharacteristics of the stylistic ideal� In the di�erent styles one �chooses�� whetherconsciously or unconsciously� to emphasize learned schemes or textural organization�types of learned schemes� and types of textural schemes� including kinds of uncertainty�which form part of the de�nition of the style�
�

The research naturally calls for more investigation� but already at this stage we think thattexture should be regarded as an indispensible factor in music analysis of all styles�
�

Bibliography
��� S�Adler� The Study of Orchestration� Norton and Co�� ����
��� R�Ashley� A Knowledge�Based approach to Assistance in Timbral Design� in Proceedingsof the International Computer Music Conference�S an Francisco� ����
��� J� Beauchamp� Brass�Tone Synthesis by Spectrum Evolution Matching with NonlinearFunctions� Computer Music Journal � ��� � ������ ����
��� A�H� Benade� Fundamentals of Musical Acoustics� Oxford University Press� New York������
��� G�Bennett� X�Rodet� Synthesis of the Singing Voice� in Current Directinos in ComputerMusic Research� MIT Press� ����
��� W�J�Bernard� Inaudible Structures� Audible Music� Ligetis Problem� and his Solution�Musical Analysis �� ������� ����
��� W�Berry� Structural Functions in Music� Chap� �� Englewood Cli�s� �����
�� D�Bolinger��ed��� Intonation� Selected Readings� Penguin Education� �����
��� P�Boulez�Timbre and Composition Timbre and Language� Contemporary Music Re�view ��� �������� ����
��� � P�Boulez� Boulez on Music Today� London� Faber and Faber� �����
���� A�S� Bregman� Auditory Scene Analysis� The perceptual organization of sound�� Cam�bridge� Massachusetts� MIT Press� ����
���� D�R� Brillinger� An Introduction to Polyspectra� Ann� Math� Stat�� Vol� ��� ���������������
���� J�Cage� Rhythm etc� in G� Kepes� ed�� Module Symmetry Proportion� London� StudioVista� pp� ������� �����
���� J�Cage�Silence� Cambridge� Mass� MIT Press� �����
�

���� R�Cann� An Analysis�Synthesis Tutorial� Computer Music Journal ���������� ��������������� and ����� ������ ���
���� Ch�Chou� Asian Music and Western Composition� In Dictionary of �th Century Music�ed� J� Vinton� ������ ����
���� Ch�Chou� Single Tone as Musical Entities� An Approach to Structured Deviations inTonal Characteristics� American Society of University Composers� Proceedings �� ���
��� R�Cogan� New Images of Musical Sound� Cambridge� Massachusetts� Harvard UniversityPress� ����
���� D�Cohen� Directionality and Complexity in Music� Musikometrica� vol� �� ����� inpress��
��� D�Cohen� Hierarchical Levels in the Musical Raw Material� Proceedings of the HISMConference� ���
���� � D�Cohen� The Performance Practice of the Rig Veda� A Musical Expression of ExcitedSpeech� Yuval �� �������� ����
���� � D�Cohen� Birdcalls and the Rules of Palestrina Counterpoint� Towards the Discoveryof Universal Qualities in Vocal Expression� Israel Studies in Musicology �� ������� ����
���� � D�Cohen� Palestrina Counterpoint � A Musical Expression of Unexcited Speech� Journalof Music Theory ��� ������ �����
���� � D�Cohen� Patterns and Frameworks of Intonation� Journal of Music Theory �� �������� �����
���� D�Cohen� S�Dubnov� Texutre Units in Music that Focuses on the Moment� Joint Inter�national Conference on Systematic Musicology� pp� ������ Bruge� �����
���� D� Cohen� R� Katz� Some timbre characteristics of the singing of a number of ethnicgroups in Israel� Proceedings of the ��th Congress of the Jewish Study� Division D�� VolII� ������� ����
���� D�Cohen� J� Mendel� H� Pratt� and A� Barneah� Response to Intervals as Revealed byBrainwave Measurement and Verbal Means� The Journal of New Music Research ���������� �����
��� L� Cohen� Time�Frequency Distributions � A Review� Proceedings of the IEEE� Vol� ���No� �� July ����
���� M� Clynes �ed��� Music Mind and Brain� New�York� Plenum Press� ����
�

��� T�M�Cover� J�A�Thomas� Elements of Information Theory� Wiley Series in Telecommu�nications� �����
���� A�Czink�� The Morphology of Musical Sound� preprint� ���
���� G�De Poli� A�Piccialli� Pitch�Synchronous Granular Synthesis� in Representations ofMusical Signals� MIT Press� �����
���� D� Deutsch �ed��� The Psychology of Music� London� Academic Press� ���
���� D�Deutsch� J� Feroe� The Inteval of Pitch Sequences in Tonal Music� PsychologicalReview � ������� ���
���� R�De Vore� Silence and its Uses in Western Music� lecture and abstract in the Proceed�ings of the Second International Conference on Music Perception and Cognition ��� LosAngeles� California� UCLA� ����
���� W�J�Dowling� Scale and Contour� Two Components of a Theory of Memory forMelodies� Psychological Review � �������� ���
���� S�Dubnov� N�Tishby� D�Cohen� Bispectrum of musical sounds� an auditory perspective�X Colloquim on Musical Informatics� Milano� Italy� �����
��� S�Dubnov� N�Tishby� Spectral Estimation using Higher Order Statistics� Proceedings ofthe ��th International Conference on Pattern Recognition� Jerusalem� Israel� �����
���� S�Dubnov� N�Tishby� D�Cohen� Hearing beyond the spectrum� Journal of New MusicResearch� Vol� ��� No� �� �����
��� S�Dubnov� N�Tishby� D�Cohen� Investigation of Frequency Jitter E�ect on Higher OrderMoments of Musical Sounds with Applications to Synthesis and Classi�cation� in theProceedings of the Interntational Computer Music Conference� Hong�Kong� �����
���� J�D� Dudley� W�J� Strong� A Computer Study of the E�ects of Harmonicity in a BrassWind Instrument� Impedance Curve� Impulse Responce� and Mouthpiece Pressure witha Hypothetical Periodic Input�
���� J�Edworthy� Melodic Contour and Musical Structure� In� Musical Structure and Cogni�tion� eds� P� Howell� J� Cross and R� West� Academic Press� ���
���� R�� Erickson� Sound Structure in Music� Berkely� CA� University of California Press�
���� R�Ethington� B�Punch� SeaWave� A System for Musical Timbre Description� ComputerMusic Journal� Volume �� Number �� �����
���� O�D�Faugeras� Decorrelation Mathods of Feature Extraction� IEEE Transactions on Pat�tern Analysis and Machine Intelligence� Vol� �� No��� July ���
�

���� I�Fonagy� K� Magdis� Emotional Patterns in Intonation and Music�� In Intonation� Se�lected Readings� ed� D� Bolinger� Penguin Education� ����
���� J�R�Fonollosa� C�L�Nikias� Wigner Higher Order Moment Spectra� De�nition� Proper�ties� Computation and Application to Transient Signal Analysis� IEEE Transactions onSignal Processing� �������������� January �����
��� A�Gabrielsson� The Multi�faceted Character of Music Experiment� lecture at the SecondInternational Conference on Music Perception and cognition �abstract in the ConferenceProceedings�� p� �� �����
���� K�Geiringer� Musical Instruments� Oxford University Press� ����
��� M�Goldstein� Sound Texture� In Dictionary of �th Century Music� ed� J� Vinton� �������� ����
���� A�H�Gray� J�D�Markel� Distance Measures for Speech Processing� IEEE Transactions onAcoustics� Speech� and Signal Processing� vol� ��� No��� October ����
���� R�Gray� A�Buzo� A�H�Gray� Y�Matsuyama� Distortion Measures for Speech Processing�IEEE Transactions on Acoustics� Speech� and Signal Processing� vol� �� No��� August���
���� R�Gray� A�H�Gray� G�Rebolledo� J�E�Shore� Rate�Distortion Speech Coding with a Mini�mum Discrimination Information Distrtion Measure� IEEE Transactions on InformationTheory� �� ���� November ����
���� M�A� Gerzon� Non�Linear Models for Auditory Perception� ����� unpublished�
���� J�M� Grey An Exploration of Musical Timbre� Ph�D� dissertation� Stanford University�CCRMA Report no� STAN�M��� Stanford� CA�� �����
���� M� Grigoriu� Applied Non�Gaussian Processes� Prentice�Hall� �����
���� D�Halperin� Contributions to a Morphology of Ambrosian Chant� Ph�D� dissertation�Tel Aviv University� ����
��� W�M�Hartman� Pitch and Integration of Tones� Proceedings of the Second InternationalConference on Music Perception and Cognition� ��� Los Angeles� California� UCLA������
���� K� Haselmann� W� Munk� G� MacDonald� Bispectra of Ocean Waves� in Proceedingsof the Symposium on Time Series Analysis� Brown University� June ������ ���� �ed�Rosenblatt�� New�York� Wiley� �����
��� M�Hicks� Interval and Form in Ligetis Continuum and Coule� Perspectives of NewMusic ��� �������� �����
�
���� M�J� Hinich� Testing for Gaussainity and Linearity of a Stationary Time Series� Journalof Time Series Analysis� Vol� �� No��� ����
���� ISSM��� Special session on Sound �timbre in European and non�European Music� ThirdInternational Symposium on Systematic Musicology� Wien� �����
���� K��Saariaho� �Timbre and Harmony�� Contemporary Music Review� ������� ����
���� D�H�Keefe� B�Laden� Correlation dimension of woodwind multiphonic tones� J�AcousticSoc�Am� � ���� �����
���� R�A�Kendall� E�C�Carterette� Verbal Attributes of Simultaneous Wind Insrument Tim�bres� Part I � II � Music Perception� ����� ����
���� H�C�Koch� Introductory Essay on Composition� The Mechanical Rules of Melody� Sec�tions � and � �transl� from the German by N� K� Baker�� New Haven� Conn�� YaleUniversity Press� ��� ������
���� J�D�Kramer� The Time of Music� New York� Schirmer� ��
��� S�Kullback� Information Theory and Statistics� New�York� Dover� ����
���� P�Lansky� Compositional Applications of Linear Predictive Coding� Current Directionsin Computer Music Research� MIT Press� ����
��� P�Lansky� Texture� in Dictionary of �th Century Music� ed� J� Vinton� �������� ����
���� H�Leichtentritt� Musical Form� Cambridge� Mass�� Harvard University Press� �����
���� D� A�Lentz� The Gamelan Music of Java and Bali� Londong� University of NebraskaPress� �����
���� F� Lerdahl� Timbral Hierarchies� Contemporary Music Review �� ������� ����
���� R� Lerdahl� R� S� Jackendo�� A Generative Theory of Tonal Music� Cambridge� Mass��MIT Press� ���
���� J�Levy� Texture as a Sign in Class and Early Romantic Music Jams� No� �� ��� ����������
���� P�Liberman� Intonation� Perception and Language� In� The MIT Press Research Mono�graph� no� �� Cambridge� Mass� ����
���� G�Ligeti� States� Events� Transformation� Perspectives of New Music ��� �������� ����
��� Y�O� Lo� Towards a Theory of Timbre� Stanford University� CCRMA Report no� STAN�M��� Stanford� CA�� ����
�

���� A�Lohmann and B� Wirnitzer� Triple Correlations� Proceedings of the IEEE� Vol� ���No� �� July ����
�� A�Lomax� Universals in Song� The World of Music� No� � �� ��� �������� �����
��� Lomax� ���� Folk Song Style and Culture� Washington� American Association for theAdvancement of Science�
��� F�E�Lorince� Jr� A Study of Musical Texture in Relation to Sonata�Form as evidenced inSelected Keyboard Sonatas from C�P�E� Bach through Beethoven� Ph�D� diss�� EastmanSchool of Music� Univ� of Rochester� �����
��� M�E�McIntyre� R�T�Schumacher and J�Woodhouse� Apperiodicity in bowed string mo�tion� Acustica ��� ������ ����
��� J�M� Mendel� Tutorial on Higher�Order Statistics �Spectra in Signal Processing andSystem Theory� Proceedings of the IEEE� Vol� ��� No� �� July ����
��� J�Mendel� C�L� Nikias� A�Swami� Higher�Order Spectral Analysis Toolbox� MATLAB�MathWorks Inc� ����
��� S� McAdams� Spectral Fusion� Spectral parsing and the Formation of Auditory Images�Ph�D� dissertation� Stanford University� CCRMA Report no� STAN�M���� Stanford�CA�� ����
��� S�McAdams� Rhythmic Repetition and Metricality do not in�uence Perceptual Integra�tion of Tone Sequences� Proceedings of the Second International Conference on MusicPerception and Cognition� ��� Los Angeles� California� UCLA� �����
�� S� McAdams� A�Bregman� Hearing Musical Streams� Computer Music Journal � ��� ������� �� ��� �����
��� L�Marks� Unity of Senses� New York� Academic Press� ����
��� M�Mersenne� Harmonic Universal� the books on Instruments� ����� Hague� MartinusNigho�� english translation of the french edition� �����
���� C�L� Nikias� J�M� Mendel� Signal Processing with Higher�Order Spectra� IEEE SignalProcessing Magazine� July ����
���� C�L� Nikias� M�R� Raghuveer� Bispectrum Estimation� A Digital Signal ProcessingFramework� Proceedings of the IEEE� Vol� ��� No� �� July ���
���� Nitschke� G� �Ma� the Japanese Sense of Place in Old and New Architecture and Plan�ning�� Architectural Design ������ �������� �����

���� Y� Oura� Constructing a Representation of a Melody� Transforming Melodic Segmentsinto Reduced Pitch Patterns Operated on by Melodies� Music Perception ����� �������������
���� K�P�Paliwal� M�Sondhi� ICASSP ����� �Toronto�� Paper S���� vol �� pp ��������
���� E�Patrick� A Percepual Representation of Sound for Signal Separation� Proceedings ofthe Second International Conference on Music Perception and Cognition� ��� Los An�geles� California� UCLA� �����
���� R�B�Pilgrim� Interval �ma is Space and Time� Foundation for a Religio�Aestheticparadigm in Japan� History of Religions ������ ������� �����
��� W�Piston� Orchestration� Gollancz Ltd�� ����
���� I�Pitas� A�N�Venetsanopoulos� Nonlinear Digital Filters� Kluwer Academic Publishers�����
��� M�B�Priestley� Nn�Linear and Non�Stationary Time Series Analysis� Academic Press�����
���� L�R�Rabiner� R�W�Schafer� Digital Processing of Speech Signals� Prentice�Hall� ����
���� M�R� Raghuveer� C�L� Nikias� Bispectrum Estimation� A Parametric Approach� IEEETransactions on ASSP� Vol� ��� No� �� October ���
���� A�Rakowski� Intonation Variants of Musical Intervals in Isolation and in Musical Con�text� Psychology of Music �� ����� ����
���� A�Rakowski� Some Phonological Universals in Music and Language� In� Musikomet�rica� �� Quantitative Linguistics� ed� M� G� Broda� ������� ���
���� J�P�Rameau� Traite de lharmonie� Paris� Ballard� �����
���� L�G�Ratner� Texture� a Rhetorical Element in Beethovens Quartets� Israel Studies inMusicology �� ������ ���
���� B�Reiprich� Transformation of Coloration and Density in Gyorgy Ligetis Lontano��Perspectives of New Music ��� ������ ���
��� C� Roads� A Tutorial on Nonlinear Distortion or Waveshaping Synthesis� ComputerMusic Journal � ��� � ������ ����
���� C�Roads� Asynchronous Granular Synthesis� in Representations of Musical Signals�MIT Press� �����
���� K�Rose� E�Gurewitz� G�C�Fox� A deterministic annealing approach to clustering� Tech�Rep� C�P���� California Institute of Technology� ����
�

����� C�Rosen� The Classical Style� New York� W� W� Norton and Company� �����
����� B�Rosner� L� Meyer�Melodic Processes and the Perception of Music� in The Psychologyof Music� ed� D� Deutsch� New York� Academic Press� pp� �������� ����
����� J�Rothgeb� Design as a Key to Structure in Tonal Music� in Readings in SchenkerAnalysis and Other Approaches� ed� M� Yeston� New Haven and London� Yale UniversityPress� pp� ������ �����
����� C�Sachs� The history of musical intstruments� New York� W�W�Norton� ���
����� G�J�Sandell� Concurrent Timbres in Orchestration� A Perceptual Study of FactorsDetermining �Blend�� Ph�D� dissertation� Evanston� Illinois� �����
����� Sauveur� Overtones and the construction of organ stops� Fontenelles report in theHistoire de le Academie des Sciences� ����
����� H�Scherchen� The nature of Music� Henry Regenry Comp�� ���� translated from Ger�man �����
���� R�T�Schumacher� Analysis of aperiodicities in nearly periodiv waveforms� Journal ofthe Acoustical Society of America� �� ���� January �����
����� V�Scolnic� Pitch Organization in Aleatoric Counterpoint in Lutoslawskis Music of theSixties� Ph�D� disseration� Hebrew University of Jerusalem� �����
���� M� Schetzen� Nonlinear System Modelling Based on Wiener Theory� Proceedings ofthe IEEE� Vol� ��� No� ��� July ����
����� G�L�Sicuranza� Quadratic Filters for Signal Processing� Proceedings of IEEE������������� August �����
����� M�Slaney� R�F�Lyon� On the importance of time � a temporal representation of sound�in Visual Representations of Speech Signals� John Wiley � Sons� �����
����� A�W� Slawson� Sound Color� Berkely� CA� University of California Press� ����
����� � J�A�Sloboda� Music structure and emotional response� Proceedings of the First Inter�national Conference on Music Perception and Cognition� ������� Kyoto� ����
����� K�Stockhausen� How Time Passes����� Die Reih �English edition� �� ���� �����
����� � J�Sundberg� Speech� Song and Emotion� In Music� Mind and Brain� ed� M� Clynes�������� ����
����� A� S� Tanguiane� Arti�cial Perceprion and Music Recognition� Lecture Notes in Arti��cial Intelligence ���� Springer�Verlag� ����� and references therein�
�

���� H�Taube� An Object�Oriented Representation for Musical Pattern De�nition� Journalof New Music Research ��� �������� �����
����� J�Tenney� L�Polansky� Temporal Gestalt Perception in Music� Journal of Music Theory��� ������ ���
���� Y� Tikochinsky� N� Tishby� R�D� Levine� Alternative Approaches to Maximum EntropyInference� Phys� Rev� A ������ ����
����� M�K�Tsatsanis� Object and Texture Classi�cation Using Higher Order Statistics� IEEETransactions on Pattern Analysis and Machine Intelligence� Vol� ��� No��� July �����
����� A�Tversky� Features of Similarity� Psychological Review� vol � � �������� �����
����� E�Varese� � The Liberation of Sound� Perspectives of New Music� ������ �����
����� P�Vettori� Fractional ARIMA Modeling of Microvariations in Additive Synthesis� Pro�ceedings of the XI Colloquium on Musical Informatics� Bologna� �����
����� J�Vinton� �ed�� Dictionary of Twentieth�CenturyMusic� London� Thames and Hudson������
����� D�L� Wessel� Timbre Space as a Musical Control Structure� Computer Music Journal� ��� � ������ �����
����� F�Winkel�Music� Sound and Sensation� New�York� Dover� ����� pp� �� � ��� ��� � ���
��