Embed Size (px)
Citation preview

1
Polysaccharide/Surfactant complexes at the air-
water interface – Effect of the charge density on
interfacial and foaming behaviors
VERSION FINALE ENVOYEE PAR M AXELOS 15 Nov 2008
Ropers M.H1.*, Novales B.
1, Boué F.
2 and Axelos M.A.V
1.
1 UR1268 Biopolymères Interactions Assemblages, INRA, F-44300 Nantes
2 Laboratoire Léon Brillouin, UMR 12 CNRS/CEA-IRAMIS, 91191 Gif-sur-Yvette Cedex,
France.
AUTHOR EMAIL ADDRESS: [email protected]
CORRESPONDING AUTHOR FOOTNOTE: Marie-Hélène Ropers , INRA, BP 71627, F-
44316 Nantes Cedex 3, France. phone 0033 2 40 67 51 89, fax 0033 2 40 67 50 84

2
ABSTRACT
The binding of a cationic surfactant (hexadecyltrimethylammonium bromide, CTAB) to a
negatively charged natural polysaccharide (pectin) at air-solution interfaces, was investigated
on single interfaces and in foams, versus the linear charge densities of the polysaccharide.
Beside classical methods to investigate polymer/surfactant systems, we applied, for the first
time concerning these systems, the analogy between the small angle neutron scattering by
foams and the neutron reflectivity of films to measure in situ film thicknesses of foams.
CTAB/pectin foam films are much thicker than that of the pure surfactant foam film but
similar for highly and lowly charged pectin/CTAB systems despite the difference in structure
of complexes at interfaces. The improvement of the foam properties of CTAB bound to pectin
is shown to be directly related to the formation of pectin-CTAB complexes at the air-water
interface. However, in opposition to surface activity, there is no specific behavior for the
highly charged pectin: foam properties depend mainly upon the bulk charge concentration,
while the interfacial behavior is mainly governed by the charge density of pectin. For the
highly charged pectin, specific cooperative effects between neighboring charged sites along
the chain are thought to be involved in the higher surface activity of pectin/CTAB complexes.
A more general behavior can be obtained at lower charge density either by using a lowly
charged pectin or by neutralizing the highly charged pectin in decreasing pH. .
KEYWORDS
pectin, surfactant, binding, foam, interface, Small Angle Neutron Scattering, Neutron
Reflectivity

3
1. Introduction
Polymer/surfactant assembly has received a constant interest over several decades since
polymers may modify the properties of surfactant solutions1,2,3,4
. Especially oppositely
charged polymer/surfactant systems were widely studied as they strongly bind to each other
and offer drastic changes in the properties of surfactant in the bulk and at interfaces1. One
class of surfactants, quaternary ammonium salts, has been particularly considered in the
polymer/surfactant studies to analyse the changes versus the effect of the alkyl chain length5-
13, the polymer structure which includes chain flexibility, charge density and
hydrophobicity13-23
, the role of multivalent cations24
and the ionic strength25-28
. Among the
negatively charged polymers that bind to this class of surfactants, pectin is a natural
polysaccharide extracted from citrus and apple fruits at the industrial scale. Its structure is
mainly constituted of galacturonic acid residues with some neutral sugars. It is schematically
represented as a single molecule with long and smooth regions interspersed with short hairy
zones (Figure 1). Around 100 (14)--linked-D-galacturonic acid residues constitute the
smooth linear regions and a backbone of alternating galacturonic acid and rhamnose residues
with frequent substitution of arabinose and galactose constitute the hairy regions29, 30
. The
percentage of galacturonic residues (COOH) esterified with methanol (COOCH3), defines the
degree of methylation (DM = [COOH]/([COOCH3+COOH])) and the degree of charge ((100
– DM)/100). Pectin is widely used as gelling agent because of its interactions with cations
especially with calcium for food applications31
. The interest in such natural polymers is of
importance in terms of stability of dispersed systems32
. Pectin, as well as pectate, the fully de-
esterified form of pectin, is also able to bind to cationic surfactants through its carboxylic
groups11, 12, 33, 34
but no binding is noticed at a degree of charge as low as 10%35
. Coming now
to foam properties, while some polysaccharides such as xanthan alter the foaming
behaviour18
, some other polysaccharides enhance the stability of foams36, 37
similarly to
4
synthetic polymers2,38
. Those effects may originate first from the gelling and thickening
effects that increase the viscosity of the solution and decrease drainage velocity and gas
permeability of the thin films2,39
, second from the complexation of polysaccharides with
amphiphilic species at the interfaces that increase the surface viscosity2,39
and third from the
intrinsic properties of the polymer like the rigidity of the polymer backbone2,18
. From a more
general point view, as well documented in the case of synthetic polymers, the factors
controlling the foam film stability are different in two different foam stages. In the foam
formation stage, the surface rheological parameters as well as the density of the adsorbed
layer play an essential role2,39
. In the foam ageing stage, surfactant adsorption, surface
tension, surfactant chain length and packing, capillary pressures in the Plateau border as well
as stratifications properties of polyelectrolyte chains in the film bulk are claimed to govern the
stability of the foam40-43
. But more recently, the inhibition of the foam drainage has also been
related to the rheology of the interface through the identification of a gel-like layer of
polymer-surfactant aggregates44
. Thus, the role of polysaccharides and more generally of
polysaccharide/surfactant aggregates on the foam stability must be clarified. In this paper, we
study the interfacial properties at the air-water interface of complexes formed between a
quaternary ammonium salt and semi flexible negatively charged polysaccharides (pectin) with
different charge densities and compare the foam properties of these complexes.
HGA
RG
( )100( )100
HGA HGA
RG
( )100( )100
HGA

5
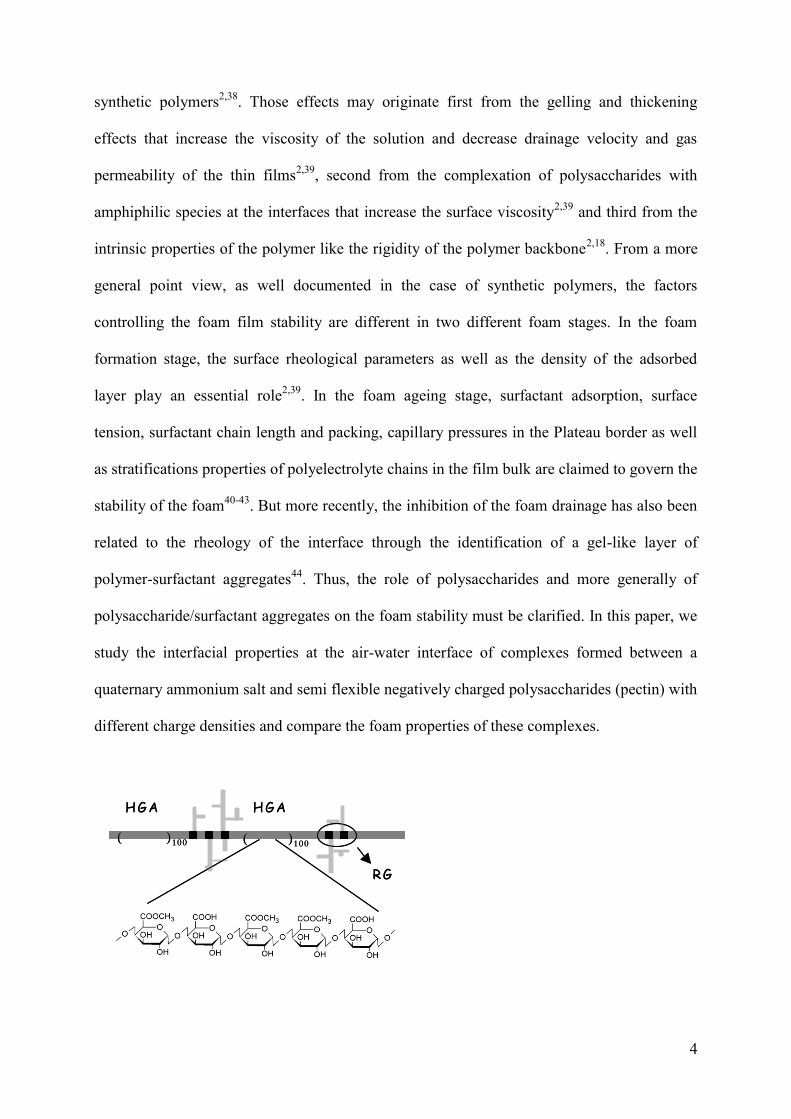
Figure 1. Schematic structure of the pectin backbone with two main polysaccharide domains
homogalacturonan (HGA, dark grey bar) and rhamnogalacturonan (RG, black and dark grey
zones) with branched chains of neutral residues of arabinose and galactose (light grey).
2. Materials and methods
2.1. Materials
Pectins provided by Copenhagen Pectin (Denmark) under the names Genupectin X-6011,
X-6014 and X-6012 carry degrees of methylation of 37%, 52% and 77% corresponding to the
linear charge densities of 1.01, 0.77 and 0.37 respectively (calculated according to literature
data31
). In the following, we will refer to the names P37, P52 and P77. These samples of
pectin derive from the same (citrus) mother pectin through a basic de-esterification so that the
charge is statistically distributed and they possess an identical backbone. They were purified
to extract traces of divalent cations by following a procedure described by Dronnet et al.45
.
The free galacturonic acid content, evaluated from titration methods, amounts to 2.40, 1.88
and 0.88 mM per gram of dried pectin for P37, P52 and P77 respectively. Pectin powders
were dissolved in the appropriate solution (ionic strength 25mM, water purified from a
Millipore Milli-Q water system) at pH 5 under magnetic stirring overnight at 4°C. After
solubilization, the pH was adjusted to 6.5 (except for other conditions specified in the text).
The intrinsic viscosity of these pectin samples were found to be around 0.3 L/g. In our
conditions of concentration, well below the semi-dilute regime, this value corresponds to
viscosities of the pectin solutions close to that of water. Cetyltrimethylammonium bromide
(CTAB) is a quaternary amine salt provided from Fluka and used without further purification.
6
It is fully soluble at 30 °C and has a critical micellar concentration of 0.18 mM as determined
by isothermal titration calorimetry in 25mM of NaCl.
2.2. Solubility diagrams
The solubility diagrams of pectin-CTAB systems were established by varying the surfactant
concentration between 10-7
and 10-3
M at a fixed galacturonic concentration (0.24mM) for
each pectin in the following conditions: neutral pH (6.5), ionic strength (25 mM NaCl) and
temperature 30°C. The weight concentrations of pectin that correspond to the galacturonic
concentration of 0.24 mM are 0.1 g/L for P37, 0.13 g/L for P52 and 0.27 g/L for P77. Pectin
solutions and CTAB solutions were mixed in equal volumes and stored at 30 °C for 7 days
until phase identification. Phases were identified by visual inspection. We distinguished
monophasic and biphasic phases and among the last ones, between turbid and precipitated
phases.
2.3. Surface tension measurements
The interfacial properties of CTAB/pectin solutions were analyzed by measuring the
surface tension of CTAB/pectin solutions at the air/water interface at 30 °C on a rising drop
tensiometer (IT Concept, Longessaigne, France). Solutions were prepared in the same manner
as for the phase diagram determination. The surface tension was measured through the shape
analysis of an air bubble (6 μL) formed at the tip of a stainless steel curved needle dipped in
the solution46
. The complete adsorption of the surface active species and their rearrangement
at the interface took at least 2 hours. Each point of the curve corresponds to the surface
tension obtained after 2.5 hours, yielding a very weak residual variation (d/dt < 10-2

7
mN/min). The surface viscoelastic properties were determined by assessing the response of
the interfacial tension to a sinusoidal variation of the bubble area (characterized by the
pulsation ω and a constant variation of 1 mm2 corresponding to the percentage of deformation
~7%). These experiments were performed after the adsorption of all surface actives species
i.e. when the surface tension had reached its equilibrium value. In such experiments, the
viscoelastic modulus ε is a complex number, with the real part that corresponds to the elastic
contribution accounting for the recoverable energy stored in the interface and the imaginary
part that reflects the loss of energy through any relaxation process occurring at or near the
interface.
2.4 Foaming properties
Foaming experiments were conducted on a “Foamscan” apparatus developed by IT Concept
(Longessaigne, FRANCE). The formation of the foam, the stability and the drainage of liquid
from the foam were followed by conductivity and optical measurements. After calibration of
the conductivity electrodes, 8 mL of solution in the sample cell was sparged with gaseous N2
through a porous glass filter at a flow rate of 25 mL/min. The gas flow was stopped after
reaching a final foam volume of 35 mL. The foamability corresponds to the time needed to
reach 35 mL of foam volume. After stopping the bubbling, the free drainage of the foam was
followed for 1200 s. Several parameters were automatically recorded by the “Foamscan”
analysing software. The drainage of liquid from the foam was followed via conductivity
measurements at different heights of the foam column. A pair of electrodes at the bottom of
the column was used for measuring the quantity of liquid that was not in the foam, while the
volume of liquid in the foam was measured by conductimetry in three pairs of electrodes
located along the glass column. The volume of foam was determined by use of a CCD camera

8
(Sony Exwave HAD). The liquid stability (LS) is the time needed to decrease by 50% the
initial liquid volume in the foam. This parameter may be taken to characterise the drainage
providing the starting volumes of foams are identical.
2.5 SANS neutron scattering on foam samples
Solutions of CTAB-pectin complexes were prepared at a concentration of 10-3
M in
surfactant and at a galacturonic concentration of 0.24 mM, i.e. 0.1 g/L for P37 and 0.27 g/L
for P77. The solvent was heavy water D2O (Eurisotop, France) in order to obtain a maximal
contrast, defined as ΔNb = Nb(i)-Nb(j) where Nb is the scattering length density and i and j
correspond to two different compounds (Figure 2). The low concentration of pectin (0.27 g/L
at the most) does not modify significantly the scattering length density of the solution in D2O
compared to the one of D2O, so that the latter can be considered as the scattering length
density of the aqueous part comprised between the two interfacial films in foams. The
intensity varying as the squares of the contrast (ΔNb2), the interface CTAB/D2O interface is
the major interface contributing to the intensity.
-1
0
1
2
3
4
5
6
7
H2O
Nb
, 1
0-1
0c
m-2
Z-profile of the foam film
A ir
C TA BC TA B
A ir
D2O

9
Figure 2. Profile of the scattering length density across a foam film of CTAB versus the
solvent (H2O or D2O). Scattering length density of CTAB was taken from the work of
Taylor6.
SANS foam measurements were performed at the Saclay Orphée reactor on the PACE
spectrometer with detector cells forming circular rings. Two different configurations were
used to cover a wide range of scattering vector modulii q, defined by q = (4πsinθ)/λ, where 2θ
is the scattering angle and λ the wavelength. In the high-q configuration (0.0277 < q < 0.285
Å-1
), collimating was achieved with a first diaphragm of 22 mm located 2.5 m before the
sample and a second diaphragm of 7 mm located just before the sample. The wavelength was
7 Å and the distance between the sample and the detector was 1 m. In the low-q configuration
(0.004 Å-1
< q < 0.0435 Å-1
), collimating was achieved with a first diaphragm of 12 mm
situated 5 m before the sample and a second diaphragm of 7 mm just before the sample (here
the foam column, see below). The wavelength was 10 Å and the sample-detector distance was
of 4.5 m.
The foams were prepared in a foam cell, or column, very similar to that described in Axelos
et al.47
. The lower part of the cell is constituted of a quartz tube, which can be diametrally
crossed by the neutron beam on a wide range of height. It is similar to the glass cylinder of the
Foamscan apparatus (paragraph 2.4), with a larger diameter in order to increase the intensity
arising from a higher number of foam films met by the beam (30 mm wide against 19 mm in
Foamscan). The bubbling was adjusted to get a foam height of 10 cm. As soon as it was
stopped, the neutron scattering intensity was recorded on the free-draining foam every 600 s
for CTAB foams and 230 s for CTAB/pectin foams. In our conditions, the estimated number
of films crossed by the beam is around 25 and even below 10 for some very dry foams. In

10
parallel with the measurements on foams, a fraction of each sample solution was poured into a
Hellma cell in order to measure the intensity scattered by the bulk solution.
Standard corrections for sample volume, neutron beam transmission, and incoherent
scattering due to protons or deuterons were applied. The scattering of the empty cylinder was
subtracted from the scattering of the cylinder filled with the foam and this difference was
divided by the scattering intensity of 1 mm of water. Data configuration were corrected from
the solvent contribution by subtracting a constant which takes into account the D2O
contribution and the incoherent scattering due to the protons of CTAB and Pectin. We used
the low q transmission data measured both in the foam and in the corresponding 2 mm CTAB
or CTAB/Pectin solutions to estimate the total thickness of the solution in the foam crossed
by the beam47
. For dry foams this thickness was found to be around 1.5 mm which
corresponds to a liquid fraction of about 0.05.
2.6 SANS data analysis
The analogy of SANS from a foam with multiwall reflectivity, and usual reflectivity by a
thin layer, has been formerly evoked47-49
. This new concept considers that a foam submitted to
an incident radiation beam is a collection of M mirrors reflecting part of this radiation. Each
mirror is one of the M foam cell walls. Here it is a neutron parallel beam (with an angular
collimation δθ), which hits each mirror indexed by the integer m with an incidence angle θm/2,
and is reflected at a “specular” angle δθ/2, so that the total deflection is a scattering angle θ =
θm. This is sketched in Figure 3.

11
Figure 3. Sketch of a foam produced by bubbling in a cell with incident and reflected beams
on some of the cell walls. is the angle between incident and reflected beam; is the
azimuthal angle (both shown here for the blue ray).
Several walls could give a reflection at the same angle θ, at different angles φ so that the
reflection spots are located on the same circle on the detector. Adding all contributions on all
cells of the multidetector corresponding to the same deflection angle θ, corresponds to a radial
average along this circle. This gives the scattered intensity for the corresponding scattering
vector of modulus q = (4π/λ)sin(θm/2), for the different values θm/2. The result is equivalent to
what obtained with a single mirror oriented at several angles θm. In practice, the observed
distribution of the θm values is continuous. This is due to the fact that each reflection spot is
actually spread into a “spike” of large angular width Δθm. This has been attributed to the fact
that foam cell walls are slightly bent47
as seen also on single films49
. If the effective incident
G as bubbling
Foam cell
Incident N eutron beam
R eflectivity on single foam film s
Intensity m ap
G as bubbling
Foam cell
Incident N eutron beam
R eflectivity on single foam film s
Intensity m ap

12
angle distribution is even wide and flat enough (this has to be kept in mind), the result is close
to a reflectivity curve obtained by rotating continuously a single mirror in front of the beam.
The question we address here is: what is this curve for such mirror, i.e. a cell wall, which
can be considered here as mostly constituted by a thin layer of water, with a thickness
between 10 nm and 50 nm? It is relatively easy to calculate such curve using simple
simulation software (available for example at www-llb.cea.fr). For a single dioptre, i.e. an
infinite layer of species A with interface with vacuum, the rate of reflected intensity R(q)
shows, as a function of or better of q, two zones: 1) Between 0 and qC, a “reflectivity
plateau”, for which R(q) = 1 ; the upper edge of the plateau, qC is the critical value; qc ~
(4πNb)1/2
where Nb is the scattering length density of the medium. This is a consequence of
Descartes-Snell laws: below an angle qC, there is no refracted beam, only a vanishing wave,
so all incoming intensity is reflected. 2) For q >qC, a fast decay reaching an asymptotic
variation q-4
(Fresnel law). Another consequence of Descartes-Snell laws: below an angle qC,
there is a refracted beam, so only a part of the beam is reflected.
When the layer thickness t becomes finite, fringes appear in the decaying part, with maxima
separated by a period Δq = 2nπ/t. This is not related to Descartes-Fresnel law, but to
interferences existing between the fractions of the beam reflected at each film-vacuum
interface. For large t values, this effect coexists with Descartes-Fresnel law, and the
reflectivity plateau is not modified, i.e. qC is the same. When the thickness decreases, fringes
are further apart from each other, and at the same time a new effect appears: the reflectivity
plateau progressively vanishes. This is because the evanescent wave reaches the other
interface, so a part of the beam is refracted. The first maximum tends asymptotically to q =
2π/t when the thickness t tends to zero.
These effects can be smoothed by the angular width of the beam, some uncertainty on the
thickness, etc. But they can be magnified graphically using a q4R(q) representation. In this
13
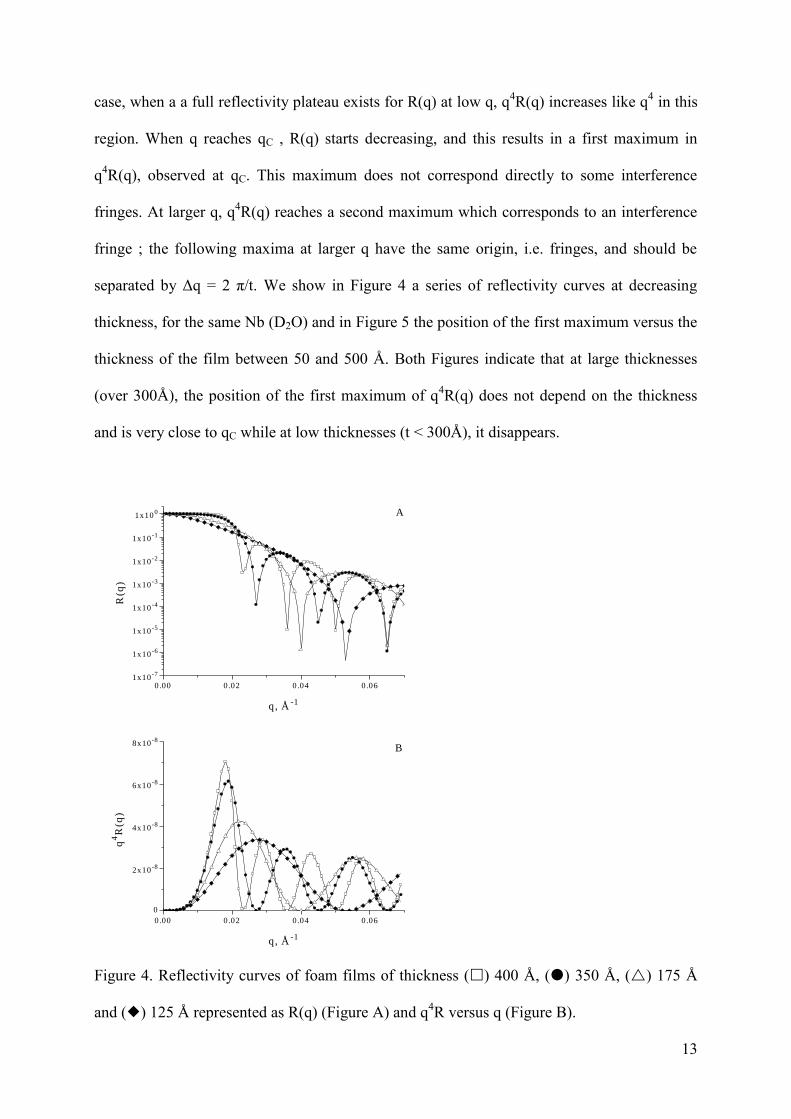
case, when a a full reflectivity plateau exists for R(q) at low q, q4R(q) increases like q
4 in this
region. When q reaches qC , R(q) starts decreasing, and this results in a first maximum in
q4R(q), observed at qC. This maximum does not correspond directly to some interference
fringes. At larger q, q4R(q) reaches a second maximum which corresponds to an interference
fringe ; the following maxima at larger q have the same origin, i.e. fringes, and should be
separated by Δq = 2 π/t. We show in Figure 4 a series of reflectivity curves at decreasing
thickness, for the same Nb (D2O) and in Figure 5 the position of the first maximum versus the
thickness of the film between 50 and 500 Å. Both Figures indicate that at large thicknesses
(over 300Å), the position of the first maximum of q4R(q) does not depend on the thickness
and is very close to qC while at low thicknesses (t < 300Å), it disappears.
0.00 0.02 0.04 0.061x10
-7
1x10⁻⁶
1x10⁻⁵
1x10⁻⁴
1x10⁻³
1x10⁻²
1x10⁻¹
1x100 A
R(q
)
q , Å-1
0.00 0.02 0.04 0.06
0
2x10⁻⁸
4x10⁻⁸
6x10⁻⁸
8x10⁻⁸
B
q4R
(q)
q , Å-1
Figure 4. Reflectivity curves of foam films of thickness () 400 Å, () 350 Å, () 175 Å
and () 125 Å represented as R(q) (Figure A) and q4R versus q (Figure B).

14
0 50 100 150 200 250 300 350 400 450 500
0.00
0.01
0.02
0.03
0.04
0.05
0.06
0.07
0.08
q1
ma
x,
Å-1
Film thickness, Å Figure 5. Values of the scattering wavevector q of the first maximum of the reflectivity curves
(shown as q4R(q)) as a function of the thickness of a single D2O film. The solid line refers to
the function 2π/t where t is the thickness of the film.
We have used in this paper the analogy between SANS by a foam with multiwall
reflectivity and reflectivity by a thin layer to analyse the SANS measurements on CTAB and
CTAB/Pectin foams, and to deduce the thickness of the films.
3. Results and Discussion
3.1. Solubility diagrams of CTAB/pectin assembly
The observations are summarised in Figure 6. At very dilute surfactant concentrations
(CTAB < 10-4
M), all mixtures are clear and transparent. Pectin-CTAB complexes are
completely soluble. As the surfactant concentration is increased, the phase behaviour differs
according to the degree of charge of pectin. In the P77/CTAB system, the solutions remain
clear and transparent on the whole range of concentration investigated. For the solutions
containing pectins P52 and P37, the solutions become turbid in a reduced concentration range
close to the charge neutralization point. This is usually attributed to the decrease in solubility

15
of the complex. For P52, as the concentration in surfactant is further increased, the solutions
become clear again. The resolubilisation of the complex is usually ascribed to the excess of
charge that accumulates on the complex. In the case of P37, the onset of precipitation occurs
just above the neutralization point and there is no resolubilisation.
P37 P52 P77
1E-7
1E-6
1E-5
1E-4
1E-3
0.01
[CT
AB
], M
Pectin Subphase
Figure 6. Solubility diagrams of pectin/CTAB complexes at 30°C. Empty squares represent
clear and transparent solutions, grey triangles correspond to turbid solutions and the plain
circles to precipitates. The pectin concentrations are 0.1, 0.13 and 0.27 g/L for P37, P52 and
P77 respectively. The total pectin charge concentration (0.24 mM in all cases) is negligible in
comparison with the charge concentration given by the salt (NaCl 25 mM).
3.3. Interfacial properties of CTAB/pectin complexes
3.3.1 Effect of DM
The formation of surface active macromolecular species was evidenced by measuring the
surface tension during spontaneous adsorption of pre-formed surfactant/pectin complexes.
The curves displaying the surface tension at equilibrium as a function of surfactant
concentration are shown in Figure 7.

16
Figure 7. Surface tension curves of CTAB () and CTAB/pectin solutions at 0.24 mM in
COO- for () P37 0.1 g/l, () P52 0.13 g/L and () P77 0.27 g/l. The dashed line
corresponds to the equivalent point of charge separating the domains where the surfactant
molecules (S+) or the pectin molecules (P
-) are the major part. The arrangement of the
polymer within the surfactant layers is unknown and the drawings are only indicative on the
adsorption behaviour (monolayer- or multilayer-like).
The surface tension values of CTAB solutions start to decrease at 2.5×10⁻⁶
M and the
micellar state is reached at 1.8×10⁻⁴
M, in accordance with isothermal titration calorimetry
measurements. Over these two decades, the surface tension decreases monotonously. The
presence of pectin has a drastic effect. Several key points must be noted.
(i) a more efficient lowering of surface tension is observed in the order P37>P52>P77.
(ii) CTAB/P37 solutions behave distinctly from CTAB/P52 and CTAB/P77: it shows a non
monotonous decrease of the surface tension with concentration, with a short plateau (here at
52 mN/m) similarly to the systems dodecylammonium chloride/τ-carrageenan15
and
dodecylammonium chloride/polystyrenesulfonate51
. By analogy with these previous results
from the literature data, we propose that the plateau at 52 mN/m corresponds to the onset of

17
micelle formation on the polymer (critical aggregation concentration, CAC). The fact that the
plateau does not exist for P52 and P77 can be directly related to their lower charge density.
(iii) above the equivalent point of charge (0.24 mM, where the charge brought by
surfactant, S+ become larger than the one brought by pectin, P
-), the surface tension curves
almost coincide. The excess monomers of surfactant molecules have come to interface and
constitute mainly the interfacial film. The onset of this plateau at around 38mN/m occurs at
increasing concentration in the order of DM, i.e., 1.5×10⁻⁵
M for P37, 3.5×10⁻⁵
M for P52 and
1×10⁻⁴
M for P77 while it starts at 1.8×10⁻⁴
M for pure CTAB.
Below the equivalent point of charge, between 70 and 52 mN/m, the surface tension curve
of CTAB/P37 solutions is shifted to approximately tenfold smaller surfactant concentrations
in comparison to the pure surfactant curve, while this factor is only 4 for CTAB/P52 and
CTAB/P77 solutions. The slopes of the three curves are however similar in this tension range.
The species located at the interface are thus presumably of the same type. According to the
review of Taylor et al. about polymer/surfactant assembly at interfaces, two kinds of
adsorption behaviour can be found in polymer/surfactant systems and reveal the types of
aggregates adsorbed at the interface3. These convenient schematic diagrams however apply
only for zero ionic strength. To take into account the addition of electrolyte and the fact that
our polymers are not fully charged, we refer to the case of C12TAB/NaPSS
(dodecyltrimethylammonium bromide and sodium polystyrenesulfonate)51
. In this case, the
addition of electrolyte (0.1 M NaBr) enlarges the concentration range over which the tension
varies. Moreover, the plateau associated to the onset of the micelle formation on the polymer
is less pronounced3, 51
. It is initially located at 45mN/m and goes up to around 51 mN/m.
The similarity of the curves for C12TAB/NaPSS system in the presence of electrolyte and
our CTAB/P37 system suggests that the aggregates are probably of the same type or result
from the same type of mechanism. In the lower surfactant concentration range (at
18
concentrations smaller than 2.5×10⁻⁶
M, surface tension value larger than the plateau), the
surface active species would be thus a monolayer of surfactant/polymer complexes (described
as Type 2 adsorption behavior by Taylor3). At higher concentrations (between 5×10
-6 and
2.5×10⁻⁵
M, surface tension value lower than the plateau), polymer/surfactant aggregates are
described at the interface as a multilayer complex (scheme in Figure 7) with an adsorbed
monolayer of surfactant and underneath a complex structure of surfactant molecules organised
in micelles or elongated micelles adsorbed with polymer to the underside of the monolayer
(named Type 1 adsorption behaviour by Taylor3, 51
). In this range, the slope is steeper
confirming the fact that the polymer/surfactant multilayer is more densely packed than the
monolayer surfactant/polymer complexes.
As concerns CTAB/P52 and CTAB/P77, the lack of CAC and the similarity of the slopes
until the free micellization in solution takes place, prove that the surface active aggregates are
surfactant/polymer complexes arranged in a monolayer. The disappearance of the
intermediate plateau at 52 mN/m with increasing DM has been also encountered for
C12TAB/PAMPS system (partially charged acrylamide polymer) and has been interpreted in
terms of low cooperativity between alkyl chains52
. Surfactant molecules bounded to the
polymer are too far from each other to be assembled into stable micelles wrapped by polymer.
3.3.2 Effect of the linear charge density
To confirm this interpretation, we compare in Figure 8 different systems where negative
charges of pectin are brought in solution either through weight concentration or by varying
the pH. The titration curve of P37 tells us that an equal COO- molarity is brought by: P37 at
0.1 g/L pH 4.2, P77 at 0.1 g/L pH 6.5, and P37 at 0.04 g/L pH 6.5. The first striking result is
that P37 at pH 6.5 at 0.04 g/L displays the same 52 mN/m tension plateau than at 0.1 g/L (the
width of the plateau is just reduced). On the contrary, the complexes formed with P37 at

19
acidic pH (4.2, 0.1 g/L) do not display any plateau and exhibit a surface activity close to the
P77 charge equivalent solution. So decreasing the charge by decreasing pH or by increasing
the methylation appears equivalent, in agreement with the fact that both acid-base dissociation
and methylation are statistical along the chain. We conclude that CTAB/P37 complexes at pH
4.2 form a monolayer at the air-water interface while at neutral pH they form either a
monolayer or multilayers according to the concentration range.
Figure 8. Surface tension curves of CTAB () and CTAB/pectin solutions with () P37 at
0.04 g/l and pH 6.5, () P37 at 0.1 g/l pH4.2 and () P77 at 0.1 g/l pH 6.5.
The degree of methylation (DM) has therefore a direct role in the surface activity of
pectin/surfactant complexes. The decrease of the concentration does not modify the
behaviour. But if we modify the distribution of charge on pectin by (statistical) protonation,
the surface-active behaviour changes. We assume that there exists a strong cooperativity
between surfactant molecules fixed on long segments of fully charged galacturonic residues.
The degree of charge of P37 (63%) enables the occurrence of enough long charged segments
that impact on the binding and the resulting assembly. As a consequence, the distinction
between highly methoxylated pectins (like P37) and lowly methoxylated pectins (like P52 and

20
P77), which is usually used for calcium binding31
, applies here for the complexation with
surfactants. The flexibility of the polymer is also a positive parameter that enables the
micellization of bound surfactant neighbours by the wrapping of the polymer.
3.3.3 Dilatational rheological experiments
Figure 9 shows the elastic modulus at equivalent charge concentrations, for two surface
tension values: 65 mN/m, from which we infer from the discussion above that the structure is
of the monolayer-type for all systems, and 47 mN/m, for which the monolayer is replaced by
a multilayer-type structure in the case of P37. It appears clearly on Figure 9 that pectin
strongly contributes to change the viscoelasticity of CTAB interfacial film.
Figure 9. Elastic modulus (in mN/m) of CTAB-pectin complexes adsorbed at the air-water
interface at equivalent bulk charge concentrations, at surface tension values of 65 mN/m (,
, ) and 47 mN/m (, ). Symbols are for (, ) CTAB-P37, (,) CTAB-P77 and
() CTAB.
At the surface tension 65 mN/m, both CTAB-pectin samples gives a flat response,
indicative of an elastic behaviour (“solid-like”), at least in the investigated frequency range,
while CTAB alone behaves like a liquid. Pectin is thus responsible for the connectivity along

21
the monolayer. The higher value of the modulus found for CTAB-P37 than for CTAB-P77
agrees with the previous idea that a higher surface charge density between P37 and CTAB at
the interface makes higher the cross-linking density, hence the connectivity. At the surface
tension 47 mN/m, moduli are lower than those obtained at 65 mN/m and both CTAB-pectin
samples exhibit a liquid-like behaviour, as indicated by the variation of the modulus curve
with frequency. Those results suggest that the layer of CTAB-pectin (monolayer or
multilayer-type) is less homogeneous. It may be regarded as patches with no connectivity
between them. In the case of P37, the change in elasticity from solid to liquid-like behaviour
may be related to the change in structure at interfaces, observed in Figure 7. The binding of
finite objects to the monolayer of CTAB mediated by pectin molecules results in the lost of
homogeneity and connectivity. In the peculiar case of P77, the change in elasticity from solid
to liquid-like behaviour is attributed to defects in the accumulation of the lowly charged
pectin molecules at the interface. Indeed, the orientation of charges carried by pectin toward
the film of CTAB is limited by the semi-flexibility of the pectin chain and the bulkiness of all
uncharged sites between two next nearest charged sites along the molecule. This induces the
formation of small domains of CTAB monolayers next to CTAB/P77 domains at the interface
(local phase separation).
3.4. Foaming properties of CTAB/pectin assembly
Let us first point out that pectin solutions do not foam: no foams were obtained for
concentrations as high as 10 g/L, which is around hundred times higher than the
concentrations investigated in this paper. As a consequence, all foaming properties will arise
from CTAB or CTAB/pectin complexes, and we will compare the two systems. In the case of
CTAB solutions(5 × 10⁻⁵
, 10-4
, 2.5 × 10⁻⁴
, 5 × 10⁻⁴
and 10-3
M), the initial volume of foam (35

22
mL) was reached in less than 70 seconds except for the lowest concentration where this time
is 87 seconds. At that concentration, the foam was not stable and disrupted in less than 5
minutes. The other foams were more stable with a final volume of 30 mL at the end of the
experiment (Figure 10). The liquid stability (LS) increased from 53 seconds to 88 seconds as
a function of CTAB concentration (Table 1). However, the general trend is that foams
produced from pure CTAB solutions are not very stable and characterized by a high speed of
drainage.
0 200 400 600 800 1000 120010
15
20
25
30
35
40
Fo
am
vo
lum
e, m
L
Time, s
CTAB (5×10⁻⁵M)/P37
CTAB (1×10⁻⁴M)/P37
CTAB (2.5×10⁻⁴M)/P37
CTAB (5×10⁻⁴M)/P37
CTAB (1×10⁻³M)/P37
CTAB (5×10⁻⁴M)
CTAB (1×10⁻³M)
Figure 10. Evolution of the foam volume for CTAB solutions and CTAB/P37 (0.1 g/L pH
6.5) mixtures at various CTAB concentrations ranging from 5×10⁻⁵
M to 10-3
M.
Concentration CTAB CTAB/P37
5×10⁻⁵
M 53 43
10-4
M 60 127
2.5×10⁻⁴
M 81 193
5×10⁻⁴
M 88 247
10-3
M 80 84
Table 1. Liquid stability (in seconds) for pure CTAB and CTAB/P37 mixtures as a function of
CTAB concentration.

23
In the presence of pectin, the foaming properties of CTAB are strongly modified (Figure
10). Only pectins of DM 37 and 77% were used, since P52 acts on surface tension similarly to
P77, as seen above. Let us first consider the case of P37 at pH 6.5 in the presence of
increasing CTAB concentrations.
3.4.1 Effects at variable CTAB contents
For a CTAB concentration of 5×10⁻⁵
M, the foamability is improved. While the foam from
pure CTAB solution disappears in a few minutes, the foam formed from CTAB/P37 solutions
at 5×10⁻⁵
M does not completely disrupt. At the end of the experiment, the foam is still visible
in the glass column; however it is constituted of quite larger bubbles. For larger CTAB
concentrations, from 10-4
to 5×10⁻⁴
M, the addition of P37 leads to the formation of very
stable foams with the same bubble size as for pure CTAB solutions. Moreover, the foam
volume remains constant (Figure 10) and the drainage is considerably slowed down (Table 1).
In this concentration range, the liquid stability is increased by a factor 2 to 3 in the presence of
P37. At larger CTAB concentrations (≥ 10-3
M), the stability decreases sharply down, back to
values comparable to pure CTAB ones: the foam volume (Figure 10) and liquid stability
values (Table 1) are indeed similar in the absence and in the presence of pectin. Pectin has no
effect on the foam properties. Note that at this concentration, the surfactant is in large excess
compared to the galacturonic content ([COO-] = 0.24 mM, [CTAB] = 1 mM, so S
+/P
- = 4).
One can thus reasonably assume that all CTAB/P37 aggregates have precipitated in this
concentration range; so CTAB imposes its foaming behaviour.
3.4.2 Effect of pectin charge: Equivalence of pH and weight concentration.
24
As the best foaming properties of CTAB/P37 mixtures were obtained at a CTAB
concentration of 5×10⁻⁴
M, all other foams produced from CTAB/Pectin solutions will be
mainly compared at this CTAB concentration. The concentration in pectin was adjusted in
order to compare systems possessing the same amount of charge in bulk, similarly to the
surface tension measurements. In practice, two ways were used to adjust P77 and P37
concentrations at the same bulk charge concentration: either by (i) decreasing the weight
concentration of P37, or (ii) by decreasing pH for P37. To meet these two conditions, (i)
CTAB/P37 mixtures at 0.1 g/L pH 6.5 and CTAB/P77 mixtures at 0.27 g/L pH 7 were
compared on one hand, and (ii) CTAB/P37 mixtures at 0.1 g/L pH 4.2 and CTAB/P77
mixtures at 0.1 g/L pH 7 were compared on the other hand.
Figure 11 shows that whatever the way to match the concentration of charge, we observe
that the volume of the foams and their liquid stability (Table 2) are very similar at equivalent
bulk concentrations of charge. The liquid volume fraction within the foams, shown in Figure
12, also displays equivalence between the two ways of matching the concentration of charge.
In the investigated concentration range 5×10⁻⁵
< [CTAB] < 10-3
M, the percentage of liquid
volume in the foam of both CTAB/P77 0.1 g/L and CTAB/P37 0.1 g/L evolves similarly. It
increases with increasing CTAB concentration up to 5×10⁻⁴
M, then decreases at higher
concentrations. At the same time, we see a shift in y-axis: we can assume that it reflects the
different concentrations of aggregates. Indeed, the decreasing bulk concentration of charge
(from DM 37 to 77 both at 0.1 g/L) decreases the concentration of CTAB/pectin complexes,
so it should decrease, by the way, their contribution to the foam stability and the water
retention within the foam.

25
0 200 400 600 800 1000 1200
10
15
20
25
30
35
40
Fo
am
vo
lum
e,
mL
T im e, s
Figure 11. Evolution of the foam volume of CTAB/Pectin foams for (□) P37 0.1 g/L pH 6.5,
(○) P77 0.27 g/L pH 6.5, (■) P37 0.1 g/L pH 4.2, (●) P77 0.1 g/l pH6.5 at a concentration in
CTAB of 5×10⁻⁴
M.
pH and Pectin
concentration Time (s)
P37 0.1 g/L pH 6.5 247
P77 0.27 g/L pH 6.5 223
P37 0.1 g/L pH 4.2 154
P77 0.1 g/L pH 6.5 183
Table 2. Liquid stability for CTAB/Pectin mixtures at a concentration in CTAB of 5×10⁻⁴ M
and in different pectin concentration and pH conditions.
5
10
15
20
25
30
35
40
45
2.5×10⁻⁴
5×10⁻⁴
10-310
-4
Pe
rce
nta
ge
of
liq
uid
vo
lum
e
C TA B concentration, M
5×10⁻⁵

26
Figure 12. Percentage of liquid volume in the foam of CTAB/Pectin mixtures for (□) P37 0.1
g/L pH 6.5, (○) P77 0.27 g/L pH 6.5, (■) P37 0.1 g/L pH 4.2 and (●) P77 0.1 g/l pH6.5,
observed 10 min after the end of foaming (compared to the liquid volume in the foam just
after the end of bubbling).
It appears clearly that points obtained at equivalent bulk charge concentrations are equal or
almost equal. The decrease in pH makes the foaming behaviour of CTAB/P37 solutions
similar to that of CTAB/P77 solutions at pH 6.5. This behaviour is in accordance with the
discussion in Section 3.3, i. e. the decrease in pH promotes the formation of CTAB/P37
complexes that resemble CTAB/P77 complexes (Figure 8). The foaming properties are also
similar when considering the charge matching by varying the weight concentration. However,
we can note a small difference, at same charge matching, between empty circles in Figure 12
(CTAB/P77 at 0.27 g/L) and empty squares (CTAB/P37 at lower weight fraction, 0.1 g/L ).
The former gives foam slightly drier. We would expect that the liquid volume increases with
the amount of polysaccharides due to the hydration around the polymer. However we observe
the reverse trend. This can reflect the differences in CTAB/pectin aggregates structure and
their different role in the Plateau borders. We have inferred that the structures of aggregates
are different from the surface tension measurements (Figure 7). CTAB molecules stack to P77
as individual molecules, due to the far distance between charges but constitute less
homogeneous layers, while CTAB may stack as grouped into micelles on P37. Micelles
wrapped by pectin are surrounded by a higher rate of hydration and this may explain the
higher rate of liquid volume in the foam formed with P37 at pH 6.5. This small difference is
in any case minor in comparison to the enhancement of the foaming properties of CTAB
solutions by pectin.

27
Finally, the liquid volume in the Plateau borders can also be in balance with the film
thickness. We will compare in section 3.5 these thicknesses as measured in situ by neutron
scattering.
3.4.3 Best foaming and large aggregates
The occurrence of best foaming properties at the phase boundary between soluble
surfactant-polymer complexes and insoluble complexes has been reported formerly36
. This
phenomenon occurs for CTAB/P37. The best foaming properties are encountered at
concentrations close to the insolubility of complexes (at twice the equivalence of charge i.e.
[COO-] = 0.24 mM and [CTAB] = 5×10
-4 M). Insolubility of complexes can be attributed to a
very large size. The best foaming properties of CTAB/P77 mixtures were also encountered at
the same concentration. However there is no formation of insoluble complexes in this
CTAB/P77 case, hence no strong increase of aggregate sizes (unless they do not reach sizes
large enough to produce neither precipitation nor turbidity). As a consequence, the
improvement of the foaming properties of CTAB/Pectin by the formation of large aggregates
is probably not the only parameter affecting foam properties. In addition to this, it is
noteworthy that the concentration in CTAB leading to the best foaming properties of
CTAB/P77 at 0.1 g/L is the same as that encountered for CTAB/P37 at 0.1 g/L (Figure 12)
while the concentration of free micelles and CTAB/pectin complexes are different.
3.4.4 Chain rigidity effects: comparison of pectin with xanthan.
Although pectin and xanthan are polysaccharides, this study, compared to that of Langevin2
on xanthan proves that pectin and xanthan act oppositely on the foaming properties of
alkyltrimethylammonoium bromide. Pectin improves the stability of foam properties of
CTAB, while xanthan alters the foamability of cationic surfactants. This can be interpreted in

28
terms of rigidity18
. The persistence length of xanthan is around 400 Å53
, approximately ten
fold higher than the persistence length of pectin (50Å)54
.
3.5. Small Angle Neutron Scattering measurements
The neutron scattering curves obtained on CTAB foams were recorded as soon as the
bubbling was stopped (Figure 13).
0.00 0.01 0.02 0.03 0.04 0.05 0.06 0.07
0.0
5.0x10⁻⁷
1.0x10⁻⁶
1.5x10⁻⁶
2.0x10⁻⁶
2.5x10⁻⁶
0.00 0.05 0.10 0.15 0.20 0.250.0
1.0x10⁻⁶
2.0x10⁻⁶
3.0x10⁻⁶
4.0x10⁻⁶
Rq
4
q, Å-1
Figure 13. Scattering curves of CTAB foams represented as Rq4 versus q. Curves were
obtained after a drainage of respectively () 600 s, () 1200 s, () 1800 s and () 2000 s
from the top to the bottom. The straight line represents the reflectivity curve for an air/D2O/air
interface, 113 Å thick and possessing a scattering length density of 6×10⁻¹⁰
cm-2
. The
scattering curve of CTAB solutions is shown as filled squares in the same plot as the
scattering curves of CTAB/foams and as an insert on a larger q-range to show the peak
corresponding to micelles at round q = 0.12 Å-1
.
The curves q4R(q) versus q exhibit a maximum at around q = 0.03 Å
-1, the intensity of
which decreases with increasing drainage. This is probably due to the decrease of the number
of films (disproportionment or film rupture). The analogy between SANS by foams and
reflectivity of single films developed in section 2.6 is used to fit the SANS curves of CTAB

29
foams using reflectivity programs. The fitting of the curves was performed assuming a simple
layer air/D2O/air: we observed that when adding a CTAB layer, no sensible variation of Nb or
thickness had any significant influence on the fits. The fitting was then performed in
determining the value of the thickness that matches at the best the first maximum and the
minimum of the reflectivity curve in the q4R(q) representation.
For pure CTAB solutions foams, the freely-drained films are 113 ± 2 Å thick. Comparing
with disjoining pressure measurements on salt-free CTAB solutions at the CMC40
, we note
that a similar thickness (around 140 Å) is observed at high pressures, equivalent to the one
necessary to get a dry foam film. This thickness corresponds to a Common Black Film and is
far higher than the thickness of two CTAB monolayers, which would be closer to a Newton
Black Film (2×21 Å according the work of Lu et al.55
). We can assume that our foam wall is
composed of two monomolecular films of CTAB separated by several layers of micelles or
bilayers (C ≥ CMC). The film does not thin over the time scale of 45 minutes, since no
additional maximum in q4R(q) is observed at higher q-values. The increase in intensity which
we can see above 0.05 Å-1
(see Insert of Figure 13 for a larger q range) is the same as
observed from scattering of CTAB micelles in solution, so it can be attributed to the micelle
contribution from the aqueous phase in the Plateau borders.
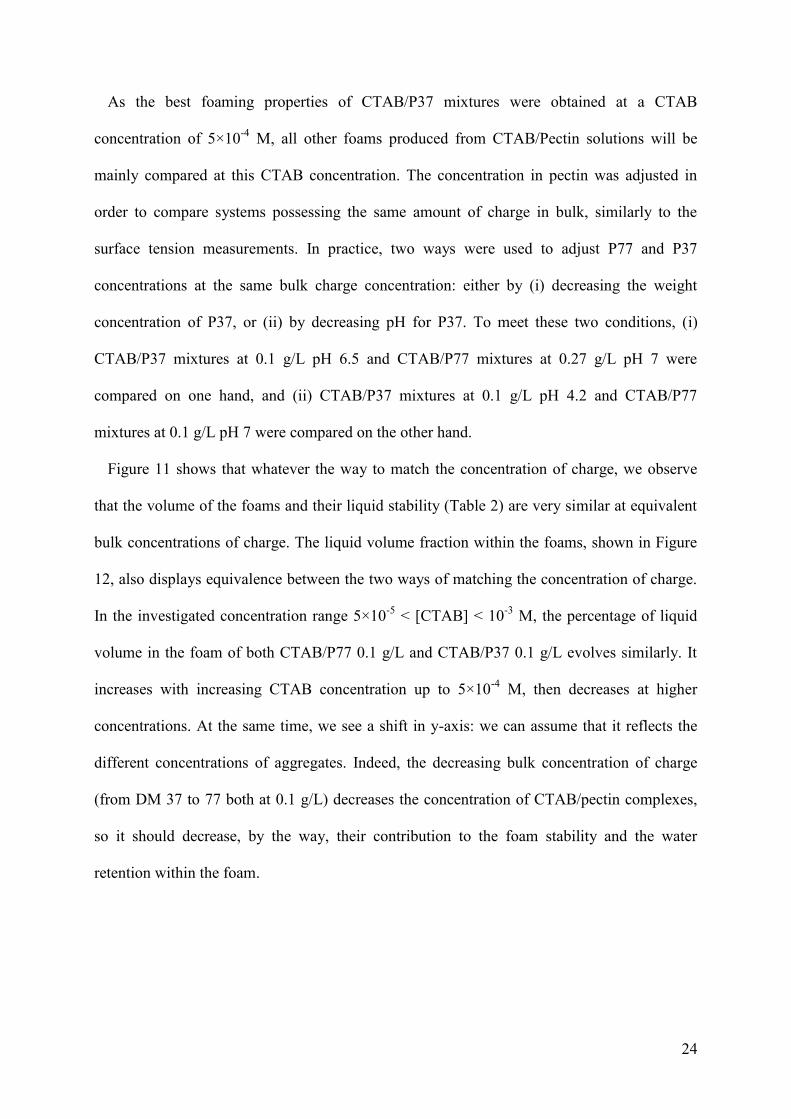
When pectin binds to CTAB, the first maximum of the SANS curve of the foams is seen at
lower q-values (around 0.018 Å-1
, Figure 14). This q-value does not change after more than
one hour of drainage and second maximum appears, signalling a thicker foam film than for
CTAB solutions foams. The curve of CTAB/P37 (not shown for clarity) exhibits exactly the
same shape than that of CTAB/P77. Using again the SANS-reflectivity analogy for foams, the
fit to a reflectivity curve of a single film gives a thickness of 300 ± 10 Å. In this case, the two
interfacial monolayers are separated by free molecules and micelles wrapped by pectin. The
amount of these has been estimated in determining the CMC of CTAB by conductivity
30
measurements in the presence of pectin (without salt). It indicates that the formation of free
micelles should occur at 3.5×10⁻⁴
M in presence of P77. At 10-3
M, the film bulk should be
constituted of free surfactant molecules for 1x10⁻⁴
M and surfactant molecules localised in
micelles wrapped by the polymer for roughly 2.5×10⁻⁴
M. The similarity of the thickness of
the foam film in CTAB/P77 and CTAB/P37 at equivalent charge concentration can be directly
related with their similar foaming behaviour (Figure 11). It is noteworthy that the thickness of
300 Å is similar to the ones measured by film disjoining pressures experiments40, 56
in several
polysaccharide or synthetic polymers/surfactant systems. This similarity applies when films
are in the drier state, i.e., when the pressure applied on the foam films is high.
0.00 0.02 0.04 0.060
2x10⁻⁸
4x10⁻⁸
6x10⁻⁸
8x10⁻⁸
Rq
4
q, Å-1
Figure 14. Scattering curve () of CTAB/P77 foams represented as Rq4 versus q and
recorded after a free drainage of 3900 s. The straight line (―) represents the reflectivity curve
for a foam film 300 Å thick and possessing a scattering length density of 6 × 10⁻¹⁰
cm-2
.
4. Conclusions
Binding of pectin to trialkylammonium surfactants is considered at the level of interfacial
and foaming properties, in agreement with solution properties which are already available in

31
the literature, in particular limiting DM for complexation35
, binding degree11, 33
and
rheological properties34
. We have shown that pectin acts on the interfacial behaviour of
alkyltrimethylammonium surfactant similarly to several other negatively charged
polysaccharides. The complex formed in bulk between the negatively charged pectin and the
cationic surfactant CTAB at a constant bulk charge concentration has a surface activity
evolving with the degree of charge. The lower the DM, the stronger the complex surface
activity (CTAB/P37 > CTAB/P52, CTAB/P77). Moreover, the modulation of the bulk charge
by pH alters the surface activity of the low DM pectin/CTAB complexes. All results show
that this behavior exhibits strong similarities with the affinity of pectin against calcium. In
both cases, the distribution of charges along the pectin chain has a role in the cooperative
phenomena.
For high DM pectins (DM 52% and 77%), the interface is thought to be covered by a thin
layer of surfactant with the polymer anchored underneath, whatever the surfactant
concentration. At low DM (37%), the same thin monolayer of pectin/CTAB is found at low
concentrations and a more compact organisation of CTAB and pectin P37 is encountered at
higher concentrations from the onset of micellisation on the biopolymer. In all cases, when
the complexes are of the monolayer type, CTAB-P37 and CTAB-P77 films at the interface
behave like a gel.
Unlike the much more rigid polysaccharide xanthan, pectin improves significantly the
stability of foam properties of CTAB. In contrast to surface activity, no significant effect of
DM on foaming properties is observed as far as the bulk charge concentration is matched.
This is confirmed by measurements of the thickness by SANS. The foams are constituted by
films of the same thickness that enlarges from 110 to around 300 Å in presence of pectin. The
description of the interfacial layer of single interfaces is not a perfect mirror of the foam

32
properties. The description of in situ interfaces, even difficult to achieve, must be pursued. In
this sense, small angle neutron scattering proves here its interest to describe the film in foams.
ACKNOWLEDGMENT
Copenhagen Pectin is acknowledged for providing GenuPectin batches of various degrees
of charges. We thank Dominique Guibert for establishing the phase diagram of CTAB/pectin
solutions.
REFERENCES
(1) Goddard, E. D. In Interactions of Surfactants with Polymers and Proteins; Goddard,
E. D.; Ananthapadmanabhan, K. P., Eds.; CRC Press: Boca Raton, 1993; pp 171-201.
(2) Langevin, D. Advances in Colloid and Interface Science 2001, 89, 467-484.
(3) Taylor, D. J. F.; Thomas, R. K.; Penfold, J. Advances in Colloid and Interface Science
2007, 132, 69-110.
(4) Hansson, P. Langmuir 2001, 17, 4167-4180.
(5) Tomasic, V.; Tomasic, A.; Smit, I.; Filipovic-Vincekovic, N. Journal of Colloid and
Interface Science 2005, 285, 342-350.
(6) Taylor, D. J. F.; Thomas, R. K.; Li, P. X. Langmuir 2003, 19, 3712-3719.
(7) Moriyama, Y.; Takeda, K.; Murakami, K. Langmuir 2000, 16, 7629-7633.
(8) Biswas, S. C.; Chattoraj, D. K. Langmuir 1997, 13, 4512-4519.
(9) Thalberg, K.; Lindman, B. Journal of Physical Chemistry 1989, 93, 1479-1483.
(10) Malovikova, A.; Hayakawa, K.; Kwak, J. C. T. Journal of Physical Chemistry 1984,
88, 1930-1933.
(11) Hayakawa, K.; Santerre, J. P.; Kwak, J. C. T. Macromolecules 1983, 16, 1642-1645.
(12) Hayakawa, K.; Ayub, A. L.; Kwak, J. C. T. Colloids and Surfaces A :
Physicochemical and Engineering Aspects 1982, 4, 389-396.
(13) Monteux, C.; Llauro, M. F.; Baigl, D.; Williams, C. E.; Anthony, O.; Bergeron, V.
Langmuir 2004, 20, 5358-5366.
(14) Nobre, T. M.; Wong, K.; Zaniquelli, M. E. D. Journal of Colloid and Interface
Science 2007, 305, 142-149.
(15) Tomasic, V.; Tomasic, A.; Filipovic-Vincekovic, N. Journal of Colloid and Interface
Science 2002, 256, 462-471.
(16) Lundqvist, H.; Eliasson, A. C.; Olofsson, G. Carbohydrate Polymers 2002, 49, 43-55.
(17) Hansson, P. Langmuir 2001, 17, 4161-4166.
(18) Ritacco, H.; Albouy, P. A.; Bhattacharyya, A.; Langevin, D. Physical Chemistry
Chemical Physics 2000, 2, 5243-5251.
(19) Engelking, J.; Menzel, H. Thin Solid Films 1998, 329, 90-95.

33
(20) Caram-Lelham, N.; Hed, F.; Sundelof, L. O. Biopolymers 1997, 41, 765-772.
(21) Asnacios, A.; Langevin, D.; Argillier, J. F. European Physical Journal B 1998, 5, 905-
911.
(22) Kiefer, J. J.; Somasundaran, P.; Ananthapadmanabhan, K. P. Langmuir 1993, 9, 1187-
1192.
(23) Monteux, C.; Williams, C. E.; Bergeron, V. Langmuir 2004, 20, 5367-5374.
(24) Hayakawa, K.; Kwak, J. C. T. Journal of Physical Chemistry 1983, 87, 506-509.
(25) Biswas, S. C.; Chattoraj, D. K. Langmuir 1997, 13, 4505-4511.
(26) Hayakawa, K.; Kwak, J. C. T. Journal of Physical Chemistry 1982, 86, 3866-3870.
(27) Wang, C.; Tam, K. C. Langmuir 2002, 18, 6484-6490.
(28) Herslof, A.; Sundelof, L. O.; Edsman, K. Journal of Physical Chemistry 1992, 96,
2345-2348.
(29) Voragen, A. G. J.; Pilnik, W.; Thibault, J. F.; Axelos, M. A. V.; Renard, C. M. G. C.
In Food Polysaccharides and Their Applications; Food Science and Technology
Series;Marcel Dekker: New-York, 1995.
(30) Perez, S.; Mazeau, K.; du Penhoat, C. H. Plant Physiology and Biochemistry 2000, 38,
37-55.
(31) Axelos, M. A. V.; Mestdagh, M. M.; Francois, J. Macromolecules 1994, 27, 6594-
6602.
(32) Dickinson, E. Food Hydrocolloids 2003, 17, 25-39.
(33) Malovikova, A.; Hayakawa, K.; Kwak, J. C. T. A.C.S. symposium series 1984, 253,
225-239.
(34) Miralles-Houzelle, M. C.; Hubert, P.; Dellacherie, E. Langmuir 2001, 17, 1384-1391.
(35) McClements, D. J. Journal of Agricultural and Food Chemistry 2000, 48, 5604-5611.
(36) Guerrini, M. M.; Lockheadf, R.; Daly, W. H. Colloids and Surfaces A :
Physicochemical and Engineering Aspects 1999, 147, 67-78.
(37) Askvik, K. M.; Hetlesaether, S.; Sjoblom, J.; Stenius, P. Colloid Surf. A-Physicochem.
Eng. Asp. 2001, 182, 175-189.
(38) Asnacios, A.; Klitzing, R. v.; Langevin, D. Colloids and Surfaces A : Physicochemical
and Engineering Aspects 2000, 167, 189-197.
(39) von Klitzing, R.; Muller, H. J. Current Opinion in Colloid & Interface Science 2002,
7, 42-49.
(40) Bergeron, V. Langmuir 1997, 13, 3474-3482.
(41) Bergeron, V. Journal of Physics-Condensed Matter 1999, 11, R215-R238.
(42) Von Klitzing, R.; Espert, A.; Asnacios, A.; Hellweg, T.; Colin, A.; Langevin, D.
Colloid Surf. A-Physicochem. Eng. Asp. 1999, 149, 131-140.
(43) von Klitzing, R.; Espert, A.; Colin, A.; Langevin, D. Colloid Surf. A-Physicochem.
Eng. Asp. 2001, 176, 109-116.
(44) Monteux, C.; Fuller, G. G.; Bergeron, V. Journal of Physical Chemistry B 2004, 108,
16473-16482.
(45) Dronnet, V. M.; Renard, C.; Axelos, M. A. V.; Thibault, J. F. Carbohydrate Polymers
1997, 34, 73-82.
(46) Benjamins, J.; Cagna, A.; LucassenReynders, E. H. Colloid Surf. A-Physicochem.
Eng. Asp. 1996, 114, 245-254.
(47) Axelos, M. A. V.; Boue, F. Langmuir 2003, 19, 6598-6604.
(48) Etrillard, J.; Axelos, M. A. V.; Cantat, I.; Artzner, F.; Renault, A.; Weiss, T.;
Delannay, R.; Boue, F. Langmuir 2005, 21, 2229-2234.
(49) Terriac, E.; Emile, J.; Axelos, M. A.; Grillo, I.; Meneau, F.; Boue, F. Colloid Surf. A-
Physicochem. Eng. Asp. 2007, 309, 112-116.

34
(50) Mingotaud, A. M.; Mingotaud, C.; L.K., P., Handbook of Monolayers. Academic
Press: San Diego, 1993.
(51) Taylor, D. J. F.; Thomas, R. K.; Hines, J. D.; Humphreys, K.; Penfold, J. Langmuir
2002, 18, 9783-9791.
(52) Jain, N.; Trabelsi, S.; Guillot, S.; McLouglilin, D.; Langevin, D.; Letellier, P.;
Turmine, M. Langmuir 2004, 20, 8496-8503.
(53) Chazeau, L.; Milas, M.; Rinaudo, M. International Journal of Polymer Analysis and
Characterization 1995, 2, 21-29.
(54) Cros, S.; Garnier, C.; Axelos, M. A. V.; Imberty, A.; Perez, S. Biopolymers 1996, 39,
339-352.
(55) Lu, J. R.; Hromadova, M.; Simister, E. A.; Thomas, R. K.; Penfold, J. Journal of
Physical Chemistry 1994, 98, 11519-11526.
(56) von Klitzing, R. Advances in Colloid and Interface Science 2005, 114, 253-266.

35
Table of Contents Graphic
0,00 0,01 0,02 0,03 0,04 0,05 0,06
0
2x10⁻⁸
4x10⁻⁸
6x10⁻⁸
8x10⁻⁸
Rq
4
q, Å-1
SA N S/R eflectivityG as bubbling
0,00 0,01 0,02 0,03 0,04 0,05 0,06
0
2x10⁻⁸
4x10⁻⁸
6x10⁻⁸
8x10⁻⁸
Rq
4
q, Å-1
SA N S/R eflectivityG as bubbling


![Kinetic study of surfactant cobalt (III) complexes by [Fe(CN)6 4-]: … · 2021. 1. 6. · Kinetic study of surfactant cobalt (III) complexes by [Fe(CN)6 4-]: Outer-Sphere Electron-Transfer](https://img.pdfslide.us/doc/110x75/60cabf65e38e6e0a6b5506ae/kinetic-study-of-surfactant-cobalt-iii-complexes-by-fecn6-4-2021-1-6.jpg)