Embed Size (px)
Citation preview
POLYGENIC AND MULTIFACTORAIL
INHERITANCE
Umm AL Qura University
Dr Neda M Bogari
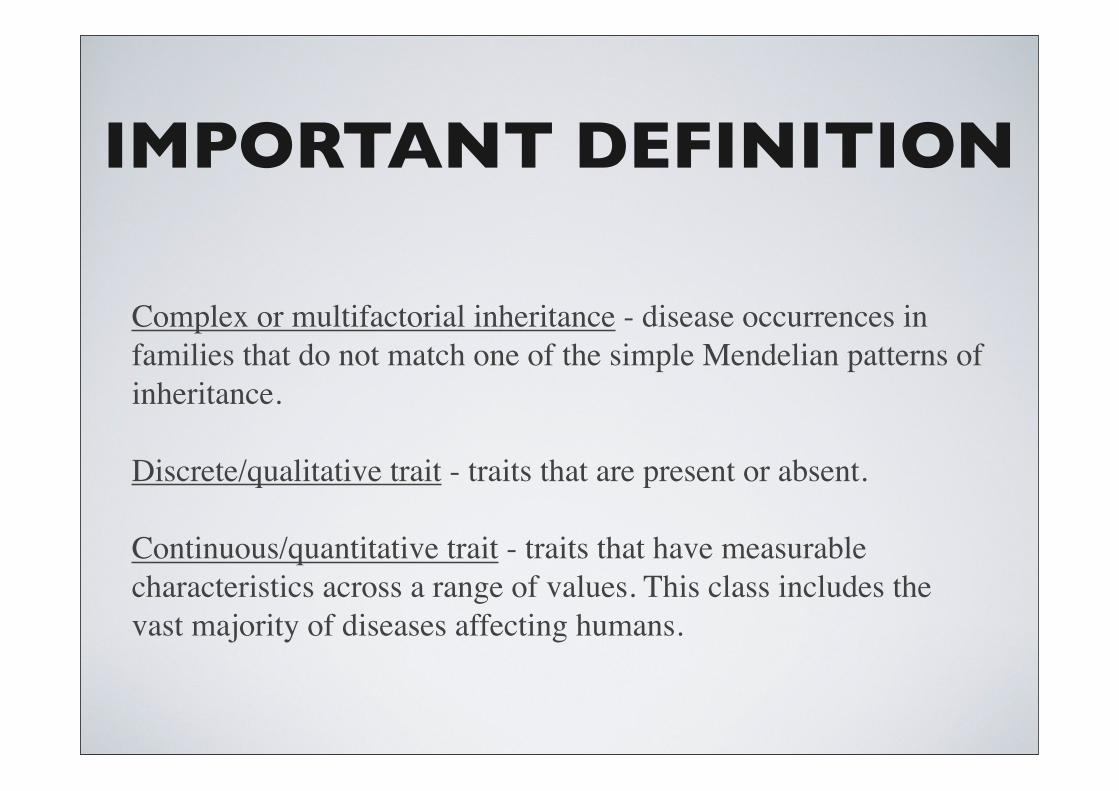
IMPORTANT DEFINITION
Complex or multifactorial inheritance - disease occurrences in families that do not match one of the simple Mendelian patterns of inheritance.
Discrete/qualitative trait - traits that are present or absent.
Continuous/quantitative trait - traits that have measurable characteristics across a range of values. This class includes the vast majority of diseases affecting humans.
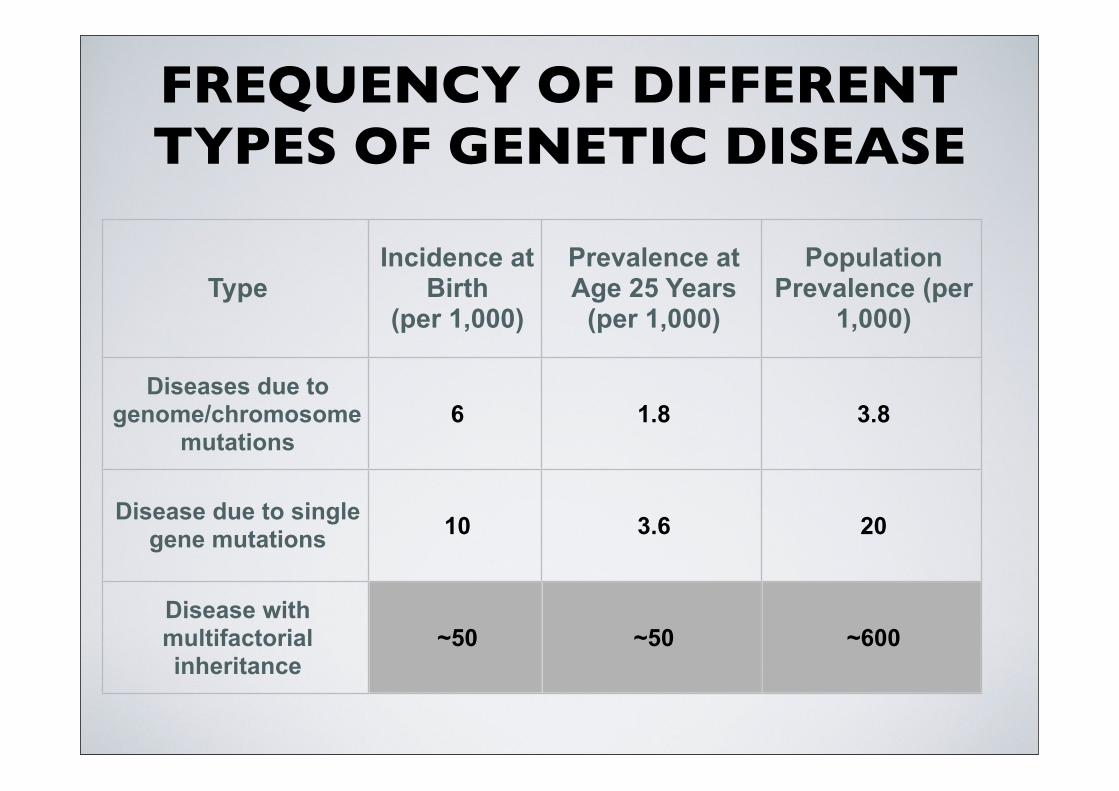
FREQUENCY OF DIFFERENT TYPES OF GENETIC DISEASE
TypeIncidence at
Birth(per 1,000)
Prevalence at Age 25 Years
(per 1,000)
Population Prevalence (per
1,000)
Diseases due to genome/chromosome
mutations6 1.8 3.8
Disease due to single gene mutations 10 3.6 20
Disease with multifactorial inheritance
~50 ~50 ~600
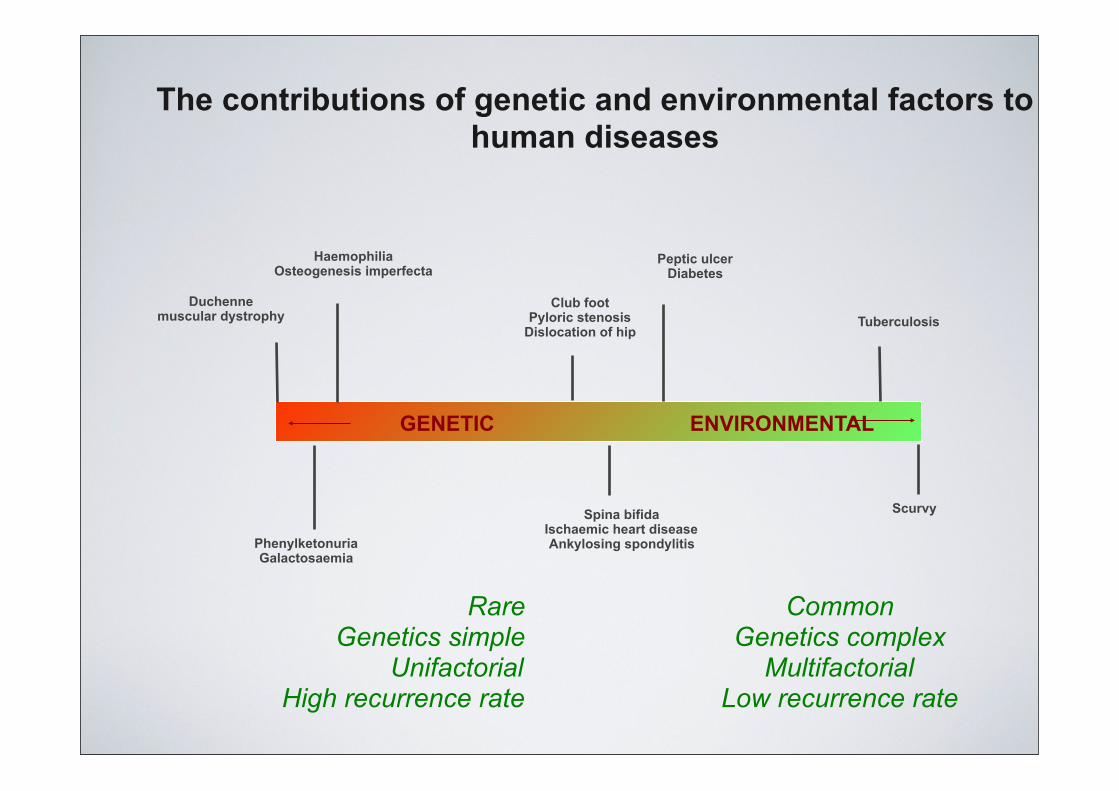
GENETIC ENVIRONMENTAL
Duchenne muscular dystrophy
HaemophiliaOsteogenesis imperfecta
Club footPyloric stenosis
Dislocation of hip
Peptic ulcerDiabetes
Tuberculosis
PhenylketonuriaGalactosaemia
Spina bifidaIschaemic heart diseaseAnkylosing spondylitis
Scurvy
The contributions of genetic and environmental factors to human diseases
RareGenetics simple
UnifactorialHigh recurrence rate
CommonGenetics complex
MultifactorialLow recurrence rate
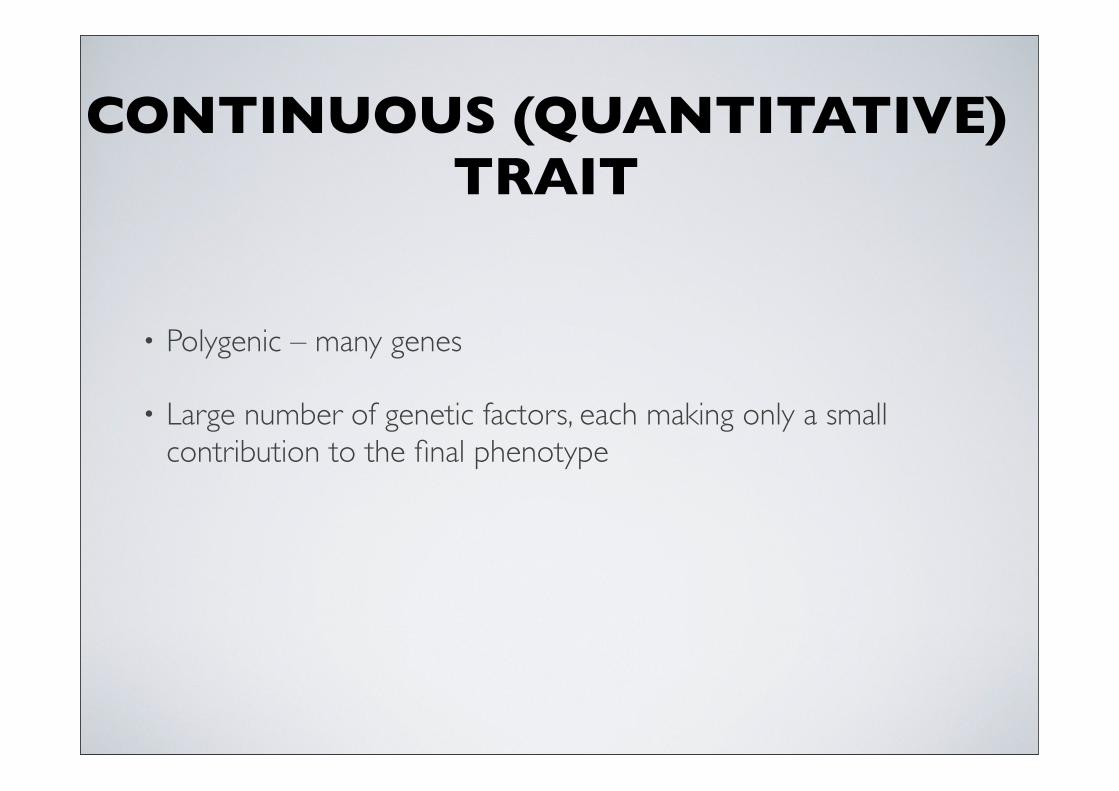
CONTINUOUS (QUANTITATIVE) TRAIT
• Polygenic – many genes
• Large number of genetic factors, each making only a small contribution to the final phenotype
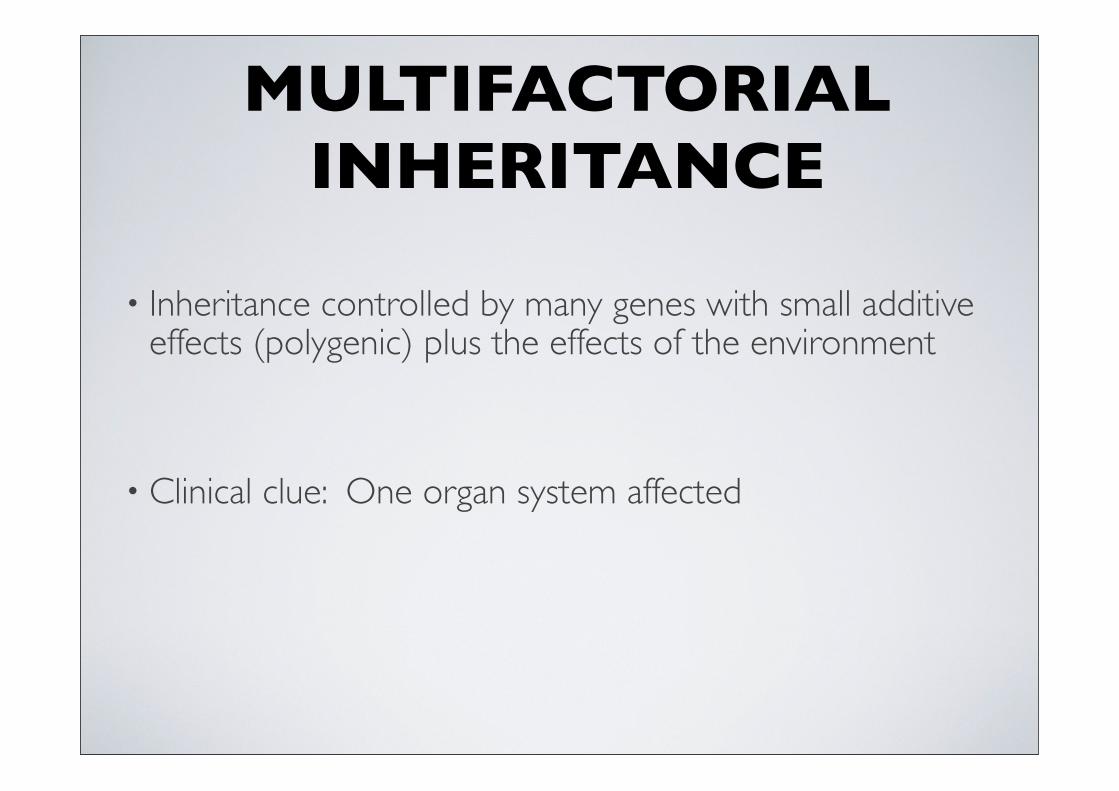
MULTIFACTORIAL INHERITANCE
• Inheritance controlled by many genes with small additive effects (polygenic) plus the effects of the environment
• Clinical clue: One organ system affected
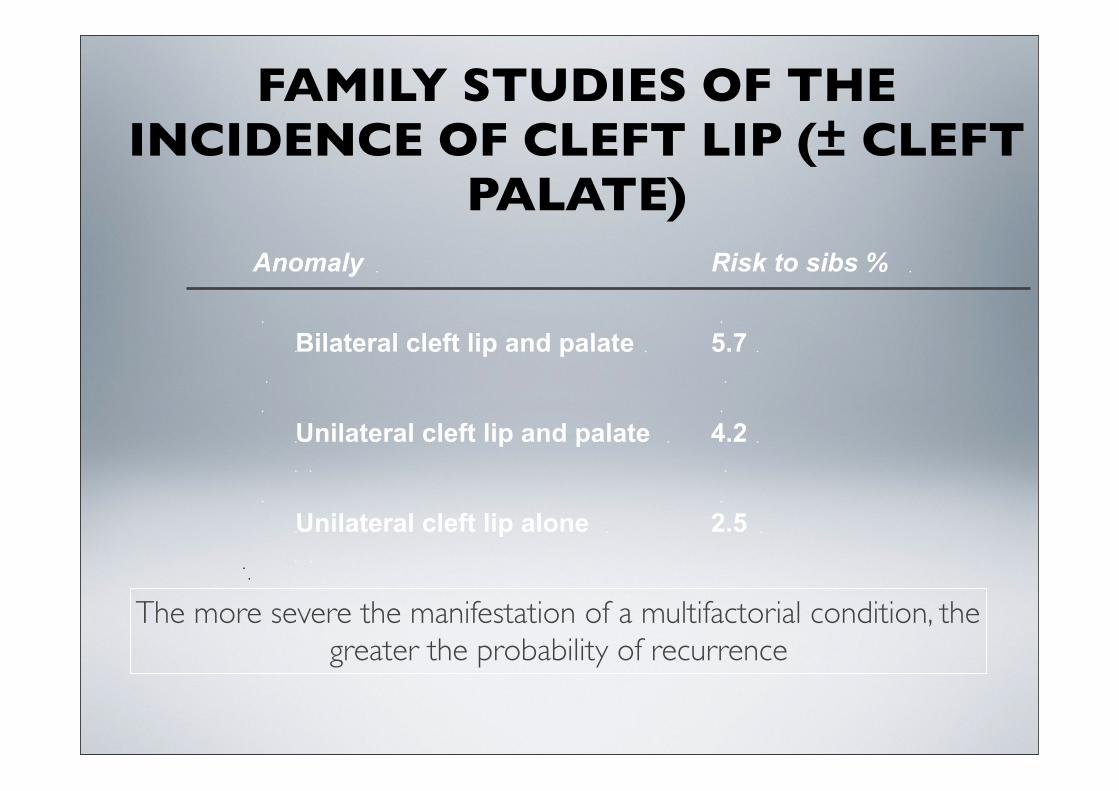
FAMILY STUDIES OF THE INCIDENCE OF CLEFT LIP (± CLEFT
PALATE)
The more severe the manifestation of a multifactorial condition, the greater the probability of recurrence
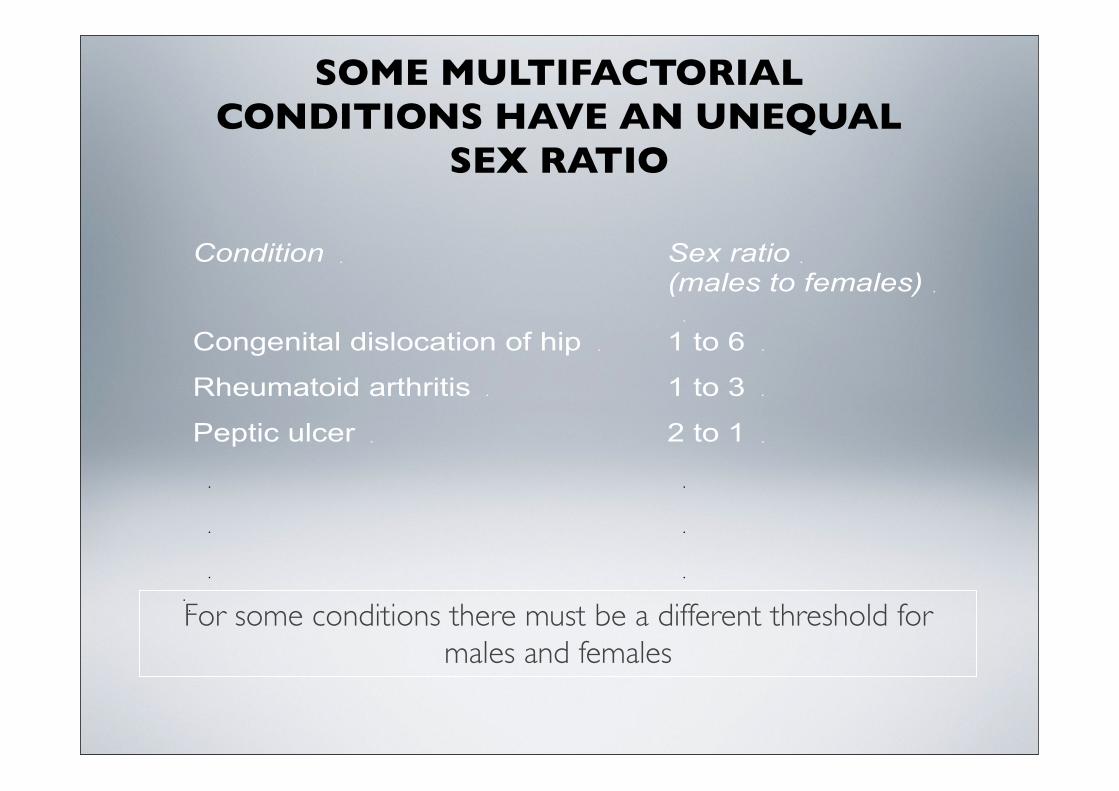
For some conditions there must be a different threshold for males and females
SOME MULTIFACTORIAL CONDITIONS HAVE AN UNEQUAL
SEX RATIO
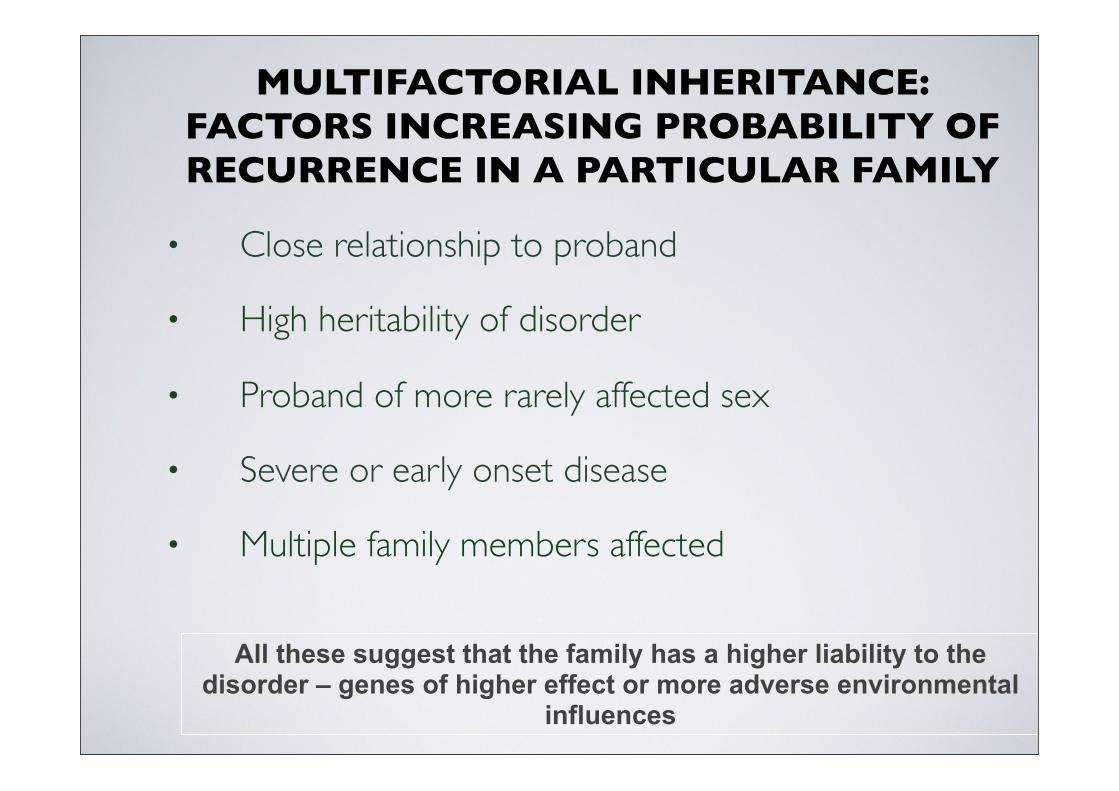
MULTIFACTORIAL INHERITANCE:FACTORS INCREASING PROBABILITY OF RECURRENCE IN A PARTICULAR FAMILY
• Close relationship to proband
• High heritability of disorder
• Proband of more rarely affected sex
• Severe or early onset disease
• Multiple family members affected
All these suggest that the family has a higher liability to the disorder – genes of higher effect or more adverse environmental
influences
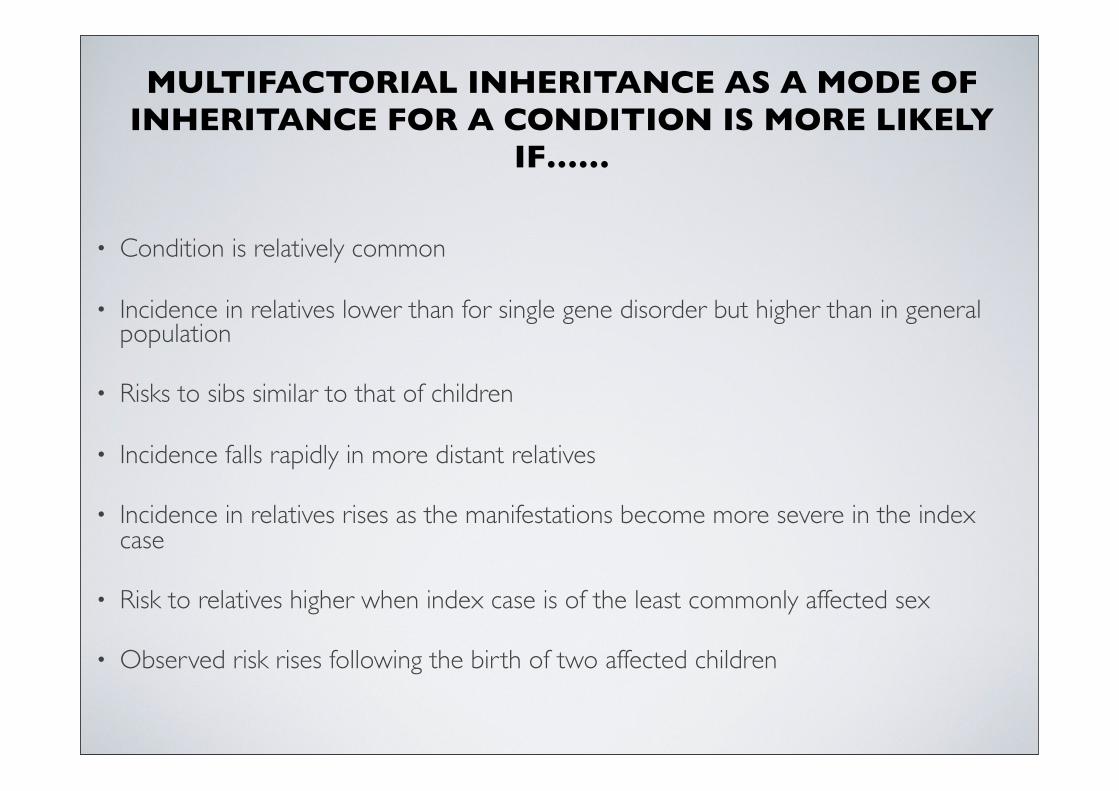
MULTIFACTORIAL INHERITANCE AS A MODE OF INHERITANCE FOR A CONDITION IS MORE LIKELY
IF……
• Condition is relatively common
• Incidence in relatives lower than for single gene disorder but higher than in general population
• Risks to sibs similar to that of children
• Incidence falls rapidly in more distant relatives
• Incidence in relatives rises as the manifestations become more severe in the index case
• Risk to relatives higher when index case is of the least commonly affected sex
• Observed risk rises following the birth of two affected children
MULTIFACTORIAL TRAITS
• Genetic predisposition likely to be due to a particular combination of genes
• The genes and environmental factors causing a particular multifactorial trait may vary from person to person
• Most diseases with a genetic component are not inherited in Mendelian fashion but display multifactorial inheritance
• Multifactorial disease usually polygenic -many genes each with small additive effects
• Major effort to identify common disease susceptibility genes underway
• Identification of SNPs associated with disease susceptibility
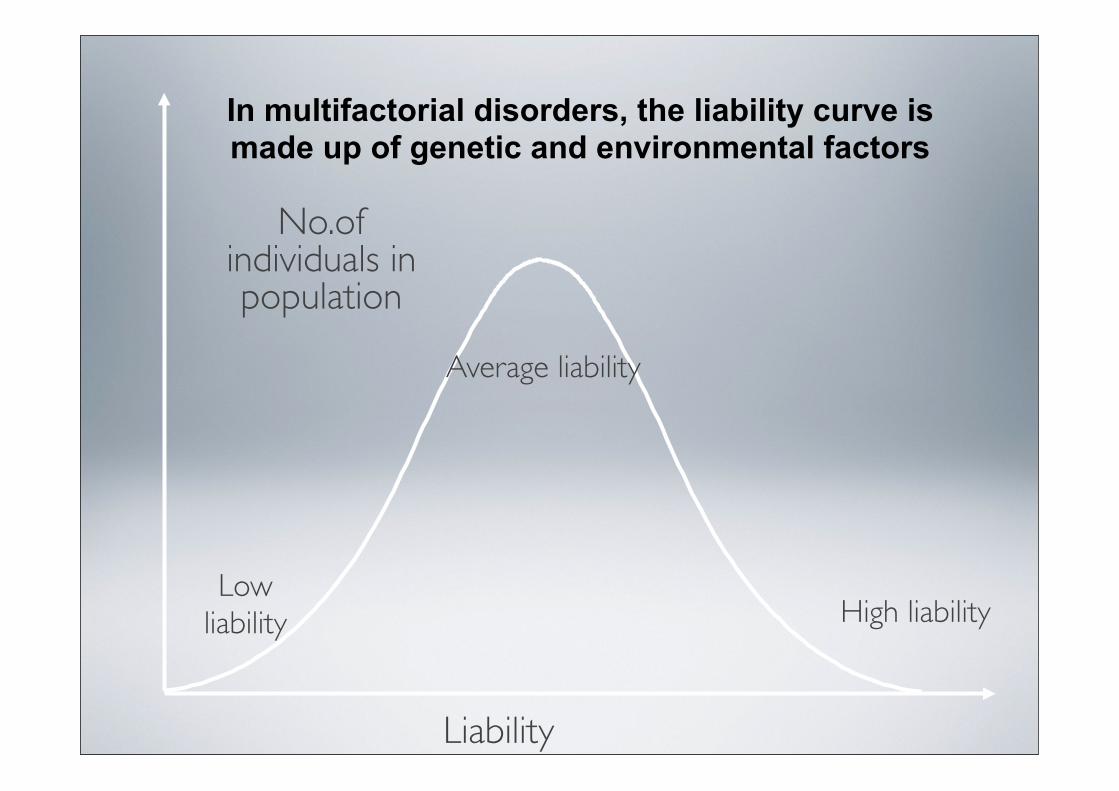
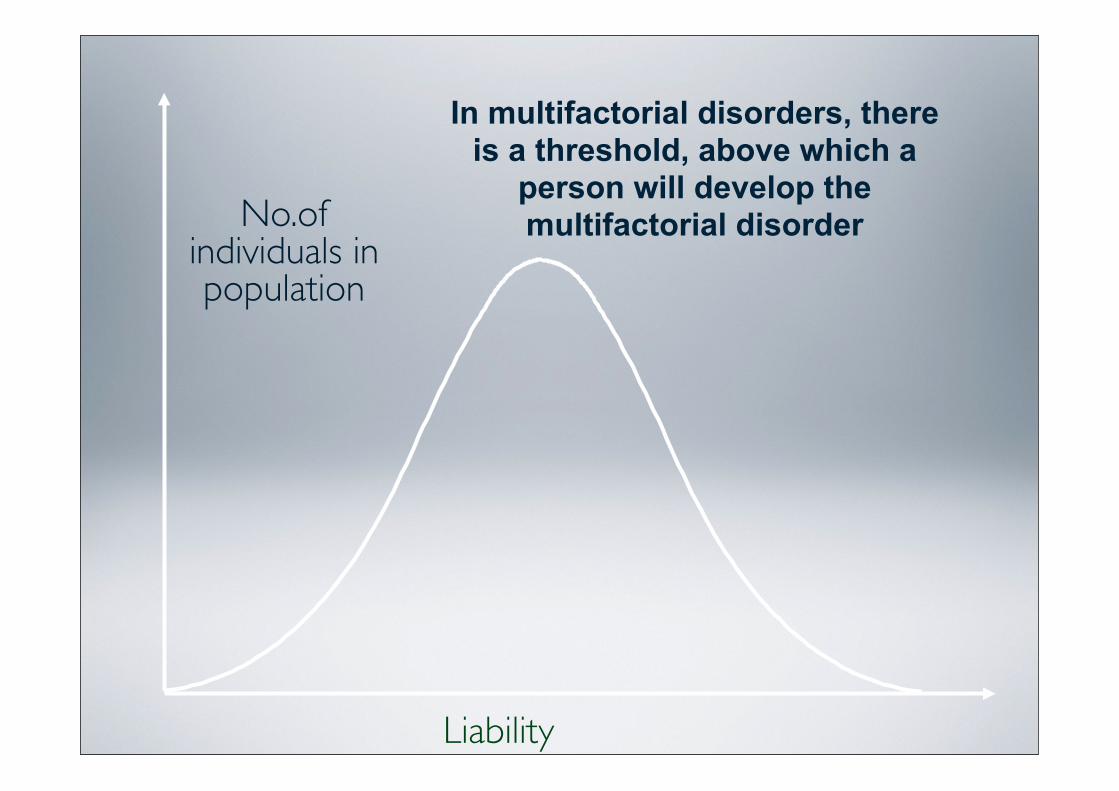
No.of individuals in population
Liability
In multifactorial disorders, the liability curve is made up of genetic and environmental factors
Low liability
Average liability
High liability
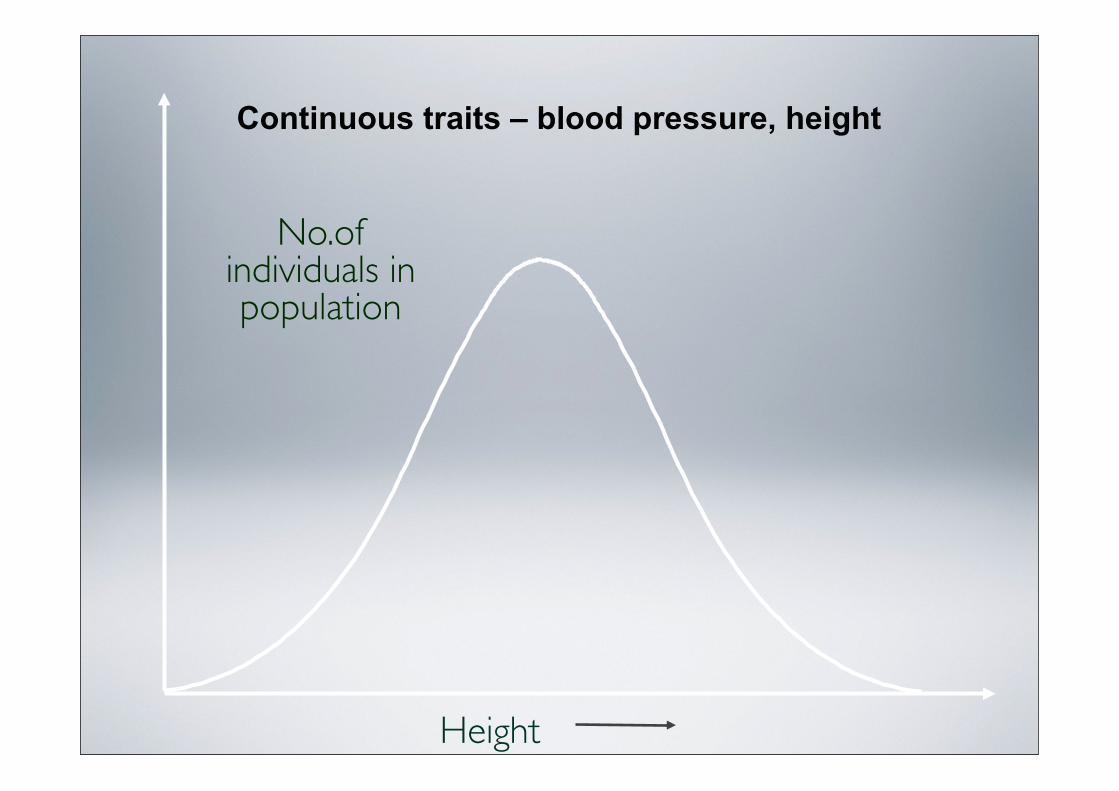
No.of individuals in population
Height
Continuous traits – blood pressure, height
No.of individuals in population
Liability
In multifactorial disorders, there is a threshold, above which a
person will develop the multifactorial disorder
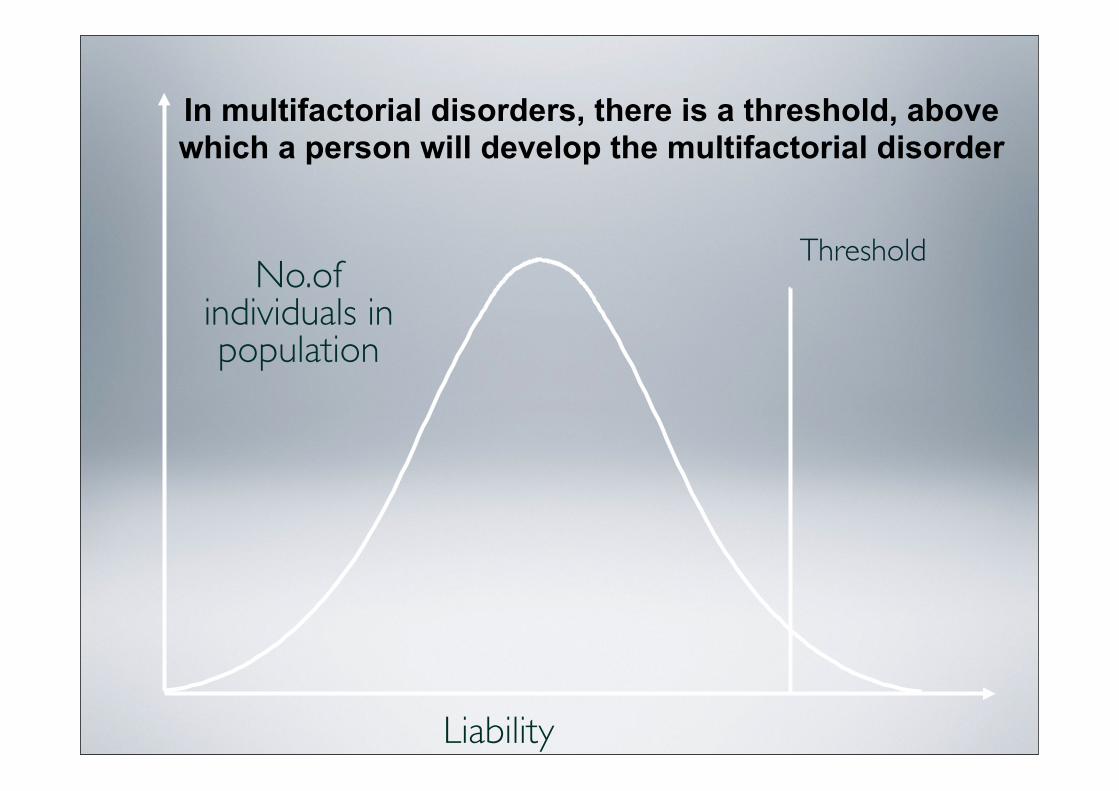
No.of individuals in population
Liability
In multifactorial disorders, there is a threshold, above which a person will develop the multifactorial disorder
Threshold
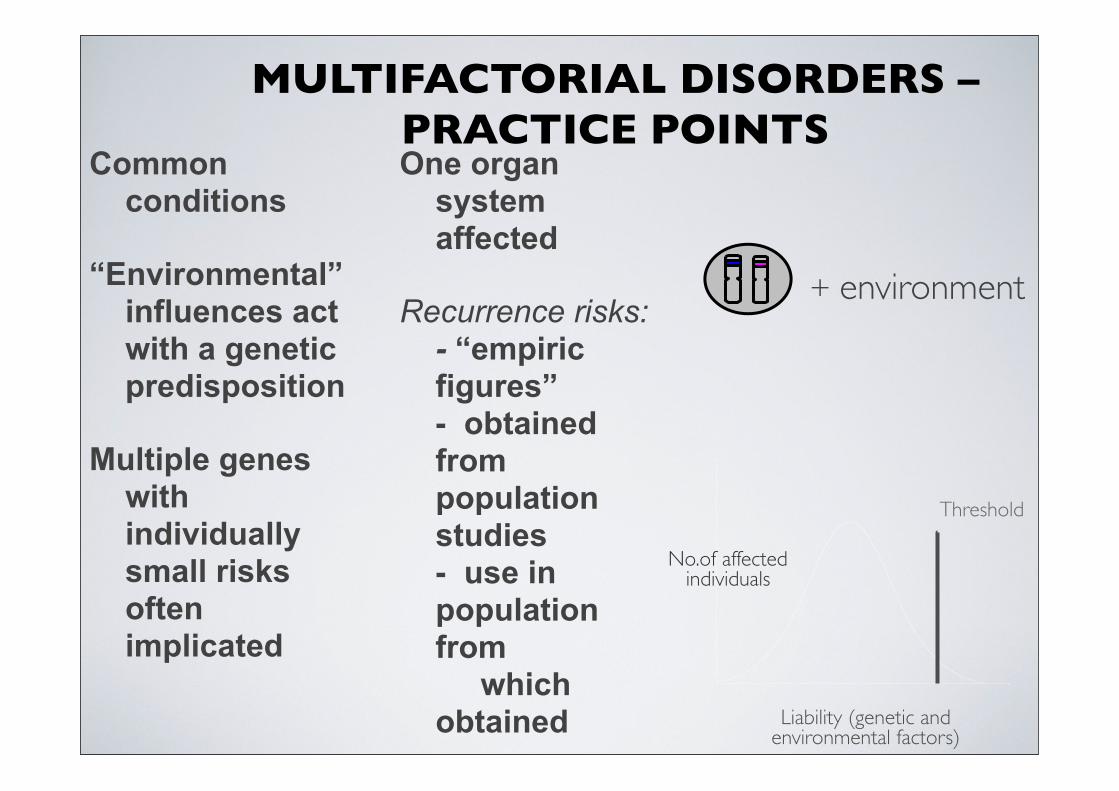
MULTIFACTORIAL DISORDERS – PRACTICE POINTS
No.of affectedindividuals
Liability (genetic and environmental factors)
Threshold
+ environment
Common conditions
“Environmental” influences act with a genetic predisposition
Multiple genes with individually small risks often implicated
One organ system affected
Recurrence risks:- “empiric figures”- obtained from population studies- use in population from which obtained
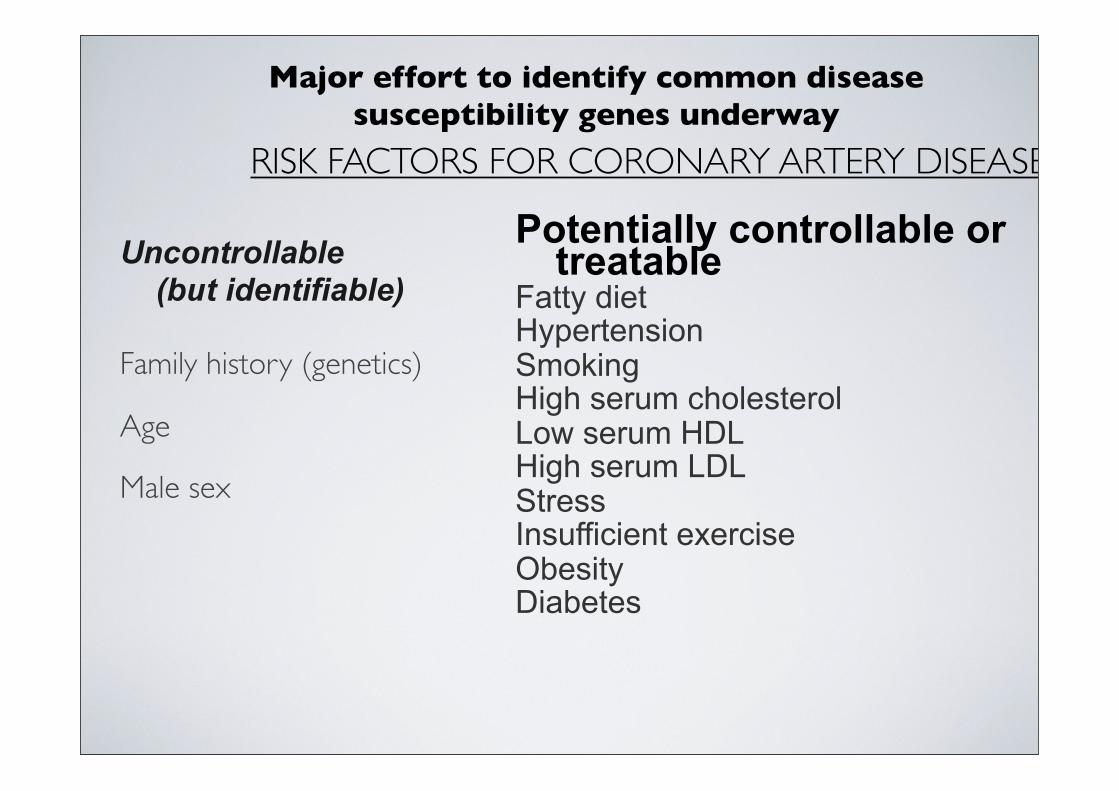
RISK FACTORS FOR CORONARY ARTERY DISEASE
Uncontrollable (but identifiable)
Family history (genetics)
Age
Male sex
Potentially controllable or treatable
Fatty dietHypertensionSmokingHigh serum cholesterolLow serum HDLHigh serum LDLStressInsufficient exerciseObesityDiabetes
Major effort to identify common disease susceptibility genes underway
• The recurrence risk for multifactorial disorders has to be determined through family studies
• Observe the number of affected siblings in many families (empiric risk)
HOW CAN THE PROBABILITY OF RECURRENCE BE DETERMINED FOR
MULTIFACTORIAL DISORDERS?
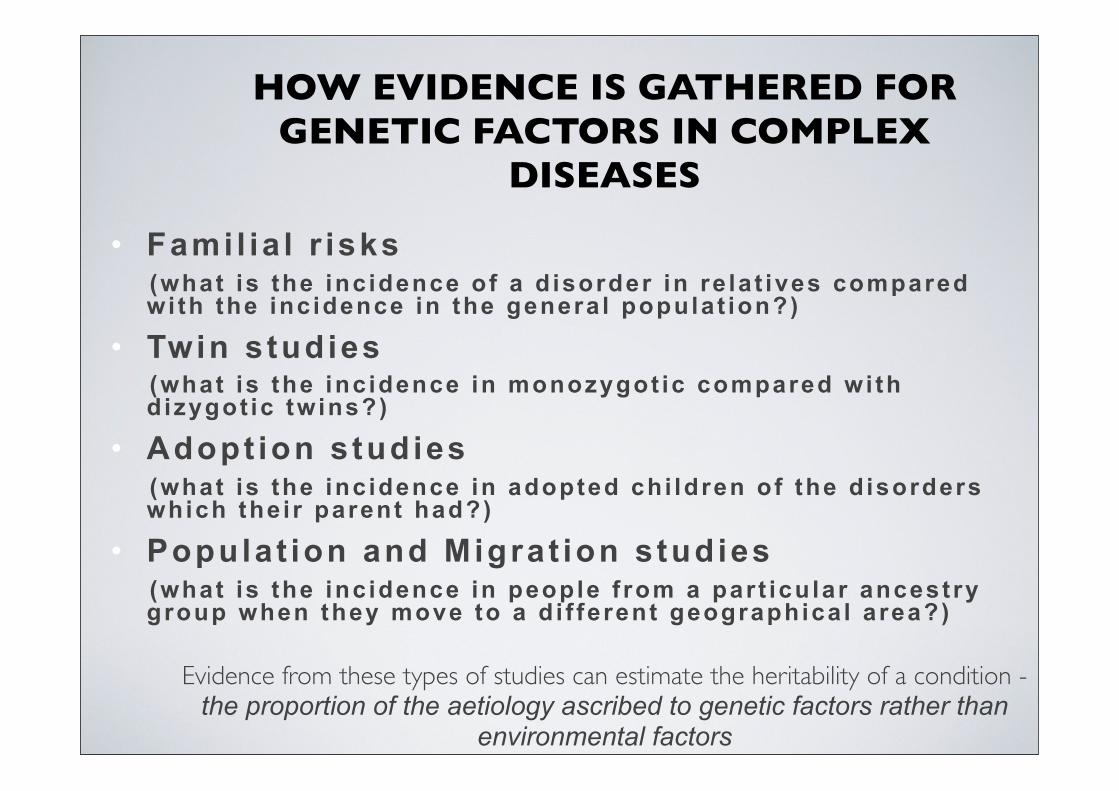
HOW EVIDENCE IS GATHERED FOR GENETIC FACTORS IN COMPLEX
DISEASES
• Fami l ia l r isks (what is the inc idence of a d isorder in re la t ives compared
wi th the inc idence in the genera l populat ion?)
• Twin studies (what is the inc idence in monozygot ic compared wi th
d izygot ic twins?)
• Adopt ion studies (what is the inc idence in adopted chi ldren of the d isorders
which thei r parent had?)
• Populat ion and Migrat ion studies (what is the inc idence in people f rom a par t icular ancestry
group when they move to a d i f ferent geographical area?)
Evidence from these types of studies can estimate the heritability of a condition - the proportion of the aetiology ascribed to genetic factors rather than
environmental factors
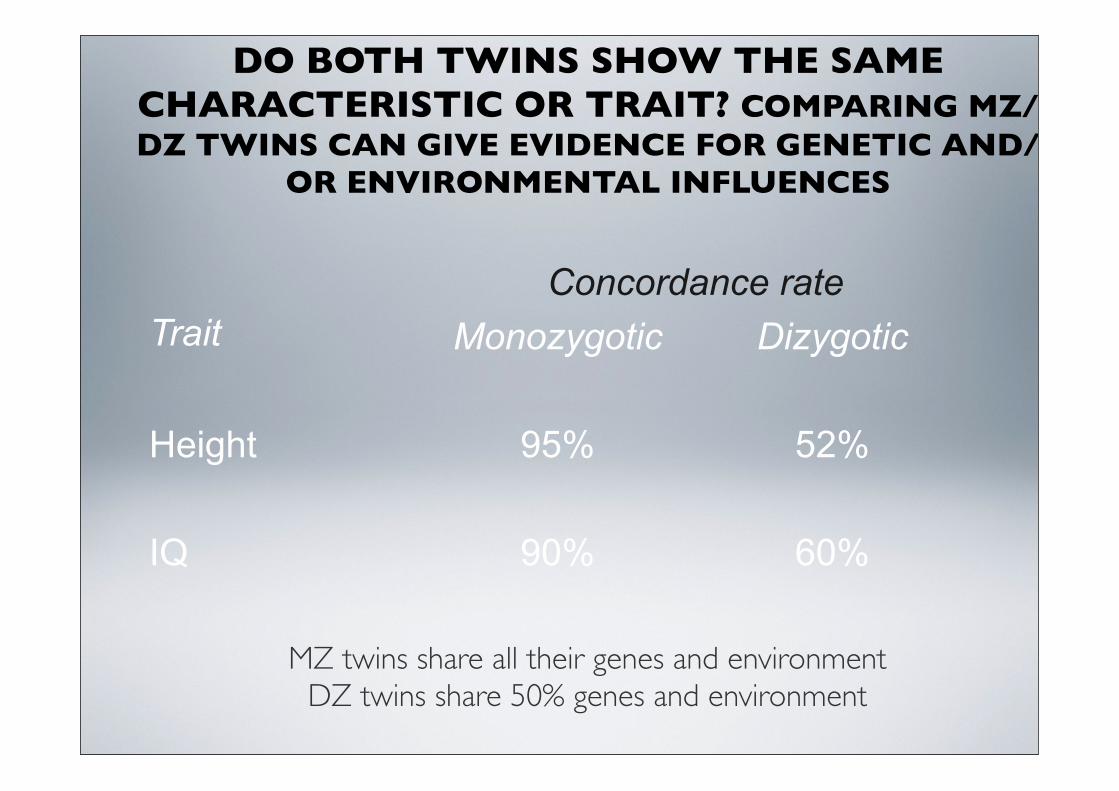
DO BOTH TWINS SHOW THE SAME CHARACTERISTIC OR TRAIT? COMPARING MZ/DZ TWINS CAN GIVE EVIDENCE FOR GENETIC AND/
OR ENVIRONMENTAL INFLUENCES
60%90%IQ
52%95%Height
DizygoticMonozygoticConcordance rate
Trait
MZ twins share all their genes and environmentDZ twins share 50% genes and environment
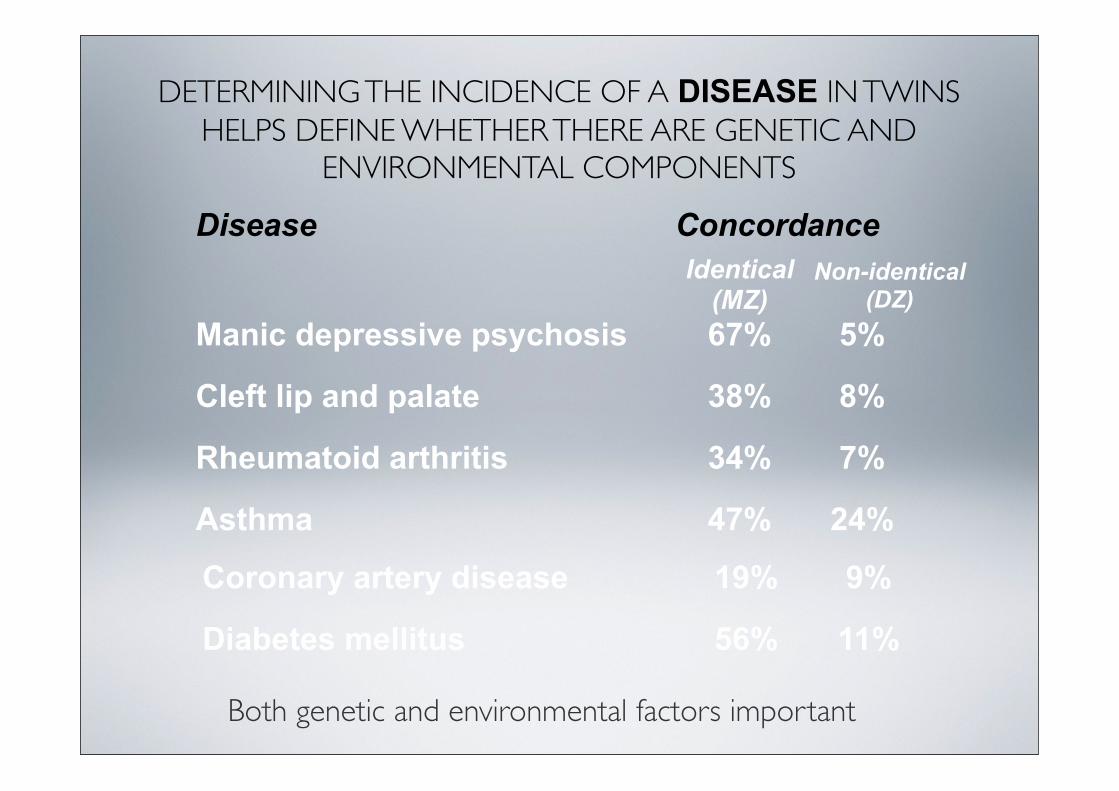
DETERMINING THE INCIDENCE OF A DISEASE IN TWINS HELPS DEFINE WHETHER THERE ARE GENETIC AND
ENVIRONMENTAL COMPONENTS
11%56%Diabetes mellitus
9%19%Coronary artery disease
24%47%Asthma
7%34%Rheumatoid arthritis
8%38%Cleft lip and palate
5%67%Manic depressive psychosis
Non-identical (DZ)
Identical (MZ)
ConcordanceDisease
Both genetic and environmental factors important
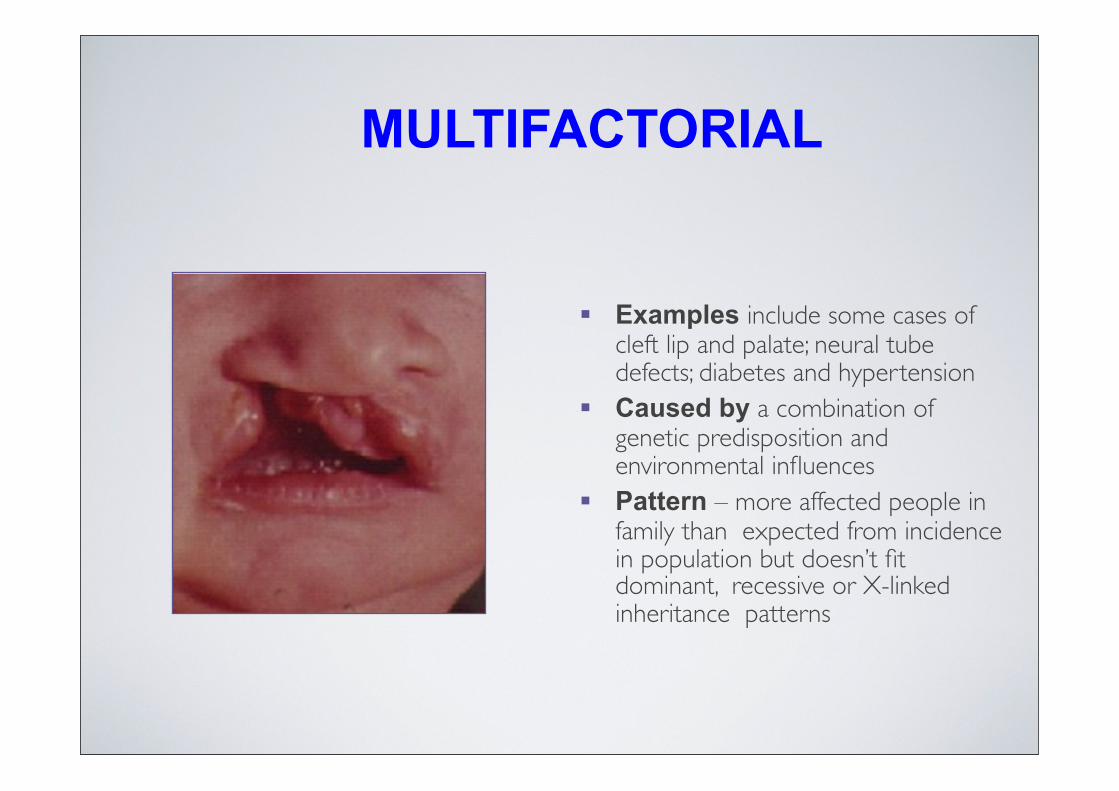
MULTIFACTORIAL
Examples include some cases of cleft lip and palate; neural tube defects; diabetes and hypertension
Caused by a combination of genetic predisposition and environmental influences
Pattern – more affected people in family than expected from incidence in population but doesn’t fit dominant, recessive or X-linked inheritance patterns
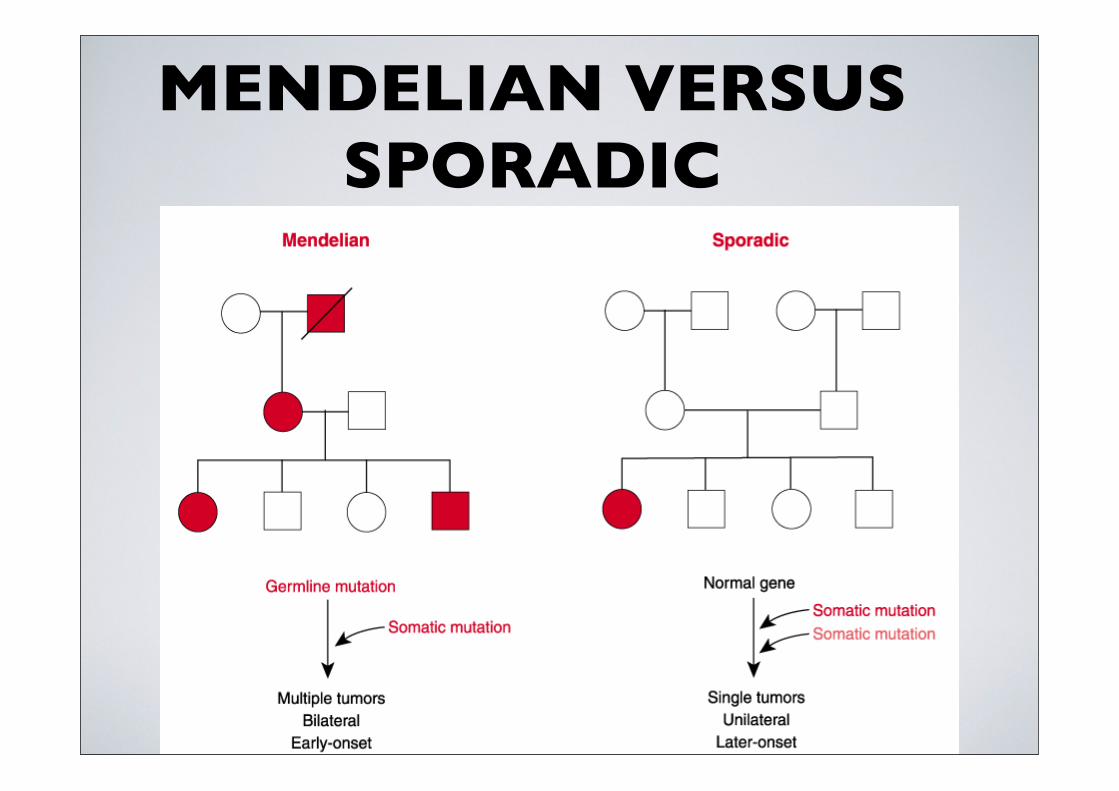
MENDELIAN VERSUS SPORADIC
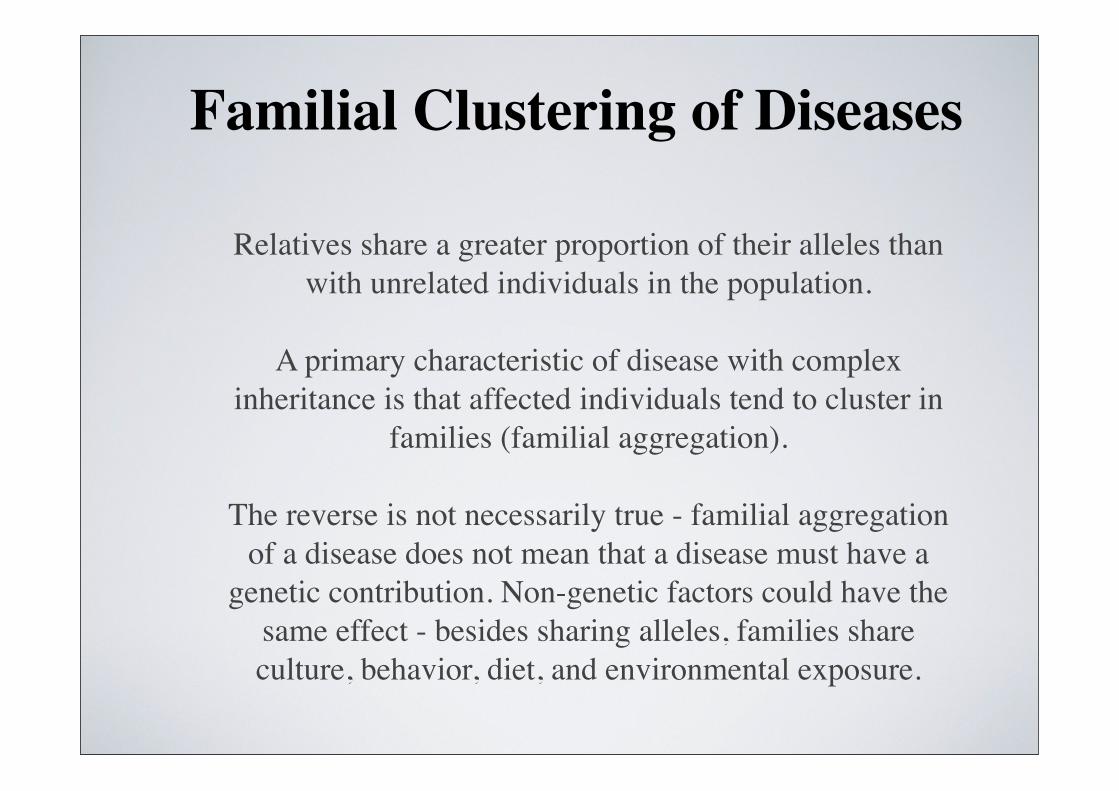
Familial Clustering of Diseases
Relatives share a greater proportion of their alleles than with unrelated individuals in the population.
A primary characteristic of disease with complex inheritance is that affected individuals tend to cluster in
families (familial aggregation).
The reverse is not necessarily true - familial aggregation of a disease does not mean that a disease must have a
genetic contribution. Non-genetic factors could have the same effect - besides sharing alleles, families share culture, behavior, diet, and environmental exposure.
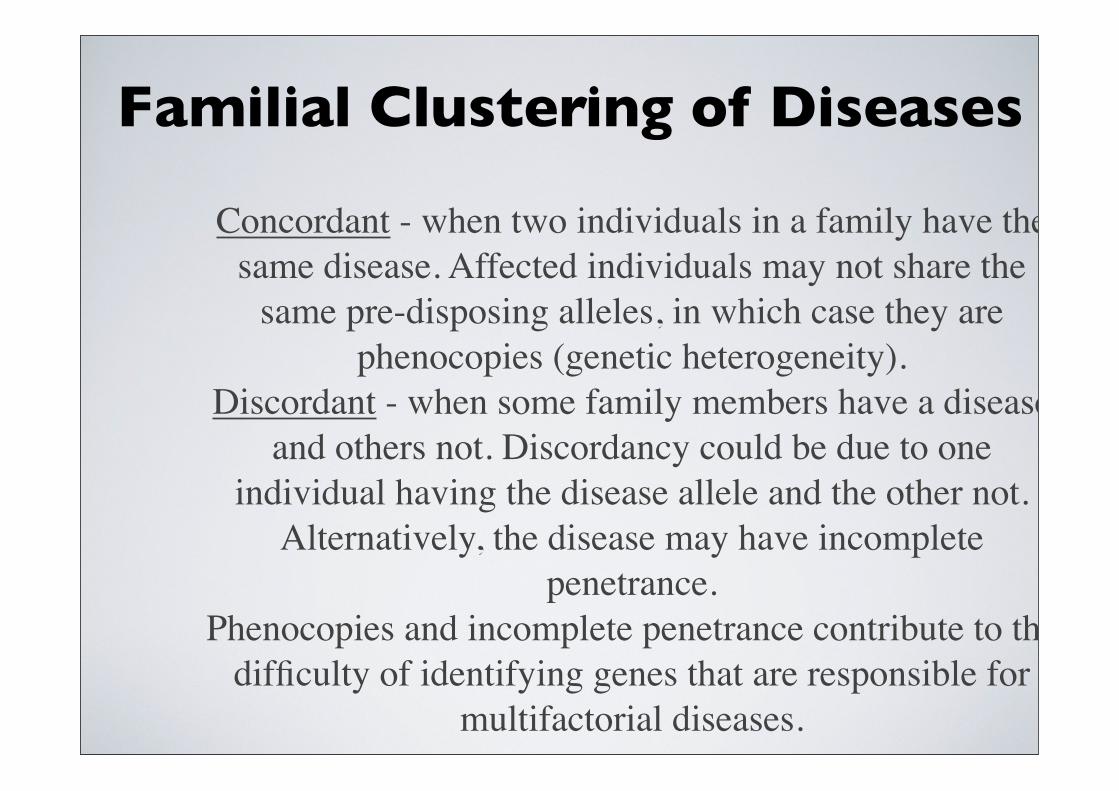
Familial Clustering of Diseases
Concordant - when two individuals in a family have the same disease. Affected individuals may not share the
same pre-disposing alleles, in which case they are phenocopies (genetic heterogeneity).
Discordant - when some family members have a disease and others not. Discordancy could be due to one
individual having the disease allele and the other not. Alternatively, the disease may have incomplete
penetrance.Phenocopies and incomplete penetrance contribute to the
difficulty of identifying genes that are responsible for multifactorial diseases.
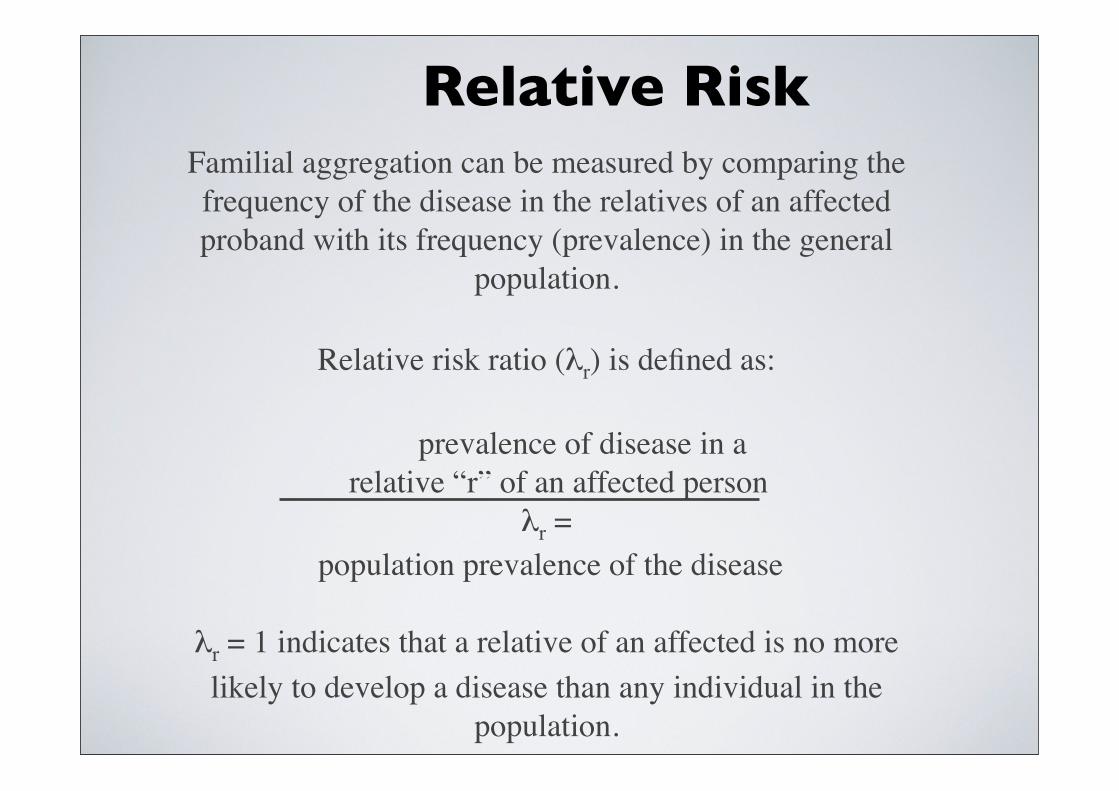
Familial aggregation can be measured by comparing the frequency of the disease in the relatives of an affected proband with its frequency (prevalence) in the general
population.
Relative risk ratio (λr) is defined as:
prevalence of disease in a relative “r” of an affected person
λr = population prevalence of the disease
λr = 1 indicates that a relative of an affected is no more likely to develop a disease than any individual in the
population.
Relative Risk
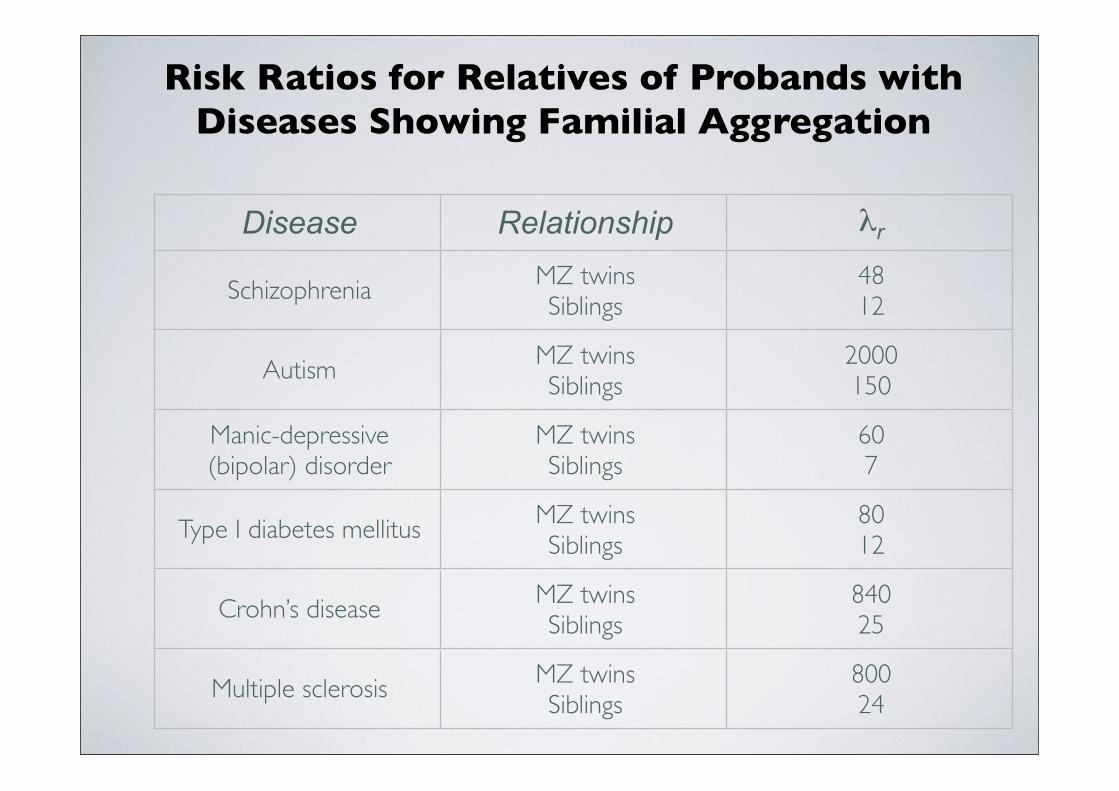
Risk Ratios for Relatives of Probands with Diseases Showing Familial Aggregation
Disease Relationship λr
Schizophrenia MZ twinsSiblings
4812
Autism MZ twinsSiblings
2000150
Manic-depressive (bipolar) disorder
MZ twinsSiblings
607
Type I diabetes mellitus MZ twinsSiblings
8012
Crohn’s disease MZ twinsSiblings
84025
Multiple sclerosis MZ twinsSiblings
80024
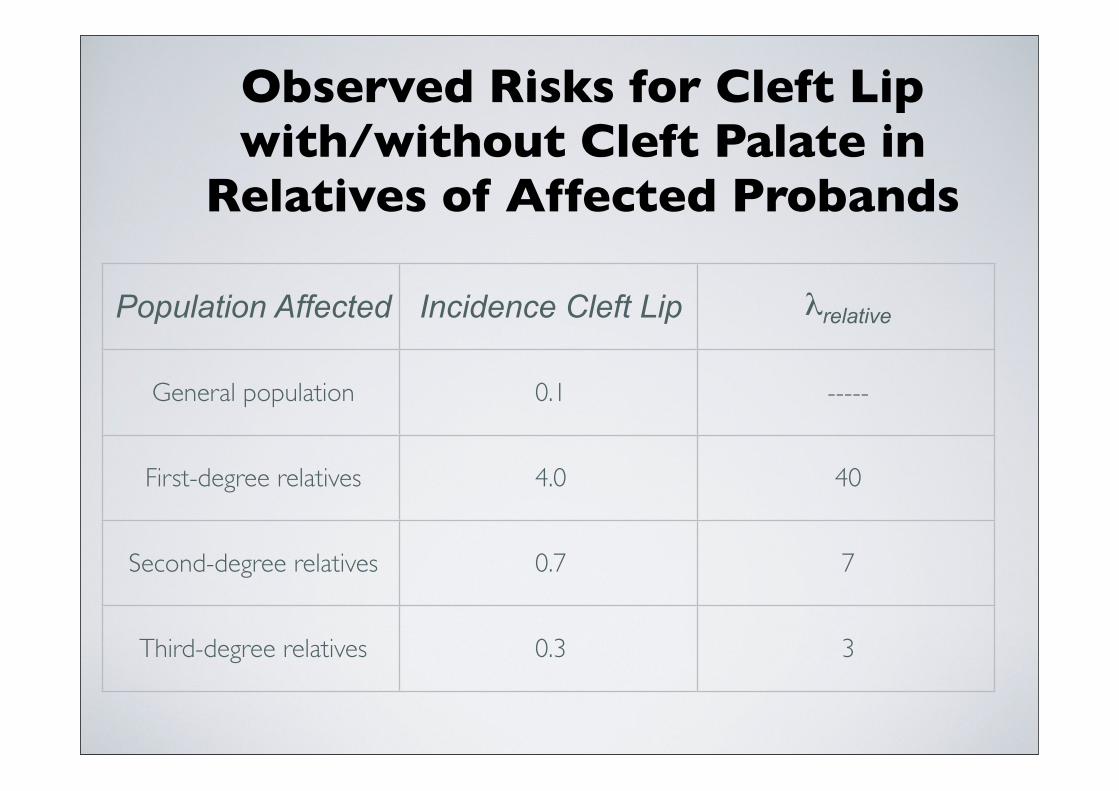
Observed Risks for Cleft Lip with/without Cleft Palate in
Relatives of Affected Probands
Population Affected Incidence Cleft Lip λrelative
General population 0.1 -----
First-degree relatives 4.0 40
Second-degree relatives 0.7 7
Third-degree relatives 0.3 3
Case-Control Studies
Another approach to assessing familial aggregation in which patients with a disease (the cases) are compared with suitably chosen individuals without the disease
(the controls) with respect to family history of disease (it is also important to randomize other variables such as environmental exposures, occupation, geographical
location, parity, previous illnesses, ethnicity, etc).
To assess a possible genetic contribution to familial aggregation of a disease, the frequency with which the disease is found in the extended families of the cases
(positive family history) is compared with the frequency of positive family history among suitable
controls that do not have the disease.
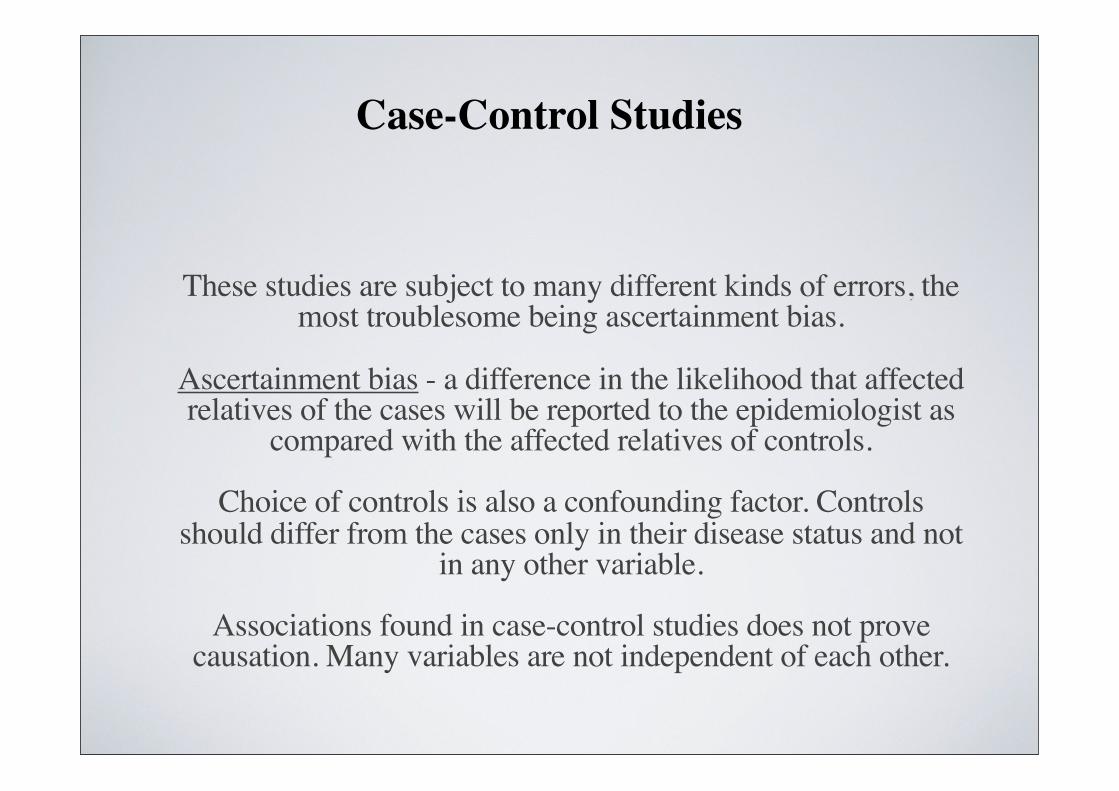
Case-Control Studies
These studies are subject to many different kinds of errors, the most troublesome being ascertainment bias.
Ascertainment bias - a difference in the likelihood that affected relatives of the cases will be reported to the epidemiologist as
compared with the affected relatives of controls.
Choice of controls is also a confounding factor. Controls should differ from the cases only in their disease status and not
in any other variable.
Associations found in case-control studies does not prove causation. Many variables are not independent of each other.
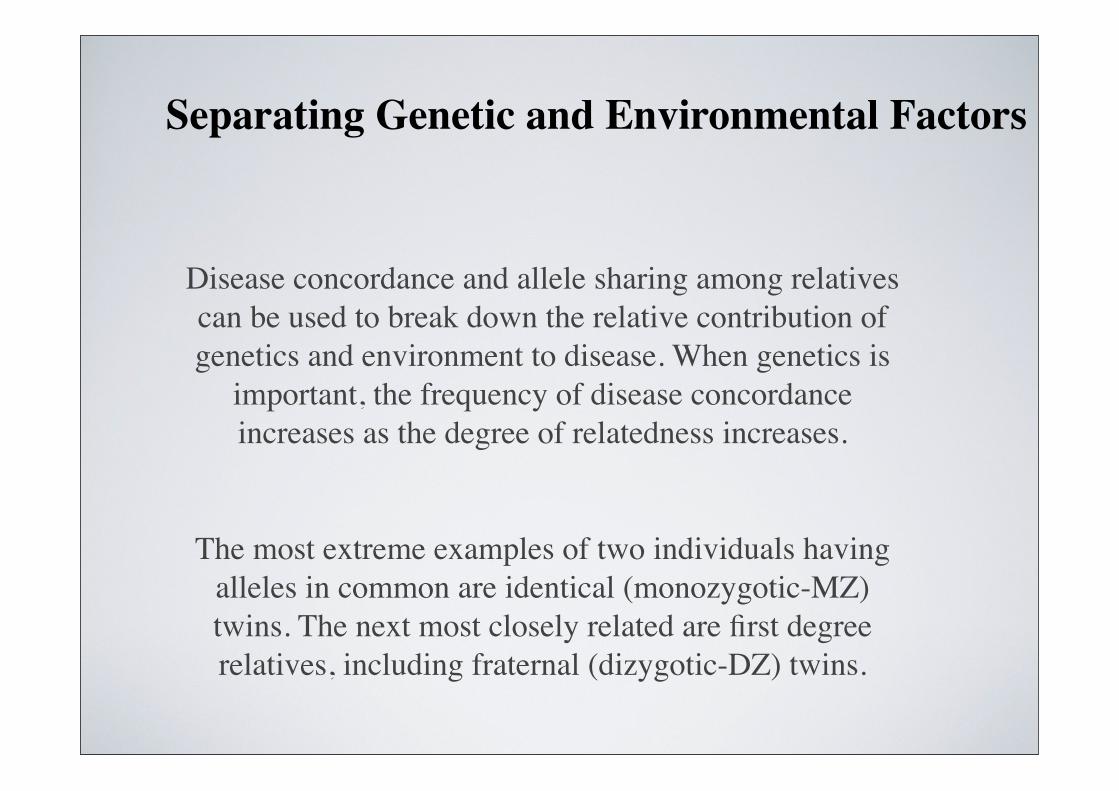
Separating Genetic and Environmental Factors
Disease concordance and allele sharing among relatives can be used to break down the relative contribution of genetics and environment to disease. When genetics is
important, the frequency of disease concordance increases as the degree of relatedness increases.
The most extreme examples of two individuals having alleles in common are identical (monozygotic-MZ) twins. The next most closely related are first degree relatives, including fraternal (dizygotic-DZ) twins.
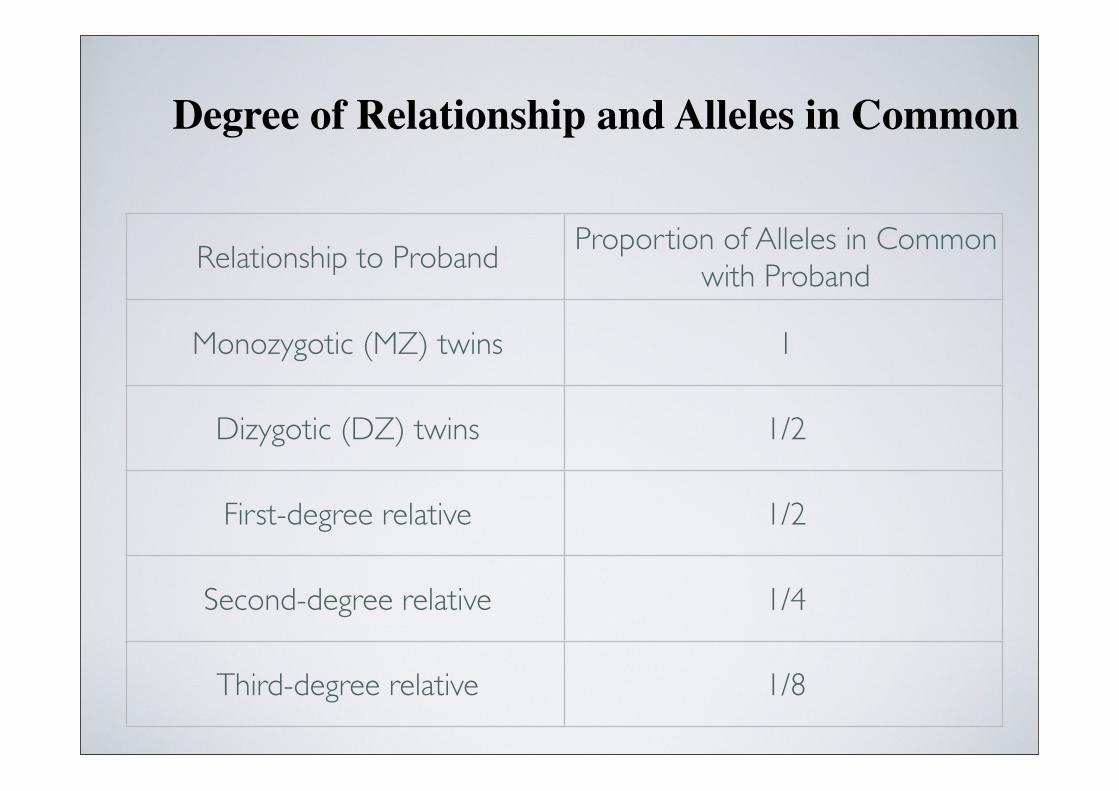
Degree of Relationship and Alleles in Common
Relationship to ProbandProportion of Alleles in Common
with Proband
Monozygotic (MZ) twins 1
Dizygotic (DZ) twins 1/2
First-degree relative 1/2
Second-degree relative 1/4
Third-degree relative 1/8
Disease concordance less than 100% in MZ twins is strong evidence that non-genetic factors play a role in the disease.
Greater concordance in MZ versus DZ twins is strong evidence of a genetic component to the disease.
An important exception is X-linked diseases. In females, discordance could also be due to differences in the proportion
of maternal versus paternal X that is inactivated.
Genetic Analysis of Complex Traits
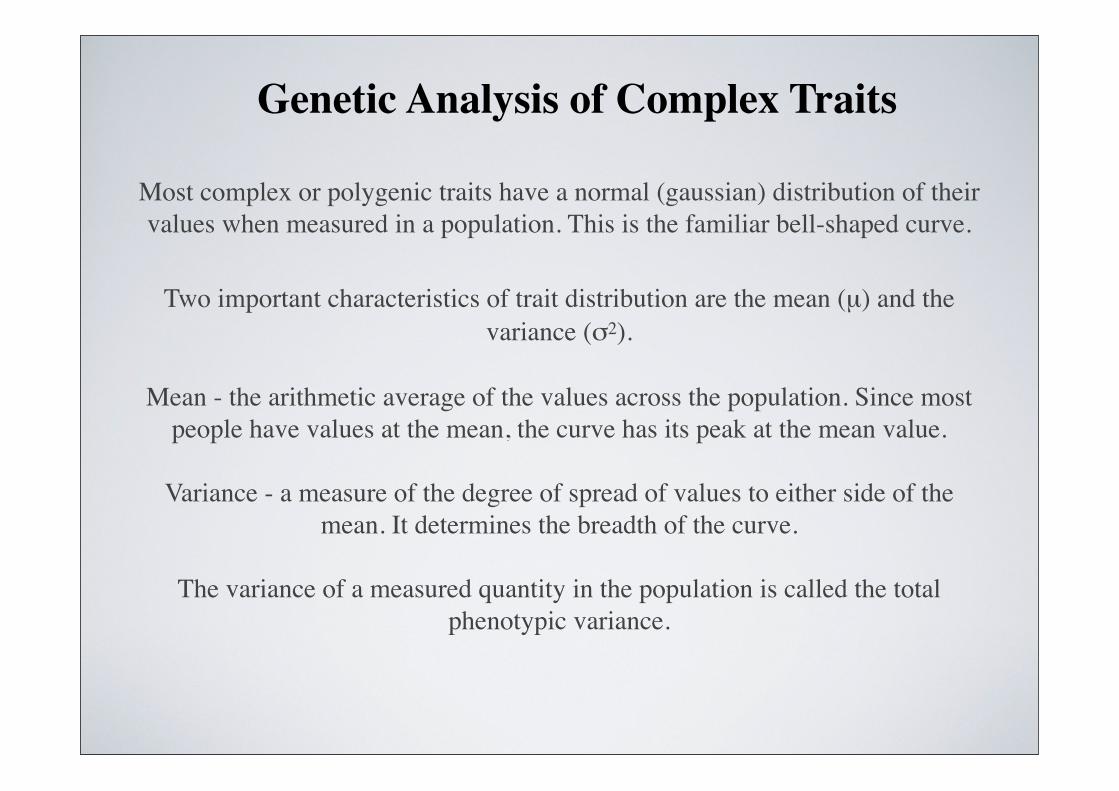
Most complex or polygenic traits have a normal (gaussian) distribution of their values when measured in a population. This is the familiar bell-shaped curve.
Two important characteristics of trait distribution are the mean (µ) and the variance (σ2).
Mean - the arithmetic average of the values across the population. Since most people have values at the mean, the curve has its peak at the mean value.
Variance - a measure of the degree of spread of values to either side of the mean. It determines the breadth of the curve.
The variance of a measured quantity in the population is called the total phenotypic variance.
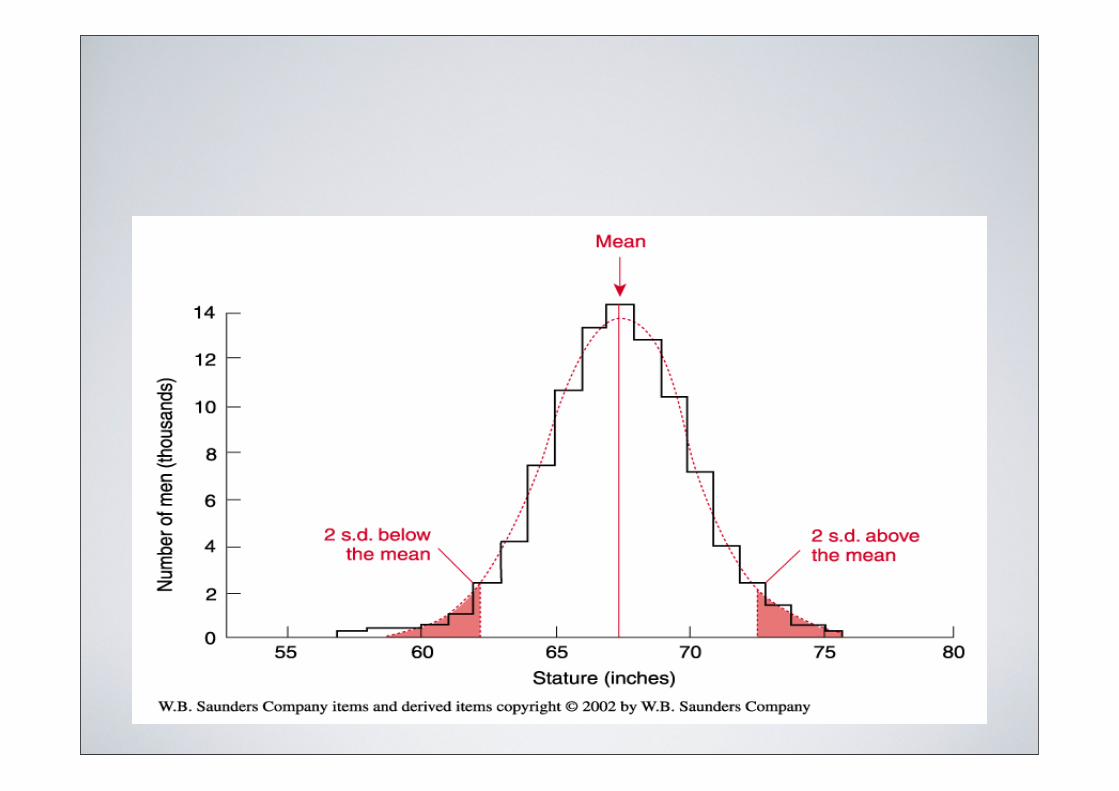
The concept of a normal range for traits is fundamental to clinical medicine. However, the distance a measurement is from the mean before it is considered abnormal is somewhat random. In general, a trait is considered abnormal (out of the range of normal values) if the value of the trait is greater than 2 standard deviations away
from the population mean.
Family studies can also be used to determine the role of genetics versus environment in the expression of complex traits. With
families,the coefficient of correlation (r) provides a measure of correlation of particular traits among relatives compared to the
general population.
r can range from 0, no correlation, to +1 for perfect positive correlation and to -1 for perfect negative correlation.
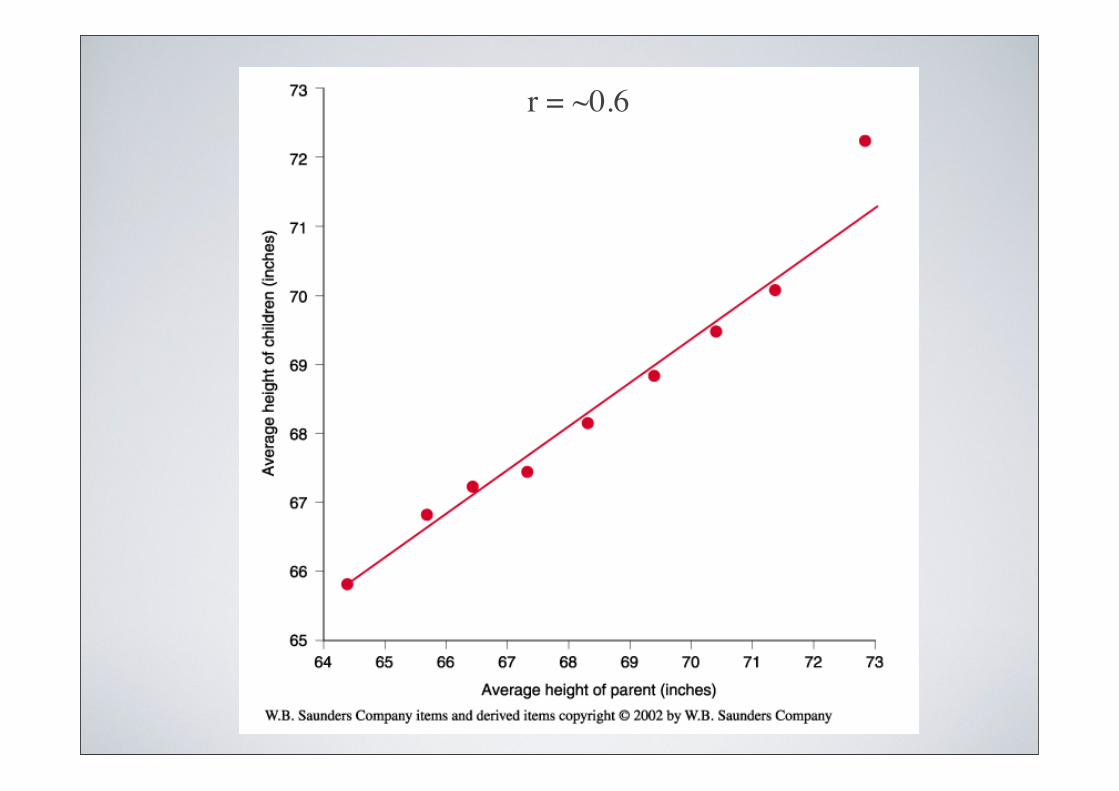
r = ~0.6
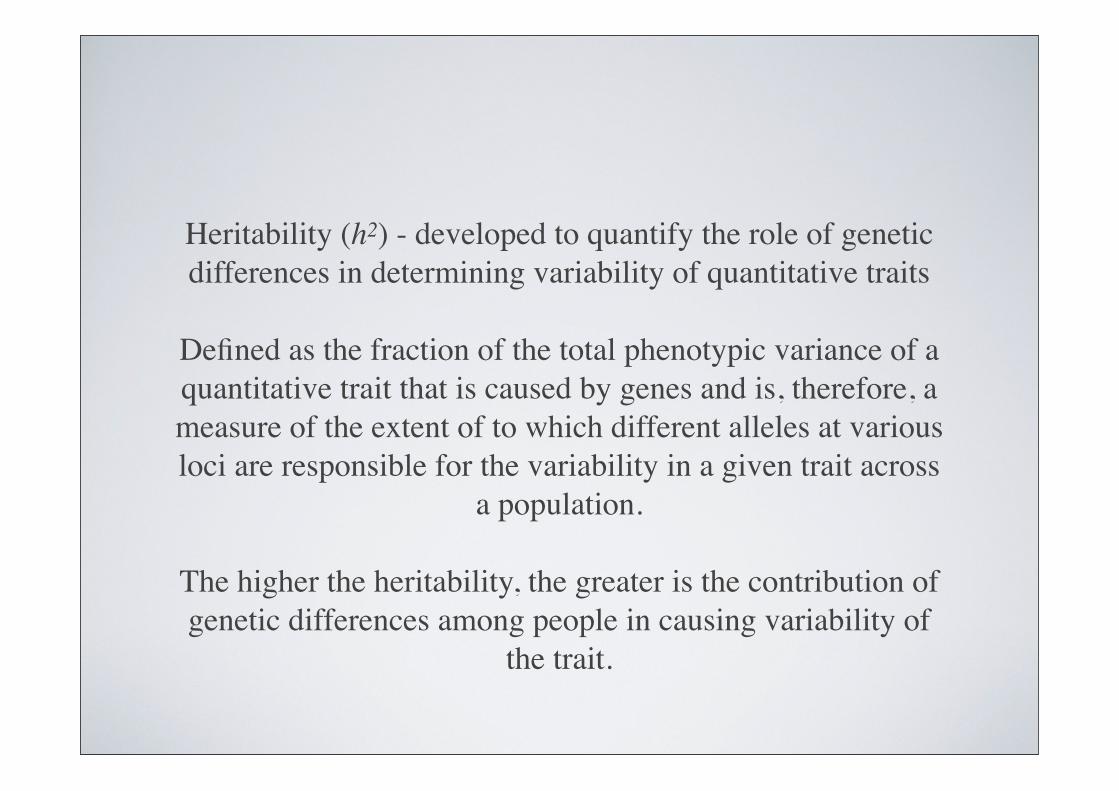
Heritability (h2) - developed to quantify the role of genetic differences in determining variability of quantitative traits
Defined as the fraction of the total phenotypic variance of a quantitative trait that is caused by genes and is, therefore, a measure of the extent of to which different alleles at various loci are responsible for the variability in a given trait across
a population.
The higher the heritability, the greater is the contribution of genetic differences among people in causing variability of
the trait.
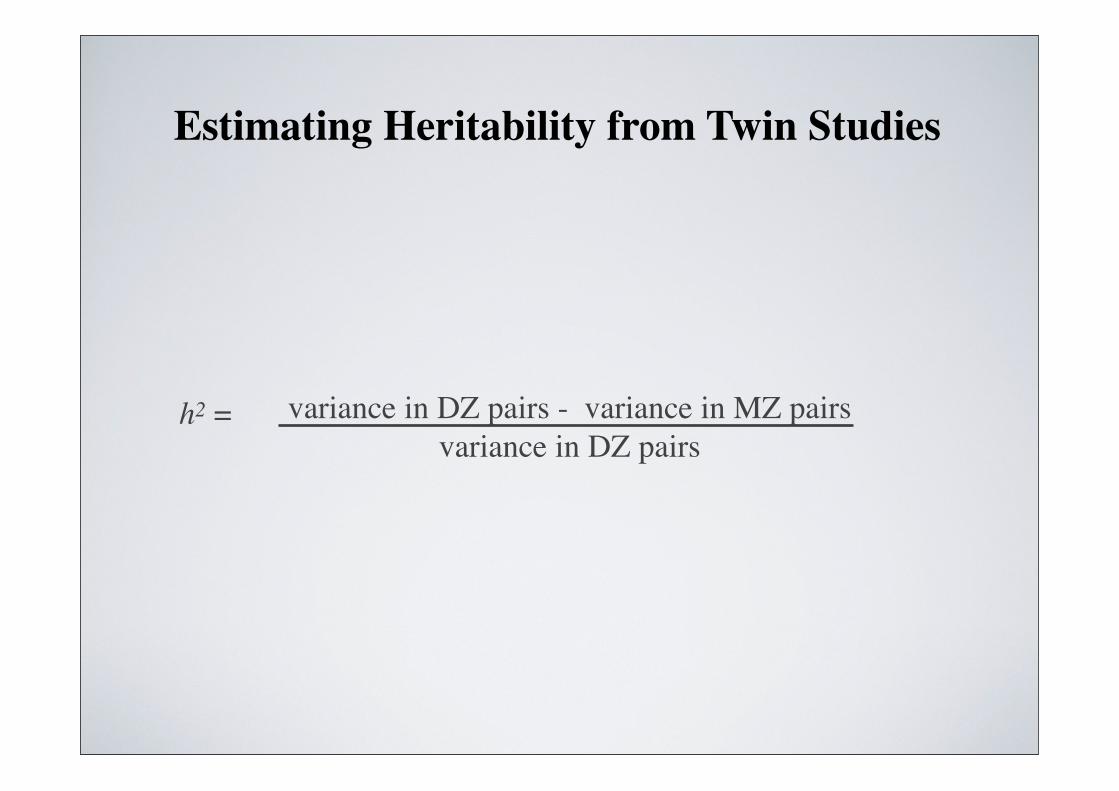
Estimating Heritability from Twin Studies
variance in DZ pairs - variance in MZ pairs variance in DZ pairs
h2 =
Genetic Mapping of Complex Traits
Two major approaches have been developed (with many variants of these for special disease models).
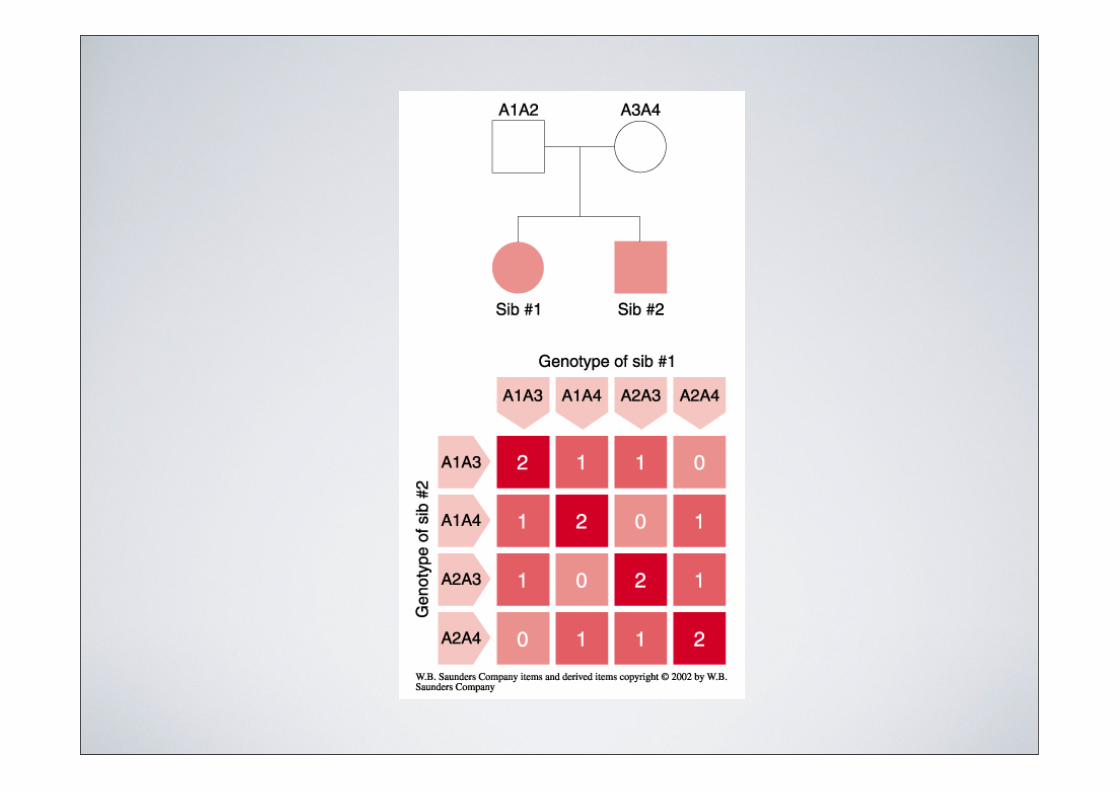
Affected pedigree method - type of linkage analysis that relies on pairs of family members who are concordant for the trait. Sibling-sibling or parent-sibling pairs are
based upon the concept of identity-by-decent. The pairs share stretches of DNA in common through a direct
inherited lineage.
Association method - is based upon the presumption that there is an increased frequency of particular alleles in affected
compared with unaffected individuals in the population.
Genetic Mapping of Complex Traits
Mapping Models
Typical linkage analysis, like used for single gene Mendelian traits, is rarely applicable to complex traits. This approach is model-based (parametric) because it assumes that there is a
particular mode of inheritance.
With complex traits, the mode of inheritance is not known. Therefore, model-free (non-parametric) approaches are used. These approaches make no assumptions about the number of
loci, the role of environment, or penetrance.
Model-free methods solely depend on the assumption that two affected relatives will have disease-predisposing alleles in
common.
Limitations of Complex Trait Analysis
Complex epistatic interactionsGenetic heterogeneityPleiotropyHistory of mutations/polymorphismsPopulation stratification