Embed Size (px)
Citation preview
Polyclonal breast cancer metastases arise fromcollective dissemination of keratin 14-expressingtumor cell clustersKevin J. Cheunga,b,c,d,1, Veena Padmanabana,b,c, Vanesa Silvestria,b,c, Koen Schippera,b,c, Joshua D. Cohena,b,c,Amanda N. Fairchilda,b,c, Michael A. Gorine, James E. Verdonee, Kenneth J. Pientae, Joel S. Baderf,and Andrew J. Ewalda,b,c,1
aDepartment of Cell Biology, The Johns Hopkins University School of Medicine, Baltimore, MD 21205; bDepartment of Oncology, The Johns HopkinsUniversity School of Medicine, Baltimore, MD 21205; cDepartment of Biomedical Engineering, The Johns Hopkins University School of Medicine, Baltimore,MD 21205; dTranslational Research Program, Public Health Sciences Division, Fred Hutchinson Cancer Research Center, Seattle, WA 98109; eThe JamesBuchanan Brady Urological Institute and Department of Urology, The Johns Hopkins University School of Medicine, Baltimore, MD 21287; and fDepartmentof Biomedical Engineering, The Johns Hopkins University, Baltimore, MD 21205
Edited by Joan S. Brugge, Harvard Medical School, Boston, MA, and approved December 23, 2015 (received for review April 30, 2015)
Recent genomic studies challenge the conventional model that eachmetastasis must arise from a single tumor cell and instead revealthat metastases can be composed of multiple genetically distinctclones. These intriguing observations raise the question: How dopolyclonal metastases emerge from the primary tumor? In thisstudy, we used multicolor lineage tracing to demonstrate that poly-clonal seeding by cell clusters is a frequent mechanism in a commonmouse model of breast cancer, accounting for >90% of metastases.We directly observed multicolored tumor cell clusters across majorstages of metastasis, including collective invasion, local dissemina-tion, intravascular emboli, circulating tumor cell clusters, and micro-metastases. Experimentally aggregating tumor cells into clustersinduced a >15-fold increase in colony formation ex vivo anda >100-fold increase in metastasis formation in vivo. Intriguingly,locally disseminated clusters, circulating tumor cell clusters, and lungmicrometastases frequently expressed the epithelial cytoskeletalprotein, keratin 14 (K14). RNA-seq analysis revealed that K14+ cellswere enriched for desmosome and hemidesmosome adhesion complexgenes, and were depleted for MHC class II genes. Depletion of K14expression abrogated distant metastases and disrupted expression ofmultiplemetastasis effectors, including Tenascin C (Tnc), Jagged1 (Jag1),and Epiregulin (Ereg). Taken together, our findings reveal K14 as a keyregulator of metastasis and establish the concept that K14+ epithelialtumor cell clusters disseminate collectively to colonize distant organs.
collective invasion | collective dissemination | polyclonal metastasis |breast cancer | keratin 14
During metastasis, cancer cells escape the primary tumor,travel through the circulation, and colonize distant organs.
Conventional models of cancer progression propose that eachmetastasis arises from the clonal outgrowth of a single tumor celland this conceptual framework is a foundation for models, suchas epithelial-mesenchymal transition (EMT) and migratory cancerstem cells (1).Challenging the generality of the single-cell/single-metastasis
model are long-standing clinical observations that tumor cell clusters(also termed “tumor clumps”) are also observed across the stages ofmetastasis. Tumor cell clusters are detected in the bloodstreamof cancer patients (2), clusters can efficiently seed metastases (3),and though rare, circulating tumor cell (CTC) clusters haveprognostic significance (4, 5). Furthermore, metastases are com-posed of multiple genetically distinct tumor cell clones, in mousemodels of breast, pancreas, and small cell carcinoma (5–7), and inhuman metastatic prostate cancer patients (8). Taken together,these observations provide accumulating evidence that tumor cellclusters contribute to metastasis. However, they leave unresolvedtwo important questions: how do tumor cell clusters emerge fromthe primary tumor, and which molecular features identify cellclusters that metastasize?
An important clinical observation is that cancer cells invadethe surrounding stroma as cohesive clusters in the majority ofepithelial tumors, a process termed “collective invasion” (9, 10).In breast cancer, collective invasion is facilitated by invasiveleader cells, a subpopulation of tumor cells that highly expresskeratin 14 (K14) and other basal epithelial markers (11). K14+
cells are migratory, protrusive, and lead trailing K14− cells, whilemaintaining cell–cell cohesion and E-cadherin–based cell contacts.In this study, we sought to understand how these K14+ cells
exit collective invasion strands in the primary tumor and travel todistant organs (12). One hypothesis is that collective invasion isan intermediate step toward eventual single-cell disseminationand monoclonal metastasis. However, tumor cell clusters aredetected in circulation (5) and primary human breast tumors candisseminate collectively into the surrounding extracellular matrixin ex vivo assays (13–15). These data prompted an alternativehypothesis, that collectively invading K14+ cancer cells couldinitiate and complete the metastatic process as a cohesive mul-ticellular unit. Here we define the clonal nature of metastases in
Significance
Conventional models of cancer progression propose that singlecells leave the primary tumor, enter the circulation, and seedclonal metastases. However, metastases can contain multipleclones, raising the question: How do polyclonal metastasesform? We demonstrate that cancer cells seed distant organs ascohesive clusters, composed of two molecularly distinct sub-populations, whose proportions vary systematically duringmetastasis. We establish that collective dissemination is a frequentmechanism for metastasis and identify a molecular program inthe most invasive, keratin 14+ (K14+) cancer cells, regulatingcell–cell adhesion, cell–matrix adhesion, and immune evasion.We demonstrate that this metastatic phenotype is dependentupon K14 expression. Understanding the molecular basis ofcollective dissemination may therefore enable novel prognos-tics and therapies to improve patient outcomes.
Author contributions: K.J.C., V.P., V.S., K.S., A.N.F., M.A.G., K.J.P., J.S.B., and A.J.E. de-signed research; K.J.C., V.P., V.S., K.S., J.D.C., A.N.F., M.A.G., and J.E.V. performed re-search; K.J.C., J.D.C., M.A.G., J.E.V., K.J.P., and J.S.B. contributed new reagents/analytictools; K.J.C., V.P., V.S., K.S., J.D.C., A.N.F., M.A.G., J.E.V., J.S.B., and A.J.E. analyzed data;and K.J.C. and A.J.E. wrote the paper.
The authors declare no conflict of interest.
This article is a PNAS Direct Submission.
Data deposition: RNA-seq data have been uploaded to the NCBI Sequence Read Archive,www.ncbi.nlm.nih.gov/sra (accession nos. SRP066319 and SRP066316).1To whom correspondence may be addressed. Email: [email protected] or [email protected].
This article contains supporting information online at www.pnas.org/lookup/suppl/doi:10.1073/pnas.1508541113/-/DCSupplemental.
E854–E863 | PNAS | Published online February 1, 2016 www.pnas.org/cgi/doi/10.1073/pnas.1508541113
Dow
nloa
ded
by g
uest
on
Mar
ch 5
, 202
0
a spontaneous mouse model of metastasis to the lungs (16, 17),in which the predominant invasive form in the primary tumor iscollective invasion strands led by K14+ cells (11). We establishthat the majority of metastases arise from polyclonal seeds, andshow that disseminated tumor cell clusters are predominantlycomposed of K14+ cells. We propose a mechanism for polyclonalmetastasis via the collective invasion, dissemination, and colo-nization of clusters of K14+ cancer cells.
ResultsMulticolor Fluorescent Lineage Tracing Identifies Frequent PolyclonalMetastasis in a Mouse Model of Breast Cancer. To define the clonalorigin of metastasis in a model of collective invasion, we de-veloped a multicolor lineage-tracing strategy in a commonly usedmouse model of breast cancer, MMTV-PyMT, which has pro-vided fundamental insights into diverse aspects of metastaticprogression (16, 17). In this model, the MMTV promoter drives
A Adenoviral CreRecombinase
Orthotopic mammarytransplant
ROSAmT/mG MMTV-PyMT tumor organoids
loxPloxPmTomato mGFPCMV enh Count lung
metastases
Potential outcomes at the metastatic site
obligate monoclonal origin
Polyclonal origin
Sequence MulticoloredMetastases?
Model
No
Yes
mTomato mGFP DAPI
2 cells 3 cells
10 cells
20+ 100+ 1000+
4 cells
20 m
B Multicolored lung metastases
20μm
Input: ROSAmT/mG
tumor organoid + CreDC
mTomato mGFP
2mm
2% 10% 30%Local mixing ofprimary tumor(% Maximum)
1% 20% 61%% Multicolored(Lung metastases)
PrimaryTumor
Tumor 1 Tumor 2 Tumor 3
Local mixing%
Low High
E
0
20
40
60
0 10 20 30
% M
ultic
olor
ed(L
ung
Met
asta
ses)
Local mixing ofprimary tumor(% Maximum)
p < 0.001
6-8 weeks
mTomato mGFP
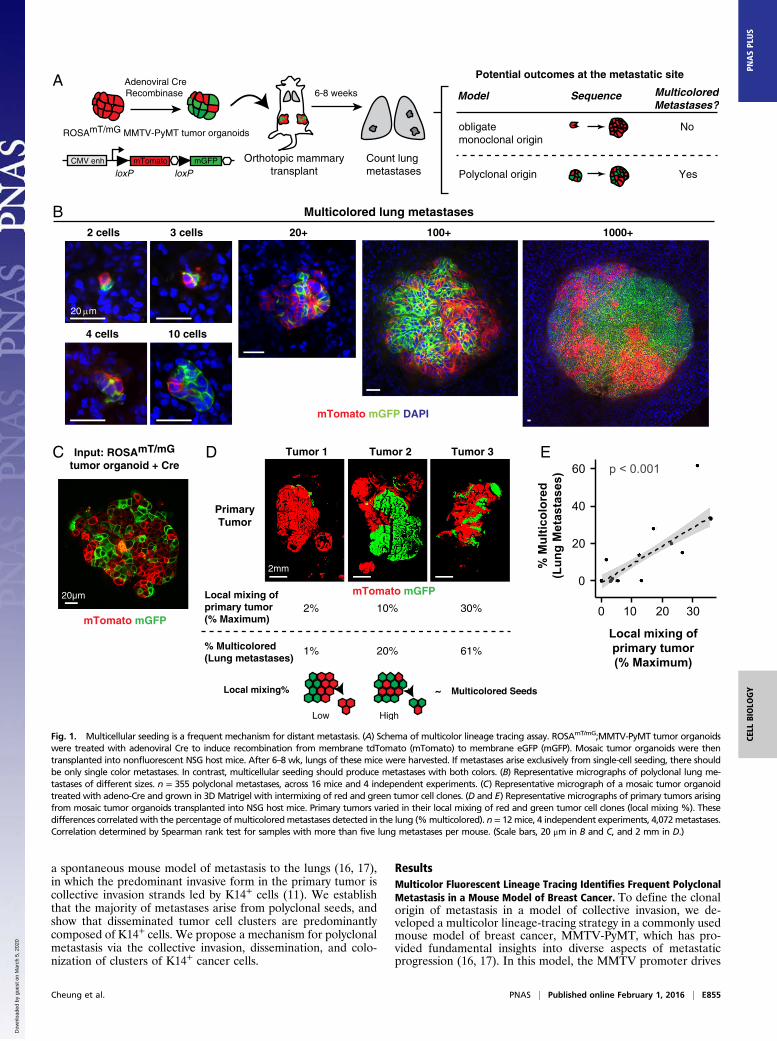
Fig. 1. Multicellular seeding is a frequent mechanism for distant metastasis. (A) Schema of multicolor lineage tracing assay. ROSAmT/mG;MMTV-PyMT tumor organoidswere treated with adenoviral Cre to induce recombination from membrane tdTomato (mTomato) to membrane eGFP (mGFP). Mosaic tumor organoids were thentransplanted into nonfluorescent NSG host mice. After 6–8 wk, lungs of these mice were harvested. If metastases arise exclusively from single-cell seeding, there shouldbe only single color metastases. In contrast, multicellular seeding should produce metastases with both colors. (B) Representative micrographs of polyclonal lung me-tastases of different sizes. n = 355 polyclonal metastases, across 16 mice and 4 independent experiments. (C) Representative micrograph of a mosaic tumor organoidtreated with adeno-Cre and grown in 3DMatrigel with intermixing of red and green tumor cell clones. (D and E) Representative micrographs of primary tumors arisingfrom mosaic tumor organoids transplanted into NSG host mice. Primary tumors varied in their local mixing of red and green tumor cell clones (local mixing %). Thesedifferences correlated with the percentage of multicoloredmetastases detected in the lung (%multicolored). n = 12mice, 4 independent experiments, 4,072metastases.Correlation determined by Spearman rank test for samples with more than five lung metastases per mouse. (Scale bars, 20 μm in B and C, and 2 mm in D.)
Cheung et al. PNAS | Published online February 1, 2016 | E855
CELL
BIOLO
GY
PNASPL
US
Dow
nloa
ded
by g
uest
on
Mar
ch 5
, 202
0
mammary epithelial expression of the polyoma virus middle Tantigen (PyMT), a potent activator of PI3K signaling, a hallmarkof human breast cancer. The mammary tumors formed in thismodel show gene expression most similar to luminal B, an aggres-sive subtype of human breast cancer prone to metastasis (18).We generated a convertible double-fluorescent mammary tu-
mor model, ROSAmT/mG;MMTV-PyMT, in which tumor cellsexpress membrane-localized tdTomato (mTomato) and, upontreatment with adenoviral Cre recombinase (adeno-Cre), switchheritably to expression of membrane-localized enhanced GFP.ROSAmT/mG;MMTV-PyMT tumor organoids were treated withadeno-Cre to generate a mixture of red and green cells. Mosaicorganoids were then injected orthotopically into the clearedmammary fat pad of nonfluorescent host mice. Because the hostis nonfluorescent, this experimental system enabled us to unam-biguously identify tumor metastases and their clonal origin (Fig.1A). The principle of this strategy is that if there is an obligatesingle-cell intermediate during the metastatic process, we wouldexpect to see a transition from a multicolored primary tumor (redand green) to singly red or green metastases.In the lungs of these mice, we detected single disseminated
tumor cells, micrometastases (2–50 cells), and macrometastases(>50 cells). Single disseminated tumor cells were 47-fold morefrequent than metastases (range 10- to 150-fold, n = 10 mice).We reasoned that if lung metastases arose exclusively fromseeding of single disseminated tumor cells, then each lung me-tastasis should express only one color. In contrast, multicellularseeding should be able to produce metastases with both colors.Interestingly, we observed lung metastases composed of bothred and green tumor cells across a range of sizes, from 2 cellsto >1,000 cells per metastasis (Fig. 1B) (n = 375 multicoloredmetastases). Multicolored metastases demonstrated significantintermixing of red and green tumor cells. Transplanted miceshowed wide variation in the percentage of multicolored me-tastases from a minimum of 0% to a maximum of 61% (n = 158multicolored out of 257 metastases). Taken together, our datashow that multicolored metastases can occur frequently in theMMTV-PyMT model.To understand our variable frequency of detection of multi-
colored metastases, we analyzed the degree of mixing of red andgreen tumor cell clones at each step in our experiments. Whereasred and green tumor cells were well mixed in the recombinedtumor organoids used as input (Fig. 1C), the tumors that resultedfrom transplanting these organoids showed surprisingly widevariation in the mixing of red and green tumor cells. We ob-served tumors composed almost entirely of a single color to tu-mors with significant intermixing of red and green zones (Fig.1D). To analyze this variation further, we quantified the localmixing of red and green cells within each tumor. Local mixingwas assessed in 100 × 100-pixel (1.3 mm × 1.3 mm) regions tiledacross the tumor by calculating the probability of selecting twocolors when pixel values were chosen at random within eachregion. We observed a strong linear correlation between theextent of local mixing and the percentage of detected multicol-ored metastases (Fig. 1E). Thus, local proximity between clonesof different colors in the primary tumor determines our ability todetect multicolored metastases. Based on our analysis of therelationship between local mixing and the detection of multi-colored metastases (Fig. 1E), we estimate that >97% of metas-tases were formed from multicellular seeds (95% confidenceinterval 74–100%).We also determined the frequency of multicolored metastases
in two additional transplant models. In MMTV-PyMT tumorsexpressing the Confetti lineage reporter (Fig. S1A), tumor cellsare induced by adeno-Cre to one of five distinct possible colors:cytoplasmic red fluorescent protein (RFP), cytoplasmic yellowfluorescent protein (YFP), nuclear GFP (nGFP), membrane cyanfluorescent protein (mCFP), or an unrecombined no-color (19).We observed zonal patches of a single color in the primary tumor,with a clear preference for the unrecombined no-color (Fig. S1B).Even with this limitation, we observed lung metastases composed
of both no-color and RFP+ tumor cells (Fig. S1C). In MMTV-PyMT tumors expressing the Rainbow reporter (Fig. S1D), adeno-Cre induces recombination to one of 21 different color values(20). Despite the increased color diversity, we similarly observedzonal patches of a single color in the primary tumor, with pref-erence for a no-color tumor cell (Fig. S1E). In the lungs of thesemice, we observed multiple metastases composed of one to fourdifferent colors (Fig. S1F). Taken together, data from threedistinct lineage analyses reveal polyclonal metastases in this ge-netically engineered mouse model of breast cancer metastasis.
Polyclonal Lung Metastases Arise from Multicellular Seeds and Not bySerial Seeding of Single Tumor Cells. The multicolored metastasesthat we observed could arise via the serial seeding of single tu-mor cells or via colonization by a multicellular cluster of tumorcells. We sought to distinguish these mechanisms in two differentways. To model stochastic serial seeding events integrated overtime, we first isolated organoids from different MMTV-PyMTtumors that constitutively expressed either mTomato or CFP.We then transplanted mTomato+ tumor organoids to the rightflank and CFP+ tumor organoids to the left flank of a nonfluo-rescent host (Fig. S2 A and B). Interestingly, we observed a smalldegree of colonization of CFP+ primary tumors by mTomato+cancer cells, accounting for 1–5% of the total tumor area, de-termined macroscopically in 5 of 11 mice (Fig. S2B, Lower, andFig. S2 C and C′). These data are consistent with the reportedability of metastases to reseed primary tumors, termed “tumorself-seeding” (21). Importantly, when we examined the clonalcomposition in the lungs, we only observed single-colored me-tastases (Fig. S2D). Taken together, these data establish thatpolyclonal metastases do not efficiently arise from serial seeding.To extend this finding, we modeled serial seeding by waves of
disseminated tumor cells in the bloodstream. In this second ex-perimental approach, we transplanted mTomato+ and CFP+tumor cells serially via tail-vein injection (Fig. S2E). mTomato+tumor cells were isolated by FACS and then injected as a single-cell suspension into a nonfluorescent host. Two days later, CFP+
tumor cells were isolated by FACS and injected as a single-cellsuspension into the same mice. Three weeks later, lungs werecollected and analyzed. In the lung, we observed exclusivelysingle-colored metastases (Fig. S2E). Therefore, serial deliveryof cancer cells to the lungs was not an efficient mechanism forgeneration of polyclonal metastases. In agreement with a recentstudy revealing metastases from oligoclonal clusters in breastcancer cell lines (5), our data are most consistent with a model inwhich polyclonal metastases occur via colonization by multicel-lular seeds rather than serial arrival and aggregation of singletumor cells.
Direct Observation of Polyclonal Collective Invasion, PolyclonalDisseminated Tumor Emboli, and Polyclonal CTC Clusters. Havingshown that polyclonal metastases arise from multicellular seed-ing, we next asked how multicellular seeds emerge from theprimary tumor. To answer this question, we identified tumor cellclusters across stages of metastasis, starting from collective in-vasion at the primary tumor stromal interface. Consistent withour local mixing analysis (Fig. 1 D and E), when we imaged atsingle-cell resolution, transplanted tumors were composed ofzonal patches and collective invasion strands were typicallycomposed of a single color. Despite this technical barrier todetection of polyclonal groups, we observed multicolored col-lective invasion at interfaces between regions of red and greencancer cells (Fig. 2A). In these regions, we reasoned that therewere two outcomes at the tumor–stromal interface correspond-ing to two distinct models for the collective invasive-dissem-inative transition (Fig. 2B). One possibility is that tumor cellsinvade collectively but that dissemination occurs obligately throughsingle cells. In this case, because disseminated clusters should ariseonly from focal proliferation of single cells, disseminated clustersshould be exclusively composed of singly red or green tumorcells. Alternatively, cancer cells could both invade and disseminate
E856 | www.pnas.org/cgi/doi/10.1073/pnas.1508541113 Cheung et al.
Dow
nloa
ded
by g
uest
on
Mar
ch 5
, 202
0
2mm
Multicolored collective invasionA
40μm
mTomato mGFP DAPI
C
D E
Multicolored disseminated tumor cell cluster
mTomato mGFP
B Dissemination Model Outcome
Tumors invade collectivelybut obligately disseminateas single cells
Tumors both invade anddisseminate collectively
mTomato mGFP F-Actin
Mono-clonal
Multi-clonal
Multicolored intravascular emboli
xy
xz
yz
mTomato CFP DAPI VE-Cadherin + CD31
Lumen
Embolus
20μm
F Circulating tumor cell clusters
Ecad
Collective Invasion IntravascularEmbolus
DisseminatedTumor Cell Cluster
mTomatomGFPDAPI
E-cadherin+ multicellular clusters
Multicolored Red Only Cyan Only
mTomatoCFP
DAPIK14
G
05101520
0 20Cluster size (# of cells)10 60
# of
Eve
nts
255075100
1-3 4-6 7+0
Cluster size (# of cells)
K14
+ ce
lls(%
of t
otal
)
H
20μm
20μm
20μm
10μm
10μm
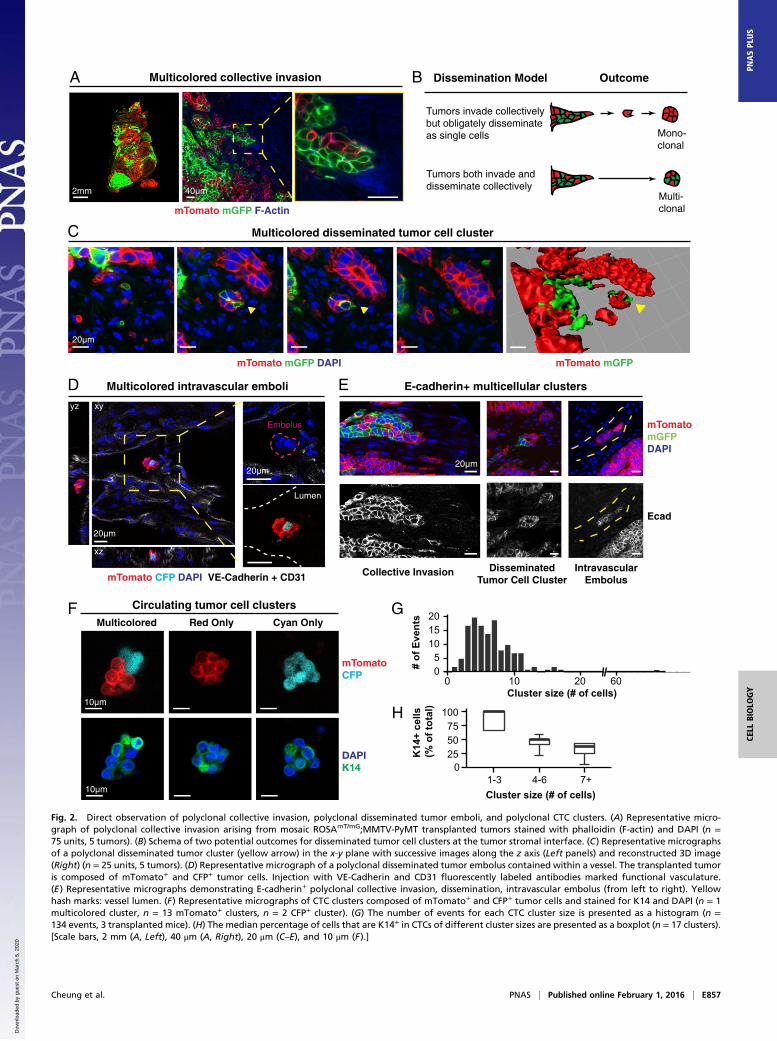
Fig. 2. Direct observation of polyclonal collective invasion, polyclonal disseminated tumor emboli, and polyclonal CTC clusters. (A) Representative micro-graph of polyclonal collective invasion arising from mosaic ROSAmT/mG;MMTV-PyMT transplanted tumors stained with phalloidin (F-actin) and DAPI (n =75 units, 5 tumors). (B) Schema of two potential outcomes for disseminated tumor cell clusters at the tumor stromal interface. (C) Representative micrographsof a polyclonal disseminated tumor cluster (yellow arrow) in the x-y plane with successive images along the z axis (Left panels) and reconstructed 3D image(Right) (n = 25 units, 5 tumors). (D) Representative micrograph of a polyclonal disseminated tumor embolus contained within a vessel. The transplanted tumoris composed of mTomato+ and CFP+ tumor cells. Injection with VE-Cadherin and CD31 fluorescently labeled antibodies marked functional vasculature.(E) Representative micrographs demonstrating E-cadherin+ polyclonal collective invasion, dissemination, intravascular embolus (from left to right). Yellowhash marks: vessel lumen. (F) Representative micrographs of CTC clusters composed of mTomato+ and CFP+ tumor cells and stained for K14 and DAPI (n = 1multicolored cluster, n = 13 mTomato+ clusters, n = 2 CFP+ cluster). (G) The number of events for each CTC cluster size is presented as a histogram (n =134 events, 3 transplanted mice). (H) The median percentage of cells that are K14+ in CTCs of different cluster sizes are presented as a boxplot (n = 17 clusters).[Scale bars, 2 mm (A, Left), 40 μm (A, Right), 20 μm (C–E), and 10 μm (F).]
Cheung et al. PNAS | Published online February 1, 2016 | E857
CELL
BIOLO
GY
PNASPL
US
Dow
nloa
ded
by g
uest
on
Mar
ch 5
, 202
0
collectively as multicellular units. In this case, we would expect toidentify multicolored disseminated clusters.To distinguish these possibilities, we analyzed disseminated
tumor cell clusters at three different stages of the metastaticsequence. First, we observed multicolored disseminated tumorcell clusters ≤200-μm away from the tumor–stromal interface,which we confirmed were fully disconnected from the primarytumor by 3D reconstruction (Fig. 2C). Next, we examined theadjacent vasculature at the tumor–stromal interface (Fig. S3 A–C).We observed both multicolored tumor microemboli and tumormacroemboli composed of >100 tumor cells within vessels (Fig.2D and Fig. S3D). Consistent with their collective organization,we observed membrane-localized E-cadherin in collectively in-vading cancer cells, locally disseminated clusters, and tumor em-boli (Fig. 2E). As a proof of concept, we next isolated CTCs fromthe systemic circulation of a mouse bearing fluorescently labeledtumors. Although this tumor had quite limited local mixing of blueand red clones, we identified both a multicolored and multiplesingly colored CTC clusters (Fig. 2F). We analyzed CTC clustersize in three mice and found that they ranged from 2 to 66 cellsper cluster, with a median of 6 cells (Fig. 2G). Taking these datatogether, our lineage-tracing studies enabled us to observemulticolored tumor cell clusters at five different stages of me-tastasis: collective invasion, locally disseminated clusters in theadjacent stroma, intravasated tumor emboli, CTC clusters, anddistant micro- and macrometastases.
Aggregating Tumor Cells into Clusters Promotes Colony Formation exVivo and Lung Metastatic Colonization in Vivo. An importantquestion raised by these experiments is: Why are multicellularseeds advantageous for metastatic colonization? This question isinteresting because tumor cells typically maintain extensive cell–cell contacts in vivo, and the organization of epithelial cells intocohesive clusters promotes tissue growth in a variety of normaland tumor contexts. For example, doublets of Paneth and Lgr5+
stem cells enhance the organoid-forming potential of single Lgr5+
stem cells (19), whereas the survival of colonic tumor orga-noids is dependent on retaining E-cadherin contacts (22).To model the colonization efficiency of multicellular seeding,
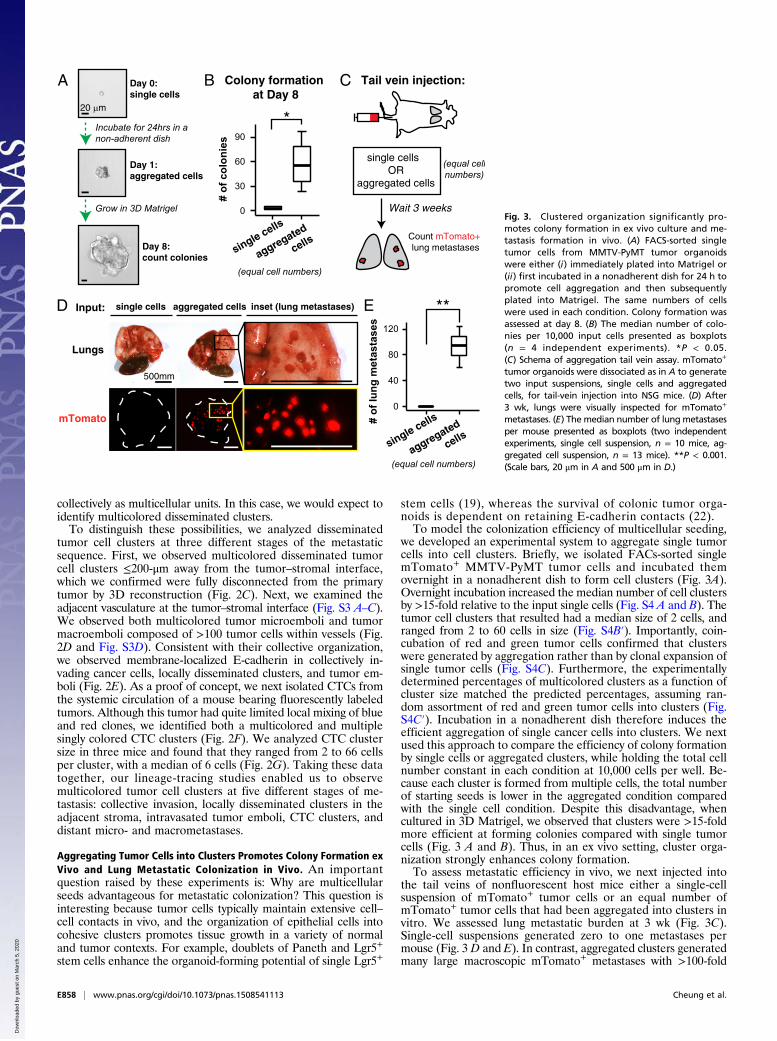
we developed an experimental system to aggregate single tumorcells into cell clusters. Briefly, we isolated FACs-sorted singlemTomato+ MMTV-PyMT tumor cells and incubated themovernight in a nonadherent dish to form cell clusters (Fig. 3A).Overnight incubation increased the median number of cell clustersby >15-fold relative to the input single cells (Fig. S4 A and B). Thetumor cell clusters that resulted had a median size of 2 cells, andranged from 2 to 60 cells in size (Fig. S4B′). Importantly, coin-cubation of red and green tumor cells confirmed that clusterswere generated by aggregation rather than by clonal expansion ofsingle tumor cells (Fig. S4C). Furthermore, the experimentallydetermined percentages of multicolored clusters as a function ofcluster size matched the predicted percentages, assuming ran-dom assortment of red and green tumor cells into clusters (Fig.S4C′). Incubation in a nonadherent dish therefore induces theefficient aggregation of single cancer cells into clusters. We nextused this approach to compare the efficiency of colony formationby single cells or aggregated clusters, while holding the total cellnumber constant in each condition at 10,000 cells per well. Be-cause each cluster is formed from multiple cells, the total numberof starting seeds is lower in the aggregated condition comparedwith the single cell condition. Despite this disadvantage, whencultured in 3D Matrigel, we observed that clusters were >15-foldmore efficient at forming colonies compared with single tumorcells (Fig. 3 A and B). Thus, in an ex vivo setting, cluster orga-nization strongly enhances colony formation.To assess metastatic efficiency in vivo, we next injected into
the tail veins of nonfluorescent host mice either a single-cellsuspension of mTomato+ tumor cells or an equal number ofmTomato+ tumor cells that had been aggregated into clusters invitro. We assessed lung metastatic burden at 3 wk (Fig. 3C).Single-cell suspensions generated zero to one metastases permouse (Fig. 3 D and E). In contrast, aggregated clusters generatedmany large macroscopic mTomato+ metastases with >100-fold
D single cells aggregated cells
Lungs
mTomato
Input: inset (lung metastases) E
0
40
80
120
# of
lung
met
asta
ses
Tail vein injection:
Count mTomato+ lung metastases
Wait 3 weeks
single cells OR
aggregated cells
CColony formation at Day 8
Day 0:single cells
A B
single cells
aggregated
cells
**
single cells
aggregated
cells
# of
col
onie
s0
30
60
90
*
500mm
20 µm
Day 1:aggregated cells
Day 8:count colonies
Incubate for 24hrs in a non-adherent dish
(equal cell numbers)
(equal cell numbers)
(equal cellnumbers)
Grow in 3D MatrigelFig. 3. Clustered organization significantly pro-motes colony formation in ex vivo culture and me-tastasis formation in vivo. (A) FACS-sorted singletumor cells from MMTV-PyMT tumor organoidswere either (i) immediately plated into Matrigel or(ii) first incubated in a nonadherent dish for 24 h topromote cell aggregation and then subsequentlyplated into Matrigel. The same numbers of cellswere used in each condition. Colony formation wasassessed at day 8. (B) The median number of colo-nies per 10,000 input cells presented as boxplots(n = 4 independent experiments). *P < 0.05.(C) Schema of aggregation tail vein assay. mTomato+
tumor organoids were dissociated as in A to generatetwo input suspensions, single cells and aggregatedcells, for tail-vein injection into NSG mice. (D) After3 wk, lungs were visually inspected for mTomato+
metastases. (E) The median number of lungmetastasesper mouse presented as boxplots (two independentexperiments, single cell suspension, n = 10 mice, ag-gregated cell suspension, n = 13 mice). **P < 0.001.(Scale bars, 20 μm in A and 500 μm in D.)
E858 | www.pnas.org/cgi/doi/10.1073/pnas.1508541113 Cheung et al.
Dow
nloa
ded
by g
uest
on
Mar
ch 5
, 202
0
increase in metastatic efficiency relative to single cells (Fig. 3 Dand E). Taken together, these data indicate that cluster organi-zation is sufficient to significantly enhance tumor cell survivaland promote metastasis formation.
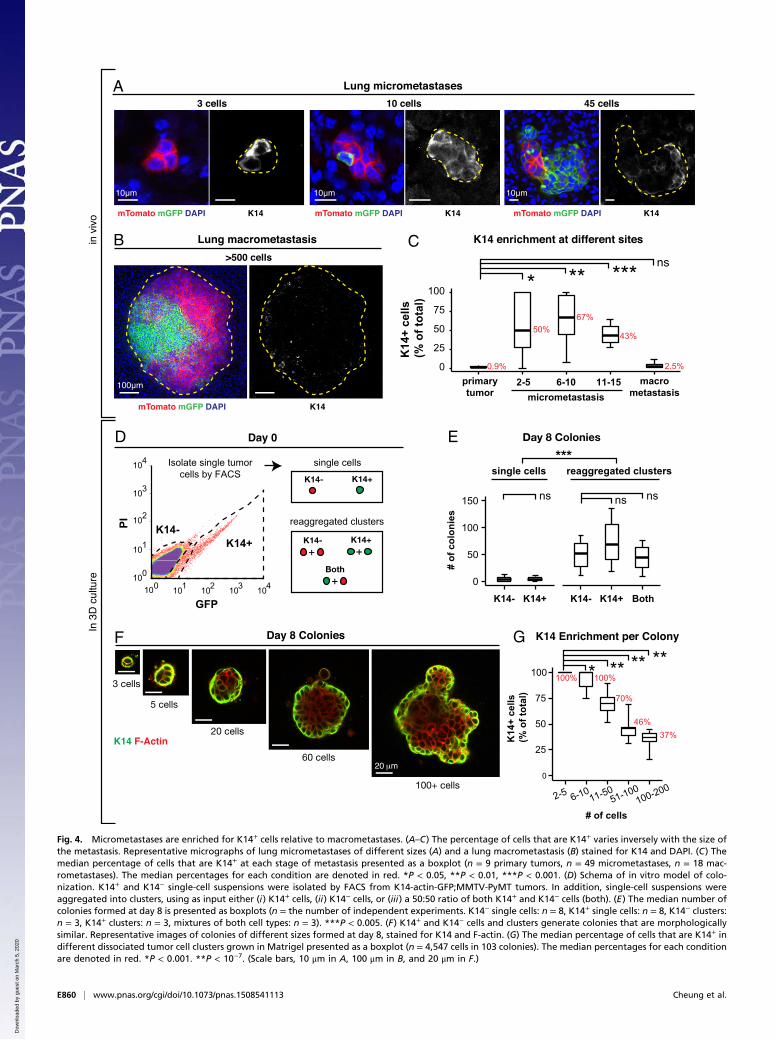
Locally Disseminated Tumor Cell Clusters, CTC Clusters, andMicrometastases Are Enriched for K14+ Cells, Relative toMacrometastases. Given the frequency of polyclonal metastasesand the efficiency of metastasis formation by multicellularseeding, we next sought to determine the molecular character-istics of the multicellular seed. In MMTV-PyMT tumors, K14+
cells account for ∼2% of the total tumor cell population (11).These K14+ tumor cells lead >88% of collective invasion strandsextending into the surrounding stroma (11). Consistent with thepioneer function of K14+ cells during metastasis, we observedK14+ cells in polyclonal collective invasion, disseminated tumorcell clusters, and intravascular emboli (Fig. S5A). We also ob-served significant differences in K14 expression between singlecells and disseminated clusters, with 2% and 59% expressingK14, respectively (Fig. S5B). In addition, we observed that 94%of CTC clusters contained K14+ cells (n = 15 of 16 CTC clusters)(Fig. 2H). The fraction of cells within the cluster that were K14+decreased as the size of the cluster increased (Fig. 2H). Our datatherefore show that K14+ cells are enriched in the disseminationstages of metastasis.In lung metastases, the proportion of K14+ cells relative to the
total cell number varied systematically with the size of the me-tastasis (Fig. 4 A and B). In the primary tumor, micrometastases,and macrometastases, K14+ cells accounted for 0.9%, >50%,and 2.5% of cells, respectively (Fig. 4C). Thus, K14+ cells arehighly enriched in locally disseminated clusters, CTC clusters,and micrometastases relative to their frequency in the primarytumor, and the proportion of K14+ cells reverts to baselinein macrometastases.To model these transitions in 3D culture, we next isolated
single K14− and K14+ cells by FACS from MMTV-PyMT tumorsthat genetically encode for a fluorescent biosensor for K14 ex-pression (Fig. 4D and Fig. S5C) (11, 23). Accordingly, we observedthat for individually purified K14− and K14+ populations, colonyformation was >16-fold higher in aggregated clusters relative tosingle tumor cells (Fig. 4E). In contrast, colony formation was notsignificantly different for K14− single cells versus K14+ single cells,or for K14− aggregated cells versus K14+ aggregated clusters (Fig.4E). Taken together, our data reveal that the difference in colonyformation between K14− and K14+ cells is small relative to thedifference between multicellular clusters and single cells.One interpretation of these data could be that the interaction
of K14− and K14+ tumor cells may synergistically enhance theefficiency of colony formation. Motivating this hypothesis, Wnt-driven murine mammary tumors contain two subclones that showinterclonal cooperation during tumor progression (24). To testthe synergy hypothesis, we used our aggregation assay to test theeffect of aggregating equal mixtures of K14− and K14+ cells (Fig.4D). However, mixing K14− and K14+ cells in aggregating clustersdid not significantly enhance colony formation relative to eitherpure K14− or K14+ cell clusters (Fig. 4E).Alternatively, phenotypic transitions between differentiation
states could blunt our ability to detect differences in colonyformation (25). We therefore examined K14 expression in ag-gregated tumor cells at day 0, day 1 postaggregation (Fig. S5D),and at day 8 (Fig. S5E). Interestingly, cell clusters at day 1 al-ready contained mixtures of K14− and K14+ cells regardless ofwhether isolated K14− cells, K14+ cells, or mixtures of both celltypes were used as input (Fig. S5D). Similarly, at day 8, >80% ofcolonies were composed of mixtures of K14− and K14+ cells ineach condition (Fig. S5E). Morphologically, small colonies wereprimarily composed of K14+ cells and larger colonies werecomposed of an inner core of K14− cells and an outer layer ofK14+ cells (Fig. 4F). Concordant with our observations of me-tastases in vivo, the proportion of K14+ cells varied with the sizeof clusters grown in 3D Matrigel. In small clusters, two to five
cells in size, 100% of cells were K14+, and in larger clusters with≥20 cells, all clusters contained multiple K14− cells (Fig. 4G).Thus, isolated K14− and K14+ cells converge toward cell coloniescomposed of both cell states, with K14+ cells predominant insmall colonies in culture and in micrometastases. Conversely, K14−cells are predominant in large colonies and in macrometastases.
The Transcriptional Program of K14+ Tumor Cells Is Enriched forDesmosome and Hemidesmosome Adhesion Complex Genes, andDepleted for Genes Involved in MHC Class II Immunosurveillance.Given the enrichment for K14+ cells in disseminated tumorcell clusters and micrometastases, we next asked how the tran-scriptional profiles of K14+ and K14− cells differed. To answerthis question, we compared the transcriptomes of K14+ andK14− cells from primary MMTV-PyMT tumors. To focus ourattention on changes in gene expression between cancer cellsubpopulations, we first isolated epithelial organoids from thetumor and then used differential centrifugation to deplete im-mune and fibroblastic stromal cells. We then processed theseorganoids to single cells and FACS-sorted them based on K14status. As expected, quantitative RT-PCR revealed that theK14+ cell fraction exhibited >12-fold higher levels of K14 RNAexpression (Fig. 5A). Our RNA-seq analysis revealed 239 genesdifferentially expressed between K14− and K14+ cells at a genome-wide significance level of P < 10−6 (mean-variance normalizedheatmap in Fig. 5B). By DAVID gene ontology (GO) analysis(26), we identified significantly enriched GO categories in eachcell subpopulation (Table S1). This analysis revealed significantenrichment for genes involved in extracellular matrix proteins,intermediate filament organization, and epithelial differentiationin K14+ cells. Interestingly, K14+ cells were enriched for tran-scripts encoding TNC, POSTN, and CTGF, proteins requiredin the metastatic niche (27–29). In addition, DAVID analysisrevealed a number of genes involved in the regulation of theimmune system that were significantly depleted in K14+ cells(Table S1). These GO categories included immune response,MHC class II antigen presentation, T-cell activation, and genesinvolved in chemotaxis. Genes involved in MHC class II pre-sentation were among the most depleted in K14+ cells (Fig. 5C′′).Our data reveal that K14+ cells differ across multiple molecularprograms that could be advantageous across distinct steps inmetastasis, including immune evasion. Furthermore, two keyfeatures distinguishing K14+ cells from the bulk tumor cellsare their increased expression of both cell–cell and cell–matrixadhesion genes.We also tested the extent to which the K14+ cell transcriptome
correlated with “stemness” in three ways (30, 31). First, we lookedat the expression of putative stem cell markers in K14− and K14+
cells. We observed that CD44 was differentially expressed betweenthese cell populations, but CD49f, CD24a, CD133, and CD29 werenot (Fig. S6A). Next, we tested for gene set enrichment in K14−and K14+ cells with published mouse mammary stem cell gene sets(Fig. S6B). Our gene set tests revealed that K14− cells wereenriched for fetal mammary stem cell and luminal epithelial genesignatures. In contrast, K14+ cells were enriched for mammarystem cell, adult mammary stem cell, and myoepithelial gene sig-natures. A third approach we took to test stemness was to assaythe ability of isolated single K14− and K14+ cells to form mam-mospheres, as in Spike et al. (31) (Fig. S6C). Our data show thatboth K14− and K14+ cells form mammospheres and that themammosphere-forming efficiency was not significantly differentbetween K14− and K14+ cells (Fig. S6D). Taken together, ourfindings are consistent with a model in which stemness featuresare observed in both K14− and K14+ cells, and that both celltypes are capable of colony formation.
K14 Expression Is Required for Distant Metastasis and Regulates GeneExpression of Multiple Metastasis Effectors. Our gene-expressionstudy revealed that K14+ cells displayed coordinated up-regulationof most desmosome (10 of 11) and hemidesmosome (10 of 12)complex genes (Fig. 5 C and C′) (32). These observations were
Cheung et al. PNAS | Published online February 1, 2016 | E859
CELL
BIOLO
GY
PNASPL
US
Dow
nloa
ded
by g
uest
on
Mar
ch 5
, 202
0
A
B
D
F G
E
C
Fig. 4. Micrometastases are enriched for K14+ cells relative to macrometastases. (A–C) The percentage of cells that are K14+ varies inversely with the size ofthe metastasis. Representative micrographs of lung micrometastases of different sizes (A) and a lung macrometastasis (B) stained for K14 and DAPI. (C) Themedian percentage of cells that are K14+ at each stage of metastasis presented as a boxplot (n = 9 primary tumors, n = 49 micrometastases, n = 18 mac-rometastases). The median percentages for each condition are denoted in red. *P < 0.05, **P < 0.01, ***P < 0.001. (D) Schema of in vitro model of colo-nization. K14+ and K14− single-cell suspensions were isolated by FACS from K14-actin-GFP;MMTV-PyMT tumors. In addition, single-cell suspensions wereaggregated into clusters, using as input either (i) K14+ cells, (ii) K14− cells, or (iii) a 50:50 ratio of both K14+ and K14− cells (both). (E) The median number ofcolonies formed at day 8 is presented as boxplots (n = the number of independent experiments. K14− single cells: n = 8, K14+ single cells: n = 8, K14− clusters:n = 3, K14+ clusters: n = 3, mixtures of both cell types: n = 3). ***P < 0.005. (F) K14+ and K14− cells and clusters generate colonies that are morphologicallysimilar. Representative images of colonies of different sizes formed at day 8, stained for K14 and F-actin. (G) The median percentage of cells that are K14+ indifferent dissociated tumor cell clusters grown in Matrigel presented as a boxplot (n = 4,547 cells in 103 colonies). The median percentages for each conditionare denoted in red. *P < 0.001. **P < 10−7. (Scale bars, 10 μm in A, 100 μm in B, and 20 μm in F.)
E860 | www.pnas.org/cgi/doi/10.1073/pnas.1508541113 Cheung et al.
Dow
nloa
ded
by g
uest
on
Mar
ch 5
, 202
0
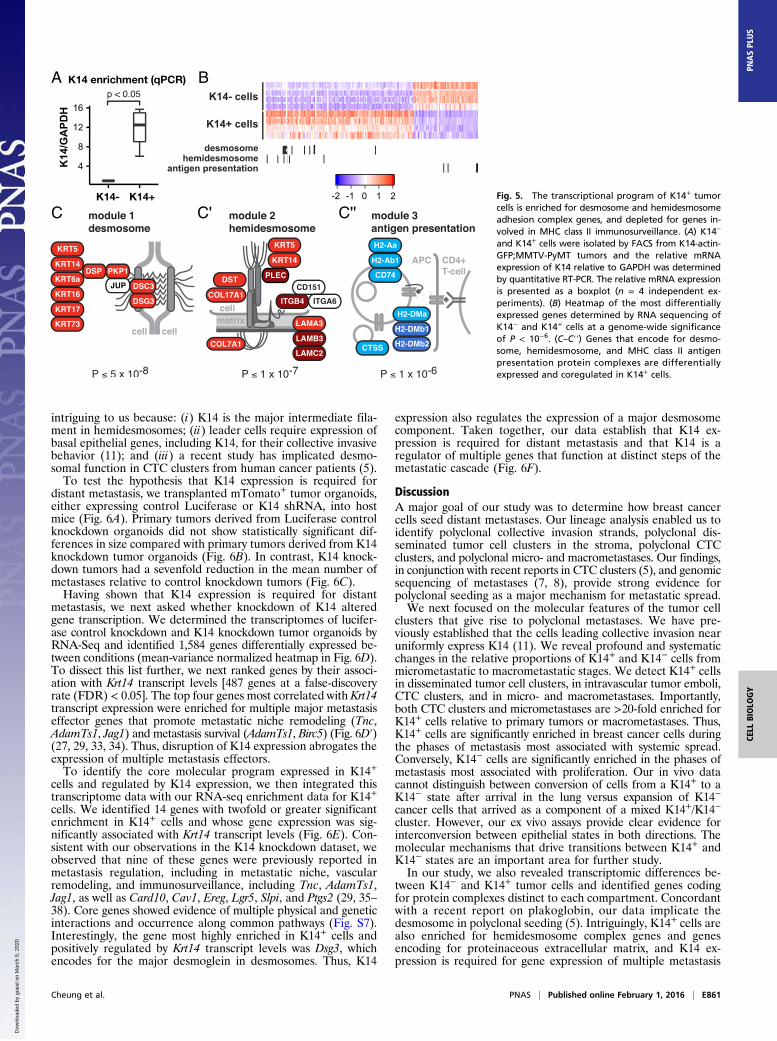
intriguing to us because: (i) K14 is the major intermediate fila-ment in hemidesmosomes; (ii) leader cells require expression ofbasal epithelial genes, including K14, for their collective invasivebehavior (11); and (iii) a recent study has implicated desmo-somal function in CTC clusters from human cancer patients (5).To test the hypothesis that K14 expression is required for
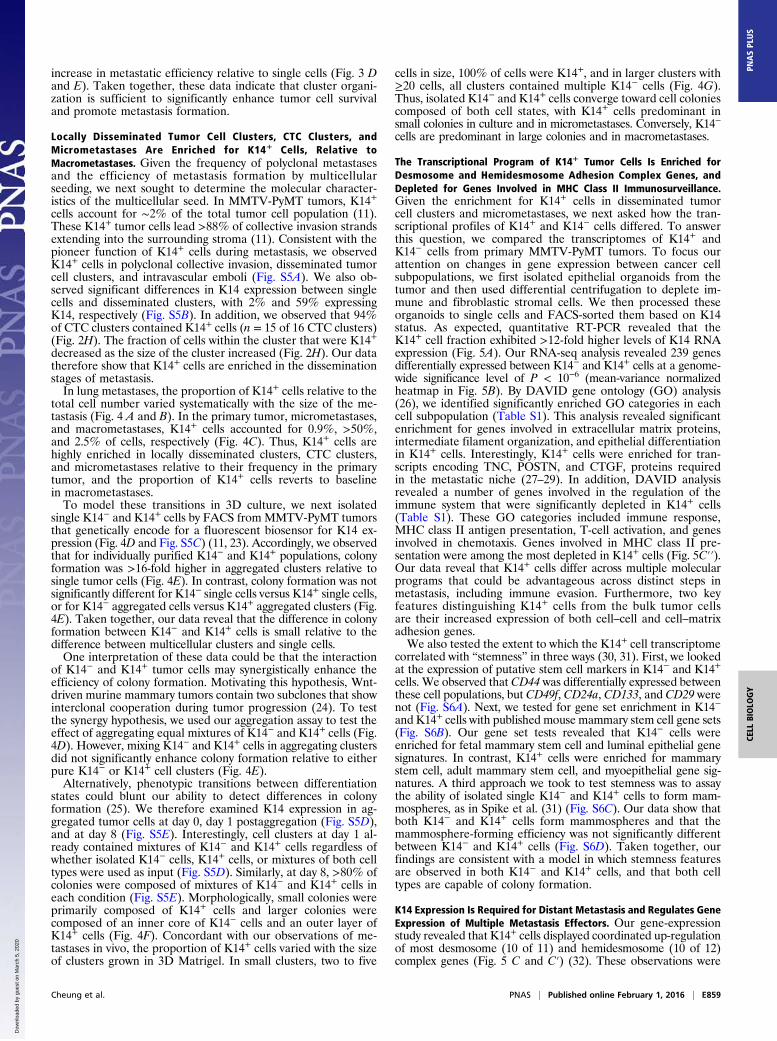
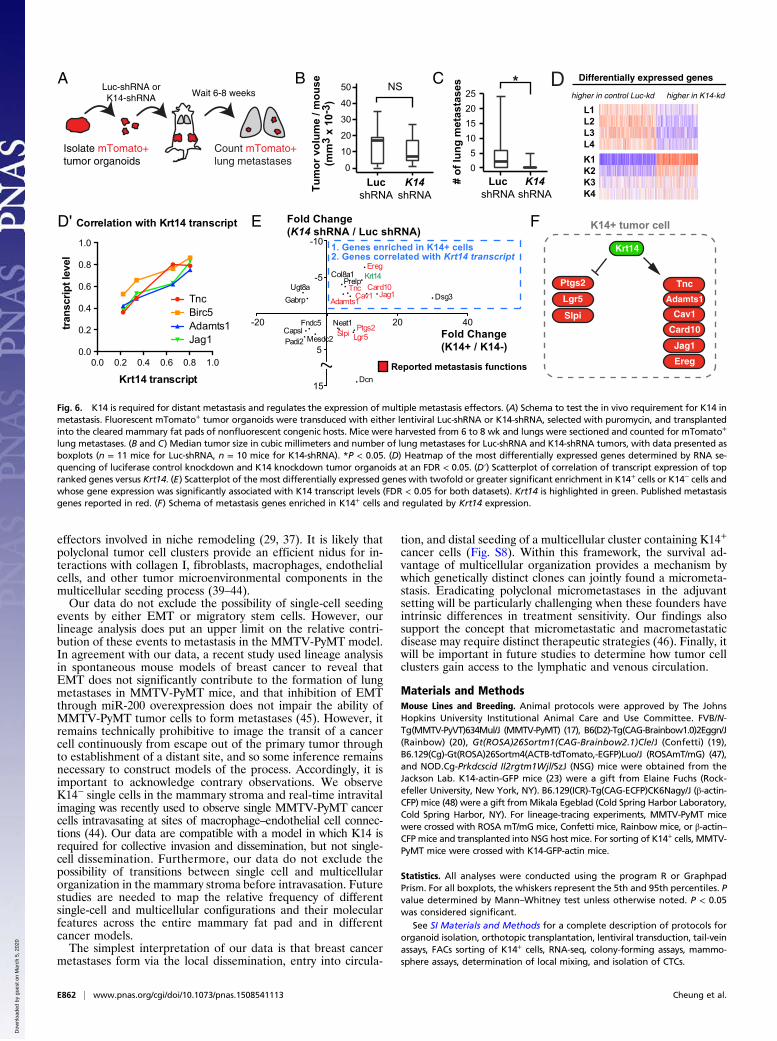
distant metastasis, we transplanted mTomato+ tumor organoids,either expressing control Luciferase or K14 shRNA, into hostmice (Fig. 6A). Primary tumors derived from Luciferase controlknockdown organoids did not show statistically significant dif-ferences in size compared with primary tumors derived from K14knockdown tumor organoids (Fig. 6B). In contrast, K14 knock-down tumors had a sevenfold reduction in the mean number ofmetastases relative to control knockdown tumors (Fig. 6C).Having shown that K14 expression is required for distant
metastasis, we next asked whether knockdown of K14 alteredgene transcription. We determined the transcriptomes of lucifer-ase control knockdown and K14 knockdown tumor organoids byRNA-Seq and identified 1,584 genes differentially expressed be-tween conditions (mean-variance normalized heatmap in Fig. 6D).To dissect this list further, we next ranked genes by their associ-ation with Krt14 transcript levels [487 genes at a false-discoveryrate (FDR) < 0.05]. The top four genes most correlated with Krt14transcript expression were enriched for multiple major metastasiseffector genes that promote metastatic niche remodeling (Tnc,AdamTs1, Jag1) and metastasis survival (AdamTs1, Birc5) (Fig. 6D′)(27, 29, 33, 34). Thus, disruption of K14 expression abrogates theexpression of multiple metastasis effectors.To identify the core molecular program expressed in K14+
cells and regulated by K14 expression, we then integrated thistranscriptome data with our RNA-seq enrichment data for K14+cells. We identified 14 genes with twofold or greater significantenrichment in K14+ cells and whose gene expression was sig-nificantly associated with Krt14 transcript levels (Fig. 6E). Con-sistent with our observations in the K14 knockdown dataset, weobserved that nine of these genes were previously reported inmetastasis regulation, including in metastatic niche, vascularremodeling, and immunosurveillance, including Tnc, AdamTs1,Jag1, as well as Card10, Cav1, Ereg, Lgr5, Slpi, and Ptgs2 (29, 35–38). Core genes showed evidence of multiple physical and geneticinteractions and occurrence along common pathways (Fig. S7).Interestingly, the gene most highly enriched in K14+ cells andpositively regulated by Krt14 transcript levels was Dsg3, whichencodes for the major desmoglein in desmosomes. Thus, K14
expression also regulates the expression of a major desmosomecomponent. Taken together, our data establish that K14 ex-pression is required for distant metastasis and that K14 is aregulator of multiple genes that function at distinct steps of themetastatic cascade (Fig. 6F).
DiscussionA major goal of our study was to determine how breast cancercells seed distant metastases. Our lineage analysis enabled us toidentify polyclonal collective invasion strands, polyclonal dis-seminated tumor cell clusters in the stroma, polyclonal CTCclusters, and polyclonal micro- and macrometastases. Our findings,in conjunction with recent reports in CTC clusters (5), and genomicsequencing of metastases (7, 8), provide strong evidence forpolyclonal seeding as a major mechanism for metastatic spread.We next focused on the molecular features of the tumor cell
clusters that give rise to polyclonal metastases. We have pre-viously established that the cells leading collective invasion nearuniformly express K14 (11). We reveal profound and systematicchanges in the relative proportions of K14+ and K14− cells frommicrometastatic to macrometastatic stages. We detect K14+ cellsin disseminated tumor cell clusters, in intravascular tumor emboli,CTC clusters, and in micro- and macrometastases. Importantly,both CTC clusters and micrometastases are >20-fold enriched forK14+ cells relative to primary tumors or macrometastases. Thus,K14+ cells are significantly enriched in breast cancer cells duringthe phases of metastasis most associated with systemic spread.Conversely, K14− cells are significantly enriched in the phases ofmetastasis most associated with proliferation. Our in vivo datacannot distinguish between conversion of cells from a K14+ to aK14− state after arrival in the lung versus expansion of K14−cancer cells that arrived as a component of a mixed K14+/K14−cluster. However, our ex vivo assays provide clear evidence forinterconversion between epithelial states in both directions. Themolecular mechanisms that drive transitions between K14+ andK14− states are an important area for further study.In our study, we also revealed transcriptomic differences be-
tween K14− and K14+ tumor cells and identified genes codingfor protein complexes distinct to each compartment. Concordantwith a recent report on plakoglobin, our data implicate thedesmosome in polyclonal seeding (5). Intriguingly, K14+ cells arealso enriched for hemidesmosome complex genes and genesencoding for proteinaceous extracellular matrix, and K14 ex-pression is required for gene expression of multiple metastasis
A
C Cʹ Cʹʹ
B
Fig. 5. The transcriptional program of K14+ tumorcells is enriched for desmosome and hemidesmosomeadhesion complex genes, and depleted for genes in-volved in MHC class II immunosurveillance. (A) K14−
and K14+ cells were isolated by FACS from K14-actin-GFP;MMTV-PyMT tumors and the relative mRNAexpression of K14 relative to GAPDH was determinedby quantitative RT-PCR. The relative mRNA expressionis presented as a boxplot (n = 4 independent ex-periments). (B) Heatmap of the most differentiallyexpressed genes determined by RNA sequencing ofK14− and K14+ cells at a genome-wide significanceof P < 10−6. (C–C′′) Genes that encode for desmo-some, hemidesmosome, and MHC class II antigenpresentation protein complexes are differentiallyexpressed and coregulated in K14+ cells.
Cheung et al. PNAS | Published online February 1, 2016 | E861
CELL
BIOLO
GY
PNASPL
US
Dow
nloa
ded
by g
uest
on
Mar
ch 5
, 202
0
effectors involved in niche remodeling (29, 37). It is likely thatpolyclonal tumor cell clusters provide an efficient nidus for in-teractions with collagen I, fibroblasts, macrophages, endothelialcells, and other tumor microenvironmental components in themulticellular seeding process (39–44).Our data do not exclude the possibility of single-cell seeding
events by either EMT or migratory stem cells. However, ourlineage analysis does put an upper limit on the relative contri-bution of these events to metastasis in the MMTV-PyMT model.In agreement with our data, a recent study used lineage analysisin spontaneous mouse models of breast cancer to reveal thatEMT does not significantly contribute to the formation of lungmetastases in MMTV-PyMT mice, and that inhibition of EMTthrough miR-200 overexpression does not impair the ability ofMMTV-PyMT tumor cells to form metastases (45). However, itremains technically prohibitive to image the transit of a cancercell continuously from escape out of the primary tumor throughto establishment of a distant site, and so some inference remainsnecessary to construct models of the process. Accordingly, it isimportant to acknowledge contrary observations. We observeK14− single cells in the mammary stroma and real-time intravitalimaging was recently used to observe single MMTV-PyMT cancercells intravasating at sites of macrophage–endothelial cell connec-tions (44). Our data are compatible with a model in which K14 isrequired for collective invasion and dissemination, but not single-cell dissemination. Furthermore, our data do not exclude thepossibility of transitions between single cell and multicellularorganization in the mammary stroma before intravasation. Futurestudies are needed to map the relative frequency of differentsingle-cell and multicellular configurations and their molecularfeatures across the entire mammary fat pad and in differentcancer models.The simplest interpretation of our data is that breast cancer
metastases form via the local dissemination, entry into circula-
tion, and distal seeding of a multicellular cluster containing K14+
cancer cells (Fig. S8). Within this framework, the survival ad-vantage of multicellular organization provides a mechanism bywhich genetically distinct clones can jointly found a micrometa-stasis. Eradicating polyclonal micrometastases in the adjuvantsetting will be particularly challenging when these founders haveintrinsic differences in treatment sensitivity. Our findings alsosupport the concept that micrometastatic and macrometastaticdisease may require distinct therapeutic strategies (46). Finally, itwill be important in future studies to determine how tumor cellclusters gain access to the lymphatic and venous circulation.
Materials and MethodsMouse Lines and Breeding. Animal protocols were approved by The JohnsHopkins University Institutional Animal Care and Use Committee. FVB/N-Tg(MMTV-PyVT)634Mul/J (MMTV-PyMT) (17), B6(D2)-Tg(CAG-Brainbow1.0)2Eggn/J(Rainbow) (20), Gt(ROSA)26Sortm1(CAG-Brainbow2.1)Cle/J (Confetti) (19),B6.129(Cg)-Gt(ROSA)26Sortm4(ACTB-tdTomato,-EGFP)Luo/J (ROSAmT/mG) (47),and NOD.Cg-Prkdcscid Il2rgtm1Wjl/SzJ (NSG) mice were obtained from theJackson Lab. K14-actin-GFP mice (23) were a gift from Elaine Fuchs (Rock-efeller University, New York, NY). B6.129(ICR)-Tg(CAG-ECFP)CK6Nagy/J (β-actin-CFP) mice (48) were a gift fromMikala Egeblad (Cold Spring Harbor Laboratory,Cold Spring Harbor, NY). For lineage-tracing experiments, MMTV-PyMT micewere crossed with ROSA mT/mG mice, Confetti mice, Rainbow mice, or β-actin–CFP mice and transplanted into NSG host mice. For sorting of K14+ cells, MMTV-PyMT mice were crossed with K14-GFP-actin mice.
Statistics. All analyses were conducted using the program R or GraphpadPrism. For all boxplots, the whiskers represent the 5th and 95th percentiles. Pvalue determined by Mann–Whitney test unless otherwise noted. P < 0.05was considered significant.
See SI Materials and Methods for a complete description of protocols fororganoid isolation, orthotopic transplantation, lentiviral transduction, tail-veinassays, FACs sorting of K14+ cells, RNA-seq, colony-forming assays, mammo-sphere assays, determination of local mixing, and isolation of CTCs.
Reported metastasis functions
Krt14
Tnc
Adamts1
Cav1
Card10
Jag1
Ptgs2
Lgr5
Slpi
K14+ tumor cell
Ereg
0510152025
LucshRNA
K14shRNA
# of
lung
met
asta
ses
Isolate mTomato+tumor organoids
Luc-shRNA orK14-shRNA
Count mTomato+ lung metastases
*Wait 6-8 weeks
0
10
20
30
40
50
Tum
or v
olum
e / m
ouse
(mm
3 x
10-3
)
LucshRNA
K14shRNA
NS
-20 20 40
15
5
-5
-10
Fold Change(K14+ / K14-)
Krt14Tnc
Jag1
Slpi
Card10Cav1
Padi2
Col8a1Ugt8a
Ptgs2Neat1
Prelp
Ereg
Fndc5
Gabrp
Mesdc2Capsl
Lgr5
Dsg3
Dcn
Fold Change(K14 shRNA / Luc shRNA)
1. Genes enriched in K14+ cells2. Genes correlated with Krt14 transcript
Adamts1
Differentially expressed genesD
0.0 0.2 0.4 0.6 0.8 1.00.0
0.2
0.4
0.6
0.8
1.0
Krt14 transcript
trans
crip
t lev
el
Correlation with Krt14 transcript
TncBirc5Adamts1Jag1
higher in control Luc-kd higher in K14-kd
L1L2L3L4K1K2K3K4
A
Dʹ E F
B C
Fig. 6. K14 is required for distant metastasis and regulates the expression of multiple metastasis effectors. (A) Schema to test the in vivo requirement for K14 inmetastasis. Fluorescent mTomato+ tumor organoids were transduced with either lentiviral Luc-shRNA or K14-shRNA, selected with puromycin, and transplantedinto the cleared mammary fat pads of nonfluorescent congenic hosts. Mice were harvested from 6 to 8 wk and lungs were sectioned and counted for mTomato+
lung metastases. (B and C) Median tumor size in cubic millimeters and number of lung metastases for Luc-shRNA and K14-shRNA tumors, with data presented asboxplots (n = 11 mice for Luc-shRNA, n = 10 mice for K14-shRNA). *P < 0.05. (D) Heatmap of the most differentially expressed genes determined by RNA se-quencing of luciferase control knockdown and K14 knockdown tumor organoids at an FDR < 0.05. (D′) Scatterplot of correlation of transcript expression of topranked genes versus Krt14. (E) Scatterplot of the most differentially expressed genes with twofold or greater significant enrichment in K14+ cells or K14− cells andwhose gene expression was significantly associated with K14 transcript levels (FDR < 0.05 for both datasets). Krt14 is highlighted in green. Published metastasisgenes reported in red. (F) Schema of metastasis genes enriched in K14+ cells and regulated by Krt14 expression.
E862 | www.pnas.org/cgi/doi/10.1073/pnas.1508541113 Cheung et al.
Dow
nloa
ded
by g
uest
on
Mar
ch 5
, 202
0
ACKNOWLEDGMENTS. We thank members of the A.J.E. laboratory forcomments on the manuscript; B. Stanger and R. Maddipati for sharingunpublished data; Hao Zhang of The Johns Hopkins School of PublicHealth Flow Cytometry Core Facility for assistance with FACS; andHaiping Hao of The Johns Hopkins Medical Institutions Deep Sequencingand Microarray Core Facility for assistance with RNA-seq. K.J.C. issupported by a Postdoctoral Fellowship from the US Department ofDefense (W81XWH-12-1-0018) and a Burroughs Wellcome Fund Career
Award for Medical Scientists. A.J.E. is supported by a Research Scholar Grant(RSG-12-141-01-CSM) from the American Cancer Society, by funds from theNational Institutes of Health/National Cancer Institute (P30 CA006973), by agrant from the Mary Kay Ash Foundation (036-13), by funds from theCindy Rosencrans Fund for Triple Negative Breast Cancer Research, by aResearch Leadership Award from the Metastatic Breast Cancer Network,and by an award from The Pink Agenda and The Breast Cancer ResearchFoundation.
1. Hanahan D, Weinberg RA (2011) Hallmarks of cancer: The next generation. Cell144(5):646–674.
2. Moore GE, Sandberg AA, Watne AL (1960) The comparative size and structure oftumor cells and clumps in the blood, bone marrow, and tumor imprints. Cancer 13:111–117.
3. Liotta LA, Saidel MG, Kleinerman J (1976) The significance of hematogenous tumorcell clumps in the metastatic process. Cancer Res 36(3):889–894.
4. Hou JM, et al. (2012) Clinical significance and molecular characteristics of circulatingtumor cells and circulating tumor microemboli in patients with small-cell lung cancer.J Clin Oncol 30(5):525–532.
5. Aceto N, et al. (2014) Circulating tumor cell clusters are oligoclonal precursors ofbreast cancer metastasis. Cell 158(5):1110–1122.
6. Maddipati R, Stanger BZ (2015) Pancreatic cancer metastases harbor evidence ofpolyclonality. Cancer Discov 5(10):1086–1097.
7. McFadden DG, et al. (2014) Genetic and clonal dissection of murine small cell lungcarcinoma progression by genome sequencing. Cell 156(6):1298–1311.
8. Gundem G, et al.; ICGC Prostate UK Group (2015) The evolutionary history of lethalmetastatic prostate cancer. Nature 520(7547):353–357.
9. Bronsert P, et al. (2014) Cancer cell invasion and EMT marker expression: A three-dimensional study of the human cancer-host interface. J Pathol 234(3):410–422.
10. Friedl P, Locker J, Sahai E, Segall JE (2012) Classifying collective cancer cell invasion.Nat Cell Biol 14(8):777–783.
11. Cheung KJ, Gabrielson E, Werb Z, Ewald AJ (2013) Collective invasion in breast cancerrequires a conserved basal epithelial program. Cell 155(7):1639–1651.
12. Cheung KJ, Ewald AJ (2014) Illuminating breast cancer invasion: Diverse roles for cell-cell interactions. Curr Opin Cell Biol 30:99–111.
13. Friedl P, Zänker KS, Bröcker EB (1998) Cell migration strategies in 3-D extracellularmatrix: Differences in morphology, cell matrix interactions, and integrin function.Microsc Res Tech 43(5):369–378.
14. Nguyen-Ngoc KV, et al. (2012) ECM microenvironment regulates collective migrationand local dissemination in normal and malignant mammary epithelium. Proc NatlAcad Sci USA 109(39):E2595–E2604.
15. Friedl P, et al. (1995) Migration of coordinated cell clusters in mesenchymal and ep-ithelial cancer explants in vitro. Cancer Res 55(20):4557–4560.
16. Lin EY, et al. (2003) Progression to malignancy in the polyoma middle T oncoproteinmouse breast cancer model provides a reliable model for human diseases. Am J Pathol163(5):2113–2126.
17. Guy CT, Cardiff RD, Muller WJ (1992) Induction of mammary tumors by expression ofpolyomavirus middle T oncogene: A transgenic mouse model for metastatic disease.Mol Cell Biol 12(3):954–961.
18. Herschkowitz JI, He X, Fan C, Perou CM (2008) The functional loss of the retinoblas-toma tumour suppressor is a common event in basal-like and luminal B breast car-cinomas. Breast Cancer Res 10(5):R75.
19. Snippert HJ, et al. (2010) Intestinal crypt homeostasis results from neutral competitionbetween symmetrically dividing Lgr5 stem cells. Cell 143(1):134–144.
20. Tabansky I, et al. (2013) Developmental bias in cleavage-stage mouse blastomeres.Curr Biol 23(1):21–31.
21. Kim MY, et al. (2009) Tumor self-seeding by circulating cancer cells. Cell 139(7):1315–1326.
22. Kondo J, et al. (2011) Retaining cell-cell contact enables preparation and culture ofspheroids composed of pure primary cancer cells from colorectal cancer. Proc NatlAcad Sci USA 108(15):6235–6240.
23. Vaezi A, Bauer C, Vasioukhin V, Fuchs E (2002) Actin cable dynamics and Rho/Rockorchestrate a polarized cytoskeletal architecture in the early steps of assembling astratified epithelium. Dev Cell 3(3):367–381.
24. Cleary AS, Leonard TL, Gestl SA, Gunther EJ (2014) Tumour cell heterogeneitymaintained by cooperating subclones in Wnt-driven mammary cancers. Nature508(7494):113–117.
25. Gupta PB, et al. (2011) Stochastic state transitions give rise to phenotypic equilibriumin populations of cancer cells. Cell 146(4):633–644.
26. Huang W, Sherman BT, Lempicki RA (2009) Systematic and integrative analysis oflarge gene lists using DAVID bioinformatics resources. Nat Protoc 4(1):44–57.
27. Kang Y, et al. (2003) A multigenic program mediating breast cancer metastasis tobone. Cancer Cell 3(6):537–549.
28. Malanchi I, et al. (2012) Interactions between cancer stem cells and their niche governmetastatic colonization. Nature 481(7379):85–89.
29. Oskarsson T, et al. (2011) Breast cancer cells produce tenascin C as a metastatic nichecomponent to colonize the lungs. Nat Med 17(7):867–874.
30. Soady KJ, et al. (2015) Mouse mammary stem cells express prognostic markers fortriple-negative breast cancer. Breast Cancer Res 17:31.
31. Spike BT, et al. (2012) A mammary stem cell population identified and characterizedin late embryogenesis reveals similarities to human breast cancer. Cell Stem Cell 10(2):183–197.
32. Broussard JA, Getsios S, Green KJ (2015) Desmosome regulation and signaling indisease. Cell Tissue Res 360(3):501–512.
33. Sethi N, Dai X, Winter CG, Kang Y (2011) Tumor-derived JAGGED1 promotes osteo-lytic bone metastasis of breast cancer by engaging notch signaling in bone cells.Cancer Cell 19(2):192–205.
34. Tanaka K, et al. (2000) Expression of survivin and its relationship to loss of apoptosis inbreast carcinomas. Clin Cancer res 6(1):127–134.
35. Devoogdt N, et al. (2003) Secretory leukocyte protease inhibitor promotes the tu-morigenic and metastatic potential of cancer cells. Proc Natl Acad Sci USA 100(10):5778–5782.
36. Goetz JG, et al. (2011) Biomechanical remodeling of the microenvironment by stromalcaveolin-1 favors tumor invasion and metastasis. Cell 146(1):148–163.
37. Gupta GP, et al. (2007) Mediators of vascular remodelling co-opted for sequentialsteps in lung metastasis. Nature 446(7137):765–770.
38. Pan D, et al. (2015) The CBM complex underwrites NF-kappaB activation to promoteHER2-associated tumor malignancy.Mol Cancer Res, 10.1158/1541-7786.MCR-15-0229-T.
39. Joyce JA, Pollard JW (2009) Microenvironmental regulation of metastasis. Nat RevCancer 9(4):239–252.
40. Condeelis J, Pollard JW (2006) Macrophages: Obligate partners for tumor cell mi-gration, invasion, and metastasis. Cell 124(2):263–266.
41. Calvo F, et al. (2013) Mechanotransduction and YAP-dependent matrix remodelling isrequired for the generation and maintenance of cancer-associated fibroblasts. NatCell Biol 15(6):637–646.
42. Egeblad M, Rasch MG, Weaver VM (2010) Dynamic interplay between the collagenscaffold and tumor evolution. Curr Opin Cell Biol 22(5):697–706.
43. Stacker SA, Achen MG, Jussila L, Baldwin ME, Alitalo K (2002) Lymphangiogenesis andcancer metastasis. Nat Rev Cancer 2(8):573–583.
44. Harney AS, et al. (2015) Real-time imaging reveals local, transient vascular perme-ability, and tumor cell intravasation stimulated by TIE2hi macrophage-derived VEGFA.Cancer Discov 5(9):932–943.
45. Fischer KR, et al. (2015) Epithelial-to-mesenchymal transition is not required for lungmetastasis but contributes to chemoresistance. Nature 527(7579):472–476.
46. Mina LA, Sledge GW, Jr (2011) Rethinking the metastatic cascade as a therapeutictarget. Nat Rev Clin Oncol 8(6):325–332.
47. Muzumdar MD, Tasic B, Miyamichi K, Li L, Luo L (2007) A global double-fluorescentCre reporter mouse. Genesis 45(9):593–605.
48. Hadjantonakis AK, Macmaster S, Nagy A (2002) Embryonic stem cells and mice ex-pressing different GFP variants for multiple non-invasive reporter usage within asingle animal. BMC Biotechnol 2:11.
49. Bruns I, et al. (2014) Megakaryocytes regulate hematopoietic stem cell quiescencethrough CXCL4 secretion. Nat Med 20(11):1315–1320.
50. Dobin A, et al. (2013) STAR: Ultrafast universal RNA-seq aligner. Bioinformatics 29(1):15–21.
51. Anders S, et al. (2013) Count-based differential expression analysis of RNA sequencingdata using R and Bioconductor. Nat Protoc 8(9):1765–1786.
52. Smyth GK (2004) Linear models and empirical bayes methods for assessing differentialexpression in microarray experiments. Stat Appl Genet Mol Biol 3:Article3.
53. Warde-Farley D, et al. (2010) The GeneMANIA prediction server: Biological networkintegration for gene prioritization and predicting gene function. Nucleic Acids Res38(Web Server issue):W214–W220.
Cheung et al. PNAS | Published online February 1, 2016 | E863
CELL
BIOLO
GY
PNASPL
US
Dow
nloa
ded
by g
uest
on
Mar
ch 5
, 202
0